Plots List
Plots
This endpoint handles manipulation of Plotly plot files.
Reference
Authorization
Any user with or without a Plotly account may view public plots. For private plots, see authentication.
Actions
list
Listing all public plots can be done via a GET request to this endpoint.
By default, plots will be listed in order of date created. The order_by
query parameter is accepted at this endpoint. Currently, only ordering by
views is supported. It is possible to filter the plots by quality
with min_quality or max_quality as query parameter.
Example:
// GET https://api.plotly.com/v2/plots/ ---> 200

// GET https://api.plotly.com/v2/plots/?order_by=-views ---> 200

// GET https://api.plotly.com/v2/plots/?min_quality=5 ---> 200

// GET https://api.plotly.com/v2/plots/?max_quality=5 ---> 200
feed
Listing all handpicked feed plots can be done via a GET request to this endpoint. By default, plots will be listed in a random order.
Example:
// GET https://api.plotly.com/v2/plots/feed ---> 200
create
You can create new plot resources here. The only required field is 'figure'. Currently, the figure is restricted to only contain references to grid data. That is, this will fail if raw data arrays are passed in. To create and manipulate underlying grids for plots, see the grids endpoint.
Example:
// This fails because a figure field is required.
// POST https://api.plotly.com/v2/plots ---> 400 Bad Request
{}

// This fails because the figure has raw data
//POST https://api.plotly.com/v2/plots ---> 400 Bad Request
{
    "figure": {"data": [{"y": ['this', 'is', 'raw', 'data']}]}
}

// This succeeds because the figure has src keys, not raw data.
//POST https://api.plotly.com/v2/plots ---> 200 OK
{
    "figure": {"data": [{"ysrc": "sven:88:u8nd62"}]}
}
When creating a grid, you can optionally specify a source_fid to specify where a plot has come from:
- source_fid: the fid of a plot that was copied (and presumably edited) to produce this one
detail
There is a lot of meta information stored about plot files including filename, title, share_url, and content_url to name a few.
This information can only be reached with a GET to this endpoint.
Example:
// GET https://api.plotly.com/v2/plots/iheartgraphs:90
content
The contents of a plot can be downloaded via the content resource. The plot
content contains referenced grid/column data by default. If you wish to
return the raw grid/column data, the inline_data=true query must be included
in the request url. The Content-Type header will be appropriately set for the
response body.
Alternatively, you can set ?map_data=unreadable to append a mapping of
sources to data that belongs to grids which are unreadable for the
requestor. This is useful when you have read access to another users plot,
but that plot contains grid references which you don't have access to.
Examples:
// Returns referenced grid/column data
// GET https://api.plotly.com/v2/plots/iheartgraphs:90/content ---> 200 OK

// Returns full grid/column data
// GET https://api.plotly.com/v2/plots/iheartgraphs:90/content?inline_data=true ---> 200 OK

// Returns full grid/column data when requestor doesn't have permission
// to read the referenced grid.
// GET https://api.plotly.com/v2/plots/iheartgraphs:90/content?map_data=unreadable ---> 200 OK
GET /v2/plots/?cursor=cD0yMDI1LTA5LTA4KzAyJTNBMjQlM0EyMC41MzQ5NTElMkIwMCUzQTAw&format=api
{ "next": "https://api.plotly.com/v2/plots/?cursor=cD0yMDI1LTA5LTA3KzE3JTNBMzQlM0E1OC42NTk4ODIlMkIwMCUzQTAw&format=api", "previous": "https://api.plotly.com/v2/plots/?cursor=cj0xJnA9MjAyNS0wOS0wOCswMSUzQTUzJTNBMTUuNjQ2MTA3JTJCMDAlM0EwMA%3D%3D&format=api", "results": [ { "creation_time": "2025-09-08T01:53:15.646107Z", "comments": { "results": [], "count": 0 }, "parented": true, "embed_url": "https://chart-studio.plotly.com/~Jeisson/1.embed", "fid": "Jeisson:1", "filename": "Plot 1", "filetype": "plot", "img_url": "https://storage.googleapis.com/plotly-prod-images/Jeisson/1/9_FQGG5W42BI1FJRUTQ0M57ZIK7AQZAK.png", "image_urls": { "default": "https://storage.googleapis.com/plotly-prod-images/Jeisson/1/2_HGIK2MSE24PFRJ70MXKTCS667NXR5W.png", "block-thumb": "https://storage.googleapis.com/plotly-prod-images/Jeisson/1/8_3438FKQQJQASKZWCR9KQ5V2V4T83OV.png", "list-thumb": "https://storage.googleapis.com/plotly-prod-images/Jeisson/1/9_FQGG5W42BI1FJRUTQ0M57ZIK7AQZAK.png" }, "api_urls": { "files": "https://api.plotly.com/v2/files/Jeisson:1", "plots": "https://api.plotly.com/v2/plots/Jeisson:1", "parent": "https://api.plotly.com/v2/folders/home?user=Jeisson" }, "owner": "Jeisson", "parent": -1, "preview": "", "referencers": [], "references": [], "title": "", "views": 1, "web_url": "https://chart-studio.plotly.com/~Jeisson/1/", "world_readable": true, "date_modified": "2025-09-08T03:29:24.175Z", "stars": { "results": [], "count": 0 }, "collaborators": { "results": [], "count": 0 }, "subfolder_count": null, "refresh_interval": null, "organize_view_url": "https://chart-studio.plotly.com/~Jeisson/1/", "current_user_permission": "read", "is_theme": null, "is_template": false, "autosize": true, "caption": "", "figure": { "data": [ { "line": { "dash": "dash" }, "meta": { "columnNames": { "x": "Mes", "y": "DFP" } }, "mode": "lines", "name": "<br>", "type": "scatter", "xsrc": "Jeisson:0:156785", "ysrc": "Jeisson:0:eec2db", "marker": { "color": "rgb(0, 0, 0)" }, "hoverinfo": "x+y+name", "hoverlabel": { "align": "left", "namelength": 0 }, "connectgaps": false }, { "meta": { "columnNames": { "x": "Mes", "y": "Katsuwonus pelamis" } }, "mode": "markers+lines", "type": "scatter", "xsrc": "Jeisson:0:156785", "ysrc": "Jeisson:0:642698", "yaxis": "y2", "marker": { "color": "rgb(255, 33, 0)" }, "stackgroup": "" }, { "meta": { "columnNames": { "x": "Mes", "y": "Thunnus albacares" } }, "mode": "markers+lines", "type": "scatter", "xsrc": "Jeisson:0:156785", "ysrc": "Jeisson:0:fdece2", "yaxis": "y3", "marker": { "color": "rgb(27, 0, 204)" } }, { "meta": { "columnNames": { "x": "Mes", "y": "E" } }, "mode": "markers+lines", "type": "scatter", "xsrc": "Jeisson:0:156785", "ysrc": "Jeisson:0:28dab4", "yaxis": "y4" } ], "frames": [], "layout": { "title": { "text": "" }, "xaxis": { "side": "bottom", "type": "category", "range": [ -0.0676818950930626, 4.250423011844331 ], "ticks": "inside", "title": { "text": "<br>" }, "anchor": "y4", "domain": [ 0, 1 ], "mirror": false, "nticks": 5, "ticklen": 3, "tickson": "labels", "showgrid": false, "showline": true, "autorange": false, "gridwidth": 1, "linecolor": "rgb(3, 3, 3)", "tickcolor": "rgb(5, 5, 5)", "automargin": false, "showspikes": false, "rangeslider": { "range": [ -0.25042301184433163, 4.250423011844331 ], "yaxis": {}, "yaxis2": {}, "yaxis3": {}, "yaxis4": {}, "visible": false, "autorange": true }, "zerolinecolor": "rgb(255, 255, 255)", "showticklabels": true }, "yaxis": { "type": "linear", "range": [ 0, 350 ], "ticks": "outside", "domain": [ 0, 1 ], "mirror": false, "nticks": 8, "showgrid": true, "showline": true, "tickmode": "auto", "zeroline": true, "autorange": false, "gridcolor": "rgb(255, 255, 255)", "linecolor": "rgb(0, 0, 0)", "tickcolor": "rgb(0, 0, 0)", "fixedrange": true, "overlaying": "y3", "ticksuffix": "", "showexponent": "none", "zerolinecolor": "rgb(1, 1, 1)", "zerolinewidth": 1, "exponentformat": "none" }, "legend": { "x": -0.059755766621438215, "y": 0.5800000000000001, "title": { "text": "DFP" }, "xanchor": "auto", "yanchor": "auto", "traceorder": "grouped", "orientation": "h" }, "yaxis2": { "side": "right", "type": "linear", "range": [ 0, 6000000 ], "ticks": "outside", "title": { "font": { "color": "rgb(255, 0, 0)" } }, "anchor": "x", "domain": [ 0, 1 ], "mirror": false, "nticks": 7, "showgrid": false, "showline": true, "tickfont": { "color": "rgb(255, 0, 0)" }, "zeroline": false, "autorange": false, "linecolor": "rgb(252, 3, 3)", "tickcolor": "rgb(255, 8, 8)", "fixedrange": true, "overlaying": "y3", "zerolinecolor": "rgb(67, 80, 167)", "zerolinewidth": 3, "exponentformat": "none", "separatethousands": true }, "yaxis3": { "side": "right", "type": "linear", "range": [ 0, 1400000 ], "tick0": 6, "ticks": "outside", "anchor": "x", "domain": [ 0, 1 ], "mirror": false, "nticks": 8, "ticklen": 82, "showgrid": false, "showline": true, "tickfont": { "color": "rgb(38, 49, 238)" }, "tickmode": "auto", "zeroline": false, "autorange": false, "linecolor": "rgb(32, 16, 224)", "linewidth": 1, "tickcolor": "rgb(255, 255, 255)", "tickwidth": 0, "fixedrange": true, "overlaying": false, "showspikes": false, "tickformat": "", "showexponent": "none", "exponentformat": "none", "showticklabels": true, "separatethousands": true }, "yaxis4": { "side": "right", "type": "linear", "range": [ 0, 600000 ], "ticks": "outside", "mirror": false, "nticks": 7, "ticklen": 160, "showgrid": false, "showline": true, "tickfont": { "color": "rgb(137, 237, 23)" }, "autorange": false, "linecolor": "rgb(247, 119, 228)", "tickcolor": "rgb(255, 255, 255)", "tickwidth": 1, "fixedrange": true, "overlaying": "y3", "showexponent": "none", "exponentformat": "none", "showticklabels": true, "separatethousands": true }, "modebar": { "activecolor": "rgba(255, 255, 255, 0.7)", "orientation": "h" }, "autosize": true, "dragmode": "pan", "template": { "data": { "bar": [ { "type": "bar", "marker": { "colorbar": { "ticks": "", "outlinewidth": 0 } } } ], "table": [ { "type": "table", "cells": { "fill": { "color": "#EBF0F8" }, "line": { "color": "white" } }, "header": { "fill": { "color": "#C8D4E3" }, "line": { "color": "white" } } } ], "carpet": [ { "type": "carpet", "aaxis": { "gridcolor": "#C8D4E3", "linecolor": "#C8D4E3", "endlinecolor": "#2a3f5f", "minorgridcolor": "#C8D4E3", "startlinecolor": "#2a3f5f" }, "baxis": { "gridcolor": "#C8D4E3", "linecolor": "#C8D4E3", "endlinecolor": "#2a3f5f", "minorgridcolor": "#C8D4E3", "startlinecolor": "#2a3f5f" } } ], "mesh3d": [ { "type": "mesh3d", "colorbar": { "ticks": "", "outlinewidth": 0 } } ], "contour": [ { "type": "contour", "colorbar": { "ticks": "", "outlinewidth": 0 }, "autocolorscale": true } ], "heatmap": [ { "type": "heatmap", "colorbar": { "ticks": "", "outlinewidth": 0 }, "autocolorscale": true } ], "scatter": [ { "type": "scatter", "marker": { "colorbar": { "ticks": "", "outlinewidth": 0 } } } ], "surface": [ { "type": "surface", "colorbar": { "ticks": "", "outlinewidth": 0 } } ], "heatmapgl": [ { "type": "heatmapgl", "colorbar": { "ticks": "", "outlinewidth": 0 } } ], "histogram": [ { "type": "histogram", "marker": { "colorbar": { "ticks": "", "outlinewidth": 0 } } } ], "parcoords": [ { "line": { "colorbar": { "ticks": "", "outlinewidth": 0 } }, "type": "parcoords" } ], "scatter3d": [ { "type": "scatter3d", "marker": { "colorbar": { "ticks": "", "outlinewidth": 0 } } } ], "scattergl": [ { "type": "scattergl", "marker": { "colorbar": { "ticks": "", "outlinewidth": 0 } } } ], "choropleth": [ { "type": "choropleth", "colorbar": { "ticks": "", "outlinewidth": 0 } } ], "scattergeo": [ { "type": "scattergeo", "marker": { "colorbar": { "ticks": "", "outlinewidth": 0 } } } ], "histogram2d": [ { "type": "histogram2d", "colorbar": { "ticks": "", "outlinewidth": 0 }, "autocolorscale": true } ], "scatterpolar": [ { "type": "scatterpolar", "marker": { "colorbar": { "ticks": "", "outlinewidth": 0 } } } ], "contourcarpet": [ { "type": "contourcarpet", "colorbar": { "ticks": "", "outlinewidth": 0 } } ], "scattercarpet": [ { "type": "scattercarpet", "marker": { "colorbar": { "ticks": "", "outlinewidth": 0 } } } ], "scattermapbox": [ { "type": "scattermapbox", "marker": { "colorbar": { "ticks": "", "outlinewidth": 0 } } } ], "scatterpolargl": [ { "type": "scatterpolargl", "marker": { "colorbar": { "ticks": "", "outlinewidth": 0 } } } ], "scatterternary": [ { "type": "scatterternary", "marker": { "colorbar": { "ticks": "", "outlinewidth": 0 } } } ], "histogram2dcontour": [ { "type": "histogram2dcontour", "colorbar": { "ticks": "", "outlinewidth": 0 }, "autocolorscale": true } ] }, "layout": { "geo": { "bgcolor": "white", "showland": true, "lakecolor": "white", "landcolor": "white", "showlakes": true, "subunitcolor": "#C8D4E3" }, "font": { "color": "#2a3f5f" }, "polar": { "bgcolor": "white", "radialaxis": { "ticks": "", "gridcolor": "#EBF0F8", "linecolor": "#EBF0F8" }, "angularaxis": { "ticks": "", "gridcolor": "#EBF0F8", "linecolor": "#EBF0F8" } }, "scene": { "xaxis": { "ticks": "", "gridcolor": "#DFE8F3", "gridwidth": 2, "linecolor": "#EBF0F8", "zerolinecolor": "#EBF0F8", "showbackground": true, "backgroundcolor": "white" }, "yaxis": { "ticks": "", "gridcolor": "#DFE8F3", "gridwidth": 2, "linecolor": "#EBF0F8", "zerolinecolor": "#EBF0F8", "showbackground": true, "backgroundcolor": "white" }, "zaxis": { "ticks": "", "gridcolor": "#DFE8F3", "gridwidth": 2, "linecolor": "#EBF0F8", "zerolinecolor": "#EBF0F8", "showbackground": true, "backgroundcolor": "white" } }, "title": { "x": 0.05 }, "xaxis": { "ticks": "", "gridcolor": "#EBF0F8", "linecolor": "#EBF0F8", "automargin": true, "zerolinecolor": "#EBF0F8", "zerolinewidth": 2 }, "yaxis": { "ticks": "", "gridcolor": "#EBF0F8", "linecolor": "#EBF0F8", "automargin": true, "zerolinecolor": "#EBF0F8", "zerolinewidth": 2 }, "ternary": { "aaxis": { "ticks": "", "gridcolor": "#DFE8F3", "linecolor": "#A2B1C6" }, "baxis": { "ticks": "", "gridcolor": "#DFE8F3", "linecolor": "#A2B1C6" }, "caxis": { "ticks": "", "gridcolor": "#DFE8F3", "linecolor": "#A2B1C6" }, "bgcolor": "white" }, "colorway": [ "#636efa", "#EF553B", "#00cc96", "#ab63fa", "#19d3f3", "#e763fa", "#fecb52", "#ffa15a", "#ff6692", "#b6e880" ], "hovermode": "closest", "colorscale": { "diverging": [ [ 0, "#8e0152" ], [ 0.1, "#c51b7d" ], [ 0.2, "#de77ae" ], [ 0.3, "#f1b6da" ], [ 0.4, "#fde0ef" ], [ 0.5, "#f7f7f7" ], [ 0.6, "#e6f5d0" ], [ 0.7, "#b8e186" ], [ 0.8, "#7fbc41" ], [ 0.9, "#4d9221" ], [ 1, "#276419" ] ], "sequential": [ [ 0, "#0508b8" ], [ 0.0893854748603352, "#1910d8" ], [ 0.1787709497206704, "#3c19f0" ], [ 0.2681564245810056, "#6b1cfb" ], [ 0.3575418994413408, "#981cfd" ], [ 0.44692737430167595, "#bf1cfd" ], [ 0.5363128491620112, "#dd2bfd" ], [ 0.6256983240223464, "#f246fe" ], [ 0.7150837988826816, "#fc67fd" ], [ 0.8044692737430168, "#fe88fc" ], [ 0.8938547486033519, "#fea5fd" ], [ 0.9832402234636871, "#febefe" ], [ 1, "#fec3fe" ] ], "sequentialminus": [ [ 0, "#0508b8" ], [ 0.0893854748603352, "#1910d8" ], [ 0.1787709497206704, "#3c19f0" ], [ 0.2681564245810056, "#6b1cfb" ], [ 0.3575418994413408, "#981cfd" ], [ 0.44692737430167595, "#bf1cfd" ], [ 0.5363128491620112, "#dd2bfd" ], [ 0.6256983240223464, "#f246fe" ], [ 0.7150837988826816, "#fc67fd" ], [ 0.8044692737430168, "#fe88fc" ], [ 0.8938547486033519, "#fea5fd" ], [ 0.9832402234636871, "#febefe" ], [ 1, "#fec3fe" ] ] }, "plot_bgcolor": "white", "paper_bgcolor": "white", "shapedefaults": { "line": { "width": 0 }, "opacity": 0.4, "fillcolor": "#506784" }, "annotationdefaults": { "arrowhead": 0, "arrowcolor": "#506784", "arrowwidth": 1 } }, "themeRef": "PLOTLY_WHITE" }, "hovermode": "closest", "separators": ",.", "showlegend": false, "uniformtext": { "mode": "hide", "minsize": 0 } } }, "height": null, "width": null, "user": { "profile_url": "https://chart-studio.plotly.com/~Jeisson", "avatar_url": "https://storage.googleapis.com/plotly-prod-profiles/43.jpg", "background_url": "https://storage.googleapis.com/plotly-prod-profiles/bg-7.jpg", "bio": "", "nickname": "", "website": "", "stream_tokens": null, "feature_set_id": null, "csrf_token": null, "date_joined": "2025-09-08 01:37:34", "mapbox_access_tokens": null, "has_password": null, "username": "Jeisson", "email": null, "is_active": null, "readonly": null, "is_dash_creator": null, "dash_created_count": null, "is_chart_creator": null, "charts_created_count": null } }, { "creation_time": "2025-09-08T01:47:38.138948Z", "comments": { "results": [], "count": 0 }, "parented": true, "embed_url": "https://chart-studio.plotly.com/~Severelag/1.embed", "fid": "Severelag:1", "filename": "BasilAbyu", "filetype": "plot", "img_url": "https://storage.googleapis.com/plotly-prod-images/Severelag/1/9_SEFHO1DN3GRF6QTNXWIM7XCFJTB6GM.png", "image_urls": { "default": "https://storage.googleapis.com/plotly-prod-images/Severelag/1/2_A0WHC50UXZ5UBJBCB1STR7LEU0B308.png", "block-thumb": "https://storage.googleapis.com/plotly-prod-images/Severelag/1/8_PKROS6T52586RNBPC0OTLVU8ALGADR.png", "list-thumb": "https://storage.googleapis.com/plotly-prod-images/Severelag/1/9_SEFHO1DN3GRF6QTNXWIM7XCFJTB6GM.png" }, "api_urls": { "files": "https://api.plotly.com/v2/files/Severelag:1", "plots": "https://api.plotly.com/v2/plots/Severelag:1", "parent": "https://api.plotly.com/v2/folders/home?user=Severelag" }, "owner": "Severelag", "parent": -1, "preview": "", "referencers": [], "references": [], "title": "", "views": 1, "web_url": "https://chart-studio.plotly.com/~Severelag/1/", "world_readable": true, "date_modified": "2025-09-08T02:09:38.592Z", "stars": { "results": [], "count": 0 }, "collaborators": { "results": [], "count": 0 }, "subfolder_count": null, "refresh_interval": null, "organize_view_url": "https://chart-studio.plotly.com/~Severelag/1/", "current_user_permission": "read", "is_theme": null, "is_template": false, "autosize": true, "caption": "", "figure": { "data": [ { "meta": { "columnNames": { "x": "A", "y": "B", "error_y": { "array": "C" } } }, "mode": "markers", "type": "bar", "xsrc": "Severelag:0:9224d7", "ysrc": "Severelag:0:220450", "error_x": { "type": "percent", "color": "#444", "value": 10, "width": 4, "visible": false, "symmetric": true, "thickness": 2 }, "error_y": { "meta": { "columnNames": { "array": "C" } }, "type": "data", "visible": true, "arraysrc": "Severelag:0:c4534c", "symmetric": true }, "orientation": "v" } ], "frames": [], "layout": { "xaxis": { "type": "linear", "range": [ 5, 35 ], "autorange": true }, "yaxis": { "type": "linear", "range": [ 0, 2.9291315789473686 ], "autorange": true }, "autosize": true, "template": { "data": { "bar": [ { "type": "bar", "marker": { "colorbar": { "ticks": "", "outlinewidth": 0 } } } ], "table": [ { "type": "table", "cells": { "fill": { "color": "#EBF0F8" }, "line": { "color": "white" } }, "header": { "fill": { "color": "#C8D4E3" }, "line": { "color": "white" } } } ], "carpet": [ { "type": "carpet", "aaxis": { "gridcolor": "#C8D4E3", "linecolor": "#C8D4E3", "endlinecolor": "#2a3f5f", "minorgridcolor": "#C8D4E3", "startlinecolor": "#2a3f5f" }, "baxis": { "gridcolor": "#C8D4E3", "linecolor": "#C8D4E3", "endlinecolor": "#2a3f5f", "minorgridcolor": "#C8D4E3", "startlinecolor": "#2a3f5f" } } ], "mesh3d": [ { "type": "mesh3d", "colorbar": { "ticks": "", "outlinewidth": 0 } } ], "contour": [ { "type": "contour", "colorbar": { "ticks": "", "outlinewidth": 0 }, "autocolorscale": true } ], "heatmap": [ { "type": "heatmap", "colorbar": { "ticks": "", "outlinewidth": 0 }, "autocolorscale": true } ], "scatter": [ { "type": "scatter", "marker": { "colorbar": { "ticks": "", "outlinewidth": 0 } } } ], "surface": [ { "type": "surface", "colorbar": { "ticks": "", "outlinewidth": 0 } } ], "heatmapgl": [ { "type": "heatmapgl", "colorbar": { "ticks": "", "outlinewidth": 0 } } ], "histogram": [ { "type": "histogram", "marker": { "colorbar": { "ticks": "", "outlinewidth": 0 } } } ], "parcoords": [ { "line": { "colorbar": { "ticks": "", "outlinewidth": 0 } }, "type": "parcoords" } ], "scatter3d": [ { "type": "scatter3d", "marker": { "colorbar": { "ticks": "", "outlinewidth": 0 } } } ], "scattergl": [ { "type": "scattergl", "marker": { "colorbar": { "ticks": "", "outlinewidth": 0 } } } ], "choropleth": [ { "type": "choropleth", "colorbar": { "ticks": "", "outlinewidth": 0 } } ], "scattergeo": [ { "type": "scattergeo", "marker": { "colorbar": { "ticks": "", "outlinewidth": 0 } } } ], "histogram2d": [ { "type": "histogram2d", "colorbar": { "ticks": "", "outlinewidth": 0 }, "autocolorscale": true } ], "scatterpolar": [ { "type": "scatterpolar", "marker": { "colorbar": { "ticks": "", "outlinewidth": 0 } } } ], "contourcarpet": [ { "type": "contourcarpet", "colorbar": { "ticks": "", "outlinewidth": 0 } } ], "scattercarpet": [ { "type": "scattercarpet", "marker": { "colorbar": { "ticks": "", "outlinewidth": 0 } } } ], "scattermapbox": [ { "type": "scattermapbox", "marker": { "colorbar": { "ticks": "", "outlinewidth": 0 } } } ], "scatterpolargl": [ { "type": "scatterpolargl", "marker": { "colorbar": { "ticks": "", "outlinewidth": 0 } } } ], "scatterternary": [ { "type": "scatterternary", "marker": { "colorbar": { "ticks": "", "outlinewidth": 0 } } } ], "histogram2dcontour": [ { "type": "histogram2dcontour", "colorbar": { "ticks": "", "outlinewidth": 0 }, "autocolorscale": true } ] }, "layout": { "geo": { "bgcolor": "white", "showland": true, "lakecolor": "white", "landcolor": "white", "showlakes": true, "subunitcolor": "#C8D4E3" }, "font": { "color": "#2a3f5f" }, "polar": { "bgcolor": "white", "radialaxis": { "ticks": "", "gridcolor": "#EBF0F8", "linecolor": "#EBF0F8" }, "angularaxis": { "ticks": "", "gridcolor": "#EBF0F8", "linecolor": "#EBF0F8" } }, "scene": { "xaxis": { "ticks": "", "gridcolor": "#DFE8F3", "gridwidth": 2, "linecolor": "#EBF0F8", "zerolinecolor": "#EBF0F8", "showbackground": true, "backgroundcolor": "white" }, "yaxis": { "ticks": "", "gridcolor": "#DFE8F3", "gridwidth": 2, "linecolor": "#EBF0F8", "zerolinecolor": "#EBF0F8", "showbackground": true, "backgroundcolor": "white" }, "zaxis": { "ticks": "", "gridcolor": "#DFE8F3", "gridwidth": 2, "linecolor": "#EBF0F8", "zerolinecolor": "#EBF0F8", "showbackground": true, "backgroundcolor": "white" } }, "title": { "x": 0.05 }, "xaxis": { "ticks": "", "gridcolor": "#EBF0F8", "linecolor": "#EBF0F8", "automargin": true, "zerolinecolor": "#EBF0F8", "zerolinewidth": 2 }, "yaxis": { "ticks": "", "gridcolor": "#EBF0F8", "linecolor": "#EBF0F8", "automargin": true, "zerolinecolor": "#EBF0F8", "zerolinewidth": 2 }, "ternary": { "aaxis": { "ticks": "", "gridcolor": "#DFE8F3", "linecolor": "#A2B1C6" }, "baxis": { "ticks": "", "gridcolor": "#DFE8F3", "linecolor": "#A2B1C6" }, "caxis": { "ticks": "", "gridcolor": "#DFE8F3", "linecolor": "#A2B1C6" }, "bgcolor": "white" }, "colorway": [ "#636efa", "#EF553B", "#00cc96", "#ab63fa", "#19d3f3", "#e763fa", "#fecb52", "#ffa15a", "#ff6692", "#b6e880" ], "hovermode": "closest", "colorscale": { "diverging": [ [ 0, "#8e0152" ], [ 0.1, "#c51b7d" ], [ 0.2, "#de77ae" ], [ 0.3, "#f1b6da" ], [ 0.4, "#fde0ef" ], [ 0.5, "#f7f7f7" ], [ 0.6, "#e6f5d0" ], [ 0.7, "#b8e186" ], [ 0.8, "#7fbc41" ], [ 0.9, "#4d9221" ], [ 1, "#276419" ] ], "sequential": [ [ 0, "#0508b8" ], [ 0.0893854748603352, "#1910d8" ], [ 0.1787709497206704, "#3c19f0" ], [ 0.2681564245810056, "#6b1cfb" ], [ 0.3575418994413408, "#981cfd" ], [ 0.44692737430167595, "#bf1cfd" ], [ 0.5363128491620112, "#dd2bfd" ], [ 0.6256983240223464, "#f246fe" ], [ 0.7150837988826816, "#fc67fd" ], [ 0.8044692737430168, "#fe88fc" ], [ 0.8938547486033519, "#fea5fd" ], [ 0.9832402234636871, "#febefe" ], [ 1, "#fec3fe" ] ], "sequentialminus": [ [ 0, "#0508b8" ], [ 0.0893854748603352, "#1910d8" ], [ 0.1787709497206704, "#3c19f0" ], [ 0.2681564245810056, "#6b1cfb" ], [ 0.3575418994413408, "#981cfd" ], [ 0.44692737430167595, "#bf1cfd" ], [ 0.5363128491620112, "#dd2bfd" ], [ 0.6256983240223464, "#f246fe" ], [ 0.7150837988826816, "#fc67fd" ], [ 0.8044692737430168, "#fe88fc" ], [ 0.8938547486033519, "#fea5fd" ], [ 0.9832402234636871, "#febefe" ], [ 1, "#fec3fe" ] ] }, "plot_bgcolor": "white", "paper_bgcolor": "white", "shapedefaults": { "line": { "width": 0 }, "opacity": 0.4, "fillcolor": "#506784" }, "annotationdefaults": { "arrowhead": 0, "arrowcolor": "#506784", "arrowwidth": 1 } }, "themeRef": "PLOTLY_WHITE" } } }, "height": null, "width": null, "user": { "profile_url": "https://chart-studio.plotly.com/~Severelag", "avatar_url": "https://storage.googleapis.com/plotly-prod-profiles/21.jpg", "background_url": "https://storage.googleapis.com/plotly-prod-profiles/bg-5.jpg", "bio": "", "nickname": "", "website": "", "stream_tokens": null, "feature_set_id": null, "csrf_token": null, "date_joined": "2025-08-29 18:32:37", "mapbox_access_tokens": null, "has_password": null, "username": "Severelag", "email": null, "is_active": null, "readonly": null, "is_dash_creator": null, "dash_created_count": null, "is_chart_creator": null, "charts_created_count": null } }, { "creation_time": "2025-09-08T01:43:23.579053Z", "comments": { "results": [], "count": 0 }, "parented": true, "embed_url": "https://chart-studio.plotly.com/~Azrael1234/1.embed", "fid": "Azrael1234:1", "filename": "Voltage as a Function of Drop Volume and Drop Height", "filetype": "plot", "img_url": "https://storage.googleapis.com/plotly-prod-images/Azrael1234/1/9_VWSH717K6K0MR2RWEV27AW5JJXOPQB.png", "image_urls": { "default": "https://storage.googleapis.com/plotly-prod-images/Azrael1234/1/2_P5NG4FSW3L6GORH7JO2UKH1WRX3QP9.png", "block-thumb": "https://storage.googleapis.com/plotly-prod-images/Azrael1234/1/8_6FNXHNIB3JILW8T6VPGZHX40YPVTD1.png", "list-thumb": "https://storage.googleapis.com/plotly-prod-images/Azrael1234/1/9_VWSH717K6K0MR2RWEV27AW5JJXOPQB.png" }, "api_urls": { "files": "https://api.plotly.com/v2/files/Azrael1234:1", "plots": "https://api.plotly.com/v2/plots/Azrael1234:1", "parent": "https://api.plotly.com/v2/folders/home?user=Azrael1234" }, "owner": "Azrael1234", "parent": -1, "preview": "", "referencers": [], "references": [], "title": "", "views": 1, "web_url": "https://chart-studio.plotly.com/~Azrael1234/1/", "world_readable": true, "date_modified": "2025-09-08T01:43:23.590Z", "stars": { "results": [], "count": 0 }, "collaborators": { "results": [], "count": 0 }, "subfolder_count": null, "refresh_interval": null, "organize_view_url": "https://chart-studio.plotly.com/~Azrael1234/1/", "current_user_permission": "read", "is_theme": null, "is_template": false, "autosize": true, "caption": "", "figure": { "data": [ { "meta": { "columnNames": { "x": "Drop Height (m)", "y": "Drop Volume (microliters)", "z": "Voltage (V)", "text": "" } }, "mode": "markers", "type": "scatter3d", "xsrc": "Azrael1234:0:d34806", "ysrc": "Azrael1234:0:7ac8e4", "zsrc": "Azrael1234:0:8dfdd3", "marker": { "size": 5 }, "error_x": { "type": "percent", "color": "#636efa", "value": 10, "width": 0, "visible": false, "symmetric": false, "thickness": 2, "valueminus": 10 }, "error_y": { "type": "percent", "color": "#636efa", "value": 10, "width": 0, "visible": false, "symmetric": true, "thickness": 2 }, "error_z": { "type": "percent", "color": "#636efa", "value": 10, "width": 0, "visible": false, "symmetric": true, "thickness": 2 }, "hoverinfo": "x+y+z" } ], "frames": [], "layout": { "scene": { "xaxis": { "type": "linear", "range": [ 0.5, 3 ], "title": { "font": { "family": "Liberation Sans" }, "text": "Drop Height (m)" }, "showline": false, "tickfont": { "family": "Liberation Sans" }, "autorange": false }, "yaxis": { "type": "linear", "range": [ 40, 65 ], "title": { "font": { "family": "Liberation Sans" }, "text": "Drop Volume (μL)<br>" }, "autorange": false }, "zaxis": { "type": "linear", "title": { "font": { "family": "Liberation Sans" }, "text": "Voltage (V)" } }, "camera": { "up": { "x": 0, "y": 0, "z": 1 }, "eye": { "x": -1.6921097516186687, "y": -1.5940856097168643, "z": 1.3748993287798295 }, "center": { "x": 0, "y": 0, "z": 0 }, "projection": { "type": "perspective" } }, "aspectmode": "auto", "aspectratio": { "x": 1, "y": 1, "z": 1 } }, "title": { "text": "Voltage (Volts) as a Function of Drop Volume (microliters) and Drop Height (meters)" }, "xaxis": { "range": [ -1, 6 ], "autorange": true }, "yaxis": { "range": [ -1, 4 ], "autorange": true }, "autosize": true, "template": { "data": { "bar": [ { "type": "bar", "marker": { "colorbar": { "ticks": "", "outlinewidth": 0 } } } ], "table": [ { "type": "table", "cells": { "fill": { "color": "#EBF0F8" }, "line": { "color": "white" } }, "header": { "fill": { "color": "#C8D4E3" }, "line": { "color": "white" } } } ], "carpet": [ { "type": "carpet", "aaxis": { "gridcolor": "white", "linecolor": "white", "endlinecolor": "#2a3f5f", "minorgridcolor": "white", "startlinecolor": "#2a3f5f" }, "baxis": { "gridcolor": "white", "linecolor": "white", "endlinecolor": "#2a3f5f", "minorgridcolor": "white", "startlinecolor": "#2a3f5f" } } ], "mesh3d": [ { "type": "mesh3d", "colorbar": { "ticks": "", "outlinewidth": 0 } } ], "contour": [ { "type": "contour", "colorbar": { "ticks": "", "outlinewidth": 0 }, "autocolorscale": true } ], "heatmap": [ { "type": "heatmap", "colorbar": { "ticks": "", "outlinewidth": 0 }, "autocolorscale": true } ], "scatter": [ { "type": "scatter", "marker": { "colorbar": { "ticks": "", "outlinewidth": 0 } } } ], "surface": [ { "type": "surface", "colorbar": { "ticks": "", "outlinewidth": 0 } } ], "heatmapgl": [ { "type": "heatmapgl", "colorbar": { "ticks": "", "outlinewidth": 0 } } ], "histogram": [ { "type": "histogram", "marker": { "colorbar": { "ticks": "", "outlinewidth": 0 } } } ], "parcoords": [ { "line": { "colorbar": { "ticks": "", "outlinewidth": 0 } }, "type": "parcoords" } ], "scatter3d": [ { "type": "scatter3d", "marker": { "colorbar": { "ticks": "", "outlinewidth": 0 } } } ], "scattergl": [ { "type": "scattergl", "marker": { "colorbar": { "ticks": "", "outlinewidth": 0 } } } ], "choropleth": [ { "type": "choropleth", "colorbar": { "ticks": "", "outlinewidth": 0 } } ], "scattergeo": [ { "type": "scattergeo", "marker": { "colorbar": { "ticks": "", "outlinewidth": 0 } } } ], "histogram2d": [ { "type": "histogram2d", "colorbar": { "ticks": "", "outlinewidth": 0 }, "autocolorscale": true } ], "scatterpolar": [ { "type": "scatterpolar", "marker": { "colorbar": { "ticks": "", "outlinewidth": 0 } } } ], "contourcarpet": [ { "type": "contourcarpet", "colorbar": { "ticks": "", "outlinewidth": 0 } } ], "scattercarpet": [ { "type": "scattercarpet", "marker": { "colorbar": { "ticks": "", "outlinewidth": 0 } } } ], "scattermapbox": [ { "type": "scattermapbox", "marker": { "colorbar": { "ticks": "", "outlinewidth": 0 } } } ], "scatterpolargl": [ { "type": "scatterpolargl", "marker": { "colorbar": { "ticks": "", "outlinewidth": 0 } } } ], "scatterternary": [ { "type": "scatterternary", "marker": { "colorbar": { "ticks": "", "outlinewidth": 0 } } } ], "histogram2dcontour": [ { "type": "histogram2dcontour", "colorbar": { "ticks": "", "outlinewidth": 0 }, "autocolorscale": true } ] }, "layout": { "geo": { "bgcolor": "white", "showland": true, "lakecolor": "white", "landcolor": "#E5ECF6", "showlakes": true, "subunitcolor": "white" }, "font": { "color": "#2a3f5f" }, "polar": { "bgcolor": "#E5ECF6", "radialaxis": { "ticks": "", "gridcolor": "white", "linecolor": "white" }, "angularaxis": { "ticks": "", "gridcolor": "white", "linecolor": "white" } }, "scene": { "xaxis": { "ticks": "", "gridcolor": "white", "gridwidth": 2, "linecolor": "white", "zerolinecolor": "white", "showbackground": true, "backgroundcolor": "#E5ECF6" }, "yaxis": { "ticks": "", "gridcolor": "white", "gridwidth": 2, "linecolor": "white", "zerolinecolor": "white", "showbackground": true, "backgroundcolor": "#E5ECF6" }, "zaxis": { "ticks": "", "gridcolor": "white", "gridwidth": 2, "linecolor": "white", "zerolinecolor": "white", "showbackground": true, "backgroundcolor": "#E5ECF6" } }, "title": { "x": 0.05 }, "xaxis": { "ticks": "", "gridcolor": "white", "linecolor": "white", "automargin": true, "zerolinecolor": "white", "zerolinewidth": 2 }, "yaxis": { "ticks": "", "gridcolor": "white", "linecolor": "white", "automargin": true, "zerolinecolor": "white", "zerolinewidth": 2 }, "ternary": { "aaxis": { "ticks": "", "gridcolor": "white", "linecolor": "white" }, "baxis": { "ticks": "", "gridcolor": "white", "linecolor": "white" }, "caxis": { "ticks": "", "gridcolor": "white", "linecolor": "white" }, "bgcolor": "#E5ECF6" }, "colorway": [ "#636efa", "#EF553B", "#00cc96", "#ab63fa", "#19d3f3", "#e763fa", "#fecb52", "#ffa15a", "#ff6692", "#b6e880" ], "hovermode": "closest", "colorscale": { "diverging": [ [ 0, "#8e0152" ], [ 0.1, "#c51b7d" ], [ 0.2, "#de77ae" ], [ 0.3, "#f1b6da" ], [ 0.4, "#fde0ef" ], [ 0.5, "#f7f7f7" ], [ 0.6, "#e6f5d0" ], [ 0.7, "#b8e186" ], [ 0.8, "#7fbc41" ], [ 0.9, "#4d9221" ], [ 1, "#276419" ] ], "sequential": [ [ 0, "#0508b8" ], [ 0.0893854748603352, "#1910d8" ], [ 0.1787709497206704, "#3c19f0" ], [ 0.2681564245810056, "#6b1cfb" ], [ 0.3575418994413408, "#981cfd" ], [ 0.44692737430167595, "#bf1cfd" ], [ 0.5363128491620112, "#dd2bfd" ], [ 0.6256983240223464, "#f246fe" ], [ 0.7150837988826816, "#fc67fd" ], [ 0.8044692737430168, "#fe88fc" ], [ 0.8938547486033519, "#fea5fd" ], [ 0.9832402234636871, "#febefe" ], [ 1, "#fec3fe" ] ], "sequentialminus": [ [ 0, "#0508b8" ], [ 0.0893854748603352, "#1910d8" ], [ 0.1787709497206704, "#3c19f0" ], [ 0.2681564245810056, "#6b1cfb" ], [ 0.3575418994413408, "#981cfd" ], [ 0.44692737430167595, "#bf1cfd" ], [ 0.5363128491620112, "#dd2bfd" ], [ 0.6256983240223464, "#f246fe" ], [ 0.7150837988826816, "#fc67fd" ], [ 0.8044692737430168, "#fe88fc" ], [ 0.8938547486033519, "#fea5fd" ], [ 0.9832402234636871, "#febefe" ], [ 1, "#fec3fe" ] ] }, "plot_bgcolor": "#E5ECF6", "paper_bgcolor": "white", "shapedefaults": { "line": { "width": 0 }, "opacity": 0.4, "fillcolor": "#506784" }, "annotationdefaults": { "arrowhead": 0, "arrowcolor": "#506784", "arrowwidth": 1 } }, "themeRef": "PLOTLY_GRAY" }, "showlegend": false } }, "height": null, "width": null, "user": { "profile_url": "https://chart-studio.plotly.com/~Azrael1234", "avatar_url": "https://storage.googleapis.com/plotly-prod-profiles/62.jpg", "background_url": "https://storage.googleapis.com/plotly-prod-profiles/bg-5.jpg", "bio": "", "nickname": "", "website": "", "stream_tokens": null, "feature_set_id": null, "csrf_token": null, "date_joined": "2025-09-08 01:37:57", "mapbox_access_tokens": null, "has_password": null, "username": "Azrael1234", "email": null, "is_active": null, "readonly": null, "is_dash_creator": null, "dash_created_count": null, "is_chart_creator": null, "charts_created_count": null } }, { "creation_time": "2025-09-07T23:07:48.170641Z", "comments": { "results": [], "count": 0 }, "parented": true, "embed_url": "https://chart-studio.plotly.com/~joao_fernando/3.embed", "fid": "joao_fernando:3", "filename": "Curva 0.635mm", "filetype": "plot", "img_url": "https://storage.googleapis.com/plotly-prod-images/joao_fernando/3/9_T7VNM2SL01LNYVB19AZCEN9U6GPW5N.png", "image_urls": { "default": "https://storage.googleapis.com/plotly-prod-images/joao_fernando/3/2_0Z8WNVEZEY1G2FUS4K09455DP3BVU0.png", "block-thumb": "https://storage.googleapis.com/plotly-prod-images/joao_fernando/3/8_H05FDF5JUE7LBML2UZSF6LB8T4NJVW.png", "list-thumb": "https://storage.googleapis.com/plotly-prod-images/joao_fernando/3/9_T7VNM2SL01LNYVB19AZCEN9U6GPW5N.png" }, "api_urls": { "files": "https://api.plotly.com/v2/files/joao_fernando:3", "plots": "https://api.plotly.com/v2/plots/joao_fernando:3", "parent": "https://api.plotly.com/v2/folders/home?user=joao_fernando" }, "owner": "joao_fernando", "parent": -1, "preview": "", "referencers": [], "references": [], "title": "", "views": 1, "web_url": "https://chart-studio.plotly.com/~joao_fernando/3/", "world_readable": true, "date_modified": "2025-09-07T23:07:48.181Z", "stars": { "results": [], "count": 0 }, "collaborators": { "results": [], "count": 0 }, "subfolder_count": null, "refresh_interval": null, "organize_view_url": "https://chart-studio.plotly.com/~joao_fernando/3/", "current_user_permission": "read", "is_theme": null, "is_template": false, "autosize": true, "caption": "", "figure": { "data": [ { "meta": { "columnNames": { "x": "x", "y": "y" } }, "mode": "lines", "type": "scatter", "xsrc": "joao_fernando:2:ba6c0f", "ysrc": "joao_fernando:2:7fa72c" } ], "frames": [], "layout": { "title": { "text": "Curva 0.635mm" }, "xaxis": { "type": "linear", "range": [ 0.5459750225006806, 8.99345780853034 ], "title": { "text": "pc, W/Kg at 60Hz" }, "autorange": true }, "yaxis": { "type": "linear", "range": [ 0.3065373065373066, 1.8265188265188266 ], "title": { "text": "B, T" }, "autorange": true }, "autosize": true } }, "height": null, "width": null, "user": { "profile_url": "https://chart-studio.plotly.com/~joao_fernando", "avatar_url": "https://storage.googleapis.com/plotly-prod-profiles/12.jpg", "background_url": "https://storage.googleapis.com/plotly-prod-profiles/bg-8.jpg", "bio": "", "nickname": "", "website": "", "stream_tokens": null, "feature_set_id": null, "csrf_token": null, "date_joined": "2025-09-07 22:58:26", "mapbox_access_tokens": null, "has_password": null, "username": "joao_fernando", "email": null, "is_active": null, "readonly": null, "is_dash_creator": null, "dash_created_count": null, "is_chart_creator": null, "charts_created_count": null } }, { "creation_time": "2025-09-07T23:00:48.830517Z", "comments": { "results": [], "count": 0 }, "parented": true, "embed_url": "https://chart-studio.plotly.com/~joao_fernando/1.embed", "fid": "joao_fernando:1", "filename": "Curva 0,470mm", "filetype": "plot", "img_url": "https://storage.googleapis.com/plotly-prod-images/joao_fernando/1/9_YB75OXMF1BNHASLPVAGTSCHAQD28SF.png", "image_urls": { "default": "https://storage.googleapis.com/plotly-prod-images/joao_fernando/1/2_DJYJH149D9B7ZY8EDV5HSSEFFWRVL9.png", "block-thumb": "https://storage.googleapis.com/plotly-prod-images/joao_fernando/1/8_ZGBFLQEZ6T1KTUC6ZE63NC7Z2KLZLE.png", "list-thumb": "https://storage.googleapis.com/plotly-prod-images/joao_fernando/1/9_YB75OXMF1BNHASLPVAGTSCHAQD28SF.png" }, "api_urls": { "files": "https://api.plotly.com/v2/files/joao_fernando:1", "plots": "https://api.plotly.com/v2/plots/joao_fernando:1", "parent": "https://api.plotly.com/v2/folders/home?user=joao_fernando" }, "owner": "joao_fernando", "parent": -1, "preview": "", "referencers": [], "references": [], "title": "", "views": 1, "web_url": "https://chart-studio.plotly.com/~joao_fernando/1/", "world_readable": true, "date_modified": "2025-09-07T23:01:05.886Z", "stars": { "results": [], "count": 0 }, "collaborators": { "results": [], "count": 0 }, "subfolder_count": null, "refresh_interval": null, "organize_view_url": "https://chart-studio.plotly.com/~joao_fernando/1/", "current_user_permission": "read", "is_theme": null, "is_template": false, "autosize": true, "caption": "", "figure": { "data": [ { "meta": { "columnNames": { "x": "x", "y": "y" } }, "mode": "lines", "type": "scatter", "xsrc": "joao_fernando:0:a71e92", "ysrc": "joao_fernando:0:eb8945" } ], "frames": [], "layout": { "title": { "text": "Curva 0.470mm" }, "xaxis": { "type": "linear", "range": [ 0.44803186237913767, 7.744711343205276 ], "autorange": true }, "yaxis": { "type": "linear", "range": [ 0.29429429429429443, 1.8096558096558097 ], "autorange": true }, "autosize": true } }, "height": null, "width": null, "user": { "profile_url": "https://chart-studio.plotly.com/~joao_fernando", "avatar_url": "https://storage.googleapis.com/plotly-prod-profiles/12.jpg", "background_url": "https://storage.googleapis.com/plotly-prod-profiles/bg-8.jpg", "bio": "", "nickname": "", "website": "", "stream_tokens": null, "feature_set_id": null, "csrf_token": null, "date_joined": "2025-09-07 22:58:26", "mapbox_access_tokens": null, "has_password": null, "username": "joao_fernando", "email": null, "is_active": null, "readonly": null, "is_dash_creator": null, "dash_created_count": null, "is_chart_creator": null, "charts_created_count": null } }, { "creation_time": "2025-09-07T22:12:15.363150Z", "comments": { "results": [], "count": 0 }, "parented": true, "embed_url": "https://chart-studio.plotly.com/~sigmaohio/1.embed", "fid": "sigmaohio:1", "filename": "Plot 1", "filetype": "plot", "img_url": "https://storage.googleapis.com/plotly-prod-images/sigmaohio/1/9_87SZNIOO2X0LUFMOQIPUM5SEORQIAU.png", "image_urls": { "default": "https://storage.googleapis.com/plotly-prod-images/sigmaohio/1/2_HSU0MG6R9HJ52J11NR4SUACA3WOOOD.png", "block-thumb": "https://storage.googleapis.com/plotly-prod-images/sigmaohio/1/8_S2REBSDH9PXA33O3YKDY4S30WBKI5T.png", "list-thumb": "https://storage.googleapis.com/plotly-prod-images/sigmaohio/1/9_87SZNIOO2X0LUFMOQIPUM5SEORQIAU.png" }, "api_urls": { "files": "https://api.plotly.com/v2/files/sigmaohio:1", "plots": "https://api.plotly.com/v2/plots/sigmaohio:1", "parent": "https://api.plotly.com/v2/folders/home?user=sigmaohio" }, "owner": "sigmaohio", "parent": -1, "preview": "", "referencers": [], "references": [], "title": "", "views": 0, "web_url": "https://chart-studio.plotly.com/~sigmaohio/1/", "world_readable": true, "date_modified": "2025-09-07T22:18:53.645Z", "stars": { "results": [], "count": 0 }, "collaborators": { "results": [], "count": 0 }, "subfolder_count": null, "refresh_interval": null, "organize_view_url": "https://chart-studio.plotly.com/~sigmaohio/1/", "current_user_permission": "read", "is_theme": null, "is_template": false, "autosize": true, "caption": "", "figure": { "data": [ { "meta": { "columnNames": { "x": "B", "y": "A" } }, "mode": "markers", "type": "bar", "xsrc": "sigmaohio:0:e62e87", "ysrc": "sigmaohio:0:78ffc2", "orientation": "v", "selectedpoints": [] } ], "frames": [], "layout": { "title": { "x": 0.06, "text": "Rate of diffusion across cubes of different edge length" }, "xaxis": { "type": "linear", "dtick": 0.5, "range": [ 0.7234982332155477, 2.2234982332155475 ], "tick0": 0, "title": { "text": "Edge Length(cm)" }, "tickmode": "linear", "autorange": false, "showspikes": false }, "yaxis": { "type": "linear", "range": [ 0, 4298.469886055346 ], "title": { "text": "Time(seconds)" }, "autorange": false, "showspikes": false }, "shapes": [ { "x0": 0.99, "x1": 1.01, "y0": 519.8994974874369, "y1": 988.9817508595609, "line": { "color": "#444444" }, "opacity": 1, "fillcolor": "rgb(0, 0, 0)" }, { "x0": 1.49, "x1": 1.51, "y0": 1481.518116900291, "y1": 2060.0528960592437, "line": { "color": "#444444" }, "opacity": 1, "fillcolor": "rgb(0, 0, 0)" }, { "x0": 1.99, "x1": 2.01, "y0": 2622.9516001057923, "y1": 3209.304416820947, "line": { "color": "#444444" }, "opacity": 1, "fillcolor": "rgb(0, 0, 0)" }, { "x0": 1, "x1": 1.5, "y0": 2947.153718592964, "y1": 3033.1137185929647, "line": { "color": "#444444" }, "opacity": 1, "fillcolor": "rgb(0, 0, 0)" }, { "x0": 1.5, "x1": 2, "y0": 3576.752181962445, "y1": 3670.5686326368696, "line": { "color": "#444444" }, "opacity": 1, "fillcolor": "rgb(0, 0, 0)" }, { "x0": 1, "x1": 2, "y0": 4053.6524728907707, "y1": 4139.650886008993, "line": { "color": "#444444" }, "opacity": 1, "fillcolor": "rgb(0, 0, 0)" } ], "autosize": true, "dragmode": "pan", "template": { "data": { "bar": [ { "type": "bar", "marker": { "colorbar": { "ticks": "", "outlinewidth": 0 } } } ], "table": [ { "type": "table", "cells": { "fill": { "color": "#EBF0F8" }, "line": { "color": "white" } }, "header": { "fill": { "color": "#C8D4E3" }, "line": { "color": "white" } } } ], "carpet": [ { "type": "carpet", "aaxis": { "gridcolor": "#C8D4E3", "linecolor": "#C8D4E3", "endlinecolor": "#2a3f5f", "minorgridcolor": "#C8D4E3", "startlinecolor": "#2a3f5f" }, "baxis": { "gridcolor": "#C8D4E3", "linecolor": "#C8D4E3", "endlinecolor": "#2a3f5f", "minorgridcolor": "#C8D4E3", "startlinecolor": "#2a3f5f" } } ], "mesh3d": [ { "type": "mesh3d", "colorbar": { "ticks": "", "outlinewidth": 0 } } ], "contour": [ { "type": "contour", "colorbar": { "ticks": "", "outlinewidth": 0 }, "autocolorscale": true } ], "heatmap": [ { "type": "heatmap", "colorbar": { "ticks": "", "outlinewidth": 0 }, "autocolorscale": true } ], "scatter": [ { "type": "scatter", "marker": { "colorbar": { "ticks": "", "outlinewidth": 0 } } } ], "surface": [ { "type": "surface", "colorbar": { "ticks": "", "outlinewidth": 0 } } ], "heatmapgl": [ { "type": "heatmapgl", "colorbar": { "ticks": "", "outlinewidth": 0 } } ], "histogram": [ { "type": "histogram", "marker": { "colorbar": { "ticks": "", "outlinewidth": 0 } } } ], "parcoords": [ { "line": { "colorbar": { "ticks": "", "outlinewidth": 0 } }, "type": "parcoords" } ], "scatter3d": [ { "type": "scatter3d", "marker": { "colorbar": { "ticks": "", "outlinewidth": 0 } } } ], "scattergl": [ { "type": "scattergl", "marker": { "colorbar": { "ticks": "", "outlinewidth": 0 } } } ], "choropleth": [ { "type": "choropleth", "colorbar": { "ticks": "", "outlinewidth": 0 } } ], "scattergeo": [ { "type": "scattergeo", "marker": { "colorbar": { "ticks": "", "outlinewidth": 0 } } } ], "histogram2d": [ { "type": "histogram2d", "colorbar": { "ticks": "", "outlinewidth": 0 }, "autocolorscale": true } ], "scatterpolar": [ { "type": "scatterpolar", "marker": { "colorbar": { "ticks": "", "outlinewidth": 0 } } } ], "contourcarpet": [ { "type": "contourcarpet", "colorbar": { "ticks": "", "outlinewidth": 0 } } ], "scattercarpet": [ { "type": "scattercarpet", "marker": { "colorbar": { "ticks": "", "outlinewidth": 0 } } } ], "scattermapbox": [ { "type": "scattermapbox", "marker": { "colorbar": { "ticks": "", "outlinewidth": 0 } } } ], "scatterpolargl": [ { "type": "scatterpolargl", "marker": { "colorbar": { "ticks": "", "outlinewidth": 0 } } } ], "scatterternary": [ { "type": "scatterternary", "marker": { "colorbar": { "ticks": "", "outlinewidth": 0 } } } ], "histogram2dcontour": [ { "type": "histogram2dcontour", "colorbar": { "ticks": "", "outlinewidth": 0 }, "autocolorscale": true } ] }, "layout": { "geo": { "bgcolor": "white", "showland": true, "lakecolor": "white", "landcolor": "white", "showlakes": true, "subunitcolor": "#C8D4E3" }, "font": { "color": "#2a3f5f" }, "polar": { "bgcolor": "white", "radialaxis": { "ticks": "", "gridcolor": "#EBF0F8", "linecolor": "#EBF0F8" }, "angularaxis": { "ticks": "", "gridcolor": "#EBF0F8", "linecolor": "#EBF0F8" } }, "scene": { "xaxis": { "ticks": "", "gridcolor": "#DFE8F3", "gridwidth": 2, "linecolor": "#EBF0F8", "zerolinecolor": "#EBF0F8", "showbackground": true, "backgroundcolor": "white" }, "yaxis": { "ticks": "", "gridcolor": "#DFE8F3", "gridwidth": 2, "linecolor": "#EBF0F8", "zerolinecolor": "#EBF0F8", "showbackground": true, "backgroundcolor": "white" }, "zaxis": { "ticks": "", "gridcolor": "#DFE8F3", "gridwidth": 2, "linecolor": "#EBF0F8", "zerolinecolor": "#EBF0F8", "showbackground": true, "backgroundcolor": "white" } }, "title": { "x": 0.05 }, "xaxis": { "ticks": "", "gridcolor": "#EBF0F8", "linecolor": "#EBF0F8", "automargin": true, "zerolinecolor": "#EBF0F8", "zerolinewidth": 2 }, "yaxis": { "ticks": "", "gridcolor": "#EBF0F8", "linecolor": "#EBF0F8", "automargin": true, "zerolinecolor": "#EBF0F8", "zerolinewidth": 2 }, "ternary": { "aaxis": { "ticks": "", "gridcolor": "#DFE8F3", "linecolor": "#A2B1C6" }, "baxis": { "ticks": "", "gridcolor": "#DFE8F3", "linecolor": "#A2B1C6" }, "caxis": { "ticks": "", "gridcolor": "#DFE8F3", "linecolor": "#A2B1C6" }, "bgcolor": "white" }, "colorway": [ "#636efa", "#EF553B", "#00cc96", "#ab63fa", "#19d3f3", "#e763fa", "#fecb52", "#ffa15a", "#ff6692", "#b6e880" ], "hovermode": "closest", "colorscale": { "diverging": [ [ 0, "#8e0152" ], [ 0.1, "#c51b7d" ], [ 0.2, "#de77ae" ], [ 0.3, "#f1b6da" ], [ 0.4, "#fde0ef" ], [ 0.5, "#f7f7f7" ], [ 0.6, "#e6f5d0" ], [ 0.7, "#b8e186" ], [ 0.8, "#7fbc41" ], [ 0.9, "#4d9221" ], [ 1, "#276419" ] ], "sequential": [ [ 0, "#0508b8" ], [ 0.0893854748603352, "#1910d8" ], [ 0.1787709497206704, "#3c19f0" ], [ 0.2681564245810056, "#6b1cfb" ], [ 0.3575418994413408, "#981cfd" ], [ 0.44692737430167595, "#bf1cfd" ], [ 0.5363128491620112, "#dd2bfd" ], [ 0.6256983240223464, "#f246fe" ], [ 0.7150837988826816, "#fc67fd" ], [ 0.8044692737430168, "#fe88fc" ], [ 0.8938547486033519, "#fea5fd" ], [ 0.9832402234636871, "#febefe" ], [ 1, "#fec3fe" ] ], "sequentialminus": [ [ 0, "#0508b8" ], [ 0.0893854748603352, "#1910d8" ], [ 0.1787709497206704, "#3c19f0" ], [ 0.2681564245810056, "#6b1cfb" ], [ 0.3575418994413408, "#981cfd" ], [ 0.44692737430167595, "#bf1cfd" ], [ 0.5363128491620112, "#dd2bfd" ], [ 0.6256983240223464, "#f246fe" ], [ 0.7150837988826816, "#fc67fd" ], [ 0.8044692737430168, "#fe88fc" ], [ 0.8938547486033519, "#fea5fd" ], [ 0.9832402234636871, "#febefe" ], [ 1, "#fec3fe" ] ] }, "plot_bgcolor": "white", "paper_bgcolor": "white", "shapedefaults": { "line": { "width": 0 }, "opacity": 0.4, "fillcolor": "#506784" }, "annotationdefaults": { "arrowhead": 0, "arrowcolor": "#506784", "arrowwidth": 1 } }, "themeRef": "PLOTLY_WHITE" }, "showlegend": false, "annotations": [ { "x": 1.226148409893993, "y": 3369.57418672309, "ax": -160, "ay": 0, "text": "***", "showarrow": false }, { "x": 1.736749116607774, "y": 3721.385876752183, "text": "***", "showarrow": false }, { "x": 1.4840989399293287, "y": 4190.468130124307, "text": "***", "showarrow": false } ] } }, "height": null, "width": null, "user": { "profile_url": "https://chart-studio.plotly.com/~sigmaohio", "avatar_url": "https://storage.googleapis.com/plotly-prod-profiles/34.jpg", "background_url": "https://storage.googleapis.com/plotly-prod-profiles/bg-6.jpg", "bio": "", "nickname": "", "website": "", "stream_tokens": null, "feature_set_id": null, "csrf_token": null, "date_joined": "2025-09-07 22:11:07", "mapbox_access_tokens": null, "has_password": null, "username": "sigmaohio", "email": null, "is_active": null, "readonly": null, "is_dash_creator": null, "dash_created_count": null, "is_chart_creator": null, "charts_created_count": null } }, { "creation_time": "2025-09-07T20:23:00.881277Z", "comments": { "results": [], "count": 0 }, "parented": true, "embed_url": "https://chart-studio.plotly.com/~rluke/1.embed", "fid": "rluke:1", "filename": "Plot 1", "filetype": "plot", "img_url": "https://storage.googleapis.com/plotly-prod-images/rluke/1/9_H1EPZ1A0YXRABXQM4LTBUSJSSES71A.png", "image_urls": { "default": "https://storage.googleapis.com/plotly-prod-images/rluke/1/2_KJJS64S4UN2MVHSUXQ9EHSIEATTRON.png", "block-thumb": "https://storage.googleapis.com/plotly-prod-images/rluke/1/8_RFYEDYUP5Q8VOOZTNP4PW15AP2NUIJ.png", "list-thumb": "https://storage.googleapis.com/plotly-prod-images/rluke/1/9_H1EPZ1A0YXRABXQM4LTBUSJSSES71A.png" }, "api_urls": { "files": "https://api.plotly.com/v2/files/rluke:1", "plots": "https://api.plotly.com/v2/plots/rluke:1", "parent": "https://api.plotly.com/v2/folders/home?user=rluke" }, "owner": "rluke", "parent": -1, "preview": "", "referencers": [], "references": [], "title": "", "views": 2, "web_url": "https://chart-studio.plotly.com/~rluke/1/", "world_readable": true, "date_modified": "2025-09-07T20:23:00.896Z", "stars": { "results": [], "count": 0 }, "collaborators": { "results": [], "count": 0 }, "subfolder_count": null, "refresh_interval": null, "organize_view_url": "https://chart-studio.plotly.com/~rluke/1/", "current_user_permission": "read", "is_theme": null, "is_template": false, "autosize": true, "caption": "", "figure": { "data": [ { "meta": { "columnNames": { "x": "A", "y": "B" } }, "mode": "markers", "name": "Plot pair (t^2,y)", "type": "scatter", "xsrc": "rluke:0:188e4a", "ysrc": "rluke:0:96e1ae", "visible": true }, { "meta": { "columnNames": { "x": "C", "y": "D" } }, "mode": "lines", "name": "Converted curve into Straight line", "type": "scatter", "xsrc": "rluke:0:a949eb", "ysrc": "rluke:0:3cae27" } ], "frames": [], "layout": { "title": { "text": "Averaged displacement y (m) versus Time squared (s^2)" }, "xaxis": { "type": "linear", "range": [ -0.10224039829302989, 1.6647403982930298 ], "title": { "text": "Time Squared (s²)" }, "autorange": true }, "yaxis": { "type": "linear", "range": [ -0.7529521016617791, 8.57295210166178 ], "title": { "text": "Average displacement y (m)" }, "autorange": true }, "autosize": true, "dragmode": "pan", "template": { "data": { "bar": [ { "type": "bar", "marker": { "colorbar": { "ticks": "", "outlinewidth": 0 } } } ], "table": [ { "type": "table", "cells": { "fill": { "color": "#EBF0F8" }, "line": { "color": "white" } }, "header": { "fill": { "color": "#C8D4E3" }, "line": { "color": "white" } } } ], "carpet": [ { "type": "carpet", "aaxis": { "gridcolor": "#C8D4E3", "linecolor": "#C8D4E3", "endlinecolor": "#2a3f5f", "minorgridcolor": "#C8D4E3", "startlinecolor": "#2a3f5f" }, "baxis": { "gridcolor": "#C8D4E3", "linecolor": "#C8D4E3", "endlinecolor": "#2a3f5f", "minorgridcolor": "#C8D4E3", "startlinecolor": "#2a3f5f" } } ], "mesh3d": [ { "type": "mesh3d", "colorbar": { "ticks": "", "outlinewidth": 0 } } ], "contour": [ { "type": "contour", "colorbar": { "ticks": "", "outlinewidth": 0 }, "autocolorscale": true } ], "heatmap": [ { "type": "heatmap", "colorbar": { "ticks": "", "outlinewidth": 0 }, "autocolorscale": true } ], "scatter": [ { "type": "scatter", "marker": { "colorbar": { "ticks": "", "outlinewidth": 0 } } } ], "surface": [ { "type": "surface", "colorbar": { "ticks": "", "outlinewidth": 0 } } ], "heatmapgl": [ { "type": "heatmapgl", "colorbar": { "ticks": "", "outlinewidth": 0 } } ], "histogram": [ { "type": "histogram", "marker": { "colorbar": { "ticks": "", "outlinewidth": 0 } } } ], "parcoords": [ { "line": { "colorbar": { "ticks": "", "outlinewidth": 0 } }, "type": "parcoords" } ], "scatter3d": [ { "type": "scatter3d", "marker": { "colorbar": { "ticks": "", "outlinewidth": 0 } } } ], "scattergl": [ { "type": "scattergl", "marker": { "colorbar": { "ticks": "", "outlinewidth": 0 } } } ], "choropleth": [ { "type": "choropleth", "colorbar": { "ticks": "", "outlinewidth": 0 } } ], "scattergeo": [ { "type": "scattergeo", "marker": { "colorbar": { "ticks": "", "outlinewidth": 0 } } } ], "histogram2d": [ { "type": "histogram2d", "colorbar": { "ticks": "", "outlinewidth": 0 }, "autocolorscale": true } ], "scatterpolar": [ { "type": "scatterpolar", "marker": { "colorbar": { "ticks": "", "outlinewidth": 0 } } } ], "contourcarpet": [ { "type": "contourcarpet", "colorbar": { "ticks": "", "outlinewidth": 0 } } ], "scattercarpet": [ { "type": "scattercarpet", "marker": { "colorbar": { "ticks": "", "outlinewidth": 0 } } } ], "scattermapbox": [ { "type": "scattermapbox", "marker": { "colorbar": { "ticks": "", "outlinewidth": 0 } } } ], "scatterpolargl": [ { "type": "scatterpolargl", "marker": { "colorbar": { "ticks": "", "outlinewidth": 0 } } } ], "scatterternary": [ { "type": "scatterternary", "marker": { "colorbar": { "ticks": "", "outlinewidth": 0 } } } ], "histogram2dcontour": [ { "type": "histogram2dcontour", "colorbar": { "ticks": "", "outlinewidth": 0 }, "autocolorscale": true } ] }, "layout": { "geo": { "bgcolor": "white", "showland": true, "lakecolor": "white", "landcolor": "white", "showlakes": true, "subunitcolor": "#C8D4E3" }, "font": { "color": "#2a3f5f" }, "polar": { "bgcolor": "white", "radialaxis": { "ticks": "", "gridcolor": "#EBF0F8", "linecolor": "#EBF0F8" }, "angularaxis": { "ticks": "", "gridcolor": "#EBF0F8", "linecolor": "#EBF0F8" } }, "scene": { "xaxis": { "ticks": "", "gridcolor": "#DFE8F3", "gridwidth": 2, "linecolor": "#EBF0F8", "zerolinecolor": "#EBF0F8", "showbackground": true, "backgroundcolor": "white" }, "yaxis": { "ticks": "", "gridcolor": "#DFE8F3", "gridwidth": 2, "linecolor": "#EBF0F8", "zerolinecolor": "#EBF0F8", "showbackground": true, "backgroundcolor": "white" }, "zaxis": { "ticks": "", "gridcolor": "#DFE8F3", "gridwidth": 2, "linecolor": "#EBF0F8", "zerolinecolor": "#EBF0F8", "showbackground": true, "backgroundcolor": "white" } }, "title": { "x": 0.05 }, "xaxis": { "ticks": "", "gridcolor": "#EBF0F8", "linecolor": "#EBF0F8", "automargin": true, "zerolinecolor": "#EBF0F8", "zerolinewidth": 2 }, "yaxis": { "ticks": "", "gridcolor": "#EBF0F8", "linecolor": "#EBF0F8", "automargin": true, "zerolinecolor": "#EBF0F8", "zerolinewidth": 2 }, "ternary": { "aaxis": { "ticks": "", "gridcolor": "#DFE8F3", "linecolor": "#A2B1C6" }, "baxis": { "ticks": "", "gridcolor": "#DFE8F3", "linecolor": "#A2B1C6" }, "caxis": { "ticks": "", "gridcolor": "#DFE8F3", "linecolor": "#A2B1C6" }, "bgcolor": "white" }, "colorway": [ "#636efa", "#EF553B", "#00cc96", "#ab63fa", "#19d3f3", "#e763fa", "#fecb52", "#ffa15a", "#ff6692", "#b6e880" ], "hovermode": "closest", "colorscale": { "diverging": [ [ 0, "#8e0152" ], [ 0.1, "#c51b7d" ], [ 0.2, "#de77ae" ], [ 0.3, "#f1b6da" ], [ 0.4, "#fde0ef" ], [ 0.5, "#f7f7f7" ], [ 0.6, "#e6f5d0" ], [ 0.7, "#b8e186" ], [ 0.8, "#7fbc41" ], [ 0.9, "#4d9221" ], [ 1, "#276419" ] ], "sequential": [ [ 0, "#0508b8" ], [ 0.0893854748603352, "#1910d8" ], [ 0.1787709497206704, "#3c19f0" ], [ 0.2681564245810056, "#6b1cfb" ], [ 0.3575418994413408, "#981cfd" ], [ 0.44692737430167595, "#bf1cfd" ], [ 0.5363128491620112, "#dd2bfd" ], [ 0.6256983240223464, "#f246fe" ], [ 0.7150837988826816, "#fc67fd" ], [ 0.8044692737430168, "#fe88fc" ], [ 0.8938547486033519, "#fea5fd" ], [ 0.9832402234636871, "#febefe" ], [ 1, "#fec3fe" ] ], "sequentialminus": [ [ 0, "#0508b8" ], [ 0.0893854748603352, "#1910d8" ], [ 0.1787709497206704, "#3c19f0" ], [ 0.2681564245810056, "#6b1cfb" ], [ 0.3575418994413408, "#981cfd" ], [ 0.44692737430167595, "#bf1cfd" ], [ 0.5363128491620112, "#dd2bfd" ], [ 0.6256983240223464, "#f246fe" ], [ 0.7150837988826816, "#fc67fd" ], [ 0.8044692737430168, "#fe88fc" ], [ 0.8938547486033519, "#fea5fd" ], [ 0.9832402234636871, "#febefe" ], [ 1, "#fec3fe" ] ] }, "plot_bgcolor": "white", "paper_bgcolor": "white", "shapedefaults": { "line": { "width": 0 }, "opacity": 0.4, "fillcolor": "#506784" }, "annotationdefaults": { "arrowhead": 0, "arrowcolor": "#506784", "arrowwidth": 1 } }, "themeRef": "PLOTLY_WHITE" } } }, "height": null, "width": null, "user": { "profile_url": "https://chart-studio.plotly.com/~rluke", "avatar_url": "https://storage.googleapis.com/plotly-prod-profiles/1.jpg", "background_url": "https://storage.googleapis.com/plotly-prod-profiles/bg-10.jpg", "bio": "", "nickname": "", "website": "", "stream_tokens": null, "feature_set_id": null, "csrf_token": null, "date_joined": "2025-09-07 20:02:51", "mapbox_access_tokens": null, "has_password": null, "username": "rluke", "email": null, "is_active": null, "readonly": null, "is_dash_creator": null, "dash_created_count": null, "is_chart_creator": null, "charts_created_count": null } }, { "creation_time": "2025-09-07T20:06:21.705432Z", "comments": { "results": [], "count": 0 }, "parented": true, "embed_url": "https://chart-studio.plotly.com/~Pedro-estudante/1.embed", "fid": "Pedro-estudante:1", "filename": "Plot 1", "filetype": "plot", "img_url": "https://storage.googleapis.com/plotly-prod-images/Pedro-estudante/1/9_LZYCHMUW5N8I0KRJ9E59S3KSWX2EA3.png", "image_urls": { "default": "https://storage.googleapis.com/plotly-prod-images/Pedro-estudante/1/2_M1GUXZ3NRCCKH8FOQMPLKGGL7PMMFZ.png", "block-thumb": "https://storage.googleapis.com/plotly-prod-images/Pedro-estudante/1/8_I53DBNS73950L8TR0CLITNW9U1DJ0U.png", "list-thumb": "https://storage.googleapis.com/plotly-prod-images/Pedro-estudante/1/9_LZYCHMUW5N8I0KRJ9E59S3KSWX2EA3.png" }, "api_urls": { "files": "https://api.plotly.com/v2/files/Pedro-estudante:1", "plots": "https://api.plotly.com/v2/plots/Pedro-estudante:1", "parent": "https://api.plotly.com/v2/folders/home?user=Pedro-estudante" }, "owner": "Pedro-estudante", "parent": -1, "preview": "", "referencers": [], "references": [], "title": "", "views": 2, "web_url": "https://chart-studio.plotly.com/~Pedro-estudante/1/", "world_readable": true, "date_modified": "2025-09-07T20:34:55.016Z", "stars": { "results": [], "count": 0 }, "collaborators": { "results": [], "count": 0 }, "subfolder_count": null, "refresh_interval": null, "organize_view_url": "https://chart-studio.plotly.com/~Pedro-estudante/1/", "current_user_permission": "read", "is_theme": null, "is_template": false, "autosize": true, "caption": "", "figure": { "data": [ { "uid": "3d8eee", "meta": { "columnNames": { "x": "A", "y": "C", "text": "", "error_x": { "array": "", "arrayminus": "" }, "error_y": { "array": "D", "arrayminus": "D" } } }, "mode": "markers", "name": "Medições", "type": "scatter", "xsrc": "Pedro-estudante:0:abd92f", "ysrc": "Pedro-estudante:0:562be7", "marker": { "size": 11, "color": "rgb(4, 12, 115)" }, "error_x": { "value": 2, "visible": true, "symmetric": true }, "error_y": { "type": "percent", "value": 2, "visible": true, "symmetric": true } }, { "uid": "c97a59", "name": "Constante elástica", "transforms": [ { "rms": "", "type": "fit", "inputUid": "3d8eee", "regressor": "x", "parameters": [ { "hold": false, "name": "m", "error": 0.0033464325859189014, "value": 0.1890639108377915 }, { "hold": false, "name": "b", "error": 0.00236147054277427, "value": -0.007054275741010042 } ], "regressand": "y", "correlation": "", "fitfunction": "m*x + b", "inputxrange": [], "outputxrange": [], "interpolation": 50 } ] } ], "frames": [], "layout": { "font": { "size": 20 }, "title": { "font": { "size": 28 }, "text": "Mola Cinza" }, "xaxis": { "type": "linear", "range": [ -0.08325117009307137, 1.2325110300048985 ], "title": { "text": "Deformação (M)" }, "nticks": 13, "tickmode": "auto", "autorange": true, "gridwidth": 3, "showspikes": false, "tickformat": "", "tickprefix": "custom", "ticksuffix": "D", "rangeslider": { "range": [ -81606.4065890051, 1232424.4635046844 ], "yaxis": {}, "visible": false, "autorange": true }, "showtickprefix": "none" }, "yaxis": { "type": "linear", "range": [ -0.029466957946477336, 0.24146695794647732 ], "title": { "text": "Peso (N)" }, "nticks": 9, "autorange": true, "gridwidth": 3, "showspikes": false, "tickformat": "" }, "legend": { "x": 1.02, "y": 1, "title": { "font": { "color": "rgb(55, 86, 135)" }, "text": "<br>" } }, "margin": { "t": 100 }, "autosize": true, "colorway": [ "#636efa", "#EF553B", "#00cc96", "#ab63fa", "#19d3f3", "#e763fa", "#fecb52", "#ffa15a", "#ff6692", "#b6e880" ], "dragmode": "zoom", "template": { "data": { "bar": [ { "type": "bar", "marker": { "colorbar": { "ticks": "", "outlinewidth": 0 } } } ], "table": [ { "type": "table", "cells": { "fill": { "color": "#EBF0F8" }, "line": { "color": "white" } }, "header": { "fill": { "color": "#C8D4E3" }, "line": { "color": "white" } } } ], "carpet": [ { "type": "carpet", "aaxis": { "gridcolor": "#C8D4E3", "linecolor": "#C8D4E3", "endlinecolor": "#2a3f5f", "minorgridcolor": "#C8D4E3", "startlinecolor": "#2a3f5f" }, "baxis": { "gridcolor": "#C8D4E3", "linecolor": "#C8D4E3", "endlinecolor": "#2a3f5f", "minorgridcolor": "#C8D4E3", "startlinecolor": "#2a3f5f" } } ], "mesh3d": [ { "type": "mesh3d", "colorbar": { "ticks": "", "outlinewidth": 0 } } ], "contour": [ { "type": "contour", "colorbar": { "ticks": "", "outlinewidth": 0 }, "autocolorscale": true } ], "heatmap": [ { "type": "heatmap", "colorbar": { "ticks": "", "outlinewidth": 0 }, "autocolorscale": true } ], "scatter": [ { "type": "scatter", "marker": { "colorbar": { "ticks": "", "outlinewidth": 0 } } } ], "surface": [ { "type": "surface", "colorbar": { "ticks": "", "outlinewidth": 0 } } ], "heatmapgl": [ { "type": "heatmapgl", "colorbar": { "ticks": "", "outlinewidth": 0 } } ], "histogram": [ { "type": "histogram", "marker": { "colorbar": { "ticks": "", "outlinewidth": 0 } } } ], "parcoords": [ { "line": { "colorbar": { "ticks": "", "outlinewidth": 0 } }, "type": "parcoords" } ], "scatter3d": [ { "type": "scatter3d", "marker": { "colorbar": { "ticks": "", "outlinewidth": 0 } } } ], "scattergl": [ { "type": "scattergl", "marker": { "colorbar": { "ticks": "", "outlinewidth": 0 } } } ], "choropleth": [ { "type": "choropleth", "colorbar": { "ticks": "", "outlinewidth": 0 } } ], "scattergeo": [ { "type": "scattergeo", "marker": { "colorbar": { "ticks": "", "outlinewidth": 0 } } } ], "histogram2d": [ { "type": "histogram2d", "colorbar": { "ticks": "", "outlinewidth": 0 }, "autocolorscale": true } ], "scatterpolar": [ { "type": "scatterpolar", "marker": { "colorbar": { "ticks": "", "outlinewidth": 0 } } } ], "contourcarpet": [ { "type": "contourcarpet", "colorbar": { "ticks": "", "outlinewidth": 0 } } ], "scattercarpet": [ { "type": "scattercarpet", "marker": { "colorbar": { "ticks": "", "outlinewidth": 0 } } } ], "scattermapbox": [ { "type": "scattermapbox", "marker": { "colorbar": { "ticks": "", "outlinewidth": 0 } } } ], "scatterpolargl": [ { "type": "scatterpolargl", "marker": { "colorbar": { "ticks": "", "outlinewidth": 0 } } } ], "scatterternary": [ { "type": "scatterternary", "marker": { "colorbar": { "ticks": "", "outlinewidth": 0 } } } ], "histogram2dcontour": [ { "type": "histogram2dcontour", "colorbar": { "ticks": "", "outlinewidth": 0 }, "autocolorscale": true } ] }, "layout": { "geo": { "bgcolor": "white", "showland": true, "lakecolor": "white", "landcolor": "white", "showlakes": true, "subunitcolor": "#C8D4E3" }, "font": { "color": "#2a3f5f" }, "polar": { "bgcolor": "white", "radialaxis": { "ticks": "", "gridcolor": "#EBF0F8", "linecolor": "#EBF0F8" }, "angularaxis": { "ticks": "", "gridcolor": "#EBF0F8", "linecolor": "#EBF0F8" } }, "scene": { "xaxis": { "ticks": "", "gridcolor": "#DFE8F3", "gridwidth": 2, "linecolor": "#EBF0F8", "zerolinecolor": "#EBF0F8", "showbackground": true, "backgroundcolor": "white" }, "yaxis": { "ticks": "", "gridcolor": "#DFE8F3", "gridwidth": 2, "linecolor": "#EBF0F8", "zerolinecolor": "#EBF0F8", "showbackground": true, "backgroundcolor": "white" }, "zaxis": { "ticks": "", "gridcolor": "#DFE8F3", "gridwidth": 2, "linecolor": "#EBF0F8", "zerolinecolor": "#EBF0F8", "showbackground": true, "backgroundcolor": "white" } }, "title": { "x": 0.05 }, "xaxis": { "ticks": "", "gridcolor": "#EBF0F8", "linecolor": "#EBF0F8", "automargin": true, "zerolinecolor": "#EBF0F8", "zerolinewidth": 2 }, "yaxis": { "ticks": "", "gridcolor": "#EBF0F8", "linecolor": "#EBF0F8", "automargin": true, "zerolinecolor": "#EBF0F8", "zerolinewidth": 2 }, "ternary": { "aaxis": { "ticks": "", "gridcolor": "#DFE8F3", "linecolor": "#A2B1C6" }, "baxis": { "ticks": "", "gridcolor": "#DFE8F3", "linecolor": "#A2B1C6" }, "caxis": { "ticks": "", "gridcolor": "#DFE8F3", "linecolor": "#A2B1C6" }, "bgcolor": "white" }, "colorway": [ "#636efa", "#EF553B", "#00cc96", "#ab63fa", "#19d3f3", "#e763fa", "#fecb52", "#ffa15a", "#ff6692", "#b6e880" ], "hovermode": "closest", "colorscale": { "diverging": [ [ 0, "#8e0152" ], [ 0.1, "#c51b7d" ], [ 0.2, "#de77ae" ], [ 0.3, "#f1b6da" ], [ 0.4, "#fde0ef" ], [ 0.5, "#f7f7f7" ], [ 0.6, "#e6f5d0" ], [ 0.7, "#b8e186" ], [ 0.8, "#7fbc41" ], [ 0.9, "#4d9221" ], [ 1, "#276419" ] ], "sequential": [ [ 0, "#0508b8" ], [ 0.0893854748603352, "#1910d8" ], [ 0.1787709497206704, "#3c19f0" ], [ 0.2681564245810056, "#6b1cfb" ], [ 0.3575418994413408, "#981cfd" ], [ 0.44692737430167595, "#bf1cfd" ], [ 0.5363128491620112, "#dd2bfd" ], [ 0.6256983240223464, "#f246fe" ], [ 0.7150837988826816, "#fc67fd" ], [ 0.8044692737430168, "#fe88fc" ], [ 0.8938547486033519, "#fea5fd" ], [ 0.9832402234636871, "#febefe" ], [ 1, "#fec3fe" ] ], "sequentialminus": [ [ 0, "#0508b8" ], [ 0.0893854748603352, "#1910d8" ], [ 0.1787709497206704, "#3c19f0" ], [ 0.2681564245810056, "#6b1cfb" ], [ 0.3575418994413408, "#981cfd" ], [ 0.44692737430167595, "#bf1cfd" ], [ 0.5363128491620112, "#dd2bfd" ], [ 0.6256983240223464, "#f246fe" ], [ 0.7150837988826816, "#fc67fd" ], [ 0.8044692737430168, "#fe88fc" ], [ 0.8938547486033519, "#fea5fd" ], [ 0.9832402234636871, "#febefe" ], [ 1, "#fec3fe" ] ] }, "plot_bgcolor": "white", "paper_bgcolor": "white", "shapedefaults": { "line": { "width": 0 }, "opacity": 0.4, "fillcolor": "#506784" }, "annotationdefaults": { "arrowhead": 0, "arrowcolor": "#506784", "arrowwidth": 1 } }, "themeRef": "PLOTLY_WHITE" }, "hovermode": "closest", "hoverlabel": { "font": { "size": 20 } }, "showlegend": true } }, "height": null, "width": null, "user": { "profile_url": "https://chart-studio.plotly.com/~Pedro-estudante", "avatar_url": "https://storage.googleapis.com/plotly-prod-profiles/35.jpg", "background_url": "https://storage.googleapis.com/plotly-prod-profiles/bg-0.jpg", "bio": "", "nickname": "", "website": "", "stream_tokens": null, "feature_set_id": null, "csrf_token": null, "date_joined": "2025-09-07 19:17:57", "mapbox_access_tokens": null, "has_password": null, "username": "Pedro-estudante", "email": null, "is_active": null, "readonly": null, "is_dash_creator": null, "dash_created_count": null, "is_chart_creator": null, "charts_created_count": null } }, { "creation_time": "2025-09-07T19:39:48.458157Z", "comments": { "results": [], "count": 0 }, "parented": true, "embed_url": "https://chart-studio.plotly.com/~Avigupta098/1.embed", "fid": "Avigupta098:1", "filename": "123", "filetype": "plot", "img_url": "https://storage.googleapis.com/plotly-prod-images/Avigupta098/1/9_OM0YNX5Y2133BJ1VLLKFFQRZYS4H6B.png", "image_urls": { "default": "https://storage.googleapis.com/plotly-prod-images/Avigupta098/1/2_LCHNTLDO3ZLG8LD4QL5UOH9YHS2RQ5.png", "block-thumb": "https://storage.googleapis.com/plotly-prod-images/Avigupta098/1/8_C7N4O3TIYFX53UPF9Y9UK4CTH46YTP.png", "list-thumb": "https://storage.googleapis.com/plotly-prod-images/Avigupta098/1/9_OM0YNX5Y2133BJ1VLLKFFQRZYS4H6B.png" }, "api_urls": { "files": "https://api.plotly.com/v2/files/Avigupta098:1", "plots": "https://api.plotly.com/v2/plots/Avigupta098:1", "parent": "https://api.plotly.com/v2/folders/home?user=Avigupta098" }, "owner": "Avigupta098", "parent": -1, "preview": "", "referencers": [], "references": [], "title": "", "views": 2, "web_url": "https://chart-studio.plotly.com/~Avigupta098/1/", "world_readable": true, "date_modified": "2025-09-07T19:57:50.939Z", "stars": { "results": [], "count": 0 }, "collaborators": { "results": [], "count": 0 }, "subfolder_count": null, "refresh_interval": null, "organize_view_url": "https://chart-studio.plotly.com/~Avigupta098/1/", "current_user_permission": "read", "is_theme": null, "is_template": false, "autosize": true, "caption": "", "figure": { "data": [ { "meta": { "columnNames": { "x": "SOC (%)", "y": "Battery Pack (V)" } }, "mode": "lines", "type": "scatter", "xsrc": "Avigupta098:0:b78562", "ysrc": "Avigupta098:0:ae1778" } ], "frames": [], "layout": { "title": { "text": "SOC (%) vs Battery Pack (V)" }, "xaxis": { "type": "linear", "range": [ 0, 51.4 ], "title": { "text": "SOC (%)" }, "autorange": true }, "yaxis": { "type": "linear", "range": [ 614.8055555555555, 678.6944444444445 ], "title": { "text": "Battery Pack Voltage (V)" }, "autorange": true }, "autosize": true, "template": { "data": { "bar": [ { "type": "bar", "marker": { "colorbar": { "ticks": "", "outlinewidth": 0 } } } ], "table": [ { "type": "table", "cells": { "fill": { "color": "#EBF0F8" }, "line": { "color": "white" } }, "header": { "fill": { "color": "#C8D4E3" }, "line": { "color": "white" } } } ], "carpet": [ { "type": "carpet", "aaxis": { "gridcolor": "#C8D4E3", "linecolor": "#C8D4E3", "endlinecolor": "#2a3f5f", "minorgridcolor": "#C8D4E3", "startlinecolor": "#2a3f5f" }, "baxis": { "gridcolor": "#C8D4E3", "linecolor": "#C8D4E3", "endlinecolor": "#2a3f5f", "minorgridcolor": "#C8D4E3", "startlinecolor": "#2a3f5f" } } ], "mesh3d": [ { "type": "mesh3d", "colorbar": { "ticks": "", "outlinewidth": 0 } } ], "contour": [ { "type": "contour", "colorbar": { "ticks": "", "outlinewidth": 0 }, "autocolorscale": true } ], "heatmap": [ { "type": "heatmap", "colorbar": { "ticks": "", "outlinewidth": 0 }, "autocolorscale": true } ], "scatter": [ { "type": "scatter", "marker": { "colorbar": { "ticks": "", "outlinewidth": 0 } } } ], "surface": [ { "type": "surface", "colorbar": { "ticks": "", "outlinewidth": 0 } } ], "heatmapgl": [ { "type": "heatmapgl", "colorbar": { "ticks": "", "outlinewidth": 0 } } ], "histogram": [ { "type": "histogram", "marker": { "colorbar": { "ticks": "", "outlinewidth": 0 } } } ], "parcoords": [ { "line": { "colorbar": { "ticks": "", "outlinewidth": 0 } }, "type": "parcoords" } ], "scatter3d": [ { "type": "scatter3d", "marker": { "colorbar": { "ticks": "", "outlinewidth": 0 } } } ], "scattergl": [ { "type": "scattergl", "marker": { "colorbar": { "ticks": "", "outlinewidth": 0 } } } ], "choropleth": [ { "type": "choropleth", "colorbar": { "ticks": "", "outlinewidth": 0 } } ], "scattergeo": [ { "type": "scattergeo", "marker": { "colorbar": { "ticks": "", "outlinewidth": 0 } } } ], "histogram2d": [ { "type": "histogram2d", "colorbar": { "ticks": "", "outlinewidth": 0 }, "autocolorscale": true } ], "scatterpolar": [ { "type": "scatterpolar", "marker": { "colorbar": { "ticks": "", "outlinewidth": 0 } } } ], "contourcarpet": [ { "type": "contourcarpet", "colorbar": { "ticks": "", "outlinewidth": 0 } } ], "scattercarpet": [ { "type": "scattercarpet", "marker": { "colorbar": { "ticks": "", "outlinewidth": 0 } } } ], "scattermapbox": [ { "type": "scattermapbox", "marker": { "colorbar": { "ticks": "", "outlinewidth": 0 } } } ], "scatterpolargl": [ { "type": "scatterpolargl", "marker": { "colorbar": { "ticks": "", "outlinewidth": 0 } } } ], "scatterternary": [ { "type": "scatterternary", "marker": { "colorbar": { "ticks": "", "outlinewidth": 0 } } } ], "histogram2dcontour": [ { "type": "histogram2dcontour", "colorbar": { "ticks": "", "outlinewidth": 0 }, "autocolorscale": true } ] }, "layout": { "geo": { "bgcolor": "white", "showland": true, "lakecolor": "white", "landcolor": "white", "showlakes": true, "subunitcolor": "#C8D4E3" }, "font": { "color": "#2a3f5f" }, "polar": { "bgcolor": "white", "radialaxis": { "ticks": "", "gridcolor": "#EBF0F8", "linecolor": "#EBF0F8" }, "angularaxis": { "ticks": "", "gridcolor": "#EBF0F8", "linecolor": "#EBF0F8" } }, "scene": { "xaxis": { "ticks": "", "gridcolor": "#DFE8F3", "gridwidth": 2, "linecolor": "#EBF0F8", "zerolinecolor": "#EBF0F8", "showbackground": true, "backgroundcolor": "white" }, "yaxis": { "ticks": "", "gridcolor": "#DFE8F3", "gridwidth": 2, "linecolor": "#EBF0F8", "zerolinecolor": "#EBF0F8", "showbackground": true, "backgroundcolor": "white" }, "zaxis": { "ticks": "", "gridcolor": "#DFE8F3", "gridwidth": 2, "linecolor": "#EBF0F8", "zerolinecolor": "#EBF0F8", "showbackground": true, "backgroundcolor": "white" } }, "title": { "x": 0.05 }, "xaxis": { "ticks": "", "gridcolor": "#EBF0F8", "linecolor": "#EBF0F8", "automargin": true, "zerolinecolor": "#EBF0F8", "zerolinewidth": 2 }, "yaxis": { "ticks": "", "gridcolor": "#EBF0F8", "linecolor": "#EBF0F8", "automargin": true, "zerolinecolor": "#EBF0F8", "zerolinewidth": 2 }, "ternary": { "aaxis": { "ticks": "", "gridcolor": "#DFE8F3", "linecolor": "#A2B1C6" }, "baxis": { "ticks": "", "gridcolor": "#DFE8F3", "linecolor": "#A2B1C6" }, "caxis": { "ticks": "", "gridcolor": "#DFE8F3", "linecolor": "#A2B1C6" }, "bgcolor": "white" }, "colorway": [ "#636efa", "#EF553B", "#00cc96", "#ab63fa", "#19d3f3", "#e763fa", "#fecb52", "#ffa15a", "#ff6692", "#b6e880" ], "hovermode": "closest", "colorscale": { "diverging": [ [ 0, "#8e0152" ], [ 0.1, "#c51b7d" ], [ 0.2, "#de77ae" ], [ 0.3, "#f1b6da" ], [ 0.4, "#fde0ef" ], [ 0.5, "#f7f7f7" ], [ 0.6, "#e6f5d0" ], [ 0.7, "#b8e186" ], [ 0.8, "#7fbc41" ], [ 0.9, "#4d9221" ], [ 1, "#276419" ] ], "sequential": [ [ 0, "#0508b8" ], [ 0.0893854748603352, "#1910d8" ], [ 0.1787709497206704, "#3c19f0" ], [ 0.2681564245810056, "#6b1cfb" ], [ 0.3575418994413408, "#981cfd" ], [ 0.44692737430167595, "#bf1cfd" ], [ 0.5363128491620112, "#dd2bfd" ], [ 0.6256983240223464, "#f246fe" ], [ 0.7150837988826816, "#fc67fd" ], [ 0.8044692737430168, "#fe88fc" ], [ 0.8938547486033519, "#fea5fd" ], [ 0.9832402234636871, "#febefe" ], [ 1, "#fec3fe" ] ], "sequentialminus": [ [ 0, "#0508b8" ], [ 0.0893854748603352, "#1910d8" ], [ 0.1787709497206704, "#3c19f0" ], [ 0.2681564245810056, "#6b1cfb" ], [ 0.3575418994413408, "#981cfd" ], [ 0.44692737430167595, "#bf1cfd" ], [ 0.5363128491620112, "#dd2bfd" ], [ 0.6256983240223464, "#f246fe" ], [ 0.7150837988826816, "#fc67fd" ], [ 0.8044692737430168, "#fe88fc" ], [ 0.8938547486033519, "#fea5fd" ], [ 0.9832402234636871, "#febefe" ], [ 1, "#fec3fe" ] ] }, "plot_bgcolor": "white", "paper_bgcolor": "white", "shapedefaults": { "line": { "width": 0 }, "opacity": 0.4, "fillcolor": "#506784" }, "annotationdefaults": { "arrowhead": 0, "arrowcolor": "#506784", "arrowwidth": 1 } }, "themeRef": "PLOTLY_WHITE" } } }, "height": null, "width": null, "user": { "profile_url": "https://chart-studio.plotly.com/~Avigupta098", "avatar_url": "https://storage.googleapis.com/plotly-prod-profiles/32.jpg", "background_url": "https://storage.googleapis.com/plotly-prod-profiles/bg-0.jpg", "bio": "", "nickname": "", "website": "", "stream_tokens": null, "feature_set_id": null, "csrf_token": null, "date_joined": "2025-09-07 19:36:01", "mapbox_access_tokens": null, "has_password": null, "username": "Avigupta098", "email": null, "is_active": null, "readonly": null, "is_dash_creator": null, "dash_created_count": null, "is_chart_creator": null, "charts_created_count": null } }, { "creation_time": "2025-09-07T17:34:58.659882Z", "comments": { "results": [], "count": 0 }, "parented": true, "embed_url": "https://chart-studio.plotly.com/~anssalk/1.embed", "fid": "anssalk:1", "filename": "Geo", "filetype": "plot", "img_url": "https://storage.googleapis.com/plotly-prod-images/anssalk/1/9_2HEMPARNFZ0JQDXFT6U59YOSXYI8J1.png", "image_urls": { "default": "https://storage.googleapis.com/plotly-prod-images/anssalk/1/2_WAE67CSLQB35OMR94OS047L6RN4BXH.png", "block-thumb": "https://api.plotly.com/v2/files/anssalk:1/image?image_name=block-thumb", "list-thumb": "https://storage.googleapis.com/plotly-prod-images/anssalk/1/9_2HEMPARNFZ0JQDXFT6U59YOSXYI8J1.png" }, "api_urls": { "files": "https://api.plotly.com/v2/files/anssalk:1", "plots": "https://api.plotly.com/v2/plots/anssalk:1", "parent": "https://api.plotly.com/v2/folders/home?user=anssalk" }, "owner": "anssalk", "parent": -1, "preview": "", "referencers": [], "references": [], "title": "", "views": 2, "web_url": "https://chart-studio.plotly.com/~anssalk/1/", "world_readable": true, "date_modified": "2025-09-09T14:01:22.790Z", "stars": { "results": [], "count": 0 }, "collaborators": { "results": [], "count": 0 }, "subfolder_count": null, "refresh_interval": null, "organize_view_url": "https://chart-studio.plotly.com/~anssalk/1/", "current_user_permission": "read", "is_theme": null, "is_template": false, "autosize": true, "caption": "", "figure": { "data": [ { "asrc": "anssalk:2:64f805", "bsrc": "anssalk:2:ad72ba", "csrc": "anssalk:2:cbc67c", "meta": { "columnNames": { "a": "B", "b": "C", "c": "D" } }, "mode": "markers", "type": "scatterternary" } ], "frames": [], "layout": { "title": { "text": "Click to enter Plot title" }, "xaxis": { "range": [ -1, 6 ], "autorange": true }, "yaxis": { "range": [ -1, 4 ], "autorange": true }, "ternary": {}, "autosize": true, "template": { "data": { "bar": [ { "type": "bar", "marker": { "colorbar": { "ticks": "", "outlinewidth": 0 } } } ], "table": [ { "type": "table", "cells": { "fill": { "color": "#EBF0F8" }, "line": { "color": "white" } }, "header": { "fill": { "color": "#C8D4E3" }, "line": { "color": "white" } } } ], "carpet": [ { "type": "carpet", "aaxis": { "gridcolor": "#C8D4E3", "linecolor": "#C8D4E3", "endlinecolor": "#2a3f5f", "minorgridcolor": "#C8D4E3", "startlinecolor": "#2a3f5f" }, "baxis": { "gridcolor": "#C8D4E3", "linecolor": "#C8D4E3", "endlinecolor": "#2a3f5f", "minorgridcolor": "#C8D4E3", "startlinecolor": "#2a3f5f" } } ], "mesh3d": [ { "type": "mesh3d", "colorbar": { "ticks": "", "outlinewidth": 0 } } ], "contour": [ { "type": "contour", "colorbar": { "ticks": "", "outlinewidth": 0 }, "autocolorscale": true } ], "heatmap": [ { "type": "heatmap", "colorbar": { "ticks": "", "outlinewidth": 0 }, "autocolorscale": true } ], "scatter": [ { "type": "scatter", "marker": { "colorbar": { "ticks": "", "outlinewidth": 0 } } } ], "surface": [ { "type": "surface", "colorbar": { "ticks": "", "outlinewidth": 0 } } ], "heatmapgl": [ { "type": "heatmapgl", "colorbar": { "ticks": "", "outlinewidth": 0 } } ], "histogram": [ { "type": "histogram", "marker": { "colorbar": { "ticks": "", "outlinewidth": 0 } } } ], "parcoords": [ { "line": { "colorbar": { "ticks": "", "outlinewidth": 0 } }, "type": "parcoords" } ], "scatter3d": [ { "type": "scatter3d", "marker": { "colorbar": { "ticks": "", "outlinewidth": 0 } } } ], "scattergl": [ { "type": "scattergl", "marker": { "colorbar": { "ticks": "", "outlinewidth": 0 } } } ], "choropleth": [ { "type": "choropleth", "colorbar": { "ticks": "", "outlinewidth": 0 } } ], "scattergeo": [ { "type": "scattergeo", "marker": { "colorbar": { "ticks": "", "outlinewidth": 0 } } } ], "histogram2d": [ { "type": "histogram2d", "colorbar": { "ticks": "", "outlinewidth": 0 }, "autocolorscale": true } ], "scatterpolar": [ { "type": "scatterpolar", "marker": { "colorbar": { "ticks": "", "outlinewidth": 0 } } } ], "contourcarpet": [ { "type": "contourcarpet", "colorbar": { "ticks": "", "outlinewidth": 0 } } ], "scattercarpet": [ { "type": "scattercarpet", "marker": { "colorbar": { "ticks": "", "outlinewidth": 0 } } } ], "scattermapbox": [ { "type": "scattermapbox", "marker": { "colorbar": { "ticks": "", "outlinewidth": 0 } } } ], "scatterpolargl": [ { "type": "scatterpolargl", "marker": { "colorbar": { "ticks": "", "outlinewidth": 0 } } } ], "scatterternary": [ { "type": "scatterternary", "marker": { "colorbar": { "ticks": "", "outlinewidth": 0 } } } ], "histogram2dcontour": [ { "type": "histogram2dcontour", "colorbar": { "ticks": "", "outlinewidth": 0 }, "autocolorscale": true } ] }, "layout": { "geo": { "bgcolor": "white", "showland": true, "lakecolor": "white", "landcolor": "white", "showlakes": true, "subunitcolor": "#C8D4E3" }, "font": { "color": "#2a3f5f" }, "polar": { "bgcolor": "white", "radialaxis": { "ticks": "", "gridcolor": "#EBF0F8", "linecolor": "#EBF0F8" }, "angularaxis": { "ticks": "", "gridcolor": "#EBF0F8", "linecolor": "#EBF0F8" } }, "scene": { "xaxis": { "ticks": "", "gridcolor": "#DFE8F3", "gridwidth": 2, "linecolor": "#EBF0F8", "zerolinecolor": "#EBF0F8", "showbackground": true, "backgroundcolor": "white" }, "yaxis": { "ticks": "", "gridcolor": "#DFE8F3", "gridwidth": 2, "linecolor": "#EBF0F8", "zerolinecolor": "#EBF0F8", "showbackground": true, "backgroundcolor": "white" }, "zaxis": { "ticks": "", "gridcolor": "#DFE8F3", "gridwidth": 2, "linecolor": "#EBF0F8", "zerolinecolor": "#EBF0F8", "showbackground": true, "backgroundcolor": "white" } }, "title": { "x": 0.05 }, "xaxis": { "ticks": "", "gridcolor": "#EBF0F8", "linecolor": "#EBF0F8", "automargin": true, "zerolinecolor": "#EBF0F8", "zerolinewidth": 2 }, "yaxis": { "ticks": "", "gridcolor": "#EBF0F8", "linecolor": "#EBF0F8", "automargin": true, "zerolinecolor": "#EBF0F8", "zerolinewidth": 2 }, "ternary": { "aaxis": { "ticks": "", "gridcolor": "#DFE8F3", "linecolor": "#A2B1C6" }, "baxis": { "ticks": "", "gridcolor": "#DFE8F3", "linecolor": "#A2B1C6" }, "caxis": { "ticks": "", "gridcolor": "#DFE8F3", "linecolor": "#A2B1C6" }, "bgcolor": "white" }, "colorway": [ "#636efa", "#EF553B", "#00cc96", "#ab63fa", "#19d3f3", "#e763fa", "#fecb52", "#ffa15a", "#ff6692", "#b6e880" ], "hovermode": "closest", "colorscale": { "diverging": [ [ 0, "#8e0152" ], [ 0.1, "#c51b7d" ], [ 0.2, "#de77ae" ], [ 0.3, "#f1b6da" ], [ 0.4, "#fde0ef" ], [ 0.5, "#f7f7f7" ], [ 0.6, "#e6f5d0" ], [ 0.7, "#b8e186" ], [ 0.8, "#7fbc41" ], [ 0.9, "#4d9221" ], [ 1, "#276419" ] ], "sequential": [ [ 0, "#0508b8" ], [ 0.0893854748603352, "#1910d8" ], [ 0.1787709497206704, "#3c19f0" ], [ 0.2681564245810056, "#6b1cfb" ], [ 0.3575418994413408, "#981cfd" ], [ 0.44692737430167595, "#bf1cfd" ], [ 0.5363128491620112, "#dd2bfd" ], [ 0.6256983240223464, "#f246fe" ], [ 0.7150837988826816, "#fc67fd" ], [ 0.8044692737430168, "#fe88fc" ], [ 0.8938547486033519, "#fea5fd" ], [ 0.9832402234636871, "#febefe" ], [ 1, "#fec3fe" ] ], "sequentialminus": [ [ 0, "#0508b8" ], [ 0.0893854748603352, "#1910d8" ], [ 0.1787709497206704, "#3c19f0" ], [ 0.2681564245810056, "#6b1cfb" ], [ 0.3575418994413408, "#981cfd" ], [ 0.44692737430167595, "#bf1cfd" ], [ 0.5363128491620112, "#dd2bfd" ], [ 0.6256983240223464, "#f246fe" ], [ 0.7150837988826816, "#fc67fd" ], [ 0.8044692737430168, "#fe88fc" ], [ 0.8938547486033519, "#fea5fd" ], [ 0.9832402234636871, "#febefe" ], [ 1, "#fec3fe" ] ] }, "plot_bgcolor": "white", "paper_bgcolor": "white", "shapedefaults": { "line": { "width": 0 }, "opacity": 0.4, "fillcolor": "#506784" }, "annotationdefaults": { "arrowhead": 0, "arrowcolor": "#506784", "arrowwidth": 1 } }, "themeRef": "PLOTLY_WHITE" } } }, "height": null, "width": null, "user": { "profile_url": "https://chart-studio.plotly.com/~anssalk", "avatar_url": "https://storage.googleapis.com/plotly-prod-profiles/36.jpg", "background_url": "https://storage.googleapis.com/plotly-prod-profiles/bg-10.jpg", "bio": "", "nickname": "", "website": "", "stream_tokens": null, "feature_set_id": null, "csrf_token": null, "date_joined": "2025-09-07 17:26:53", "mapbox_access_tokens": null, "has_password": null, "username": "anssalk", "email": null, "is_active": null, "readonly": null, "is_dash_creator": null, "dash_created_count": null, "is_chart_creator": null, "charts_created_count": null } } ] }
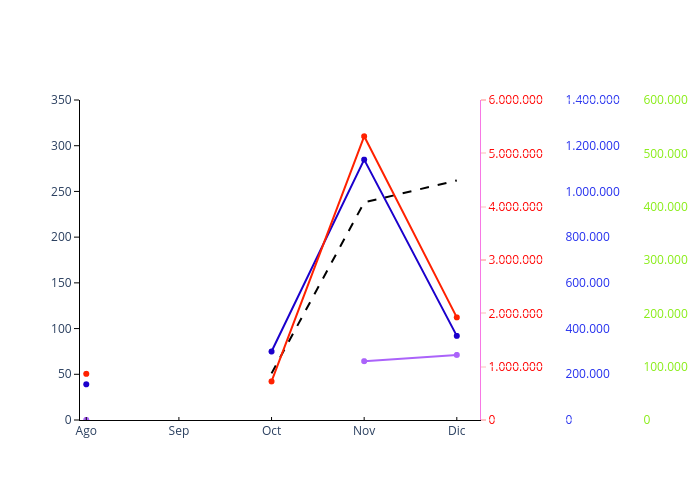