Plots List
Plots
This endpoint handles manipulation of Plotly plot files.
Reference
Authorization
Any user with or without a Plotly account may view public plots. For private plots, see authentication.
Actions
list
Listing all public plots can be done via a GET request to this endpoint.
By default, plots will be listed in order of date created. The order_by
query parameter is accepted at this endpoint. Currently, only ordering by
views is supported. It is possible to filter the plots by quality
with min_quality or max_quality as query parameter.
Example:
// GET https://api.plotly.com/v2/plots/ ---> 200

// GET https://api.plotly.com/v2/plots/?order_by=-views ---> 200

// GET https://api.plotly.com/v2/plots/?min_quality=5 ---> 200

// GET https://api.plotly.com/v2/plots/?max_quality=5 ---> 200
feed
Listing all handpicked feed plots can be done via a GET request to this endpoint. By default, plots will be listed in a random order.
Example:
// GET https://api.plotly.com/v2/plots/feed ---> 200
create
You can create new plot resources here. The only required field is 'figure'. Currently, the figure is restricted to only contain references to grid data. That is, this will fail if raw data arrays are passed in. To create and manipulate underlying grids for plots, see the grids endpoint.
Example:
// This fails because a figure field is required.
// POST https://api.plotly.com/v2/plots ---> 400 Bad Request
{}

// This fails because the figure has raw data
//POST https://api.plotly.com/v2/plots ---> 400 Bad Request
{
    "figure": {"data": [{"y": ['this', 'is', 'raw', 'data']}]}
}

// This succeeds because the figure has src keys, not raw data.
//POST https://api.plotly.com/v2/plots ---> 200 OK
{
    "figure": {"data": [{"ysrc": "sven:88:u8nd62"}]}
}
When creating a grid, you can optionally specify a source_fid to specify where a plot has come from:
- source_fid: the fid of a plot that was copied (and presumably edited) to produce this one
detail
There is a lot of meta information stored about plot files including filename, title, share_url, and content_url to name a few.
This information can only be reached with a GET to this endpoint.
Example:
// GET https://api.plotly.com/v2/plots/iheartgraphs:90
content
The contents of a plot can be downloaded via the content resource. The plot
content contains referenced grid/column data by default. If you wish to
return the raw grid/column data, the inline_data=true query must be included
in the request url. The Content-Type header will be appropriately set for the
response body.
Alternatively, you can set ?map_data=unreadable to append a mapping of
sources to data that belongs to grids which are unreadable for the
requestor. This is useful when you have read access to another users plot,
but that plot contains grid references which you don't have access to.
Examples:
// Returns referenced grid/column data
// GET https://api.plotly.com/v2/plots/iheartgraphs:90/content ---> 200 OK

// Returns full grid/column data
// GET https://api.plotly.com/v2/plots/iheartgraphs:90/content?inline_data=true ---> 200 OK

// Returns full grid/column data when requestor doesn't have permission
// to read the referenced grid.
// GET https://api.plotly.com/v2/plots/iheartgraphs:90/content?map_data=unreadable ---> 200 OK
GET /v2/plots/?cursor=cD0yMDI1LTA5LTA5KzEwJTNBNDklM0ExOC42OTExODclMkIwMCUzQTAw&format=api
{ "next": "https://api.plotly.com/v2/plots/?cursor=cD0yMDI1LTA5LTA5KzA4JTNBNTklM0ExNi43MzU3MjElMkIwMCUzQTAw&format=api", "previous": "https://api.plotly.com/v2/plots/?cursor=cj0xJnA9MjAyNS0wOS0wOSsxMCUzQTI3JTNBMzYuNTI4MzI2JTJCMDAlM0EwMA%3D%3D&format=api", "results": [ { "creation_time": "2025-09-09T10:27:36.528326Z", "comments": { "results": [], "count": 0 }, "parented": true, "embed_url": "https://chart-studio.plotly.com/~plotlyaravindgn1/35.embed", "fid": "plotlyaravindgn1:35", "filename": "Scratch assay_area plot_for_main figure_1009202", "filetype": "plot", "img_url": "https://storage.googleapis.com/plotly-prod-images/plotlyaravindgn1/35/9_9NP474787YRHYNSUX7TAMTMSIXRPIH.png", "image_urls": { "default": "https://api.plotly.com/v2/files/plotlyaravindgn1:35/image?image_name=default", "block-thumb": "https://storage.googleapis.com/plotly-prod-images/plotlyaravindgn1/35/8_CR5LZF09VSTDJXUXOAVGW6OWSL6TJU.png", "list-thumb": "https://storage.googleapis.com/plotly-prod-images/plotlyaravindgn1/35/9_9NP474787YRHYNSUX7TAMTMSIXRPIH.png" }, "api_urls": { "files": "https://api.plotly.com/v2/files/plotlyaravindgn1:35", "plots": "https://api.plotly.com/v2/plots/plotlyaravindgn1:35", "parent": "https://api.plotly.com/v2/folders/home?user=plotlyaravindgn1" }, "owner": "plotlyaravindgn1", "parent": -1, "preview": "", "referencers": [], "references": [], "title": "", "views": 0, "web_url": "https://chart-studio.plotly.com/~plotlyaravindgn1/35/", "world_readable": true, "date_modified": "2025-09-10T05:31:58.675Z", "stars": { "results": [], "count": 0 }, "collaborators": { "results": [], "count": 0 }, "subfolder_count": null, "refresh_interval": null, "organize_view_url": "https://chart-studio.plotly.com/~plotlyaravindgn1/35/", "current_user_permission": "read", "is_theme": null, "is_template": false, "autosize": true, "caption": "", "figure": { "data": [ { "fill": "tonexty", "line": { "color": "rgb(23, 84, 220)" }, "meta": { "columnNames": { "x": "A", "y": "Control", "error_y": { "array": "Control SEM", "arrayminus": "Control SEM" } } }, "mode": "markers+lines", "name": "Control", "type": "scatter", "xsrc": "plotlyaravindgn1:33:c384b7", "ysrc": "plotlyaravindgn1:34:6380a5", "error_y": { "meta": { "columnNames": { "array": "Control SEM", "arrayminus": "Control SEM" } }, "type": "data", "color": "rgb(16, 16, 206)", "width": 3, "visible": true, "arraysrc": "plotlyaravindgn1:32:a8946f", "symmetric": false, "arrayminussrc": "plotlyaravindgn1:32:a8946f" }, "fillcolor": "rgba(113, 141, 200, 0.5)", "stackgroup": 1, "orientation": "h" }, { "fill": "none", "line": { "color": "rgb(177, 119, 14)" }, "meta": { "columnNames": { "x": "A", "y": "B", "error_y": { "array": "EV SEM", "arrayminus": "EV SEM" } } }, "mode": "markers+lines", "name": "Empty vector", "type": "scatter", "xsrc": "plotlyaravindgn1:33:c384b7", "ysrc": "plotlyaravindgn1:34:43cab8", "error_y": { "meta": { "columnNames": { "array": "EV SEM", "arrayminus": "EV SEM" } }, "type": "data", "color": "rgb(161, 113, 0)", "width": 3, "visible": true, "arraysrc": "plotlyaravindgn1:32:fbef5c", "symmetric": false, "thickness": 2, "arrayminussrc": "plotlyaravindgn1:32:fbef5c" }, "fillcolor": "rgba(221, 151, 26, 0.5)", "stackgroup": 1 }, { "fill": "none", "line": { "color": "rgb(24, 179, 54)" }, "meta": { "columnNames": { "x": "A", "y": "C", "error_y": { "array": "sh1 SEM", "arrayminus": "sh1 SEM" } } }, "mode": "markers+lines", "name": "sh1_IGF2BP3", "type": "scatter", "xsrc": "plotlyaravindgn1:33:c384b7", "ysrc": "plotlyaravindgn1:34:c1ce09", "marker": { "color": "rgb(25, 206, 59)" }, "error_y": { "meta": { "columnNames": { "array": "sh1 SEM", "arrayminus": "sh1 SEM" } }, "type": "data", "color": "rgb(30, 203, 30)", "width": 3, "visible": true, "arraysrc": "plotlyaravindgn1:32:181b08", "symmetric": false, "arrayminussrc": "plotlyaravindgn1:32:181b08" }, "fillcolor": "rgba(37, 199, 66, 0.5)", "stackgroup": 1 }, { "fill": "none", "line": { "color": "rgb(184, 97, 233)" }, "meta": { "columnNames": { "x": "A", "y": "D", "error_y": { "array": "sh2_SEM", "arrayminus": "sh2_SEM" } } }, "mode": "markers+lines", "name": "sh2_IGF2BP3", "type": "scatter", "xsrc": "plotlyaravindgn1:33:c384b7", "ysrc": "plotlyaravindgn1:34:e6a279", "marker": { "line": { "color": "rgb(167, 73, 222)" }, "color": "rgb(195, 84, 255)" }, "error_y": { "meta": { "columnNames": { "array": "sh2_SEM", "arrayminus": "sh2_SEM" } }, "type": "data", "color": "rgb(124, 116, 133)", "width": 3, "visible": true, "arraysrc": "plotlyaravindgn1:32:1dc7ef", "symmetric": false, "arrayminussrc": "plotlyaravindgn1:32:1dc7ef" }, "fillcolor": "rgba(118, 102, 122, 0.5)", "stackgroup": 1 }, { "fill": "none", "meta": { "columnNames": { "x": "A", "y": "E", "error_y": { "array": "S SEM", "arrayminus": "S SEM" } } }, "mode": "markers+lines", "name": "STM2457", "type": "scatter", "xsrc": "plotlyaravindgn1:33:c384b7", "ysrc": "plotlyaravindgn1:34:b8625b", "error_y": { "meta": { "columnNames": { "array": "S SEM", "arrayminus": "S SEM" } }, "type": "data", "visible": true, "arraysrc": "plotlyaravindgn1:32:2555e9", "symmetric": false, "arrayminussrc": "plotlyaravindgn1:32:2555e9" }, "stackgroup": 1 }, { "fill": "none", "line": { "dash": "solid", "color": "rgb(240, 8, 110)" }, "meta": { "columnNames": { "x": "A", "y": "Zoledronic acid", "error_y": { "array": "Z SEM", "arrayminus": "Z SEM" } } }, "mode": "markers+lines", "name": "Zoledronic acid", "type": "scatter", "xsrc": "plotlyaravindgn1:33:c384b7", "ysrc": "plotlyaravindgn1:34:9889b2", "error_y": { "meta": { "columnNames": { "array": "Z SEM", "arrayminus": "Z SEM" } }, "type": "data", "color": "rgb(220, 16, 129)", "width": 3, "visible": true, "arraysrc": "plotlyaravindgn1:32:d8d9d6", "symmetric": false, "arrayminussrc": "plotlyaravindgn1:32:d8d9d6" }, "visible": true, "fillcolor": "rgba(217, 80, 125, 0.5)", "stackgroup": 1 }, { "fill": "none", "line": { "color": "rgb(58, 66, 64)" }, "meta": { "columnNames": { "x": "A", "y": "Alendronate", "error_y": { "array": "A SEM", "arrayminus": "A SEM" } } }, "mode": "markers+lines", "name": "Alendronate", "type": "scatter", "xsrc": "plotlyaravindgn1:33:c384b7", "ysrc": "plotlyaravindgn1:34:5c043b", "error_y": { "meta": { "columnNames": { "array": "A SEM", "arrayminus": "A SEM" } }, "type": "data", "color": "rgb(40, 44, 44)", "width": 3, "visible": true, "arraysrc": "plotlyaravindgn1:32:6a5b9c", "symmetric": false, "arrayminussrc": "plotlyaravindgn1:32:6a5b9c" }, "fillcolor": "rgba(38, 205, 178, 0.5)", "stackgroup": 1 }, { "fill": "none", "line": { "color": "rgb(235, 223, 24)" }, "meta": { "columnNames": { "x": "A", "y": "Lovastatin", "error_y": { "array": "L SEM", "arrayminus": "L SEM" } } }, "mode": "markers+lines", "name": "Lovastatin", "type": "scatter", "xsrc": "plotlyaravindgn1:33:c384b7", "ysrc": "plotlyaravindgn1:34:75ffee", "error_y": { "meta": { "columnNames": { "array": "L SEM", "arrayminus": "L SEM" } }, "type": "data", "color": "rgb(187, 187, 24)", "width": 3, "visible": true, "arraysrc": "plotlyaravindgn1:32:1e6583", "symmetric": false, "arrayminussrc": "plotlyaravindgn1:32:1e6583" }, "fillcolor": "rgba(227, 224, 75, 0.5)", "stackgroup": 1 } ], "frames": [], "layout": { "xaxis": { "type": "category", "range": [ -0.35639180962921985, 6.35639180962922 ], "nticks": 0, "tickson": "labels", "showline": false, "tickmode": "auto", "zeroline": true, "autorange": true, "gridcolor": "rgb(228, 223, 223)", "gridwidth": 0, "linecolor": "rgb(58, 59, 60)", "linewidth": 0, "zerolinewidth": 1 }, "yaxis": { "type": "linear", "range": [ 0, 106.10248777376142 ], "ticks": "", "nticks": 0, "tickson": "labels", "showgrid": true, "showline": true, "tickmode": "auto", "autorange": true, "gridcolor": "rgb(228, 223, 223)", "gridwidth": 0, "linewidth": 0, "zerolinecolor": "rgb(225, 226, 229)", "zerolinewidth": 0 }, "legend": { "x": 1.0133609958506222, "y": 0.8216780045351472, "font": { "family": "Arial" }, "valign": "bottom", "borderwidth": 0 }, "autosize": true, "template": { "data": { "bar": [ { "type": "bar", "marker": { "colorbar": { "ticks": "", "outlinewidth": 0 } } } ], "table": [ { "type": "table", "cells": { "fill": { "color": "#EBF0F8" }, "line": { "color": "white" } }, "header": { "fill": { "color": "#C8D4E3" }, "line": { "color": "white" } } } ], "carpet": [ { "type": "carpet", "aaxis": { "gridcolor": "#C8D4E3", "linecolor": "#C8D4E3", "endlinecolor": "#2a3f5f", "minorgridcolor": "#C8D4E3", "startlinecolor": "#2a3f5f" }, "baxis": { "gridcolor": "#C8D4E3", "linecolor": "#C8D4E3", "endlinecolor": "#2a3f5f", "minorgridcolor": "#C8D4E3", "startlinecolor": "#2a3f5f" } } ], "mesh3d": [ { "type": "mesh3d", "colorbar": { "ticks": "", "outlinewidth": 0 } } ], "contour": [ { "type": "contour", "colorbar": { "ticks": "", "outlinewidth": 0 }, "autocolorscale": true } ], "heatmap": [ { "type": "heatmap", "colorbar": { "ticks": "", "outlinewidth": 0 }, "autocolorscale": true } ], "scatter": [ { "type": "scatter", "marker": { "colorbar": { "ticks": "", "outlinewidth": 0 } } } ], "surface": [ { "type": "surface", "colorbar": { "ticks": "", "outlinewidth": 0 } } ], "heatmapgl": [ { "type": "heatmapgl", "colorbar": { "ticks": "", "outlinewidth": 0 } } ], "histogram": [ { "type": "histogram", "marker": { "colorbar": { "ticks": "", "outlinewidth": 0 } } } ], "parcoords": [ { "line": { "colorbar": { "ticks": "", "outlinewidth": 0 } }, "type": "parcoords" } ], "scatter3d": [ { "type": "scatter3d", "marker": { "colorbar": { "ticks": "", "outlinewidth": 0 } } } ], "scattergl": [ { "type": "scattergl", "marker": { "colorbar": { "ticks": "", "outlinewidth": 0 } } } ], "choropleth": [ { "type": "choropleth", "colorbar": { "ticks": "", "outlinewidth": 0 } } ], "scattergeo": [ { "type": "scattergeo", "marker": { "colorbar": { "ticks": "", "outlinewidth": 0 } } } ], "histogram2d": [ { "type": "histogram2d", "colorbar": { "ticks": "", "outlinewidth": 0 }, "autocolorscale": true } ], "scatterpolar": [ { "type": "scatterpolar", "marker": { "colorbar": { "ticks": "", "outlinewidth": 0 } } } ], "contourcarpet": [ { "type": "contourcarpet", "colorbar": { "ticks": "", "outlinewidth": 0 } } ], "scattercarpet": [ { "type": "scattercarpet", "marker": { "colorbar": { "ticks": "", "outlinewidth": 0 } } } ], "scattermapbox": [ { "type": "scattermapbox", "marker": { "colorbar": { "ticks": "", "outlinewidth": 0 } } } ], "scatterpolargl": [ { "type": "scatterpolargl", "marker": { "colorbar": { "ticks": "", "outlinewidth": 0 } } } ], "scatterternary": [ { "type": "scatterternary", "marker": { "colorbar": { "ticks": "", "outlinewidth": 0 } } } ], "histogram2dcontour": [ { "type": "histogram2dcontour", "colorbar": { "ticks": "", "outlinewidth": 0 }, "autocolorscale": true } ] }, "layout": { "geo": { "bgcolor": "white", "showland": true, "lakecolor": "white", "landcolor": "white", "showlakes": true, "subunitcolor": "#C8D4E3" }, "font": { "color": "#2a3f5f" }, "polar": { "bgcolor": "white", "radialaxis": { "ticks": "", "gridcolor": "#EBF0F8", "linecolor": "#EBF0F8" }, "angularaxis": { "ticks": "", "gridcolor": "#EBF0F8", "linecolor": "#EBF0F8" } }, "scene": { "xaxis": { "ticks": "", "gridcolor": "#DFE8F3", "gridwidth": 2, "linecolor": "#EBF0F8", "zerolinecolor": "#EBF0F8", "showbackground": true, "backgroundcolor": "white" }, "yaxis": { "ticks": "", "gridcolor": "#DFE8F3", "gridwidth": 2, "linecolor": "#EBF0F8", "zerolinecolor": "#EBF0F8", "showbackground": true, "backgroundcolor": "white" }, "zaxis": { "ticks": "", "gridcolor": "#DFE8F3", "gridwidth": 2, "linecolor": "#EBF0F8", "zerolinecolor": "#EBF0F8", "showbackground": true, "backgroundcolor": "white" } }, "title": { "x": 0.05 }, "xaxis": { "ticks": "", "gridcolor": "#EBF0F8", "linecolor": "#EBF0F8", "automargin": true, "zerolinecolor": "#EBF0F8", "zerolinewidth": 2 }, "yaxis": { "ticks": "", "gridcolor": "#EBF0F8", "linecolor": "#EBF0F8", "automargin": true, "zerolinecolor": "#EBF0F8", "zerolinewidth": 2 }, "ternary": { "aaxis": { "ticks": "", "gridcolor": "#DFE8F3", "linecolor": "#A2B1C6" }, "baxis": { "ticks": "", "gridcolor": "#DFE8F3", "linecolor": "#A2B1C6" }, "caxis": { "ticks": "", "gridcolor": "#DFE8F3", "linecolor": "#A2B1C6" }, "bgcolor": "white" }, "colorway": [ "#636efa", "#EF553B", "#00cc96", "#ab63fa", "#19d3f3", "#e763fa", "#fecb52", "#ffa15a", "#ff6692", "#b6e880" ], "hovermode": "closest", "colorscale": { "diverging": [ [ 0, "#8e0152" ], [ 0.1, "#c51b7d" ], [ 0.2, "#de77ae" ], [ 0.3, "#f1b6da" ], [ 0.4, "#fde0ef" ], [ 0.5, "#f7f7f7" ], [ 0.6, "#e6f5d0" ], [ 0.7, "#b8e186" ], [ 0.8, "#7fbc41" ], [ 0.9, "#4d9221" ], [ 1, "#276419" ] ], "sequential": [ [ 0, "#0508b8" ], [ 0.0893854748603352, "#1910d8" ], [ 0.1787709497206704, "#3c19f0" ], [ 0.2681564245810056, "#6b1cfb" ], [ 0.3575418994413408, "#981cfd" ], [ 0.44692737430167595, "#bf1cfd" ], [ 0.5363128491620112, "#dd2bfd" ], [ 0.6256983240223464, "#f246fe" ], [ 0.7150837988826816, "#fc67fd" ], [ 0.8044692737430168, "#fe88fc" ], [ 0.8938547486033519, "#fea5fd" ], [ 0.9832402234636871, "#febefe" ], [ 1, "#fec3fe" ] ], "sequentialminus": [ [ 0, "#0508b8" ], [ 0.0893854748603352, "#1910d8" ], [ 0.1787709497206704, "#3c19f0" ], [ 0.2681564245810056, "#6b1cfb" ], [ 0.3575418994413408, "#981cfd" ], [ 0.44692737430167595, "#bf1cfd" ], [ 0.5363128491620112, "#dd2bfd" ], [ 0.6256983240223464, "#f246fe" ], [ 0.7150837988826816, "#fc67fd" ], [ 0.8044692737430168, "#fe88fc" ], [ 0.8938547486033519, "#fea5fd" ], [ 0.9832402234636871, "#febefe" ], [ 1, "#fec3fe" ] ] }, "plot_bgcolor": "white", "paper_bgcolor": "white", "shapedefaults": { "line": { "width": 0 }, "opacity": 0.4, "fillcolor": "#506784" }, "annotationdefaults": { "arrowhead": 0, "arrowcolor": "#506784", "arrowwidth": 1 } }, "themeRef": "PLOTLY_WHITE" } } }, "height": null, "width": null, "user": { "profile_url": "https://chart-studio.plotly.com/~plotlyaravindgn1", "avatar_url": "https://storage.googleapis.com/plotly-prod-profiles/64.jpg", "background_url": "https://storage.googleapis.com/plotly-prod-profiles/bg-11.jpg", "bio": "", "nickname": "", "website": "", "stream_tokens": null, "feature_set_id": null, "csrf_token": null, "date_joined": "2022-06-10 09:42:31", "mapbox_access_tokens": null, "has_password": null, "username": "plotlyaravindgn1", "email": null, "is_active": null, "readonly": null, "is_dash_creator": null, "dash_created_count": null, "is_chart_creator": null, "charts_created_count": null } }, { "creation_time": "2025-09-09T10:26:27.287973Z", "comments": { "results": [], "count": 0 }, "parented": true, "embed_url": "https://chart-studio.plotly.com/~LeonorF/44.embed", "fid": "LeonorF:44", "filename": "phormidolide ic50 2d copy", "filetype": "plot", "img_url": "https://storage.googleapis.com/plotly-prod-images/LeonorF/44/9_646VFG7D95BKTOIHKC719CICHXPB2B.png", "image_urls": { "default": "https://storage.googleapis.com/plotly-prod-images/LeonorF/44/2_44OIY4H5RZ5JRKQ7IGXCQY6MWOZ0K5.png", "block-thumb": "https://storage.googleapis.com/plotly-prod-images/LeonorF/44/8_62A9NVGPMSMKBCEIWG2PX313ZXS9ER.png", "list-thumb": "https://storage.googleapis.com/plotly-prod-images/LeonorF/44/9_646VFG7D95BKTOIHKC719CICHXPB2B.png" }, "api_urls": { "files": "https://api.plotly.com/v2/files/LeonorF:44", "plots": "https://api.plotly.com/v2/plots/LeonorF:44", "parent": "https://api.plotly.com/v2/folders/home?user=LeonorF" }, "owner": "LeonorF", "parent": -1, "preview": "", "referencers": [], "references": [], "title": "", "views": 0, "web_url": "https://chart-studio.plotly.com/~LeonorF/44/", "world_readable": true, "date_modified": "2025-09-09T11:01:36.960Z", "stars": { "results": [], "count": 0 }, "collaborators": { "results": [], "count": 0 }, "subfolder_count": null, "refresh_interval": null, "organize_view_url": "https://chart-studio.plotly.com/~LeonorF/44/", "current_user_permission": "read", "is_theme": null, "is_template": false, "autosize": true, "caption": "", "figure": { "data": [ { "line": { "color": "rgb(215, 199, 239)", "width": 5 }, "meta": { "columnNames": { "x": "F", "y": "G", "error_y": { "array": "C" } } }, "mode": "lines", "name": "Phormidolide A", "type": "scatter", "xsrc": "LeonorF:43:9137d0", "ysrc": "LeonorF:43:7ddff0", "error_y": { "meta": { "columnNames": { "array": "C" } }, "type": "data", "color": "rgb(0, 0, 0)", "width": 4, "visible": true, "arraysrc": "LeonorF:43:4a29a1", "traceref": 0, "symmetric": true, "thickness": 2, "tracerefminus": 0 } }, { "line": { "color": "rgb(189, 210, 234)", "width": 5 }, "meta": { "columnNames": { "x": "F", "y": "I", "error_y": { "array": "E" } } }, "mode": "lines", "name": "Phormidolide E", "type": "scatter", "xsrc": "LeonorF:43:9137d0", "ysrc": "LeonorF:43:a1ad84", "error_y": { "meta": { "columnNames": { "array": "E" } }, "type": "data", "color": "rgb(0, 0, 0)", "visible": true, "arraysrc": "LeonorF:43:5be876", "symmetric": true }, "stackgroup": null } ], "frames": [], "layout": { "font": { "color": "rgb(5, 5, 5)" }, "scene": { "aspectmode": "auto", "aspectratio": { "x": 1, "y": 1, "z": 1 } }, "title": { "font": { "color": "rgb(0, 0, 0)" }, "text": "" }, "xaxis": { "type": "category", "range": [ -0.44444444444444453, 8.444444444444445 ], "title": { "text": "IC50 3D HCT 116" }, "autorange": true }, "yaxis": { "type": "linear", "range": [ 15.545530222222222, 119.59624577777778 ], "title": { "text": "% cell viability (normalized to DMSO)" }, "autorange": true }, "bargap": 0.30000000000000004, "legend": { "font": { "size": 20, "color": "rgb(0, 0, 0)" }, "orientation": "v" }, "autosize": true, "template": { "data": { "bar": [ { "type": "bar", "marker": { "colorbar": { "ticks": "", "outlinewidth": 0 } } } ], "table": [ { "type": "table", "cells": { "fill": { "color": "#EBF0F8" }, "line": { "color": "white" } }, "header": { "fill": { "color": "#C8D4E3" }, "line": { "color": "white" } } } ], "carpet": [ { "type": "carpet", "aaxis": { "gridcolor": "#C8D4E3", "linecolor": "#C8D4E3", "endlinecolor": "#2a3f5f", "minorgridcolor": "#C8D4E3", "startlinecolor": "#2a3f5f" }, "baxis": { "gridcolor": "#C8D4E3", "linecolor": "#C8D4E3", "endlinecolor": "#2a3f5f", "minorgridcolor": "#C8D4E3", "startlinecolor": "#2a3f5f" } } ], "mesh3d": [ { "type": "mesh3d", "colorbar": { "ticks": "", "outlinewidth": 0 } } ], "contour": [ { "type": "contour", "colorbar": { "ticks": "", "outlinewidth": 0 }, "autocolorscale": true } ], "heatmap": [ { "type": "heatmap", "colorbar": { "ticks": "", "outlinewidth": 0 }, "autocolorscale": true } ], "scatter": [ { "type": "scatter", "marker": { "colorbar": { "ticks": "", "outlinewidth": 0 } } } ], "surface": [ { "type": "surface", "colorbar": { "ticks": "", "outlinewidth": 0 } } ], "heatmapgl": [ { "type": "heatmapgl", "colorbar": { "ticks": "", "outlinewidth": 0 } } ], "histogram": [ { "type": "histogram", "marker": { "colorbar": { "ticks": "", "outlinewidth": 0 } } } ], "parcoords": [ { "line": { "colorbar": { "ticks": "", "outlinewidth": 0 } }, "type": "parcoords" } ], "scatter3d": [ { "type": "scatter3d", "marker": { "colorbar": { "ticks": "", "outlinewidth": 0 } } } ], "scattergl": [ { "type": "scattergl", "marker": { "colorbar": { "ticks": "", "outlinewidth": 0 } } } ], "choropleth": [ { "type": "choropleth", "colorbar": { "ticks": "", "outlinewidth": 0 } } ], "scattergeo": [ { "type": "scattergeo", "marker": { "colorbar": { "ticks": "", "outlinewidth": 0 } } } ], "histogram2d": [ { "type": "histogram2d", "colorbar": { "ticks": "", "outlinewidth": 0 }, "autocolorscale": true } ], "scatterpolar": [ { "type": "scatterpolar", "marker": { "colorbar": { "ticks": "", "outlinewidth": 0 } } } ], "contourcarpet": [ { "type": "contourcarpet", "colorbar": { "ticks": "", "outlinewidth": 0 } } ], "scattercarpet": [ { "type": "scattercarpet", "marker": { "colorbar": { "ticks": "", "outlinewidth": 0 } } } ], "scattermapbox": [ { "type": "scattermapbox", "marker": { "colorbar": { "ticks": "", "outlinewidth": 0 } } } ], "scatterpolargl": [ { "type": "scatterpolargl", "marker": { "colorbar": { "ticks": "", "outlinewidth": 0 } } } ], "scatterternary": [ { "type": "scatterternary", "marker": { "colorbar": { "ticks": "", "outlinewidth": 0 } } } ], "histogram2dcontour": [ { "type": "histogram2dcontour", "colorbar": { "ticks": "", "outlinewidth": 0 }, "autocolorscale": true } ] }, "layout": { "geo": { "bgcolor": "white", "showland": true, "lakecolor": "white", "landcolor": "white", "showlakes": true, "subunitcolor": "#C8D4E3" }, "font": { "color": "#2a3f5f" }, "polar": { "bgcolor": "white", "radialaxis": { "ticks": "", "gridcolor": "#EBF0F8", "linecolor": "#EBF0F8" }, "angularaxis": { "ticks": "", "gridcolor": "#EBF0F8", "linecolor": "#EBF0F8" } }, "scene": { "xaxis": { "ticks": "", "gridcolor": "#DFE8F3", "gridwidth": 2, "linecolor": "#EBF0F8", "zerolinecolor": "#EBF0F8", "showbackground": true, "backgroundcolor": "white" }, "yaxis": { "ticks": "", "gridcolor": "#DFE8F3", "gridwidth": 2, "linecolor": "#EBF0F8", "zerolinecolor": "#EBF0F8", "showbackground": true, "backgroundcolor": "white" }, "zaxis": { "ticks": "", "gridcolor": "#DFE8F3", "gridwidth": 2, "linecolor": "#EBF0F8", "zerolinecolor": "#EBF0F8", "showbackground": true, "backgroundcolor": "white" } }, "title": { "x": 0.05 }, "xaxis": { "ticks": "", "gridcolor": "#EBF0F8", "linecolor": "#EBF0F8", "automargin": true, "zerolinecolor": "#EBF0F8", "zerolinewidth": 2 }, "yaxis": { "ticks": "", "gridcolor": "#EBF0F8", "linecolor": "#EBF0F8", "automargin": true, "zerolinecolor": "#EBF0F8", "zerolinewidth": 2 }, "ternary": { "aaxis": { "ticks": "", "gridcolor": "#DFE8F3", "linecolor": "#A2B1C6" }, "baxis": { "ticks": "", "gridcolor": "#DFE8F3", "linecolor": "#A2B1C6" }, "caxis": { "ticks": "", "gridcolor": "#DFE8F3", "linecolor": "#A2B1C6" }, "bgcolor": "white" }, "colorway": [ "#636efa", "#EF553B", "#00cc96", "#ab63fa", "#19d3f3", "#e763fa", "#fecb52", "#ffa15a", "#ff6692", "#b6e880" ], "hovermode": "closest", "colorscale": { "diverging": [ [ 0, "#8e0152" ], [ 0.1, "#c51b7d" ], [ 0.2, "#de77ae" ], [ 0.3, "#f1b6da" ], [ 0.4, "#fde0ef" ], [ 0.5, "#f7f7f7" ], [ 0.6, "#e6f5d0" ], [ 0.7, "#b8e186" ], [ 0.8, "#7fbc41" ], [ 0.9, "#4d9221" ], [ 1, "#276419" ] ], "sequential": [ [ 0, "#0508b8" ], [ 0.0893854748603352, "#1910d8" ], [ 0.1787709497206704, "#3c19f0" ], [ 0.2681564245810056, "#6b1cfb" ], [ 0.3575418994413408, "#981cfd" ], [ 0.44692737430167595, "#bf1cfd" ], [ 0.5363128491620112, "#dd2bfd" ], [ 0.6256983240223464, "#f246fe" ], [ 0.7150837988826816, "#fc67fd" ], [ 0.8044692737430168, "#fe88fc" ], [ 0.8938547486033519, "#fea5fd" ], [ 0.9832402234636871, "#febefe" ], [ 1, "#fec3fe" ] ], "sequentialminus": [ [ 0, "#0508b8" ], [ 0.0893854748603352, "#1910d8" ], [ 0.1787709497206704, "#3c19f0" ], [ 0.2681564245810056, "#6b1cfb" ], [ 0.3575418994413408, "#981cfd" ], [ 0.44692737430167595, "#bf1cfd" ], [ 0.5363128491620112, "#dd2bfd" ], [ 0.6256983240223464, "#f246fe" ], [ 0.7150837988826816, "#fc67fd" ], [ 0.8044692737430168, "#fe88fc" ], [ 0.8938547486033519, "#fea5fd" ], [ 0.9832402234636871, "#febefe" ], [ 1, "#fec3fe" ] ] }, "plot_bgcolor": "white", "paper_bgcolor": "white", "shapedefaults": { "line": { "width": 0 }, "opacity": 0.4, "fillcolor": "#506784" }, "annotationdefaults": { "arrowhead": 0, "arrowcolor": "#506784", "arrowwidth": 1 } }, "themeRef": "PLOTLY_WHITE" } } }, "height": null, "width": null, "user": { "profile_url": "https://chart-studio.plotly.com/~LeonorF", "avatar_url": "https://storage.googleapis.com/plotly-prod-profiles/30.jpg", "background_url": "https://storage.googleapis.com/plotly-prod-profiles/bg-9.jpg", "bio": "", "nickname": "", "website": "", "stream_tokens": null, "feature_set_id": null, "csrf_token": null, "date_joined": "2021-03-18 14:30:52", "mapbox_access_tokens": null, "has_password": null, "username": "LeonorF", "email": null, "is_active": null, "readonly": null, "is_dash_creator": null, "dash_created_count": null, "is_chart_creator": null, "charts_created_count": null } }, { "creation_time": "2025-09-09T10:23:25.281672Z", "comments": { "results": [], "count": 0 }, "parented": true, "embed_url": "https://chart-studio.plotly.com/~singhtinka970/54.embed", "fid": "singhtinka970:54", "filename": "Plot 54", "filetype": "plot", "img_url": "https://api.plotly.com/v2/files/singhtinka970:54/image?image_name=list-thumb", "image_urls": { "default": "https://storage.googleapis.com/plotly-prod-images/singhtinka970/54/2_5HPD3X99IB6OUVBVLFUHCU5PS6Q96J.png", "block-thumb": "https://storage.googleapis.com/plotly-prod-images/singhtinka970/54/8_FMCC6UKZLEX1Z9E5Z1XOG8Y7O07GQQ.png", "list-thumb": "https://api.plotly.com/v2/files/singhtinka970:54/image?image_name=list-thumb" }, "api_urls": { "files": "https://api.plotly.com/v2/files/singhtinka970:54", "plots": "https://api.plotly.com/v2/plots/singhtinka970:54", "parent": "https://api.plotly.com/v2/folders/home?user=singhtinka970" }, "owner": "singhtinka970", "parent": -1, "preview": "", "referencers": [], "references": [], "title": "", "views": 0, "web_url": "https://chart-studio.plotly.com/~singhtinka970/54/", "world_readable": true, "date_modified": "2025-09-09T10:23:25.295Z", "stars": { "results": [], "count": 0 }, "collaborators": { "results": [], "count": 0 }, "subfolder_count": null, "refresh_interval": null, "organize_view_url": "https://chart-studio.plotly.com/~singhtinka970/54/", "current_user_permission": "read", "is_theme": null, "is_template": false, "autosize": true, "caption": "", "figure": { "data": [ { "line": { "width": 7 }, "meta": { "columnNames": { "x": "sensorId", "y": "PGKN FS01" } }, "mode": "lines", "name": "PGKN 1", "type": "scatter", "xsrc": "singhtinka970:51:409a94", "ysrc": "singhtinka970:51:19e521", "visible": true }, { "line": { "width": 7 }, "meta": { "columnNames": { "x": "sensorId", "y": "5ac9edb1c4edec00190b2148" } }, "mode": "lines", "name": "PGKN 2", "type": "scatter", "xsrc": "singhtinka970:49:3c4263", "ysrc": "singhtinka970:49:ddfb8e", "visible": true }, { "line": { "width": 7 }, "meta": { "columnNames": { "x": "sensorId", "y": "5afd97e7223bd800198db696" } }, "mode": "lines", "name": "PGKN Marvin", "type": "scatter", "xsrc": "singhtinka970:50:fc975b", "ysrc": "singhtinka970:50:0ad382", "visible": true, "stackgroup": null }, { "line": { "width": 7 }, "meta": { "columnNames": { "x": "sensorId", "y": "5acfae2a223bd8001977b621" } }, "mode": "lines", "name": "PGKN 3", "type": "scatter", "xsrc": "singhtinka970:48:19645b", "ysrc": "singhtinka970:48:141e90", "visible": true, "stackgroup": null }, { "line": { "width": 7 }, "meta": { "columnNames": { "x": "sensorId", "y": "5ae36891223bd8001972fb55" } }, "mode": "lines", "name": "PGKN 5", "type": "scatter", "xsrc": "singhtinka970:52:a4c142", "ysrc": "singhtinka970:52:37c588", "visible": true, "stackgroup": null }, { "line": { "width": 7 }, "meta": { "columnNames": { "x": "sensorId", "y": "5ae36a64223bd80019734632" } }, "mode": "lines", "name": "PGKN 7", "type": "scatter", "xsrc": "singhtinka970:53:5cc2d1", "ysrc": "singhtinka970:53:05fddd", "visible": true, "stackgroup": null } ], "frames": [], "layout": { "font": { "size": 30, "family": "Times New Roman" }, "title": { "text": "Tagesmittelwerte April - November 2018 PM 2.5" }, "xaxis": { "type": "category", "dtick": 30, "range": [ 0, 226 ], "tick0": -21, "title": { "font": { "size": 40 } }, "nticks": 18, "tickfont": { "size": 40 }, "tickmode": "linear", "autorange": true, "gridwidth": 4, "zerolinewidth": 7 }, "yaxis": { "type": "linear", "range": [ -3.7516525543001236, 79.0612280771569 ], "title": { "text": "PM 2.5 in ug/m3" }, "autorange": true }, "legend": { "font": { "size": 40 } }, "autosize": true, "hovermode": "closest" } }, "height": null, "width": null, "user": { "profile_url": "https://chart-studio.plotly.com/~singhtinka970", "avatar_url": "https://storage.googleapis.com/plotly-prod-profiles/62.jpg", "background_url": "https://storage.googleapis.com/plotly-prod-profiles/bg-14.jpg", "bio": "", "nickname": "", "website": "", "stream_tokens": null, "feature_set_id": null, "csrf_token": null, "date_joined": "2025-09-05 08:50:37", "mapbox_access_tokens": null, "has_password": null, "username": "singhtinka970", "email": null, "is_active": null, "readonly": null, "is_dash_creator": null, "dash_created_count": null, "is_chart_creator": null, "charts_created_count": null } }, { "creation_time": "2025-09-09T10:20:46.462891Z", "comments": { "results": [], "count": 0 }, "parented": true, "embed_url": "https://chart-studio.plotly.com/~hamzawaheed437/1.embed", "fid": "hamzawaheed437:1", "filename": "MLN-1", "filetype": "plot", "img_url": "https://storage.googleapis.com/plotly-prod-images/hamzawaheed437/1/9_NFJ07MSB3S9N4MCV1Q0HRLPJI54W4I.png", "image_urls": { "default": "https://storage.googleapis.com/plotly-prod-images/hamzawaheed437/1/2_JDX559387A1UAQGAFB4BX0WBMKJ45J.png", "block-thumb": "https://storage.googleapis.com/plotly-prod-images/hamzawaheed437/1/8_TSVLI36RNMZIRWRC2OWUD1IXYDA3O4.png", "list-thumb": "https://storage.googleapis.com/plotly-prod-images/hamzawaheed437/1/9_NFJ07MSB3S9N4MCV1Q0HRLPJI54W4I.png" }, "api_urls": { "files": "https://api.plotly.com/v2/files/hamzawaheed437:1", "plots": "https://api.plotly.com/v2/plots/hamzawaheed437:1", "parent": "https://api.plotly.com/v2/folders/home?user=hamzawaheed437" }, "owner": "hamzawaheed437", "parent": -1, "preview": "", "referencers": [], "references": [], "title": "", "views": 0, "web_url": "https://chart-studio.plotly.com/~hamzawaheed437/1/", "world_readable": true, "date_modified": "2025-09-09T10:20:46.473Z", "stars": { "results": [], "count": 0 }, "collaborators": { "results": [], "count": 0 }, "subfolder_count": null, "refresh_interval": null, "organize_view_url": "https://chart-studio.plotly.com/~hamzawaheed437/1/", "current_user_permission": "read", "is_theme": null, "is_template": false, "autosize": true, "caption": "", "figure": { "data": [ { "asrc": "hamzawaheed437:0:b18627", "bsrc": "hamzawaheed437:0:9e90b6", "csrc": "hamzawaheed437:0:013534", "meta": { "columnNames": { "a": "A", "b": "B", "c": "C" } }, "mode": "markers", "type": "scatterternary" } ], "frames": [], "layout": { "sum": 100, "title": { "text": "" }, "width": 1121, "xaxis": { "range": [ -1, 6 ], "title": { "text": "" }, "showgrid": false, "zeroline": false, "autorange": true, "showticklabels": false }, "yaxis": { "range": [ -1, 4 ], "title": { "text": "" }, "showgrid": false, "zeroline": false, "autorange": true, "showticklabels": false }, "height": 514, "margin": { "b": 40, "l": 60, "r": 10, "t": 25 }, "ternary": {}, "autosize": true, "showlegend": false, "hidesources": true } }, "height": 514, "width": 1121, "user": { "profile_url": "https://chart-studio.plotly.com/~hamzawaheed437", "avatar_url": "https://storage.googleapis.com/plotly-prod-profiles/26.jpg", "background_url": "https://storage.googleapis.com/plotly-prod-profiles/bg-7.jpg", "bio": "", "nickname": "", "website": "", "stream_tokens": null, "feature_set_id": null, "csrf_token": null, "date_joined": "2025-09-09 08:27:18", "mapbox_access_tokens": null, "has_password": null, "username": "hamzawaheed437", "email": null, "is_active": null, "readonly": null, "is_dash_creator": null, "dash_created_count": null, "is_chart_creator": null, "charts_created_count": null } }, { "creation_time": "2025-09-09T10:12:33.672355Z", "comments": { "results": [], "count": 0 }, "parented": true, "embed_url": "https://chart-studio.plotly.com/~pjm25/1.embed", "fid": "pjm25:1", "filename": "IOTA_2025_OHLC", "filetype": "plot", "img_url": "https://storage.googleapis.com/plotly-prod-images/pjm25/1/9_YAKO8BMJ7TDJGYKS0F1XXXWW3BEDTG.png", "image_urls": { "default": "https://storage.googleapis.com/plotly-prod-images/pjm25/1/2_6Q3BAMJBPVNEFKWJ0QT9K8425VL2R5.png", "block-thumb": "https://storage.googleapis.com/plotly-prod-images/pjm25/1/8_FJX2TVCPWJ7SRKPDJG04XU3NHSUT77.png", "list-thumb": "https://storage.googleapis.com/plotly-prod-images/pjm25/1/9_YAKO8BMJ7TDJGYKS0F1XXXWW3BEDTG.png" }, "api_urls": { "files": "https://api.plotly.com/v2/files/pjm25:1", "plots": "https://api.plotly.com/v2/plots/pjm25:1", "parent": "https://api.plotly.com/v2/folders/home?user=pjm25" }, "owner": "pjm25", "parent": -1, "preview": "", "referencers": [], "references": [], "title": "", "views": 0, "web_url": "https://chart-studio.plotly.com/~pjm25/1/", "world_readable": true, "date_modified": "2025-09-09T10:12:33.682Z", "stars": { "results": [], "count": 0 }, "collaborators": { "results": [], "count": 0 }, "subfolder_count": null, "refresh_interval": null, "organize_view_url": "https://chart-studio.plotly.com/~pjm25/1/", "current_user_permission": "read", "is_theme": null, "is_template": null, "autosize": true, "caption": "", "figure": { "data": [ { "name": "Daily", "type": "candlestick", "xsrc": "pjm25:0:a556fa", "lowsrc": "pjm25:0:9d0099", "highsrc": "pjm25:0:80ac0d", "opensrc": "pjm25:0:3bb9ef", "closesrc": "pjm25:0:a24290" }, { "name": "Weekly", "type": "candlestick", "xsrc": "pjm25:0:307a92", "lowsrc": "pjm25:0:a6ce7e", "highsrc": "pjm25:0:fb00db", "opensrc": "pjm25:0:7ee0be", "visible": false, "closesrc": "pjm25:0:7676cb" } ], "layout": { "title": { "text": "IOTA OHLC (USD) — 2025 Daily/Weekly" }, "xaxis": { "title": { "text": "Date" }, "rangeslider": { "visible": true }, "rangeselector": { "buttons": [ { "step": "month", "count": 1, "label": "1m", "stepmode": "backward" }, { "step": "month", "count": 3, "label": "3m", "stepmode": "backward" }, { "step": "month", "count": 6, "label": "6m", "stepmode": "backward" }, { "step": "all" } ] } }, "yaxis": { "title": { "text": "Price (USD)" } }, "template": { "data": { "bar": [ { "type": "bar", "marker": { "line": { "color": "#E5ECF6", "width": 0.5 }, "pattern": { "size": 10, "fillmode": "overlay", "solidity": 0.2 } }, "error_x": { "color": "#2a3f5f" }, "error_y": { "color": "#2a3f5f" } } ], "pie": [ { "type": "pie", "automargin": true } ], "table": [ { "type": "table", "cells": { "fill": { "color": "#EBF0F8" }, "line": { "color": "white" } }, "header": { "fill": { "color": "#C8D4E3" }, "line": { "color": "white" } } } ], "carpet": [ { "type": "carpet", "aaxis": { "gridcolor": "white", "linecolor": "white", "endlinecolor": "#2a3f5f", "minorgridcolor": "white", "startlinecolor": "#2a3f5f" }, "baxis": { "gridcolor": "white", "linecolor": "white", "endlinecolor": "#2a3f5f", "minorgridcolor": "white", "startlinecolor": "#2a3f5f" } } ], "mesh3d": [ { "type": "mesh3d", "colorbar": { "ticks": "", "outlinewidth": 0 } } ], "contour": [ { "type": "contour", "colorbar": { "ticks": "", "outlinewidth": 0 }, "colorscale": [ [ 0.0, "#0d0887" ], [ 0.1111111111111111, "#46039f" ], [ 0.2222222222222222, "#7201a8" ], [ 0.3333333333333333, "#9c179e" ], [ 0.4444444444444444, "#bd3786" ], [ 0.5555555555555556, "#d8576b" ], [ 0.6666666666666666, "#ed7953" ], [ 0.7777777777777778, "#fb9f3a" ], [ 0.8888888888888888, "#fdca26" ], [ 1.0, "#f0f921" ] ] } ], "heatmap": [ { "type": "heatmap", "colorbar": { "ticks": "", "outlinewidth": 0 }, "colorscale": [ [ 0.0, "#0d0887" ], [ 0.1111111111111111, "#46039f" ], [ 0.2222222222222222, "#7201a8" ], [ 0.3333333333333333, "#9c179e" ], [ 0.4444444444444444, "#bd3786" ], [ 0.5555555555555556, "#d8576b" ], [ 0.6666666666666666, "#ed7953" ], [ 0.7777777777777778, "#fb9f3a" ], [ 0.8888888888888888, "#fdca26" ], [ 1.0, "#f0f921" ] ] } ], "scatter": [ { "type": "scatter", "fillpattern": { "size": 10, "fillmode": "overlay", "solidity": 0.2 } } ], "surface": [ { "type": "surface", "colorbar": { "ticks": "", "outlinewidth": 0 }, "colorscale": [ [ 0.0, "#0d0887" ], [ 0.1111111111111111, "#46039f" ], [ 0.2222222222222222, "#7201a8" ], [ 0.3333333333333333, "#9c179e" ], [ 0.4444444444444444, "#bd3786" ], [ 0.5555555555555556, "#d8576b" ], [ 0.6666666666666666, "#ed7953" ], [ 0.7777777777777778, "#fb9f3a" ], [ 0.8888888888888888, "#fdca26" ], [ 1.0, "#f0f921" ] ] } ], "barpolar": [ { "type": "barpolar", "marker": { "line": { "color": "#E5ECF6", "width": 0.5 }, "pattern": { "size": 10, "fillmode": "overlay", "solidity": 0.2 } } } ], "heatmapgl": [ { "type": "heatmapgl", "colorbar": { "ticks": "", "outlinewidth": 0 }, "colorscale": [ [ 0.0, "#0d0887" ], [ 0.1111111111111111, "#46039f" ], [ 0.2222222222222222, "#7201a8" ], [ 0.3333333333333333, "#9c179e" ], [ 0.4444444444444444, "#bd3786" ], [ 0.5555555555555556, "#d8576b" ], [ 0.6666666666666666, "#ed7953" ], [ 0.7777777777777778, "#fb9f3a" ], [ 0.8888888888888888, "#fdca26" ], [ 1.0, "#f0f921" ] ] } ], "histogram": [ { "type": "histogram", "marker": { "pattern": { "size": 10, "fillmode": "overlay", "solidity": 0.2 } } } ], "parcoords": [ { "line": { "colorbar": { "ticks": "", "outlinewidth": 0 } }, "type": "parcoords" } ], "scatter3d": [ { "line": { "colorbar": { "ticks": "", "outlinewidth": 0 } }, "type": "scatter3d", "marker": { "colorbar": { "ticks": "", "outlinewidth": 0 } } } ], "scattergl": [ { "type": "scattergl", "marker": { "colorbar": { "ticks": "", "outlinewidth": 0 } } } ], "choropleth": [ { "type": "choropleth", "colorbar": { "ticks": "", "outlinewidth": 0 } } ], "scattergeo": [ { "type": "scattergeo", "marker": { "colorbar": { "ticks": "", "outlinewidth": 0 } } } ], "histogram2d": [ { "type": "histogram2d", "colorbar": { "ticks": "", "outlinewidth": 0 }, "colorscale": [ [ 0.0, "#0d0887" ], [ 0.1111111111111111, "#46039f" ], [ 0.2222222222222222, "#7201a8" ], [ 0.3333333333333333, "#9c179e" ], [ 0.4444444444444444, "#bd3786" ], [ 0.5555555555555556, "#d8576b" ], [ 0.6666666666666666, "#ed7953" ], [ 0.7777777777777778, "#fb9f3a" ], [ 0.8888888888888888, "#fdca26" ], [ 1.0, "#f0f921" ] ] } ], "scatterpolar": [ { "type": "scatterpolar", "marker": { "colorbar": { "ticks": "", "outlinewidth": 0 } } } ], "contourcarpet": [ { "type": "contourcarpet", "colorbar": { "ticks": "", "outlinewidth": 0 } } ], "scattercarpet": [ { "type": "scattercarpet", "marker": { "colorbar": { "ticks": "", "outlinewidth": 0 } } } ], "scattermapbox": [ { "type": "scattermapbox", "marker": { "colorbar": { "ticks": "", "outlinewidth": 0 } } } ], "scatterpolargl": [ { "type": "scatterpolargl", "marker": { "colorbar": { "ticks": "", "outlinewidth": 0 } } } ], "scatterternary": [ { "type": "scatterternary", "marker": { "colorbar": { "ticks": "", "outlinewidth": 0 } } } ], "histogram2dcontour": [ { "type": "histogram2dcontour", "colorbar": { "ticks": "", "outlinewidth": 0 }, "colorscale": [ [ 0.0, "#0d0887" ], [ 0.1111111111111111, "#46039f" ], [ 0.2222222222222222, "#7201a8" ], [ 0.3333333333333333, "#9c179e" ], [ 0.4444444444444444, "#bd3786" ], [ 0.5555555555555556, "#d8576b" ], [ 0.6666666666666666, "#ed7953" ], [ 0.7777777777777778, "#fb9f3a" ], [ 0.8888888888888888, "#fdca26" ], [ 1.0, "#f0f921" ] ] } ] }, "layout": { "geo": { "bgcolor": "white", "showland": true, "lakecolor": "white", "landcolor": "#E5ECF6", "showlakes": true, "subunitcolor": "white" }, "font": { "color": "#2a3f5f" }, "polar": { "bgcolor": "#E5ECF6", "radialaxis": { "ticks": "", "gridcolor": "white", "linecolor": "white" }, "angularaxis": { "ticks": "", "gridcolor": "white", "linecolor": "white" } }, "scene": { "xaxis": { "ticks": "", "gridcolor": "white", "gridwidth": 2, "linecolor": "white", "zerolinecolor": "white", "showbackground": true, "backgroundcolor": "#E5ECF6" }, "yaxis": { "ticks": "", "gridcolor": "white", "gridwidth": 2, "linecolor": "white", "zerolinecolor": "white", "showbackground": true, "backgroundcolor": "#E5ECF6" }, "zaxis": { "ticks": "", "gridcolor": "white", "gridwidth": 2, "linecolor": "white", "zerolinecolor": "white", "showbackground": true, "backgroundcolor": "#E5ECF6" } }, "title": { "x": 0.05 }, "xaxis": { "ticks": "", "title": { "standoff": 15 }, "gridcolor": "white", "linecolor": "white", "automargin": true, "zerolinecolor": "white", "zerolinewidth": 2 }, "yaxis": { "ticks": "", "title": { "standoff": 15 }, "gridcolor": "white", "linecolor": "white", "automargin": true, "zerolinecolor": "white", "zerolinewidth": 2 }, "mapbox": { "style": "light" }, "ternary": { "aaxis": { "ticks": "", "gridcolor": "white", "linecolor": "white" }, "baxis": { "ticks": "", "gridcolor": "white", "linecolor": "white" }, "caxis": { "ticks": "", "gridcolor": "white", "linecolor": "white" }, "bgcolor": "#E5ECF6" }, "colorway": [ "#636efa", "#EF553B", "#00cc96", "#ab63fa", "#FFA15A", "#19d3f3", "#FF6692", "#B6E880", "#FF97FF", "#FECB52" ], "coloraxis": { "colorbar": { "ticks": "", "outlinewidth": 0 } }, "hovermode": "closest", "colorscale": { "diverging": [ [ 0, "#8e0152" ], [ 0.1, "#c51b7d" ], [ 0.2, "#de77ae" ], [ 0.3, "#f1b6da" ], [ 0.4, "#fde0ef" ], [ 0.5, "#f7f7f7" ], [ 0.6, "#e6f5d0" ], [ 0.7, "#b8e186" ], [ 0.8, "#7fbc41" ], [ 0.9, "#4d9221" ], [ 1, "#276419" ] ], "sequential": [ [ 0.0, "#0d0887" ], [ 0.1111111111111111, "#46039f" ], [ 0.2222222222222222, "#7201a8" ], [ 0.3333333333333333, "#9c179e" ], [ 0.4444444444444444, "#bd3786" ], [ 0.5555555555555556, "#d8576b" ], [ 0.6666666666666666, "#ed7953" ], [ 0.7777777777777778, "#fb9f3a" ], [ 0.8888888888888888, "#fdca26" ], [ 1.0, "#f0f921" ] ], "sequentialminus": [ [ 0.0, "#0d0887" ], [ 0.1111111111111111, "#46039f" ], [ 0.2222222222222222, "#7201a8" ], [ 0.3333333333333333, "#9c179e" ], [ 0.4444444444444444, "#bd3786" ], [ 0.5555555555555556, "#d8576b" ], [ 0.6666666666666666, "#ed7953" ], [ 0.7777777777777778, "#fb9f3a" ], [ 0.8888888888888888, "#fdca26" ], [ 1.0, "#f0f921" ] ] }, "hoverlabel": { "align": "left" }, "plot_bgcolor": "#E5ECF6", "paper_bgcolor": "white", "shapedefaults": { "line": { "color": "#2a3f5f" } }, "autotypenumbers": "strict", "annotationdefaults": { "arrowhead": 0, "arrowcolor": "#2a3f5f", "arrowwidth": 1 } } }, "updatemenus": [ { "x": 0.5, "y": 1.12, "type": "buttons", "buttons": [ { "args": [ { "visible": [ true, false ] } ], "label": "Daily", "method": "update" }, { "args": [ { "visible": [ false, true ] } ], "label": "Weekly", "method": "update" } ], "xanchor": "center", "direction": "left" } ] } }, "height": null, "width": null, "user": { "profile_url": "https://chart-studio.plotly.com/~pjm25", "avatar_url": "https://storage.googleapis.com/plotly-prod-profiles/91.jpg", "background_url": "https://storage.googleapis.com/plotly-prod-profiles/bg-10.jpg", "bio": "", "nickname": "", "website": "", "stream_tokens": null, "feature_set_id": null, "csrf_token": null, "date_joined": "2025-09-09 10:06:56", "mapbox_access_tokens": null, "has_password": null, "username": "pjm25", "email": null, "is_active": null, "readonly": null, "is_dash_creator": null, "dash_created_count": null, "is_chart_creator": null, "charts_created_count": null } }, { "creation_time": "2025-09-09T10:07:47.181334Z", "comments": { "results": [], "count": 0 }, "parented": true, "embed_url": "https://chart-studio.plotly.com/~PUIPUI.COM/20.embed", "fid": "PUIPUI.COM:20", "filename": "Plot 20", "filetype": "plot", "img_url": "https://storage.googleapis.com/plotly-prod-images/PUIPUI.COM/20/9_6EZTZFL40YB6Y04TMDOQBM5LJ6XMJG.png", "image_urls": { "default": "https://storage.googleapis.com/plotly-prod-images/PUIPUI.COM/20/2_YE8MTVXEX3A5YIPGSCF5A5S6N4G2SK.png", "block-thumb": "https://storage.googleapis.com/plotly-prod-images/PUIPUI.COM/20/8_XQFADYHCW7VMGY0S1HX253IH5PMOJZ.png", "list-thumb": "https://storage.googleapis.com/plotly-prod-images/PUIPUI.COM/20/9_6EZTZFL40YB6Y04TMDOQBM5LJ6XMJG.png" }, "api_urls": { "files": "https://api.plotly.com/v2/files/PUIPUI.COM:20", "plots": "https://api.plotly.com/v2/plots/PUIPUI.COM:20", "parent": "https://api.plotly.com/v2/folders/home?user=PUIPUI.COM" }, "owner": "PUIPUI.COM", "parent": -1, "preview": "", "referencers": [], "references": [], "title": "", "views": 0, "web_url": "https://chart-studio.plotly.com/~PUIPUI.COM/20/", "world_readable": true, "date_modified": "2025-09-09T10:08:17.748Z", "stars": { "results": [], "count": 0 }, "collaborators": { "results": [], "count": 0 }, "subfolder_count": null, "refresh_interval": null, "organize_view_url": "https://chart-studio.plotly.com/~PUIPUI.COM/20/", "current_user_permission": "read", "is_theme": null, "is_template": false, "autosize": true, "caption": "", "figure": { "data": [ { "meta": { "columnNames": { "x": "Freq [GHz]", "y": "dB(S(2,1)) []" } }, "mode": "lines", "name": "0", "type": "scatter", "xsrc": "PUIPUI.COM:17:14c740", "ysrc": "PUIPUI.COM:17:8678ca" }, { "meta": { "columnNames": { "x": "Freq [GHz]", "y": "dB(S(2,1)) []" } }, "mode": "lines", "name": "10", "type": "scatter", "xsrc": "PUIPUI.COM:16:0762be", "ysrc": "PUIPUI.COM:16:e75971", "stackgroup": null }, { "meta": { "columnNames": { "x": "Freq [GHz]", "y": "dB(S(2,1)) []" } }, "mode": "lines", "name": "30", "type": "scatter", "xsrc": "PUIPUI.COM:19:270cfb", "ysrc": "PUIPUI.COM:19:3a7aac", "stackgroup": null }, { "meta": { "columnNames": { "x": "Freq [GHz]", "y": "dB(S(2,1)) []" } }, "mode": "lines", "name": "50", "type": "scatter", "xsrc": "PUIPUI.COM:13:6ce407", "ysrc": "PUIPUI.COM:13:9f1699", "stackgroup": null }, { "meta": { "columnNames": { "x": "Freq [GHz]", "y": "dB(S(2,1)) []" } }, "mode": "lines", "name": "70", "type": "scatter", "xsrc": "PUIPUI.COM:14:044236", "ysrc": "PUIPUI.COM:14:883d97", "stackgroup": null }, { "meta": { "columnNames": { "x": "Freq [GHz]", "y": "dB(S(2,1)) []" } }, "mode": "lines", "name": "90", "type": "scatter", "xsrc": "PUIPUI.COM:15:34fd9c", "ysrc": "PUIPUI.COM:15:e9601c", "stackgroup": null }, { "meta": { "columnNames": { "x": "Freq [GHz]", "y": "dB(S(2,1)) []" } }, "mode": "lines", "name": "100", "type": "scatter", "xsrc": "PUIPUI.COM:18:8ec6d1", "ysrc": "PUIPUI.COM:18:0d3d0d", "stackgroup": null } ], "frames": [], "layout": { "xaxis": { "type": "linear", "range": [ 1.01, 4 ], "autorange": true }, "yaxis": { "type": "linear", "range": [ -43.20643933086239, 2.169825559713402 ], "autorange": true }, "autosize": true, "template": { "data": { "bar": [ { "type": "bar", "marker": { "colorbar": { "ticks": "", "outlinewidth": 0 } } } ], "table": [ { "type": "table", "cells": { "fill": { "color": "#EBF0F8" }, "line": { "color": "white" } }, "header": { "fill": { "color": "#C8D4E3" }, "line": { "color": "white" } } } ], "carpet": [ { "type": "carpet", "aaxis": { "gridcolor": "#C8D4E3", "linecolor": "#C8D4E3", "endlinecolor": "#2a3f5f", "minorgridcolor": "#C8D4E3", "startlinecolor": "#2a3f5f" }, "baxis": { "gridcolor": "#C8D4E3", "linecolor": "#C8D4E3", "endlinecolor": "#2a3f5f", "minorgridcolor": "#C8D4E3", "startlinecolor": "#2a3f5f" } } ], "mesh3d": [ { "type": "mesh3d", "colorbar": { "ticks": "", "outlinewidth": 0 } } ], "contour": [ { "type": "contour", "colorbar": { "ticks": "", "outlinewidth": 0 }, "autocolorscale": true } ], "heatmap": [ { "type": "heatmap", "colorbar": { "ticks": "", "outlinewidth": 0 }, "autocolorscale": true } ], "scatter": [ { "type": "scatter", "marker": { "colorbar": { "ticks": "", "outlinewidth": 0 } } } ], "surface": [ { "type": "surface", "colorbar": { "ticks": "", "outlinewidth": 0 } } ], "heatmapgl": [ { "type": "heatmapgl", "colorbar": { "ticks": "", "outlinewidth": 0 } } ], "histogram": [ { "type": "histogram", "marker": { "colorbar": { "ticks": "", "outlinewidth": 0 } } } ], "parcoords": [ { "line": { "colorbar": { "ticks": "", "outlinewidth": 0 } }, "type": "parcoords" } ], "scatter3d": [ { "type": "scatter3d", "marker": { "colorbar": { "ticks": "", "outlinewidth": 0 } } } ], "scattergl": [ { "type": "scattergl", "marker": { "colorbar": { "ticks": "", "outlinewidth": 0 } } } ], "choropleth": [ { "type": "choropleth", "colorbar": { "ticks": "", "outlinewidth": 0 } } ], "scattergeo": [ { "type": "scattergeo", "marker": { "colorbar": { "ticks": "", "outlinewidth": 0 } } } ], "histogram2d": [ { "type": "histogram2d", "colorbar": { "ticks": "", "outlinewidth": 0 }, "autocolorscale": true } ], "scatterpolar": [ { "type": "scatterpolar", "marker": { "colorbar": { "ticks": "", "outlinewidth": 0 } } } ], "contourcarpet": [ { "type": "contourcarpet", "colorbar": { "ticks": "", "outlinewidth": 0 } } ], "scattercarpet": [ { "type": "scattercarpet", "marker": { "colorbar": { "ticks": "", "outlinewidth": 0 } } } ], "scattermapbox": [ { "type": "scattermapbox", "marker": { "colorbar": { "ticks": "", "outlinewidth": 0 } } } ], "scatterpolargl": [ { "type": "scatterpolargl", "marker": { "colorbar": { "ticks": "", "outlinewidth": 0 } } } ], "scatterternary": [ { "type": "scatterternary", "marker": { "colorbar": { "ticks": "", "outlinewidth": 0 } } } ], "histogram2dcontour": [ { "type": "histogram2dcontour", "colorbar": { "ticks": "", "outlinewidth": 0 }, "autocolorscale": true } ] }, "layout": { "geo": { "bgcolor": "white", "showland": true, "lakecolor": "white", "landcolor": "white", "showlakes": true, "subunitcolor": "#C8D4E3" }, "font": { "color": "#2a3f5f" }, "polar": { "bgcolor": "white", "radialaxis": { "ticks": "", "gridcolor": "#EBF0F8", "linecolor": "#EBF0F8" }, "angularaxis": { "ticks": "", "gridcolor": "#EBF0F8", "linecolor": "#EBF0F8" } }, "scene": { "xaxis": { "ticks": "", "gridcolor": "#DFE8F3", "gridwidth": 2, "linecolor": "#EBF0F8", "zerolinecolor": "#EBF0F8", "showbackground": true, "backgroundcolor": "white" }, "yaxis": { "ticks": "", "gridcolor": "#DFE8F3", "gridwidth": 2, "linecolor": "#EBF0F8", "zerolinecolor": "#EBF0F8", "showbackground": true, "backgroundcolor": "white" }, "zaxis": { "ticks": "", "gridcolor": "#DFE8F3", "gridwidth": 2, "linecolor": "#EBF0F8", "zerolinecolor": "#EBF0F8", "showbackground": true, "backgroundcolor": "white" } }, "title": { "x": 0.05 }, "xaxis": { "ticks": "", "gridcolor": "#EBF0F8", "linecolor": "#EBF0F8", "automargin": true, "zerolinecolor": "#EBF0F8", "zerolinewidth": 2 }, "yaxis": { "ticks": "", "gridcolor": "#EBF0F8", "linecolor": "#EBF0F8", "automargin": true, "zerolinecolor": "#EBF0F8", "zerolinewidth": 2 }, "ternary": { "aaxis": { "ticks": "", "gridcolor": "#DFE8F3", "linecolor": "#A2B1C6" }, "baxis": { "ticks": "", "gridcolor": "#DFE8F3", "linecolor": "#A2B1C6" }, "caxis": { "ticks": "", "gridcolor": "#DFE8F3", "linecolor": "#A2B1C6" }, "bgcolor": "white" }, "colorway": [ "#636efa", "#EF553B", "#00cc96", "#ab63fa", "#19d3f3", "#e763fa", "#fecb52", "#ffa15a", "#ff6692", "#b6e880" ], "hovermode": "closest", "colorscale": { "diverging": [ [ 0, "#8e0152" ], [ 0.1, "#c51b7d" ], [ 0.2, "#de77ae" ], [ 0.3, "#f1b6da" ], [ 0.4, "#fde0ef" ], [ 0.5, "#f7f7f7" ], [ 0.6, "#e6f5d0" ], [ 0.7, "#b8e186" ], [ 0.8, "#7fbc41" ], [ 0.9, "#4d9221" ], [ 1, "#276419" ] ], "sequential": [ [ 0, "#0508b8" ], [ 0.0893854748603352, "#1910d8" ], [ 0.1787709497206704, "#3c19f0" ], [ 0.2681564245810056, "#6b1cfb" ], [ 0.3575418994413408, "#981cfd" ], [ 0.44692737430167595, "#bf1cfd" ], [ 0.5363128491620112, "#dd2bfd" ], [ 0.6256983240223464, "#f246fe" ], [ 0.7150837988826816, "#fc67fd" ], [ 0.8044692737430168, "#fe88fc" ], [ 0.8938547486033519, "#fea5fd" ], [ 0.9832402234636871, "#febefe" ], [ 1, "#fec3fe" ] ], "sequentialminus": [ [ 0, "#0508b8" ], [ 0.0893854748603352, "#1910d8" ], [ 0.1787709497206704, "#3c19f0" ], [ 0.2681564245810056, "#6b1cfb" ], [ 0.3575418994413408, "#981cfd" ], [ 0.44692737430167595, "#bf1cfd" ], [ 0.5363128491620112, "#dd2bfd" ], [ 0.6256983240223464, "#f246fe" ], [ 0.7150837988826816, "#fc67fd" ], [ 0.8044692737430168, "#fe88fc" ], [ 0.8938547486033519, "#fea5fd" ], [ 0.9832402234636871, "#febefe" ], [ 1, "#fec3fe" ] ] }, "plot_bgcolor": "white", "paper_bgcolor": "white", "shapedefaults": { "line": { "width": 0 }, "opacity": 0.4, "fillcolor": "#506784" }, "annotationdefaults": { "arrowhead": 0, "arrowcolor": "#506784", "arrowwidth": 1 } }, "themeRef": "PLOTLY_WHITE" } } }, "height": null, "width": null, "user": { "profile_url": "https://chart-studio.plotly.com/~PUIPUI.COM", "avatar_url": "https://storage.googleapis.com/plotly-prod-profiles/82.jpg", "background_url": "https://storage.googleapis.com/plotly-prod-profiles/bg-8.jpg", "bio": "", "nickname": "", "website": "", "stream_tokens": null, "feature_set_id": null, "csrf_token": null, "date_joined": "2025-09-09 09:46:32", "mapbox_access_tokens": null, "has_password": null, "username": "PUIPUI.COM", "email": null, "is_active": null, "readonly": null, "is_dash_creator": null, "dash_created_count": null, "is_chart_creator": null, "charts_created_count": null } }, { "creation_time": "2025-09-09T09:48:41.978713Z", "comments": { "results": [], "count": 0 }, "parented": true, "embed_url": "https://chart-studio.plotly.com/~PUIPUI.COM/12.embed", "fid": "PUIPUI.COM:12", "filename": "Plot 12", "filetype": "plot", "img_url": "https://api.plotly.com/v2/files/PUIPUI.COM:12/image?image_name=list-thumb", "image_urls": { "default": "https://api.plotly.com/v2/files/PUIPUI.COM:12/image?image_name=default", "block-thumb": "https://storage.googleapis.com/plotly-prod-images/PUIPUI.COM/12/8_7RCF0J2KT7Y0UQ7V07N3BPBN0RKDXC.png", "list-thumb": "https://api.plotly.com/v2/files/PUIPUI.COM:12/image?image_name=list-thumb" }, "api_urls": { "files": "https://api.plotly.com/v2/files/PUIPUI.COM:12", "plots": "https://api.plotly.com/v2/plots/PUIPUI.COM:12", "parent": "https://api.plotly.com/v2/folders/home?user=PUIPUI.COM" }, "owner": "PUIPUI.COM", "parent": -1, "preview": "", "referencers": [], "references": [], "title": "", "views": 0, "web_url": "https://chart-studio.plotly.com/~PUIPUI.COM/12/", "world_readable": true, "date_modified": "2025-09-09T09:48:41.991Z", "stars": { "results": [], "count": 0 }, "collaborators": { "results": [], "count": 0 }, "subfolder_count": null, "refresh_interval": null, "organize_view_url": "https://chart-studio.plotly.com/~PUIPUI.COM/12/", "current_user_permission": "read", "is_theme": null, "is_template": false, "autosize": true, "caption": "", "figure": { "data": [ { "meta": { "columnNames": { "x": "Freq [GHz]", "y": "dB(S(4,3)) []" } }, "mode": "lines", "name": "r 5870", "type": "scatter", "xsrc": "PUIPUI.COM:0:b83939", "ysrc": "PUIPUI.COM:0:a931ac" }, { "meta": { "columnNames": { "x": "Freq [GHz]", "y": "dB(S(4,3)) []" } }, "mode": "lines", "name": "r 4003", "type": "scatter", "xsrc": "PUIPUI.COM:1:d9b652", "ysrc": "PUIPUI.COM:1:2d23cf", "stackgroup": null }, { "meta": { "columnNames": { "x": "Freq [GHz]", "y": "dB(S(4,3)) []" } }, "mode": "lines", "name": "air<br>", "type": "scatter", "xsrc": "PUIPUI.COM:2:e6296c", "ysrc": "PUIPUI.COM:2:41ae34", "stackgroup": null }, { "meta": { "columnNames": { "x": "Freq [GHz]", "y": "dB(S(4,3)) []" } }, "mode": "lines", "name": "alumina 92 pct", "type": "scatter", "xsrc": "PUIPUI.COM:3:41e484", "ysrc": "PUIPUI.COM:3:cdcc24", "stackgroup": null }, { "meta": { "columnNames": { "x": "Freq [GHz]", "y": "dB(S(4,3)) []" } }, "mode": "lines", "name": "tactonic rf 60 tm", "type": "scatter", "xsrc": "PUIPUI.COM:4:f43ba3", "ysrc": "PUIPUI.COM:4:781074", "stackgroup": null }, { "meta": { "columnNames": { "x": "Freq [GHz]", "y": "dB(S(4,3)) []" } }, "mode": "lines", "name": "fr4", "type": "scatter", "xsrc": "PUIPUI.COM:5:7ca76f", "ysrc": "PUIPUI.COM:5:a2e4d1", "stackgroup": null }, { "meta": { "columnNames": { "x": "Freq [GHz]", "y": "dB(S(4,3)) []" } }, "mode": "lines", "name": "r 5880", "type": "scatter", "xsrc": "PUIPUI.COM:6:f1b825", "ysrc": "PUIPUI.COM:6:743882", "stackgroup": null }, { "meta": { "columnNames": { "x": "Freq [GHz]", "y": "dB(S(4,3)) []" } }, "mode": "lines", "name": "r 3010", "type": "scatter", "xsrc": "PUIPUI.COM:9:4a9b0f", "ysrc": "PUIPUI.COM:9:694ea6", "stackgroup": null }, { "meta": { "columnNames": { "x": "Freq [GHz]", "y": "dB(S(4,3)) []" } }, "mode": "lines", "name": "r 3006", "type": "scatter", "xsrc": "PUIPUI.COM:8:9a6f78", "ysrc": "PUIPUI.COM:8:3e670e", "stackgroup": null }, { "meta": { "columnNames": { "x": "Freq [GHz]", "y": "dB(S(4,3)) []" } }, "mode": "lines", "name": "r 6006", "type": "scatter", "xsrc": "PUIPUI.COM:7:736478", "ysrc": "PUIPUI.COM:7:3f2d79", "stackgroup": null }, { "meta": { "columnNames": { "x": "Freq [GHz]", "y": "dB(S(4,3)) []" } }, "mode": "lines", "name": "rf35", "type": "scatter", "xsrc": "PUIPUI.COM:10:d40b11", "ysrc": "PUIPUI.COM:10:d561f5", "stackgroup": null }, { "meta": { "columnNames": { "x": "Freq [GHz]", "y": "dB(S(4,3)) []" } }, "mode": "lines", "name": "ad255c", "type": "scatter", "xsrc": "PUIPUI.COM:11:c6c81b", "ysrc": "PUIPUI.COM:11:3a3bb3", "stackgroup": null } ], "frames": [], "layout": { "title": { "text": "Final design square microstrip" }, "xaxis": { "type": "linear", "range": [ 0.01, 5 ], "autorange": true, "showspikes": false }, "yaxis": { "type": "linear", "range": [ -27.93514801638565, 1.470189555665395 ], "autorange": true, "showspikes": false }, "autosize": true, "dragmode": "zoom", "template": { "data": { "bar": [ { "type": "bar", "marker": { "colorbar": { "ticks": "", "outlinewidth": 0 } } } ], "table": [ { "type": "table", "cells": { "fill": { "color": "#EBF0F8" }, "line": { "color": "white" } }, "header": { "fill": { "color": "#C8D4E3" }, "line": { "color": "white" } } } ], "carpet": [ { "type": "carpet", "aaxis": { "gridcolor": "#C8D4E3", "linecolor": "#C8D4E3", "endlinecolor": "#2a3f5f", "minorgridcolor": "#C8D4E3", "startlinecolor": "#2a3f5f" }, "baxis": { "gridcolor": "#C8D4E3", "linecolor": "#C8D4E3", "endlinecolor": "#2a3f5f", "minorgridcolor": "#C8D4E3", "startlinecolor": "#2a3f5f" } } ], "mesh3d": [ { "type": "mesh3d", "colorbar": { "ticks": "", "outlinewidth": 0 } } ], "contour": [ { "type": "contour", "colorbar": { "ticks": "", "outlinewidth": 0 }, "autocolorscale": true } ], "heatmap": [ { "type": "heatmap", "colorbar": { "ticks": "", "outlinewidth": 0 }, "autocolorscale": true } ], "scatter": [ { "type": "scatter", "marker": { "colorbar": { "ticks": "", "outlinewidth": 0 } } } ], "surface": [ { "type": "surface", "colorbar": { "ticks": "", "outlinewidth": 0 } } ], "heatmapgl": [ { "type": "heatmapgl", "colorbar": { "ticks": "", "outlinewidth": 0 } } ], "histogram": [ { "type": "histogram", "marker": { "colorbar": { "ticks": "", "outlinewidth": 0 } } } ], "parcoords": [ { "line": { "colorbar": { "ticks": "", "outlinewidth": 0 } }, "type": "parcoords" } ], "scatter3d": [ { "type": "scatter3d", "marker": { "colorbar": { "ticks": "", "outlinewidth": 0 } } } ], "scattergl": [ { "type": "scattergl", "marker": { "colorbar": { "ticks": "", "outlinewidth": 0 } } } ], "choropleth": [ { "type": "choropleth", "colorbar": { "ticks": "", "outlinewidth": 0 } } ], "scattergeo": [ { "type": "scattergeo", "marker": { "colorbar": { "ticks": "", "outlinewidth": 0 } } } ], "histogram2d": [ { "type": "histogram2d", "colorbar": { "ticks": "", "outlinewidth": 0 }, "autocolorscale": true } ], "scatterpolar": [ { "type": "scatterpolar", "marker": { "colorbar": { "ticks": "", "outlinewidth": 0 } } } ], "contourcarpet": [ { "type": "contourcarpet", "colorbar": { "ticks": "", "outlinewidth": 0 } } ], "scattercarpet": [ { "type": "scattercarpet", "marker": { "colorbar": { "ticks": "", "outlinewidth": 0 } } } ], "scattermapbox": [ { "type": "scattermapbox", "marker": { "colorbar": { "ticks": "", "outlinewidth": 0 } } } ], "scatterpolargl": [ { "type": "scatterpolargl", "marker": { "colorbar": { "ticks": "", "outlinewidth": 0 } } } ], "scatterternary": [ { "type": "scatterternary", "marker": { "colorbar": { "ticks": "", "outlinewidth": 0 } } } ], "histogram2dcontour": [ { "type": "histogram2dcontour", "colorbar": { "ticks": "", "outlinewidth": 0 }, "autocolorscale": true } ] }, "layout": { "geo": { "bgcolor": "white", "showland": true, "lakecolor": "white", "landcolor": "white", "showlakes": true, "subunitcolor": "#C8D4E3" }, "font": { "color": "#2a3f5f" }, "polar": { "bgcolor": "white", "radialaxis": { "ticks": "", "gridcolor": "#EBF0F8", "linecolor": "#EBF0F8" }, "angularaxis": { "ticks": "", "gridcolor": "#EBF0F8", "linecolor": "#EBF0F8" } }, "scene": { "xaxis": { "ticks": "", "gridcolor": "#DFE8F3", "gridwidth": 2, "linecolor": "#EBF0F8", "zerolinecolor": "#EBF0F8", "showbackground": true, "backgroundcolor": "white" }, "yaxis": { "ticks": "", "gridcolor": "#DFE8F3", "gridwidth": 2, "linecolor": "#EBF0F8", "zerolinecolor": "#EBF0F8", "showbackground": true, "backgroundcolor": "white" }, "zaxis": { "ticks": "", "gridcolor": "#DFE8F3", "gridwidth": 2, "linecolor": "#EBF0F8", "zerolinecolor": "#EBF0F8", "showbackground": true, "backgroundcolor": "white" } }, "title": { "x": 0.05 }, "xaxis": { "ticks": "", "gridcolor": "#EBF0F8", "linecolor": "#EBF0F8", "automargin": true, "zerolinecolor": "#EBF0F8", "zerolinewidth": 2 }, "yaxis": { "ticks": "", "gridcolor": "#EBF0F8", "linecolor": "#EBF0F8", "automargin": true, "zerolinecolor": "#EBF0F8", "zerolinewidth": 2 }, "ternary": { "aaxis": { "ticks": "", "gridcolor": "#DFE8F3", "linecolor": "#A2B1C6" }, "baxis": { "ticks": "", "gridcolor": "#DFE8F3", "linecolor": "#A2B1C6" }, "caxis": { "ticks": "", "gridcolor": "#DFE8F3", "linecolor": "#A2B1C6" }, "bgcolor": "white" }, "colorway": [ "#636efa", "#EF553B", "#00cc96", "#ab63fa", "#19d3f3", "#e763fa", "#fecb52", "#ffa15a", "#ff6692", "#b6e880" ], "hovermode": "closest", "colorscale": { "diverging": [ [ 0, "#8e0152" ], [ 0.1, "#c51b7d" ], [ 0.2, "#de77ae" ], [ 0.3, "#f1b6da" ], [ 0.4, "#fde0ef" ], [ 0.5, "#f7f7f7" ], [ 0.6, "#e6f5d0" ], [ 0.7, "#b8e186" ], [ 0.8, "#7fbc41" ], [ 0.9, "#4d9221" ], [ 1, "#276419" ] ], "sequential": [ [ 0, "#0508b8" ], [ 0.0893854748603352, "#1910d8" ], [ 0.1787709497206704, "#3c19f0" ], [ 0.2681564245810056, "#6b1cfb" ], [ 0.3575418994413408, "#981cfd" ], [ 0.44692737430167595, "#bf1cfd" ], [ 0.5363128491620112, "#dd2bfd" ], [ 0.6256983240223464, "#f246fe" ], [ 0.7150837988826816, "#fc67fd" ], [ 0.8044692737430168, "#fe88fc" ], [ 0.8938547486033519, "#fea5fd" ], [ 0.9832402234636871, "#febefe" ], [ 1, "#fec3fe" ] ], "sequentialminus": [ [ 0, "#0508b8" ], [ 0.0893854748603352, "#1910d8" ], [ 0.1787709497206704, "#3c19f0" ], [ 0.2681564245810056, "#6b1cfb" ], [ 0.3575418994413408, "#981cfd" ], [ 0.44692737430167595, "#bf1cfd" ], [ 0.5363128491620112, "#dd2bfd" ], [ 0.6256983240223464, "#f246fe" ], [ 0.7150837988826816, "#fc67fd" ], [ 0.8044692737430168, "#fe88fc" ], [ 0.8938547486033519, "#fea5fd" ], [ 0.9832402234636871, "#febefe" ], [ 1, "#fec3fe" ] ] }, "plot_bgcolor": "white", "paper_bgcolor": "white", "shapedefaults": { "line": { "width": 0 }, "opacity": 0.4, "fillcolor": "#506784" }, "annotationdefaults": { "arrowhead": 0, "arrowcolor": "#506784", "arrowwidth": 1 } }, "themeRef": "PLOTLY_WHITE" } } }, "height": null, "width": null, "user": { "profile_url": "https://chart-studio.plotly.com/~PUIPUI.COM", "avatar_url": "https://storage.googleapis.com/plotly-prod-profiles/82.jpg", "background_url": "https://storage.googleapis.com/plotly-prod-profiles/bg-8.jpg", "bio": "", "nickname": "", "website": "", "stream_tokens": null, "feature_set_id": null, "csrf_token": null, "date_joined": "2025-09-09 09:46:32", "mapbox_access_tokens": null, "has_password": null, "username": "PUIPUI.COM", "email": null, "is_active": null, "readonly": null, "is_dash_creator": null, "dash_created_count": null, "is_chart_creator": null, "charts_created_count": null } }, { "creation_time": "2025-09-09T09:25:54.789932Z", "comments": { "results": [], "count": 0 }, "parented": true, "embed_url": "https://chart-studio.plotly.com/~singhtinka970/47.embed", "fid": "singhtinka970:47", "filename": "Plot 47", "filetype": "plot", "img_url": "https://storage.googleapis.com/plotly-prod-images/singhtinka970/47/9_OGXWBY8KYZGMGC1CW0MY6XSRCQCGG4.png", "image_urls": { "default": "https://storage.googleapis.com/plotly-prod-images/singhtinka970/47/2_NCINE5AZU2P0YMTGFJMICFYBM5LBL2.png", "block-thumb": "https://storage.googleapis.com/plotly-prod-images/singhtinka970/47/8_ZFRKFLVTFZ2CZPSTFQ6JBZBDFCJLB2.png", "list-thumb": "https://storage.googleapis.com/plotly-prod-images/singhtinka970/47/9_OGXWBY8KYZGMGC1CW0MY6XSRCQCGG4.png" }, "api_urls": { "files": "https://api.plotly.com/v2/files/singhtinka970:47", "plots": "https://api.plotly.com/v2/plots/singhtinka970:47", "parent": "https://api.plotly.com/v2/folders/home?user=singhtinka970" }, "owner": "singhtinka970", "parent": -1, "preview": "", "referencers": [], "references": [], "title": "", "views": 0, "web_url": "https://chart-studio.plotly.com/~singhtinka970/47/", "world_readable": true, "date_modified": "2025-09-09T12:59:13.610Z", "stars": { "results": [], "count": 0 }, "collaborators": { "results": [], "count": 0 }, "subfolder_count": null, "refresh_interval": null, "organize_view_url": "https://chart-studio.plotly.com/~singhtinka970/47/", "current_user_permission": "read", "is_theme": null, "is_template": false, "autosize": true, "caption": "", "figure": { "data": [ { "uid": "252343", "meta": { "columnNames": { "x": "Year", "y": "Jan" } }, "mode": "lines", "name": "<b>Jan</b>", "type": "scatter", "xsrc": "singhtinka970:46:e5ad85", "ysrc": "singhtinka970:46:de24f9" }, { "uid": "034c12", "meta": { "columnNames": { "x": "Year", "y": "Feb" } }, "mode": "lines", "name": "<b>Feb</b>", "type": "scatter", "xsrc": "singhtinka970:46:e5ad85", "ysrc": "singhtinka970:46:5f1194" }, { "uid": "dbda0b", "meta": { "columnNames": { "x": "Year", "y": "Dec" } }, "mode": "lines", "name": "<b>Dec</b>", "type": "scatter", "xsrc": "singhtinka970:46:e5ad85", "ysrc": "singhtinka970:46:c1d650" }, { "uid": "3d67a9", "meta": { "columnNames": { "x": "Year", "y": "Mar" } }, "mode": "lines", "name": "<b>Mar</b>", "type": "scatter", "xsrc": "singhtinka970:46:e5ad85", "ysrc": "singhtinka970:46:e64669", "xaxis": "x2", "yaxis": "y2" }, { "uid": "2945b6", "meta": { "columnNames": { "x": "Year", "y": "Apr" } }, "mode": "lines", "name": "<b>Apr</b>", "type": "scatter", "xsrc": "singhtinka970:46:e5ad85", "ysrc": "singhtinka970:46:c6d622", "xaxis": "x2", "yaxis": "y2" }, { "uid": "ee0891", "meta": { "columnNames": { "x": "Year", "y": "May" } }, "mode": "lines", "name": "<b>May</b>", "type": "scatter", "xsrc": "singhtinka970:46:e5ad85", "ysrc": "singhtinka970:46:658ee5", "xaxis": "x2", "yaxis": "y2" }, { "uid": "534b59", "meta": { "columnNames": { "x": "Year", "y": "Jun" } }, "mode": "lines", "name": "<b>Jun</b>", "type": "scatter", "xsrc": "singhtinka970:46:e5ad85", "ysrc": "singhtinka970:46:64404d", "xaxis": "x3", "yaxis": "y3" }, { "uid": "9d510a", "meta": { "columnNames": { "x": "Year", "y": "Jul" } }, "mode": "lines", "name": "<b>Jul</b>", "type": "scatter", "xsrc": "singhtinka970:46:e5ad85", "ysrc": "singhtinka970:46:691937", "xaxis": "x3", "yaxis": "y3" }, { "uid": "3c8d2d", "meta": { "columnNames": { "x": "Year", "y": "Aug" } }, "mode": "lines", "name": "<b>Aug</b>", "type": "scatter", "xsrc": "singhtinka970:46:e5ad85", "ysrc": "singhtinka970:46:a4b9d5", "xaxis": "x3", "yaxis": "y3" }, { "uid": "d042ac", "meta": { "columnNames": { "x": "Year", "y": "Sep" } }, "mode": "lines", "name": "<b>Sep</b>", "type": "scatter", "xsrc": "singhtinka970:46:e5ad85", "ysrc": "singhtinka970:46:b33ce7", "xaxis": "x4", "yaxis": "y4" }, { "uid": "2b86f0", "meta": { "columnNames": { "x": "Year", "y": "Oct" } }, "mode": "lines", "name": "<b>Oct</b>", "type": "scatter", "xsrc": "singhtinka970:46:e5ad85", "ysrc": "singhtinka970:46:7b2bca", "xaxis": "x4", "yaxis": "y4" }, { "uid": "ef5c58", "meta": { "columnNames": { "x": "Year", "y": "Nov" } }, "mode": "lines", "name": "<b>Nov</b>", "type": "scatter", "xsrc": "singhtinka970:46:e5ad85", "ysrc": "singhtinka970:46:20622a", "xaxis": "x4", "yaxis": "y4" } ], "frames": [], "layout": { "font": { "size": 13, "color": "rgb(7, 0, 0)", "family": "Overpass" }, "title": { "font": { "size": 15, "color": "rgb(24, 1, 1)", "family": "Overpass" }, "text": "<b>Seasonal Analysis for PM</b><sub><b>2.5</b></sub><b> Concentrations</b><br>0 3 6 9 12 15 18 21 22 23 Fall 15 30 45 60 75 Summer 10 20 30 40 50 spring 15 30 45 60 75<br>" }, "xaxis": { "type": "linear", "range": [ 1960, 2040 ], "title": { "font": { "size": 15, "color": "rgb(15, 1, 1)", "family": "Overpass" }, "text": "<b>Hour</b>" }, "domain": [ 0, 0.45 ], "tickfont": { "size": 15, "color": "rgb(24, 1, 1)", "family": "Overpass" }, "autorange": true }, "yaxis": { "type": "linear", "range": [ -4.523888888888889, 105.35388888888889 ], "title": { "font": { "size": 15, "color": "rgb(15, 1, 1)", "family": "Overpass" }, "text": "<b>Winter</b>" }, "domain": [ 0, 0.45 ], "tickfont": { "size": 15, "color": "rgb(24, 1, 1)", "family": "Overpass" }, "autorange": true }, "legend": { "x": 0.1708997080437491, "y": 1.0539138038546723, "orientation": "h" }, "xaxis2": { "type": "linear", "range": [ 1960, 2040 ], "title": { "font": { "size": 15, "color": "rgb(15, 1, 1)", "family": "Overpass" }, "text": "<b>Hour</b>" }, "anchor": "y2", "domain": [ 0.55, 1 ], "tickfont": { "size": 15, "color": "rgb(24, 1, 1)", "family": "Overpass" }, "autorange": true }, "xaxis3": { "type": "linear", "range": [ 1960, 2040 ], "title": { "font": { "size": 15, "color": "rgb(15, 1, 1)", "family": "Overpass" }, "text": "<b>Hour</b>" }, "anchor": "y3", "domain": [ 0.55, 1 ], "tickfont": { "size": 15, "color": "rgb(24, 1, 1)", "family": "Overpass" }, "autorange": true }, "xaxis4": { "type": "linear", "range": [ 1960, 2040 ], "title": { "font": { "size": 15, "color": "rgb(15, 1, 1)", "family": "Overpass" }, "text": "<b>Hour</b>" }, "anchor": "y4", "domain": [ 0, 0.45 ], "tickfont": { "size": 15, "color": "rgb(24, 1, 1)", "family": "Overpass" }, "autorange": true }, "yaxis2": { "type": "linear", "range": [ -4.305, 104.995 ], "title": { "font": { "size": 15, "color": "rgb(15, 1, 1)", "family": "Overpass" }, "text": "<b>Spring</b>" }, "anchor": "x2", "domain": [ 0, 0.45 ], "tickfont": { "size": 15, "color": "rgb(24, 1, 1)", "family": "Overpass" }, "autorange": true }, "yaxis3": { "type": "linear", "range": [ -5.408333333333333, 104.15833333333335 ], "title": { "font": { "size": 15, "color": "rgb(15, 1, 1)", "family": "Overpass" }, "text": "<b>Summer</b>" }, "anchor": "x3", "domain": [ 0.55, 1 ], "tickfont": { "size": 15, "color": "rgb(24, 1, 1)", "family": "Overpass" }, "autorange": true }, "yaxis4": { "type": "linear", "range": [ -4.942777777777778, 105.11277777777778 ], "title": { "font": { "size": 15, "color": "rgb(15, 1, 1)", "family": "Overpass" }, "text": "<b>Fall</b>" }, "anchor": "x4", "domain": [ 0.55, 1 ], "tickfont": { "size": 15, "color": "rgb(24, 1, 1)", "family": "Overpass" }, "autorange": true }, "autosize": true, "hovermode": "closest", "showlegend": true } }, "height": null, "width": null, "user": { "profile_url": "https://chart-studio.plotly.com/~singhtinka970", "avatar_url": "https://storage.googleapis.com/plotly-prod-profiles/62.jpg", "background_url": "https://storage.googleapis.com/plotly-prod-profiles/bg-14.jpg", "bio": "", "nickname": "", "website": "", "stream_tokens": null, "feature_set_id": null, "csrf_token": null, "date_joined": "2025-09-05 08:50:37", "mapbox_access_tokens": null, "has_password": null, "username": "singhtinka970", "email": null, "is_active": null, "readonly": null, "is_dash_creator": null, "dash_created_count": null, "is_chart_creator": null, "charts_created_count": null } }, { "creation_time": "2025-09-09T09:25:36.700029Z", "comments": { "results": [], "count": 0 }, "parented": true, "embed_url": "https://chart-studio.plotly.com/~priyanka1620/1.embed", "fid": "priyanka1620:1", "filename": "Plot 1", "filetype": "plot", "img_url": "https://storage.googleapis.com/plotly-prod-images/priyanka1620/1/9_A9UI2Q6PI2H58603Q4S48RVDX2JJ5P.png", "image_urls": { "default": "https://storage.googleapis.com/plotly-prod-images/priyanka1620/1/2_634D156FM9XM7OETFI5WU3HE2QYBVJ.png", "block-thumb": "https://storage.googleapis.com/plotly-prod-images/priyanka1620/1/8_2WVNMLZR1RUSEEWMFZPOSM9JCELE2M.png", "list-thumb": "https://storage.googleapis.com/plotly-prod-images/priyanka1620/1/9_A9UI2Q6PI2H58603Q4S48RVDX2JJ5P.png" }, "api_urls": { "files": "https://api.plotly.com/v2/files/priyanka1620:1", "plots": "https://api.plotly.com/v2/plots/priyanka1620:1", "parent": "https://api.plotly.com/v2/folders/home?user=priyanka1620" }, "owner": "priyanka1620", "parent": -1, "preview": "", "referencers": [], "references": [], "title": "", "views": 0, "web_url": "https://chart-studio.plotly.com/~priyanka1620/1/", "world_readable": true, "date_modified": "2025-09-09T09:25:36.715Z", "stars": { "results": [], "count": 0 }, "collaborators": { "results": [], "count": 0 }, "subfolder_count": null, "refresh_interval": null, "organize_view_url": "https://chart-studio.plotly.com/~priyanka1620/1/", "current_user_permission": "read", "is_theme": null, "is_template": false, "autosize": true, "caption": "", "figure": { "data": [ { "meta": { "columnNames": { "x": "x", "y": "y" } }, "mode": "lines", "type": "scatter", "xsrc": "priyanka1620:0:b0d6d3", "ysrc": "priyanka1620:0:67ebcd" } ], "frames": [], "layout": { "title": { "text": "Click to enter Plot title" }, "xaxis": { "type": "linear", "range": [ 0.006032110963328896, 0.9959711191335741 ], "autorange": true }, "yaxis": { "type": "linear", "range": [ 0.2329287252368648, 0.8295480189491817 ], "autorange": true }, "autosize": true } }, "height": null, "width": null, "user": { "profile_url": "https://chart-studio.plotly.com/~priyanka1620", "avatar_url": "https://storage.googleapis.com/plotly-prod-profiles/53.jpg", "background_url": "https://storage.googleapis.com/plotly-prod-profiles/bg-11.jpg", "bio": "", "nickname": "", "website": "", "stream_tokens": null, "feature_set_id": null, "csrf_token": null, "date_joined": "2025-09-09 09:24:27", "mapbox_access_tokens": null, "has_password": null, "username": "priyanka1620", "email": null, "is_active": null, "readonly": null, "is_dash_creator": null, "dash_created_count": null, "is_chart_creator": null, "charts_created_count": null } }, { "creation_time": "2025-09-09T08:59:16.735721Z", "comments": { "results": [], "count": 0 }, "parented": true, "embed_url": "https://chart-studio.plotly.com/~singhtinka970/45.embed", "fid": "singhtinka970:45", "filename": "Plot 45", "filetype": "plot", "img_url": "https://api.plotly.com/v2/files/singhtinka970:45/image?image_name=list-thumb", "image_urls": { "default": "https://storage.googleapis.com/plotly-prod-images/singhtinka970/45/2_PIPK8GZKO4CUOKTXPD59XLZWFHNQOI.png", "block-thumb": "https://storage.googleapis.com/plotly-prod-images/singhtinka970/45/8_YF2ZBW469YNEF2OTHUVATFT5UNWUJZ.png", "list-thumb": "https://api.plotly.com/v2/files/singhtinka970:45/image?image_name=list-thumb" }, "api_urls": { "files": "https://api.plotly.com/v2/files/singhtinka970:45", "plots": "https://api.plotly.com/v2/plots/singhtinka970:45", "parent": "https://api.plotly.com/v2/folders/home?user=singhtinka970" }, "owner": "singhtinka970", "parent": -1, "preview": "", "referencers": [], "references": [], "title": "", "views": 0, "web_url": "https://chart-studio.plotly.com/~singhtinka970/45/", "world_readable": true, "date_modified": "2025-09-09T10:04:54.589Z", "stars": { "results": [], "count": 0 }, "collaborators": { "results": [], "count": 0 }, "subfolder_count": null, "refresh_interval": null, "organize_view_url": "https://chart-studio.plotly.com/~singhtinka970/45/", "current_user_permission": "read", "is_theme": null, "is_template": false, "autosize": true, "caption": "", "figure": { "data": [ { "uid": "252343", "meta": { "columnNames": { "x": "Year", "y": "Jan" } }, "mode": "lines", "name": "Jan", "type": "scatter", "xsrc": "singhtinka970:44:60e68d", "ysrc": "singhtinka970:44:3e826a" }, { "uid": "034c12", "meta": { "columnNames": { "x": "Year", "y": "Feb" } }, "mode": "lines", "name": "Feb", "type": "scatter", "xsrc": "singhtinka970:44:60e68d", "ysrc": "singhtinka970:44:cff4f3" }, { "uid": "dbda0b", "meta": { "columnNames": { "x": "Year", "y": "Dec" } }, "mode": "lines", "name": "Dec", "type": "scatter", "xsrc": "singhtinka970:44:60e68d", "ysrc": "singhtinka970:44:9f77d8" }, { "uid": "3d67a9", "meta": { "columnNames": { "x": "Year", "y": "Mar" } }, "mode": "lines", "name": "Mar", "type": "scatter", "xsrc": "singhtinka970:44:60e68d", "ysrc": "singhtinka970:44:3056ad", "xaxis": "x2", "yaxis": "y2" }, { "uid": "2945b6", "meta": { "columnNames": { "x": "Year", "y": "Apr" } }, "mode": "lines", "name": "Apr", "type": "scatter", "xsrc": "singhtinka970:44:60e68d", "ysrc": "singhtinka970:44:711ec4", "xaxis": "x2", "yaxis": "y2" }, { "uid": "ee0891", "meta": { "columnNames": { "x": "Year", "y": "May" } }, "mode": "lines", "name": "May", "type": "scatter", "xsrc": "singhtinka970:44:60e68d", "ysrc": "singhtinka970:44:6378e0", "xaxis": "x2", "yaxis": "y2" }, { "uid": "534b59", "meta": { "columnNames": { "x": "Year", "y": "Jun" } }, "mode": "lines", "name": "Jun", "type": "scatter", "xsrc": "singhtinka970:44:60e68d", "ysrc": "singhtinka970:44:e42145", "xaxis": "x3", "yaxis": "y3" }, { "uid": "9d510a", "meta": { "columnNames": { "x": "Year", "y": "Jul" } }, "mode": "lines", "name": "Jul", "type": "scatter", "xsrc": "singhtinka970:44:60e68d", "ysrc": "singhtinka970:44:311450", "xaxis": "x3", "yaxis": "y3" }, { "uid": "3c8d2d", "meta": { "columnNames": { "x": "Year", "y": "Aug" } }, "mode": "lines", "name": "Aug", "type": "scatter", "xsrc": "singhtinka970:44:60e68d", "ysrc": "singhtinka970:44:cb18a7", "xaxis": "x3", "yaxis": "y3" }, { "uid": "d042ac", "meta": { "columnNames": { "x": "Year", "y": "Sep" } }, "mode": "lines", "name": "Sep", "type": "scatter", "xsrc": "singhtinka970:44:60e68d", "ysrc": "singhtinka970:44:4bf348", "xaxis": "x4", "yaxis": "y4" }, { "uid": "2b86f0", "meta": { "columnNames": { "x": "Year", "y": "Oct" } }, "mode": "lines", "name": "Oct", "type": "scatter", "xsrc": "singhtinka970:44:60e68d", "ysrc": "singhtinka970:44:df1eef", "xaxis": "x4", "yaxis": "y4" }, { "uid": "ef5c58", "meta": { "columnNames": { "x": "Year", "y": "Nov" } }, "mode": "lines", "name": "Nov", "type": "scatter", "xsrc": "singhtinka970:44:60e68d", "ysrc": "singhtinka970:44:bc00f1", "xaxis": "x4", "yaxis": "y4" } ], "frames": [], "layout": { "title": { "font": { "size": 15, "color": "rgb(34, 3, 3)", "family": "Overpass" }, "text": "<b>PM 2.5 concentrations by Season (1960-2024)</b><br>Fall 20 30 40 50 Summer 20 25 20 35 Winter 20 50 80 110 Spring 20 30 40 50" }, "xaxis": { "type": "linear", "range": [ 1880, 2017 ], "title": { "font": { "size": 16, "color": "rgb(15, 1, 1)", "family": "Overpass" }, "text": "<b>Year</b>" }, "domain": [ 0, 0.45 ], "tickfont": { "size": 15, "color": "rgb(16, 1, 1)", "family": "Overpass" }, "zeroline": false, "autorange": true }, "yaxis": { "type": "linear", "range": [ -0.93, 1.4700000000000002 ], "title": { "font": { "size": 16, "color": "rgb(15, 1, 1)", "family": "Overpass" }, "text": "<b>Winter</b>" }, "domain": [ 0, 0.45 ], "tickfont": { "size": 15, "color": "rgb(16, 1, 1)", "family": "Overpass" }, "zeroline": false, "autorange": true }, "legend": { "x": 0.17298219319073, "y": 1.064079515632426, "orientation": "h" }, "xaxis2": { "type": "linear", "range": [ 1880, 2017 ], "title": { "font": { "size": 16, "color": "rgb(15, 1, 1)", "family": "Overpass" }, "text": "<b>Year</b>" }, "anchor": "y2", "domain": [ 0.55, 1 ], "tickfont": { "size": 15, "color": "rgb(16, 1, 1)", "family": "Overpass" }, "zeroline": false, "autorange": true }, "xaxis3": { "type": "linear", "range": [ 1880, 2017 ], "title": { "font": { "size": 16, "color": "rgb(15, 1, 1)", "family": "Overpass" }, "text": "<b>Year</b>" }, "anchor": "y3", "domain": [ 0.55, 1 ], "tickfont": { "size": 15, "color": "rgb(16, 1, 1)", "family": "Overpass" }, "zeroline": false, "autorange": true }, "xaxis4": { "type": "linear", "range": [ 1880, 2017 ], "title": { "font": { "size": 16, "color": "rgb(15, 1, 1)", "family": "Overpass" }, "text": "<b>Year</b>" }, "anchor": "y4", "domain": [ 0, 0.45 ], "tickfont": { "size": 15, "color": "rgb(16, 1, 1)", "family": "Overpass" }, "zeroline": false, "autorange": true }, "yaxis2": { "type": "linear", "range": [ -0.7172222222222222, 1.4272222222222224 ], "title": { "font": { "size": 16, "color": "rgb(23, 1, 1)", "family": "Overpass" }, "text": "<b>Spring</b>" }, "anchor": "x2", "domain": [ 0, 0.45 ], "tickfont": { "size": 15, "color": "rgb(16, 1, 1)", "family": "Overpass" }, "zeroline": false, "autorange": true }, "yaxis3": { "type": "linear", "range": [ -0.6461111111111112, 1.076111111111111 ], "title": { "font": { "size": 16, "color": "rgb(15, 1, 1)", "family": "Overpass" }, "text": "<b>Summer</b>" }, "anchor": "x3", "domain": [ 0.55, 1 ], "tickfont": { "size": 15, "color": "rgb(16, 1, 1)", "family": "Overpass" }, "zeroline": false, "autorange": true }, "yaxis4": { "type": "linear", "range": [ -0.6716666666666666, 1.1616666666666666 ], "title": { "font": { "size": 16, "color": "rgb(15, 1, 1)", "family": "Overpass" }, "text": "<b>Fall</b>" }, "anchor": "x4", "domain": [ 0.55, 1 ], "tickfont": { "size": 15, "color": "rgb(16, 1, 1)", "family": "Overpass" }, "zeroline": false, "autorange": true }, "autosize": true, "hovermode": "closest", "showlegend": true } }, "height": null, "width": null, "user": { "profile_url": "https://chart-studio.plotly.com/~singhtinka970", "avatar_url": "https://storage.googleapis.com/plotly-prod-profiles/62.jpg", "background_url": "https://storage.googleapis.com/plotly-prod-profiles/bg-14.jpg", "bio": "", "nickname": "", "website": "", "stream_tokens": null, "feature_set_id": null, "csrf_token": null, "date_joined": "2025-09-05 08:50:37", "mapbox_access_tokens": null, "has_password": null, "username": "singhtinka970", "email": null, "is_active": null, "readonly": null, "is_dash_creator": null, "dash_created_count": null, "is_chart_creator": null, "charts_created_count": null } } ] }
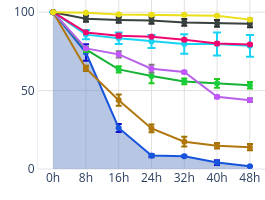
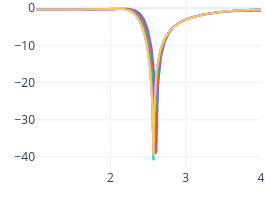