Plots List
Plots
This endpoint handles manipulation of Plotly plot files.
Reference
Authorization
Any user with or without a Plotly account may view public plots. For private plots, see authentication.
Actions
list
Listing all public plots can be done via a GET request to this endpoint.
By default, plots will be listed in order of date created. The order_by
query parameter is accepted at this endpoint. Currently, only ordering by
views is supported. It is possible to filter the plots by quality
with min_quality or max_quality as query parameter.
Example:
// GET https://api.plotly.com/v2/plots/ ---> 200

// GET https://api.plotly.com/v2/plots/?order_by=-views ---> 200

// GET https://api.plotly.com/v2/plots/?min_quality=5 ---> 200

// GET https://api.plotly.com/v2/plots/?max_quality=5 ---> 200
feed
Listing all handpicked feed plots can be done via a GET request to this endpoint. By default, plots will be listed in a random order.
Example:
// GET https://api.plotly.com/v2/plots/feed ---> 200
create
You can create new plot resources here. The only required field is 'figure'. Currently, the figure is restricted to only contain references to grid data. That is, this will fail if raw data arrays are passed in. To create and manipulate underlying grids for plots, see the grids endpoint.
Example:
// This fails because a figure field is required.
// POST https://api.plotly.com/v2/plots ---> 400 Bad Request
{}

// This fails because the figure has raw data
//POST https://api.plotly.com/v2/plots ---> 400 Bad Request
{
    "figure": {"data": [{"y": ['this', 'is', 'raw', 'data']}]}
}

// This succeeds because the figure has src keys, not raw data.
//POST https://api.plotly.com/v2/plots ---> 200 OK
{
    "figure": {"data": [{"ysrc": "sven:88:u8nd62"}]}
}
When creating a grid, you can optionally specify a source_fid to specify where a plot has come from:
- source_fid: the fid of a plot that was copied (and presumably edited) to produce this one
detail
There is a lot of meta information stored about plot files including filename, title, share_url, and content_url to name a few.
This information can only be reached with a GET to this endpoint.
Example:
// GET https://api.plotly.com/v2/plots/iheartgraphs:90
content
The contents of a plot can be downloaded via the content resource. The plot
content contains referenced grid/column data by default. If you wish to
return the raw grid/column data, the inline_data=true query must be included
in the request url. The Content-Type header will be appropriately set for the
response body.
Alternatively, you can set ?map_data=unreadable to append a mapping of
sources to data that belongs to grids which are unreadable for the
requestor. This is useful when you have read access to another users plot,
but that plot contains grid references which you don't have access to.
Examples:
// Returns referenced grid/column data
// GET https://api.plotly.com/v2/plots/iheartgraphs:90/content ---> 200 OK

// Returns full grid/column data
// GET https://api.plotly.com/v2/plots/iheartgraphs:90/content?inline_data=true ---> 200 OK

// Returns full grid/column data when requestor doesn't have permission
// to read the referenced grid.
// GET https://api.plotly.com/v2/plots/iheartgraphs:90/content?map_data=unreadable ---> 200 OK
GET /v2/plots/?cursor=cD0yMDI1LTA5LTAyKzE3JTNBMzQlM0EyNC45NzY2MzglMkIwMCUzQTAw&format=api
{ "next": "https://api.plotly.com/v2/plots/?cursor=cD0yMDI1LTA5LTAyKzEzJTNBMjIlM0EyMS42Nzk1NDMlMkIwMCUzQTAw&format=api", "previous": "https://api.plotly.com/v2/plots/?cursor=cj0xJnA9MjAyNS0wOS0wMisxNiUzQTQ5JTNBMjguMzg5ODExJTJCMDAlM0EwMA%3D%3D&format=api", "results": [ { "creation_time": "2025-09-02T16:49:28.389811Z", "comments": { "results": [], "count": 0 }, "parented": true, "embed_url": "https://chart-studio.plotly.com/~ThadLee/242.embed", "fid": "ThadLee:242", "filename": "Plot 242", "filetype": "plot", "img_url": "https://storage.googleapis.com/plotly-prod-images/ThadLee/242/9_1L9ZVL1COY02HLPV3AODCWBHF217P0.png", "image_urls": { "default": "https://storage.googleapis.com/plotly-prod-images/ThadLee/242/2_PF80NNYJAFM6T23FO7B8VE6SHQLWBG.png", "block-thumb": "https://storage.googleapis.com/plotly-prod-images/ThadLee/242/8_L8RY09R2JKHK96LU4WCGRM5JNGORR0.png", "list-thumb": "https://storage.googleapis.com/plotly-prod-images/ThadLee/242/9_1L9ZVL1COY02HLPV3AODCWBHF217P0.png" }, "api_urls": { "files": "https://api.plotly.com/v2/files/ThadLee:242", "plots": "https://api.plotly.com/v2/plots/ThadLee:242", "parent": "https://api.plotly.com/v2/folders/home?user=ThadLee" }, "owner": "ThadLee", "parent": -1, "preview": "", "referencers": [], "references": [], "title": "", "views": 0, "web_url": "https://chart-studio.plotly.com/~ThadLee/242/", "world_readable": true, "date_modified": "2025-09-03T07:11:52.356Z", "stars": { "results": [], "count": 0 }, "collaborators": { "results": [], "count": 0 }, "subfolder_count": null, "refresh_interval": null, "organize_view_url": "https://chart-studio.plotly.com/~ThadLee/242/", "current_user_permission": "read", "is_theme": null, "is_template": false, "autosize": true, "caption": "", "figure": { "data": [ { "meta": { "columnNames": { "x": "A", "y": "B" } }, "mode": "lines", "name": "TiO<sub>2</sub> pure", "type": "scatter", "xsrc": "ThadLee:241:74d930", "ysrc": "ThadLee:241:75e5ca" }, { "meta": { "columnNames": { "x": "A", "y": "C" } }, "mode": "lines", "name": "TiO<sub>2</sub>/GA(0%)", "type": "scatter", "xsrc": "ThadLee:241:74d930", "ysrc": "ThadLee:241:8c7c19", "yaxis": "y2", "stackgroup": null }, { "meta": { "columnNames": { "x": "A", "y": "D" } }, "mode": "lines", "name": "TiO<sub>2</sub>/GA(2%)", "type": "scatter", "xsrc": "ThadLee:241:74d930", "ysrc": "ThadLee:241:0562ea", "yaxis": "y3", "stackgroup": null }, { "meta": { "columnNames": { "x": "A", "y": "E" } }, "mode": "lines", "name": "TiO<sub>2</sub>/GA(3%)", "type": "scatter", "xsrc": "ThadLee:241:74d930", "ysrc": "ThadLee:241:1cee53", "yaxis": "y4", "stackgroup": null }, { "meta": { "columnNames": { "x": "A", "y": "F" } }, "mode": "lines", "name": "TiO<sub>2</sub>/GA(4%)", "type": "scatter", "xsrc": "ThadLee:241:74d930", "ysrc": "ThadLee:241:77fc2d", "yaxis": "y5", "stackgroup": null } ], "frames": [], "layout": { "xaxis": { "type": "linear", "range": [ 4.95260663507109, 85.04739336492891 ], "ticks": "outside", "title": { "font": { "size": 20 }, "text": "Degree (2θ)" }, "domain": [ 0, 1 ], "mirror": false, "nticks": 12, "ticklen": 5, "showgrid": false, "showline": true, "tickfont": { "size": 16 }, "tickmode": "auto", "autorange": true, "linecolor": "rgb(0, 4, 11)", "tickwidth": 1, "zerolinecolor": "rgb(0, 1, 3)", "zerolinewidth": 1, "showticklabels": true }, "yaxis": { "type": "linear", "range": [ 0, 1042.888888888889 ], "title": { "text": " " }, "domain": [ 0, 0.2 ], "mirror": "ticks", "showgrid": false, "showline": true, "autorange": false, "linecolor": "rgb(0, 4, 11)", "zerolinecolor": "rgb(0, 1, 3)", "zerolinewidth": 1, "showticklabels": false }, "shapes": [ { "x0": 5, "x1": 85, "y0": 1, "y1": 1, "line": { "dash": "solid", "color": "rgb(8, 8, 8)", "width": 1 }, "type": "line", "yref": "paper", "opacity": 1, "fillcolor": "rgb(12, 12, 12)" } ], "yaxis2": { "side": "left", "type": "linear", "range": [ 0, 1042.888888888889 ], "title": { "text": " " }, "domain": [ 0.2, 0.4 ], "mirror": "ticks", "showgrid": false, "showline": true, "autorange": false, "linecolor": "rgb(0, 4, 11)", "overlaying": false, "zerolinecolor": "rgb(0, 1, 3)", "zerolinewidth": 1, "showticklabels": false }, "yaxis3": { "side": "left", "type": "linear", "range": [ 0, 1068.111111111111 ], "title": { "font": { "size": 20 }, "text": "Intensity (a.u.)" }, "domain": [ 0.4, 0.6 ], "mirror": "ticks", "showgrid": false, "showline": true, "autorange": false, "linecolor": "rgb(0, 4, 11)", "overlaying": false, "zerolinecolor": "rgb(0, 1, 3)", "zerolinewidth": 1, "showticklabels": false }, "yaxis4": { "side": "left", "type": "linear", "range": [ 0, 1051.2222222222222 ], "title": { "text": " " }, "domain": [ 0.6, 0.8 ], "mirror": "ticks", "showgrid": false, "showline": true, "autorange": false, "linecolor": "rgb(0, 4, 11)", "overlaying": false, "zerolinecolor": "rgb(0, 1, 3)", "zerolinewidth": 1, "showticklabels": false }, "yaxis5": { "side": "left", "type": "linear", "range": [ 0, 1108.2222222222222 ], "title": { "text": " " }, "domain": [ 0.8, 1 ], "mirror": "ticks", "showgrid": false, "showline": true, "autorange": false, "linecolor": "rgb(0, 4, 11)", "overlaying": false, "zerolinecolor": "rgb(0, 1, 3)", "zerolinewidth": 1, "showticklabels": false }, "autosize": true, "template": { "data": { "bar": [ { "type": "bar", "marker": { "colorbar": { "ticks": "", "outlinewidth": 0 } } } ], "table": [ { "type": "table", "cells": { "fill": { "color": "#EBF0F8" }, "line": { "color": "white" } }, "header": { "fill": { "color": "#C8D4E3" }, "line": { "color": "white" } } } ], "carpet": [ { "type": "carpet", "aaxis": { "gridcolor": "#C8D4E3", "linecolor": "#C8D4E3", "endlinecolor": "#2a3f5f", "minorgridcolor": "#C8D4E3", "startlinecolor": "#2a3f5f" }, "baxis": { "gridcolor": "#C8D4E3", "linecolor": "#C8D4E3", "endlinecolor": "#2a3f5f", "minorgridcolor": "#C8D4E3", "startlinecolor": "#2a3f5f" } } ], "mesh3d": [ { "type": "mesh3d", "colorbar": { "ticks": "", "outlinewidth": 0 } } ], "contour": [ { "type": "contour", "colorbar": { "ticks": "", "outlinewidth": 0 }, "autocolorscale": true } ], "heatmap": [ { "type": "heatmap", "colorbar": { "ticks": "", "outlinewidth": 0 }, "autocolorscale": true } ], "scatter": [ { "type": "scatter", "marker": { "colorbar": { "ticks": "", "outlinewidth": 0 } } } ], "surface": [ { "type": "surface", "colorbar": { "ticks": "", "outlinewidth": 0 } } ], "heatmapgl": [ { "type": "heatmapgl", "colorbar": { "ticks": "", "outlinewidth": 0 } } ], "histogram": [ { "type": "histogram", "marker": { "colorbar": { "ticks": "", "outlinewidth": 0 } } } ], "parcoords": [ { "line": { "colorbar": { "ticks": "", "outlinewidth": 0 } }, "type": "parcoords" } ], "scatter3d": [ { "type": "scatter3d", "marker": { "colorbar": { "ticks": "", "outlinewidth": 0 } } } ], "scattergl": [ { "type": "scattergl", "marker": { "colorbar": { "ticks": "", "outlinewidth": 0 } } } ], "choropleth": [ { "type": "choropleth", "colorbar": { "ticks": "", "outlinewidth": 0 } } ], "scattergeo": [ { "type": "scattergeo", "marker": { "colorbar": { "ticks": "", "outlinewidth": 0 } } } ], "histogram2d": [ { "type": "histogram2d", "colorbar": { "ticks": "", "outlinewidth": 0 }, "autocolorscale": true } ], "scatterpolar": [ { "type": "scatterpolar", "marker": { "colorbar": { "ticks": "", "outlinewidth": 0 } } } ], "contourcarpet": [ { "type": "contourcarpet", "colorbar": { "ticks": "", "outlinewidth": 0 } } ], "scattercarpet": [ { "type": "scattercarpet", "marker": { "colorbar": { "ticks": "", "outlinewidth": 0 } } } ], "scattermapbox": [ { "type": "scattermapbox", "marker": { "colorbar": { "ticks": "", "outlinewidth": 0 } } } ], "scatterpolargl": [ { "type": "scatterpolargl", "marker": { "colorbar": { "ticks": "", "outlinewidth": 0 } } } ], "scatterternary": [ { "type": "scatterternary", "marker": { "colorbar": { "ticks": "", "outlinewidth": 0 } } } ], "histogram2dcontour": [ { "type": "histogram2dcontour", "colorbar": { "ticks": "", "outlinewidth": 0 }, "autocolorscale": true } ] }, "layout": { "geo": { "bgcolor": "white", "showland": true, "lakecolor": "white", "landcolor": "white", "showlakes": true, "subunitcolor": "#C8D4E3" }, "font": { "color": "#2a3f5f" }, "polar": { "bgcolor": "white", "radialaxis": { "ticks": "", "gridcolor": "#EBF0F8", "linecolor": "#EBF0F8" }, "angularaxis": { "ticks": "", "gridcolor": "#EBF0F8", "linecolor": "#EBF0F8" } }, "scene": { "xaxis": { "ticks": "", "gridcolor": "#DFE8F3", "gridwidth": 2, "linecolor": "#EBF0F8", "zerolinecolor": "#EBF0F8", "showbackground": true, "backgroundcolor": "white" }, "yaxis": { "ticks": "", "gridcolor": "#DFE8F3", "gridwidth": 2, "linecolor": "#EBF0F8", "zerolinecolor": "#EBF0F8", "showbackground": true, "backgroundcolor": "white" }, "zaxis": { "ticks": "", "gridcolor": "#DFE8F3", "gridwidth": 2, "linecolor": "#EBF0F8", "zerolinecolor": "#EBF0F8", "showbackground": true, "backgroundcolor": "white" } }, "title": { "x": 0.05 }, "xaxis": { "ticks": "", "gridcolor": "#EBF0F8", "linecolor": "#EBF0F8", "automargin": true, "zerolinecolor": "#EBF0F8", "zerolinewidth": 2 }, "yaxis": { "ticks": "", "gridcolor": "#EBF0F8", "linecolor": "#EBF0F8", "automargin": true, "zerolinecolor": "#EBF0F8", "zerolinewidth": 2 }, "ternary": { "aaxis": { "ticks": "", "gridcolor": "#DFE8F3", "linecolor": "#A2B1C6" }, "baxis": { "ticks": "", "gridcolor": "#DFE8F3", "linecolor": "#A2B1C6" }, "caxis": { "ticks": "", "gridcolor": "#DFE8F3", "linecolor": "#A2B1C6" }, "bgcolor": "white" }, "colorway": [ "#636efa", "#EF553B", "#00cc96", "#ab63fa", "#19d3f3", "#e763fa", "#fecb52", "#ffa15a", "#ff6692", "#b6e880" ], "hovermode": "closest", "colorscale": { "diverging": [ [ 0, "#8e0152" ], [ 0.1, "#c51b7d" ], [ 0.2, "#de77ae" ], [ 0.3, "#f1b6da" ], [ 0.4, "#fde0ef" ], [ 0.5, "#f7f7f7" ], [ 0.6, "#e6f5d0" ], [ 0.7, "#b8e186" ], [ 0.8, "#7fbc41" ], [ 0.9, "#4d9221" ], [ 1, "#276419" ] ], "sequential": [ [ 0, "#0508b8" ], [ 0.0893854748603352, "#1910d8" ], [ 0.1787709497206704, "#3c19f0" ], [ 0.2681564245810056, "#6b1cfb" ], [ 0.3575418994413408, "#981cfd" ], [ 0.44692737430167595, "#bf1cfd" ], [ 0.5363128491620112, "#dd2bfd" ], [ 0.6256983240223464, "#f246fe" ], [ 0.7150837988826816, "#fc67fd" ], [ 0.8044692737430168, "#fe88fc" ], [ 0.8938547486033519, "#fea5fd" ], [ 0.9832402234636871, "#febefe" ], [ 1, "#fec3fe" ] ], "sequentialminus": [ [ 0, "#0508b8" ], [ 0.0893854748603352, "#1910d8" ], [ 0.1787709497206704, "#3c19f0" ], [ 0.2681564245810056, "#6b1cfb" ], [ 0.3575418994413408, "#981cfd" ], [ 0.44692737430167595, "#bf1cfd" ], [ 0.5363128491620112, "#dd2bfd" ], [ 0.6256983240223464, "#f246fe" ], [ 0.7150837988826816, "#fc67fd" ], [ 0.8044692737430168, "#fe88fc" ], [ 0.8938547486033519, "#fea5fd" ], [ 0.9832402234636871, "#febefe" ], [ 1, "#fec3fe" ] ] }, "plot_bgcolor": "white", "paper_bgcolor": "white", "shapedefaults": { "line": { "width": 0 }, "opacity": 0.4, "fillcolor": "#506784" }, "annotationdefaults": { "arrowhead": 0, "arrowcolor": "#506784", "arrowwidth": 1 } }, "themeRef": "PLOTLY_WHITE" }, "annotations": [ { "x": 23.473142857142857, "y": 0.1960784313725489, "text": "(101)", "yref": "paper", "yanchor": "top", "showarrow": false }, { "x": 35.803200000000004, "y": 0.00849673202614376, "text": "(103)", "yref": "paper", "showarrow": false }, { "x": 37.7104, "y": 0.05228758169934633, "text": "(004)", "yref": "paper", "showarrow": false }, { "x": 39.79405714285714, "y": 0.014379084967320321, "text": "(112)", "yref": "paper", "showarrow": false }, { "x": 47.960457142857145, "y": 0.06339869281045751, "text": "(200)", "yref": "paper", "showarrow": false }, { "x": 52.862857142857145, "y": 0.02614379084967311, "text": "(105)", "yref": "paper", "showarrow": false }, { "x": 55.69714285714286, "y": 0.02941176470588225, "text": "(211)", "yref": "paper", "showarrow": false }, { "x": 62.55428571428571, "y": 0.02614379084967311, "text": "(118)", "yref": "paper", "showarrow": false }, { "x": 67.58285714285714, "y": 0.022875816993464082, "text": "(116)", "yref": "paper", "showarrow": false }, { "x": 71.05714285714286, "y": 0.019607843137254943, "text": "(220)", "yref": "paper", "showarrow": false }, { "x": 74.89714285714285, "y": 0.022875816993464082, "text": "(215)", "yref": "paper", "showarrow": false }, { "x": 82.66857142857143, "y": 0.019607843137254832, "text": "(224)", "yref": "paper", "showarrow": false } ] } }, "height": null, "width": null, "user": { "profile_url": "https://chart-studio.plotly.com/~ThadLee", "avatar_url": "https://storage.googleapis.com/plotly-prod-profiles/14.jpg", "background_url": "https://storage.googleapis.com/plotly-prod-profiles/bg-7.jpg", "bio": "", "nickname": "", "website": "", "stream_tokens": null, "feature_set_id": null, "csrf_token": null, "date_joined": "2023-08-26 05:56:46", "mapbox_access_tokens": null, "has_password": null, "username": "ThadLee", "email": null, "is_active": null, "readonly": null, "is_dash_creator": null, "dash_created_count": null, "is_chart_creator": null, "charts_created_count": null } }, { "creation_time": "2025-09-02T16:43:37.313817Z", "comments": { "results": [], "count": 0 }, "parented": true, "embed_url": "https://chart-studio.plotly.com/~ASCIVOLETTO/105.embed", "fid": "ASCIVOLETTO:105", "filename": "KSPMEPLOTEVOLV2", "filetype": "plot", "img_url": "https://storage.googleapis.com/plotly-prod-images/ASCIVOLETTO/105/9_WQN77ZJRHMPPE10S6YVS4NKFR6XARY.png", "image_urls": { "default": "https://storage.googleapis.com/plotly-prod-images/ASCIVOLETTO/105/2_GKS89GTSSPXXN21482H5LXZNGR7R9S.png", "block-thumb": "https://storage.googleapis.com/plotly-prod-images/ASCIVOLETTO/105/8_T0D5TV7V937VLINMEP8JDRJTBIYAQ7.png", "list-thumb": "https://storage.googleapis.com/plotly-prod-images/ASCIVOLETTO/105/9_WQN77ZJRHMPPE10S6YVS4NKFR6XARY.png" }, "api_urls": { "files": "https://api.plotly.com/v2/files/ASCIVOLETTO:105", "plots": "https://api.plotly.com/v2/plots/ASCIVOLETTO:105", "parent": "https://api.plotly.com/v2/folders/home?user=ASCIVOLETTO" }, "owner": "ASCIVOLETTO", "parent": -1, "preview": "", "referencers": [], "references": [], "title": "", "views": 0, "web_url": "https://chart-studio.plotly.com/~ASCIVOLETTO/105/", "world_readable": true, "date_modified": "2025-09-02T17:07:29.083Z", "stars": { "results": [], "count": 0 }, "collaborators": { "results": [], "count": 0 }, "subfolder_count": null, "refresh_interval": null, "organize_view_url": "https://chart-studio.plotly.com/~ASCIVOLETTO/105/", "current_user_permission": "read", "is_theme": null, "is_template": false, "autosize": true, "caption": "", "figure": { "data": [ { "meta": { "columnNames": { "x": "A", "y": "C" } }, "mode": "markers", "name": "Low DP Var. Y4Y6", "type": "scatter", "xsrc": "ASCIVOLETTO:104:bd5397", "ysrc": "ASCIVOLETTO:104:4e4831", "marker": { "line": { "color": "rgb(20, 233, 233)" }, "size": 10, "color": "rgb(3, 26, 240)", "symbol": "diamond" } }, { "meta": { "columnNames": { "x": "A", "y": "B" } }, "mode": "markers", "name": "High DP Var. Y4Y6", "type": "scatter", "xsrc": "ASCIVOLETTO:104:bd5397", "ysrc": "ASCIVOLETTO:104:c67abe", "marker": { "size": 10, "color": "rgb(227, 38, 6)", "symbol": "diamond" }, "stackgroup": null }, { "meta": { "columnNames": { "x": "", "y": "D" } }, "mode": "lines", "type": "scatter", "ysrc": "ASCIVOLETTO:104:388a9c", "showlegend": false }, { "meta": { "columnNames": { "x": "", "y": "" } }, "mode": "lines", "type": "scatter", "stackgroup": null } ], "frames": [], "layout": { "font": { "size": 12, "color": "rgb(5, 5, 6)" }, "title": { "x": 0.5, "font": { "size": 20 }, "text": "KS-PME Evolution (High DP Y4 Funds)" }, "xaxis": { "side": "bottom", "type": "linear", "range": [ 0, 10.2 ], "title": { "text": "Year of the fund" }, "mirror": false, "nticks": 11, "showgrid": true, "showline": true, "autorange": false, "gridcolor": "rgb(255, 255, 255)", "gridwidth": 1, "linecolor": "rgb(0, 3, 8)", "linewidth": 2 }, "yaxis": { "type": "linear", "range": [ 0, 1.4 ], "title": { "text": "KSPME" }, "nticks": 8, "showgrid": true, "showline": true, "zeroline": false, "autorange": false, "gridcolor": "rgb(231, 236, 240)", "linecolor": "rgb(5, 5, 5)", "linewidth": 2 }, "legend": { "x": 1.02, "y": 1.02, "font": { "color": "rgb(0, 0, 0)" }, "xanchor": "left", "yanchor": "auto", "bordercolor": "rgb(0, 0, 0)", "borderwidth": 1 }, "modebar": { "orientation": "h" }, "autosize": true, "template": { "data": { "bar": [ { "type": "bar", "marker": { "colorbar": { "ticks": "", "outlinewidth": 0 } } } ], "table": [ { "type": "table", "cells": { "fill": { "color": "#EBF0F8" }, "line": { "color": "white" } }, "header": { "fill": { "color": "#C8D4E3" }, "line": { "color": "white" } } } ], "carpet": [ { "type": "carpet", "aaxis": { "gridcolor": "#C8D4E3", "linecolor": "#C8D4E3", "endlinecolor": "#2a3f5f", "minorgridcolor": "#C8D4E3", "startlinecolor": "#2a3f5f" }, "baxis": { "gridcolor": "#C8D4E3", "linecolor": "#C8D4E3", "endlinecolor": "#2a3f5f", "minorgridcolor": "#C8D4E3", "startlinecolor": "#2a3f5f" } } ], "mesh3d": [ { "type": "mesh3d", "colorbar": { "ticks": "", "outlinewidth": 0 } } ], "contour": [ { "type": "contour", "colorbar": { "ticks": "", "outlinewidth": 0 }, "autocolorscale": true } ], "heatmap": [ { "type": "heatmap", "colorbar": { "ticks": "", "outlinewidth": 0 }, "autocolorscale": true } ], "scatter": [ { "type": "scatter", "marker": { "colorbar": { "ticks": "", "outlinewidth": 0 } } } ], "surface": [ { "type": "surface", "colorbar": { "ticks": "", "outlinewidth": 0 } } ], "heatmapgl": [ { "type": "heatmapgl", "colorbar": { "ticks": "", "outlinewidth": 0 } } ], "histogram": [ { "type": "histogram", "marker": { "colorbar": { "ticks": "", "outlinewidth": 0 } } } ], "parcoords": [ { "line": { "colorbar": { "ticks": "", "outlinewidth": 0 } }, "type": "parcoords" } ], "scatter3d": [ { "type": "scatter3d", "marker": { "colorbar": { "ticks": "", "outlinewidth": 0 } } } ], "scattergl": [ { "type": "scattergl", "marker": { "colorbar": { "ticks": "", "outlinewidth": 0 } } } ], "choropleth": [ { "type": "choropleth", "colorbar": { "ticks": "", "outlinewidth": 0 } } ], "scattergeo": [ { "type": "scattergeo", "marker": { "colorbar": { "ticks": "", "outlinewidth": 0 } } } ], "histogram2d": [ { "type": "histogram2d", "colorbar": { "ticks": "", "outlinewidth": 0 }, "autocolorscale": true } ], "scatterpolar": [ { "type": "scatterpolar", "marker": { "colorbar": { "ticks": "", "outlinewidth": 0 } } } ], "contourcarpet": [ { "type": "contourcarpet", "colorbar": { "ticks": "", "outlinewidth": 0 } } ], "scattercarpet": [ { "type": "scattercarpet", "marker": { "colorbar": { "ticks": "", "outlinewidth": 0 } } } ], "scattermapbox": [ { "type": "scattermapbox", "marker": { "colorbar": { "ticks": "", "outlinewidth": 0 } } } ], "scatterpolargl": [ { "type": "scatterpolargl", "marker": { "colorbar": { "ticks": "", "outlinewidth": 0 } } } ], "scatterternary": [ { "type": "scatterternary", "marker": { "colorbar": { "ticks": "", "outlinewidth": 0 } } } ], "histogram2dcontour": [ { "type": "histogram2dcontour", "colorbar": { "ticks": "", "outlinewidth": 0 }, "autocolorscale": true } ] }, "layout": { "geo": { "bgcolor": "white", "showland": true, "lakecolor": "white", "landcolor": "white", "showlakes": true, "subunitcolor": "#C8D4E3" }, "font": { "color": "#2a3f5f" }, "polar": { "bgcolor": "white", "radialaxis": { "ticks": "", "gridcolor": "#EBF0F8", "linecolor": "#EBF0F8" }, "angularaxis": { "ticks": "", "gridcolor": "#EBF0F8", "linecolor": "#EBF0F8" } }, "scene": { "xaxis": { "ticks": "", "gridcolor": "#DFE8F3", "gridwidth": 2, "linecolor": "#EBF0F8", "zerolinecolor": "#EBF0F8", "showbackground": true, "backgroundcolor": "white" }, "yaxis": { "ticks": "", "gridcolor": "#DFE8F3", "gridwidth": 2, "linecolor": "#EBF0F8", "zerolinecolor": "#EBF0F8", "showbackground": true, "backgroundcolor": "white" }, "zaxis": { "ticks": "", "gridcolor": "#DFE8F3", "gridwidth": 2, "linecolor": "#EBF0F8", "zerolinecolor": "#EBF0F8", "showbackground": true, "backgroundcolor": "white" } }, "title": { "x": 0.05 }, "xaxis": { "ticks": "", "gridcolor": "#EBF0F8", "linecolor": "#EBF0F8", "automargin": true, "zerolinecolor": "#EBF0F8", "zerolinewidth": 2 }, "yaxis": { "ticks": "", "gridcolor": "#EBF0F8", "linecolor": "#EBF0F8", "automargin": true, "zerolinecolor": "#EBF0F8", "zerolinewidth": 2 }, "ternary": { "aaxis": { "ticks": "", "gridcolor": "#DFE8F3", "linecolor": "#A2B1C6" }, "baxis": { "ticks": "", "gridcolor": "#DFE8F3", "linecolor": "#A2B1C6" }, "caxis": { "ticks": "", "gridcolor": "#DFE8F3", "linecolor": "#A2B1C6" }, "bgcolor": "white" }, "colorway": [ "#636efa", "#EF553B", "#00cc96", "#ab63fa", "#19d3f3", "#e763fa", "#fecb52", "#ffa15a", "#ff6692", "#b6e880" ], "hovermode": "closest", "colorscale": { "diverging": [ [ 0, "#8e0152" ], [ 0.1, "#c51b7d" ], [ 0.2, "#de77ae" ], [ 0.3, "#f1b6da" ], [ 0.4, "#fde0ef" ], [ 0.5, "#f7f7f7" ], [ 0.6, "#e6f5d0" ], [ 0.7, "#b8e186" ], [ 0.8, "#7fbc41" ], [ 0.9, "#4d9221" ], [ 1, "#276419" ] ], "sequential": [ [ 0, "#0508b8" ], [ 0.0893854748603352, "#1910d8" ], [ 0.1787709497206704, "#3c19f0" ], [ 0.2681564245810056, "#6b1cfb" ], [ 0.3575418994413408, "#981cfd" ], [ 0.44692737430167595, "#bf1cfd" ], [ 0.5363128491620112, "#dd2bfd" ], [ 0.6256983240223464, "#f246fe" ], [ 0.7150837988826816, "#fc67fd" ], [ 0.8044692737430168, "#fe88fc" ], [ 0.8938547486033519, "#fea5fd" ], [ 0.9832402234636871, "#febefe" ], [ 1, "#fec3fe" ] ], "sequentialminus": [ [ 0, "#0508b8" ], [ 0.0893854748603352, "#1910d8" ], [ 0.1787709497206704, "#3c19f0" ], [ 0.2681564245810056, "#6b1cfb" ], [ 0.3575418994413408, "#981cfd" ], [ 0.44692737430167595, "#bf1cfd" ], [ 0.5363128491620112, "#dd2bfd" ], [ 0.6256983240223464, "#f246fe" ], [ 0.7150837988826816, "#fc67fd" ], [ 0.8044692737430168, "#fe88fc" ], [ 0.8938547486033519, "#fea5fd" ], [ 0.9832402234636871, "#febefe" ], [ 1, "#fec3fe" ] ] }, "plot_bgcolor": "white", "paper_bgcolor": "white", "shapedefaults": { "line": { "width": 0 }, "opacity": 0.4, "fillcolor": "#506784" }, "annotationdefaults": { "arrowhead": 0, "arrowcolor": "#506784", "arrowwidth": 1 } }, "themeRef": "PLOTLY_WHITE" }, "hoverlabel": { "font": { "size": 13 } }, "paper_bgcolor": "rgb(255, 255, 255)" } }, "height": null, "width": null, "user": { "profile_url": "https://chart-studio.plotly.com/~ASCIVOLETTO", "avatar_url": "https://storage.googleapis.com/plotly-prod-profiles/96.jpg", "background_url": "https://storage.googleapis.com/plotly-prod-profiles/bg-7.jpg", "bio": "", "nickname": "", "website": "", "stream_tokens": null, "feature_set_id": null, "csrf_token": null, "date_joined": "2023-03-30 13:28:23", "mapbox_access_tokens": null, "has_password": null, "username": "ASCIVOLETTO", "email": null, "is_active": null, "readonly": null, "is_dash_creator": null, "dash_created_count": null, "is_chart_creator": null, "charts_created_count": null } }, { "creation_time": "2025-09-02T16:42:49.147366Z", "comments": { "results": [], "count": 0 }, "parented": true, "embed_url": "https://chart-studio.plotly.com/~ASCIVOLETTO/103.embed", "fid": "ASCIVOLETTO:103", "filename": "TVPIPLOTEVOL_V2", "filetype": "plot", "img_url": "https://storage.googleapis.com/plotly-prod-images/ASCIVOLETTO/103/9_GMLK61UT76BINZ8S0CTTBTFM68QNCQ.png", "image_urls": { "default": "https://storage.googleapis.com/plotly-prod-images/ASCIVOLETTO/103/2_GUZ1QKVH2DFM8MVN7XPOLC2TQYRW00.png", "block-thumb": "https://storage.googleapis.com/plotly-prod-images/ASCIVOLETTO/103/8_H88HFWVK0EX4TEFC5WC1VF820OMXR4.png", "list-thumb": "https://storage.googleapis.com/plotly-prod-images/ASCIVOLETTO/103/9_GMLK61UT76BINZ8S0CTTBTFM68QNCQ.png" }, "api_urls": { "files": "https://api.plotly.com/v2/files/ASCIVOLETTO:103", "plots": "https://api.plotly.com/v2/plots/ASCIVOLETTO:103", "parent": "https://api.plotly.com/v2/folders/home?user=ASCIVOLETTO" }, "owner": "ASCIVOLETTO", "parent": -1, "preview": "", "referencers": [], "references": [], "title": "", "views": 0, "web_url": "https://chart-studio.plotly.com/~ASCIVOLETTO/103/", "world_readable": true, "date_modified": "2025-09-02T17:07:34.916Z", "stars": { "results": [], "count": 0 }, "collaborators": { "results": [], "count": 0 }, "subfolder_count": null, "refresh_interval": null, "organize_view_url": "https://chart-studio.plotly.com/~ASCIVOLETTO/103/", "current_user_permission": "read", "is_theme": null, "is_template": false, "autosize": true, "caption": "", "figure": { "data": [ { "meta": { "columnNames": { "x": "A", "y": "C" } }, "mode": "markers", "name": "Low DP Var. Y4Y6", "type": "scatter", "xsrc": "ASCIVOLETTO:102:8470a8", "ysrc": "ASCIVOLETTO:102:56a1bf", "marker": { "line": { "color": "rgb(20, 233, 233)" }, "size": 10, "color": "rgb(3, 26, 240)", "symbol": "diamond" } }, { "meta": { "columnNames": { "x": "A", "y": "B" } }, "mode": "markers", "name": "High DP Var. Y4Y6", "type": "scatter", "xsrc": "ASCIVOLETTO:102:8470a8", "ysrc": "ASCIVOLETTO:102:484829", "marker": { "size": 10, "color": "rgb(227, 38, 6)", "symbol": "diamond" }, "stackgroup": null }, { "meta": { "columnNames": { "x": "", "y": "D" } }, "mode": "lines", "type": "scatter", "ysrc": "ASCIVOLETTO:102:e04265", "showlegend": false }, { "meta": { "columnNames": { "x": "", "y": "" } }, "mode": "lines", "type": "scatter", "stackgroup": null } ], "frames": [], "layout": { "font": { "size": 12, "color": "rgb(5, 5, 6)" }, "title": { "x": 0.5, "font": { "size": 20 }, "text": "TVPI Evolution (High DP Y4 Funds)" }, "xaxis": { "side": "bottom", "type": "linear", "range": [ 0, 10.2 ], "title": { "text": "Year of the fund" }, "mirror": false, "nticks": 11, "showgrid": true, "showline": true, "autorange": false, "gridcolor": "rgb(255, 255, 255)", "gridwidth": 1, "linecolor": "rgb(0, 3, 8)", "linewidth": 2 }, "yaxis": { "type": "linear", "range": [ 0.9, 1.6 ], "title": { "text": "TVPI" }, "nticks": 8, "showgrid": true, "showline": true, "zeroline": false, "autorange": false, "gridcolor": "rgb(231, 236, 240)", "linecolor": "rgb(5, 5, 5)", "linewidth": 2 }, "legend": { "x": 1.02, "y": 1.02, "font": { "color": "rgb(0, 0, 0)" }, "xanchor": "left", "yanchor": "auto", "bordercolor": "rgb(0, 0, 0)", "borderwidth": 1 }, "modebar": { "orientation": "h" }, "autosize": true, "template": { "data": { "bar": [ { "type": "bar", "marker": { "colorbar": { "ticks": "", "outlinewidth": 0 } } } ], "table": [ { "type": "table", "cells": { "fill": { "color": "#EBF0F8" }, "line": { "color": "white" } }, "header": { "fill": { "color": "#C8D4E3" }, "line": { "color": "white" } } } ], "carpet": [ { "type": "carpet", "aaxis": { "gridcolor": "#C8D4E3", "linecolor": "#C8D4E3", "endlinecolor": "#2a3f5f", "minorgridcolor": "#C8D4E3", "startlinecolor": "#2a3f5f" }, "baxis": { "gridcolor": "#C8D4E3", "linecolor": "#C8D4E3", "endlinecolor": "#2a3f5f", "minorgridcolor": "#C8D4E3", "startlinecolor": "#2a3f5f" } } ], "mesh3d": [ { "type": "mesh3d", "colorbar": { "ticks": "", "outlinewidth": 0 } } ], "contour": [ { "type": "contour", "colorbar": { "ticks": "", "outlinewidth": 0 }, "autocolorscale": true } ], "heatmap": [ { "type": "heatmap", "colorbar": { "ticks": "", "outlinewidth": 0 }, "autocolorscale": true } ], "scatter": [ { "type": "scatter", "marker": { "colorbar": { "ticks": "", "outlinewidth": 0 } } } ], "surface": [ { "type": "surface", "colorbar": { "ticks": "", "outlinewidth": 0 } } ], "heatmapgl": [ { "type": "heatmapgl", "colorbar": { "ticks": "", "outlinewidth": 0 } } ], "histogram": [ { "type": "histogram", "marker": { "colorbar": { "ticks": "", "outlinewidth": 0 } } } ], "parcoords": [ { "line": { "colorbar": { "ticks": "", "outlinewidth": 0 } }, "type": "parcoords" } ], "scatter3d": [ { "type": "scatter3d", "marker": { "colorbar": { "ticks": "", "outlinewidth": 0 } } } ], "scattergl": [ { "type": "scattergl", "marker": { "colorbar": { "ticks": "", "outlinewidth": 0 } } } ], "choropleth": [ { "type": "choropleth", "colorbar": { "ticks": "", "outlinewidth": 0 } } ], "scattergeo": [ { "type": "scattergeo", "marker": { "colorbar": { "ticks": "", "outlinewidth": 0 } } } ], "histogram2d": [ { "type": "histogram2d", "colorbar": { "ticks": "", "outlinewidth": 0 }, "autocolorscale": true } ], "scatterpolar": [ { "type": "scatterpolar", "marker": { "colorbar": { "ticks": "", "outlinewidth": 0 } } } ], "contourcarpet": [ { "type": "contourcarpet", "colorbar": { "ticks": "", "outlinewidth": 0 } } ], "scattercarpet": [ { "type": "scattercarpet", "marker": { "colorbar": { "ticks": "", "outlinewidth": 0 } } } ], "scattermapbox": [ { "type": "scattermapbox", "marker": { "colorbar": { "ticks": "", "outlinewidth": 0 } } } ], "scatterpolargl": [ { "type": "scatterpolargl", "marker": { "colorbar": { "ticks": "", "outlinewidth": 0 } } } ], "scatterternary": [ { "type": "scatterternary", "marker": { "colorbar": { "ticks": "", "outlinewidth": 0 } } } ], "histogram2dcontour": [ { "type": "histogram2dcontour", "colorbar": { "ticks": "", "outlinewidth": 0 }, "autocolorscale": true } ] }, "layout": { "geo": { "bgcolor": "white", "showland": true, "lakecolor": "white", "landcolor": "white", "showlakes": true, "subunitcolor": "#C8D4E3" }, "font": { "color": "#2a3f5f" }, "polar": { "bgcolor": "white", "radialaxis": { "ticks": "", "gridcolor": "#EBF0F8", "linecolor": "#EBF0F8" }, "angularaxis": { "ticks": "", "gridcolor": "#EBF0F8", "linecolor": "#EBF0F8" } }, "scene": { "xaxis": { "ticks": "", "gridcolor": "#DFE8F3", "gridwidth": 2, "linecolor": "#EBF0F8", "zerolinecolor": "#EBF0F8", "showbackground": true, "backgroundcolor": "white" }, "yaxis": { "ticks": "", "gridcolor": "#DFE8F3", "gridwidth": 2, "linecolor": "#EBF0F8", "zerolinecolor": "#EBF0F8", "showbackground": true, "backgroundcolor": "white" }, "zaxis": { "ticks": "", "gridcolor": "#DFE8F3", "gridwidth": 2, "linecolor": "#EBF0F8", "zerolinecolor": "#EBF0F8", "showbackground": true, "backgroundcolor": "white" } }, "title": { "x": 0.05 }, "xaxis": { "ticks": "", "gridcolor": "#EBF0F8", "linecolor": "#EBF0F8", "automargin": true, "zerolinecolor": "#EBF0F8", "zerolinewidth": 2 }, "yaxis": { "ticks": "", "gridcolor": "#EBF0F8", "linecolor": "#EBF0F8", "automargin": true, "zerolinecolor": "#EBF0F8", "zerolinewidth": 2 }, "ternary": { "aaxis": { "ticks": "", "gridcolor": "#DFE8F3", "linecolor": "#A2B1C6" }, "baxis": { "ticks": "", "gridcolor": "#DFE8F3", "linecolor": "#A2B1C6" }, "caxis": { "ticks": "", "gridcolor": "#DFE8F3", "linecolor": "#A2B1C6" }, "bgcolor": "white" }, "colorway": [ "#636efa", "#EF553B", "#00cc96", "#ab63fa", "#19d3f3", "#e763fa", "#fecb52", "#ffa15a", "#ff6692", "#b6e880" ], "hovermode": "closest", "colorscale": { "diverging": [ [ 0, "#8e0152" ], [ 0.1, "#c51b7d" ], [ 0.2, "#de77ae" ], [ 0.3, "#f1b6da" ], [ 0.4, "#fde0ef" ], [ 0.5, "#f7f7f7" ], [ 0.6, "#e6f5d0" ], [ 0.7, "#b8e186" ], [ 0.8, "#7fbc41" ], [ 0.9, "#4d9221" ], [ 1, "#276419" ] ], "sequential": [ [ 0, "#0508b8" ], [ 0.0893854748603352, "#1910d8" ], [ 0.1787709497206704, "#3c19f0" ], [ 0.2681564245810056, "#6b1cfb" ], [ 0.3575418994413408, "#981cfd" ], [ 0.44692737430167595, "#bf1cfd" ], [ 0.5363128491620112, "#dd2bfd" ], [ 0.6256983240223464, "#f246fe" ], [ 0.7150837988826816, "#fc67fd" ], [ 0.8044692737430168, "#fe88fc" ], [ 0.8938547486033519, "#fea5fd" ], [ 0.9832402234636871, "#febefe" ], [ 1, "#fec3fe" ] ], "sequentialminus": [ [ 0, "#0508b8" ], [ 0.0893854748603352, "#1910d8" ], [ 0.1787709497206704, "#3c19f0" ], [ 0.2681564245810056, "#6b1cfb" ], [ 0.3575418994413408, "#981cfd" ], [ 0.44692737430167595, "#bf1cfd" ], [ 0.5363128491620112, "#dd2bfd" ], [ 0.6256983240223464, "#f246fe" ], [ 0.7150837988826816, "#fc67fd" ], [ 0.8044692737430168, "#fe88fc" ], [ 0.8938547486033519, "#fea5fd" ], [ 0.9832402234636871, "#febefe" ], [ 1, "#fec3fe" ] ] }, "plot_bgcolor": "white", "paper_bgcolor": "white", "shapedefaults": { "line": { "width": 0 }, "opacity": 0.4, "fillcolor": "#506784" }, "annotationdefaults": { "arrowhead": 0, "arrowcolor": "#506784", "arrowwidth": 1 } }, "themeRef": "PLOTLY_WHITE" }, "hoverlabel": { "font": { "size": 13 } }, "paper_bgcolor": "rgb(255, 255, 255)" } }, "height": null, "width": null, "user": { "profile_url": "https://chart-studio.plotly.com/~ASCIVOLETTO", "avatar_url": "https://storage.googleapis.com/plotly-prod-profiles/96.jpg", "background_url": "https://storage.googleapis.com/plotly-prod-profiles/bg-7.jpg", "bio": "", "nickname": "", "website": "", "stream_tokens": null, "feature_set_id": null, "csrf_token": null, "date_joined": "2023-03-30 13:28:23", "mapbox_access_tokens": null, "has_password": null, "username": "ASCIVOLETTO", "email": null, "is_active": null, "readonly": null, "is_dash_creator": null, "dash_created_count": null, "is_chart_creator": null, "charts_created_count": null } }, { "creation_time": "2025-09-02T16:25:00.703180Z", "comments": { "results": [], "count": 0 }, "parented": true, "embed_url": "https://chart-studio.plotly.com/~sahil24/12.embed", "fid": "sahil24:12", "filename": "Plot 12", "filetype": "plot", "img_url": "https://storage.googleapis.com/plotly-prod-images/sahil24/12/9_RW4Q5DJCEU6QY9RAB1VWXISFE3MWFD.png", "image_urls": { "default": "https://storage.googleapis.com/plotly-prod-images/sahil24/12/2_1X5WQTBORNP5TT55SUH0RD3NYCZHK6.png", "block-thumb": "https://storage.googleapis.com/plotly-prod-images/sahil24/12/8_YWZYRX3YP1C1Z45H87YSBX0OE1CNTE.png", "list-thumb": "https://storage.googleapis.com/plotly-prod-images/sahil24/12/9_RW4Q5DJCEU6QY9RAB1VWXISFE3MWFD.png" }, "api_urls": { "files": "https://api.plotly.com/v2/files/sahil24:12", "plots": "https://api.plotly.com/v2/plots/sahil24:12", "parent": "https://api.plotly.com/v2/folders/home?user=sahil24" }, "owner": "sahil24", "parent": -1, "preview": "", "referencers": [], "references": [], "title": "", "views": 0, "web_url": "https://chart-studio.plotly.com/~sahil24/12/", "world_readable": true, "date_modified": "2025-09-02T16:25:00.717Z", "stars": { "results": [], "count": 0 }, "collaborators": { "results": [], "count": 0 }, "subfolder_count": null, "refresh_interval": null, "organize_view_url": "https://chart-studio.plotly.com/~sahil24/12/", "current_user_permission": "read", "is_theme": null, "is_template": false, "autosize": true, "caption": "", "figure": { "data": [ { "meta": { "columnNames": { "labels": "B", "values": "A" } }, "mode": "markers", "type": "pie", "textfont": { "color": "rgb(237, 242, 250)" }, "textinfo": "percent", "labelssrc": "sahil24:11:321db1", "valuessrc": "sahil24:11:10e19e" } ], "frames": [], "layout": { "font": { "color": "rgb(37, 64, 119)" }, "xaxis": { "range": [ -1, 6 ], "autorange": true }, "yaxis": { "range": [ -1, 4 ], "autorange": true }, "legend": { "x": 0.43999999999999995, "y": 0.28000000000000025 }, "autosize": true, "template": { "data": { "bar": [ { "type": "bar", "marker": { "colorbar": { "ticks": "", "outlinewidth": 0 } } } ], "table": [ { "type": "table", "cells": { "fill": { "color": "#EBF0F8" }, "line": { "color": "white" } }, "header": { "fill": { "color": "#C8D4E3" }, "line": { "color": "white" } } } ], "carpet": [ { "type": "carpet", "aaxis": { "gridcolor": "#C8D4E3", "linecolor": "#C8D4E3", "endlinecolor": "#2a3f5f", "minorgridcolor": "#C8D4E3", "startlinecolor": "#2a3f5f" }, "baxis": { "gridcolor": "#C8D4E3", "linecolor": "#C8D4E3", "endlinecolor": "#2a3f5f", "minorgridcolor": "#C8D4E3", "startlinecolor": "#2a3f5f" } } ], "mesh3d": [ { "type": "mesh3d", "colorbar": { "ticks": "", "outlinewidth": 0 } } ], "contour": [ { "type": "contour", "colorbar": { "ticks": "", "outlinewidth": 0 }, "autocolorscale": true } ], "heatmap": [ { "type": "heatmap", "colorbar": { "ticks": "", "outlinewidth": 0 }, "autocolorscale": true } ], "scatter": [ { "type": "scatter", "marker": { "colorbar": { "ticks": "", "outlinewidth": 0 } } } ], "surface": [ { "type": "surface", "colorbar": { "ticks": "", "outlinewidth": 0 } } ], "heatmapgl": [ { "type": "heatmapgl", "colorbar": { "ticks": "", "outlinewidth": 0 } } ], "histogram": [ { "type": "histogram", "marker": { "colorbar": { "ticks": "", "outlinewidth": 0 } } } ], "parcoords": [ { "line": { "colorbar": { "ticks": "", "outlinewidth": 0 } }, "type": "parcoords" } ], "scatter3d": [ { "type": "scatter3d", "marker": { "colorbar": { "ticks": "", "outlinewidth": 0 } } } ], "scattergl": [ { "type": "scattergl", "marker": { "colorbar": { "ticks": "", "outlinewidth": 0 } } } ], "choropleth": [ { "type": "choropleth", "colorbar": { "ticks": "", "outlinewidth": 0 } } ], "scattergeo": [ { "type": "scattergeo", "marker": { "colorbar": { "ticks": "", "outlinewidth": 0 } } } ], "histogram2d": [ { "type": "histogram2d", "colorbar": { "ticks": "", "outlinewidth": 0 }, "autocolorscale": true } ], "scatterpolar": [ { "type": "scatterpolar", "marker": { "colorbar": { "ticks": "", "outlinewidth": 0 } } } ], "contourcarpet": [ { "type": "contourcarpet", "colorbar": { "ticks": "", "outlinewidth": 0 } } ], "scattercarpet": [ { "type": "scattercarpet", "marker": { "colorbar": { "ticks": "", "outlinewidth": 0 } } } ], "scattermapbox": [ { "type": "scattermapbox", "marker": { "colorbar": { "ticks": "", "outlinewidth": 0 } } } ], "scatterpolargl": [ { "type": "scatterpolargl", "marker": { "colorbar": { "ticks": "", "outlinewidth": 0 } } } ], "scatterternary": [ { "type": "scatterternary", "marker": { "colorbar": { "ticks": "", "outlinewidth": 0 } } } ], "histogram2dcontour": [ { "type": "histogram2dcontour", "colorbar": { "ticks": "", "outlinewidth": 0 }, "autocolorscale": true } ] }, "layout": { "geo": { "bgcolor": "white", "showland": true, "lakecolor": "white", "landcolor": "white", "showlakes": true, "subunitcolor": "#C8D4E3" }, "font": { "color": "#2a3f5f" }, "polar": { "bgcolor": "white", "radialaxis": { "ticks": "", "gridcolor": "#EBF0F8", "linecolor": "#EBF0F8" }, "angularaxis": { "ticks": "", "gridcolor": "#EBF0F8", "linecolor": "#EBF0F8" } }, "scene": { "xaxis": { "ticks": "", "gridcolor": "#DFE8F3", "gridwidth": 2, "linecolor": "#EBF0F8", "zerolinecolor": "#EBF0F8", "showbackground": true, "backgroundcolor": "white" }, "yaxis": { "ticks": "", "gridcolor": "#DFE8F3", "gridwidth": 2, "linecolor": "#EBF0F8", "zerolinecolor": "#EBF0F8", "showbackground": true, "backgroundcolor": "white" }, "zaxis": { "ticks": "", "gridcolor": "#DFE8F3", "gridwidth": 2, "linecolor": "#EBF0F8", "zerolinecolor": "#EBF0F8", "showbackground": true, "backgroundcolor": "white" } }, "title": { "x": 0.05 }, "xaxis": { "ticks": "", "gridcolor": "#EBF0F8", "linecolor": "#EBF0F8", "automargin": true, "zerolinecolor": "#EBF0F8", "zerolinewidth": 2 }, "yaxis": { "ticks": "", "gridcolor": "#EBF0F8", "linecolor": "#EBF0F8", "automargin": true, "zerolinecolor": "#EBF0F8", "zerolinewidth": 2 }, "ternary": { "aaxis": { "ticks": "", "gridcolor": "#DFE8F3", "linecolor": "#A2B1C6" }, "baxis": { "ticks": "", "gridcolor": "#DFE8F3", "linecolor": "#A2B1C6" }, "caxis": { "ticks": "", "gridcolor": "#DFE8F3", "linecolor": "#A2B1C6" }, "bgcolor": "white" }, "colorway": [ "#636efa", "#EF553B", "#00cc96", "#ab63fa", "#19d3f3", "#e763fa", "#fecb52", "#ffa15a", "#ff6692", "#b6e880" ], "hovermode": "closest", "colorscale": { "diverging": [ [ 0, "#8e0152" ], [ 0.1, "#c51b7d" ], [ 0.2, "#de77ae" ], [ 0.3, "#f1b6da" ], [ 0.4, "#fde0ef" ], [ 0.5, "#f7f7f7" ], [ 0.6, "#e6f5d0" ], [ 0.7, "#b8e186" ], [ 0.8, "#7fbc41" ], [ 0.9, "#4d9221" ], [ 1, "#276419" ] ], "sequential": [ [ 0, "#0508b8" ], [ 0.0893854748603352, "#1910d8" ], [ 0.1787709497206704, "#3c19f0" ], [ 0.2681564245810056, "#6b1cfb" ], [ 0.3575418994413408, "#981cfd" ], [ 0.44692737430167595, "#bf1cfd" ], [ 0.5363128491620112, "#dd2bfd" ], [ 0.6256983240223464, "#f246fe" ], [ 0.7150837988826816, "#fc67fd" ], [ 0.8044692737430168, "#fe88fc" ], [ 0.8938547486033519, "#fea5fd" ], [ 0.9832402234636871, "#febefe" ], [ 1, "#fec3fe" ] ], "sequentialminus": [ [ 0, "#0508b8" ], [ 0.0893854748603352, "#1910d8" ], [ 0.1787709497206704, "#3c19f0" ], [ 0.2681564245810056, "#6b1cfb" ], [ 0.3575418994413408, "#981cfd" ], [ 0.44692737430167595, "#bf1cfd" ], [ 0.5363128491620112, "#dd2bfd" ], [ 0.6256983240223464, "#f246fe" ], [ 0.7150837988826816, "#fc67fd" ], [ 0.8044692737430168, "#fe88fc" ], [ 0.8938547486033519, "#fea5fd" ], [ 0.9832402234636871, "#febefe" ], [ 1, "#fec3fe" ] ] }, "plot_bgcolor": "white", "paper_bgcolor": "white", "shapedefaults": { "line": { "width": 0 }, "opacity": 0.4, "fillcolor": "#506784" }, "annotationdefaults": { "arrowhead": 0, "arrowcolor": "#506784", "arrowwidth": 1 } }, "themeRef": "PLOTLY_WHITE" } } }, "height": null, "width": null, "user": { "profile_url": "https://chart-studio.plotly.com/~sahil24", "avatar_url": "https://storage.googleapis.com/plotly-prod-profiles/31.jpg", "background_url": "https://storage.googleapis.com/plotly-prod-profiles/bg-0.jpg", "bio": "", "nickname": "", "website": "", "stream_tokens": null, "feature_set_id": null, "csrf_token": null, "date_joined": "2025-08-16 05:29:32", "mapbox_access_tokens": null, "has_password": null, "username": "sahil24", "email": null, "is_active": null, "readonly": null, "is_dash_creator": null, "dash_created_count": null, "is_chart_creator": null, "charts_created_count": null } }, { "creation_time": "2025-09-02T15:18:19.936160Z", "comments": { "results": [], "count": 0 }, "parented": true, "embed_url": "https://chart-studio.plotly.com/~ASCIVOLETTO/101.embed", "fid": "ASCIVOLETTO:101", "filename": "TVPIEVOLPLOT", "filetype": "plot", "img_url": "https://storage.googleapis.com/plotly-prod-images/ASCIVOLETTO/101/9_9VCYB24SXNK9MQGF9ZGPWKN09UTDYZ.png", "image_urls": { "default": "https://storage.googleapis.com/plotly-prod-images/ASCIVOLETTO/101/2_53H94UCT37AS1R5GYCQQAWLXHN3BEK.png", "block-thumb": "https://storage.googleapis.com/plotly-prod-images/ASCIVOLETTO/101/8_61SFTMCULDC9XNF9O1BE0FWVUQYVRT.png", "list-thumb": "https://storage.googleapis.com/plotly-prod-images/ASCIVOLETTO/101/9_9VCYB24SXNK9MQGF9ZGPWKN09UTDYZ.png" }, "api_urls": { "files": "https://api.plotly.com/v2/files/ASCIVOLETTO:101", "plots": "https://api.plotly.com/v2/plots/ASCIVOLETTO:101", "parent": "https://api.plotly.com/v2/folders/home?user=ASCIVOLETTO" }, "owner": "ASCIVOLETTO", "parent": -1, "preview": "", "referencers": [], "references": [], "title": "", "views": 0, "web_url": "https://chart-studio.plotly.com/~ASCIVOLETTO/101/", "world_readable": true, "date_modified": "2025-09-02T15:18:19.946Z", "stars": { "results": [], "count": 0 }, "collaborators": { "results": [], "count": 0 }, "subfolder_count": null, "refresh_interval": null, "organize_view_url": "https://chart-studio.plotly.com/~ASCIVOLETTO/101/", "current_user_permission": "read", "is_theme": null, "is_template": false, "autosize": true, "caption": "", "figure": { "data": [ { "meta": { "columnNames": { "x": "A", "y": "C" } }, "mode": "markers", "name": "Low DP Var. Y4Y6", "type": "scatter", "xsrc": "ASCIVOLETTO:100:1f4ddf", "ysrc": "ASCIVOLETTO:100:255769", "marker": { "line": { "color": "rgb(20, 233, 233)" }, "size": 10, "color": "rgb(12, 212, 237)", "symbol": "circle" } }, { "meta": { "columnNames": { "x": "A", "y": "B" } }, "mode": "markers", "name": "High DP Var. Y4Y6", "type": "scatter", "xsrc": "ASCIVOLETTO:100:1f4ddf", "ysrc": "ASCIVOLETTO:100:a90a50", "marker": { "size": 10, "color": "rgb(227, 38, 6)" }, "stackgroup": null }, { "meta": { "columnNames": { "x": "", "y": "D" } }, "mode": "lines", "type": "scatter", "ysrc": "ASCIVOLETTO:100:9f579b", "showlegend": false }, { "meta": { "columnNames": { "x": "", "y": "" } }, "mode": "lines", "type": "scatter", "stackgroup": null } ], "frames": [], "layout": { "font": { "size": 12, "color": "rgb(5, 5, 6)" }, "title": { "x": 0.5, "font": { "size": 16 }, "text": "TVPI Evolution (High DP Y4 Funds)" }, "xaxis": { "type": "linear", "range": [ 0, 10.25 ], "title": { "text": "Year of the fund" }, "autorange": false }, "yaxis": { "type": "linear", "range": [ 0.9, 1.7 ], "title": { "text": "TVPI" }, "autorange": false }, "modebar": { "orientation": "h" }, "autosize": true, "template": { "data": { "bar": [ { "type": "bar", "marker": { "colorbar": { "ticks": "", "outlinewidth": 0 } } } ], "table": [ { "type": "table", "cells": { "fill": { "color": "#EBF0F8" }, "line": { "color": "white" } }, "header": { "fill": { "color": "#C8D4E3" }, "line": { "color": "white" } } } ], "carpet": [ { "type": "carpet", "aaxis": { "gridcolor": "#C8D4E3", "linecolor": "#C8D4E3", "endlinecolor": "#2a3f5f", "minorgridcolor": "#C8D4E3", "startlinecolor": "#2a3f5f" }, "baxis": { "gridcolor": "#C8D4E3", "linecolor": "#C8D4E3", "endlinecolor": "#2a3f5f", "minorgridcolor": "#C8D4E3", "startlinecolor": "#2a3f5f" } } ], "mesh3d": [ { "type": "mesh3d", "colorbar": { "ticks": "", "outlinewidth": 0 } } ], "contour": [ { "type": "contour", "colorbar": { "ticks": "", "outlinewidth": 0 }, "autocolorscale": true } ], "heatmap": [ { "type": "heatmap", "colorbar": { "ticks": "", "outlinewidth": 0 }, "autocolorscale": true } ], "scatter": [ { "type": "scatter", "marker": { "colorbar": { "ticks": "", "outlinewidth": 0 } } } ], "surface": [ { "type": "surface", "colorbar": { "ticks": "", "outlinewidth": 0 } } ], "heatmapgl": [ { "type": "heatmapgl", "colorbar": { "ticks": "", "outlinewidth": 0 } } ], "histogram": [ { "type": "histogram", "marker": { "colorbar": { "ticks": "", "outlinewidth": 0 } } } ], "parcoords": [ { "line": { "colorbar": { "ticks": "", "outlinewidth": 0 } }, "type": "parcoords" } ], "scatter3d": [ { "type": "scatter3d", "marker": { "colorbar": { "ticks": "", "outlinewidth": 0 } } } ], "scattergl": [ { "type": "scattergl", "marker": { "colorbar": { "ticks": "", "outlinewidth": 0 } } } ], "choropleth": [ { "type": "choropleth", "colorbar": { "ticks": "", "outlinewidth": 0 } } ], "scattergeo": [ { "type": "scattergeo", "marker": { "colorbar": { "ticks": "", "outlinewidth": 0 } } } ], "histogram2d": [ { "type": "histogram2d", "colorbar": { "ticks": "", "outlinewidth": 0 }, "autocolorscale": true } ], "scatterpolar": [ { "type": "scatterpolar", "marker": { "colorbar": { "ticks": "", "outlinewidth": 0 } } } ], "contourcarpet": [ { "type": "contourcarpet", "colorbar": { "ticks": "", "outlinewidth": 0 } } ], "scattercarpet": [ { "type": "scattercarpet", "marker": { "colorbar": { "ticks": "", "outlinewidth": 0 } } } ], "scattermapbox": [ { "type": "scattermapbox", "marker": { "colorbar": { "ticks": "", "outlinewidth": 0 } } } ], "scatterpolargl": [ { "type": "scatterpolargl", "marker": { "colorbar": { "ticks": "", "outlinewidth": 0 } } } ], "scatterternary": [ { "type": "scatterternary", "marker": { "colorbar": { "ticks": "", "outlinewidth": 0 } } } ], "histogram2dcontour": [ { "type": "histogram2dcontour", "colorbar": { "ticks": "", "outlinewidth": 0 }, "autocolorscale": true } ] }, "layout": { "geo": { "bgcolor": "white", "showland": true, "lakecolor": "white", "landcolor": "white", "showlakes": true, "subunitcolor": "#C8D4E3" }, "font": { "color": "#2a3f5f" }, "polar": { "bgcolor": "white", "radialaxis": { "ticks": "", "gridcolor": "#EBF0F8", "linecolor": "#EBF0F8" }, "angularaxis": { "ticks": "", "gridcolor": "#EBF0F8", "linecolor": "#EBF0F8" } }, "scene": { "xaxis": { "ticks": "", "gridcolor": "#DFE8F3", "gridwidth": 2, "linecolor": "#EBF0F8", "zerolinecolor": "#EBF0F8", "showbackground": true, "backgroundcolor": "white" }, "yaxis": { "ticks": "", "gridcolor": "#DFE8F3", "gridwidth": 2, "linecolor": "#EBF0F8", "zerolinecolor": "#EBF0F8", "showbackground": true, "backgroundcolor": "white" }, "zaxis": { "ticks": "", "gridcolor": "#DFE8F3", "gridwidth": 2, "linecolor": "#EBF0F8", "zerolinecolor": "#EBF0F8", "showbackground": true, "backgroundcolor": "white" } }, "title": { "x": 0.05 }, "xaxis": { "ticks": "", "gridcolor": "#EBF0F8", "linecolor": "#EBF0F8", "automargin": true, "zerolinecolor": "#EBF0F8", "zerolinewidth": 2 }, "yaxis": { "ticks": "", "gridcolor": "#EBF0F8", "linecolor": "#EBF0F8", "automargin": true, "zerolinecolor": "#EBF0F8", "zerolinewidth": 2 }, "ternary": { "aaxis": { "ticks": "", "gridcolor": "#DFE8F3", "linecolor": "#A2B1C6" }, "baxis": { "ticks": "", "gridcolor": "#DFE8F3", "linecolor": "#A2B1C6" }, "caxis": { "ticks": "", "gridcolor": "#DFE8F3", "linecolor": "#A2B1C6" }, "bgcolor": "white" }, "colorway": [ "#636efa", "#EF553B", "#00cc96", "#ab63fa", "#19d3f3", "#e763fa", "#fecb52", "#ffa15a", "#ff6692", "#b6e880" ], "hovermode": "closest", "colorscale": { "diverging": [ [ 0, "#8e0152" ], [ 0.1, "#c51b7d" ], [ 0.2, "#de77ae" ], [ 0.3, "#f1b6da" ], [ 0.4, "#fde0ef" ], [ 0.5, "#f7f7f7" ], [ 0.6, "#e6f5d0" ], [ 0.7, "#b8e186" ], [ 0.8, "#7fbc41" ], [ 0.9, "#4d9221" ], [ 1, "#276419" ] ], "sequential": [ [ 0, "#0508b8" ], [ 0.0893854748603352, "#1910d8" ], [ 0.1787709497206704, "#3c19f0" ], [ 0.2681564245810056, "#6b1cfb" ], [ 0.3575418994413408, "#981cfd" ], [ 0.44692737430167595, "#bf1cfd" ], [ 0.5363128491620112, "#dd2bfd" ], [ 0.6256983240223464, "#f246fe" ], [ 0.7150837988826816, "#fc67fd" ], [ 0.8044692737430168, "#fe88fc" ], [ 0.8938547486033519, "#fea5fd" ], [ 0.9832402234636871, "#febefe" ], [ 1, "#fec3fe" ] ], "sequentialminus": [ [ 0, "#0508b8" ], [ 0.0893854748603352, "#1910d8" ], [ 0.1787709497206704, "#3c19f0" ], [ 0.2681564245810056, "#6b1cfb" ], [ 0.3575418994413408, "#981cfd" ], [ 0.44692737430167595, "#bf1cfd" ], [ 0.5363128491620112, "#dd2bfd" ], [ 0.6256983240223464, "#f246fe" ], [ 0.7150837988826816, "#fc67fd" ], [ 0.8044692737430168, "#fe88fc" ], [ 0.8938547486033519, "#fea5fd" ], [ 0.9832402234636871, "#febefe" ], [ 1, "#fec3fe" ] ] }, "plot_bgcolor": "white", "paper_bgcolor": "white", "shapedefaults": { "line": { "width": 0 }, "opacity": 0.4, "fillcolor": "#506784" }, "annotationdefaults": { "arrowhead": 0, "arrowcolor": "#506784", "arrowwidth": 1 } }, "themeRef": "PLOTLY_WHITE" }, "hoverlabel": { "font": { "size": 13 } }, "paper_bgcolor": "rgb(239, 243, 245)" } }, "height": null, "width": null, "user": { "profile_url": "https://chart-studio.plotly.com/~ASCIVOLETTO", "avatar_url": "https://storage.googleapis.com/plotly-prod-profiles/96.jpg", "background_url": "https://storage.googleapis.com/plotly-prod-profiles/bg-7.jpg", "bio": "", "nickname": "", "website": "", "stream_tokens": null, "feature_set_id": null, "csrf_token": null, "date_joined": "2023-03-30 13:28:23", "mapbox_access_tokens": null, "has_password": null, "username": "ASCIVOLETTO", "email": null, "is_active": null, "readonly": null, "is_dash_creator": null, "dash_created_count": null, "is_chart_creator": null, "charts_created_count": null } }, { "creation_time": "2025-09-02T15:16:39.043758Z", "comments": { "results": [], "count": 0 }, "parented": true, "embed_url": "https://chart-studio.plotly.com/~ASCIVOLETTO/99.embed", "fid": "ASCIVOLETTO:99", "filename": "KSPMEPLOTEVOL", "filetype": "plot", "img_url": "https://storage.googleapis.com/plotly-prod-images/ASCIVOLETTO/99/9_G4GC62DK3OSF4YZ6CVBZ3RVBHWTFS6.png", "image_urls": { "default": "https://storage.googleapis.com/plotly-prod-images/ASCIVOLETTO/99/2_KKBIIYLI2OLYLI3AVC36ZXR05ANDJW.png", "block-thumb": "https://storage.googleapis.com/plotly-prod-images/ASCIVOLETTO/99/8_BNWSSLVNGVQE5BVJG8TXOHRPWYN7SS.png", "list-thumb": "https://storage.googleapis.com/plotly-prod-images/ASCIVOLETTO/99/9_G4GC62DK3OSF4YZ6CVBZ3RVBHWTFS6.png" }, "api_urls": { "files": "https://api.plotly.com/v2/files/ASCIVOLETTO:99", "plots": "https://api.plotly.com/v2/plots/ASCIVOLETTO:99", "parent": "https://api.plotly.com/v2/folders/home?user=ASCIVOLETTO" }, "owner": "ASCIVOLETTO", "parent": -1, "preview": "", "referencers": [], "references": [], "title": "", "views": 0, "web_url": "https://chart-studio.plotly.com/~ASCIVOLETTO/99/", "world_readable": true, "date_modified": "2025-09-02T15:16:39.054Z", "stars": { "results": [], "count": 0 }, "collaborators": { "results": [], "count": 0 }, "subfolder_count": null, "refresh_interval": null, "organize_view_url": "https://chart-studio.plotly.com/~ASCIVOLETTO/99/", "current_user_permission": "read", "is_theme": null, "is_template": false, "autosize": true, "caption": "", "figure": { "data": [ { "meta": { "columnNames": { "x": "A", "y": "C" } }, "mode": "markers", "name": "Low DP Var. Y4Y6", "type": "scatter", "xsrc": "ASCIVOLETTO:98:f5d2e4", "ysrc": "ASCIVOLETTO:98:6313d3", "marker": { "line": { "color": "rgb(20, 233, 233)" }, "size": 10, "color": "rgb(12, 212, 237)", "symbol": "circle" } }, { "meta": { "columnNames": { "x": "A", "y": "B" } }, "mode": "markers", "name": "High DP Var. Y4Y6", "type": "scatter", "xsrc": "ASCIVOLETTO:98:f5d2e4", "ysrc": "ASCIVOLETTO:98:a292c2", "marker": { "size": 10, "color": "rgb(227, 38, 6)" }, "stackgroup": null }, { "meta": { "columnNames": { "x": "", "y": "D" } }, "mode": "lines", "type": "scatter", "ysrc": "ASCIVOLETTO:98:bf4931", "showlegend": false }, { "meta": { "columnNames": { "x": "", "y": "" } }, "mode": "lines", "type": "scatter", "stackgroup": null } ], "frames": [], "layout": { "font": { "size": 12, "color": "rgb(5, 5, 6)" }, "title": { "x": 0.5, "font": { "size": 16 }, "text": "KS-PME Evolution (High DP Y4 Funds)" }, "xaxis": { "type": "linear", "range": [ 0, 10.25 ], "title": { "text": "Year of the fund" }, "autorange": false }, "yaxis": { "type": "linear", "range": [ 0, 1.5 ], "title": { "text": "KSPME" }, "autorange": false }, "modebar": { "orientation": "h" }, "autosize": true, "template": { "data": { "bar": [ { "type": "bar", "marker": { "colorbar": { "ticks": "", "outlinewidth": 0 } } } ], "table": [ { "type": "table", "cells": { "fill": { "color": "#EBF0F8" }, "line": { "color": "white" } }, "header": { "fill": { "color": "#C8D4E3" }, "line": { "color": "white" } } } ], "carpet": [ { "type": "carpet", "aaxis": { "gridcolor": "#C8D4E3", "linecolor": "#C8D4E3", "endlinecolor": "#2a3f5f", "minorgridcolor": "#C8D4E3", "startlinecolor": "#2a3f5f" }, "baxis": { "gridcolor": "#C8D4E3", "linecolor": "#C8D4E3", "endlinecolor": "#2a3f5f", "minorgridcolor": "#C8D4E3", "startlinecolor": "#2a3f5f" } } ], "mesh3d": [ { "type": "mesh3d", "colorbar": { "ticks": "", "outlinewidth": 0 } } ], "contour": [ { "type": "contour", "colorbar": { "ticks": "", "outlinewidth": 0 }, "autocolorscale": true } ], "heatmap": [ { "type": "heatmap", "colorbar": { "ticks": "", "outlinewidth": 0 }, "autocolorscale": true } ], "scatter": [ { "type": "scatter", "marker": { "colorbar": { "ticks": "", "outlinewidth": 0 } } } ], "surface": [ { "type": "surface", "colorbar": { "ticks": "", "outlinewidth": 0 } } ], "heatmapgl": [ { "type": "heatmapgl", "colorbar": { "ticks": "", "outlinewidth": 0 } } ], "histogram": [ { "type": "histogram", "marker": { "colorbar": { "ticks": "", "outlinewidth": 0 } } } ], "parcoords": [ { "line": { "colorbar": { "ticks": "", "outlinewidth": 0 } }, "type": "parcoords" } ], "scatter3d": [ { "type": "scatter3d", "marker": { "colorbar": { "ticks": "", "outlinewidth": 0 } } } ], "scattergl": [ { "type": "scattergl", "marker": { "colorbar": { "ticks": "", "outlinewidth": 0 } } } ], "choropleth": [ { "type": "choropleth", "colorbar": { "ticks": "", "outlinewidth": 0 } } ], "scattergeo": [ { "type": "scattergeo", "marker": { "colorbar": { "ticks": "", "outlinewidth": 0 } } } ], "histogram2d": [ { "type": "histogram2d", "colorbar": { "ticks": "", "outlinewidth": 0 }, "autocolorscale": true } ], "scatterpolar": [ { "type": "scatterpolar", "marker": { "colorbar": { "ticks": "", "outlinewidth": 0 } } } ], "contourcarpet": [ { "type": "contourcarpet", "colorbar": { "ticks": "", "outlinewidth": 0 } } ], "scattercarpet": [ { "type": "scattercarpet", "marker": { "colorbar": { "ticks": "", "outlinewidth": 0 } } } ], "scattermapbox": [ { "type": "scattermapbox", "marker": { "colorbar": { "ticks": "", "outlinewidth": 0 } } } ], "scatterpolargl": [ { "type": "scatterpolargl", "marker": { "colorbar": { "ticks": "", "outlinewidth": 0 } } } ], "scatterternary": [ { "type": "scatterternary", "marker": { "colorbar": { "ticks": "", "outlinewidth": 0 } } } ], "histogram2dcontour": [ { "type": "histogram2dcontour", "colorbar": { "ticks": "", "outlinewidth": 0 }, "autocolorscale": true } ] }, "layout": { "geo": { "bgcolor": "white", "showland": true, "lakecolor": "white", "landcolor": "white", "showlakes": true, "subunitcolor": "#C8D4E3" }, "font": { "color": "#2a3f5f" }, "polar": { "bgcolor": "white", "radialaxis": { "ticks": "", "gridcolor": "#EBF0F8", "linecolor": "#EBF0F8" }, "angularaxis": { "ticks": "", "gridcolor": "#EBF0F8", "linecolor": "#EBF0F8" } }, "scene": { "xaxis": { "ticks": "", "gridcolor": "#DFE8F3", "gridwidth": 2, "linecolor": "#EBF0F8", "zerolinecolor": "#EBF0F8", "showbackground": true, "backgroundcolor": "white" }, "yaxis": { "ticks": "", "gridcolor": "#DFE8F3", "gridwidth": 2, "linecolor": "#EBF0F8", "zerolinecolor": "#EBF0F8", "showbackground": true, "backgroundcolor": "white" }, "zaxis": { "ticks": "", "gridcolor": "#DFE8F3", "gridwidth": 2, "linecolor": "#EBF0F8", "zerolinecolor": "#EBF0F8", "showbackground": true, "backgroundcolor": "white" } }, "title": { "x": 0.05 }, "xaxis": { "ticks": "", "gridcolor": "#EBF0F8", "linecolor": "#EBF0F8", "automargin": true, "zerolinecolor": "#EBF0F8", "zerolinewidth": 2 }, "yaxis": { "ticks": "", "gridcolor": "#EBF0F8", "linecolor": "#EBF0F8", "automargin": true, "zerolinecolor": "#EBF0F8", "zerolinewidth": 2 }, "ternary": { "aaxis": { "ticks": "", "gridcolor": "#DFE8F3", "linecolor": "#A2B1C6" }, "baxis": { "ticks": "", "gridcolor": "#DFE8F3", "linecolor": "#A2B1C6" }, "caxis": { "ticks": "", "gridcolor": "#DFE8F3", "linecolor": "#A2B1C6" }, "bgcolor": "white" }, "colorway": [ "#636efa", "#EF553B", "#00cc96", "#ab63fa", "#19d3f3", "#e763fa", "#fecb52", "#ffa15a", "#ff6692", "#b6e880" ], "hovermode": "closest", "colorscale": { "diverging": [ [ 0, "#8e0152" ], [ 0.1, "#c51b7d" ], [ 0.2, "#de77ae" ], [ 0.3, "#f1b6da" ], [ 0.4, "#fde0ef" ], [ 0.5, "#f7f7f7" ], [ 0.6, "#e6f5d0" ], [ 0.7, "#b8e186" ], [ 0.8, "#7fbc41" ], [ 0.9, "#4d9221" ], [ 1, "#276419" ] ], "sequential": [ [ 0, "#0508b8" ], [ 0.0893854748603352, "#1910d8" ], [ 0.1787709497206704, "#3c19f0" ], [ 0.2681564245810056, "#6b1cfb" ], [ 0.3575418994413408, "#981cfd" ], [ 0.44692737430167595, "#bf1cfd" ], [ 0.5363128491620112, "#dd2bfd" ], [ 0.6256983240223464, "#f246fe" ], [ 0.7150837988826816, "#fc67fd" ], [ 0.8044692737430168, "#fe88fc" ], [ 0.8938547486033519, "#fea5fd" ], [ 0.9832402234636871, "#febefe" ], [ 1, "#fec3fe" ] ], "sequentialminus": [ [ 0, "#0508b8" ], [ 0.0893854748603352, "#1910d8" ], [ 0.1787709497206704, "#3c19f0" ], [ 0.2681564245810056, "#6b1cfb" ], [ 0.3575418994413408, "#981cfd" ], [ 0.44692737430167595, "#bf1cfd" ], [ 0.5363128491620112, "#dd2bfd" ], [ 0.6256983240223464, "#f246fe" ], [ 0.7150837988826816, "#fc67fd" ], [ 0.8044692737430168, "#fe88fc" ], [ 0.8938547486033519, "#fea5fd" ], [ 0.9832402234636871, "#febefe" ], [ 1, "#fec3fe" ] ] }, "plot_bgcolor": "white", "paper_bgcolor": "white", "shapedefaults": { "line": { "width": 0 }, "opacity": 0.4, "fillcolor": "#506784" }, "annotationdefaults": { "arrowhead": 0, "arrowcolor": "#506784", "arrowwidth": 1 } }, "themeRef": "PLOTLY_WHITE" }, "hoverlabel": { "font": { "size": 13 } }, "paper_bgcolor": "rgb(239, 243, 245)" } }, "height": null, "width": null, "user": { "profile_url": "https://chart-studio.plotly.com/~ASCIVOLETTO", "avatar_url": "https://storage.googleapis.com/plotly-prod-profiles/96.jpg", "background_url": "https://storage.googleapis.com/plotly-prod-profiles/bg-7.jpg", "bio": "", "nickname": "", "website": "", "stream_tokens": null, "feature_set_id": null, "csrf_token": null, "date_joined": "2023-03-30 13:28:23", "mapbox_access_tokens": null, "has_password": null, "username": "ASCIVOLETTO", "email": null, "is_active": null, "readonly": null, "is_dash_creator": null, "dash_created_count": null, "is_chart_creator": null, "charts_created_count": null } }, { "creation_time": "2025-09-02T15:01:32.762917Z", "comments": { "results": [], "count": 0 }, "parented": true, "embed_url": "https://chart-studio.plotly.com/~dsteinbe/3.embed", "fid": "dsteinbe:3", "filename": "emissions per category", "filetype": "plot", "img_url": "https://storage.googleapis.com/plotly-prod-images/dsteinbe/3/9_QBA1MTGY3FABOR8CLR0MZODZGMGAP3.png", "image_urls": { "default": "https://storage.googleapis.com/plotly-prod-images/dsteinbe/3/2_TPHLWUIQGXOU9QQ53WVVY697SE7MEF.png", "block-thumb": "https://storage.googleapis.com/plotly-prod-images/dsteinbe/3/8_B9GMOSH2FI0WJ0GVJCJHPAA5QSR19N.png", "list-thumb": "https://storage.googleapis.com/plotly-prod-images/dsteinbe/3/9_QBA1MTGY3FABOR8CLR0MZODZGMGAP3.png" }, "api_urls": { "files": "https://api.plotly.com/v2/files/dsteinbe:3", "plots": "https://api.plotly.com/v2/plots/dsteinbe:3", "parent": "https://api.plotly.com/v2/folders/home?user=dsteinbe" }, "owner": "dsteinbe", "parent": -1, "preview": "", "referencers": [], "references": [], "title": "", "views": 0, "web_url": "https://chart-studio.plotly.com/~dsteinbe/3/", "world_readable": true, "date_modified": "2025-09-02T15:01:32.776Z", "stars": { "results": [], "count": 0 }, "collaborators": { "results": [], "count": 0 }, "subfolder_count": null, "refresh_interval": null, "organize_view_url": "https://chart-studio.plotly.com/~dsteinbe/3/", "current_user_permission": "read", "is_theme": null, "is_template": false, "autosize": true, "caption": "", "figure": { "data": [ { "meta": { "columnNames": { "x": "Other On-Campus Stationary, x; Direct Transportation, x; Refrigerants & Chemicals, x; Fertilizer & Animals, x; Purchased Electricity, x; Purchased Steam/Chilled Water, x", "y": "Other On-Campus Stationary, y" } }, "name": "Other On-Campus Stationary", "type": "bar", "xsrc": "dsteinbe:2:2e73e8", "ysrc": "dsteinbe:2:d50d2f" }, { "meta": { "columnNames": { "x": "Other On-Campus Stationary, x; Direct Transportation, x; Refrigerants & Chemicals, x; Fertilizer & Animals, x; Purchased Electricity, x; Purchased Steam/Chilled Water, x", "y": "Direct Transportation, y" } }, "name": "Direct Transportation", "type": "bar", "xsrc": "dsteinbe:2:2e73e8", "ysrc": "dsteinbe:2:a38293" }, { "meta": { "columnNames": { "x": "Other On-Campus Stationary, x; Direct Transportation, x; Refrigerants & Chemicals, x; Fertilizer & Animals, x; Purchased Electricity, x; Purchased Steam/Chilled Water, x", "y": "Refrigerants & Chemicals, y" } }, "name": "Refrigerants & Chemicals", "type": "bar", "xsrc": "dsteinbe:2:2e73e8", "ysrc": "dsteinbe:2:a837b8" }, { "meta": { "columnNames": { "x": "Other On-Campus Stationary, x; Direct Transportation, x; Refrigerants & Chemicals, x; Fertilizer & Animals, x; Purchased Electricity, x; Purchased Steam/Chilled Water, x", "y": "Fertilizer & Animals, y" } }, "name": "Fertilizer & Animals", "type": "bar", "xsrc": "dsteinbe:2:2e73e8", "ysrc": "dsteinbe:2:d3cc80" }, { "meta": { "columnNames": { "x": "Other On-Campus Stationary, x; Direct Transportation, x; Refrigerants & Chemicals, x; Fertilizer & Animals, x; Purchased Electricity, x; Purchased Steam/Chilled Water, x", "y": "Purchased Electricity, y" } }, "name": "Purchased Electricity", "type": "bar", "xsrc": "dsteinbe:2:2e73e8", "ysrc": "dsteinbe:2:751bac" }, { "meta": { "columnNames": { "x": "Other On-Campus Stationary, x; Direct Transportation, x; Refrigerants & Chemicals, x; Fertilizer & Animals, x; Purchased Electricity, x; Purchased Steam/Chilled Water, x", "y": "Purchased Steam/Chilled Water, y" } }, "name": "Purchased Steam/Chilled Water", "type": "bar", "xsrc": "dsteinbe:2:2e73e8", "ysrc": "dsteinbe:2:742716" } ], "frames": [], "layout": { "title": { "text": "Carnegie Mellon University Emissions per Category" }, "xaxis": { "type": "category", "range": [ -0.5, 19.5 ], "title": { "text": "Fiscal Year (July 1 - June 30)" }, "nticks": 0, "autorange": true }, "yaxis": { "type": "linear", "range": [ 0, 123396.27368421052 ], "title": { "text": "MT eCO2" }, "nticks": 25, "autorange": true, "rangemode": "tozero", "zerolinecolor": "#DDD" }, "legend": { "x": 1, "y": 1 }, "barmode": "stack", "autosize": true, "colorway": [ "#0044BB", "#A7D063", "#4C8DFF", "#D6D6D6", "#F57D3D", "#BDA55D" ], "hovermode": "closest", "hoverlabel": { "namelength": 35 }, "showlegend": true } }, "height": null, "width": null, "user": { "profile_url": "https://chart-studio.plotly.com/~dsteinbe", "avatar_url": "https://storage.googleapis.com/plotly-prod-profiles/39.jpg", "background_url": "https://storage.googleapis.com/plotly-prod-profiles/bg-5.jpg", "bio": "", "nickname": "", "website": "", "stream_tokens": null, "feature_set_id": null, "csrf_token": null, "date_joined": "2025-09-02 14:53:44", "mapbox_access_tokens": null, "has_password": null, "username": "dsteinbe", "email": null, "is_active": null, "readonly": null, "is_dash_creator": null, "dash_created_count": null, "is_chart_creator": null, "charts_created_count": null } }, { "creation_time": "2025-09-02T14:58:46.697216Z", "comments": { "results": [], "count": 0 }, "parented": true, "embed_url": "https://chart-studio.plotly.com/~allan64/1.embed", "fid": "allan64:1", "filename": "Plot 1", "filetype": "plot", "img_url": "https://storage.googleapis.com/plotly-prod-images/allan64/1/9_QCHRLI55BHHPT8DL4AUYKH7343P3Z8.png", "image_urls": { "default": "https://storage.googleapis.com/plotly-prod-images/allan64/1/2_9DG69RFESZ4CUAE6SCCLYPJFW6G71F.png", "block-thumb": "https://storage.googleapis.com/plotly-prod-images/allan64/1/8_RJ4EF08LWLOOCHWY3LV0M1SG3W21QW.png", "list-thumb": "https://storage.googleapis.com/plotly-prod-images/allan64/1/9_QCHRLI55BHHPT8DL4AUYKH7343P3Z8.png" }, "api_urls": { "files": "https://api.plotly.com/v2/files/allan64:1", "plots": "https://api.plotly.com/v2/plots/allan64:1", "parent": "https://api.plotly.com/v2/folders/home?user=allan64" }, "owner": "allan64", "parent": -1, "preview": "", "referencers": [], "references": [], "title": "", "views": 0, "web_url": "https://chart-studio.plotly.com/~allan64/1/", "world_readable": true, "date_modified": "2025-09-02T14:58:46.707Z", "stars": { "results": [], "count": 0 }, "collaborators": { "results": [], "count": 0 }, "subfolder_count": null, "refresh_interval": null, "organize_view_url": "https://chart-studio.plotly.com/~allan64/1/", "current_user_permission": "read", "is_theme": null, "is_template": false, "autosize": true, "caption": "", "figure": { "data": [ { "meta": { "columnNames": { "x": "A", "y": "results_add_random" } }, "mode": "markers", "name": "add random", "type": "scatter", "xsrc": "allan64:0:9008f6", "ysrc": "allan64:0:4faedb", "visible": true }, { "meta": { "columnNames": { "x": "A", "y": "results_add_reverse" } }, "mode": "markers", "name": "add reverse", "type": "scatter", "xsrc": "allan64:0:9008f6", "ysrc": "allan64:0:721534", "stackgroup": null } ], "frames": [], "layout": { "xaxis": { "type": "linear", "range": [ -127993.81838074395, 2288193.8183807437 ], "autorange": true }, "yaxis": { "type": "linear", "range": [ 12051.31959219858, 16047.68040780142 ], "autorange": true }, "autosize": true, "template": { "data": { "bar": [ { "type": "bar", "marker": { "colorbar": { "ticks": "", "outlinewidth": 0 } } } ], "table": [ { "type": "table", "cells": { "fill": { "color": "#EBF0F8" }, "line": { "color": "white" } }, "header": { "fill": { "color": "#C8D4E3" }, "line": { "color": "white" } } } ], "carpet": [ { "type": "carpet", "aaxis": { "gridcolor": "#C8D4E3", "linecolor": "#C8D4E3", "endlinecolor": "#2a3f5f", "minorgridcolor": "#C8D4E3", "startlinecolor": "#2a3f5f" }, "baxis": { "gridcolor": "#C8D4E3", "linecolor": "#C8D4E3", "endlinecolor": "#2a3f5f", "minorgridcolor": "#C8D4E3", "startlinecolor": "#2a3f5f" } } ], "mesh3d": [ { "type": "mesh3d", "colorbar": { "ticks": "", "outlinewidth": 0 } } ], "contour": [ { "type": "contour", "colorbar": { "ticks": "", "outlinewidth": 0 }, "autocolorscale": true } ], "heatmap": [ { "type": "heatmap", "colorbar": { "ticks": "", "outlinewidth": 0 }, "autocolorscale": true } ], "scatter": [ { "type": "scatter", "marker": { "colorbar": { "ticks": "", "outlinewidth": 0 } } } ], "surface": [ { "type": "surface", "colorbar": { "ticks": "", "outlinewidth": 0 } } ], "heatmapgl": [ { "type": "heatmapgl", "colorbar": { "ticks": "", "outlinewidth": 0 } } ], "histogram": [ { "type": "histogram", "marker": { "colorbar": { "ticks": "", "outlinewidth": 0 } } } ], "parcoords": [ { "line": { "colorbar": { "ticks": "", "outlinewidth": 0 } }, "type": "parcoords" } ], "scatter3d": [ { "type": "scatter3d", "marker": { "colorbar": { "ticks": "", "outlinewidth": 0 } } } ], "scattergl": [ { "type": "scattergl", "marker": { "colorbar": { "ticks": "", "outlinewidth": 0 } } } ], "choropleth": [ { "type": "choropleth", "colorbar": { "ticks": "", "outlinewidth": 0 } } ], "scattergeo": [ { "type": "scattergeo", "marker": { "colorbar": { "ticks": "", "outlinewidth": 0 } } } ], "histogram2d": [ { "type": "histogram2d", "colorbar": { "ticks": "", "outlinewidth": 0 }, "autocolorscale": true } ], "scatterpolar": [ { "type": "scatterpolar", "marker": { "colorbar": { "ticks": "", "outlinewidth": 0 } } } ], "contourcarpet": [ { "type": "contourcarpet", "colorbar": { "ticks": "", "outlinewidth": 0 } } ], "scattercarpet": [ { "type": "scattercarpet", "marker": { "colorbar": { "ticks": "", "outlinewidth": 0 } } } ], "scattermapbox": [ { "type": "scattermapbox", "marker": { "colorbar": { "ticks": "", "outlinewidth": 0 } } } ], "scatterpolargl": [ { "type": "scatterpolargl", "marker": { "colorbar": { "ticks": "", "outlinewidth": 0 } } } ], "scatterternary": [ { "type": "scatterternary", "marker": { "colorbar": { "ticks": "", "outlinewidth": 0 } } } ], "histogram2dcontour": [ { "type": "histogram2dcontour", "colorbar": { "ticks": "", "outlinewidth": 0 }, "autocolorscale": true } ] }, "layout": { "geo": { "bgcolor": "white", "showland": true, "lakecolor": "white", "landcolor": "white", "showlakes": true, "subunitcolor": "#C8D4E3" }, "font": { "color": "#2a3f5f" }, "polar": { "bgcolor": "white", "radialaxis": { "ticks": "", "gridcolor": "#EBF0F8", "linecolor": "#EBF0F8" }, "angularaxis": { "ticks": "", "gridcolor": "#EBF0F8", "linecolor": "#EBF0F8" } }, "scene": { "xaxis": { "ticks": "", "gridcolor": "#DFE8F3", "gridwidth": 2, "linecolor": "#EBF0F8", "zerolinecolor": "#EBF0F8", "showbackground": true, "backgroundcolor": "white" }, "yaxis": { "ticks": "", "gridcolor": "#DFE8F3", "gridwidth": 2, "linecolor": "#EBF0F8", "zerolinecolor": "#EBF0F8", "showbackground": true, "backgroundcolor": "white" }, "zaxis": { "ticks": "", "gridcolor": "#DFE8F3", "gridwidth": 2, "linecolor": "#EBF0F8", "zerolinecolor": "#EBF0F8", "showbackground": true, "backgroundcolor": "white" } }, "title": { "x": 0.05 }, "xaxis": { "ticks": "", "gridcolor": "#EBF0F8", "linecolor": "#EBF0F8", "automargin": true, "zerolinecolor": "#EBF0F8", "zerolinewidth": 2 }, "yaxis": { "ticks": "", "gridcolor": "#EBF0F8", "linecolor": "#EBF0F8", "automargin": true, "zerolinecolor": "#EBF0F8", "zerolinewidth": 2 }, "ternary": { "aaxis": { "ticks": "", "gridcolor": "#DFE8F3", "linecolor": "#A2B1C6" }, "baxis": { "ticks": "", "gridcolor": "#DFE8F3", "linecolor": "#A2B1C6" }, "caxis": { "ticks": "", "gridcolor": "#DFE8F3", "linecolor": "#A2B1C6" }, "bgcolor": "white" }, "colorway": [ "#636efa", "#EF553B", "#00cc96", "#ab63fa", "#19d3f3", "#e763fa", "#fecb52", "#ffa15a", "#ff6692", "#b6e880" ], "hovermode": "closest", "colorscale": { "diverging": [ [ 0, "#8e0152" ], [ 0.1, "#c51b7d" ], [ 0.2, "#de77ae" ], [ 0.3, "#f1b6da" ], [ 0.4, "#fde0ef" ], [ 0.5, "#f7f7f7" ], [ 0.6, "#e6f5d0" ], [ 0.7, "#b8e186" ], [ 0.8, "#7fbc41" ], [ 0.9, "#4d9221" ], [ 1, "#276419" ] ], "sequential": [ [ 0, "#0508b8" ], [ 0.0893854748603352, "#1910d8" ], [ 0.1787709497206704, "#3c19f0" ], [ 0.2681564245810056, "#6b1cfb" ], [ 0.3575418994413408, "#981cfd" ], [ 0.44692737430167595, "#bf1cfd" ], [ 0.5363128491620112, "#dd2bfd" ], [ 0.6256983240223464, "#f246fe" ], [ 0.7150837988826816, "#fc67fd" ], [ 0.8044692737430168, "#fe88fc" ], [ 0.8938547486033519, "#fea5fd" ], [ 0.9832402234636871, "#febefe" ], [ 1, "#fec3fe" ] ], "sequentialminus": [ [ 0, "#0508b8" ], [ 0.0893854748603352, "#1910d8" ], [ 0.1787709497206704, "#3c19f0" ], [ 0.2681564245810056, "#6b1cfb" ], [ 0.3575418994413408, "#981cfd" ], [ 0.44692737430167595, "#bf1cfd" ], [ 0.5363128491620112, "#dd2bfd" ], [ 0.6256983240223464, "#f246fe" ], [ 0.7150837988826816, "#fc67fd" ], [ 0.8044692737430168, "#fe88fc" ], [ 0.8938547486033519, "#fea5fd" ], [ 0.9832402234636871, "#febefe" ], [ 1, "#fec3fe" ] ] }, "plot_bgcolor": "white", "paper_bgcolor": "white", "shapedefaults": { "line": { "width": 0 }, "opacity": 0.4, "fillcolor": "#506784" }, "annotationdefaults": { "arrowhead": 0, "arrowcolor": "#506784", "arrowwidth": 1 } }, "themeRef": "PLOTLY_WHITE" } } }, "height": null, "width": null, "user": { "profile_url": "https://chart-studio.plotly.com/~allan64", "avatar_url": "https://storage.googleapis.com/plotly-prod-profiles/66.jpg", "background_url": "https://storage.googleapis.com/plotly-prod-profiles/bg-13.jpg", "bio": "", "nickname": "", "website": "", "stream_tokens": null, "feature_set_id": null, "csrf_token": null, "date_joined": "2025-09-02 14:03:47", "mapbox_access_tokens": null, "has_password": null, "username": "allan64", "email": null, "is_active": null, "readonly": null, "is_dash_creator": null, "dash_created_count": null, "is_chart_creator": null, "charts_created_count": null } }, { "creation_time": "2025-09-02T14:54:42.661720Z", "comments": { "results": [], "count": 0 }, "parented": true, "embed_url": "https://chart-studio.plotly.com/~dsteinbe/1.embed", "fid": "dsteinbe:1", "filename": "Plot 1", "filetype": "plot", "img_url": "https://storage.googleapis.com/plotly-prod-images/dsteinbe/1/9_M6ME6L2TFK09L4GORDM6AVYCLDKRS3.png", "image_urls": { "default": "https://storage.googleapis.com/plotly-prod-images/dsteinbe/1/2_2PW3U7BHHR76DMX2CSP9JKBZZNDZYN.png", "block-thumb": "https://storage.googleapis.com/plotly-prod-images/dsteinbe/1/8_Y7P3WGMEBQ55YRI0YZC6FVSD4RZZHR.png", "list-thumb": "https://storage.googleapis.com/plotly-prod-images/dsteinbe/1/9_M6ME6L2TFK09L4GORDM6AVYCLDKRS3.png" }, "api_urls": { "files": "https://api.plotly.com/v2/files/dsteinbe:1", "plots": "https://api.plotly.com/v2/plots/dsteinbe:1", "parent": "https://api.plotly.com/v2/folders/home?user=dsteinbe" }, "owner": "dsteinbe", "parent": -1, "preview": "", "referencers": [], "references": [], "title": "", "views": 0, "web_url": "https://chart-studio.plotly.com/~dsteinbe/1/", "world_readable": true, "date_modified": "2025-09-02T14:57:02.646Z", "stars": { "results": [], "count": 0 }, "collaborators": { "results": [], "count": 0 }, "subfolder_count": null, "refresh_interval": null, "organize_view_url": "https://chart-studio.plotly.com/~dsteinbe/1/", "current_user_permission": "read", "is_theme": null, "is_template": false, "autosize": true, "caption": "", "figure": { "data": [ { "meta": { "columnNames": { "x": "Scope 1 , x; Scope 2 , x", "y": "Scope 1 , y" } }, "name": "Scope 1 ", "type": "bar", "xsrc": "dsteinbe:0:c6051d", "ysrc": "dsteinbe:0:3d9400" }, { "meta": { "columnNames": { "x": "Scope 1 , x; Scope 2 , x", "y": "Scope 2 , y" } }, "name": "Scope 2 ", "type": "bar", "xsrc": "dsteinbe:0:c6051d", "ysrc": "dsteinbe:0:2c0252" } ], "frames": [], "layout": { "title": { "text": "Carnegie Mellon University Annual Greenhouse Gas Emissions" }, "xaxis": { "type": "category", "range": [ -0.5, 19.5 ], "title": { "text": "Fiscal Year (July 1 - June 30)" }, "showgrid": false, "autorange": false }, "yaxis": { "type": "linear", "dtick": 1, "range": [ 0, 123396.27368421052 ], "title": { "text": "MT eCO2" }, "nticks": 25, "tickmode": "auto", "autorange": true, "rangemode": "tozero", "zerolinecolor": "#DDD" }, "legend": { "x": 1, "y": 1, "xanchor": "left", "yanchor": "auto", "traceorder": "normal" }, "barmode": "stack", "autosize": true, "colorway": [ "#0044BB", "#71AA13", "#627182" ], "hovermode": "closest", "hoverlabel": { "namelength": 35 }, "showlegend": true } }, "height": null, "width": null, "user": { "profile_url": "https://chart-studio.plotly.com/~dsteinbe", "avatar_url": "https://storage.googleapis.com/plotly-prod-profiles/39.jpg", "background_url": "https://storage.googleapis.com/plotly-prod-profiles/bg-5.jpg", "bio": "", "nickname": "", "website": "", "stream_tokens": null, "feature_set_id": null, "csrf_token": null, "date_joined": "2025-09-02 14:53:44", "mapbox_access_tokens": null, "has_password": null, "username": "dsteinbe", "email": null, "is_active": null, "readonly": null, "is_dash_creator": null, "dash_created_count": null, "is_chart_creator": null, "charts_created_count": null } }, { "creation_time": "2025-09-02T13:22:21.679543Z", "comments": { "results": [], "count": 0 }, "parented": true, "embed_url": "https://chart-studio.plotly.com/~rpedro/1.embed", "fid": "rpedro:1", "filename": "Plot 1", "filetype": "plot", "img_url": "https://storage.googleapis.com/plotly-prod-images/rpedro/1/9_B7IV569WAYQ5DHXPN9FGRNOWQSP9T9.png", "image_urls": { "default": "https://storage.googleapis.com/plotly-prod-images/rpedro/1/2_QMMU9IV9HECVSI6V2S1Y3YK58TBR2O.png", "block-thumb": "https://storage.googleapis.com/plotly-prod-images/rpedro/1/8_7ZTJ98OIG5P946EDNSQQF872CFHENE.png", "list-thumb": "https://storage.googleapis.com/plotly-prod-images/rpedro/1/9_B7IV569WAYQ5DHXPN9FGRNOWQSP9T9.png" }, "api_urls": { "files": "https://api.plotly.com/v2/files/rpedro:1", "plots": "https://api.plotly.com/v2/plots/rpedro:1", "parent": "https://api.plotly.com/v2/folders/home?user=rpedro" }, "owner": "rpedro", "parent": -1, "preview": "", "referencers": [], "references": [], "title": "", "views": 0, "web_url": "https://chart-studio.plotly.com/~rpedro/1/", "world_readable": true, "date_modified": "2025-09-02T13:22:21.691Z", "stars": { "results": [], "count": 0 }, "collaborators": { "results": [], "count": 0 }, "subfolder_count": null, "refresh_interval": null, "organize_view_url": "https://chart-studio.plotly.com/~rpedro/1/", "current_user_permission": "read", "is_theme": null, "is_template": false, "autosize": true, "caption": "", "figure": { "data": [ { "uid": "359bcf", "meta": { "columnNames": { "x": "A", "y": "B", "error_x": { "array": "C", "arrayminus": "D" }, "error_y": { "array": "D", "arrayminus": "D" } } }, "mode": "markers", "type": "scatter", "xsrc": "rpedro:0:2d4669", "ysrc": "rpedro:0:9f81f8", "marker": { "size": 10, "color": "#636efa" }, "error_x": { "meta": { "columnNames": { "array": "C", "arrayminus": "D" } }, "type": "data", "color": "#636efa", "value": 10, "width": 4, "visible": true, "arraysrc": "rpedro:0:293706", "symmetric": false, "thickness": 2, "arrayminussrc": "rpedro:0:319360" }, "error_y": { "meta": { "columnNames": { "array": "D", "arrayminus": "D" } }, "type": "data", "color": "rgb(99, 250, 109)", "width": 4, "visible": true, "arraysrc": "rpedro:0:319360", "traceref": 0, "symmetric": false, "thickness": 2, "arrayminussrc": "rpedro:0:319360" }, "stackgroup": "" }, { "uid": "b4ad63", "transforms": [ { "rms": "", "type": "fit", "inputUid": "359bcf", "regressor": "x", "parameters": [ { "hold": false, "name": "m", "error": 0, "value": 2 }, { "hold": false, "name": "b", "error": 0, "value": 0 } ], "regressand": "y", "correlation": "", "fitfunction": "m*x + b", "inputxrange": [], "outputxrange": [], "interpolation": 50 } ] } ], "frames": [], "layout": { "font": { "size": 12 }, "title": { "text": "Gender Gap in Earnings per University" }, "xaxis": { "type": "linear", "range": [ -0.38888888888888884, 5.388888888888888 ], "autorange": true }, "yaxis": { "type": "linear", "range": [ -0.760709010339734, 10.760709010339735 ], "autorange": true }, "dragmode": "zoom", "template": { "data": { "bar": [ { "type": "bar", "marker": { "colorbar": { "ticks": "", "outlinewidth": 0 } } } ], "table": [ { "type": "table", "cells": { "fill": { "color": "#EBF0F8" }, "line": { "color": "white" } }, "header": { "fill": { "color": "#C8D4E3" }, "line": { "color": "white" } } } ], "carpet": [ { "type": "carpet", "aaxis": { "gridcolor": "#C8D4E3", "linecolor": "#C8D4E3", "endlinecolor": "#2a3f5f", "minorgridcolor": "#C8D4E3", "startlinecolor": "#2a3f5f" }, "baxis": { "gridcolor": "#C8D4E3", "linecolor": "#C8D4E3", "endlinecolor": "#2a3f5f", "minorgridcolor": "#C8D4E3", "startlinecolor": "#2a3f5f" } } ], "mesh3d": [ { "type": "mesh3d", "colorbar": { "ticks": "", "outlinewidth": 0 } } ], "contour": [ { "type": "contour", "colorbar": { "ticks": "", "outlinewidth": 0 }, "autocolorscale": true } ], "heatmap": [ { "type": "heatmap", "colorbar": { "ticks": "", "outlinewidth": 0 }, "autocolorscale": true } ], "scatter": [ { "type": "scatter", "marker": { "colorbar": { "ticks": "", "outlinewidth": 0 } } } ], "surface": [ { "type": "surface", "colorbar": { "ticks": "", "outlinewidth": 0 } } ], "heatmapgl": [ { "type": "heatmapgl", "colorbar": { "ticks": "", "outlinewidth": 0 } } ], "histogram": [ { "type": "histogram", "marker": { "colorbar": { "ticks": "", "outlinewidth": 0 } } } ], "parcoords": [ { "line": { "colorbar": { "ticks": "", "outlinewidth": 0 } }, "type": "parcoords" } ], "scatter3d": [ { "type": "scatter3d", "marker": { "colorbar": { "ticks": "", "outlinewidth": 0 } } } ], "scattergl": [ { "type": "scattergl", "marker": { "colorbar": { "ticks": "", "outlinewidth": 0 } } } ], "choropleth": [ { "type": "choropleth", "colorbar": { "ticks": "", "outlinewidth": 0 } } ], "scattergeo": [ { "type": "scattergeo", "marker": { "colorbar": { "ticks": "", "outlinewidth": 0 } } } ], "histogram2d": [ { "type": "histogram2d", "colorbar": { "ticks": "", "outlinewidth": 0 }, "autocolorscale": true } ], "scatterpolar": [ { "type": "scatterpolar", "marker": { "colorbar": { "ticks": "", "outlinewidth": 0 } } } ], "contourcarpet": [ { "type": "contourcarpet", "colorbar": { "ticks": "", "outlinewidth": 0 } } ], "scattercarpet": [ { "type": "scattercarpet", "marker": { "colorbar": { "ticks": "", "outlinewidth": 0 } } } ], "scattermapbox": [ { "type": "scattermapbox", "marker": { "colorbar": { "ticks": "", "outlinewidth": 0 } } } ], "scatterpolargl": [ { "type": "scatterpolargl", "marker": { "colorbar": { "ticks": "", "outlinewidth": 0 } } } ], "scatterternary": [ { "type": "scatterternary", "marker": { "colorbar": { "ticks": "", "outlinewidth": 0 } } } ], "histogram2dcontour": [ { "type": "histogram2dcontour", "colorbar": { "ticks": "", "outlinewidth": 0 }, "autocolorscale": true } ] }, "layout": { "geo": { "bgcolor": "white", "showland": true, "lakecolor": "white", "landcolor": "white", "showlakes": true, "subunitcolor": "#C8D4E3" }, "font": { "color": "#2a3f5f" }, "polar": { "bgcolor": "white", "radialaxis": { "ticks": "", "gridcolor": "#EBF0F8", "linecolor": "#EBF0F8" }, "angularaxis": { "ticks": "", "gridcolor": "#EBF0F8", "linecolor": "#EBF0F8" } }, "scene": { "xaxis": { "ticks": "", "gridcolor": "#DFE8F3", "gridwidth": 2, "linecolor": "#EBF0F8", "zerolinecolor": "#EBF0F8", "showbackground": true, "backgroundcolor": "white" }, "yaxis": { "ticks": "", "gridcolor": "#DFE8F3", "gridwidth": 2, "linecolor": "#EBF0F8", "zerolinecolor": "#EBF0F8", "showbackground": true, "backgroundcolor": "white" }, "zaxis": { "ticks": "", "gridcolor": "#DFE8F3", "gridwidth": 2, "linecolor": "#EBF0F8", "zerolinecolor": "#EBF0F8", "showbackground": true, "backgroundcolor": "white" } }, "title": { "x": 0.05 }, "xaxis": { "ticks": "", "gridcolor": "#EBF0F8", "linecolor": "#EBF0F8", "automargin": true, "zerolinecolor": "#EBF0F8", "zerolinewidth": 2 }, "yaxis": { "ticks": "", "gridcolor": "#EBF0F8", "linecolor": "#EBF0F8", "automargin": true, "zerolinecolor": "#EBF0F8", "zerolinewidth": 2 }, "ternary": { "aaxis": { "ticks": "", "gridcolor": "#DFE8F3", "linecolor": "#A2B1C6" }, "baxis": { "ticks": "", "gridcolor": "#DFE8F3", "linecolor": "#A2B1C6" }, "caxis": { "ticks": "", "gridcolor": "#DFE8F3", "linecolor": "#A2B1C6" }, "bgcolor": "white" }, "colorway": [ "#636efa", "#EF553B", "#00cc96", "#ab63fa", "#19d3f3", "#e763fa", "#fecb52", "#ffa15a", "#ff6692", "#b6e880" ], "hovermode": "closest", "colorscale": { "diverging": [ [ 0, "#8e0152" ], [ 0.1, "#c51b7d" ], [ 0.2, "#de77ae" ], [ 0.3, "#f1b6da" ], [ 0.4, "#fde0ef" ], [ 0.5, "#f7f7f7" ], [ 0.6, "#e6f5d0" ], [ 0.7, "#b8e186" ], [ 0.8, "#7fbc41" ], [ 0.9, "#4d9221" ], [ 1, "#276419" ] ], "sequential": [ [ 0, "#0508b8" ], [ 0.0893854748603352, "#1910d8" ], [ 0.1787709497206704, "#3c19f0" ], [ 0.2681564245810056, "#6b1cfb" ], [ 0.3575418994413408, "#981cfd" ], [ 0.44692737430167595, "#bf1cfd" ], [ 0.5363128491620112, "#dd2bfd" ], [ 0.6256983240223464, "#f246fe" ], [ 0.7150837988826816, "#fc67fd" ], [ 0.8044692737430168, "#fe88fc" ], [ 0.8938547486033519, "#fea5fd" ], [ 0.9832402234636871, "#febefe" ], [ 1, "#fec3fe" ] ], "sequentialminus": [ [ 0, "#0508b8" ], [ 0.0893854748603352, "#1910d8" ], [ 0.1787709497206704, "#3c19f0" ], [ 0.2681564245810056, "#6b1cfb" ], [ 0.3575418994413408, "#981cfd" ], [ 0.44692737430167595, "#bf1cfd" ], [ 0.5363128491620112, "#dd2bfd" ], [ 0.6256983240223464, "#f246fe" ], [ 0.7150837988826816, "#fc67fd" ], [ 0.8044692737430168, "#fe88fc" ], [ 0.8938547486033519, "#fea5fd" ], [ 0.9832402234636871, "#febefe" ], [ 1, "#fec3fe" ] ] }, "plot_bgcolor": "white", "paper_bgcolor": "white", "shapedefaults": { "line": { "width": 0 }, "opacity": 0.4, "fillcolor": "#506784" }, "annotationdefaults": { "arrowhead": 0, "arrowcolor": "#506784", "arrowwidth": 1 } }, "themeRef": "PLOTLY_WHITE" } } }, "height": null, "width": null, "user": { "profile_url": "https://chart-studio.plotly.com/~rpedro", "avatar_url": "https://storage.googleapis.com/plotly-prod-profiles/72.jpg", "background_url": "https://storage.googleapis.com/plotly-prod-profiles/bg-8.jpg", "bio": "", "nickname": "", "website": "", "stream_tokens": null, "feature_set_id": null, "csrf_token": null, "date_joined": "2025-09-02 12:59:51", "mapbox_access_tokens": null, "has_password": null, "username": "rpedro", "email": null, "is_active": null, "readonly": null, "is_dash_creator": null, "dash_created_count": null, "is_chart_creator": null, "charts_created_count": null } } ] }
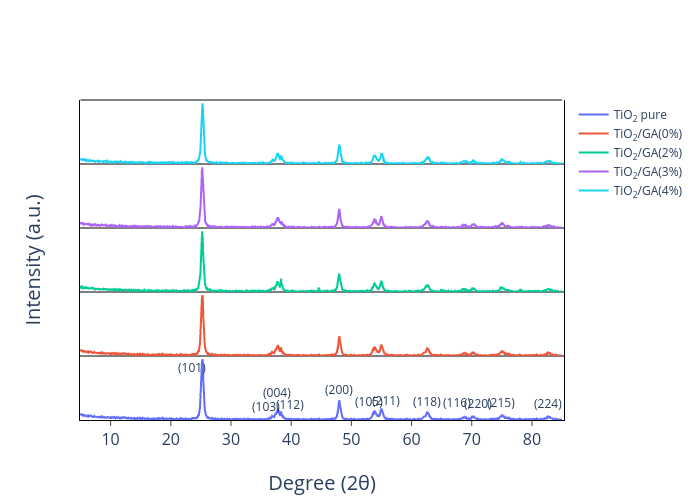