Plots List
Plots
This endpoint handles manipulation of Plotly plot files.
Reference
Authorization
Any user with or without a Plotly account may view public plots. For private plots, see authentication.
Actions
list
Listing all public plots can be done via a GET request to this endpoint.
By default, plots will be listed in order of date created. The order_by
query parameter is accepted at this endpoint. Currently, only ordering by
views is supported. It is possible to filter the plots by quality
with min_quality or max_quality as query parameter.
Example:
// GET https://api.plotly.com/v2/plots/ ---> 200

// GET https://api.plotly.com/v2/plots/?order_by=-views ---> 200

// GET https://api.plotly.com/v2/plots/?min_quality=5 ---> 200

// GET https://api.plotly.com/v2/plots/?max_quality=5 ---> 200
feed
Listing all handpicked feed plots can be done via a GET request to this endpoint. By default, plots will be listed in a random order.
Example:
// GET https://api.plotly.com/v2/plots/feed ---> 200
create
You can create new plot resources here. The only required field is 'figure'. Currently, the figure is restricted to only contain references to grid data. That is, this will fail if raw data arrays are passed in. To create and manipulate underlying grids for plots, see the grids endpoint.
Example:
// This fails because a figure field is required.
// POST https://api.plotly.com/v2/plots ---> 400 Bad Request
{}

// This fails because the figure has raw data
//POST https://api.plotly.com/v2/plots ---> 400 Bad Request
{
    "figure": {"data": [{"y": ['this', 'is', 'raw', 'data']}]}
}

// This succeeds because the figure has src keys, not raw data.
//POST https://api.plotly.com/v2/plots ---> 200 OK
{
    "figure": {"data": [{"ysrc": "sven:88:u8nd62"}]}
}
When creating a grid, you can optionally specify a source_fid to specify where a plot has come from:
- source_fid: the fid of a plot that was copied (and presumably edited) to produce this one
detail
There is a lot of meta information stored about plot files including filename, title, share_url, and content_url to name a few.
This information can only be reached with a GET to this endpoint.
Example:
// GET https://api.plotly.com/v2/plots/iheartgraphs:90
content
The contents of a plot can be downloaded via the content resource. The plot
content contains referenced grid/column data by default. If you wish to
return the raw grid/column data, the inline_data=true query must be included
in the request url. The Content-Type header will be appropriately set for the
response body.
Alternatively, you can set ?map_data=unreadable to append a mapping of
sources to data that belongs to grids which are unreadable for the
requestor. This is useful when you have read access to another users plot,
but that plot contains grid references which you don't have access to.
Examples:
// Returns referenced grid/column data
// GET https://api.plotly.com/v2/plots/iheartgraphs:90/content ---> 200 OK

// Returns full grid/column data
// GET https://api.plotly.com/v2/plots/iheartgraphs:90/content?inline_data=true ---> 200 OK

// Returns full grid/column data when requestor doesn't have permission
// to read the referenced grid.
// GET https://api.plotly.com/v2/plots/iheartgraphs:90/content?map_data=unreadable ---> 200 OK
GET /v2/plots/?cursor=cD0yMDI1LTA5LTE2KzA0JTNBMzYlM0ExMi4zNTgwNzclMkIwMCUzQTAw&format=api
{ "next": "https://api.plotly.com/v2/plots/?cursor=cD0yMDI1LTA5LTE2KzAzJTNBMjAlM0ExOS4xNzE3MzElMkIwMCUzQTAw&format=api", "previous": "https://api.plotly.com/v2/plots/?cursor=cj0xJnA9MjAyNS0wOS0xNiswNCUzQTM2JTNBMTAuNTk0MDY1JTJCMDAlM0EwMA%3D%3D&format=api", "results": [ { "creation_time": "2025-09-16T04:36:10.594065Z", "comments": { "results": [], "count": 0 }, "parented": true, "embed_url": "https://chart-studio.plotly.com/~hackathon_test/67.embed", "fid": "hackathon_test:67", "filename": "infracost-graph-table-1757997364", "filetype": "plot", "img_url": "https://api.plotly.com/v2/files/hackathon_test:67/image?image_name=list-thumb", "image_urls": { "default": "https://api.plotly.com/v2/files/hackathon_test:67/image?image_name=default", "block-thumb": "https://api.plotly.com/v2/files/hackathon_test:67/image?image_name=block-thumb", "list-thumb": "https://api.plotly.com/v2/files/hackathon_test:67/image?image_name=list-thumb" }, "api_urls": { "files": "https://api.plotly.com/v2/files/hackathon_test:67", "plots": "https://api.plotly.com/v2/plots/hackathon_test:67", "parent": "https://api.plotly.com/v2/folders/home?user=hackathon_test" }, "owner": "hackathon_test", "parent": -1, "preview": "", "referencers": [], "references": [], "title": "", "views": 0, "web_url": "https://chart-studio.plotly.com/~hackathon_test/67/", "world_readable": true, "date_modified": "2025-09-16T04:36:16.859Z", "stars": { "results": [], "count": 0 }, "collaborators": { "results": [], "count": 0 }, "subfolder_count": null, "refresh_interval": null, "organize_view_url": "https://chart-studio.plotly.com/~hackathon_test/67/", "current_user_permission": "read", "is_theme": null, "is_template": null, "autosize": true, "caption": "", "figure": { "data": [ { "name": "aws_lb.hack_lb", "type": "bar", "xsrc": "hackathon_test:69:091375", "ysrc": "hackathon_test:69:6021f1", "xaxis": "x", "yaxis": "y", "marker": { "color": "rgb(229, 134, 6)", "pattern": { "shape": "" } }, "showlegend": true, "legendgroup": "aws_lb.hack_lb", "offsetgroup": "aws_lb.hack_lb", "orientation": "v", "textposition": "auto", "hovertemplate": "Resource=%{x}<br>Monthly Cost ($)=%{y}<extra></extra>", "alignmentgroup": "True" }, { "name": "aws_db_instance.hack_db", "type": "bar", "xsrc": "hackathon_test:69:da2c4a", "ysrc": "hackathon_test:69:660507", "xaxis": "x", "yaxis": "y", "marker": { "color": "rgb(93, 105, 177)", "pattern": { "shape": "" } }, "showlegend": true, "legendgroup": "aws_db_instance.hack_db", "offsetgroup": "aws_db_instance.hack_db", "orientation": "v", "textposition": "auto", "hovertemplate": "Resource=%{x}<br>Monthly Cost ($)=%{y}<extra></extra>", "alignmentgroup": "True" }, { "name": "aws_instance.hack_vm", "type": "bar", "xsrc": "hackathon_test:69:804fc3", "ysrc": "hackathon_test:69:12610d", "xaxis": "x", "yaxis": "y", "marker": { "color": "rgb(82, 188, 163)", "pattern": { "shape": "" } }, "showlegend": true, "legendgroup": "aws_instance.hack_vm", "offsetgroup": "aws_instance.hack_vm", "orientation": "v", "textposition": "auto", "hovertemplate": "Resource=%{x}<br>Monthly Cost ($)=%{y}<extra></extra>", "alignmentgroup": "True" }, { "name": "aws_instance.hack_vm2", "type": "bar", "xsrc": "hackathon_test:69:110f16", "ysrc": "hackathon_test:69:99453a", "xaxis": "x", "yaxis": "y", "marker": { "color": "rgb(153, 201, 69)", "pattern": { "shape": "" } }, "showlegend": true, "legendgroup": "aws_instance.hack_vm2", "offsetgroup": "aws_instance.hack_vm2", "orientation": "v", "textposition": "auto", "hovertemplate": "Resource=%{x}<br>Monthly Cost ($)=%{y}<extra></extra>", "alignmentgroup": "True" }, { "name": "aws_ebs_volume.hack_volume", "type": "bar", "xsrc": "hackathon_test:69:796aa3", "ysrc": "hackathon_test:69:44cc12", "xaxis": "x", "yaxis": "y", "marker": { "color": "rgb(204, 97, 176)", "pattern": { "shape": "" } }, "showlegend": true, "legendgroup": "aws_ebs_volume.hack_volume", "offsetgroup": "aws_ebs_volume.hack_volume", "orientation": "v", "textposition": "auto", "hovertemplate": "Resource=%{x}<br>Monthly Cost ($)=%{y}<extra></extra>", "alignmentgroup": "True" }, { "type": "table", "cells": { "fill": { "colorsrc": "hackathon_test:69:8cc1a6" }, "font": { "size": 11 }, "align": "center", "valuessrc": "hackathon_test:69:83ecf9" }, "domain": { "x": [ 0.0, 1.0 ], "y": [ 0.0, 0.2976 ] }, "header": { "fill": { "color": "lightgrey" }, "font": { "size": 12, "color": "black" }, "align": "center", "valuessrc": "hackathon_test:69:5fc1f4" } } ], "layout": { "title": { "text": "Monthly Infracost Breakdown per Resource" }, "width": 1200, "xaxis": { "anchor": "y", "domain": [ 0.0, 1.0 ] }, "yaxis": { "anchor": "x", "domain": [ 0.3676, 1.0 ] }, "height": 900, "template": { "data": { "table": [ { "type": "table", "cells": { "fill": { "color": "#000038" }, "font": { "color": "#000037" }, "line": { "color": "#000039" } }, "header": { "fill": { "color": "#000040" }, "font": { "color": "#000036" }, "line": { "color": "#000039" } } } ], "icicle": [ { "type": "icicle", "textfont": { "color": "white" } } ], "sankey": [ { "type": "sankey", "textfont": { "color": "#000036" } } ], "contour": [ { "type": "contour", "colorscale": [ [ 0.0, "#000011" ], [ 0.1111111111111111, "#000012" ], [ 0.2222222222222222, "#000013" ], [ 0.3333333333333333, "#000014" ], [ 0.4444444444444444, "#000015" ], [ 0.5555555555555556, "#000016" ], [ 0.6666666666666666, "#000017" ], [ 0.7777777777777778, "#000018" ], [ 0.8888888888888888, "#000019" ], [ 1.0, "#000020" ] ] } ], "heatmap": [ { "type": "heatmap", "colorscale": [ [ 0.0, "#000011" ], [ 0.1111111111111111, "#000012" ], [ 0.2222222222222222, "#000013" ], [ 0.3333333333333333, "#000014" ], [ 0.4444444444444444, "#000015" ], [ 0.5555555555555556, "#000016" ], [ 0.6666666666666666, "#000017" ], [ 0.7777777777777778, "#000018" ], [ 0.8888888888888888, "#000019" ], [ 1.0, "#000020" ] ] } ], "scatter": [ { "type": "scatter", "marker": { "line": { "width": 0 } } } ], "waterfall": [ { "type": "waterfall", "totals": { "marker": { "color": "#000034" } }, "connector": { "line": { "color": "#000036", "width": 2 } }, "decreasing": { "marker": { "color": "#000033" } }, "increasing": { "marker": { "color": "#000032" } } } ], "candlestick": [ { "type": "candlestick", "decreasing": { "line": { "color": "#000033" } }, "increasing": { "line": { "color": "#000032" } } } ], "histogram2d": [ { "type": "histogram2d", "colorscale": [ [ 0.0, "#000011" ], [ 0.1111111111111111, "#000012" ], [ 0.2222222222222222, "#000013" ], [ 0.3333333333333333, "#000014" ], [ 0.4444444444444444, "#000015" ], [ 0.5555555555555556, "#000016" ], [ 0.6666666666666666, "#000017" ], [ 0.7777777777777778, "#000018" ], [ 0.8888888888888888, "#000019" ], [ 1.0, "#000020" ] ] } ], "contourcarpet": [ { "type": "contourcarpet", "colorscale": [ [ 0.0, "#000011" ], [ 0.1111111111111111, "#000012" ], [ 0.2222222222222222, "#000013" ], [ 0.3333333333333333, "#000014" ], [ 0.4444444444444444, "#000015" ], [ 0.5555555555555556, "#000016" ], [ 0.6666666666666666, "#000017" ], [ 0.7777777777777778, "#000018" ], [ 0.8888888888888888, "#000019" ], [ 1.0, "#000020" ] ] } ] }, "layout": { "colorway": [ "#000001", "#000002", "#000003", "#000004", "#000005", "#000006", "#000007", "#000008", "#000009", "#000010" ], "coloraxis": { "colorscale": [ [ 0.0, "#000011" ], [ 0.1111111111111111, "#000012" ], [ 0.2222222222222222, "#000013" ], [ 0.3333333333333333, "#000014" ], [ 0.4444444444444444, "#000015" ], [ 0.5555555555555556, "#000016" ], [ 0.6666666666666666, "#000017" ], [ 0.7777777777777778, "#000018" ], [ 0.8888888888888888, "#000019" ], [ 1.0, "#000020" ] ] }, "colorscale": { "diverging": [ [ 0.0, "#000021" ], [ 0.1, "#000022" ], [ 0.2, "#000023" ], [ 0.3, "#000024" ], [ 0.4, "#000025" ], [ 0.5, "#000026" ], [ 0.6, "#000027" ], [ 0.7, "#000028" ], [ 0.8, "#000029" ], [ 0.9, "#000030" ], [ 1.0, "#000031" ] ], "sequential": [ [ 0.0, "#000011" ], [ 0.1111111111111111, "#000012" ], [ 0.2222222222222222, "#000013" ], [ 0.3333333333333333, "#000014" ], [ 0.4444444444444444, "#000015" ], [ 0.5555555555555556, "#000016" ], [ 0.6666666666666666, "#000017" ], [ 0.7777777777777778, "#000018" ], [ 0.8888888888888888, "#000019" ], [ 1.0, "#000020" ] ], "sequentialminus": [ [ 0.0, "#000011" ], [ 0.1111111111111111, "#000012" ], [ 0.2222222222222222, "#000013" ], [ 0.3333333333333333, "#000014" ], [ 0.4444444444444444, "#000015" ], [ 0.5555555555555556, "#000016" ], [ 0.6666666666666666, "#000017" ], [ 0.7777777777777778, "#000018" ], [ 0.8888888888888888, "#000019" ], [ 1.0, "#000020" ] ] } } }, "plot_bgcolor": "rgba(245,245,245,1)", "paper_bgcolor": "rgba(245,245,245,1)" } }, "height": 900, "width": 1200, "user": { "profile_url": "https://chart-studio.plotly.com/~hackathon_test", "avatar_url": "https://storage.googleapis.com/plotly-prod-profiles/21.jpg", "background_url": "https://storage.googleapis.com/plotly-prod-profiles/bg-7.jpg", "bio": "", "nickname": "", "website": "", "stream_tokens": null, "feature_set_id": null, "csrf_token": null, "date_joined": "2025-09-16 02:59:33", "mapbox_access_tokens": null, "has_password": null, "username": "hackathon_test", "email": null, "is_active": null, "readonly": null, "is_dash_creator": null, "dash_created_count": null, "is_chart_creator": null, "charts_created_count": null } }, { "creation_time": "2025-09-16T04:30:26.284467Z", "comments": { "results": [], "count": 0 }, "parented": true, "embed_url": "https://chart-studio.plotly.com/~hackathon_test/61.embed", "fid": "hackathon_test:61", "filename": "infracost-graph-table-1757997018", "filetype": "plot", "img_url": "https://api.plotly.com/v2/files/hackathon_test:61/image?image_name=list-thumb", "image_urls": { "default": "https://api.plotly.com/v2/files/hackathon_test:61/image?image_name=default", "block-thumb": "https://storage.googleapis.com/plotly-prod-images/hackathon_test/61/8_YV7UQGZ6GZV0BM3ZCTGMLO8W3OUQMY.png", "list-thumb": "https://api.plotly.com/v2/files/hackathon_test:61/image?image_name=list-thumb" }, "api_urls": { "files": "https://api.plotly.com/v2/files/hackathon_test:61", "plots": "https://api.plotly.com/v2/plots/hackathon_test:61", "parent": "https://api.plotly.com/v2/folders/home?user=hackathon_test" }, "owner": "hackathon_test", "parent": -1, "preview": "", "referencers": [], "references": [], "title": "", "views": 0, "web_url": "https://chart-studio.plotly.com/~hackathon_test/61/", "world_readable": true, "date_modified": "2025-09-16T04:30:26.295Z", "stars": { "results": [], "count": 0 }, "collaborators": { "results": [], "count": 0 }, "subfolder_count": null, "refresh_interval": null, "organize_view_url": "https://chart-studio.plotly.com/~hackathon_test/61/", "current_user_permission": "read", "is_theme": null, "is_template": null, "autosize": true, "caption": "", "figure": { "data": [ { "name": "aws_lb.hack_lb", "type": "bar", "xsrc": "hackathon_test:60:10c7a9", "ysrc": "hackathon_test:60:8b458d", "xaxis": "x", "yaxis": "y", "marker": { "color": "rgb(229, 134, 6)", "pattern": { "shape": "" } }, "showlegend": true, "legendgroup": "aws_lb.hack_lb", "offsetgroup": "aws_lb.hack_lb", "orientation": "v", "textposition": "auto", "hovertemplate": "Resource=%{x}<br>Monthly Cost ($)=%{y}<extra></extra>", "alignmentgroup": "True" }, { "name": "aws_db_instance.hack_db", "type": "bar", "xsrc": "hackathon_test:60:ad10f4", "ysrc": "hackathon_test:60:6d4a73", "xaxis": "x", "yaxis": "y", "marker": { "color": "rgb(93, 105, 177)", "pattern": { "shape": "" } }, "showlegend": true, "legendgroup": "aws_db_instance.hack_db", "offsetgroup": "aws_db_instance.hack_db", "orientation": "v", "textposition": "auto", "hovertemplate": "Resource=%{x}<br>Monthly Cost ($)=%{y}<extra></extra>", "alignmentgroup": "True" }, { "name": "aws_instance.hack_vm", "type": "bar", "xsrc": "hackathon_test:60:b160f1", "ysrc": "hackathon_test:60:fdf363", "xaxis": "x", "yaxis": "y", "marker": { "color": "rgb(82, 188, 163)", "pattern": { "shape": "" } }, "showlegend": true, "legendgroup": "aws_instance.hack_vm", "offsetgroup": "aws_instance.hack_vm", "orientation": "v", "textposition": "auto", "hovertemplate": "Resource=%{x}<br>Monthly Cost ($)=%{y}<extra></extra>", "alignmentgroup": "True" }, { "name": "aws_instance.hack_vm2", "type": "bar", "xsrc": "hackathon_test:60:bc576f", "ysrc": "hackathon_test:60:a41070", "xaxis": "x", "yaxis": "y", "marker": { "color": "rgb(153, 201, 69)", "pattern": { "shape": "" } }, "showlegend": true, "legendgroup": "aws_instance.hack_vm2", "offsetgroup": "aws_instance.hack_vm2", "orientation": "v", "textposition": "auto", "hovertemplate": "Resource=%{x}<br>Monthly Cost ($)=%{y}<extra></extra>", "alignmentgroup": "True" }, { "name": "aws_ebs_volume.hack_volume", "type": "bar", "xsrc": "hackathon_test:60:4c2fce", "ysrc": "hackathon_test:60:b63332", "xaxis": "x", "yaxis": "y", "marker": { "color": "rgb(204, 97, 176)", "pattern": { "shape": "" } }, "showlegend": true, "legendgroup": "aws_ebs_volume.hack_volume", "offsetgroup": "aws_ebs_volume.hack_volume", "orientation": "v", "textposition": "auto", "hovertemplate": "Resource=%{x}<br>Monthly Cost ($)=%{y}<extra></extra>", "alignmentgroup": "True" }, { "type": "table", "cells": { "fill": { "colorsrc": "hackathon_test:60:547909" }, "font": { "size": 11 }, "align": "center", "valuessrc": "hackathon_test:60:2e615c" }, "domain": { "x": [ 0.0, 1.0 ], "y": [ 0.0, 0.2976 ] }, "header": { "fill": { "color": "lightgrey" }, "font": { "size": 12, "color": "black" }, "align": "center", "valuessrc": "hackathon_test:60:5bfdc9" } } ], "layout": { "title": { "text": "Monthly Infracost Breakdown per Resource" }, "width": 1200, "xaxis": { "anchor": "y", "domain": [ 0.0, 1.0 ] }, "yaxis": { "anchor": "x", "domain": [ 0.3676, 1.0 ] }, "height": 900, "template": { "data": { "table": [ { "type": "table", "cells": { "fill": { "color": "#000038" }, "font": { "color": "#000037" }, "line": { "color": "#000039" } }, "header": { "fill": { "color": "#000040" }, "font": { "color": "#000036" }, "line": { "color": "#000039" } } } ], "icicle": [ { "type": "icicle", "textfont": { "color": "white" } } ], "sankey": [ { "type": "sankey", "textfont": { "color": "#000036" } } ], "contour": [ { "type": "contour", "colorscale": [ [ 0.0, "#000011" ], [ 0.1111111111111111, "#000012" ], [ 0.2222222222222222, "#000013" ], [ 0.3333333333333333, "#000014" ], [ 0.4444444444444444, "#000015" ], [ 0.5555555555555556, "#000016" ], [ 0.6666666666666666, "#000017" ], [ 0.7777777777777778, "#000018" ], [ 0.8888888888888888, "#000019" ], [ 1.0, "#000020" ] ] } ], "heatmap": [ { "type": "heatmap", "colorscale": [ [ 0.0, "#000011" ], [ 0.1111111111111111, "#000012" ], [ 0.2222222222222222, "#000013" ], [ 0.3333333333333333, "#000014" ], [ 0.4444444444444444, "#000015" ], [ 0.5555555555555556, "#000016" ], [ 0.6666666666666666, "#000017" ], [ 0.7777777777777778, "#000018" ], [ 0.8888888888888888, "#000019" ], [ 1.0, "#000020" ] ] } ], "scatter": [ { "type": "scatter", "marker": { "line": { "width": 0 } } } ], "waterfall": [ { "type": "waterfall", "totals": { "marker": { "color": "#000034" } }, "connector": { "line": { "color": "#000036", "width": 2 } }, "decreasing": { "marker": { "color": "#000033" } }, "increasing": { "marker": { "color": "#000032" } } } ], "candlestick": [ { "type": "candlestick", "decreasing": { "line": { "color": "#000033" } }, "increasing": { "line": { "color": "#000032" } } } ], "histogram2d": [ { "type": "histogram2d", "colorscale": [ [ 0.0, "#000011" ], [ 0.1111111111111111, "#000012" ], [ 0.2222222222222222, "#000013" ], [ 0.3333333333333333, "#000014" ], [ 0.4444444444444444, "#000015" ], [ 0.5555555555555556, "#000016" ], [ 0.6666666666666666, "#000017" ], [ 0.7777777777777778, "#000018" ], [ 0.8888888888888888, "#000019" ], [ 1.0, "#000020" ] ] } ], "contourcarpet": [ { "type": "contourcarpet", "colorscale": [ [ 0.0, "#000011" ], [ 0.1111111111111111, "#000012" ], [ 0.2222222222222222, "#000013" ], [ 0.3333333333333333, "#000014" ], [ 0.4444444444444444, "#000015" ], [ 0.5555555555555556, "#000016" ], [ 0.6666666666666666, "#000017" ], [ 0.7777777777777778, "#000018" ], [ 0.8888888888888888, "#000019" ], [ 1.0, "#000020" ] ] } ] }, "layout": { "colorway": [ "#000001", "#000002", "#000003", "#000004", "#000005", "#000006", "#000007", "#000008", "#000009", "#000010" ], "coloraxis": { "colorscale": [ [ 0.0, "#000011" ], [ 0.1111111111111111, "#000012" ], [ 0.2222222222222222, "#000013" ], [ 0.3333333333333333, "#000014" ], [ 0.4444444444444444, "#000015" ], [ 0.5555555555555556, "#000016" ], [ 0.6666666666666666, "#000017" ], [ 0.7777777777777778, "#000018" ], [ 0.8888888888888888, "#000019" ], [ 1.0, "#000020" ] ] }, "colorscale": { "diverging": [ [ 0.0, "#000021" ], [ 0.1, "#000022" ], [ 0.2, "#000023" ], [ 0.3, "#000024" ], [ 0.4, "#000025" ], [ 0.5, "#000026" ], [ 0.6, "#000027" ], [ 0.7, "#000028" ], [ 0.8, "#000029" ], [ 0.9, "#000030" ], [ 1.0, "#000031" ] ], "sequential": [ [ 0.0, "#000011" ], [ 0.1111111111111111, "#000012" ], [ 0.2222222222222222, "#000013" ], [ 0.3333333333333333, "#000014" ], [ 0.4444444444444444, "#000015" ], [ 0.5555555555555556, "#000016" ], [ 0.6666666666666666, "#000017" ], [ 0.7777777777777778, "#000018" ], [ 0.8888888888888888, "#000019" ], [ 1.0, "#000020" ] ], "sequentialminus": [ [ 0.0, "#000011" ], [ 0.1111111111111111, "#000012" ], [ 0.2222222222222222, "#000013" ], [ 0.3333333333333333, "#000014" ], [ 0.4444444444444444, "#000015" ], [ 0.5555555555555556, "#000016" ], [ 0.6666666666666666, "#000017" ], [ 0.7777777777777778, "#000018" ], [ 0.8888888888888888, "#000019" ], [ 1.0, "#000020" ] ] } } }, "plot_bgcolor": "rgba(245,245,245,1)", "paper_bgcolor": "rgba(245,245,245,1)" } }, "height": 900, "width": 1200, "user": { "profile_url": "https://chart-studio.plotly.com/~hackathon_test", "avatar_url": "https://storage.googleapis.com/plotly-prod-profiles/21.jpg", "background_url": "https://storage.googleapis.com/plotly-prod-profiles/bg-7.jpg", "bio": "", "nickname": "", "website": "", "stream_tokens": null, "feature_set_id": null, "csrf_token": null, "date_joined": "2025-09-16 02:59:33", "mapbox_access_tokens": null, "has_password": null, "username": "hackathon_test", "email": null, "is_active": null, "readonly": null, "is_dash_creator": null, "dash_created_count": null, "is_chart_creator": null, "charts_created_count": null } }, { "creation_time": "2025-09-16T03:30:22.577591Z", "comments": { "results": [], "count": 0 }, "parented": true, "embed_url": "https://chart-studio.plotly.com/~hackathon_test/47.embed", "fid": "hackathon_test:47", "filename": "infracost-costs-1757993415", "filetype": "plot", "img_url": "https://api.plotly.com/v2/files/hackathon_test:47/image?image_name=list-thumb", "image_urls": { "default": "https://api.plotly.com/v2/files/hackathon_test:47/image?image_name=default", "block-thumb": "https://storage.googleapis.com/plotly-prod-images/hackathon_test/47/8_C7ZCV08216BQ0E0QJ8XDT0A2N9OX0B.png", "list-thumb": "https://api.plotly.com/v2/files/hackathon_test:47/image?image_name=list-thumb" }, "api_urls": { "files": "https://api.plotly.com/v2/files/hackathon_test:47", "plots": "https://api.plotly.com/v2/plots/hackathon_test:47", "parent": "https://api.plotly.com/v2/folders/home?user=hackathon_test" }, "owner": "hackathon_test", "parent": -1, "preview": "", "referencers": [], "references": [], "title": "", "views": 0, "web_url": "https://chart-studio.plotly.com/~hackathon_test/47/", "world_readable": true, "date_modified": "2025-09-16T03:30:22.588Z", "stars": { "results": [], "count": 0 }, "collaborators": { "results": [], "count": 0 }, "subfolder_count": null, "refresh_interval": null, "organize_view_url": "https://chart-studio.plotly.com/~hackathon_test/47/", "current_user_permission": "read", "is_theme": null, "is_template": null, "autosize": true, "caption": "", "figure": { "data": [ { "name": "aws_lb.hack_lb", "type": "bar", "xsrc": "hackathon_test:43:a14526", "ysrc": "hackathon_test:43:e81d39", "xaxis": "x", "yaxis": "y", "marker": { "color": "rgb(229, 134, 6)", "pattern": { "shape": "" } }, "showlegend": true, "legendgroup": "aws_lb.hack_lb", "offsetgroup": "aws_lb.hack_lb", "orientation": "v", "textposition": "auto", "hovertemplate": "Resource=%{x}<br>Monthly Cost ($)=%{y}<extra></extra>", "alignmentgroup": "True" }, { "name": "aws_db_instance.hack_db", "type": "bar", "xsrc": "hackathon_test:43:ba485e", "ysrc": "hackathon_test:43:e102e4", "xaxis": "x", "yaxis": "y", "marker": { "color": "rgb(93, 105, 177)", "pattern": { "shape": "" } }, "showlegend": true, "legendgroup": "aws_db_instance.hack_db", "offsetgroup": "aws_db_instance.hack_db", "orientation": "v", "textposition": "auto", "hovertemplate": "Resource=%{x}<br>Monthly Cost ($)=%{y}<extra></extra>", "alignmentgroup": "True" }, { "name": "aws_instance.hack_vm", "type": "bar", "xsrc": "hackathon_test:43:be05a7", "ysrc": "hackathon_test:43:e59f81", "xaxis": "x", "yaxis": "y", "marker": { "color": "rgb(82, 188, 163)", "pattern": { "shape": "" } }, "showlegend": true, "legendgroup": "aws_instance.hack_vm", "offsetgroup": "aws_instance.hack_vm", "orientation": "v", "textposition": "auto", "hovertemplate": "Resource=%{x}<br>Monthly Cost ($)=%{y}<extra></extra>", "alignmentgroup": "True" }, { "name": "aws_instance.hack_vm2", "type": "bar", "xsrc": "hackathon_test:43:a0ddd0", "ysrc": "hackathon_test:43:5c3b22", "xaxis": "x", "yaxis": "y", "marker": { "color": "rgb(153, 201, 69)", "pattern": { "shape": "" } }, "showlegend": true, "legendgroup": "aws_instance.hack_vm2", "offsetgroup": "aws_instance.hack_vm2", "orientation": "v", "textposition": "auto", "hovertemplate": "Resource=%{x}<br>Monthly Cost ($)=%{y}<extra></extra>", "alignmentgroup": "True" }, { "name": "aws_ebs_volume.hack_volume", "type": "bar", "xsrc": "hackathon_test:43:2271d6", "ysrc": "hackathon_test:43:c3e877", "xaxis": "x", "yaxis": "y", "marker": { "color": "rgb(204, 97, 176)", "pattern": { "shape": "" } }, "showlegend": true, "legendgroup": "aws_ebs_volume.hack_volume", "offsetgroup": "aws_ebs_volume.hack_volume", "orientation": "v", "textposition": "auto", "hovertemplate": "Resource=%{x}<br>Monthly Cost ($)=%{y}<extra></extra>", "alignmentgroup": "True" } ], "layout": { "title": { "text": "Monthly Infracost Breakdown per Resource" }, "width": 1200, "xaxis": { "title": { "text": "Resource" }, "anchor": "y", "domain": [ 0.0, 1.0 ], "tickangle": -30, "categoryarray": [ "aws_lb.hack_lb", "aws_db_instance.hack_db", "aws_instance.hack_vm", "aws_instance.hack_vm2", "aws_ebs_volume.hack_volume" ], "categoryorder": "array" }, "yaxis": { "title": { "text": "Monthly Cost ($)" }, "anchor": "x", "domain": [ 0.0, 1.0 ] }, "legend": { "x": 1, "y": 1, "font": { "size": 10 }, "title": { "text": "Resource" }, "bgcolor": "rgba(255,255,255,0.6)", "xanchor": "left", "yanchor": "top", "bordercolor": "black", "borderwidth": 1, "orientation": "v", "tracegroupgap": 0 }, "barmode": "relative", "template": { "data": { "table": [ { "type": "table", "cells": { "fill": { "color": "#000038" }, "font": { "color": "#000037" }, "line": { "color": "#000039" } }, "header": { "fill": { "color": "#000040" }, "font": { "color": "#000036" }, "line": { "color": "#000039" } } } ], "icicle": [ { "type": "icicle", "textfont": { "color": "white" } } ], "sankey": [ { "type": "sankey", "textfont": { "color": "#000036" } } ], "contour": [ { "type": "contour", "colorscale": [ [ 0.0, "#000011" ], [ 0.1111111111111111, "#000012" ], [ 0.2222222222222222, "#000013" ], [ 0.3333333333333333, "#000014" ], [ 0.4444444444444444, "#000015" ], [ 0.5555555555555556, "#000016" ], [ 0.6666666666666666, "#000017" ], [ 0.7777777777777778, "#000018" ], [ 0.8888888888888888, "#000019" ], [ 1.0, "#000020" ] ] } ], "heatmap": [ { "type": "heatmap", "colorscale": [ [ 0.0, "#000011" ], [ 0.1111111111111111, "#000012" ], [ 0.2222222222222222, "#000013" ], [ 0.3333333333333333, "#000014" ], [ 0.4444444444444444, "#000015" ], [ 0.5555555555555556, "#000016" ], [ 0.6666666666666666, "#000017" ], [ 0.7777777777777778, "#000018" ], [ 0.8888888888888888, "#000019" ], [ 1.0, "#000020" ] ] } ], "scatter": [ { "type": "scatter", "marker": { "line": { "width": 0 } } } ], "waterfall": [ { "type": "waterfall", "totals": { "marker": { "color": "#000034" } }, "connector": { "line": { "color": "#000036", "width": 2 } }, "decreasing": { "marker": { "color": "#000033" } }, "increasing": { "marker": { "color": "#000032" } } } ], "candlestick": [ { "type": "candlestick", "decreasing": { "line": { "color": "#000033" } }, "increasing": { "line": { "color": "#000032" } } } ], "histogram2d": [ { "type": "histogram2d", "colorscale": [ [ 0.0, "#000011" ], [ 0.1111111111111111, "#000012" ], [ 0.2222222222222222, "#000013" ], [ 0.3333333333333333, "#000014" ], [ 0.4444444444444444, "#000015" ], [ 0.5555555555555556, "#000016" ], [ 0.6666666666666666, "#000017" ], [ 0.7777777777777778, "#000018" ], [ 0.8888888888888888, "#000019" ], [ 1.0, "#000020" ] ] } ], "contourcarpet": [ { "type": "contourcarpet", "colorscale": [ [ 0.0, "#000011" ], [ 0.1111111111111111, "#000012" ], [ 0.2222222222222222, "#000013" ], [ 0.3333333333333333, "#000014" ], [ 0.4444444444444444, "#000015" ], [ 0.5555555555555556, "#000016" ], [ 0.6666666666666666, "#000017" ], [ 0.7777777777777778, "#000018" ], [ 0.8888888888888888, "#000019" ], [ 1.0, "#000020" ] ] } ] }, "layout": { "colorway": [ "#000001", "#000002", "#000003", "#000004", "#000005", "#000006", "#000007", "#000008", "#000009", "#000010" ], "coloraxis": { "colorscale": [ [ 0.0, "#000011" ], [ 0.1111111111111111, "#000012" ], [ 0.2222222222222222, "#000013" ], [ 0.3333333333333333, "#000014" ], [ 0.4444444444444444, "#000015" ], [ 0.5555555555555556, "#000016" ], [ 0.6666666666666666, "#000017" ], [ 0.7777777777777778, "#000018" ], [ 0.8888888888888888, "#000019" ], [ 1.0, "#000020" ] ] }, "colorscale": { "diverging": [ [ 0.0, "#000021" ], [ 0.1, "#000022" ], [ 0.2, "#000023" ], [ 0.3, "#000024" ], [ 0.4, "#000025" ], [ 0.5, "#000026" ], [ 0.6, "#000027" ], [ 0.7, "#000028" ], [ 0.8, "#000029" ], [ 0.9, "#000030" ], [ 1.0, "#000031" ] ], "sequential": [ [ 0.0, "#000011" ], [ 0.1111111111111111, "#000012" ], [ 0.2222222222222222, "#000013" ], [ 0.3333333333333333, "#000014" ], [ 0.4444444444444444, "#000015" ], [ 0.5555555555555556, "#000016" ], [ 0.6666666666666666, "#000017" ], [ 0.7777777777777778, "#000018" ], [ 0.8888888888888888, "#000019" ], [ 1.0, "#000020" ] ], "sequentialminus": [ [ 0.0, "#000011" ], [ 0.1111111111111111, "#000012" ], [ 0.2222222222222222, "#000013" ], [ 0.3333333333333333, "#000014" ], [ 0.4444444444444444, "#000015" ], [ 0.5555555555555556, "#000016" ], [ 0.6666666666666666, "#000017" ], [ 0.7777777777777778, "#000018" ], [ 0.8888888888888888, "#000019" ], [ 1.0, "#000020" ] ] } } }, "plot_bgcolor": "rgba(245,245,245,1)", "paper_bgcolor": "rgba(245,245,245,1)" } }, "height": null, "width": 1200, "user": { "profile_url": "https://chart-studio.plotly.com/~hackathon_test", "avatar_url": "https://storage.googleapis.com/plotly-prod-profiles/21.jpg", "background_url": "https://storage.googleapis.com/plotly-prod-profiles/bg-7.jpg", "bio": "", "nickname": "", "website": "", "stream_tokens": null, "feature_set_id": null, "csrf_token": null, "date_joined": "2025-09-16 02:59:33", "mapbox_access_tokens": null, "has_password": null, "username": "hackathon_test", "email": null, "is_active": null, "readonly": null, "is_dash_creator": null, "dash_created_count": null, "is_chart_creator": null, "charts_created_count": null } }, { "creation_time": "2025-09-16T03:30:20.523905Z", "comments": { "results": [], "count": 0 }, "parented": true, "embed_url": "https://chart-studio.plotly.com/~hackathon_test/46.embed", "fid": "hackathon_test:46", "filename": "infracost-costs-1757993414", "filetype": "plot", "img_url": "https://api.plotly.com/v2/files/hackathon_test:46/image?image_name=list-thumb", "image_urls": { "default": "https://api.plotly.com/v2/files/hackathon_test:46/image?image_name=default", "block-thumb": "https://storage.googleapis.com/plotly-prod-images/hackathon_test/46/8_0F10P0PIXWJOIJWF6Z9OB1FXHYTTWO.png", "list-thumb": "https://api.plotly.com/v2/files/hackathon_test:46/image?image_name=list-thumb" }, "api_urls": { "files": "https://api.plotly.com/v2/files/hackathon_test:46", "plots": "https://api.plotly.com/v2/plots/hackathon_test:46", "parent": "https://api.plotly.com/v2/folders/home?user=hackathon_test" }, "owner": "hackathon_test", "parent": -1, "preview": "", "referencers": [], "references": [], "title": "", "views": 0, "web_url": "https://chart-studio.plotly.com/~hackathon_test/46/", "world_readable": true, "date_modified": "2025-09-16T03:30:20.534Z", "stars": { "results": [], "count": 0 }, "collaborators": { "results": [], "count": 0 }, "subfolder_count": null, "refresh_interval": null, "organize_view_url": "https://chart-studio.plotly.com/~hackathon_test/46/", "current_user_permission": "read", "is_theme": null, "is_template": null, "autosize": true, "caption": "", "figure": { "data": [ { "name": "aws_lb.hack_lb", "type": "bar", "xsrc": "hackathon_test:41:6dcc79", "ysrc": "hackathon_test:41:82370e", "xaxis": "x", "yaxis": "y", "marker": { "color": "rgb(229, 134, 6)", "pattern": { "shape": "" } }, "showlegend": true, "legendgroup": "aws_lb.hack_lb", "offsetgroup": "aws_lb.hack_lb", "orientation": "v", "textposition": "auto", "hovertemplate": "Resource=%{x}<br>Monthly Cost ($)=%{y}<extra></extra>", "alignmentgroup": "True" }, { "name": "aws_db_instance.hack_db", "type": "bar", "xsrc": "hackathon_test:41:a6c174", "ysrc": "hackathon_test:41:33769e", "xaxis": "x", "yaxis": "y", "marker": { "color": "rgb(93, 105, 177)", "pattern": { "shape": "" } }, "showlegend": true, "legendgroup": "aws_db_instance.hack_db", "offsetgroup": "aws_db_instance.hack_db", "orientation": "v", "textposition": "auto", "hovertemplate": "Resource=%{x}<br>Monthly Cost ($)=%{y}<extra></extra>", "alignmentgroup": "True" }, { "name": "aws_instance.hack_vm", "type": "bar", "xsrc": "hackathon_test:41:6d870f", "ysrc": "hackathon_test:41:9666da", "xaxis": "x", "yaxis": "y", "marker": { "color": "rgb(82, 188, 163)", "pattern": { "shape": "" } }, "showlegend": true, "legendgroup": "aws_instance.hack_vm", "offsetgroup": "aws_instance.hack_vm", "orientation": "v", "textposition": "auto", "hovertemplate": "Resource=%{x}<br>Monthly Cost ($)=%{y}<extra></extra>", "alignmentgroup": "True" }, { "name": "aws_instance.hack_vm2", "type": "bar", "xsrc": "hackathon_test:41:72502b", "ysrc": "hackathon_test:41:878116", "xaxis": "x", "yaxis": "y", "marker": { "color": "rgb(153, 201, 69)", "pattern": { "shape": "" } }, "showlegend": true, "legendgroup": "aws_instance.hack_vm2", "offsetgroup": "aws_instance.hack_vm2", "orientation": "v", "textposition": "auto", "hovertemplate": "Resource=%{x}<br>Monthly Cost ($)=%{y}<extra></extra>", "alignmentgroup": "True" }, { "name": "aws_ebs_volume.hack_volume", "type": "bar", "xsrc": "hackathon_test:41:0b5260", "ysrc": "hackathon_test:41:0f61c1", "xaxis": "x", "yaxis": "y", "marker": { "color": "rgb(204, 97, 176)", "pattern": { "shape": "" } }, "showlegend": true, "legendgroup": "aws_ebs_volume.hack_volume", "offsetgroup": "aws_ebs_volume.hack_volume", "orientation": "v", "textposition": "auto", "hovertemplate": "Resource=%{x}<br>Monthly Cost ($)=%{y}<extra></extra>", "alignmentgroup": "True" } ], "layout": { "title": { "text": "Monthly Infracost Breakdown per Resource" }, "width": 1200, "xaxis": { "title": { "text": "Resource" }, "anchor": "y", "domain": [ 0.0, 1.0 ], "tickangle": -30, "categoryarray": [ "aws_lb.hack_lb", "aws_db_instance.hack_db", "aws_instance.hack_vm", "aws_instance.hack_vm2", "aws_ebs_volume.hack_volume" ], "categoryorder": "array" }, "yaxis": { "title": { "text": "Monthly Cost ($)" }, "anchor": "x", "domain": [ 0.0, 1.0 ] }, "legend": { "x": 1, "y": 1, "font": { "size": 10 }, "title": { "text": "Resource" }, "bgcolor": "rgba(255,255,255,0.6)", "xanchor": "left", "yanchor": "top", "bordercolor": "black", "borderwidth": 1, "orientation": "v", "tracegroupgap": 0 }, "barmode": "relative", "template": { "data": { "table": [ { "type": "table", "cells": { "fill": { "color": "#000038" }, "font": { "color": "#000037" }, "line": { "color": "#000039" } }, "header": { "fill": { "color": "#000040" }, "font": { "color": "#000036" }, "line": { "color": "#000039" } } } ], "icicle": [ { "type": "icicle", "textfont": { "color": "white" } } ], "sankey": [ { "type": "sankey", "textfont": { "color": "#000036" } } ], "contour": [ { "type": "contour", "colorscale": [ [ 0.0, "#000011" ], [ 0.1111111111111111, "#000012" ], [ 0.2222222222222222, "#000013" ], [ 0.3333333333333333, "#000014" ], [ 0.4444444444444444, "#000015" ], [ 0.5555555555555556, "#000016" ], [ 0.6666666666666666, "#000017" ], [ 0.7777777777777778, "#000018" ], [ 0.8888888888888888, "#000019" ], [ 1.0, "#000020" ] ] } ], "heatmap": [ { "type": "heatmap", "colorscale": [ [ 0.0, "#000011" ], [ 0.1111111111111111, "#000012" ], [ 0.2222222222222222, "#000013" ], [ 0.3333333333333333, "#000014" ], [ 0.4444444444444444, "#000015" ], [ 0.5555555555555556, "#000016" ], [ 0.6666666666666666, "#000017" ], [ 0.7777777777777778, "#000018" ], [ 0.8888888888888888, "#000019" ], [ 1.0, "#000020" ] ] } ], "scatter": [ { "type": "scatter", "marker": { "line": { "width": 0 } } } ], "waterfall": [ { "type": "waterfall", "totals": { "marker": { "color": "#000034" } }, "connector": { "line": { "color": "#000036", "width": 2 } }, "decreasing": { "marker": { "color": "#000033" } }, "increasing": { "marker": { "color": "#000032" } } } ], "candlestick": [ { "type": "candlestick", "decreasing": { "line": { "color": "#000033" } }, "increasing": { "line": { "color": "#000032" } } } ], "histogram2d": [ { "type": "histogram2d", "colorscale": [ [ 0.0, "#000011" ], [ 0.1111111111111111, "#000012" ], [ 0.2222222222222222, "#000013" ], [ 0.3333333333333333, "#000014" ], [ 0.4444444444444444, "#000015" ], [ 0.5555555555555556, "#000016" ], [ 0.6666666666666666, "#000017" ], [ 0.7777777777777778, "#000018" ], [ 0.8888888888888888, "#000019" ], [ 1.0, "#000020" ] ] } ], "contourcarpet": [ { "type": "contourcarpet", "colorscale": [ [ 0.0, "#000011" ], [ 0.1111111111111111, "#000012" ], [ 0.2222222222222222, "#000013" ], [ 0.3333333333333333, "#000014" ], [ 0.4444444444444444, "#000015" ], [ 0.5555555555555556, "#000016" ], [ 0.6666666666666666, "#000017" ], [ 0.7777777777777778, "#000018" ], [ 0.8888888888888888, "#000019" ], [ 1.0, "#000020" ] ] } ] }, "layout": { "colorway": [ "#000001", "#000002", "#000003", "#000004", "#000005", "#000006", "#000007", "#000008", "#000009", "#000010" ], "coloraxis": { "colorscale": [ [ 0.0, "#000011" ], [ 0.1111111111111111, "#000012" ], [ 0.2222222222222222, "#000013" ], [ 0.3333333333333333, "#000014" ], [ 0.4444444444444444, "#000015" ], [ 0.5555555555555556, "#000016" ], [ 0.6666666666666666, "#000017" ], [ 0.7777777777777778, "#000018" ], [ 0.8888888888888888, "#000019" ], [ 1.0, "#000020" ] ] }, "colorscale": { "diverging": [ [ 0.0, "#000021" ], [ 0.1, "#000022" ], [ 0.2, "#000023" ], [ 0.3, "#000024" ], [ 0.4, "#000025" ], [ 0.5, "#000026" ], [ 0.6, "#000027" ], [ 0.7, "#000028" ], [ 0.8, "#000029" ], [ 0.9, "#000030" ], [ 1.0, "#000031" ] ], "sequential": [ [ 0.0, "#000011" ], [ 0.1111111111111111, "#000012" ], [ 0.2222222222222222, "#000013" ], [ 0.3333333333333333, "#000014" ], [ 0.4444444444444444, "#000015" ], [ 0.5555555555555556, "#000016" ], [ 0.6666666666666666, "#000017" ], [ 0.7777777777777778, "#000018" ], [ 0.8888888888888888, "#000019" ], [ 1.0, "#000020" ] ], "sequentialminus": [ [ 0.0, "#000011" ], [ 0.1111111111111111, "#000012" ], [ 0.2222222222222222, "#000013" ], [ 0.3333333333333333, "#000014" ], [ 0.4444444444444444, "#000015" ], [ 0.5555555555555556, "#000016" ], [ 0.6666666666666666, "#000017" ], [ 0.7777777777777778, "#000018" ], [ 0.8888888888888888, "#000019" ], [ 1.0, "#000020" ] ] } } }, "plot_bgcolor": "rgba(245,245,245,1)", "paper_bgcolor": "rgba(245,245,245,1)" } }, "height": null, "width": 1200, "user": { "profile_url": "https://chart-studio.plotly.com/~hackathon_test", "avatar_url": "https://storage.googleapis.com/plotly-prod-profiles/21.jpg", "background_url": "https://storage.googleapis.com/plotly-prod-profiles/bg-7.jpg", "bio": "", "nickname": "", "website": "", "stream_tokens": null, "feature_set_id": null, "csrf_token": null, "date_joined": "2025-09-16 02:59:33", "mapbox_access_tokens": null, "has_password": null, "username": "hackathon_test", "email": null, "is_active": null, "readonly": null, "is_dash_creator": null, "dash_created_count": null, "is_chart_creator": null, "charts_created_count": null } }, { "creation_time": "2025-09-16T03:30:19.350714Z", "comments": { "results": [], "count": 0 }, "parented": true, "embed_url": "https://chart-studio.plotly.com/~hackathon_test/45.embed", "fid": "hackathon_test:45", "filename": "infracost-costs-1757993412", "filetype": "plot", "img_url": "https://api.plotly.com/v2/files/hackathon_test:45/image?image_name=list-thumb", "image_urls": { "default": "https://api.plotly.com/v2/files/hackathon_test:45/image?image_name=default", "block-thumb": "https://storage.googleapis.com/plotly-prod-images/hackathon_test/45/8_4ZOFIZ2421RUNE3SV9OXSB3AL2J5G9.png", "list-thumb": "https://api.plotly.com/v2/files/hackathon_test:45/image?image_name=list-thumb" }, "api_urls": { "files": "https://api.plotly.com/v2/files/hackathon_test:45", "plots": "https://api.plotly.com/v2/plots/hackathon_test:45", "parent": "https://api.plotly.com/v2/folders/home?user=hackathon_test" }, "owner": "hackathon_test", "parent": -1, "preview": "", "referencers": [], "references": [], "title": "", "views": 0, "web_url": "https://chart-studio.plotly.com/~hackathon_test/45/", "world_readable": true, "date_modified": "2025-09-16T03:30:19.362Z", "stars": { "results": [], "count": 0 }, "collaborators": { "results": [], "count": 0 }, "subfolder_count": null, "refresh_interval": null, "organize_view_url": "https://chart-studio.plotly.com/~hackathon_test/45/", "current_user_permission": "read", "is_theme": null, "is_template": null, "autosize": true, "caption": "", "figure": { "data": [ { "name": "aws_lb.hack_lb", "type": "bar", "xsrc": "hackathon_test:39:2c5865", "ysrc": "hackathon_test:39:df55bf", "xaxis": "x", "yaxis": "y", "marker": { "color": "rgb(229, 134, 6)", "pattern": { "shape": "" } }, "showlegend": true, "legendgroup": "aws_lb.hack_lb", "offsetgroup": "aws_lb.hack_lb", "orientation": "v", "textposition": "auto", "hovertemplate": "Resource=%{x}<br>Monthly Cost ($)=%{y}<extra></extra>", "alignmentgroup": "True" }, { "name": "aws_db_instance.hack_db", "type": "bar", "xsrc": "hackathon_test:39:06881a", "ysrc": "hackathon_test:39:c06327", "xaxis": "x", "yaxis": "y", "marker": { "color": "rgb(93, 105, 177)", "pattern": { "shape": "" } }, "showlegend": true, "legendgroup": "aws_db_instance.hack_db", "offsetgroup": "aws_db_instance.hack_db", "orientation": "v", "textposition": "auto", "hovertemplate": "Resource=%{x}<br>Monthly Cost ($)=%{y}<extra></extra>", "alignmentgroup": "True" }, { "name": "aws_instance.hack_vm", "type": "bar", "xsrc": "hackathon_test:39:2219e3", "ysrc": "hackathon_test:39:438f80", "xaxis": "x", "yaxis": "y", "marker": { "color": "rgb(82, 188, 163)", "pattern": { "shape": "" } }, "showlegend": true, "legendgroup": "aws_instance.hack_vm", "offsetgroup": "aws_instance.hack_vm", "orientation": "v", "textposition": "auto", "hovertemplate": "Resource=%{x}<br>Monthly Cost ($)=%{y}<extra></extra>", "alignmentgroup": "True" }, { "name": "aws_instance.hack_vm2", "type": "bar", "xsrc": "hackathon_test:39:4e6bec", "ysrc": "hackathon_test:39:ee6d61", "xaxis": "x", "yaxis": "y", "marker": { "color": "rgb(153, 201, 69)", "pattern": { "shape": "" } }, "showlegend": true, "legendgroup": "aws_instance.hack_vm2", "offsetgroup": "aws_instance.hack_vm2", "orientation": "v", "textposition": "auto", "hovertemplate": "Resource=%{x}<br>Monthly Cost ($)=%{y}<extra></extra>", "alignmentgroup": "True" }, { "name": "aws_ebs_volume.hack_volume", "type": "bar", "xsrc": "hackathon_test:39:2e8be7", "ysrc": "hackathon_test:39:e169be", "xaxis": "x", "yaxis": "y", "marker": { "color": "rgb(204, 97, 176)", "pattern": { "shape": "" } }, "showlegend": true, "legendgroup": "aws_ebs_volume.hack_volume", "offsetgroup": "aws_ebs_volume.hack_volume", "orientation": "v", "textposition": "auto", "hovertemplate": "Resource=%{x}<br>Monthly Cost ($)=%{y}<extra></extra>", "alignmentgroup": "True" } ], "layout": { "title": { "text": "Monthly Infracost Breakdown per Resource" }, "width": 1200, "xaxis": { "title": { "text": "Resource" }, "anchor": "y", "domain": [ 0.0, 1.0 ], "tickangle": -30, "categoryarray": [ "aws_lb.hack_lb", "aws_db_instance.hack_db", "aws_instance.hack_vm", "aws_instance.hack_vm2", "aws_ebs_volume.hack_volume" ], "categoryorder": "array" }, "yaxis": { "title": { "text": "Monthly Cost ($)" }, "anchor": "x", "domain": [ 0.0, 1.0 ] }, "legend": { "x": 1, "y": 1, "font": { "size": 10 }, "title": { "text": "Resource" }, "bgcolor": "rgba(255,255,255,0.6)", "xanchor": "left", "yanchor": "top", "bordercolor": "black", "borderwidth": 1, "orientation": "v", "tracegroupgap": 0 }, "barmode": "relative", "template": { "data": { "table": [ { "type": "table", "cells": { "fill": { "color": "#000038" }, "font": { "color": "#000037" }, "line": { "color": "#000039" } }, "header": { "fill": { "color": "#000040" }, "font": { "color": "#000036" }, "line": { "color": "#000039" } } } ], "icicle": [ { "type": "icicle", "textfont": { "color": "white" } } ], "sankey": [ { "type": "sankey", "textfont": { "color": "#000036" } } ], "contour": [ { "type": "contour", "colorscale": [ [ 0.0, "#000011" ], [ 0.1111111111111111, "#000012" ], [ 0.2222222222222222, "#000013" ], [ 0.3333333333333333, "#000014" ], [ 0.4444444444444444, "#000015" ], [ 0.5555555555555556, "#000016" ], [ 0.6666666666666666, "#000017" ], [ 0.7777777777777778, "#000018" ], [ 0.8888888888888888, "#000019" ], [ 1.0, "#000020" ] ] } ], "heatmap": [ { "type": "heatmap", "colorscale": [ [ 0.0, "#000011" ], [ 0.1111111111111111, "#000012" ], [ 0.2222222222222222, "#000013" ], [ 0.3333333333333333, "#000014" ], [ 0.4444444444444444, "#000015" ], [ 0.5555555555555556, "#000016" ], [ 0.6666666666666666, "#000017" ], [ 0.7777777777777778, "#000018" ], [ 0.8888888888888888, "#000019" ], [ 1.0, "#000020" ] ] } ], "scatter": [ { "type": "scatter", "marker": { "line": { "width": 0 } } } ], "waterfall": [ { "type": "waterfall", "totals": { "marker": { "color": "#000034" } }, "connector": { "line": { "color": "#000036", "width": 2 } }, "decreasing": { "marker": { "color": "#000033" } }, "increasing": { "marker": { "color": "#000032" } } } ], "candlestick": [ { "type": "candlestick", "decreasing": { "line": { "color": "#000033" } }, "increasing": { "line": { "color": "#000032" } } } ], "histogram2d": [ { "type": "histogram2d", "colorscale": [ [ 0.0, "#000011" ], [ 0.1111111111111111, "#000012" ], [ 0.2222222222222222, "#000013" ], [ 0.3333333333333333, "#000014" ], [ 0.4444444444444444, "#000015" ], [ 0.5555555555555556, "#000016" ], [ 0.6666666666666666, "#000017" ], [ 0.7777777777777778, "#000018" ], [ 0.8888888888888888, "#000019" ], [ 1.0, "#000020" ] ] } ], "contourcarpet": [ { "type": "contourcarpet", "colorscale": [ [ 0.0, "#000011" ], [ 0.1111111111111111, "#000012" ], [ 0.2222222222222222, "#000013" ], [ 0.3333333333333333, "#000014" ], [ 0.4444444444444444, "#000015" ], [ 0.5555555555555556, "#000016" ], [ 0.6666666666666666, "#000017" ], [ 0.7777777777777778, "#000018" ], [ 0.8888888888888888, "#000019" ], [ 1.0, "#000020" ] ] } ] }, "layout": { "colorway": [ "#000001", "#000002", "#000003", "#000004", "#000005", "#000006", "#000007", "#000008", "#000009", "#000010" ], "coloraxis": { "colorscale": [ [ 0.0, "#000011" ], [ 0.1111111111111111, "#000012" ], [ 0.2222222222222222, "#000013" ], [ 0.3333333333333333, "#000014" ], [ 0.4444444444444444, "#000015" ], [ 0.5555555555555556, "#000016" ], [ 0.6666666666666666, "#000017" ], [ 0.7777777777777778, "#000018" ], [ 0.8888888888888888, "#000019" ], [ 1.0, "#000020" ] ] }, "colorscale": { "diverging": [ [ 0.0, "#000021" ], [ 0.1, "#000022" ], [ 0.2, "#000023" ], [ 0.3, "#000024" ], [ 0.4, "#000025" ], [ 0.5, "#000026" ], [ 0.6, "#000027" ], [ 0.7, "#000028" ], [ 0.8, "#000029" ], [ 0.9, "#000030" ], [ 1.0, "#000031" ] ], "sequential": [ [ 0.0, "#000011" ], [ 0.1111111111111111, "#000012" ], [ 0.2222222222222222, "#000013" ], [ 0.3333333333333333, "#000014" ], [ 0.4444444444444444, "#000015" ], [ 0.5555555555555556, "#000016" ], [ 0.6666666666666666, "#000017" ], [ 0.7777777777777778, "#000018" ], [ 0.8888888888888888, "#000019" ], [ 1.0, "#000020" ] ], "sequentialminus": [ [ 0.0, "#000011" ], [ 0.1111111111111111, "#000012" ], [ 0.2222222222222222, "#000013" ], [ 0.3333333333333333, "#000014" ], [ 0.4444444444444444, "#000015" ], [ 0.5555555555555556, "#000016" ], [ 0.6666666666666666, "#000017" ], [ 0.7777777777777778, "#000018" ], [ 0.8888888888888888, "#000019" ], [ 1.0, "#000020" ] ] } } }, "plot_bgcolor": "rgba(245,245,245,1)", "paper_bgcolor": "rgba(245,245,245,1)" } }, "height": null, "width": 1200, "user": { "profile_url": "https://chart-studio.plotly.com/~hackathon_test", "avatar_url": "https://storage.googleapis.com/plotly-prod-profiles/21.jpg", "background_url": "https://storage.googleapis.com/plotly-prod-profiles/bg-7.jpg", "bio": "", "nickname": "", "website": "", "stream_tokens": null, "feature_set_id": null, "csrf_token": null, "date_joined": "2025-09-16 02:59:33", "mapbox_access_tokens": null, "has_password": null, "username": "hackathon_test", "email": null, "is_active": null, "readonly": null, "is_dash_creator": null, "dash_created_count": null, "is_chart_creator": null, "charts_created_count": null } }, { "creation_time": "2025-09-16T03:30:16.756994Z", "comments": { "results": [], "count": 0 }, "parented": true, "embed_url": "https://chart-studio.plotly.com/~hackathon_test/40.embed", "fid": "hackathon_test:40", "filename": "infracost-costs-1757993410", "filetype": "plot", "img_url": "https://api.plotly.com/v2/files/hackathon_test:40/image?image_name=list-thumb", "image_urls": { "default": "https://api.plotly.com/v2/files/hackathon_test:40/image?image_name=default", "block-thumb": "https://storage.googleapis.com/plotly-prod-images/hackathon_test/40/8_DK5LSOCAL3OWS7WGM6L0L0AK3VE29H.png", "list-thumb": "https://api.plotly.com/v2/files/hackathon_test:40/image?image_name=list-thumb" }, "api_urls": { "files": "https://api.plotly.com/v2/files/hackathon_test:40", "plots": "https://api.plotly.com/v2/plots/hackathon_test:40", "parent": "https://api.plotly.com/v2/folders/home?user=hackathon_test" }, "owner": "hackathon_test", "parent": -1, "preview": "", "referencers": [], "references": [], "title": "", "views": 0, "web_url": "https://chart-studio.plotly.com/~hackathon_test/40/", "world_readable": true, "date_modified": "2025-09-16T03:30:17.837Z", "stars": { "results": [], "count": 0 }, "collaborators": { "results": [], "count": 0 }, "subfolder_count": null, "refresh_interval": null, "organize_view_url": "https://chart-studio.plotly.com/~hackathon_test/40/", "current_user_permission": "read", "is_theme": null, "is_template": null, "autosize": true, "caption": "", "figure": { "data": [ { "name": "aws_lb.hack_lb", "type": "bar", "xsrc": "hackathon_test:38:63a8b8", "ysrc": "hackathon_test:38:4155dd", "xaxis": "x", "yaxis": "y", "marker": { "color": "rgb(229, 134, 6)", "pattern": { "shape": "" } }, "showlegend": true, "legendgroup": "aws_lb.hack_lb", "offsetgroup": "aws_lb.hack_lb", "orientation": "v", "textposition": "auto", "hovertemplate": "Resource=%{x}<br>Monthly Cost ($)=%{y}<extra></extra>", "alignmentgroup": "True" }, { "name": "aws_db_instance.hack_db", "type": "bar", "xsrc": "hackathon_test:38:db40e4", "ysrc": "hackathon_test:38:b83073", "xaxis": "x", "yaxis": "y", "marker": { "color": "rgb(93, 105, 177)", "pattern": { "shape": "" } }, "showlegend": true, "legendgroup": "aws_db_instance.hack_db", "offsetgroup": "aws_db_instance.hack_db", "orientation": "v", "textposition": "auto", "hovertemplate": "Resource=%{x}<br>Monthly Cost ($)=%{y}<extra></extra>", "alignmentgroup": "True" }, { "name": "aws_instance.hack_vm", "type": "bar", "xsrc": "hackathon_test:38:82005f", "ysrc": "hackathon_test:38:a4de91", "xaxis": "x", "yaxis": "y", "marker": { "color": "rgb(82, 188, 163)", "pattern": { "shape": "" } }, "showlegend": true, "legendgroup": "aws_instance.hack_vm", "offsetgroup": "aws_instance.hack_vm", "orientation": "v", "textposition": "auto", "hovertemplate": "Resource=%{x}<br>Monthly Cost ($)=%{y}<extra></extra>", "alignmentgroup": "True" }, { "name": "aws_instance.hack_vm2", "type": "bar", "xsrc": "hackathon_test:38:da200d", "ysrc": "hackathon_test:38:5c0816", "xaxis": "x", "yaxis": "y", "marker": { "color": "rgb(153, 201, 69)", "pattern": { "shape": "" } }, "showlegend": true, "legendgroup": "aws_instance.hack_vm2", "offsetgroup": "aws_instance.hack_vm2", "orientation": "v", "textposition": "auto", "hovertemplate": "Resource=%{x}<br>Monthly Cost ($)=%{y}<extra></extra>", "alignmentgroup": "True" }, { "name": "aws_ebs_volume.hack_volume", "type": "bar", "xsrc": "hackathon_test:38:88ca03", "ysrc": "hackathon_test:38:fa6757", "xaxis": "x", "yaxis": "y", "marker": { "color": "rgb(204, 97, 176)", "pattern": { "shape": "" } }, "showlegend": true, "legendgroup": "aws_ebs_volume.hack_volume", "offsetgroup": "aws_ebs_volume.hack_volume", "orientation": "v", "textposition": "auto", "hovertemplate": "Resource=%{x}<br>Monthly Cost ($)=%{y}<extra></extra>", "alignmentgroup": "True" } ], "layout": { "title": { "text": "Monthly Infracost Breakdown per Resource" }, "width": 1200, "xaxis": { "title": { "text": "Resource" }, "anchor": "y", "domain": [ 0.0, 1.0 ], "tickangle": -30, "categoryarray": [ "aws_lb.hack_lb", "aws_db_instance.hack_db", "aws_instance.hack_vm", "aws_instance.hack_vm2", "aws_ebs_volume.hack_volume" ], "categoryorder": "array" }, "yaxis": { "title": { "text": "Monthly Cost ($)" }, "anchor": "x", "domain": [ 0.0, 1.0 ] }, "legend": { "x": 1, "y": 1, "font": { "size": 10 }, "title": { "text": "Resource" }, "bgcolor": "rgba(255,255,255,0.6)", "xanchor": "left", "yanchor": "top", "bordercolor": "black", "borderwidth": 1, "orientation": "v", "tracegroupgap": 0 }, "barmode": "relative", "template": { "data": { "table": [ { "type": "table", "cells": { "fill": { "color": "#000038" }, "font": { "color": "#000037" }, "line": { "color": "#000039" } }, "header": { "fill": { "color": "#000040" }, "font": { "color": "#000036" }, "line": { "color": "#000039" } } } ], "icicle": [ { "type": "icicle", "textfont": { "color": "white" } } ], "sankey": [ { "type": "sankey", "textfont": { "color": "#000036" } } ], "contour": [ { "type": "contour", "colorscale": [ [ 0.0, "#000011" ], [ 0.1111111111111111, "#000012" ], [ 0.2222222222222222, "#000013" ], [ 0.3333333333333333, "#000014" ], [ 0.4444444444444444, "#000015" ], [ 0.5555555555555556, "#000016" ], [ 0.6666666666666666, "#000017" ], [ 0.7777777777777778, "#000018" ], [ 0.8888888888888888, "#000019" ], [ 1.0, "#000020" ] ] } ], "heatmap": [ { "type": "heatmap", "colorscale": [ [ 0.0, "#000011" ], [ 0.1111111111111111, "#000012" ], [ 0.2222222222222222, "#000013" ], [ 0.3333333333333333, "#000014" ], [ 0.4444444444444444, "#000015" ], [ 0.5555555555555556, "#000016" ], [ 0.6666666666666666, "#000017" ], [ 0.7777777777777778, "#000018" ], [ 0.8888888888888888, "#000019" ], [ 1.0, "#000020" ] ] } ], "scatter": [ { "type": "scatter", "marker": { "line": { "width": 0 } } } ], "waterfall": [ { "type": "waterfall", "totals": { "marker": { "color": "#000034" } }, "connector": { "line": { "color": "#000036", "width": 2 } }, "decreasing": { "marker": { "color": "#000033" } }, "increasing": { "marker": { "color": "#000032" } } } ], "candlestick": [ { "type": "candlestick", "decreasing": { "line": { "color": "#000033" } }, "increasing": { "line": { "color": "#000032" } } } ], "histogram2d": [ { "type": "histogram2d", "colorscale": [ [ 0.0, "#000011" ], [ 0.1111111111111111, "#000012" ], [ 0.2222222222222222, "#000013" ], [ 0.3333333333333333, "#000014" ], [ 0.4444444444444444, "#000015" ], [ 0.5555555555555556, "#000016" ], [ 0.6666666666666666, "#000017" ], [ 0.7777777777777778, "#000018" ], [ 0.8888888888888888, "#000019" ], [ 1.0, "#000020" ] ] } ], "contourcarpet": [ { "type": "contourcarpet", "colorscale": [ [ 0.0, "#000011" ], [ 0.1111111111111111, "#000012" ], [ 0.2222222222222222, "#000013" ], [ 0.3333333333333333, "#000014" ], [ 0.4444444444444444, "#000015" ], [ 0.5555555555555556, "#000016" ], [ 0.6666666666666666, "#000017" ], [ 0.7777777777777778, "#000018" ], [ 0.8888888888888888, "#000019" ], [ 1.0, "#000020" ] ] } ] }, "layout": { "colorway": [ "#000001", "#000002", "#000003", "#000004", "#000005", "#000006", "#000007", "#000008", "#000009", "#000010" ], "coloraxis": { "colorscale": [ [ 0.0, "#000011" ], [ 0.1111111111111111, "#000012" ], [ 0.2222222222222222, "#000013" ], [ 0.3333333333333333, "#000014" ], [ 0.4444444444444444, "#000015" ], [ 0.5555555555555556, "#000016" ], [ 0.6666666666666666, "#000017" ], [ 0.7777777777777778, "#000018" ], [ 0.8888888888888888, "#000019" ], [ 1.0, "#000020" ] ] }, "colorscale": { "diverging": [ [ 0.0, "#000021" ], [ 0.1, "#000022" ], [ 0.2, "#000023" ], [ 0.3, "#000024" ], [ 0.4, "#000025" ], [ 0.5, "#000026" ], [ 0.6, "#000027" ], [ 0.7, "#000028" ], [ 0.8, "#000029" ], [ 0.9, "#000030" ], [ 1.0, "#000031" ] ], "sequential": [ [ 0.0, "#000011" ], [ 0.1111111111111111, "#000012" ], [ 0.2222222222222222, "#000013" ], [ 0.3333333333333333, "#000014" ], [ 0.4444444444444444, "#000015" ], [ 0.5555555555555556, "#000016" ], [ 0.6666666666666666, "#000017" ], [ 0.7777777777777778, "#000018" ], [ 0.8888888888888888, "#000019" ], [ 1.0, "#000020" ] ], "sequentialminus": [ [ 0.0, "#000011" ], [ 0.1111111111111111, "#000012" ], [ 0.2222222222222222, "#000013" ], [ 0.3333333333333333, "#000014" ], [ 0.4444444444444444, "#000015" ], [ 0.5555555555555556, "#000016" ], [ 0.6666666666666666, "#000017" ], [ 0.7777777777777778, "#000018" ], [ 0.8888888888888888, "#000019" ], [ 1.0, "#000020" ] ] } } }, "plot_bgcolor": "rgba(245,245,245,1)", "paper_bgcolor": "rgba(245,245,245,1)" } }, "height": null, "width": 1200, "user": { "profile_url": "https://chart-studio.plotly.com/~hackathon_test", "avatar_url": "https://storage.googleapis.com/plotly-prod-profiles/21.jpg", "background_url": "https://storage.googleapis.com/plotly-prod-profiles/bg-7.jpg", "bio": "", "nickname": "", "website": "", "stream_tokens": null, "feature_set_id": null, "csrf_token": null, "date_joined": "2025-09-16 02:59:33", "mapbox_access_tokens": null, "has_password": null, "username": "hackathon_test", "email": null, "is_active": null, "readonly": null, "is_dash_creator": null, "dash_created_count": null, "is_chart_creator": null, "charts_created_count": null } }, { "creation_time": "2025-09-16T03:27:35.011472Z", "comments": { "results": [], "count": 0 }, "parented": true, "embed_url": "https://chart-studio.plotly.com/~hackathon_test/35.embed", "fid": "hackathon_test:35", "filename": "infracost-graph-table", "filetype": "plot", "img_url": "https://api.plotly.com/v2/files/hackathon_test:35/image?image_name=list-thumb", "image_urls": { "default": "https://api.plotly.com/v2/files/hackathon_test:35/image?image_name=default", "block-thumb": "https://storage.googleapis.com/plotly-prod-images/hackathon_test/35/8_H9KC4S32V6ATSG5JLU2NJKM1BDQU1L.png", "list-thumb": "https://api.plotly.com/v2/files/hackathon_test:35/image?image_name=list-thumb" }, "api_urls": { "files": "https://api.plotly.com/v2/files/hackathon_test:35", "plots": "https://api.plotly.com/v2/plots/hackathon_test:35", "parent": "https://api.plotly.com/v2/folders/home?user=hackathon_test" }, "owner": "hackathon_test", "parent": -1, "preview": "", "referencers": [], "references": [], "title": "", "views": 0, "web_url": "https://chart-studio.plotly.com/~hackathon_test/35/", "world_readable": true, "date_modified": "2025-09-16T04:20:12.939Z", "stars": { "results": [], "count": 0 }, "collaborators": { "results": [], "count": 0 }, "subfolder_count": null, "refresh_interval": null, "organize_view_url": "https://chart-studio.plotly.com/~hackathon_test/35/", "current_user_permission": "read", "is_theme": null, "is_template": null, "autosize": true, "caption": "", "figure": { "data": [ { "name": "aws_lb.hack_lb", "type": "bar", "xsrc": "hackathon_test:59:080cdb", "ysrc": "hackathon_test:59:b4c4f6", "xaxis": "x", "yaxis": "y", "marker": { "color": "rgb(229, 134, 6)", "pattern": { "shape": "" } }, "showlegend": true, "legendgroup": "aws_lb.hack_lb", "offsetgroup": "aws_lb.hack_lb", "orientation": "v", "textposition": "auto", "hovertemplate": "Resource=%{x}<br>Monthly Cost ($)=%{y}<extra></extra>", "alignmentgroup": "True" }, { "name": "aws_db_instance.hack_db", "type": "bar", "xsrc": "hackathon_test:59:be6cb8", "ysrc": "hackathon_test:59:82de09", "xaxis": "x", "yaxis": "y", "marker": { "color": "rgb(93, 105, 177)", "pattern": { "shape": "" } }, "showlegend": true, "legendgroup": "aws_db_instance.hack_db", "offsetgroup": "aws_db_instance.hack_db", "orientation": "v", "textposition": "auto", "hovertemplate": "Resource=%{x}<br>Monthly Cost ($)=%{y}<extra></extra>", "alignmentgroup": "True" }, { "name": "aws_instance.hack_vm", "type": "bar", "xsrc": "hackathon_test:59:6d7f70", "ysrc": "hackathon_test:59:3f75d5", "xaxis": "x", "yaxis": "y", "marker": { "color": "rgb(82, 188, 163)", "pattern": { "shape": "" } }, "showlegend": true, "legendgroup": "aws_instance.hack_vm", "offsetgroup": "aws_instance.hack_vm", "orientation": "v", "textposition": "auto", "hovertemplate": "Resource=%{x}<br>Monthly Cost ($)=%{y}<extra></extra>", "alignmentgroup": "True" }, { "name": "aws_instance.hack_vm2", "type": "bar", "xsrc": "hackathon_test:59:c94479", "ysrc": "hackathon_test:59:e9db1d", "xaxis": "x", "yaxis": "y", "marker": { "color": "rgb(153, 201, 69)", "pattern": { "shape": "" } }, "showlegend": true, "legendgroup": "aws_instance.hack_vm2", "offsetgroup": "aws_instance.hack_vm2", "orientation": "v", "textposition": "auto", "hovertemplate": "Resource=%{x}<br>Monthly Cost ($)=%{y}<extra></extra>", "alignmentgroup": "True" }, { "name": "aws_ebs_volume.hack_volume", "type": "bar", "xsrc": "hackathon_test:59:fb7ed6", "ysrc": "hackathon_test:59:80f4d3", "xaxis": "x", "yaxis": "y", "marker": { "color": "rgb(204, 97, 176)", "pattern": { "shape": "" } }, "showlegend": true, "legendgroup": "aws_ebs_volume.hack_volume", "offsetgroup": "aws_ebs_volume.hack_volume", "orientation": "v", "textposition": "auto", "hovertemplate": "Resource=%{x}<br>Monthly Cost ($)=%{y}<extra></extra>", "alignmentgroup": "True" }, { "type": "table", "cells": { "fill": { "colorsrc": "hackathon_test:59:4c3026" }, "font": { "size": 11 }, "align": "center", "valuessrc": "hackathon_test:59:f545f8" }, "domain": { "x": [ 0.0, 1.0 ], "y": [ 0.0, 0.2976 ] }, "header": { "fill": { "color": "lightgrey" }, "font": { "size": 12, "color": "black" }, "align": "center", "valuessrc": "hackathon_test:59:062d12" } } ], "layout": { "title": { "text": "Monthly Infracost Breakdown per Resource" }, "width": 1200, "xaxis": { "anchor": "y", "domain": [ 0.0, 1.0 ] }, "yaxis": { "anchor": "x", "domain": [ 0.3676, 1.0 ] }, "height": 900, "template": { "data": { "table": [ { "type": "table", "cells": { "fill": { "color": "#000038" }, "font": { "color": "#000037" }, "line": { "color": "#000039" } }, "header": { "fill": { "color": "#000040" }, "font": { "color": "#000036" }, "line": { "color": "#000039" } } } ], "icicle": [ { "type": "icicle", "textfont": { "color": "white" } } ], "sankey": [ { "type": "sankey", "textfont": { "color": "#000036" } } ], "contour": [ { "type": "contour", "colorscale": [ [ 0.0, "#000011" ], [ 0.1111111111111111, "#000012" ], [ 0.2222222222222222, "#000013" ], [ 0.3333333333333333, "#000014" ], [ 0.4444444444444444, "#000015" ], [ 0.5555555555555556, "#000016" ], [ 0.6666666666666666, "#000017" ], [ 0.7777777777777778, "#000018" ], [ 0.8888888888888888, "#000019" ], [ 1.0, "#000020" ] ] } ], "heatmap": [ { "type": "heatmap", "colorscale": [ [ 0.0, "#000011" ], [ 0.1111111111111111, "#000012" ], [ 0.2222222222222222, "#000013" ], [ 0.3333333333333333, "#000014" ], [ 0.4444444444444444, "#000015" ], [ 0.5555555555555556, "#000016" ], [ 0.6666666666666666, "#000017" ], [ 0.7777777777777778, "#000018" ], [ 0.8888888888888888, "#000019" ], [ 1.0, "#000020" ] ] } ], "scatter": [ { "type": "scatter", "marker": { "line": { "width": 0 } } } ], "waterfall": [ { "type": "waterfall", "totals": { "marker": { "color": "#000034" } }, "connector": { "line": { "color": "#000036", "width": 2 } }, "decreasing": { "marker": { "color": "#000033" } }, "increasing": { "marker": { "color": "#000032" } } } ], "candlestick": [ { "type": "candlestick", "decreasing": { "line": { "color": "#000033" } }, "increasing": { "line": { "color": "#000032" } } } ], "histogram2d": [ { "type": "histogram2d", "colorscale": [ [ 0.0, "#000011" ], [ 0.1111111111111111, "#000012" ], [ 0.2222222222222222, "#000013" ], [ 0.3333333333333333, "#000014" ], [ 0.4444444444444444, "#000015" ], [ 0.5555555555555556, "#000016" ], [ 0.6666666666666666, "#000017" ], [ 0.7777777777777778, "#000018" ], [ 0.8888888888888888, "#000019" ], [ 1.0, "#000020" ] ] } ], "contourcarpet": [ { "type": "contourcarpet", "colorscale": [ [ 0.0, "#000011" ], [ 0.1111111111111111, "#000012" ], [ 0.2222222222222222, "#000013" ], [ 0.3333333333333333, "#000014" ], [ 0.4444444444444444, "#000015" ], [ 0.5555555555555556, "#000016" ], [ 0.6666666666666666, "#000017" ], [ 0.7777777777777778, "#000018" ], [ 0.8888888888888888, "#000019" ], [ 1.0, "#000020" ] ] } ] }, "layout": { "colorway": [ "#000001", "#000002", "#000003", "#000004", "#000005", "#000006", "#000007", "#000008", "#000009", "#000010" ], "coloraxis": { "colorscale": [ [ 0.0, "#000011" ], [ 0.1111111111111111, "#000012" ], [ 0.2222222222222222, "#000013" ], [ 0.3333333333333333, "#000014" ], [ 0.4444444444444444, "#000015" ], [ 0.5555555555555556, "#000016" ], [ 0.6666666666666666, "#000017" ], [ 0.7777777777777778, "#000018" ], [ 0.8888888888888888, "#000019" ], [ 1.0, "#000020" ] ] }, "colorscale": { "diverging": [ [ 0.0, "#000021" ], [ 0.1, "#000022" ], [ 0.2, "#000023" ], [ 0.3, "#000024" ], [ 0.4, "#000025" ], [ 0.5, "#000026" ], [ 0.6, "#000027" ], [ 0.7, "#000028" ], [ 0.8, "#000029" ], [ 0.9, "#000030" ], [ 1.0, "#000031" ] ], "sequential": [ [ 0.0, "#000011" ], [ 0.1111111111111111, "#000012" ], [ 0.2222222222222222, "#000013" ], [ 0.3333333333333333, "#000014" ], [ 0.4444444444444444, "#000015" ], [ 0.5555555555555556, "#000016" ], [ 0.6666666666666666, "#000017" ], [ 0.7777777777777778, "#000018" ], [ 0.8888888888888888, "#000019" ], [ 1.0, "#000020" ] ], "sequentialminus": [ [ 0.0, "#000011" ], [ 0.1111111111111111, "#000012" ], [ 0.2222222222222222, "#000013" ], [ 0.3333333333333333, "#000014" ], [ 0.4444444444444444, "#000015" ], [ 0.5555555555555556, "#000016" ], [ 0.6666666666666666, "#000017" ], [ 0.7777777777777778, "#000018" ], [ 0.8888888888888888, "#000019" ], [ 1.0, "#000020" ] ] } } }, "plot_bgcolor": "rgba(245,245,245,1)", "paper_bgcolor": "rgba(245,245,245,1)" } }, "height": 900, "width": 1200, "user": { "profile_url": "https://chart-studio.plotly.com/~hackathon_test", "avatar_url": "https://storage.googleapis.com/plotly-prod-profiles/21.jpg", "background_url": "https://storage.googleapis.com/plotly-prod-profiles/bg-7.jpg", "bio": "", "nickname": "", "website": "", "stream_tokens": null, "feature_set_id": null, "csrf_token": null, "date_joined": "2025-09-16 02:59:33", "mapbox_access_tokens": null, "has_password": null, "username": "hackathon_test", "email": null, "is_active": null, "readonly": null, "is_dash_creator": null, "dash_created_count": null, "is_chart_creator": null, "charts_created_count": null } }, { "creation_time": "2025-09-16T03:23:23.057339Z", "comments": { "results": [], "count": 0 }, "parented": true, "embed_url": "https://chart-studio.plotly.com/~hackathon_test/33.embed", "fid": "hackathon_test:33", "filename": "infracost-combined", "filetype": "plot", "img_url": "https://api.plotly.com/v2/files/hackathon_test:33/image?image_name=list-thumb", "image_urls": { "default": "https://api.plotly.com/v2/files/hackathon_test:33/image?image_name=default", "block-thumb": "https://storage.googleapis.com/plotly-prod-images/hackathon_test/33/8_1FO1GMQ6TL60FWNN12GEGC1SRRBPEE.png", "list-thumb": "https://api.plotly.com/v2/files/hackathon_test:33/image?image_name=list-thumb" }, "api_urls": { "files": "https://api.plotly.com/v2/files/hackathon_test:33", "plots": "https://api.plotly.com/v2/plots/hackathon_test:33", "parent": "https://api.plotly.com/v2/folders/home?user=hackathon_test" }, "owner": "hackathon_test", "parent": -1, "preview": "", "referencers": [], "references": [], "title": "", "views": 0, "web_url": "https://chart-studio.plotly.com/~hackathon_test/33/", "world_readable": true, "date_modified": "2025-09-16T03:23:23.067Z", "stars": { "results": [], "count": 0 }, "collaborators": { "results": [], "count": 0 }, "subfolder_count": null, "refresh_interval": null, "organize_view_url": "https://chart-studio.plotly.com/~hackathon_test/33/", "current_user_permission": "read", "is_theme": null, "is_template": null, "autosize": true, "caption": "", "figure": { "data": [ { "name": "Monthly Cost", "type": "bar", "xsrc": "hackathon_test:32:ec230e", "ysrc": "hackathon_test:32:f1197f", "xaxis": "x", "yaxis": "y", "marker": { "colorsrc": "hackathon_test:32:88b745" } }, { "type": "table", "cells": { "fill": { "color": "white" }, "font": { "size": 11 }, "align": "center", "valuessrc": "hackathon_test:32:21ea44" }, "domain": { "x": [ 0.0, 1.0 ], "y": [ 0.0, 0.34 ] }, "header": { "fill": { "color": "lightgrey" }, "font": { "size": 12, "color": "black" }, "align": "center", "valuessrc": "hackathon_test:32:712745" } } ], "layout": { "width": 1200, "xaxis": { "anchor": "y", "domain": [ 0.0, 1.0 ], "tickangle": -30 }, "yaxis": { "anchor": "x", "domain": [ 0.49, 1.0 ] }, "height": 900, "legend": { "x": 1, "y": 1, "xanchor": "left", "yanchor": "top" }, "template": { "data": { "table": [ { "type": "table", "cells": { "fill": { "color": "#000038" }, "font": { "color": "#000037" }, "line": { "color": "#000039" } }, "header": { "fill": { "color": "#000040" }, "font": { "color": "#000036" }, "line": { "color": "#000039" } } } ], "icicle": [ { "type": "icicle", "textfont": { "color": "white" } } ], "sankey": [ { "type": "sankey", "textfont": { "color": "#000036" } } ], "contour": [ { "type": "contour", "colorscale": [ [ 0.0, "#000011" ], [ 0.1111111111111111, "#000012" ], [ 0.2222222222222222, "#000013" ], [ 0.3333333333333333, "#000014" ], [ 0.4444444444444444, "#000015" ], [ 0.5555555555555556, "#000016" ], [ 0.6666666666666666, "#000017" ], [ 0.7777777777777778, "#000018" ], [ 0.8888888888888888, "#000019" ], [ 1.0, "#000020" ] ] } ], "heatmap": [ { "type": "heatmap", "colorscale": [ [ 0.0, "#000011" ], [ 0.1111111111111111, "#000012" ], [ 0.2222222222222222, "#000013" ], [ 0.3333333333333333, "#000014" ], [ 0.4444444444444444, "#000015" ], [ 0.5555555555555556, "#000016" ], [ 0.6666666666666666, "#000017" ], [ 0.7777777777777778, "#000018" ], [ 0.8888888888888888, "#000019" ], [ 1.0, "#000020" ] ] } ], "scatter": [ { "type": "scatter", "marker": { "line": { "width": 0 } } } ], "waterfall": [ { "type": "waterfall", "totals": { "marker": { "color": "#000034" } }, "connector": { "line": { "color": "#000036", "width": 2 } }, "decreasing": { "marker": { "color": "#000033" } }, "increasing": { "marker": { "color": "#000032" } } } ], "candlestick": [ { "type": "candlestick", "decreasing": { "line": { "color": "#000033" } }, "increasing": { "line": { "color": "#000032" } } } ], "histogram2d": [ { "type": "histogram2d", "colorscale": [ [ 0.0, "#000011" ], [ 0.1111111111111111, "#000012" ], [ 0.2222222222222222, "#000013" ], [ 0.3333333333333333, "#000014" ], [ 0.4444444444444444, "#000015" ], [ 0.5555555555555556, "#000016" ], [ 0.6666666666666666, "#000017" ], [ 0.7777777777777778, "#000018" ], [ 0.8888888888888888, "#000019" ], [ 1.0, "#000020" ] ] } ], "contourcarpet": [ { "type": "contourcarpet", "colorscale": [ [ 0.0, "#000011" ], [ 0.1111111111111111, "#000012" ], [ 0.2222222222222222, "#000013" ], [ 0.3333333333333333, "#000014" ], [ 0.4444444444444444, "#000015" ], [ 0.5555555555555556, "#000016" ], [ 0.6666666666666666, "#000017" ], [ 0.7777777777777778, "#000018" ], [ 0.8888888888888888, "#000019" ], [ 1.0, "#000020" ] ] } ] }, "layout": { "colorway": [ "#000001", "#000002", "#000003", "#000004", "#000005", "#000006", "#000007", "#000008", "#000009", "#000010" ], "coloraxis": { "colorscale": [ [ 0.0, "#000011" ], [ 0.1111111111111111, "#000012" ], [ 0.2222222222222222, "#000013" ], [ 0.3333333333333333, "#000014" ], [ 0.4444444444444444, "#000015" ], [ 0.5555555555555556, "#000016" ], [ 0.6666666666666666, "#000017" ], [ 0.7777777777777778, "#000018" ], [ 0.8888888888888888, "#000019" ], [ 1.0, "#000020" ] ] }, "colorscale": { "diverging": [ [ 0.0, "#000021" ], [ 0.1, "#000022" ], [ 0.2, "#000023" ], [ 0.3, "#000024" ], [ 0.4, "#000025" ], [ 0.5, "#000026" ], [ 0.6, "#000027" ], [ 0.7, "#000028" ], [ 0.8, "#000029" ], [ 0.9, "#000030" ], [ 1.0, "#000031" ] ], "sequential": [ [ 0.0, "#000011" ], [ 0.1111111111111111, "#000012" ], [ 0.2222222222222222, "#000013" ], [ 0.3333333333333333, "#000014" ], [ 0.4444444444444444, "#000015" ], [ 0.5555555555555556, "#000016" ], [ 0.6666666666666666, "#000017" ], [ 0.7777777777777778, "#000018" ], [ 0.8888888888888888, "#000019" ], [ 1.0, "#000020" ] ], "sequentialminus": [ [ 0.0, "#000011" ], [ 0.1111111111111111, "#000012" ], [ 0.2222222222222222, "#000013" ], [ 0.3333333333333333, "#000014" ], [ 0.4444444444444444, "#000015" ], [ 0.5555555555555556, "#000016" ], [ 0.6666666666666666, "#000017" ], [ 0.7777777777777778, "#000018" ], [ 0.8888888888888888, "#000019" ], [ 1.0, "#000020" ] ] } } }, "showlegend": false, "annotations": [ { "x": 0.5, "y": 1.0, "font": { "size": 16 }, "text": "Monthly Infracost Breakdown per Resource", "xref": "paper", "yref": "paper", "xanchor": "center", "yanchor": "bottom", "showarrow": false }, { "x": 0.5, "y": 0.34, "font": { "size": 16 }, "text": "Resource Cost Table", "xref": "paper", "yref": "paper", "xanchor": "center", "yanchor": "bottom", "showarrow": false } ], "plot_bgcolor": "rgba(245,245,245,1)", "paper_bgcolor": "rgba(245,245,245,1)" } }, "height": 900, "width": 1200, "user": { "profile_url": "https://chart-studio.plotly.com/~hackathon_test", "avatar_url": "https://storage.googleapis.com/plotly-prod-profiles/21.jpg", "background_url": "https://storage.googleapis.com/plotly-prod-profiles/bg-7.jpg", "bio": "", "nickname": "", "website": "", "stream_tokens": null, "feature_set_id": null, "csrf_token": null, "date_joined": "2025-09-16 02:59:33", "mapbox_access_tokens": null, "has_password": null, "username": "hackathon_test", "email": null, "is_active": null, "readonly": null, "is_dash_creator": null, "dash_created_count": null, "is_chart_creator": null, "charts_created_count": null } }, { "creation_time": "2025-09-16T03:20:25.705591Z", "comments": { "results": [], "count": 0 }, "parented": true, "embed_url": "https://chart-studio.plotly.com/~hackathon_test/27.embed", "fid": "hackathon_test:27", "filename": "infracost-table", "filetype": "plot", "img_url": "https://api.plotly.com/v2/files/hackathon_test:27/image?image_name=list-thumb", "image_urls": { "default": "https://api.plotly.com/v2/files/hackathon_test:27/image?image_name=default", "block-thumb": "https://storage.googleapis.com/plotly-prod-images/hackathon_test/27/8_80TQ7KCWTSJO5MY2SA892AGTIQI52I.png", "list-thumb": "https://api.plotly.com/v2/files/hackathon_test:27/image?image_name=list-thumb" }, "api_urls": { "files": "https://api.plotly.com/v2/files/hackathon_test:27", "plots": "https://api.plotly.com/v2/plots/hackathon_test:27", "parent": "https://api.plotly.com/v2/folders/home?user=hackathon_test" }, "owner": "hackathon_test", "parent": -1, "preview": "", "referencers": [], "references": [], "title": "", "views": 0, "web_url": "https://chart-studio.plotly.com/~hackathon_test/27/", "world_readable": true, "date_modified": "2025-09-16T03:20:39.476Z", "stars": { "results": [], "count": 0 }, "collaborators": { "results": [], "count": 0 }, "subfolder_count": null, "refresh_interval": null, "organize_view_url": "https://chart-studio.plotly.com/~hackathon_test/27/", "current_user_permission": "read", "is_theme": null, "is_template": null, "autosize": true, "caption": "", "figure": { "data": [ { "type": "table", "cells": { "fill": { "colorsrc": "hackathon_test:30:eb8630" }, "font": { "size": 11 }, "align": "center", "valuessrc": "hackathon_test:30:b17e79" }, "header": { "fill": { "color": "lightgrey" }, "font": { "size": 12, "color": "black" }, "align": "center", "valuessrc": "hackathon_test:30:1a5ec9" } } ], "layout": { "title": { "text": "Cost Summary per Resource" }, "width": 800, "margin": { "b": 20, "l": 20, "r": 20, "t": 40 }, "template": { "data": { "table": [ { "type": "table", "cells": { "fill": { "color": "#000038" }, "font": { "color": "#000037" }, "line": { "color": "#000039" } }, "header": { "fill": { "color": "#000040" }, "font": { "color": "#000036" }, "line": { "color": "#000039" } } } ], "icicle": [ { "type": "icicle", "textfont": { "color": "white" } } ], "sankey": [ { "type": "sankey", "textfont": { "color": "#000036" } } ], "contour": [ { "type": "contour", "colorscale": [ [ 0.0, "#000011" ], [ 0.1111111111111111, "#000012" ], [ 0.2222222222222222, "#000013" ], [ 0.3333333333333333, "#000014" ], [ 0.4444444444444444, "#000015" ], [ 0.5555555555555556, "#000016" ], [ 0.6666666666666666, "#000017" ], [ 0.7777777777777778, "#000018" ], [ 0.8888888888888888, "#000019" ], [ 1.0, "#000020" ] ] } ], "heatmap": [ { "type": "heatmap", "colorscale": [ [ 0.0, "#000011" ], [ 0.1111111111111111, "#000012" ], [ 0.2222222222222222, "#000013" ], [ 0.3333333333333333, "#000014" ], [ 0.4444444444444444, "#000015" ], [ 0.5555555555555556, "#000016" ], [ 0.6666666666666666, "#000017" ], [ 0.7777777777777778, "#000018" ], [ 0.8888888888888888, "#000019" ], [ 1.0, "#000020" ] ] } ], "scatter": [ { "type": "scatter", "marker": { "line": { "width": 0 } } } ], "waterfall": [ { "type": "waterfall", "totals": { "marker": { "color": "#000034" } }, "connector": { "line": { "color": "#000036", "width": 2 } }, "decreasing": { "marker": { "color": "#000033" } }, "increasing": { "marker": { "color": "#000032" } } } ], "candlestick": [ { "type": "candlestick", "decreasing": { "line": { "color": "#000033" } }, "increasing": { "line": { "color": "#000032" } } } ], "histogram2d": [ { "type": "histogram2d", "colorscale": [ [ 0.0, "#000011" ], [ 0.1111111111111111, "#000012" ], [ 0.2222222222222222, "#000013" ], [ 0.3333333333333333, "#000014" ], [ 0.4444444444444444, "#000015" ], [ 0.5555555555555556, "#000016" ], [ 0.6666666666666666, "#000017" ], [ 0.7777777777777778, "#000018" ], [ 0.8888888888888888, "#000019" ], [ 1.0, "#000020" ] ] } ], "contourcarpet": [ { "type": "contourcarpet", "colorscale": [ [ 0.0, "#000011" ], [ 0.1111111111111111, "#000012" ], [ 0.2222222222222222, "#000013" ], [ 0.3333333333333333, "#000014" ], [ 0.4444444444444444, "#000015" ], [ 0.5555555555555556, "#000016" ], [ 0.6666666666666666, "#000017" ], [ 0.7777777777777778, "#000018" ], [ 0.8888888888888888, "#000019" ], [ 1.0, "#000020" ] ] } ] }, "layout": { "colorway": [ "#000001", "#000002", "#000003", "#000004", "#000005", "#000006", "#000007", "#000008", "#000009", "#000010" ], "coloraxis": { "colorscale": [ [ 0.0, "#000011" ], [ 0.1111111111111111, "#000012" ], [ 0.2222222222222222, "#000013" ], [ 0.3333333333333333, "#000014" ], [ 0.4444444444444444, "#000015" ], [ 0.5555555555555556, "#000016" ], [ 0.6666666666666666, "#000017" ], [ 0.7777777777777778, "#000018" ], [ 0.8888888888888888, "#000019" ], [ 1.0, "#000020" ] ] }, "colorscale": { "diverging": [ [ 0.0, "#000021" ], [ 0.1, "#000022" ], [ 0.2, "#000023" ], [ 0.3, "#000024" ], [ 0.4, "#000025" ], [ 0.5, "#000026" ], [ 0.6, "#000027" ], [ 0.7, "#000028" ], [ 0.8, "#000029" ], [ 0.9, "#000030" ], [ 1.0, "#000031" ] ], "sequential": [ [ 0.0, "#000011" ], [ 0.1111111111111111, "#000012" ], [ 0.2222222222222222, "#000013" ], [ 0.3333333333333333, "#000014" ], [ 0.4444444444444444, "#000015" ], [ 0.5555555555555556, "#000016" ], [ 0.6666666666666666, "#000017" ], [ 0.7777777777777778, "#000018" ], [ 0.8888888888888888, "#000019" ], [ 1.0, "#000020" ] ], "sequentialminus": [ [ 0.0, "#000011" ], [ 0.1111111111111111, "#000012" ], [ 0.2222222222222222, "#000013" ], [ 0.3333333333333333, "#000014" ], [ 0.4444444444444444, "#000015" ], [ 0.5555555555555556, "#000016" ], [ 0.6666666666666666, "#000017" ], [ 0.7777777777777778, "#000018" ], [ 0.8888888888888888, "#000019" ], [ 1.0, "#000020" ] ] } } } } }, "height": null, "width": 800, "user": { "profile_url": "https://chart-studio.plotly.com/~hackathon_test", "avatar_url": "https://storage.googleapis.com/plotly-prod-profiles/21.jpg", "background_url": "https://storage.googleapis.com/plotly-prod-profiles/bg-7.jpg", "bio": "", "nickname": "", "website": "", "stream_tokens": null, "feature_set_id": null, "csrf_token": null, "date_joined": "2025-09-16 02:59:33", "mapbox_access_tokens": null, "has_password": null, "username": "hackathon_test", "email": null, "is_active": null, "readonly": null, "is_dash_creator": null, "dash_created_count": null, "is_chart_creator": null, "charts_created_count": null } }, { "creation_time": "2025-09-16T03:20:19.171731Z", "comments": { "results": [], "count": 0 }, "parented": true, "embed_url": "https://chart-studio.plotly.com/~hackathon_test/24.embed", "fid": "hackathon_test:24", "filename": "infracost-bar", "filetype": "plot", "img_url": "https://api.plotly.com/v2/files/hackathon_test:24/image?image_name=list-thumb", "image_urls": { "default": "https://api.plotly.com/v2/files/hackathon_test:24/image?image_name=default", "block-thumb": "https://storage.googleapis.com/plotly-prod-images/hackathon_test/24/8_SH065OQMP8NFDS62IWCD0ABIUV4LJT.png", "list-thumb": "https://api.plotly.com/v2/files/hackathon_test:24/image?image_name=list-thumb" }, "api_urls": { "files": "https://api.plotly.com/v2/files/hackathon_test:24", "plots": "https://api.plotly.com/v2/plots/hackathon_test:24", "parent": "https://api.plotly.com/v2/folders/home?user=hackathon_test" }, "owner": "hackathon_test", "parent": -1, "preview": "", "referencers": [], "references": [], "title": "", "views": 0, "web_url": "https://chart-studio.plotly.com/~hackathon_test/24/", "world_readable": true, "date_modified": "2025-09-16T03:20:38.779Z", "stars": { "results": [], "count": 0 }, "collaborators": { "results": [], "count": 0 }, "subfolder_count": null, "refresh_interval": null, "organize_view_url": "https://chart-studio.plotly.com/~hackathon_test/24/", "current_user_permission": "read", "is_theme": null, "is_template": null, "autosize": true, "caption": "", "figure": { "data": [ { "name": "aws_lb.hack_lb", "type": "bar", "xsrc": "hackathon_test:28:ca21a7", "ysrc": "hackathon_test:28:3b1795", "xaxis": "x", "yaxis": "y", "marker": { "color": "rgb(229, 134, 6)", "pattern": { "shape": "" } }, "showlegend": true, "legendgroup": "aws_lb.hack_lb", "offsetgroup": "aws_lb.hack_lb", "orientation": "v", "textposition": "auto", "hovertemplate": "Resource=%{x}<br>Monthly Cost ($)=%{y}<extra></extra>", "alignmentgroup": "True" }, { "name": "aws_db_instance.hack_db", "type": "bar", "xsrc": "hackathon_test:28:30ea44", "ysrc": "hackathon_test:28:67e14d", "xaxis": "x", "yaxis": "y", "marker": { "color": "rgb(93, 105, 177)", "pattern": { "shape": "" } }, "showlegend": true, "legendgroup": "aws_db_instance.hack_db", "offsetgroup": "aws_db_instance.hack_db", "orientation": "v", "textposition": "auto", "hovertemplate": "Resource=%{x}<br>Monthly Cost ($)=%{y}<extra></extra>", "alignmentgroup": "True" }, { "name": "aws_instance.hack_vm", "type": "bar", "xsrc": "hackathon_test:28:cb2e2e", "ysrc": "hackathon_test:28:90ab02", "xaxis": "x", "yaxis": "y", "marker": { "color": "rgb(82, 188, 163)", "pattern": { "shape": "" } }, "showlegend": true, "legendgroup": "aws_instance.hack_vm", "offsetgroup": "aws_instance.hack_vm", "orientation": "v", "textposition": "auto", "hovertemplate": "Resource=%{x}<br>Monthly Cost ($)=%{y}<extra></extra>", "alignmentgroup": "True" }, { "name": "aws_instance.hack_vm2", "type": "bar", "xsrc": "hackathon_test:28:edc619", "ysrc": "hackathon_test:28:3eeb7d", "xaxis": "x", "yaxis": "y", "marker": { "color": "rgb(153, 201, 69)", "pattern": { "shape": "" } }, "showlegend": true, "legendgroup": "aws_instance.hack_vm2", "offsetgroup": "aws_instance.hack_vm2", "orientation": "v", "textposition": "auto", "hovertemplate": "Resource=%{x}<br>Monthly Cost ($)=%{y}<extra></extra>", "alignmentgroup": "True" }, { "name": "aws_ebs_volume.hack_volume", "type": "bar", "xsrc": "hackathon_test:28:49ae8b", "ysrc": "hackathon_test:28:2c1eb2", "xaxis": "x", "yaxis": "y", "marker": { "color": "rgb(204, 97, 176)", "pattern": { "shape": "" } }, "showlegend": true, "legendgroup": "aws_ebs_volume.hack_volume", "offsetgroup": "aws_ebs_volume.hack_volume", "orientation": "v", "textposition": "auto", "hovertemplate": "Resource=%{x}<br>Monthly Cost ($)=%{y}<extra></extra>", "alignmentgroup": "True" } ], "layout": { "title": { "text": "Monthly Infracost Breakdown per Resource" }, "width": 1200, "xaxis": { "title": { "text": "Resource" }, "anchor": "y", "domain": [ 0.0, 1.0 ], "tickangle": -30, "categoryarray": [ "aws_lb.hack_lb", "aws_db_instance.hack_db", "aws_instance.hack_vm", "aws_instance.hack_vm2", "aws_ebs_volume.hack_volume" ], "categoryorder": "array" }, "yaxis": { "title": { "text": "Monthly Cost ($)" }, "anchor": "x", "domain": [ 0.0, 1.0 ] }, "legend": { "x": 1, "y": 1, "font": { "size": 10 }, "title": { "text": "Resource" }, "bgcolor": "rgba(255,255,255,0.6)", "xanchor": "left", "yanchor": "top", "bordercolor": "black", "borderwidth": 1, "orientation": "v", "tracegroupgap": 0 }, "barmode": "relative", "template": { "data": { "table": [ { "type": "table", "cells": { "fill": { "color": "#000038" }, "font": { "color": "#000037" }, "line": { "color": "#000039" } }, "header": { "fill": { "color": "#000040" }, "font": { "color": "#000036" }, "line": { "color": "#000039" } } } ], "icicle": [ { "type": "icicle", "textfont": { "color": "white" } } ], "sankey": [ { "type": "sankey", "textfont": { "color": "#000036" } } ], "contour": [ { "type": "contour", "colorscale": [ [ 0.0, "#000011" ], [ 0.1111111111111111, "#000012" ], [ 0.2222222222222222, "#000013" ], [ 0.3333333333333333, "#000014" ], [ 0.4444444444444444, "#000015" ], [ 0.5555555555555556, "#000016" ], [ 0.6666666666666666, "#000017" ], [ 0.7777777777777778, "#000018" ], [ 0.8888888888888888, "#000019" ], [ 1.0, "#000020" ] ] } ], "heatmap": [ { "type": "heatmap", "colorscale": [ [ 0.0, "#000011" ], [ 0.1111111111111111, "#000012" ], [ 0.2222222222222222, "#000013" ], [ 0.3333333333333333, "#000014" ], [ 0.4444444444444444, "#000015" ], [ 0.5555555555555556, "#000016" ], [ 0.6666666666666666, "#000017" ], [ 0.7777777777777778, "#000018" ], [ 0.8888888888888888, "#000019" ], [ 1.0, "#000020" ] ] } ], "scatter": [ { "type": "scatter", "marker": { "line": { "width": 0 } } } ], "waterfall": [ { "type": "waterfall", "totals": { "marker": { "color": "#000034" } }, "connector": { "line": { "color": "#000036", "width": 2 } }, "decreasing": { "marker": { "color": "#000033" } }, "increasing": { "marker": { "color": "#000032" } } } ], "candlestick": [ { "type": "candlestick", "decreasing": { "line": { "color": "#000033" } }, "increasing": { "line": { "color": "#000032" } } } ], "histogram2d": [ { "type": "histogram2d", "colorscale": [ [ 0.0, "#000011" ], [ 0.1111111111111111, "#000012" ], [ 0.2222222222222222, "#000013" ], [ 0.3333333333333333, "#000014" ], [ 0.4444444444444444, "#000015" ], [ 0.5555555555555556, "#000016" ], [ 0.6666666666666666, "#000017" ], [ 0.7777777777777778, "#000018" ], [ 0.8888888888888888, "#000019" ], [ 1.0, "#000020" ] ] } ], "contourcarpet": [ { "type": "contourcarpet", "colorscale": [ [ 0.0, "#000011" ], [ 0.1111111111111111, "#000012" ], [ 0.2222222222222222, "#000013" ], [ 0.3333333333333333, "#000014" ], [ 0.4444444444444444, "#000015" ], [ 0.5555555555555556, "#000016" ], [ 0.6666666666666666, "#000017" ], [ 0.7777777777777778, "#000018" ], [ 0.8888888888888888, "#000019" ], [ 1.0, "#000020" ] ] } ] }, "layout": { "colorway": [ "#000001", "#000002", "#000003", "#000004", "#000005", "#000006", "#000007", "#000008", "#000009", "#000010" ], "coloraxis": { "colorscale": [ [ 0.0, "#000011" ], [ 0.1111111111111111, "#000012" ], [ 0.2222222222222222, "#000013" ], [ 0.3333333333333333, "#000014" ], [ 0.4444444444444444, "#000015" ], [ 0.5555555555555556, "#000016" ], [ 0.6666666666666666, "#000017" ], [ 0.7777777777777778, "#000018" ], [ 0.8888888888888888, "#000019" ], [ 1.0, "#000020" ] ] }, "colorscale": { "diverging": [ [ 0.0, "#000021" ], [ 0.1, "#000022" ], [ 0.2, "#000023" ], [ 0.3, "#000024" ], [ 0.4, "#000025" ], [ 0.5, "#000026" ], [ 0.6, "#000027" ], [ 0.7, "#000028" ], [ 0.8, "#000029" ], [ 0.9, "#000030" ], [ 1.0, "#000031" ] ], "sequential": [ [ 0.0, "#000011" ], [ 0.1111111111111111, "#000012" ], [ 0.2222222222222222, "#000013" ], [ 0.3333333333333333, "#000014" ], [ 0.4444444444444444, "#000015" ], [ 0.5555555555555556, "#000016" ], [ 0.6666666666666666, "#000017" ], [ 0.7777777777777778, "#000018" ], [ 0.8888888888888888, "#000019" ], [ 1.0, "#000020" ] ], "sequentialminus": [ [ 0.0, "#000011" ], [ 0.1111111111111111, "#000012" ], [ 0.2222222222222222, "#000013" ], [ 0.3333333333333333, "#000014" ], [ 0.4444444444444444, "#000015" ], [ 0.5555555555555556, "#000016" ], [ 0.6666666666666666, "#000017" ], [ 0.7777777777777778, "#000018" ], [ 0.8888888888888888, "#000019" ], [ 1.0, "#000020" ] ] } } }, "plot_bgcolor": "rgba(245,245,245,1)", "paper_bgcolor": "rgba(245,245,245,1)" } }, "height": null, "width": 1200, "user": { "profile_url": "https://chart-studio.plotly.com/~hackathon_test", "avatar_url": "https://storage.googleapis.com/plotly-prod-profiles/21.jpg", "background_url": "https://storage.googleapis.com/plotly-prod-profiles/bg-7.jpg", "bio": "", "nickname": "", "website": "", "stream_tokens": null, "feature_set_id": null, "csrf_token": null, "date_joined": "2025-09-16 02:59:33", "mapbox_access_tokens": null, "has_password": null, "username": "hackathon_test", "email": null, "is_active": null, "readonly": null, "is_dash_creator": null, "dash_created_count": null, "is_chart_creator": null, "charts_created_count": null } } ] }
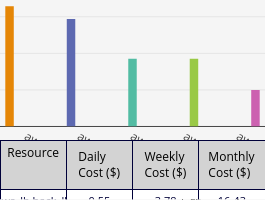
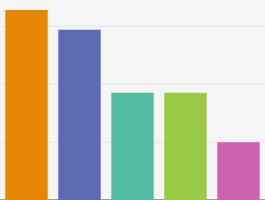
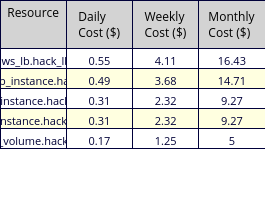