Plots List
Plots
This endpoint handles manipulation of Plotly plot files.
Reference
Authorization
Any user with or without a Plotly account may view public plots. For private plots, see authentication.
Actions
list
Listing all public plots can be done via a GET request to this endpoint.
By default, plots will be listed in order of date created. The order_by
query parameter is accepted at this endpoint. Currently, only ordering by
views is supported. It is possible to filter the plots by quality
with min_quality or max_quality as query parameter.
Example:
// GET https://api.plotly.com/v2/plots/ ---> 200

// GET https://api.plotly.com/v2/plots/?order_by=-views ---> 200

// GET https://api.plotly.com/v2/plots/?min_quality=5 ---> 200

// GET https://api.plotly.com/v2/plots/?max_quality=5 ---> 200
feed
Listing all handpicked feed plots can be done via a GET request to this endpoint. By default, plots will be listed in a random order.
Example:
// GET https://api.plotly.com/v2/plots/feed ---> 200
create
You can create new plot resources here. The only required field is 'figure'. Currently, the figure is restricted to only contain references to grid data. That is, this will fail if raw data arrays are passed in. To create and manipulate underlying grids for plots, see the grids endpoint.
Example:
// This fails because a figure field is required.
// POST https://api.plotly.com/v2/plots ---> 400 Bad Request
{}

// This fails because the figure has raw data
//POST https://api.plotly.com/v2/plots ---> 400 Bad Request
{
    "figure": {"data": [{"y": ['this', 'is', 'raw', 'data']}]}
}

// This succeeds because the figure has src keys, not raw data.
//POST https://api.plotly.com/v2/plots ---> 200 OK
{
    "figure": {"data": [{"ysrc": "sven:88:u8nd62"}]}
}
When creating a grid, you can optionally specify a source_fid to specify where a plot has come from:
- source_fid: the fid of a plot that was copied (and presumably edited) to produce this one
detail
There is a lot of meta information stored about plot files including filename, title, share_url, and content_url to name a few.
This information can only be reached with a GET to this endpoint.
Example:
// GET https://api.plotly.com/v2/plots/iheartgraphs:90
content
The contents of a plot can be downloaded via the content resource. The plot
content contains referenced grid/column data by default. If you wish to
return the raw grid/column data, the inline_data=true query must be included
in the request url. The Content-Type header will be appropriately set for the
response body.
Alternatively, you can set ?map_data=unreadable to append a mapping of
sources to data that belongs to grids which are unreadable for the
requestor. This is useful when you have read access to another users plot,
but that plot contains grid references which you don't have access to.
Examples:
// Returns referenced grid/column data
// GET https://api.plotly.com/v2/plots/iheartgraphs:90/content ---> 200 OK

// Returns full grid/column data
// GET https://api.plotly.com/v2/plots/iheartgraphs:90/content?inline_data=true ---> 200 OK

// Returns full grid/column data when requestor doesn't have permission
// to read the referenced grid.
// GET https://api.plotly.com/v2/plots/iheartgraphs:90/content?map_data=unreadable ---> 200 OK
GET /v2/plots/?cursor=cD0yMDI1LTA5LTEwKzEwJTNBMjYlM0EzMi45MjA3NzklMkIwMCUzQTAw&format=api
{ "next": "https://api.plotly.com/v2/plots/?cursor=cD0yMDI1LTA5LTEwKzA4JTNBMTQlM0ExOC43MTI0MjQlMkIwMCUzQTAw&format=api", "previous": "https://api.plotly.com/v2/plots/?cursor=cj0xJnA9MjAyNS0wOS0xMCsxMCUzQTEwJTNBMzguMzczNTIyJTJCMDAlM0EwMA%3D%3D&format=api", "results": [ { "creation_time": "2025-09-10T10:10:38.373522Z", "comments": { "results": [], "count": 0 }, "parented": true, "embed_url": "https://chart-studio.plotly.com/~opencv.korea/114.embed", "fid": "opencv.korea:114", "filename": "my-embed-chart", "filetype": "plot", "img_url": "https://storage.googleapis.com/plotly-prod-images/opencv.korea/114/9_Y57U40SMPA5Q4NILQ59AYYFM251EI1.png", "image_urls": { "default": "https://storage.googleapis.com/plotly-prod-images/opencv.korea/114/2_H8HD6IM6B7RP7P9M6EDSEGHTM7N1MF.png", "block-thumb": "https://storage.googleapis.com/plotly-prod-images/opencv.korea/114/8_XNFE7A2CG81L5KV8NLC6VMKO55W40L.png", "list-thumb": "https://storage.googleapis.com/plotly-prod-images/opencv.korea/114/9_Y57U40SMPA5Q4NILQ59AYYFM251EI1.png" }, "api_urls": { "files": "https://api.plotly.com/v2/files/opencv.korea:114", "plots": "https://api.plotly.com/v2/plots/opencv.korea:114", "parent": "https://api.plotly.com/v2/folders/home?user=opencv.korea" }, "owner": "opencv.korea", "parent": -1, "preview": "", "referencers": [], "references": [], "title": "", "views": 1, "web_url": "https://chart-studio.plotly.com/~opencv.korea/114/", "world_readable": true, "date_modified": "2025-09-10T10:13:14.986Z", "stars": { "results": [], "count": 0 }, "collaborators": { "results": [], "count": 0 }, "subfolder_count": null, "refresh_interval": null, "organize_view_url": "https://chart-studio.plotly.com/~opencv.korea/114/", "current_user_permission": "read", "is_theme": null, "is_template": null, "autosize": true, "caption": "", "figure": { "data": [ { "mode": "lines+markers", "type": "scatter", "xsrc": "opencv.korea:118:a67d2f", "ysrc": "opencv.korea:118:bbc03f" } ], "layout": { "template": { "data": { "bar": [ { "type": "bar", "marker": { "line": { "color": "#E5ECF6", "width": 0.5 }, "pattern": { "size": 10, "fillmode": "overlay", "solidity": 0.2 } }, "error_x": { "color": "#2a3f5f" }, "error_y": { "color": "#2a3f5f" } } ], "pie": [ { "type": "pie", "automargin": true } ], "table": [ { "type": "table", "cells": { "fill": { "color": "#EBF0F8" }, "line": { "color": "white" } }, "header": { "fill": { "color": "#C8D4E3" }, "line": { "color": "white" } } } ], "carpet": [ { "type": "carpet", "aaxis": { "gridcolor": "white", "linecolor": "white", "endlinecolor": "#2a3f5f", "minorgridcolor": "white", "startlinecolor": "#2a3f5f" }, "baxis": { "gridcolor": "white", "linecolor": "white", "endlinecolor": "#2a3f5f", "minorgridcolor": "white", "startlinecolor": "#2a3f5f" } } ], "mesh3d": [ { "type": "mesh3d", "colorbar": { "ticks": "", "outlinewidth": 0 } } ], "contour": [ { "type": "contour", "colorbar": { "ticks": "", "outlinewidth": 0 }, "colorscale": [ [ 0.0, "#0d0887" ], [ 0.1111111111111111, "#46039f" ], [ 0.2222222222222222, "#7201a8" ], [ 0.3333333333333333, "#9c179e" ], [ 0.4444444444444444, "#bd3786" ], [ 0.5555555555555556, "#d8576b" ], [ 0.6666666666666666, "#ed7953" ], [ 0.7777777777777778, "#fb9f3a" ], [ 0.8888888888888888, "#fdca26" ], [ 1.0, "#f0f921" ] ] } ], "heatmap": [ { "type": "heatmap", "colorbar": { "ticks": "", "outlinewidth": 0 }, "colorscale": [ [ 0.0, "#0d0887" ], [ 0.1111111111111111, "#46039f" ], [ 0.2222222222222222, "#7201a8" ], [ 0.3333333333333333, "#9c179e" ], [ 0.4444444444444444, "#bd3786" ], [ 0.5555555555555556, "#d8576b" ], [ 0.6666666666666666, "#ed7953" ], [ 0.7777777777777778, "#fb9f3a" ], [ 0.8888888888888888, "#fdca26" ], [ 1.0, "#f0f921" ] ] } ], "scatter": [ { "type": "scatter", "fillpattern": { "size": 10, "fillmode": "overlay", "solidity": 0.2 } } ], "surface": [ { "type": "surface", "colorbar": { "ticks": "", "outlinewidth": 0 }, "colorscale": [ [ 0.0, "#0d0887" ], [ 0.1111111111111111, "#46039f" ], [ 0.2222222222222222, "#7201a8" ], [ 0.3333333333333333, "#9c179e" ], [ 0.4444444444444444, "#bd3786" ], [ 0.5555555555555556, "#d8576b" ], [ 0.6666666666666666, "#ed7953" ], [ 0.7777777777777778, "#fb9f3a" ], [ 0.8888888888888888, "#fdca26" ], [ 1.0, "#f0f921" ] ] } ], "barpolar": [ { "type": "barpolar", "marker": { "line": { "color": "#E5ECF6", "width": 0.5 }, "pattern": { "size": 10, "fillmode": "overlay", "solidity": 0.2 } } } ], "heatmapgl": [ { "type": "heatmapgl", "colorbar": { "ticks": "", "outlinewidth": 0 }, "colorscale": [ [ 0.0, "#0d0887" ], [ 0.1111111111111111, "#46039f" ], [ 0.2222222222222222, "#7201a8" ], [ 0.3333333333333333, "#9c179e" ], [ 0.4444444444444444, "#bd3786" ], [ 0.5555555555555556, "#d8576b" ], [ 0.6666666666666666, "#ed7953" ], [ 0.7777777777777778, "#fb9f3a" ], [ 0.8888888888888888, "#fdca26" ], [ 1.0, "#f0f921" ] ] } ], "histogram": [ { "type": "histogram", "marker": { "pattern": { "size": 10, "fillmode": "overlay", "solidity": 0.2 } } } ], "parcoords": [ { "line": { "colorbar": { "ticks": "", "outlinewidth": 0 } }, "type": "parcoords" } ], "scatter3d": [ { "line": { "colorbar": { "ticks": "", "outlinewidth": 0 } }, "type": "scatter3d", "marker": { "colorbar": { "ticks": "", "outlinewidth": 0 } } } ], "scattergl": [ { "type": "scattergl", "marker": { "colorbar": { "ticks": "", "outlinewidth": 0 } } } ], "choropleth": [ { "type": "choropleth", "colorbar": { "ticks": "", "outlinewidth": 0 } } ], "scattergeo": [ { "type": "scattergeo", "marker": { "colorbar": { "ticks": "", "outlinewidth": 0 } } } ], "histogram2d": [ { "type": "histogram2d", "colorbar": { "ticks": "", "outlinewidth": 0 }, "colorscale": [ [ 0.0, "#0d0887" ], [ 0.1111111111111111, "#46039f" ], [ 0.2222222222222222, "#7201a8" ], [ 0.3333333333333333, "#9c179e" ], [ 0.4444444444444444, "#bd3786" ], [ 0.5555555555555556, "#d8576b" ], [ 0.6666666666666666, "#ed7953" ], [ 0.7777777777777778, "#fb9f3a" ], [ 0.8888888888888888, "#fdca26" ], [ 1.0, "#f0f921" ] ] } ], "scatterpolar": [ { "type": "scatterpolar", "marker": { "colorbar": { "ticks": "", "outlinewidth": 0 } } } ], "contourcarpet": [ { "type": "contourcarpet", "colorbar": { "ticks": "", "outlinewidth": 0 } } ], "scattercarpet": [ { "type": "scattercarpet", "marker": { "colorbar": { "ticks": "", "outlinewidth": 0 } } } ], "scattermapbox": [ { "type": "scattermapbox", "marker": { "colorbar": { "ticks": "", "outlinewidth": 0 } } } ], "scatterpolargl": [ { "type": "scatterpolargl", "marker": { "colorbar": { "ticks": "", "outlinewidth": 0 } } } ], "scatterternary": [ { "type": "scatterternary", "marker": { "colorbar": { "ticks": "", "outlinewidth": 0 } } } ], "histogram2dcontour": [ { "type": "histogram2dcontour", "colorbar": { "ticks": "", "outlinewidth": 0 }, "colorscale": [ [ 0.0, "#0d0887" ], [ 0.1111111111111111, "#46039f" ], [ 0.2222222222222222, "#7201a8" ], [ 0.3333333333333333, "#9c179e" ], [ 0.4444444444444444, "#bd3786" ], [ 0.5555555555555556, "#d8576b" ], [ 0.6666666666666666, "#ed7953" ], [ 0.7777777777777778, "#fb9f3a" ], [ 0.8888888888888888, "#fdca26" ], [ 1.0, "#f0f921" ] ] } ] }, "layout": { "geo": { "bgcolor": "white", "showland": true, "lakecolor": "white", "landcolor": "#E5ECF6", "showlakes": true, "subunitcolor": "white" }, "font": { "color": "#2a3f5f" }, "polar": { "bgcolor": "#E5ECF6", "radialaxis": { "ticks": "", "gridcolor": "white", "linecolor": "white" }, "angularaxis": { "ticks": "", "gridcolor": "white", "linecolor": "white" } }, "scene": { "xaxis": { "ticks": "", "gridcolor": "white", "gridwidth": 2, "linecolor": "white", "zerolinecolor": "white", "showbackground": true, "backgroundcolor": "#E5ECF6" }, "yaxis": { "ticks": "", "gridcolor": "white", "gridwidth": 2, "linecolor": "white", "zerolinecolor": "white", "showbackground": true, "backgroundcolor": "#E5ECF6" }, "zaxis": { "ticks": "", "gridcolor": "white", "gridwidth": 2, "linecolor": "white", "zerolinecolor": "white", "showbackground": true, "backgroundcolor": "#E5ECF6" } }, "title": { "x": 0.05 }, "xaxis": { "ticks": "", "title": { "standoff": 15 }, "gridcolor": "white", "linecolor": "white", "automargin": true, "zerolinecolor": "white", "zerolinewidth": 2 }, "yaxis": { "ticks": "", "title": { "standoff": 15 }, "gridcolor": "white", "linecolor": "white", "automargin": true, "zerolinecolor": "white", "zerolinewidth": 2 }, "mapbox": { "style": "light" }, "ternary": { "aaxis": { "ticks": "", "gridcolor": "white", "linecolor": "white" }, "baxis": { "ticks": "", "gridcolor": "white", "linecolor": "white" }, "caxis": { "ticks": "", "gridcolor": "white", "linecolor": "white" }, "bgcolor": "#E5ECF6" }, "colorway": [ "#636efa", "#EF553B", "#00cc96", "#ab63fa", "#FFA15A", "#19d3f3", "#FF6692", "#B6E880", "#FF97FF", "#FECB52" ], "coloraxis": { "colorbar": { "ticks": "", "outlinewidth": 0 } }, "hovermode": "closest", "colorscale": { "diverging": [ [ 0, "#8e0152" ], [ 0.1, "#c51b7d" ], [ 0.2, "#de77ae" ], [ 0.3, "#f1b6da" ], [ 0.4, "#fde0ef" ], [ 0.5, "#f7f7f7" ], [ 0.6, "#e6f5d0" ], [ 0.7, "#b8e186" ], [ 0.8, "#7fbc41" ], [ 0.9, "#4d9221" ], [ 1, "#276419" ] ], "sequential": [ [ 0.0, "#0d0887" ], [ 0.1111111111111111, "#46039f" ], [ 0.2222222222222222, "#7201a8" ], [ 0.3333333333333333, "#9c179e" ], [ 0.4444444444444444, "#bd3786" ], [ 0.5555555555555556, "#d8576b" ], [ 0.6666666666666666, "#ed7953" ], [ 0.7777777777777778, "#fb9f3a" ], [ 0.8888888888888888, "#fdca26" ], [ 1.0, "#f0f921" ] ], "sequentialminus": [ [ 0.0, "#0d0887" ], [ 0.1111111111111111, "#46039f" ], [ 0.2222222222222222, "#7201a8" ], [ 0.3333333333333333, "#9c179e" ], [ 0.4444444444444444, "#bd3786" ], [ 0.5555555555555556, "#d8576b" ], [ 0.6666666666666666, "#ed7953" ], [ 0.7777777777777778, "#fb9f3a" ], [ 0.8888888888888888, "#fdca26" ], [ 1.0, "#f0f921" ] ] }, "hoverlabel": { "align": "left" }, "plot_bgcolor": "#E5ECF6", "paper_bgcolor": "white", "shapedefaults": { "line": { "color": "#2a3f5f" } }, "autotypenumbers": "strict", "annotationdefaults": { "arrowhead": 0, "arrowcolor": "#2a3f5f", "arrowwidth": 1 } } } } }, "height": null, "width": null, "user": { "profile_url": "https://chart-studio.plotly.com/~opencv.korea", "avatar_url": "https://storage.googleapis.com/plotly-prod-profiles/GPDKQ7OAFE318I3TRAFP4MVAXP7TZP.jpg", "background_url": "https://storage.googleapis.com/plotly-prod-profiles/bg-6.jpg", "bio": "", "nickname": "", "website": "", "stream_tokens": null, "feature_set_id": null, "csrf_token": null, "date_joined": "2022-03-16 13:01:08", "mapbox_access_tokens": null, "has_password": null, "username": "opencv.korea", "email": null, "is_active": null, "readonly": null, "is_dash_creator": null, "dash_created_count": null, "is_chart_creator": null, "charts_created_count": null } }, { "creation_time": "2025-09-10T10:06:04.321693Z", "comments": { "results": [], "count": 0 }, "parented": true, "embed_url": "https://chart-studio.plotly.com/~opencv.korea/111.embed", "fid": "opencv.korea:111", "filename": "test-chart", "filetype": "plot", "img_url": "https://storage.googleapis.com/plotly-prod-images/opencv.korea/111/9_T7VT0AH6PD8DA6PA7KRBX20QBWH7GB.png", "image_urls": { "default": "https://storage.googleapis.com/plotly-prod-images/opencv.korea/111/2_NPQ57PA2CXYE95H269TCPLVN8GID0X.png", "block-thumb": "https://storage.googleapis.com/plotly-prod-images/opencv.korea/111/8_Q6QL2W9RG7U5MS0EPUIOMZH6SQAGYU.png", "list-thumb": "https://storage.googleapis.com/plotly-prod-images/opencv.korea/111/9_T7VT0AH6PD8DA6PA7KRBX20QBWH7GB.png" }, "api_urls": { "files": "https://api.plotly.com/v2/files/opencv.korea:111", "plots": "https://api.plotly.com/v2/plots/opencv.korea:111", "parent": "https://api.plotly.com/v2/folders/home?user=opencv.korea" }, "owner": "opencv.korea", "parent": -1, "preview": "", "referencers": [], "references": [], "title": "", "views": 1, "web_url": "https://chart-studio.plotly.com/~opencv.korea/111/", "world_readable": true, "date_modified": "2025-09-10T10:25:27.525Z", "stars": { "results": [], "count": 0 }, "collaborators": { "results": [], "count": 0 }, "subfolder_count": null, "refresh_interval": null, "organize_view_url": "https://chart-studio.plotly.com/~opencv.korea/111/", "current_user_permission": "read", "is_theme": null, "is_template": null, "autosize": true, "caption": "", "figure": { "data": [ { "x0": " ", "y0": " ", "box": { "visible": false }, "name": "Female", "type": "violin", "ysrc": "opencv.korea:123:c5aabb", "xaxis": "x", "yaxis": "y", "marker": { "color": "#636efa" }, "scalegroup": "True", "showlegend": true, "legendgroup": "Female", "offsetgroup": "Female", "orientation": "v", "hovertemplate": "sex=Female<br>total_bill=%{y}<extra></extra>", "alignmentgroup": "True" }, { "x0": " ", "y0": " ", "box": { "visible": false }, "name": "Male", "type": "violin", "ysrc": "opencv.korea:123:a4d30e", "xaxis": "x", "yaxis": "y", "marker": { "color": "#EF553B" }, "scalegroup": "True", "showlegend": true, "legendgroup": "Male", "offsetgroup": "Male", "orientation": "v", "hovertemplate": "sex=Male<br>total_bill=%{y}<extra></extra>", "alignmentgroup": "True" } ], "layout": { "width": 600, "xaxis": { "anchor": "y", "domain": [ 0.0, 1.0 ] }, "yaxis": { "title": { "text": "total_bill" }, "anchor": "x", "domain": [ 0.0, 1.0 ] }, "height": 300, "legend": { "title": { "text": "sex" }, "tracegroupgap": 0 }, "margin": { "t": 60 }, "template": { "data": { "bar": [ { "type": "bar", "marker": { "line": { "color": "#E5ECF6", "width": 0.5 }, "pattern": { "size": 10, "fillmode": "overlay", "solidity": 0.2 } }, "error_x": { "color": "#2a3f5f" }, "error_y": { "color": "#2a3f5f" } } ], "pie": [ { "type": "pie", "automargin": true } ], "table": [ { "type": "table", "cells": { "fill": { "color": "#EBF0F8" }, "line": { "color": "white" } }, "header": { "fill": { "color": "#C8D4E3" }, "line": { "color": "white" } } } ], "carpet": [ { "type": "carpet", "aaxis": { "gridcolor": "white", "linecolor": "white", "endlinecolor": "#2a3f5f", "minorgridcolor": "white", "startlinecolor": "#2a3f5f" }, "baxis": { "gridcolor": "white", "linecolor": "white", "endlinecolor": "#2a3f5f", "minorgridcolor": "white", "startlinecolor": "#2a3f5f" } } ], "mesh3d": [ { "type": "mesh3d", "colorbar": { "ticks": "", "outlinewidth": 0 } } ], "contour": [ { "type": "contour", "colorbar": { "ticks": "", "outlinewidth": 0 }, "colorscale": [ [ 0.0, "#0d0887" ], [ 0.1111111111111111, "#46039f" ], [ 0.2222222222222222, "#7201a8" ], [ 0.3333333333333333, "#9c179e" ], [ 0.4444444444444444, "#bd3786" ], [ 0.5555555555555556, "#d8576b" ], [ 0.6666666666666666, "#ed7953" ], [ 0.7777777777777778, "#fb9f3a" ], [ 0.8888888888888888, "#fdca26" ], [ 1.0, "#f0f921" ] ] } ], "heatmap": [ { "type": "heatmap", "colorbar": { "ticks": "", "outlinewidth": 0 }, "colorscale": [ [ 0.0, "#0d0887" ], [ 0.1111111111111111, "#46039f" ], [ 0.2222222222222222, "#7201a8" ], [ 0.3333333333333333, "#9c179e" ], [ 0.4444444444444444, "#bd3786" ], [ 0.5555555555555556, "#d8576b" ], [ 0.6666666666666666, "#ed7953" ], [ 0.7777777777777778, "#fb9f3a" ], [ 0.8888888888888888, "#fdca26" ], [ 1.0, "#f0f921" ] ] } ], "scatter": [ { "type": "scatter", "fillpattern": { "size": 10, "fillmode": "overlay", "solidity": 0.2 } } ], "surface": [ { "type": "surface", "colorbar": { "ticks": "", "outlinewidth": 0 }, "colorscale": [ [ 0.0, "#0d0887" ], [ 0.1111111111111111, "#46039f" ], [ 0.2222222222222222, "#7201a8" ], [ 0.3333333333333333, "#9c179e" ], [ 0.4444444444444444, "#bd3786" ], [ 0.5555555555555556, "#d8576b" ], [ 0.6666666666666666, "#ed7953" ], [ 0.7777777777777778, "#fb9f3a" ], [ 0.8888888888888888, "#fdca26" ], [ 1.0, "#f0f921" ] ] } ], "barpolar": [ { "type": "barpolar", "marker": { "line": { "color": "#E5ECF6", "width": 0.5 }, "pattern": { "size": 10, "fillmode": "overlay", "solidity": 0.2 } } } ], "heatmapgl": [ { "type": "heatmapgl", "colorbar": { "ticks": "", "outlinewidth": 0 }, "colorscale": [ [ 0.0, "#0d0887" ], [ 0.1111111111111111, "#46039f" ], [ 0.2222222222222222, "#7201a8" ], [ 0.3333333333333333, "#9c179e" ], [ 0.4444444444444444, "#bd3786" ], [ 0.5555555555555556, "#d8576b" ], [ 0.6666666666666666, "#ed7953" ], [ 0.7777777777777778, "#fb9f3a" ], [ 0.8888888888888888, "#fdca26" ], [ 1.0, "#f0f921" ] ] } ], "histogram": [ { "type": "histogram", "marker": { "pattern": { "size": 10, "fillmode": "overlay", "solidity": 0.2 } } } ], "parcoords": [ { "line": { "colorbar": { "ticks": "", "outlinewidth": 0 } }, "type": "parcoords" } ], "scatter3d": [ { "line": { "colorbar": { "ticks": "", "outlinewidth": 0 } }, "type": "scatter3d", "marker": { "colorbar": { "ticks": "", "outlinewidth": 0 } } } ], "scattergl": [ { "type": "scattergl", "marker": { "colorbar": { "ticks": "", "outlinewidth": 0 } } } ], "choropleth": [ { "type": "choropleth", "colorbar": { "ticks": "", "outlinewidth": 0 } } ], "scattergeo": [ { "type": "scattergeo", "marker": { "colorbar": { "ticks": "", "outlinewidth": 0 } } } ], "histogram2d": [ { "type": "histogram2d", "colorbar": { "ticks": "", "outlinewidth": 0 }, "colorscale": [ [ 0.0, "#0d0887" ], [ 0.1111111111111111, "#46039f" ], [ 0.2222222222222222, "#7201a8" ], [ 0.3333333333333333, "#9c179e" ], [ 0.4444444444444444, "#bd3786" ], [ 0.5555555555555556, "#d8576b" ], [ 0.6666666666666666, "#ed7953" ], [ 0.7777777777777778, "#fb9f3a" ], [ 0.8888888888888888, "#fdca26" ], [ 1.0, "#f0f921" ] ] } ], "scatterpolar": [ { "type": "scatterpolar", "marker": { "colorbar": { "ticks": "", "outlinewidth": 0 } } } ], "contourcarpet": [ { "type": "contourcarpet", "colorbar": { "ticks": "", "outlinewidth": 0 } } ], "scattercarpet": [ { "type": "scattercarpet", "marker": { "colorbar": { "ticks": "", "outlinewidth": 0 } } } ], "scattermapbox": [ { "type": "scattermapbox", "marker": { "colorbar": { "ticks": "", "outlinewidth": 0 } } } ], "scatterpolargl": [ { "type": "scatterpolargl", "marker": { "colorbar": { "ticks": "", "outlinewidth": 0 } } } ], "scatterternary": [ { "type": "scatterternary", "marker": { "colorbar": { "ticks": "", "outlinewidth": 0 } } } ], "histogram2dcontour": [ { "type": "histogram2dcontour", "colorbar": { "ticks": "", "outlinewidth": 0 }, "colorscale": [ [ 0.0, "#0d0887" ], [ 0.1111111111111111, "#46039f" ], [ 0.2222222222222222, "#7201a8" ], [ 0.3333333333333333, "#9c179e" ], [ 0.4444444444444444, "#bd3786" ], [ 0.5555555555555556, "#d8576b" ], [ 0.6666666666666666, "#ed7953" ], [ 0.7777777777777778, "#fb9f3a" ], [ 0.8888888888888888, "#fdca26" ], [ 1.0, "#f0f921" ] ] } ] }, "layout": { "geo": { "bgcolor": "white", "showland": true, "lakecolor": "white", "landcolor": "#E5ECF6", "showlakes": true, "subunitcolor": "white" }, "font": { "color": "#2a3f5f" }, "polar": { "bgcolor": "#E5ECF6", "radialaxis": { "ticks": "", "gridcolor": "white", "linecolor": "white" }, "angularaxis": { "ticks": "", "gridcolor": "white", "linecolor": "white" } }, "scene": { "xaxis": { "ticks": "", "gridcolor": "white", "gridwidth": 2, "linecolor": "white", "zerolinecolor": "white", "showbackground": true, "backgroundcolor": "#E5ECF6" }, "yaxis": { "ticks": "", "gridcolor": "white", "gridwidth": 2, "linecolor": "white", "zerolinecolor": "white", "showbackground": true, "backgroundcolor": "#E5ECF6" }, "zaxis": { "ticks": "", "gridcolor": "white", "gridwidth": 2, "linecolor": "white", "zerolinecolor": "white", "showbackground": true, "backgroundcolor": "#E5ECF6" } }, "title": { "x": 0.05 }, "xaxis": { "ticks": "", "title": { "standoff": 15 }, "gridcolor": "white", "linecolor": "white", "automargin": true, "zerolinecolor": "white", "zerolinewidth": 2 }, "yaxis": { "ticks": "", "title": { "standoff": 15 }, "gridcolor": "white", "linecolor": "white", "automargin": true, "zerolinecolor": "white", "zerolinewidth": 2 }, "mapbox": { "style": "light" }, "ternary": { "aaxis": { "ticks": "", "gridcolor": "white", "linecolor": "white" }, "baxis": { "ticks": "", "gridcolor": "white", "linecolor": "white" }, "caxis": { "ticks": "", "gridcolor": "white", "linecolor": "white" }, "bgcolor": "#E5ECF6" }, "colorway": [ "#636efa", "#EF553B", "#00cc96", "#ab63fa", "#FFA15A", "#19d3f3", "#FF6692", "#B6E880", "#FF97FF", "#FECB52" ], "coloraxis": { "colorbar": { "ticks": "", "outlinewidth": 0 } }, "hovermode": "closest", "colorscale": { "diverging": [ [ 0, "#8e0152" ], [ 0.1, "#c51b7d" ], [ 0.2, "#de77ae" ], [ 0.3, "#f1b6da" ], [ 0.4, "#fde0ef" ], [ 0.5, "#f7f7f7" ], [ 0.6, "#e6f5d0" ], [ 0.7, "#b8e186" ], [ 0.8, "#7fbc41" ], [ 0.9, "#4d9221" ], [ 1, "#276419" ] ], "sequential": [ [ 0.0, "#0d0887" ], [ 0.1111111111111111, "#46039f" ], [ 0.2222222222222222, "#7201a8" ], [ 0.3333333333333333, "#9c179e" ], [ 0.4444444444444444, "#bd3786" ], [ 0.5555555555555556, "#d8576b" ], [ 0.6666666666666666, "#ed7953" ], [ 0.7777777777777778, "#fb9f3a" ], [ 0.8888888888888888, "#fdca26" ], [ 1.0, "#f0f921" ] ], "sequentialminus": [ [ 0.0, "#0d0887" ], [ 0.1111111111111111, "#46039f" ], [ 0.2222222222222222, "#7201a8" ], [ 0.3333333333333333, "#9c179e" ], [ 0.4444444444444444, "#bd3786" ], [ 0.5555555555555556, "#d8576b" ], [ 0.6666666666666666, "#ed7953" ], [ 0.7777777777777778, "#fb9f3a" ], [ 0.8888888888888888, "#fdca26" ], [ 1.0, "#f0f921" ] ] }, "hoverlabel": { "align": "left" }, "plot_bgcolor": "#E5ECF6", "paper_bgcolor": "white", "shapedefaults": { "line": { "color": "#2a3f5f" } }, "autotypenumbers": "strict", "annotationdefaults": { "arrowhead": 0, "arrowcolor": "#2a3f5f", "arrowwidth": 1 } } }, "violinmode": "group" } }, "height": 300, "width": 600, "user": { "profile_url": "https://chart-studio.plotly.com/~opencv.korea", "avatar_url": "https://storage.googleapis.com/plotly-prod-profiles/GPDKQ7OAFE318I3TRAFP4MVAXP7TZP.jpg", "background_url": "https://storage.googleapis.com/plotly-prod-profiles/bg-6.jpg", "bio": "", "nickname": "", "website": "", "stream_tokens": null, "feature_set_id": null, "csrf_token": null, "date_joined": "2022-03-16 13:01:08", "mapbox_access_tokens": null, "has_password": null, "username": "opencv.korea", "email": null, "is_active": null, "readonly": null, "is_dash_creator": null, "dash_created_count": null, "is_chart_creator": null, "charts_created_count": null } }, { "creation_time": "2025-09-10T10:06:00.899310Z", "comments": { "results": [], "count": 0 }, "parented": true, "embed_url": "https://chart-studio.plotly.com/~opencv.korea/109.embed", "fid": "opencv.korea:109", "filename": "SSA-차트", "filetype": "plot", "img_url": "https://storage.googleapis.com/plotly-prod-images/opencv.korea/109/9_XQD8UF3H71WOG5HEU5NJTFQDFX4DIA.png", "image_urls": { "default": "https://storage.googleapis.com/plotly-prod-images/opencv.korea/109/2_8K10UESIUH6SOOWL54S2HFDWK7P0LQ.png", "block-thumb": "https://storage.googleapis.com/plotly-prod-images/opencv.korea/109/8_EDFYQ4TEI4W26RYBW45RHGGZX5VK0W.png", "list-thumb": "https://storage.googleapis.com/plotly-prod-images/opencv.korea/109/9_XQD8UF3H71WOG5HEU5NJTFQDFX4DIA.png" }, "api_urls": { "files": "https://api.plotly.com/v2/files/opencv.korea:109", "plots": "https://api.plotly.com/v2/plots/opencv.korea:109", "parent": "https://api.plotly.com/v2/folders/home?user=opencv.korea" }, "owner": "opencv.korea", "parent": -1, "preview": "", "referencers": [], "references": [], "title": "", "views": 1, "web_url": "https://chart-studio.plotly.com/~opencv.korea/109/", "world_readable": true, "date_modified": "2025-09-10T10:09:43.656Z", "stars": { "results": [], "count": 0 }, "collaborators": { "results": [], "count": 0 }, "subfolder_count": null, "refresh_interval": null, "organize_view_url": "https://chart-studio.plotly.com/~opencv.korea/109/", "current_user_permission": "read", "is_theme": null, "is_template": null, "autosize": true, "caption": "", "figure": { "data": [ { "mode": "lines+markers", "type": "scatter", "xsrc": "opencv.korea:112:ccbf13", "ysrc": "opencv.korea:112:3c458a" } ], "layout": { "template": { "data": { "bar": [ { "type": "bar", "marker": { "line": { "color": "#E5ECF6", "width": 0.5 }, "pattern": { "size": 10, "fillmode": "overlay", "solidity": 0.2 } }, "error_x": { "color": "#2a3f5f" }, "error_y": { "color": "#2a3f5f" } } ], "pie": [ { "type": "pie", "automargin": true } ], "table": [ { "type": "table", "cells": { "fill": { "color": "#EBF0F8" }, "line": { "color": "white" } }, "header": { "fill": { "color": "#C8D4E3" }, "line": { "color": "white" } } } ], "carpet": [ { "type": "carpet", "aaxis": { "gridcolor": "white", "linecolor": "white", "endlinecolor": "#2a3f5f", "minorgridcolor": "white", "startlinecolor": "#2a3f5f" }, "baxis": { "gridcolor": "white", "linecolor": "white", "endlinecolor": "#2a3f5f", "minorgridcolor": "white", "startlinecolor": "#2a3f5f" } } ], "mesh3d": [ { "type": "mesh3d", "colorbar": { "ticks": "", "outlinewidth": 0 } } ], "contour": [ { "type": "contour", "colorbar": { "ticks": "", "outlinewidth": 0 }, "colorscale": [ [ 0.0, "#0d0887" ], [ 0.1111111111111111, "#46039f" ], [ 0.2222222222222222, "#7201a8" ], [ 0.3333333333333333, "#9c179e" ], [ 0.4444444444444444, "#bd3786" ], [ 0.5555555555555556, "#d8576b" ], [ 0.6666666666666666, "#ed7953" ], [ 0.7777777777777778, "#fb9f3a" ], [ 0.8888888888888888, "#fdca26" ], [ 1.0, "#f0f921" ] ] } ], "heatmap": [ { "type": "heatmap", "colorbar": { "ticks": "", "outlinewidth": 0 }, "colorscale": [ [ 0.0, "#0d0887" ], [ 0.1111111111111111, "#46039f" ], [ 0.2222222222222222, "#7201a8" ], [ 0.3333333333333333, "#9c179e" ], [ 0.4444444444444444, "#bd3786" ], [ 0.5555555555555556, "#d8576b" ], [ 0.6666666666666666, "#ed7953" ], [ 0.7777777777777778, "#fb9f3a" ], [ 0.8888888888888888, "#fdca26" ], [ 1.0, "#f0f921" ] ] } ], "scatter": [ { "type": "scatter", "fillpattern": { "size": 10, "fillmode": "overlay", "solidity": 0.2 } } ], "surface": [ { "type": "surface", "colorbar": { "ticks": "", "outlinewidth": 0 }, "colorscale": [ [ 0.0, "#0d0887" ], [ 0.1111111111111111, "#46039f" ], [ 0.2222222222222222, "#7201a8" ], [ 0.3333333333333333, "#9c179e" ], [ 0.4444444444444444, "#bd3786" ], [ 0.5555555555555556, "#d8576b" ], [ 0.6666666666666666, "#ed7953" ], [ 0.7777777777777778, "#fb9f3a" ], [ 0.8888888888888888, "#fdca26" ], [ 1.0, "#f0f921" ] ] } ], "barpolar": [ { "type": "barpolar", "marker": { "line": { "color": "#E5ECF6", "width": 0.5 }, "pattern": { "size": 10, "fillmode": "overlay", "solidity": 0.2 } } } ], "heatmapgl": [ { "type": "heatmapgl", "colorbar": { "ticks": "", "outlinewidth": 0 }, "colorscale": [ [ 0.0, "#0d0887" ], [ 0.1111111111111111, "#46039f" ], [ 0.2222222222222222, "#7201a8" ], [ 0.3333333333333333, "#9c179e" ], [ 0.4444444444444444, "#bd3786" ], [ 0.5555555555555556, "#d8576b" ], [ 0.6666666666666666, "#ed7953" ], [ 0.7777777777777778, "#fb9f3a" ], [ 0.8888888888888888, "#fdca26" ], [ 1.0, "#f0f921" ] ] } ], "histogram": [ { "type": "histogram", "marker": { "pattern": { "size": 10, "fillmode": "overlay", "solidity": 0.2 } } } ], "parcoords": [ { "line": { "colorbar": { "ticks": "", "outlinewidth": 0 } }, "type": "parcoords" } ], "scatter3d": [ { "line": { "colorbar": { "ticks": "", "outlinewidth": 0 } }, "type": "scatter3d", "marker": { "colorbar": { "ticks": "", "outlinewidth": 0 } } } ], "scattergl": [ { "type": "scattergl", "marker": { "colorbar": { "ticks": "", "outlinewidth": 0 } } } ], "choropleth": [ { "type": "choropleth", "colorbar": { "ticks": "", "outlinewidth": 0 } } ], "scattergeo": [ { "type": "scattergeo", "marker": { "colorbar": { "ticks": "", "outlinewidth": 0 } } } ], "histogram2d": [ { "type": "histogram2d", "colorbar": { "ticks": "", "outlinewidth": 0 }, "colorscale": [ [ 0.0, "#0d0887" ], [ 0.1111111111111111, "#46039f" ], [ 0.2222222222222222, "#7201a8" ], [ 0.3333333333333333, "#9c179e" ], [ 0.4444444444444444, "#bd3786" ], [ 0.5555555555555556, "#d8576b" ], [ 0.6666666666666666, "#ed7953" ], [ 0.7777777777777778, "#fb9f3a" ], [ 0.8888888888888888, "#fdca26" ], [ 1.0, "#f0f921" ] ] } ], "scatterpolar": [ { "type": "scatterpolar", "marker": { "colorbar": { "ticks": "", "outlinewidth": 0 } } } ], "contourcarpet": [ { "type": "contourcarpet", "colorbar": { "ticks": "", "outlinewidth": 0 } } ], "scattercarpet": [ { "type": "scattercarpet", "marker": { "colorbar": { "ticks": "", "outlinewidth": 0 } } } ], "scattermapbox": [ { "type": "scattermapbox", "marker": { "colorbar": { "ticks": "", "outlinewidth": 0 } } } ], "scatterpolargl": [ { "type": "scatterpolargl", "marker": { "colorbar": { "ticks": "", "outlinewidth": 0 } } } ], "scatterternary": [ { "type": "scatterternary", "marker": { "colorbar": { "ticks": "", "outlinewidth": 0 } } } ], "histogram2dcontour": [ { "type": "histogram2dcontour", "colorbar": { "ticks": "", "outlinewidth": 0 }, "colorscale": [ [ 0.0, "#0d0887" ], [ 0.1111111111111111, "#46039f" ], [ 0.2222222222222222, "#7201a8" ], [ 0.3333333333333333, "#9c179e" ], [ 0.4444444444444444, "#bd3786" ], [ 0.5555555555555556, "#d8576b" ], [ 0.6666666666666666, "#ed7953" ], [ 0.7777777777777778, "#fb9f3a" ], [ 0.8888888888888888, "#fdca26" ], [ 1.0, "#f0f921" ] ] } ] }, "layout": { "geo": { "bgcolor": "white", "showland": true, "lakecolor": "white", "landcolor": "#E5ECF6", "showlakes": true, "subunitcolor": "white" }, "font": { "color": "#2a3f5f" }, "polar": { "bgcolor": "#E5ECF6", "radialaxis": { "ticks": "", "gridcolor": "white", "linecolor": "white" }, "angularaxis": { "ticks": "", "gridcolor": "white", "linecolor": "white" } }, "scene": { "xaxis": { "ticks": "", "gridcolor": "white", "gridwidth": 2, "linecolor": "white", "zerolinecolor": "white", "showbackground": true, "backgroundcolor": "#E5ECF6" }, "yaxis": { "ticks": "", "gridcolor": "white", "gridwidth": 2, "linecolor": "white", "zerolinecolor": "white", "showbackground": true, "backgroundcolor": "#E5ECF6" }, "zaxis": { "ticks": "", "gridcolor": "white", "gridwidth": 2, "linecolor": "white", "zerolinecolor": "white", "showbackground": true, "backgroundcolor": "#E5ECF6" } }, "title": { "x": 0.05 }, "xaxis": { "ticks": "", "title": { "standoff": 15 }, "gridcolor": "white", "linecolor": "white", "automargin": true, "zerolinecolor": "white", "zerolinewidth": 2 }, "yaxis": { "ticks": "", "title": { "standoff": 15 }, "gridcolor": "white", "linecolor": "white", "automargin": true, "zerolinecolor": "white", "zerolinewidth": 2 }, "mapbox": { "style": "light" }, "ternary": { "aaxis": { "ticks": "", "gridcolor": "white", "linecolor": "white" }, "baxis": { "ticks": "", "gridcolor": "white", "linecolor": "white" }, "caxis": { "ticks": "", "gridcolor": "white", "linecolor": "white" }, "bgcolor": "#E5ECF6" }, "colorway": [ "#636efa", "#EF553B", "#00cc96", "#ab63fa", "#FFA15A", "#19d3f3", "#FF6692", "#B6E880", "#FF97FF", "#FECB52" ], "coloraxis": { "colorbar": { "ticks": "", "outlinewidth": 0 } }, "hovermode": "closest", "colorscale": { "diverging": [ [ 0, "#8e0152" ], [ 0.1, "#c51b7d" ], [ 0.2, "#de77ae" ], [ 0.3, "#f1b6da" ], [ 0.4, "#fde0ef" ], [ 0.5, "#f7f7f7" ], [ 0.6, "#e6f5d0" ], [ 0.7, "#b8e186" ], [ 0.8, "#7fbc41" ], [ 0.9, "#4d9221" ], [ 1, "#276419" ] ], "sequential": [ [ 0.0, "#0d0887" ], [ 0.1111111111111111, "#46039f" ], [ 0.2222222222222222, "#7201a8" ], [ 0.3333333333333333, "#9c179e" ], [ 0.4444444444444444, "#bd3786" ], [ 0.5555555555555556, "#d8576b" ], [ 0.6666666666666666, "#ed7953" ], [ 0.7777777777777778, "#fb9f3a" ], [ 0.8888888888888888, "#fdca26" ], [ 1.0, "#f0f921" ] ], "sequentialminus": [ [ 0.0, "#0d0887" ], [ 0.1111111111111111, "#46039f" ], [ 0.2222222222222222, "#7201a8" ], [ 0.3333333333333333, "#9c179e" ], [ 0.4444444444444444, "#bd3786" ], [ 0.5555555555555556, "#d8576b" ], [ 0.6666666666666666, "#ed7953" ], [ 0.7777777777777778, "#fb9f3a" ], [ 0.8888888888888888, "#fdca26" ], [ 1.0, "#f0f921" ] ] }, "hoverlabel": { "align": "left" }, "plot_bgcolor": "#E5ECF6", "paper_bgcolor": "white", "shapedefaults": { "line": { "color": "#2a3f5f" } }, "autotypenumbers": "strict", "annotationdefaults": { "arrowhead": 0, "arrowcolor": "#2a3f5f", "arrowwidth": 1 } } } } }, "height": null, "width": null, "user": { "profile_url": "https://chart-studio.plotly.com/~opencv.korea", "avatar_url": "https://storage.googleapis.com/plotly-prod-profiles/GPDKQ7OAFE318I3TRAFP4MVAXP7TZP.jpg", "background_url": "https://storage.googleapis.com/plotly-prod-profiles/bg-6.jpg", "bio": "", "nickname": "", "website": "", "stream_tokens": null, "feature_set_id": null, "csrf_token": null, "date_joined": "2022-03-16 13:01:08", "mapbox_access_tokens": null, "has_password": null, "username": "opencv.korea", "email": null, "is_active": null, "readonly": null, "is_dash_creator": null, "dash_created_count": null, "is_chart_creator": null, "charts_created_count": null } }, { "creation_time": "2025-09-10T09:57:27.919642Z", "comments": { "results": [], "count": 0 }, "parented": true, "embed_url": "https://chart-studio.plotly.com/~Jana.Wae/3.embed", "fid": "Jana.Wae:3", "filename": "Vbesserung der Diabetiker mit und ohne DR", "filetype": "plot", "img_url": "https://storage.googleapis.com/plotly-prod-images/Jana.Wae/3/9_UAP7G33HZGSTUHPYC06S4FSDRFFF3N.png", "image_urls": { "default": "https://storage.googleapis.com/plotly-prod-images/Jana.Wae/3/2_7VOW1H5PWPBYP7FBSU8MMJK8HRDDVO.png", "block-thumb": "https://storage.googleapis.com/plotly-prod-images/Jana.Wae/3/8_E9MP83WO9VK5FKLNUSM6CQ2K75AXAY.png", "list-thumb": "https://storage.googleapis.com/plotly-prod-images/Jana.Wae/3/9_UAP7G33HZGSTUHPYC06S4FSDRFFF3N.png" }, "api_urls": { "files": "https://api.plotly.com/v2/files/Jana.Wae:3", "plots": "https://api.plotly.com/v2/plots/Jana.Wae:3", "parent": "https://api.plotly.com/v2/folders/home?user=Jana.Wae" }, "owner": "Jana.Wae", "parent": -1, "preview": "", "referencers": [], "references": [], "title": "", "views": 1, "web_url": "https://chart-studio.plotly.com/~Jana.Wae/3/", "world_readable": true, "date_modified": "2025-09-10T12:01:23.719Z", "stars": { "results": [], "count": 0 }, "collaborators": { "results": [], "count": 0 }, "subfolder_count": null, "refresh_interval": null, "organize_view_url": "https://chart-studio.plotly.com/~Jana.Wae/3/", "current_user_permission": "read", "is_theme": null, "is_template": false, "autosize": true, "caption": "", "figure": { "data": [ { "meta": { "columnNames": { "y": "A" } }, "mode": "markers", "name": "ΔVe -> b der Diabetiker mit DR", "type": "box", "ysrc": "Jana.Wae:2:e773f6", "jitter": 0.31, "boxmean": true, "boxpoints": "all", "whiskerwidth": 0.41 }, { "meta": { "columnNames": { "y": "B" } }, "name": "ΔVe -> b der Diabetiker ohne DR", "type": "box", "ysrc": "Jana.Wae:2:c4c682", "jitter": 0.31, "boxmean": true, "boxpoints": "all" } ], "frames": [], "layout": { "xaxis": { "type": "category", "range": [ -0.5093457943925234, 1.5 ], "autorange": true }, "yaxis": { "type": "linear", "range": [ -2.4771744349444447, 1.0251144439444444 ], "title": { "text": "Visusbesserung in LogMar" }, "autorange": true }, "boxgap": 0.42000000000000004, "autosize": true, "template": { "data": { "bar": [ { "type": "bar", "marker": { "colorbar": { "ticks": "", "outlinewidth": 0 } } } ], "table": [ { "type": "table", "cells": { "fill": { "color": "#EBF0F8" }, "line": { "color": "white" } }, "header": { "fill": { "color": "#C8D4E3" }, "line": { "color": "white" } } } ], "carpet": [ { "type": "carpet", "aaxis": { "gridcolor": "#C8D4E3", "linecolor": "#C8D4E3", "endlinecolor": "#2a3f5f", "minorgridcolor": "#C8D4E3", "startlinecolor": "#2a3f5f" }, "baxis": { "gridcolor": "#C8D4E3", "linecolor": "#C8D4E3", "endlinecolor": "#2a3f5f", "minorgridcolor": "#C8D4E3", "startlinecolor": "#2a3f5f" } } ], "mesh3d": [ { "type": "mesh3d", "colorbar": { "ticks": "", "outlinewidth": 0 } } ], "contour": [ { "type": "contour", "colorbar": { "ticks": "", "outlinewidth": 0 }, "autocolorscale": true } ], "heatmap": [ { "type": "heatmap", "colorbar": { "ticks": "", "outlinewidth": 0 }, "autocolorscale": true } ], "scatter": [ { "type": "scatter", "marker": { "colorbar": { "ticks": "", "outlinewidth": 0 } } } ], "surface": [ { "type": "surface", "colorbar": { "ticks": "", "outlinewidth": 0 } } ], "heatmapgl": [ { "type": "heatmapgl", "colorbar": { "ticks": "", "outlinewidth": 0 } } ], "histogram": [ { "type": "histogram", "marker": { "colorbar": { "ticks": "", "outlinewidth": 0 } } } ], "parcoords": [ { "line": { "colorbar": { "ticks": "", "outlinewidth": 0 } }, "type": "parcoords" } ], "scatter3d": [ { "type": "scatter3d", "marker": { "colorbar": { "ticks": "", "outlinewidth": 0 } } } ], "scattergl": [ { "type": "scattergl", "marker": { "colorbar": { "ticks": "", "outlinewidth": 0 } } } ], "choropleth": [ { "type": "choropleth", "colorbar": { "ticks": "", "outlinewidth": 0 } } ], "scattergeo": [ { "type": "scattergeo", "marker": { "colorbar": { "ticks": "", "outlinewidth": 0 } } } ], "histogram2d": [ { "type": "histogram2d", "colorbar": { "ticks": "", "outlinewidth": 0 }, "autocolorscale": true } ], "scatterpolar": [ { "type": "scatterpolar", "marker": { "colorbar": { "ticks": "", "outlinewidth": 0 } } } ], "contourcarpet": [ { "type": "contourcarpet", "colorbar": { "ticks": "", "outlinewidth": 0 } } ], "scattercarpet": [ { "type": "scattercarpet", "marker": { "colorbar": { "ticks": "", "outlinewidth": 0 } } } ], "scattermapbox": [ { "type": "scattermapbox", "marker": { "colorbar": { "ticks": "", "outlinewidth": 0 } } } ], "scatterpolargl": [ { "type": "scatterpolargl", "marker": { "colorbar": { "ticks": "", "outlinewidth": 0 } } } ], "scatterternary": [ { "type": "scatterternary", "marker": { "colorbar": { "ticks": "", "outlinewidth": 0 } } } ], "histogram2dcontour": [ { "type": "histogram2dcontour", "colorbar": { "ticks": "", "outlinewidth": 0 }, "autocolorscale": true } ] }, "layout": { "geo": { "bgcolor": "white", "showland": true, "lakecolor": "white", "landcolor": "white", "showlakes": true, "subunitcolor": "#C8D4E3" }, "font": { "color": "#2a3f5f" }, "polar": { "bgcolor": "white", "radialaxis": { "ticks": "", "gridcolor": "#EBF0F8", "linecolor": "#EBF0F8" }, "angularaxis": { "ticks": "", "gridcolor": "#EBF0F8", "linecolor": "#EBF0F8" } }, "scene": { "xaxis": { "ticks": "", "gridcolor": "#DFE8F3", "gridwidth": 2, "linecolor": "#EBF0F8", "zerolinecolor": "#EBF0F8", "showbackground": true, "backgroundcolor": "white" }, "yaxis": { "ticks": "", "gridcolor": "#DFE8F3", "gridwidth": 2, "linecolor": "#EBF0F8", "zerolinecolor": "#EBF0F8", "showbackground": true, "backgroundcolor": "white" }, "zaxis": { "ticks": "", "gridcolor": "#DFE8F3", "gridwidth": 2, "linecolor": "#EBF0F8", "zerolinecolor": "#EBF0F8", "showbackground": true, "backgroundcolor": "white" } }, "title": { "x": 0.05 }, "xaxis": { "ticks": "", "gridcolor": "#EBF0F8", "linecolor": "#EBF0F8", "automargin": true, "zerolinecolor": "#EBF0F8", "zerolinewidth": 2 }, "yaxis": { "ticks": "", "gridcolor": "#EBF0F8", "linecolor": "#EBF0F8", "automargin": true, "zerolinecolor": "#EBF0F8", "zerolinewidth": 2 }, "ternary": { "aaxis": { "ticks": "", "gridcolor": "#DFE8F3", "linecolor": "#A2B1C6" }, "baxis": { "ticks": "", "gridcolor": "#DFE8F3", "linecolor": "#A2B1C6" }, "caxis": { "ticks": "", "gridcolor": "#DFE8F3", "linecolor": "#A2B1C6" }, "bgcolor": "white" }, "colorway": [ "#636efa", "#EF553B", "#00cc96", "#ab63fa", "#19d3f3", "#e763fa", "#fecb52", "#ffa15a", "#ff6692", "#b6e880" ], "hovermode": "closest", "colorscale": { "diverging": [ [ 0, "#8e0152" ], [ 0.1, "#c51b7d" ], [ 0.2, "#de77ae" ], [ 0.3, "#f1b6da" ], [ 0.4, "#fde0ef" ], [ 0.5, "#f7f7f7" ], [ 0.6, "#e6f5d0" ], [ 0.7, "#b8e186" ], [ 0.8, "#7fbc41" ], [ 0.9, "#4d9221" ], [ 1, "#276419" ] ], "sequential": [ [ 0, "#0508b8" ], [ 0.0893854748603352, "#1910d8" ], [ 0.1787709497206704, "#3c19f0" ], [ 0.2681564245810056, "#6b1cfb" ], [ 0.3575418994413408, "#981cfd" ], [ 0.44692737430167595, "#bf1cfd" ], [ 0.5363128491620112, "#dd2bfd" ], [ 0.6256983240223464, "#f246fe" ], [ 0.7150837988826816, "#fc67fd" ], [ 0.8044692737430168, "#fe88fc" ], [ 0.8938547486033519, "#fea5fd" ], [ 0.9832402234636871, "#febefe" ], [ 1, "#fec3fe" ] ], "sequentialminus": [ [ 0, "#0508b8" ], [ 0.0893854748603352, "#1910d8" ], [ 0.1787709497206704, "#3c19f0" ], [ 0.2681564245810056, "#6b1cfb" ], [ 0.3575418994413408, "#981cfd" ], [ 0.44692737430167595, "#bf1cfd" ], [ 0.5363128491620112, "#dd2bfd" ], [ 0.6256983240223464, "#f246fe" ], [ 0.7150837988826816, "#fc67fd" ], [ 0.8044692737430168, "#fe88fc" ], [ 0.8938547486033519, "#fea5fd" ], [ 0.9832402234636871, "#febefe" ], [ 1, "#fec3fe" ] ] }, "plot_bgcolor": "white", "paper_bgcolor": "white", "shapedefaults": { "line": { "width": 0 }, "opacity": 0.4, "fillcolor": "#506784" }, "annotationdefaults": { "arrowhead": 0, "arrowcolor": "#506784", "arrowwidth": 1 } }, "themeRef": "PLOTLY_WHITE" }, "boxgroupgap": 0.33 } }, "height": null, "width": null, "user": { "profile_url": "https://chart-studio.plotly.com/~Jana.Wae", "avatar_url": "https://storage.googleapis.com/plotly-prod-profiles/38.jpg", "background_url": "https://storage.googleapis.com/plotly-prod-profiles/bg-5.jpg", "bio": "", "nickname": "", "website": "", "stream_tokens": null, "feature_set_id": null, "csrf_token": null, "date_joined": "2025-09-10 09:44:35", "mapbox_access_tokens": null, "has_password": null, "username": "Jana.Wae", "email": null, "is_active": null, "readonly": null, "is_dash_creator": null, "dash_created_count": null, "is_chart_creator": null, "charts_created_count": null } }, { "creation_time": "2025-09-10T09:47:43.226185Z", "comments": { "results": [], "count": 0 }, "parented": true, "embed_url": "https://chart-studio.plotly.com/~Jana.Wae/1.embed", "fid": "Jana.Wae:1", "filename": "Ve der Diabetiker mit und ohne DR", "filetype": "plot", "img_url": "https://storage.googleapis.com/plotly-prod-images/Jana.Wae/1/9_XO2CM3EF7BSHEBCAUGLFJAW21W7EPK.png", "image_urls": { "default": "https://storage.googleapis.com/plotly-prod-images/Jana.Wae/1/2_PQAWPNVSPNG12UC4WWBODOMA48IJI7.png", "block-thumb": "https://storage.googleapis.com/plotly-prod-images/Jana.Wae/1/8_Q7SVG44J40VXACJP86HNOW79H02D7C.png", "list-thumb": "https://storage.googleapis.com/plotly-prod-images/Jana.Wae/1/9_XO2CM3EF7BSHEBCAUGLFJAW21W7EPK.png" }, "api_urls": { "files": "https://api.plotly.com/v2/files/Jana.Wae:1", "plots": "https://api.plotly.com/v2/plots/Jana.Wae:1", "parent": "https://api.plotly.com/v2/folders/home?user=Jana.Wae" }, "owner": "Jana.Wae", "parent": -1, "preview": "", "referencers": [], "references": [], "title": "", "views": 1, "web_url": "https://chart-studio.plotly.com/~Jana.Wae/1/", "world_readable": true, "date_modified": "2025-09-10T09:52:24.258Z", "stars": { "results": [], "count": 0 }, "collaborators": { "results": [], "count": 0 }, "subfolder_count": null, "refresh_interval": null, "organize_view_url": "https://chart-studio.plotly.com/~Jana.Wae/1/", "current_user_permission": "read", "is_theme": null, "is_template": false, "autosize": true, "caption": "", "figure": { "data": [ { "meta": { "columnNames": { "x": "", "y": "V1 LogMar (mit DR)" } }, "mode": "markers", "name": "V<sub>E</sub> der Diabetiker mit DR", "type": "box", "ysrc": "Jana.Wae:0:36fe52", "jitter": 0.31, "marker": { "symbol": "circle" }, "boxmean": true, "hoveron": "boxes+points", "notched": false, "boxpoints": "all", "hoverinfo": "x+y+name", "showlegend": true, "orientation": "v", "whiskerwidth": 0.41 }, { "meta": { "columnNames": { "y": "V1 LogMar (ohne DR)" } }, "name": "V<sub>E </sub>der Diabetiker ohne DR", "type": "box", "ysrc": "Jana.Wae:0:5b9849", "jitter": 0.31, "boxmean": true, "boxpoints": "all", "whiskerwidth": 0.41 } ], "frames": [], "layout": { "xaxis": { "type": "category", "range": [ -0.5088757396449705, 1.5 ], "autorange": true }, "yaxis": { "type": "linear", "range": [ -0.15, 2.85 ], "title": { "text": "Visus in LogMar" }, "autorange": true }, "boxgap": 0.42000000000000004, "boxmode": "overlay", "autosize": true, "template": { "data": { "bar": [ { "type": "bar", "marker": { "colorbar": { "ticks": "", "outlinewidth": 0 } } } ], "table": [ { "type": "table", "cells": { "fill": { "color": "#EBF0F8" }, "line": { "color": "white" } }, "header": { "fill": { "color": "#C8D4E3" }, "line": { "color": "white" } } } ], "carpet": [ { "type": "carpet", "aaxis": { "gridcolor": "#C8D4E3", "linecolor": "#C8D4E3", "endlinecolor": "#2a3f5f", "minorgridcolor": "#C8D4E3", "startlinecolor": "#2a3f5f" }, "baxis": { "gridcolor": "#C8D4E3", "linecolor": "#C8D4E3", "endlinecolor": "#2a3f5f", "minorgridcolor": "#C8D4E3", "startlinecolor": "#2a3f5f" } } ], "mesh3d": [ { "type": "mesh3d", "colorbar": { "ticks": "", "outlinewidth": 0 } } ], "contour": [ { "type": "contour", "colorbar": { "ticks": "", "outlinewidth": 0 }, "autocolorscale": true } ], "heatmap": [ { "type": "heatmap", "colorbar": { "ticks": "", "outlinewidth": 0 }, "autocolorscale": true } ], "scatter": [ { "type": "scatter", "marker": { "colorbar": { "ticks": "", "outlinewidth": 0 } } } ], "surface": [ { "type": "surface", "colorbar": { "ticks": "", "outlinewidth": 0 } } ], "heatmapgl": [ { "type": "heatmapgl", "colorbar": { "ticks": "", "outlinewidth": 0 } } ], "histogram": [ { "type": "histogram", "marker": { "colorbar": { "ticks": "", "outlinewidth": 0 } } } ], "parcoords": [ { "line": { "colorbar": { "ticks": "", "outlinewidth": 0 } }, "type": "parcoords" } ], "scatter3d": [ { "type": "scatter3d", "marker": { "colorbar": { "ticks": "", "outlinewidth": 0 } } } ], "scattergl": [ { "type": "scattergl", "marker": { "colorbar": { "ticks": "", "outlinewidth": 0 } } } ], "choropleth": [ { "type": "choropleth", "colorbar": { "ticks": "", "outlinewidth": 0 } } ], "scattergeo": [ { "type": "scattergeo", "marker": { "colorbar": { "ticks": "", "outlinewidth": 0 } } } ], "histogram2d": [ { "type": "histogram2d", "colorbar": { "ticks": "", "outlinewidth": 0 }, "autocolorscale": true } ], "scatterpolar": [ { "type": "scatterpolar", "marker": { "colorbar": { "ticks": "", "outlinewidth": 0 } } } ], "contourcarpet": [ { "type": "contourcarpet", "colorbar": { "ticks": "", "outlinewidth": 0 } } ], "scattercarpet": [ { "type": "scattercarpet", "marker": { "colorbar": { "ticks": "", "outlinewidth": 0 } } } ], "scattermapbox": [ { "type": "scattermapbox", "marker": { "colorbar": { "ticks": "", "outlinewidth": 0 } } } ], "scatterpolargl": [ { "type": "scatterpolargl", "marker": { "colorbar": { "ticks": "", "outlinewidth": 0 } } } ], "scatterternary": [ { "type": "scatterternary", "marker": { "colorbar": { "ticks": "", "outlinewidth": 0 } } } ], "histogram2dcontour": [ { "type": "histogram2dcontour", "colorbar": { "ticks": "", "outlinewidth": 0 }, "autocolorscale": true } ] }, "layout": { "geo": { "bgcolor": "white", "showland": true, "lakecolor": "white", "landcolor": "white", "showlakes": true, "subunitcolor": "#C8D4E3" }, "font": { "color": "#2a3f5f" }, "polar": { "bgcolor": "white", "radialaxis": { "ticks": "", "gridcolor": "#EBF0F8", "linecolor": "#EBF0F8" }, "angularaxis": { "ticks": "", "gridcolor": "#EBF0F8", "linecolor": "#EBF0F8" } }, "scene": { "xaxis": { "ticks": "", "gridcolor": "#DFE8F3", "gridwidth": 2, "linecolor": "#EBF0F8", "zerolinecolor": "#EBF0F8", "showbackground": true, "backgroundcolor": "white" }, "yaxis": { "ticks": "", "gridcolor": "#DFE8F3", "gridwidth": 2, "linecolor": "#EBF0F8", "zerolinecolor": "#EBF0F8", "showbackground": true, "backgroundcolor": "white" }, "zaxis": { "ticks": "", "gridcolor": "#DFE8F3", "gridwidth": 2, "linecolor": "#EBF0F8", "zerolinecolor": "#EBF0F8", "showbackground": true, "backgroundcolor": "white" } }, "title": { "x": 0.05 }, "xaxis": { "ticks": "", "gridcolor": "#EBF0F8", "linecolor": "#EBF0F8", "automargin": true, "zerolinecolor": "#EBF0F8", "zerolinewidth": 2 }, "yaxis": { "ticks": "", "gridcolor": "#EBF0F8", "linecolor": "#EBF0F8", "automargin": true, "zerolinecolor": "#EBF0F8", "zerolinewidth": 2 }, "ternary": { "aaxis": { "ticks": "", "gridcolor": "#DFE8F3", "linecolor": "#A2B1C6" }, "baxis": { "ticks": "", "gridcolor": "#DFE8F3", "linecolor": "#A2B1C6" }, "caxis": { "ticks": "", "gridcolor": "#DFE8F3", "linecolor": "#A2B1C6" }, "bgcolor": "white" }, "colorway": [ "#636efa", "#EF553B", "#00cc96", "#ab63fa", "#19d3f3", "#e763fa", "#fecb52", "#ffa15a", "#ff6692", "#b6e880" ], "hovermode": "closest", "colorscale": { "diverging": [ [ 0, "#8e0152" ], [ 0.1, "#c51b7d" ], [ 0.2, "#de77ae" ], [ 0.3, "#f1b6da" ], [ 0.4, "#fde0ef" ], [ 0.5, "#f7f7f7" ], [ 0.6, "#e6f5d0" ], [ 0.7, "#b8e186" ], [ 0.8, "#7fbc41" ], [ 0.9, "#4d9221" ], [ 1, "#276419" ] ], "sequential": [ [ 0, "#0508b8" ], [ 0.0893854748603352, "#1910d8" ], [ 0.1787709497206704, "#3c19f0" ], [ 0.2681564245810056, "#6b1cfb" ], [ 0.3575418994413408, "#981cfd" ], [ 0.44692737430167595, "#bf1cfd" ], [ 0.5363128491620112, "#dd2bfd" ], [ 0.6256983240223464, "#f246fe" ], [ 0.7150837988826816, "#fc67fd" ], [ 0.8044692737430168, "#fe88fc" ], [ 0.8938547486033519, "#fea5fd" ], [ 0.9832402234636871, "#febefe" ], [ 1, "#fec3fe" ] ], "sequentialminus": [ [ 0, "#0508b8" ], [ 0.0893854748603352, "#1910d8" ], [ 0.1787709497206704, "#3c19f0" ], [ 0.2681564245810056, "#6b1cfb" ], [ 0.3575418994413408, "#981cfd" ], [ 0.44692737430167595, "#bf1cfd" ], [ 0.5363128491620112, "#dd2bfd" ], [ 0.6256983240223464, "#f246fe" ], [ 0.7150837988826816, "#fc67fd" ], [ 0.8044692737430168, "#fe88fc" ], [ 0.8938547486033519, "#fea5fd" ], [ 0.9832402234636871, "#febefe" ], [ 1, "#fec3fe" ] ] }, "plot_bgcolor": "white", "paper_bgcolor": "white", "shapedefaults": { "line": { "width": 0 }, "opacity": 0.4, "fillcolor": "#506784" }, "annotationdefaults": { "arrowhead": 0, "arrowcolor": "#506784", "arrowwidth": 1 } }, "themeRef": "PLOTLY_WHITE" }, "boxgroupgap": 0.33 } }, "height": null, "width": null, "user": { "profile_url": "https://chart-studio.plotly.com/~Jana.Wae", "avatar_url": "https://storage.googleapis.com/plotly-prod-profiles/38.jpg", "background_url": "https://storage.googleapis.com/plotly-prod-profiles/bg-5.jpg", "bio": "", "nickname": "", "website": "", "stream_tokens": null, "feature_set_id": null, "csrf_token": null, "date_joined": "2025-09-10 09:44:35", "mapbox_access_tokens": null, "has_password": null, "username": "Jana.Wae", "email": null, "is_active": null, "readonly": null, "is_dash_creator": null, "dash_created_count": null, "is_chart_creator": null, "charts_created_count": null } }, { "creation_time": "2025-09-10T08:43:20.800157Z", "comments": { "results": [], "count": 0 }, "parented": true, "embed_url": "https://chart-studio.plotly.com/~apicM/1.embed", "fid": "apicM:1", "filename": "Plot", "filetype": "plot", "img_url": "https://storage.googleapis.com/plotly-prod-images/apicM/1/9_9JVLG1MIAHUG5KK3XDFN775NA14KCZ.png", "image_urls": { "default": "https://storage.googleapis.com/plotly-prod-images/apicM/1/2_3SXXJ9NXUXVF0P2WNYT9DZCGC866IJ.png", "block-thumb": "https://storage.googleapis.com/plotly-prod-images/apicM/1/8_55JQEAKOLYZ9US9JGBL5966VMBXU4Q.png", "list-thumb": "https://storage.googleapis.com/plotly-prod-images/apicM/1/9_9JVLG1MIAHUG5KK3XDFN775NA14KCZ.png" }, "api_urls": { "files": "https://api.plotly.com/v2/files/apicM:1", "plots": "https://api.plotly.com/v2/plots/apicM:1", "parent": "https://api.plotly.com/v2/folders/home?user=apicM" }, "owner": "apicM", "parent": -1, "preview": "", "referencers": [], "references": [], "title": "", "views": 1, "web_url": "https://chart-studio.plotly.com/~apicM/1/", "world_readable": true, "date_modified": "2025-09-10T08:43:20.814Z", "stars": { "results": [], "count": 0 }, "collaborators": { "results": [], "count": 0 }, "subfolder_count": null, "refresh_interval": null, "organize_view_url": "https://chart-studio.plotly.com/~apicM/1/", "current_user_permission": "read", "is_theme": null, "is_template": false, "autosize": true, "caption": "", "figure": { "data": [ { "meta": { "columnNames": { "labels": "A", "values": "B" } }, "mode": "markers", "type": "pie", "labelssrc": "apicM:0:e42719", "valuessrc": "apicM:0:dcfdbc" } ], "frames": [], "layout": { "xaxis": { "range": [ -1, 6 ], "autorange": true }, "yaxis": { "range": [ -1, 4 ], "autorange": true }, "autosize": true, "colorway": [ "#b3e2cd", "#fdcdac", "#cbd5e8", "#f4cae4", "#e6f5c9", "#fff2ae", "#f1e2cc", "#cccccc" ], "colorscale": { "sequential": [ [ 0, "#dcdcdc" ], [ 0.3333333333333333, "#f5c39d" ], [ 0.6666666666666666, "#f5a069" ], [ 1, "#b20a1c" ] ] } } }, "height": null, "width": null, "user": { "profile_url": "https://chart-studio.plotly.com/~apicM", "avatar_url": "https://storage.googleapis.com/plotly-prod-profiles/7.jpg", "background_url": "https://storage.googleapis.com/plotly-prod-profiles/bg-7.jpg", "bio": "", "nickname": "", "website": "", "stream_tokens": null, "feature_set_id": null, "csrf_token": null, "date_joined": "2025-09-10 08:39:57", "mapbox_access_tokens": null, "has_password": null, "username": "apicM", "email": null, "is_active": null, "readonly": null, "is_dash_creator": null, "dash_created_count": null, "is_chart_creator": null, "charts_created_count": null } }, { "creation_time": "2025-09-10T08:36:13.187737Z", "comments": { "results": [], "count": 0 }, "parented": true, "embed_url": "https://chart-studio.plotly.com/~swagata21/2.embed", "fid": "swagata21:2", "filename": "Plot 2", "filetype": "plot", "img_url": "https://storage.googleapis.com/plotly-prod-images/swagata21/2/9_LH7VHKORTP8T2QLABZ8GP6PBOTA9QJ.png", "image_urls": { "default": "https://storage.googleapis.com/plotly-prod-images/swagata21/2/2_2RMNOMPS266WIPPIHCO6YB204A3XRY.png", "block-thumb": "https://storage.googleapis.com/plotly-prod-images/swagata21/2/8_HDB6P9CGONBBVUBQVGNNZVDZ1SC0YU.png", "list-thumb": "https://storage.googleapis.com/plotly-prod-images/swagata21/2/9_LH7VHKORTP8T2QLABZ8GP6PBOTA9QJ.png" }, "api_urls": { "files": "https://api.plotly.com/v2/files/swagata21:2", "plots": "https://api.plotly.com/v2/plots/swagata21:2", "parent": "https://api.plotly.com/v2/folders/home?user=swagata21" }, "owner": "swagata21", "parent": -1, "preview": "", "referencers": [], "references": [], "title": "", "views": 1, "web_url": "https://chart-studio.plotly.com/~swagata21/2/", "world_readable": true, "date_modified": "2025-09-11T16:58:55.007Z", "stars": { "results": [], "count": 0 }, "collaborators": { "results": [], "count": 0 }, "subfolder_count": null, "refresh_interval": null, "organize_view_url": "https://chart-studio.plotly.com/~swagata21/2/", "current_user_permission": "read", "is_theme": null, "is_template": false, "autosize": true, "caption": "", "figure": { "data": [ { "line": { "width": 3 }, "meta": { "columnNames": { "x": "Month", "y": "2024(H)", "text": "2024(H)" } }, "mode": "markers+lines+text", "name": "2024(H)", "type": "scatter", "xsrc": "swagata21:1:463148", "ysrc": "swagata21:1:d44562", "marker": { "line": { "color": "rgb(99, 110, 250)", "width": 6 }, "size": 10, "symbol": "circle", "opacity": 1 }, "textsrc": "swagata21:1:d44562", "hoverinfo": "x", "hoverlabel": { "align": "right", "namelength": 15 }, "textposition": "top left" }, { "line": { "width": 3 }, "meta": { "columnNames": { "x": "Month", "y": "2025(H)", "text": "2025(H)" } }, "mode": "markers+lines+text", "name": "2025(H)", "type": "scatter", "xsrc": "swagata21:1:463148", "ysrc": "swagata21:1:309828", "marker": { "line": { "color": "rgb(239, 85, 59)", "width": 10 } }, "textsrc": "swagata21:1:309828", "stackgroup": null, "textposition": "top right" }, { "line": { "dash": "dot", "width": 3 }, "meta": { "columnNames": { "x": "Month", "y": "2025(F)", "text": "2025(F)" } }, "mode": "markers+lines+text", "name": "2025(F)", "type": "scatter", "xsrc": "swagata21:1:463148", "ysrc": "swagata21:1:2bb250", "marker": { "line": { "width": 10 }, "size": 10, "color": "rgb(239, 85, 59)" }, "textsrc": "swagata21:1:2bb250", "stackgroup": null }, { "line": { "dash": "dot", "color": "rgb(30, 116, 74)", "width": 3 }, "meta": { "columnNames": { "x": "Month", "y": "2026(F)", "text": "2026(F)" } }, "mode": "markers+lines+text", "name": "2026(F)", "type": "scatter", "xsrc": "swagata21:1:463148", "ysrc": "swagata21:1:1a7445", "textsrc": "swagata21:1:1a7445", "stackgroup": null }, { "meta": { "columnNames": { "x": "Month", "y": "MCA" } }, "mode": "markers", "name": "MCA", "type": "bar", "xsrc": "swagata21:4:5821b6", "ysrc": "swagata21:4:0ae13b", "yaxis": "y2", "marker": { "opacity": 0.5 }, "stackgroup": null, "orientation": "v", "textposition": "inside" }, { "meta": { "columnNames": { "x": "Month", "y": "MCE GmbH" } }, "name": "MCE GmbH", "type": "bar", "xsrc": "swagata21:4:5821b6", "ysrc": "swagata21:4:77e584", "yaxis": "y2", "marker": { "color": "rgb(99, 250, 144)", "opacity": 0.5 }, "opacity": 1, "orientation": "v" }, { "meta": { "columnNames": { "x": "Month", "y": "MCE GmbH" } }, "name": "Mitsubishi Chemical Group", "type": "bar", "xsrc": "swagata21:4:5821b6", "ysrc": "swagata21:4:77e584", "yaxis": "y2", "marker": { "opacity": 0.5 }, "opacity": 1, "orientation": "v" } ], "frames": [], "layout": { "font": { "family": "Roboto" }, "xaxis": { "type": "category", "range": [ -0.6771571848521529, 11.677157184852152 ], "title": { "font": { "size": 12 }, "text": "Month" }, "showline": false, "autorange": true, "linewidth": 1 }, "yaxis": { "type": "linear", "range": [ 23271908153.88535, 65592478806.11465 ], "title": { "text": "Cost" }, "showgrid": true, "showline": false, "tickmode": "auto", "zeroline": true, "autorange": true, "gridwidth": 0, "ticksuffix": "$", "zerolinewidth": 0, "exponentformat": "B" }, "bargap": 0.6, "legend": { "x": 0.5, "y": -0.23762639373856256, "xanchor": "center", "yanchor": "middle", "itemsizing": "trace", "orientation": "h" }, "yaxis2": { "side": "right", "type": "linear", "range": [ 0, 100.00000000000001 ], "title": { "text": "PERCENTAGE" }, "showgrid": true, "autorange": true, "overlaying": "y", "ticksuffix": "%" }, "barmode": "stack", "barnorm": "percent", "autosize": true, "template": { "data": { "bar": [ { "type": "bar", "marker": { "colorbar": { "ticks": "", "outlinewidth": 0 } } } ], "table": [ { "type": "table", "cells": { "fill": { "color": "#EBF0F8" }, "line": { "color": "white" } }, "header": { "fill": { "color": "#C8D4E3" }, "line": { "color": "white" } } } ], "carpet": [ { "type": "carpet", "aaxis": { "gridcolor": "#C8D4E3", "linecolor": "#C8D4E3", "endlinecolor": "#2a3f5f", "minorgridcolor": "#C8D4E3", "startlinecolor": "#2a3f5f" }, "baxis": { "gridcolor": "#C8D4E3", "linecolor": "#C8D4E3", "endlinecolor": "#2a3f5f", "minorgridcolor": "#C8D4E3", "startlinecolor": "#2a3f5f" } } ], "mesh3d": [ { "type": "mesh3d", "colorbar": { "ticks": "", "outlinewidth": 0 } } ], "contour": [ { "type": "contour", "colorbar": { "ticks": "", "outlinewidth": 0 }, "autocolorscale": true } ], "heatmap": [ { "type": "heatmap", "colorbar": { "ticks": "", "outlinewidth": 0 }, "autocolorscale": true } ], "scatter": [ { "type": "scatter", "marker": { "colorbar": { "ticks": "", "outlinewidth": 0 } } } ], "surface": [ { "type": "surface", "colorbar": { "ticks": "", "outlinewidth": 0 } } ], "heatmapgl": [ { "type": "heatmapgl", "colorbar": { "ticks": "", "outlinewidth": 0 } } ], "histogram": [ { "type": "histogram", "marker": { "colorbar": { "ticks": "", "outlinewidth": 0 } } } ], "parcoords": [ { "line": { "colorbar": { "ticks": "", "outlinewidth": 0 } }, "type": "parcoords" } ], "scatter3d": [ { "type": "scatter3d", "marker": { "colorbar": { "ticks": "", "outlinewidth": 0 } } } ], "scattergl": [ { "type": "scattergl", "marker": { "colorbar": { "ticks": "", "outlinewidth": 0 } } } ], "choropleth": [ { "type": "choropleth", "colorbar": { "ticks": "", "outlinewidth": 0 } } ], "scattergeo": [ { "type": "scattergeo", "marker": { "colorbar": { "ticks": "", "outlinewidth": 0 } } } ], "histogram2d": [ { "type": "histogram2d", "colorbar": { "ticks": "", "outlinewidth": 0 }, "autocolorscale": true } ], "scatterpolar": [ { "type": "scatterpolar", "marker": { "colorbar": { "ticks": "", "outlinewidth": 0 } } } ], "contourcarpet": [ { "type": "contourcarpet", "colorbar": { "ticks": "", "outlinewidth": 0 } } ], "scattercarpet": [ { "type": "scattercarpet", "marker": { "colorbar": { "ticks": "", "outlinewidth": 0 } } } ], "scattermapbox": [ { "type": "scattermapbox", "marker": { "colorbar": { "ticks": "", "outlinewidth": 0 } } } ], "scatterpolargl": [ { "type": "scatterpolargl", "marker": { "colorbar": { "ticks": "", "outlinewidth": 0 } } } ], "scatterternary": [ { "type": "scatterternary", "marker": { "colorbar": { "ticks": "", "outlinewidth": 0 } } } ], "histogram2dcontour": [ { "type": "histogram2dcontour", "colorbar": { "ticks": "", "outlinewidth": 0 }, "autocolorscale": true } ] }, "layout": { "geo": { "bgcolor": "white", "showland": true, "lakecolor": "white", "landcolor": "white", "showlakes": true, "subunitcolor": "#C8D4E3" }, "font": { "color": "#2a3f5f" }, "polar": { "bgcolor": "white", "radialaxis": { "ticks": "", "gridcolor": "#EBF0F8", "linecolor": "#EBF0F8" }, "angularaxis": { "ticks": "", "gridcolor": "#EBF0F8", "linecolor": "#EBF0F8" } }, "scene": { "xaxis": { "ticks": "", "gridcolor": "#DFE8F3", "gridwidth": 2, "linecolor": "#EBF0F8", "zerolinecolor": "#EBF0F8", "showbackground": true, "backgroundcolor": "white" }, "yaxis": { "ticks": "", "gridcolor": "#DFE8F3", "gridwidth": 2, "linecolor": "#EBF0F8", "zerolinecolor": "#EBF0F8", "showbackground": true, "backgroundcolor": "white" }, "zaxis": { "ticks": "", "gridcolor": "#DFE8F3", "gridwidth": 2, "linecolor": "#EBF0F8", "zerolinecolor": "#EBF0F8", "showbackground": true, "backgroundcolor": "white" } }, "title": { "x": 0.05 }, "xaxis": { "ticks": "", "gridcolor": "#EBF0F8", "linecolor": "#EBF0F8", "automargin": true, "zerolinecolor": "#EBF0F8", "zerolinewidth": 2 }, "yaxis": { "ticks": "", "gridcolor": "#EBF0F8", "linecolor": "#EBF0F8", "automargin": true, "zerolinecolor": "#EBF0F8", "zerolinewidth": 2 }, "ternary": { "aaxis": { "ticks": "", "gridcolor": "#DFE8F3", "linecolor": "#A2B1C6" }, "baxis": { "ticks": "", "gridcolor": "#DFE8F3", "linecolor": "#A2B1C6" }, "caxis": { "ticks": "", "gridcolor": "#DFE8F3", "linecolor": "#A2B1C6" }, "bgcolor": "white" }, "colorway": [ "#636efa", "#EF553B", "#00cc96", "#ab63fa", "#19d3f3", "#e763fa", "#fecb52", "#ffa15a", "#ff6692", "#b6e880" ], "hovermode": "closest", "colorscale": { "diverging": [ [ 0, "#8e0152" ], [ 0.1, "#c51b7d" ], [ 0.2, "#de77ae" ], [ 0.3, "#f1b6da" ], [ 0.4, "#fde0ef" ], [ 0.5, "#f7f7f7" ], [ 0.6, "#e6f5d0" ], [ 0.7, "#b8e186" ], [ 0.8, "#7fbc41" ], [ 0.9, "#4d9221" ], [ 1, "#276419" ] ], "sequential": [ [ 0, "#0508b8" ], [ 0.0893854748603352, "#1910d8" ], [ 0.1787709497206704, "#3c19f0" ], [ 0.2681564245810056, "#6b1cfb" ], [ 0.3575418994413408, "#981cfd" ], [ 0.44692737430167595, "#bf1cfd" ], [ 0.5363128491620112, "#dd2bfd" ], [ 0.6256983240223464, "#f246fe" ], [ 0.7150837988826816, "#fc67fd" ], [ 0.8044692737430168, "#fe88fc" ], [ 0.8938547486033519, "#fea5fd" ], [ 0.9832402234636871, "#febefe" ], [ 1, "#fec3fe" ] ], "sequentialminus": [ [ 0, "#0508b8" ], [ 0.0893854748603352, "#1910d8" ], [ 0.1787709497206704, "#3c19f0" ], [ 0.2681564245810056, "#6b1cfb" ], [ 0.3575418994413408, "#981cfd" ], [ 0.44692737430167595, "#bf1cfd" ], [ 0.5363128491620112, "#dd2bfd" ], [ 0.6256983240223464, "#f246fe" ], [ 0.7150837988826816, "#fc67fd" ], [ 0.8044692737430168, "#fe88fc" ], [ 0.8938547486033519, "#fea5fd" ], [ 0.9832402234636871, "#febefe" ], [ 1, "#fec3fe" ] ] }, "plot_bgcolor": "white", "paper_bgcolor": "white", "shapedefaults": { "line": { "width": 0 }, "opacity": 0.4, "fillcolor": "#506784" }, "annotationdefaults": { "arrowhead": 0, "arrowcolor": "#506784", "arrowwidth": 1 } }, "themeRef": "PLOTLY_WHITE" }, "bargroupgap": 0 } }, "height": null, "width": null, "user": { "profile_url": "https://chart-studio.plotly.com/~swagata21", "avatar_url": "https://storage.googleapis.com/plotly-prod-profiles/35.jpg", "background_url": "https://storage.googleapis.com/plotly-prod-profiles/bg-6.jpg", "bio": "", "nickname": "", "website": "", "stream_tokens": null, "feature_set_id": null, "csrf_token": null, "date_joined": "2025-09-10 08:06:25", "mapbox_access_tokens": null, "has_password": null, "username": "swagata21", "email": null, "is_active": null, "readonly": null, "is_dash_creator": null, "dash_created_count": null, "is_chart_creator": null, "charts_created_count": null } }, { "creation_time": "2025-09-10T08:34:30.816666Z", "comments": { "results": [], "count": 0 }, "parented": true, "embed_url": "https://chart-studio.plotly.com/~lophital/1.embed", "fid": "lophital:1", "filename": "r-pshap", "filetype": "plot", "img_url": "https://storage.googleapis.com/plotly-prod-images/lophital/1/9_QC1ALGHNUWNNVWYP3GMKIQRO0UY8VJ.png", "image_urls": { "default": "https://storage.googleapis.com/plotly-prod-images/lophital/1/2_4H1D7NVCIQUN2SFOJ13RO5YJL33RIG.png", "block-thumb": "https://storage.googleapis.com/plotly-prod-images/lophital/1/8_R7HIY4L36K0V5IYNI0YV50Y8C9U9S8.png", "list-thumb": "https://storage.googleapis.com/plotly-prod-images/lophital/1/9_QC1ALGHNUWNNVWYP3GMKIQRO0UY8VJ.png" }, "api_urls": { "files": "https://api.plotly.com/v2/files/lophital:1", "plots": "https://api.plotly.com/v2/plots/lophital:1", "parent": "https://api.plotly.com/v2/folders/home?user=lophital" }, "owner": "lophital", "parent": -1, "preview": "", "referencers": [], "references": [], "title": "", "views": 2, "web_url": "https://chart-studio.plotly.com/~lophital/1/", "world_readable": true, "date_modified": "2025-09-10T12:18:11.722Z", "stars": { "results": [], "count": 0 }, "collaborators": { "results": [], "count": 0 }, "subfolder_count": null, "refresh_interval": null, "organize_view_url": "https://chart-studio.plotly.com/~lophital/1/", "current_user_permission": "read", "is_theme": null, "is_template": null, "autosize": true, "caption": "", "figure": { "data": [ { "line": { "color": "rgba(102,194,165,1)", "width": 55 }, "mode": "markers", "name": "Abies alba", "type": "scatter3d", "xsrc": "lophital:0:3cb6ec", "ysrc": "lophital:0:6e957b", "zsrc": "lophital:0:27a819", "frame": null, "marker": { "line": { "color": "rgba(102,194,165,1)" }, "color": "rgba(102,194,165,1)", "sizesrc": "lophital:0:ed506b", "sizemode": "area" }, "error_x": { "color": "rgba(102,194,165,1)", "width": 55 }, "error_y": { "color": "rgba(102,194,165,1)", "width": 55 }, "textsrc": "lophital:0:e11484", "textfont": { "size": 55, "color": "rgba(102,194,165,1)" }, "hoverinfosrc": "lophital:0:be0784" }, { "line": { "color": "rgba(142,187,153,1)", "width": 55 }, "mode": "markers", "name": "Abies amabilis", "type": "scatter3d", "xsrc": "lophital:0:13471f", "ysrc": "lophital:0:7dfc9b", "zsrc": "lophital:0:5b8889", "frame": null, "marker": { "line": { "color": "rgba(142,187,153,1)" }, "color": "rgba(142,187,153,1)", "sizesrc": "lophital:0:9dc982", "sizemode": "area" }, "error_x": { "color": "rgba(142,187,153,1)", "width": 55 }, "error_y": { "color": "rgba(142,187,153,1)", "width": 55 }, "textsrc": "lophital:0:c496b3", "textfont": { "size": 55, "color": "rgba(142,187,153,1)" }, "hoverinfosrc": "lophital:0:b12527" }, { "line": { "color": "rgba(172,179,141,1)", "width": 55 }, "mode": "markers", "name": "Abies balsamea", "type": "scatter3d", "xsrc": "lophital:0:70636a", "ysrc": "lophital:0:84f432", "zsrc": "lophital:0:ea79fc", "frame": null, "marker": { "line": { "color": "rgba(172,179,141,1)" }, "color": "rgba(172,179,141,1)", "sizesrc": "lophital:0:e23ba9", "sizemode": "area" }, "error_x": { "color": "rgba(172,179,141,1)", "width": 55 }, "error_y": { "color": "rgba(172,179,141,1)", "width": 55 }, "textsrc": "lophital:0:791e48", "textfont": { "size": 55, "color": "rgba(172,179,141,1)" }, "hoverinfosrc": "lophital:0:78fa94" }, { "line": { "color": "rgba(197,170,130,1)", "width": 55 }, "mode": "markers", "name": "Abies bracteata", "type": "scatter3d", "xsrc": "lophital:0:ef2750", "ysrc": "lophital:0:feca5b", "zsrc": "lophital:0:3260eb", "frame": null, "marker": { "line": { "color": "rgba(197,170,130,1)" }, "color": "rgba(197,170,130,1)", "sizesrc": "lophital:0:dad9b6", "sizemode": "area" }, "error_x": { "color": "rgba(197,170,130,1)", "width": 55 }, "error_y": { "color": "rgba(197,170,130,1)", "width": 55 }, "textsrc": "lophital:0:290b48", "textfont": { "size": 55, "color": "rgba(197,170,130,1)" }, "hoverinfosrc": "lophital:0:8bfded" }, { "line": { "color": "rgba(219,161,118,1)", "width": 55 }, "mode": "markers", "name": "Abies cephalonica", "type": "scatter3d", "xsrc": "lophital:0:c30515", "ysrc": "lophital:0:c9ac6d", "zsrc": "lophital:0:841268", "frame": null, "marker": { "line": { "color": "rgba(219,161,118,1)" }, "color": "rgba(219,161,118,1)", "sizesrc": "lophital:0:cd806f", "sizemode": "area" }, "error_x": { "color": "rgba(219,161,118,1)", "width": 55 }, "error_y": { "color": "rgba(219,161,118,1)", "width": 55 }, "textsrc": "lophital:0:6f615f", "textfont": { "size": 55, "color": "rgba(219,161,118,1)" }, "hoverinfosrc": "lophital:0:8a3764" }, { "line": { "color": "rgba(239,150,106,1)", "width": 55 }, "mode": "markers", "name": "Abies cilicica", "type": "scatter3d", "xsrc": "lophital:0:8ede8b", "ysrc": "lophital:0:888d8c", "zsrc": "lophital:0:1ad1da", "frame": null, "marker": { "line": { "color": "rgba(239,150,106,1)" }, "color": "rgba(239,150,106,1)", "sizesrc": "lophital:0:9877fe", "sizemode": "area" }, "error_x": { "color": "rgba(239,150,106,1)", "width": 55 }, "error_y": { "color": "rgba(239,150,106,1)", "width": 55 }, "textsrc": "lophital:0:5ff3fa", "textfont": { "size": 55, "color": "rgba(239,150,106,1)" }, "hoverinfosrc": "lophital:0:46aafb" }, { "line": { "color": "rgba(248,142,103,1)", "width": 55 }, "mode": "markers", "name": "Abies concolor", "type": "scatter3d", "xsrc": "lophital:0:687a7e", "ysrc": "lophital:0:324e5a", "zsrc": "lophital:0:93a6c7", "frame": null, "marker": { "line": { "color": "rgba(248,142,103,1)" }, "color": "rgba(248,142,103,1)", "sizesrc": "lophital:0:aa1887", "sizemode": "area" }, "error_x": { "color": "rgba(248,142,103,1)", "width": 55 }, "error_y": { "color": "rgba(248,142,103,1)", "width": 55 }, "textsrc": "lophital:0:d22afc", "textfont": { "size": 55, "color": "rgba(248,142,103,1)" }, "hoverinfosrc": "lophital:0:aefff8" }, { "line": { "color": "rgba(233,146,122,1)", "width": 55 }, "mode": "markers", "name": "Abies delavayi", "type": "scatter3d", "xsrc": "lophital:0:eda450", "ysrc": "lophital:0:c2bf43", "zsrc": "lophital:0:50cac8", "frame": null, "marker": { "line": { "color": "rgba(233,146,122,1)" }, "color": "rgba(233,146,122,1)", "sizesrc": "lophital:0:58e05f", "sizemode": "area" }, "error_x": { "color": "rgba(233,146,122,1)", "width": 55 }, "error_y": { "color": "rgba(233,146,122,1)", "width": 55 }, "textsrc": "lophital:0:6fa69b", "textfont": { "size": 55, "color": "rgba(233,146,122,1)" }, "hoverinfosrc": "lophital:0:164aa5" }, { "line": { "color": "rgba(217,150,141,1)", "width": 55 }, "mode": "markers", "name": "Abies durangensis", "type": "scatter3d", "xsrc": "lophital:0:7e9158", "ysrc": "lophital:0:4e84f5", "zsrc": "lophital:0:eb950f", "frame": null, "marker": { "line": { "color": "rgba(217,150,141,1)" }, "color": "rgba(217,150,141,1)", "sizesrc": "lophital:0:ec61be", "sizemode": "area" }, "error_x": { "color": "rgba(217,150,141,1)", "width": 55 }, "error_y": { "color": "rgba(217,150,141,1)", "width": 55 }, "textsrc": "lophital:0:614daf", "textfont": { "size": 55, "color": "rgba(217,150,141,1)" }, "hoverinfosrc": "lophital:0:d5732a" }, { "line": { "color": "rgba(199,153,159,1)", "width": 55 }, "mode": "markers", "name": "Abies fargesii", "type": "scatter3d", "xsrc": "lophital:0:2afd30", "ysrc": "lophital:0:701753", "zsrc": "lophital:0:c9420d", "frame": null, "marker": { "line": { "color": "rgba(199,153,159,1)" }, "color": "rgba(199,153,159,1)", "sizesrc": "lophital:0:f083c0", "sizemode": "area" }, "error_x": { "color": "rgba(199,153,159,1)", "width": 55 }, "error_y": { "color": "rgba(199,153,159,1)", "width": 55 }, "textsrc": "lophital:0:9f1668", "textfont": { "size": 55, "color": "rgba(199,153,159,1)" }, "hoverinfosrc": "lophital:0:2ded14" }, { "line": { "color": "rgba(178,156,177,1)", "width": 55 }, "mode": "markers", "name": "Abies firma", "type": "scatter3d", "xsrc": "lophital:0:147645", "ysrc": "lophital:0:faed1a", "zsrc": "lophital:0:092435", "frame": null, "marker": { "line": { "color": "rgba(178,156,177,1)" }, "color": "rgba(178,156,177,1)", "sizesrc": "lophital:0:3cda4a", "sizemode": "area" }, "error_x": { "color": "rgba(178,156,177,1)", "width": 55 }, "error_y": { "color": "rgba(178,156,177,1)", "width": 55 }, "textsrc": "lophital:0:ade605", "textfont": { "size": 55, "color": "rgba(178,156,177,1)" }, "hoverinfosrc": "lophital:0:bbc33f" }, { "line": { "color": "rgba(154,159,195,1)", "width": 55 }, "mode": "markers", "name": "Abies forrestii", "type": "scatter3d", "xsrc": "lophital:0:a6c4a8", "ysrc": "lophital:0:e5860e", "zsrc": "lophital:0:5d85bb", "frame": null, "marker": { "line": { "color": "rgba(154,159,195,1)" }, "color": "rgba(154,159,195,1)", "sizesrc": "lophital:0:b8a75c", "sizemode": "area" }, "error_x": { "color": "rgba(154,159,195,1)", "width": 55 }, "error_y": { "color": "rgba(154,159,195,1)", "width": 55 }, "textsrc": "lophital:0:cb7fa1", "textfont": { "size": 55, "color": "rgba(154,159,195,1)" }, "hoverinfosrc": "lophital:0:395f16" }, { "line": { "color": "rgba(152,158,202,1)", "width": 55 }, "mode": "markers", "name": "Abies fraseri", "type": "scatter3d", "xsrc": "lophital:0:c77755", "ysrc": "lophital:0:57ed39", "zsrc": "lophital:0:39fad7", "frame": null, "marker": { "line": { "color": "rgba(152,158,202,1)" }, "color": "rgba(152,158,202,1)", "sizesrc": "lophital:0:62c3c5", "sizemode": "area" }, "error_x": { "color": "rgba(152,158,202,1)", "width": 55 }, "error_y": { "color": "rgba(152,158,202,1)", "width": 55 }, "textsrc": "lophital:0:7b2d65", "textfont": { "size": 55, "color": "rgba(152,158,202,1)" }, "hoverinfosrc": "lophital:0:9f0441" }, { "line": { "color": "rgba(169,155,201,1)", "width": 55 }, "mode": "markers", "name": "Abies grandis", "type": "scatter3d", "xsrc": "lophital:0:9a2eb0", "ysrc": "lophital:0:73a403", "zsrc": "lophital:0:174d5e", "frame": null, "marker": { "line": { "color": "rgba(169,155,201,1)" }, "color": "rgba(169,155,201,1)", "sizesrc": "lophital:0:492a4c", "sizemode": "area" }, "error_x": { "color": "rgba(169,155,201,1)", "width": 55 }, "error_y": { "color": "rgba(169,155,201,1)", "width": 55 }, "textsrc": "lophital:0:8697ec", "textfont": { "size": 55, "color": "rgba(169,155,201,1)" }, "hoverinfosrc": "lophital:0:9d2229" }, { "line": { "color": "rgba(185,152,199,1)", "width": 55 }, "mode": "markers", "name": "Abies guatemalensis", "type": "scatter3d", "xsrc": "lophital:0:632710", "ysrc": "lophital:0:590fee", "zsrc": "lophital:0:64e7cd", "frame": null, "marker": { "line": { "color": "rgba(185,152,199,1)" }, "color": "rgba(185,152,199,1)", "sizesrc": "lophital:0:bd1728", "sizemode": "area" }, "error_x": { "color": "rgba(185,152,199,1)", "width": 55 }, "error_y": { "color": "rgba(185,152,199,1)", "width": 55 }, "textsrc": "lophital:0:076156", "textfont": { "size": 55, "color": "rgba(185,152,199,1)" }, "hoverinfosrc": "lophital:0:993fc3" }, { "line": { "color": "rgba(201,148,198,1)", "width": 55 }, "mode": "markers", "name": "Abies hickelii", "type": "scatter3d", "xsrc": "lophital:0:b3e197", "ysrc": "lophital:0:27618e", "zsrc": "lophital:0:aecb94", "frame": null, "marker": { "line": { "color": "rgba(201,148,198,1)" }, "color": "rgba(201,148,198,1)", "sizesrc": "lophital:0:4a21c7", "sizemode": "area" }, "error_x": { "color": "rgba(201,148,198,1)", "width": 55 }, "error_y": { "color": "rgba(201,148,198,1)", "width": 55 }, "textsrc": "lophital:0:686853", "textfont": { "size": 55, "color": "rgba(201,148,198,1)" }, "hoverinfosrc": "lophital:0:f1fe49" }, { "line": { "color": "rgba(215,144,197,1)", "width": 55 }, "mode": "markers", "name": "Abies holophylla", "type": "scatter3d", "xsrc": "lophital:0:c90b7a", "ysrc": "lophital:0:77a354", "zsrc": "lophital:0:81efe9", "frame": null, "marker": { "line": { "color": "rgba(215,144,197,1)" }, "color": "rgba(215,144,197,1)", "sizesrc": "lophital:0:ebfa9e", "sizemode": "area" }, "error_x": { "color": "rgba(215,144,197,1)", "width": 55 }, "error_y": { "color": "rgba(215,144,197,1)", "width": 55 }, "textsrc": "lophital:0:ee45c7", "textfont": { "size": 55, "color": "rgba(215,144,197,1)" }, "hoverinfosrc": "lophital:0:b79c74" }, { "line": { "color": "rgba(229,139,195,1)", "width": 55 }, "mode": "markers", "name": "Abies homolepis", "type": "scatter3d", "xsrc": "lophital:0:e8f254", "ysrc": "lophital:0:577674", "zsrc": "lophital:0:f72e23", "frame": null, "marker": { "line": { "color": "rgba(229,139,195,1)" }, "color": "rgba(229,139,195,1)", "sizesrc": "lophital:0:32594e", "sizemode": "area" }, "error_x": { "color": "rgba(229,139,195,1)", "width": 55 }, "error_y": { "color": "rgba(229,139,195,1)", "width": 55 }, "textsrc": "lophital:0:7febcb", "textfont": { "size": 55, "color": "rgba(229,139,195,1)" }, "hoverinfosrc": "lophital:0:6e60a4" }, { "line": { "color": "rgba(224,152,180,1)", "width": 55 }, "mode": "markers", "name": "Abies kawakamii", "type": "scatter3d", "xsrc": "lophital:0:7ea642", "ysrc": "lophital:0:66a6bf", "zsrc": "lophital:0:b55e75", "frame": null, "marker": { "line": { "color": "rgba(224,152,180,1)" }, "color": "rgba(224,152,180,1)", "sizesrc": "lophital:0:c304e0", "sizemode": "area" }, "error_x": { "color": "rgba(224,152,180,1)", "width": 55 }, "error_y": { "color": "rgba(224,152,180,1)", "width": 55 }, "textsrc": "lophital:0:a11b5b", "textfont": { "size": 55, "color": "rgba(224,152,180,1)" }, "hoverinfosrc": "lophital:0:6eb0c4" }, { "line": { "color": "rgba(216,167,162,1)", "width": 55 }, "mode": "markers", "name": "Abies lasiocarpa", "type": "scatter3d", "xsrc": "lophital:0:244cbf", "ysrc": "lophital:0:5a6297", "zsrc": "lophital:0:1eb36c", "frame": null, "marker": { "line": { "color": "rgba(216,167,162,1)" }, "color": "rgba(216,167,162,1)", "sizesrc": "lophital:0:fffd54", "sizemode": "area" }, "error_x": { "color": "rgba(216,167,162,1)", "width": 55 }, "error_y": { "color": "rgba(216,167,162,1)", "width": 55 }, "textsrc": "lophital:0:2126f7", "textfont": { "size": 55, "color": "rgba(216,167,162,1)" }, "hoverinfosrc": "lophital:0:060c74" }, { "line": { "color": "rgba(205,180,144,1)", "width": 55 }, "mode": "markers", "name": "Abies magnifica", "type": "scatter3d", "xsrc": "lophital:0:a1ff01", "ysrc": "lophital:0:c2797c", "zsrc": "lophital:0:428ead", "frame": null, "marker": { "line": { "color": "rgba(205,180,144,1)" }, "color": "rgba(205,180,144,1)", "sizesrc": "lophital:0:e70c69", "sizemode": "area" }, "error_x": { "color": "rgba(205,180,144,1)", "width": 55 }, "error_y": { "color": "rgba(205,180,144,1)", "width": 55 }, "textsrc": "lophital:0:fc9c3f", "textfont": { "size": 55, "color": "rgba(205,180,144,1)" }, "hoverinfosrc": "lophital:0:232677" }, { "line": { "color": "rgba(193,193,125,1)", "width": 55 }, "mode": "markers", "name": "Abies mariesii", "type": "scatter3d", "xsrc": "lophital:0:f5fb74", "ysrc": "lophital:0:e42a0d", "zsrc": "lophital:0:60108c", "frame": null, "marker": { "line": { "color": "rgba(193,193,125,1)" }, "color": "rgba(193,193,125,1)", "sizesrc": "lophital:0:924a65", "sizemode": "area" }, "error_x": { "color": "rgba(193,193,125,1)", "width": 55 }, "error_y": { "color": "rgba(193,193,125,1)", "width": 55 }, "textsrc": "lophital:0:56622a", "textfont": { "size": 55, "color": "rgba(193,193,125,1)" }, "hoverinfosrc": "lophital:0:3e5cd3" }, { "line": { "color": "rgba(180,206,104,1)", "width": 55 }, "mode": "markers", "name": "Abies nephrolepis", "type": "scatter3d", "xsrc": "lophital:0:e95da6", "ysrc": "lophital:0:93f3b9", "zsrc": "lophital:0:d9dfdc", "frame": null, "marker": { "line": { "color": "rgba(180,206,104,1)" }, "color": "rgba(180,206,104,1)", "sizesrc": "lophital:0:4ba5f4", "sizemode": "area" }, "error_x": { "color": "rgba(180,206,104,1)", "width": 55 }, "error_y": { "color": "rgba(180,206,104,1)", "width": 55 }, "textsrc": "lophital:0:67a36e", "textfont": { "size": 55, "color": "rgba(180,206,104,1)" }, "hoverinfosrc": "lophital:0:03b4e5" }, { "line": { "color": "rgba(169,216,83,1)", "width": 55 }, "mode": "markers", "name": "Abies nordmanniana", "type": "scatter3d", "xsrc": "lophital:0:740184", "ysrc": "lophital:0:67ad6d", "zsrc": "lophital:0:fee440", "frame": null, "marker": { "line": { "color": "rgba(169,216,83,1)" }, "color": "rgba(169,216,83,1)", "sizesrc": "lophital:0:659e6f", "sizemode": "area" }, "error_x": { "color": "rgba(169,216,83,1)", "width": 55 }, "error_y": { "color": "rgba(169,216,83,1)", "width": 55 }, "textsrc": "lophital:0:2a3821", "textfont": { "size": 55, "color": "rgba(169,216,83,1)" }, "hoverinfosrc": "lophital:0:095b3e" }, { "line": { "color": "rgba(186,217,78,1)", "width": 55 }, "mode": "markers", "name": "Abies pinsapo", "type": "scatter3d", "xsrc": "lophital:0:7636f9", "ysrc": "lophital:0:cecd55", "zsrc": "lophital:0:d7d547", "frame": null, "marker": { "line": { "color": "rgba(186,217,78,1)" }, "color": "rgba(186,217,78,1)", "sizesrc": "lophital:0:d4d8a2", "sizemode": "area" }, "error_x": { "color": "rgba(186,217,78,1)", "width": 55 }, "error_y": { "color": "rgba(186,217,78,1)", "width": 55 }, "textsrc": "lophital:0:8d7d3c", "textfont": { "size": 55, "color": "rgba(186,217,78,1)" }, "hoverinfosrc": "lophital:0:1c6a6c" }, { "line": { "color": "rgba(202,217,72,1)", "width": 55 }, "mode": "markers", "name": "Abies procera", "type": "scatter3d", "xsrc": "lophital:0:721337", "ysrc": "lophital:0:d45bb8", "zsrc": "lophital:0:67d108", "frame": null, "marker": { "line": { "color": "rgba(202,217,72,1)" }, "color": "rgba(202,217,72,1)", "sizesrc": "lophital:0:5b8157", "sizemode": "area" }, "error_x": { "color": "rgba(202,217,72,1)", "width": 55 }, "error_y": { "color": "rgba(202,217,72,1)", "width": 55 }, "textsrc": "lophital:0:19d649", "textfont": { "size": 55, "color": "rgba(202,217,72,1)" }, "hoverinfosrc": "lophital:0:78527f" }, { "line": { "color": "rgba(217,217,66,1)", "width": 55 }, "mode": "markers", "name": "Abies religiosa", "type": "scatter3d", "xsrc": "lophital:0:5246e3", "ysrc": "lophital:0:1de695", "zsrc": "lophital:0:4706bb", "frame": null, "marker": { "line": { "color": "rgba(217,217,66,1)" }, "color": "rgba(217,217,66,1)", "sizesrc": "lophital:0:56bf48", "sizemode": "area" }, "error_x": { "color": "rgba(217,217,66,1)", "width": 55 }, "error_y": { "color": "rgba(217,217,66,1)", "width": 55 }, "textsrc": "lophital:0:b0d145", "textfont": { "size": 55, "color": "rgba(217,217,66,1)" }, "hoverinfosrc": "lophital:0:a9bd7f" }, { "line": { "color": "rgba(232,217,59,1)", "width": 55 }, "mode": "markers", "name": "Abies sachalinensis", "type": "scatter3d", "xsrc": "lophital:0:99ca2c", "ysrc": "lophital:0:b8fe1e", "zsrc": "lophital:0:47797c", "frame": null, "marker": { "line": { "color": "rgba(232,217,59,1)" }, "color": "rgba(232,217,59,1)", "sizesrc": "lophital:0:64534c", "sizemode": "area" }, "error_x": { "color": "rgba(232,217,59,1)", "width": 55 }, "error_y": { "color": "rgba(232,217,59,1)", "width": 55 }, "textsrc": "lophital:0:352d7d", "textfont": { "size": 55, "color": "rgba(232,217,59,1)" }, "hoverinfosrc": "lophital:0:8c0598" }, { "line": { "color": "rgba(247,217,52,1)", "width": 55 }, "mode": "markers", "name": "Abies sibirica", "type": "scatter3d", "xsrc": "lophital:0:33b66b", "ysrc": "lophital:0:1f7164", "zsrc": "lophital:0:cdea5c", "frame": null, "marker": { "line": { "color": "rgba(247,217,52,1)" }, "color": "rgba(247,217,52,1)", "sizesrc": "lophital:0:4aa80d", "sizemode": "area" }, "error_x": { "color": "rgba(247,217,52,1)", "width": 55 }, "error_y": { "color": "rgba(247,217,52,1)", "width": 55 }, "textsrc": "lophital:0:9d2bc5", "textfont": { "size": 55, "color": "rgba(247,217,52,1)" }, "hoverinfosrc": "lophital:0:418ba1" }, { "line": { "color": "rgba(253,215,59,1)", "width": 55 }, "mode": "markers", "name": "Abies spectabilis", "type": "scatter3d", "xsrc": "lophital:0:923c58", "ysrc": "lophital:0:83f2c2", "zsrc": "lophital:0:e22fbd", "frame": null, "marker": { "line": { "color": "rgba(253,215,59,1)" }, "color": "rgba(253,215,59,1)", "sizesrc": "lophital:0:eeeed9", "sizemode": "area" }, "error_x": { "color": "rgba(253,215,59,1)", "width": 55 }, "error_y": { "color": "rgba(253,215,59,1)", "width": 55 }, "textsrc": "lophital:0:66f3f9", "textfont": { "size": 55, "color": "rgba(253,215,59,1)" }, "hoverinfosrc": "lophital:0:9f570f" }, { "line": { "color": "rgba(250,212,80,1)", "width": 55 }, "mode": "markers", "name": "Abies veitchii", "type": "scatter3d", "xsrc": "lophital:0:85e5d1", "ysrc": "lophital:0:6e995b", "zsrc": "lophital:0:904a9b", "frame": null, "marker": { "line": { "color": "rgba(250,212,80,1)" }, "color": "rgba(250,212,80,1)", "sizesrc": "lophital:0:082e4b", "sizemode": "area" }, "error_x": { "color": "rgba(250,212,80,1)", "width": 55 }, "error_y": { "color": "rgba(250,212,80,1)", "width": 55 }, "textsrc": "lophital:0:6aa817", "textfont": { "size": 55, "color": "rgba(250,212,80,1)" }, "hoverinfosrc": "lophital:0:e3542c" }, { "line": { "color": "rgba(245,208,98,1)", "width": 55 }, "mode": "markers", "name": "Abies vejarii", "type": "scatter3d", "xsrc": "lophital:0:977f48", "ysrc": "lophital:0:295e38", "zsrc": "lophital:0:0d9bdf", "frame": null, "marker": { "line": { "color": "rgba(245,208,98,1)" }, "color": "rgba(245,208,98,1)", "sizesrc": "lophital:0:74a98f", "sizemode": "area" }, "error_x": { "color": "rgba(245,208,98,1)", "width": 55 }, "error_y": { "color": "rgba(245,208,98,1)", "width": 55 }, "textsrc": "lophital:0:1d07d2", "textfont": { "size": 55, "color": "rgba(245,208,98,1)" }, "hoverinfosrc": "lophital:0:0643de" }, { "line": { "color": "rgba(241,204,114,1)", "width": 55 }, "mode": "markers", "name": "count_15_1e4", "type": "scatter3d", "xsrc": "lophital:0:9fbdf8", "ysrc": "lophital:0:885644", "zsrc": "lophital:0:eae34b", "frame": null, "marker": { "line": { "color": "rgba(241,204,114,1)" }, "color": "rgba(241,204,114,1)", "sizesrc": "lophital:0:dcf506", "sizemode": "area" }, "error_x": { "color": "rgba(241,204,114,1)", "width": 55 }, "error_y": { "color": "rgba(241,204,114,1)", "width": 55 }, "textsrc": "lophital:0:2b5c79", "textfont": { "size": 55, "color": "rgba(241,204,114,1)" }, "hoverinfosrc": "lophital:0:c06dd4" }, { "line": { "color": "rgba(236,201,129,1)", "width": 55 }, "mode": "markers", "name": "count_15_1e5", "type": "scatter3d", "xsrc": "lophital:0:bbe70b", "ysrc": "lophital:0:7de753", "zsrc": "lophital:0:d58f0a", "frame": null, "marker": { "line": { "color": "rgba(236,201,129,1)" }, "color": "rgba(236,201,129,1)", "sizesrc": "lophital:0:b4d486", "sizemode": "area" }, "error_x": { "color": "rgba(236,201,129,1)", "width": 55 }, "error_y": { "color": "rgba(236,201,129,1)", "width": 55 }, "textsrc": "lophital:0:a63d79", "textfont": { "size": 55, "color": "rgba(236,201,129,1)" }, "hoverinfosrc": "lophital:0:ee23c8" }, { "line": { "color": "rgba(231,197,144,1)", "width": 55 }, "mode": "markers", "name": "count_15_5e5", "type": "scatter3d", "xsrc": "lophital:0:5aae6b", "ysrc": "lophital:0:8836a4", "zsrc": "lophital:0:080ce8", "frame": null, "marker": { "line": { "color": "rgba(231,197,144,1)" }, "color": "rgba(231,197,144,1)", "sizesrc": "lophital:0:3a0fdd", "sizemode": "area" }, "error_x": { "color": "rgba(231,197,144,1)", "width": 55 }, "error_y": { "color": "rgba(231,197,144,1)", "width": 55 }, "textsrc": "lophital:0:056857", "textfont": { "size": 55, "color": "rgba(231,197,144,1)" }, "hoverinfosrc": "lophital:0:209adf" }, { "line": { "color": "rgba(223,194,152,1)", "width": 55 }, "mode": "markers", "name": "count_30_1e4", "type": "scatter3d", "xsrc": "lophital:0:c8f651", "ysrc": "lophital:0:e5f88e", "zsrc": "lophital:0:7b6112", "frame": null, "marker": { "line": { "color": "rgba(223,194,152,1)" }, "color": "rgba(223,194,152,1)", "sizesrc": "lophital:0:5a2420", "sizemode": "area" }, "error_x": { "color": "rgba(223,194,152,1)", "width": 55 }, "error_y": { "color": "rgba(223,194,152,1)", "width": 55 }, "textsrc": "lophital:0:4b186f", "textfont": { "size": 55, "color": "rgba(223,194,152,1)" }, "hoverinfosrc": "lophital:0:b3dec3" }, { "line": { "color": "rgba(215,191,158,1)", "width": 55 }, "mode": "markers", "name": "count_30_1e5", "type": "scatter3d", "xsrc": "lophital:0:a44c7e", "ysrc": "lophital:0:baab1b", "zsrc": "lophital:0:b89fa3", "frame": null, "marker": { "line": { "color": "rgba(215,191,158,1)" }, "color": "rgba(215,191,158,1)", "sizesrc": "lophital:0:80ad66", "sizemode": "area" }, "error_x": { "color": "rgba(215,191,158,1)", "width": 55 }, "error_y": { "color": "rgba(215,191,158,1)", "width": 55 }, "textsrc": "lophital:0:d6ff06", "textfont": { "size": 55, "color": "rgba(215,191,158,1)" }, "hoverinfosrc": "lophital:0:1403e9" }, { "line": { "color": "rgba(206,188,163,1)", "width": 55 }, "mode": "markers", "name": "count_30_5e5", "type": "scatter3d", "xsrc": "lophital:0:a51beb", "ysrc": "lophital:0:2c71e6", "zsrc": "lophital:0:cf0cd9", "frame": null, "marker": { "line": { "color": "rgba(206,188,163,1)" }, "color": "rgba(206,188,163,1)", "sizesrc": "lophital:0:791810", "sizemode": "area" }, "error_x": { "color": "rgba(206,188,163,1)", "width": 55 }, "error_y": { "color": "rgba(206,188,163,1)", "width": 55 }, "textsrc": "lophital:0:c8d73a", "textfont": { "size": 55, "color": "rgba(206,188,163,1)" }, "hoverinfosrc": "lophital:0:5c882e" }, { "line": { "color": "rgba(198,185,168,1)", "width": 55 }, "mode": "markers", "name": "count_5_1e4", "type": "scatter3d", "xsrc": "lophital:0:72961b", "ysrc": "lophital:0:02d0ab", "zsrc": "lophital:0:2295ab", "frame": null, "marker": { "line": { "color": "rgba(198,185,168,1)" }, "color": "rgba(198,185,168,1)", "sizesrc": "lophital:0:48f35f", "sizemode": "area" }, "error_x": { "color": "rgba(198,185,168,1)", "width": 55 }, "error_y": { "color": "rgba(198,185,168,1)", "width": 55 }, "textsrc": "lophital:0:e6d181", "textfont": { "size": 55, "color": "rgba(198,185,168,1)" }, "hoverinfosrc": "lophital:0:33db1b" }, { "line": { "color": "rgba(189,182,174,1)", "width": 55 }, "mode": "markers", "name": "count_5_1e5", "type": "scatter3d", "xsrc": "lophital:0:94f582", "ysrc": "lophital:0:faacaf", "zsrc": "lophital:0:53c04e", "frame": null, "marker": { "line": { "color": "rgba(189,182,174,1)" }, "color": "rgba(189,182,174,1)", "sizesrc": "lophital:0:3e311a", "sizemode": "area" }, "error_x": { "color": "rgba(189,182,174,1)", "width": 55 }, "error_y": { "color": "rgba(189,182,174,1)", "width": 55 }, "textsrc": "lophital:0:eccf83", "textfont": { "size": 55, "color": "rgba(189,182,174,1)" }, "hoverinfosrc": "lophital:0:76cbd3" }, { "line": { "color": "rgba(179,179,179,1)", "width": 55 }, "mode": "markers", "name": "count_5_5e5", "type": "scatter3d", "xsrc": "lophital:0:2f205d", "ysrc": "lophital:0:246f9e", "zsrc": "lophital:0:6e7b61", "frame": null, "marker": { "line": { "color": "rgba(179,179,179,1)" }, "color": "rgba(179,179,179,1)", "sizesrc": "lophital:0:81256f", "sizemode": "area" }, "error_x": { "color": "rgba(179,179,179,1)", "width": 55 }, "error_y": { "color": "rgba(179,179,179,1)", "width": 55 }, "textsrc": "lophital:0:43f309", "textfont": { "size": 55, "color": "rgba(179,179,179,1)" }, "hoverinfosrc": "lophital:0:fc2bdf" } ], "layout": { "scene": { "xaxis": { "title": "PC1" }, "yaxis": { "title": "PC2" }, "zaxis": { "title": "PC3" } }, "margin": { "b": 40, "l": 60, "r": 10, "t": 25 }, "hovermode": "closest", "showlegend": true } }, "height": null, "width": null, "user": { "profile_url": "https://chart-studio.plotly.com/~lophital", "avatar_url": "https://storage.googleapis.com/plotly-prod-profiles/39.jpg", "background_url": "https://storage.googleapis.com/plotly-prod-profiles/bg-6.jpg", "bio": "", "nickname": "", "website": "", "stream_tokens": null, "feature_set_id": null, "csrf_token": null, "date_joined": "2025-09-10 08:25:42", "mapbox_access_tokens": null, "has_password": null, "username": "lophital", "email": null, "is_active": null, "readonly": null, "is_dash_creator": null, "dash_created_count": null, "is_chart_creator": null, "charts_created_count": null } }, { "creation_time": "2025-09-10T08:14:51.460940Z", "comments": { "results": [], "count": 0 }, "parented": true, "embed_url": "https://chart-studio.plotly.com/~Sowjanyalakshmi/3.embed", "fid": "Sowjanyalakshmi:3", "filename": "Plot 3", "filetype": "plot", "img_url": "https://storage.googleapis.com/plotly-prod-images/Sowjanyalakshmi/3/9_9U3JC2A9YYOWGH372WP8921037YDVL.png", "image_urls": { "default": "https://storage.googleapis.com/plotly-prod-images/Sowjanyalakshmi/3/2_8EYM9S4JQYAQUWN556ZPWJ5P823IMX.png", "block-thumb": "https://storage.googleapis.com/plotly-prod-images/Sowjanyalakshmi/3/8_OW68JOKS9MXQZEVJ0L832VSBDJM1B2.png", "list-thumb": "https://storage.googleapis.com/plotly-prod-images/Sowjanyalakshmi/3/9_9U3JC2A9YYOWGH372WP8921037YDVL.png" }, "api_urls": { "files": "https://api.plotly.com/v2/files/Sowjanyalakshmi:3", "plots": "https://api.plotly.com/v2/plots/Sowjanyalakshmi:3", "parent": "https://api.plotly.com/v2/folders/home?user=Sowjanyalakshmi" }, "owner": "Sowjanyalakshmi", "parent": -1, "preview": "", "referencers": [], "references": [], "title": "", "views": 1, "web_url": "https://chart-studio.plotly.com/~Sowjanyalakshmi/3/", "world_readable": true, "date_modified": "2025-09-17T10:21:12.485Z", "stars": { "results": [], "count": 0 }, "collaborators": { "results": [], "count": 0 }, "subfolder_count": null, "refresh_interval": null, "organize_view_url": "https://chart-studio.plotly.com/~Sowjanyalakshmi/3/", "current_user_permission": "read", "is_theme": null, "is_template": false, "autosize": true, "caption": "", "figure": { "data": [ { "meta": { "columnNames": { "x": "A", "y": "B", "error_y": { "array": "E", "arrayminus": "E" } } }, "name": "CON", "type": "bar", "xsrc": "Sowjanyalakshmi:0:47913a", "ysrc": "Sowjanyalakshmi:0:0ed948", "xaxis": "x", "yaxis": "y", "error_y": { "meta": { "columnNames": { "array": "E", "arrayminus": "E" } }, "type": "data", "visible": true, "arraysrc": "Sowjanyalakshmi:0:e51346", "symmetric": false, "arrayminussrc": "Sowjanyalakshmi:0:e51346" }, "visible": true, "orientation": "v" }, { "meta": { "columnNames": { "x": "A", "y": "D", "error_y": { "array": "C", "arrayminus": "C" } } }, "mode": "markers", "name": "TET", "type": "bar", "xsrc": "Sowjanyalakshmi:0:47913a", "ysrc": "Sowjanyalakshmi:0:0a160f", "error_x": { "type": "data", "visible": true, "symmetric": false }, "error_y": { "meta": { "columnNames": { "array": "C", "arrayminus": "C" } }, "type": "data", "visible": true, "arraysrc": "Sowjanyalakshmi:0:2a013c", "symmetric": false, "arrayminussrc": "Sowjanyalakshmi:0:2a013c" }, "visible": true, "orientation": "v" }, { "meta": { "columnNames": { "x": "A", "y": "F", "error_y": { "array": "G", "arrayminus": "G" } } }, "name": "SYN", "type": "bar", "xsrc": "Sowjanyalakshmi:0:47913a", "ysrc": "Sowjanyalakshmi:0:26a0bb", "error_y": { "meta": { "columnNames": { "array": "G", "arrayminus": "G" } }, "type": "data", "visible": true, "arraysrc": "Sowjanyalakshmi:0:5cfa52", "symmetric": false, "arrayminussrc": "Sowjanyalakshmi:0:5cfa52" }, "visible": true, "orientation": "v" } ], "frames": [], "layout": { "xaxis": { "type": "category", "range": [ -0.5, 6.5 ], "title": { "font": { "size": 9 } }, "tickfont": { "size": 9 }, "autorange": true }, "yaxis": { "type": "linear", "range": [ 0, 82.06947368421054 ], "title": { "text": "Measurements in (cm)" }, "autorange": true }, "legend": { "font": { "size": 9 } }, "autosize": true, "template": { "data": { "bar": [ { "type": "bar", "marker": { "colorbar": { "ticks": "", "outlinewidth": 0 } } } ], "table": [ { "type": "table", "cells": { "fill": { "color": "#EBF0F8" }, "line": { "color": "white" } }, "header": { "fill": { "color": "#C8D4E3" }, "line": { "color": "white" } } } ], "carpet": [ { "type": "carpet", "aaxis": { "gridcolor": "#C8D4E3", "linecolor": "#C8D4E3", "endlinecolor": "#2a3f5f", "minorgridcolor": "#C8D4E3", "startlinecolor": "#2a3f5f" }, "baxis": { "gridcolor": "#C8D4E3", "linecolor": "#C8D4E3", "endlinecolor": "#2a3f5f", "minorgridcolor": "#C8D4E3", "startlinecolor": "#2a3f5f" } } ], "mesh3d": [ { "type": "mesh3d", "colorbar": { "ticks": "", "outlinewidth": 0 } } ], "contour": [ { "type": "contour", "colorbar": { "ticks": "", "outlinewidth": 0 }, "autocolorscale": true } ], "heatmap": [ { "type": "heatmap", "colorbar": { "ticks": "", "outlinewidth": 0 }, "autocolorscale": true } ], "scatter": [ { "type": "scatter", "marker": { "colorbar": { "ticks": "", "outlinewidth": 0 } } } ], "surface": [ { "type": "surface", "colorbar": { "ticks": "", "outlinewidth": 0 } } ], "heatmapgl": [ { "type": "heatmapgl", "colorbar": { "ticks": "", "outlinewidth": 0 } } ], "histogram": [ { "type": "histogram", "marker": { "colorbar": { "ticks": "", "outlinewidth": 0 } } } ], "parcoords": [ { "line": { "colorbar": { "ticks": "", "outlinewidth": 0 } }, "type": "parcoords" } ], "scatter3d": [ { "type": "scatter3d", "marker": { "colorbar": { "ticks": "", "outlinewidth": 0 } } } ], "scattergl": [ { "type": "scattergl", "marker": { "colorbar": { "ticks": "", "outlinewidth": 0 } } } ], "choropleth": [ { "type": "choropleth", "colorbar": { "ticks": "", "outlinewidth": 0 } } ], "scattergeo": [ { "type": "scattergeo", "marker": { "colorbar": { "ticks": "", "outlinewidth": 0 } } } ], "histogram2d": [ { "type": "histogram2d", "colorbar": { "ticks": "", "outlinewidth": 0 }, "autocolorscale": true } ], "scatterpolar": [ { "type": "scatterpolar", "marker": { "colorbar": { "ticks": "", "outlinewidth": 0 } } } ], "contourcarpet": [ { "type": "contourcarpet", "colorbar": { "ticks": "", "outlinewidth": 0 } } ], "scattercarpet": [ { "type": "scattercarpet", "marker": { "colorbar": { "ticks": "", "outlinewidth": 0 } } } ], "scattermapbox": [ { "type": "scattermapbox", "marker": { "colorbar": { "ticks": "", "outlinewidth": 0 } } } ], "scatterpolargl": [ { "type": "scatterpolargl", "marker": { "colorbar": { "ticks": "", "outlinewidth": 0 } } } ], "scatterternary": [ { "type": "scatterternary", "marker": { "colorbar": { "ticks": "", "outlinewidth": 0 } } } ], "histogram2dcontour": [ { "type": "histogram2dcontour", "colorbar": { "ticks": "", "outlinewidth": 0 }, "autocolorscale": true } ] }, "layout": { "geo": { "bgcolor": "white", "showland": true, "lakecolor": "white", "landcolor": "white", "showlakes": true, "subunitcolor": "#C8D4E3" }, "font": { "color": "#2a3f5f" }, "polar": { "bgcolor": "white", "radialaxis": { "ticks": "", "gridcolor": "#EBF0F8", "linecolor": "#EBF0F8" }, "angularaxis": { "ticks": "", "gridcolor": "#EBF0F8", "linecolor": "#EBF0F8" } }, "scene": { "xaxis": { "ticks": "", "gridcolor": "#DFE8F3", "gridwidth": 2, "linecolor": "#EBF0F8", "zerolinecolor": "#EBF0F8", "showbackground": true, "backgroundcolor": "white" }, "yaxis": { "ticks": "", "gridcolor": "#DFE8F3", "gridwidth": 2, "linecolor": "#EBF0F8", "zerolinecolor": "#EBF0F8", "showbackground": true, "backgroundcolor": "white" }, "zaxis": { "ticks": "", "gridcolor": "#DFE8F3", "gridwidth": 2, "linecolor": "#EBF0F8", "zerolinecolor": "#EBF0F8", "showbackground": true, "backgroundcolor": "white" } }, "title": { "x": 0.05 }, "xaxis": { "ticks": "", "gridcolor": "#EBF0F8", "linecolor": "#EBF0F8", "automargin": true, "zerolinecolor": "#EBF0F8", "zerolinewidth": 2 }, "yaxis": { "ticks": "", "gridcolor": "#EBF0F8", "linecolor": "#EBF0F8", "automargin": true, "zerolinecolor": "#EBF0F8", "zerolinewidth": 2 }, "ternary": { "aaxis": { "ticks": "", "gridcolor": "#DFE8F3", "linecolor": "#A2B1C6" }, "baxis": { "ticks": "", "gridcolor": "#DFE8F3", "linecolor": "#A2B1C6" }, "caxis": { "ticks": "", "gridcolor": "#DFE8F3", "linecolor": "#A2B1C6" }, "bgcolor": "white" }, "colorway": [ "#636efa", "#EF553B", "#00cc96", "#ab63fa", "#19d3f3", "#e763fa", "#fecb52", "#ffa15a", "#ff6692", "#b6e880" ], "hovermode": "closest", "colorscale": { "diverging": [ [ 0, "#8e0152" ], [ 0.1, "#c51b7d" ], [ 0.2, "#de77ae" ], [ 0.3, "#f1b6da" ], [ 0.4, "#fde0ef" ], [ 0.5, "#f7f7f7" ], [ 0.6, "#e6f5d0" ], [ 0.7, "#b8e186" ], [ 0.8, "#7fbc41" ], [ 0.9, "#4d9221" ], [ 1, "#276419" ] ], "sequential": [ [ 0, "#0508b8" ], [ 0.0893854748603352, "#1910d8" ], [ 0.1787709497206704, "#3c19f0" ], [ 0.2681564245810056, "#6b1cfb" ], [ 0.3575418994413408, "#981cfd" ], [ 0.44692737430167595, "#bf1cfd" ], [ 0.5363128491620112, "#dd2bfd" ], [ 0.6256983240223464, "#f246fe" ], [ 0.7150837988826816, "#fc67fd" ], [ 0.8044692737430168, "#fe88fc" ], [ 0.8938547486033519, "#fea5fd" ], [ 0.9832402234636871, "#febefe" ], [ 1, "#fec3fe" ] ], "sequentialminus": [ [ 0, "#0508b8" ], [ 0.0893854748603352, "#1910d8" ], [ 0.1787709497206704, "#3c19f0" ], [ 0.2681564245810056, "#6b1cfb" ], [ 0.3575418994413408, "#981cfd" ], [ 0.44692737430167595, "#bf1cfd" ], [ 0.5363128491620112, "#dd2bfd" ], [ 0.6256983240223464, "#f246fe" ], [ 0.7150837988826816, "#fc67fd" ], [ 0.8044692737430168, "#fe88fc" ], [ 0.8938547486033519, "#fea5fd" ], [ 0.9832402234636871, "#febefe" ], [ 1, "#fec3fe" ] ] }, "plot_bgcolor": "white", "paper_bgcolor": "white", "shapedefaults": { "line": { "width": 0 }, "opacity": 0.4, "fillcolor": "#506784" }, "annotationdefaults": { "arrowhead": 0, "arrowcolor": "#506784", "arrowwidth": 1 } }, "themeRef": "PLOTLY_WHITE" }, "bargroupgap": 0.1 } }, "height": null, "width": null, "user": { "profile_url": "https://chart-studio.plotly.com/~Sowjanyalakshmi", "avatar_url": "https://storage.googleapis.com/plotly-prod-profiles/81.jpg", "background_url": "https://storage.googleapis.com/plotly-prod-profiles/bg-12.jpg", "bio": "", "nickname": "", "website": "", "stream_tokens": null, "feature_set_id": null, "csrf_token": null, "date_joined": "2025-09-10 04:45:06", "mapbox_access_tokens": null, "has_password": null, "username": "Sowjanyalakshmi", "email": null, "is_active": null, "readonly": null, "is_dash_creator": null, "dash_created_count": null, "is_chart_creator": null, "charts_created_count": null } }, { "creation_time": "2025-09-10T08:14:18.712424Z", "comments": { "results": [], "count": 0 }, "parented": true, "embed_url": "https://chart-studio.plotly.com/~wizman26/881.embed", "fid": "wizman26:881", "filename": "SB_193DTE_JUL", "filetype": "plot", "img_url": "https://storage.googleapis.com/plotly-prod-images/wizman26/881/9_X4HQZ54T9Q4TWA849HHRQEA3ZKJ15V.png", "image_urls": { "default": "https://storage.googleapis.com/plotly-prod-images/wizman26/881/2_6UA2VCLLF018PY1U16R8B462M67Z2K.png", "block-thumb": "https://storage.googleapis.com/plotly-prod-images/wizman26/881/8_LCDQSPEUCHFZOWCK77D1VM82KVJSB6.png", "list-thumb": "https://storage.googleapis.com/plotly-prod-images/wizman26/881/9_X4HQZ54T9Q4TWA849HHRQEA3ZKJ15V.png" }, "api_urls": { "files": "https://api.plotly.com/v2/files/wizman26:881", "plots": "https://api.plotly.com/v2/plots/wizman26:881", "parent": "https://api.plotly.com/v2/folders/home?user=wizman26" }, "owner": "wizman26", "parent": -1, "preview": "", "referencers": [], "references": [], "title": "", "views": 1, "web_url": "https://chart-studio.plotly.com/~wizman26/881/", "world_readable": true, "date_modified": "2025-09-10T08:14:18.725Z", "stars": { "results": [], "count": 0 }, "collaborators": { "results": [], "count": 0 }, "subfolder_count": null, "refresh_interval": null, "organize_view_url": "https://chart-studio.plotly.com/~wizman26/881/", "current_user_permission": "read", "is_theme": null, "is_template": null, "autosize": true, "caption": "", "figure": { "data": [ { "line": { "dash": "solid", "color": "rgba(255, 153, 51, 1.0)", "shape": "linear", "width": 1.3 }, "mode": "lines", "name": "SB_193DTE_JUL", "text": "", "type": "scatter", "xsrc": "wizman26:880:8d747b", "ysrc": "wizman26:880:118a55" } ], "layout": { "title": { "font": { "color": "#4D5663" }, "text": "SB_193DTE_JUL" }, "xaxis": { "title": { "font": { "color": "#4D5663" }, "text": "" }, "showgrid": true, "tickfont": { "color": "#4D5663" }, "gridcolor": "#E1E5ED", "zerolinecolor": "#E1E5ED" }, "yaxis": { "title": { "font": { "color": "#4D5663" }, "text": "" }, "showgrid": true, "tickfont": { "color": "#4D5663" }, "gridcolor": "#E1E5ED", "zerolinecolor": "#E1E5ED" }, "legend": { "font": { "color": "#4D5663" }, "bgcolor": "#F5F6F9" }, "template": { "data": { "bar": [ { "type": "bar", "marker": { "line": { "color": "#E5ECF6", "width": 0.5 }, "pattern": { "size": 10, "fillmode": "overlay", "solidity": 0.2 } }, "error_x": { "color": "#2a3f5f" }, "error_y": { "color": "#2a3f5f" } } ], "pie": [ { "type": "pie", "automargin": true } ], "table": [ { "type": "table", "cells": { "fill": { "color": "#EBF0F8" }, "line": { "color": "white" } }, "header": { "fill": { "color": "#C8D4E3" }, "line": { "color": "white" } } } ], "carpet": [ { "type": "carpet", "aaxis": { "gridcolor": "white", "linecolor": "white", "endlinecolor": "#2a3f5f", "minorgridcolor": "white", "startlinecolor": "#2a3f5f" }, "baxis": { "gridcolor": "white", "linecolor": "white", "endlinecolor": "#2a3f5f", "minorgridcolor": "white", "startlinecolor": "#2a3f5f" } } ], "mesh3d": [ { "type": "mesh3d", "colorbar": { "ticks": "", "outlinewidth": 0 } } ], "contour": [ { "type": "contour", "colorbar": { "ticks": "", "outlinewidth": 0 }, "colorscale": [ [ 0.0, "#0d0887" ], [ 0.1111111111111111, "#46039f" ], [ 0.2222222222222222, "#7201a8" ], [ 0.3333333333333333, "#9c179e" ], [ 0.4444444444444444, "#bd3786" ], [ 0.5555555555555556, "#d8576b" ], [ 0.6666666666666666, "#ed7953" ], [ 0.7777777777777778, "#fb9f3a" ], [ 0.8888888888888888, "#fdca26" ], [ 1.0, "#f0f921" ] ] } ], "heatmap": [ { "type": "heatmap", "colorbar": { "ticks": "", "outlinewidth": 0 }, "colorscale": [ [ 0.0, "#0d0887" ], [ 0.1111111111111111, "#46039f" ], [ 0.2222222222222222, "#7201a8" ], [ 0.3333333333333333, "#9c179e" ], [ 0.4444444444444444, "#bd3786" ], [ 0.5555555555555556, "#d8576b" ], [ 0.6666666666666666, "#ed7953" ], [ 0.7777777777777778, "#fb9f3a" ], [ 0.8888888888888888, "#fdca26" ], [ 1.0, "#f0f921" ] ] } ], "scatter": [ { "type": "scatter", "fillpattern": { "size": 10, "fillmode": "overlay", "solidity": 0.2 } } ], "surface": [ { "type": "surface", "colorbar": { "ticks": "", "outlinewidth": 0 }, "colorscale": [ [ 0.0, "#0d0887" ], [ 0.1111111111111111, "#46039f" ], [ 0.2222222222222222, "#7201a8" ], [ 0.3333333333333333, "#9c179e" ], [ 0.4444444444444444, "#bd3786" ], [ 0.5555555555555556, "#d8576b" ], [ 0.6666666666666666, "#ed7953" ], [ 0.7777777777777778, "#fb9f3a" ], [ 0.8888888888888888, "#fdca26" ], [ 1.0, "#f0f921" ] ] } ], "barpolar": [ { "type": "barpolar", "marker": { "line": { "color": "#E5ECF6", "width": 0.5 }, "pattern": { "size": 10, "fillmode": "overlay", "solidity": 0.2 } } } ], "heatmapgl": [ { "type": "heatmapgl", "colorbar": { "ticks": "", "outlinewidth": 0 }, "colorscale": [ [ 0.0, "#0d0887" ], [ 0.1111111111111111, "#46039f" ], [ 0.2222222222222222, "#7201a8" ], [ 0.3333333333333333, "#9c179e" ], [ 0.4444444444444444, "#bd3786" ], [ 0.5555555555555556, "#d8576b" ], [ 0.6666666666666666, "#ed7953" ], [ 0.7777777777777778, "#fb9f3a" ], [ 0.8888888888888888, "#fdca26" ], [ 1.0, "#f0f921" ] ] } ], "histogram": [ { "type": "histogram", "marker": { "pattern": { "size": 10, "fillmode": "overlay", "solidity": 0.2 } } } ], "parcoords": [ { "line": { "colorbar": { "ticks": "", "outlinewidth": 0 } }, "type": "parcoords" } ], "scatter3d": [ { "line": { "colorbar": { "ticks": "", "outlinewidth": 0 } }, "type": "scatter3d", "marker": { "colorbar": { "ticks": "", "outlinewidth": 0 } } } ], "scattergl": [ { "type": "scattergl", "marker": { "colorbar": { "ticks": "", "outlinewidth": 0 } } } ], "choropleth": [ { "type": "choropleth", "colorbar": { "ticks": "", "outlinewidth": 0 } } ], "scattergeo": [ { "type": "scattergeo", "marker": { "colorbar": { "ticks": "", "outlinewidth": 0 } } } ], "histogram2d": [ { "type": "histogram2d", "colorbar": { "ticks": "", "outlinewidth": 0 }, "colorscale": [ [ 0.0, "#0d0887" ], [ 0.1111111111111111, "#46039f" ], [ 0.2222222222222222, "#7201a8" ], [ 0.3333333333333333, "#9c179e" ], [ 0.4444444444444444, "#bd3786" ], [ 0.5555555555555556, "#d8576b" ], [ 0.6666666666666666, "#ed7953" ], [ 0.7777777777777778, "#fb9f3a" ], [ 0.8888888888888888, "#fdca26" ], [ 1.0, "#f0f921" ] ] } ], "scatterpolar": [ { "type": "scatterpolar", "marker": { "colorbar": { "ticks": "", "outlinewidth": 0 } } } ], "contourcarpet": [ { "type": "contourcarpet", "colorbar": { "ticks": "", "outlinewidth": 0 } } ], "scattercarpet": [ { "type": "scattercarpet", "marker": { "colorbar": { "ticks": "", "outlinewidth": 0 } } } ], "scattermapbox": [ { "type": "scattermapbox", "marker": { "colorbar": { "ticks": "", "outlinewidth": 0 } } } ], "scatterpolargl": [ { "type": "scatterpolargl", "marker": { "colorbar": { "ticks": "", "outlinewidth": 0 } } } ], "scatterternary": [ { "type": "scatterternary", "marker": { "colorbar": { "ticks": "", "outlinewidth": 0 } } } ], "histogram2dcontour": [ { "type": "histogram2dcontour", "colorbar": { "ticks": "", "outlinewidth": 0 }, "colorscale": [ [ 0.0, "#0d0887" ], [ 0.1111111111111111, "#46039f" ], [ 0.2222222222222222, "#7201a8" ], [ 0.3333333333333333, "#9c179e" ], [ 0.4444444444444444, "#bd3786" ], [ 0.5555555555555556, "#d8576b" ], [ 0.6666666666666666, "#ed7953" ], [ 0.7777777777777778, "#fb9f3a" ], [ 0.8888888888888888, "#fdca26" ], [ 1.0, "#f0f921" ] ] } ] }, "layout": { "geo": { "bgcolor": "white", "showland": true, "lakecolor": "white", "landcolor": "#E5ECF6", "showlakes": true, "subunitcolor": "white" }, "font": { "color": "#2a3f5f" }, "polar": { "bgcolor": "#E5ECF6", "radialaxis": { "ticks": "", "gridcolor": "white", "linecolor": "white" }, "angularaxis": { "ticks": "", "gridcolor": "white", "linecolor": "white" } }, "scene": { "xaxis": { "ticks": "", "gridcolor": "white", "gridwidth": 2, "linecolor": "white", "zerolinecolor": "white", "showbackground": true, "backgroundcolor": "#E5ECF6" }, "yaxis": { "ticks": "", "gridcolor": "white", "gridwidth": 2, "linecolor": "white", "zerolinecolor": "white", "showbackground": true, "backgroundcolor": "#E5ECF6" }, "zaxis": { "ticks": "", "gridcolor": "white", "gridwidth": 2, "linecolor": "white", "zerolinecolor": "white", "showbackground": true, "backgroundcolor": "#E5ECF6" } }, "title": { "x": 0.05 }, "xaxis": { "ticks": "", "title": { "standoff": 15 }, "gridcolor": "white", "linecolor": "white", "automargin": true, "zerolinecolor": "white", "zerolinewidth": 2 }, "yaxis": { "ticks": "", "title": { "standoff": 15 }, "gridcolor": "white", "linecolor": "white", "automargin": true, "zerolinecolor": "white", "zerolinewidth": 2 }, "mapbox": { "style": "light" }, "ternary": { "aaxis": { "ticks": "", "gridcolor": "white", "linecolor": "white" }, "baxis": { "ticks": "", "gridcolor": "white", "linecolor": "white" }, "caxis": { "ticks": "", "gridcolor": "white", "linecolor": "white" }, "bgcolor": "#E5ECF6" }, "colorway": [ "#636efa", "#EF553B", "#00cc96", "#ab63fa", "#FFA15A", "#19d3f3", "#FF6692", "#B6E880", "#FF97FF", "#FECB52" ], "coloraxis": { "colorbar": { "ticks": "", "outlinewidth": 0 } }, "hovermode": "closest", "colorscale": { "diverging": [ [ 0, "#8e0152" ], [ 0.1, "#c51b7d" ], [ 0.2, "#de77ae" ], [ 0.3, "#f1b6da" ], [ 0.4, "#fde0ef" ], [ 0.5, "#f7f7f7" ], [ 0.6, "#e6f5d0" ], [ 0.7, "#b8e186" ], [ 0.8, "#7fbc41" ], [ 0.9, "#4d9221" ], [ 1, "#276419" ] ], "sequential": [ [ 0.0, "#0d0887" ], [ 0.1111111111111111, "#46039f" ], [ 0.2222222222222222, "#7201a8" ], [ 0.3333333333333333, "#9c179e" ], [ 0.4444444444444444, "#bd3786" ], [ 0.5555555555555556, "#d8576b" ], [ 0.6666666666666666, "#ed7953" ], [ 0.7777777777777778, "#fb9f3a" ], [ 0.8888888888888888, "#fdca26" ], [ 1.0, "#f0f921" ] ], "sequentialminus": [ [ 0.0, "#0d0887" ], [ 0.1111111111111111, "#46039f" ], [ 0.2222222222222222, "#7201a8" ], [ 0.3333333333333333, "#9c179e" ], [ 0.4444444444444444, "#bd3786" ], [ 0.5555555555555556, "#d8576b" ], [ 0.6666666666666666, "#ed7953" ], [ 0.7777777777777778, "#fb9f3a" ], [ 0.8888888888888888, "#fdca26" ], [ 1.0, "#f0f921" ] ] }, "hoverlabel": { "align": "left" }, "plot_bgcolor": "#E5ECF6", "paper_bgcolor": "white", "shapedefaults": { "line": { "color": "#2a3f5f" } }, "autotypenumbers": "strict", "annotationdefaults": { "arrowhead": 0, "arrowcolor": "#2a3f5f", "arrowwidth": 1 } } }, "plot_bgcolor": "#F5F6F9", "paper_bgcolor": "#F5F6F9" } }, "height": null, "width": null, "user": { "profile_url": "https://chart-studio.plotly.com/~wizman26", "avatar_url": "https://storage.googleapis.com/plotly-prod-profiles/81.jpg", "background_url": "https://storage.googleapis.com/plotly-prod-profiles/bg-10.jpg", "bio": "", "nickname": "", "website": "", "stream_tokens": null, "feature_set_id": null, "csrf_token": null, "date_joined": "2024-08-08 10:55:26", "mapbox_access_tokens": null, "has_password": null, "username": "wizman26", "email": null, "is_active": null, "readonly": null, "is_dash_creator": null, "dash_created_count": null, "is_chart_creator": null, "charts_created_count": null } } ] }
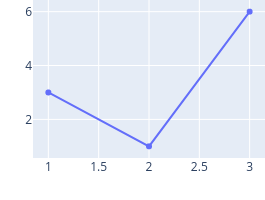
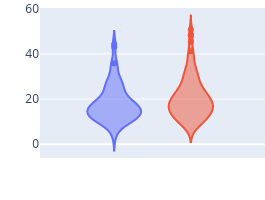
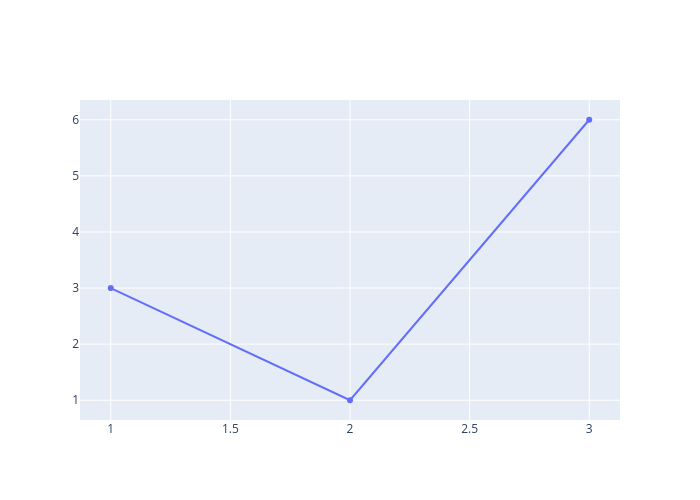