Plots List
Plots
This endpoint handles manipulation of Plotly plot files.
Reference
Authorization
Any user with or without a Plotly account may view public plots. For private plots, see authentication.
Actions
list
Listing all public plots can be done via a GET request to this endpoint.
By default, plots will be listed in order of date created. The order_by
query parameter is accepted at this endpoint. Currently, only ordering by
views is supported. It is possible to filter the plots by quality
with min_quality or max_quality as query parameter.
Example:
// GET https://api.plotly.com/v2/plots/ ---> 200

// GET https://api.plotly.com/v2/plots/?order_by=-views ---> 200

// GET https://api.plotly.com/v2/plots/?min_quality=5 ---> 200

// GET https://api.plotly.com/v2/plots/?max_quality=5 ---> 200
feed
Listing all handpicked feed plots can be done via a GET request to this endpoint. By default, plots will be listed in a random order.
Example:
// GET https://api.plotly.com/v2/plots/feed ---> 200
create
You can create new plot resources here. The only required field is 'figure'. Currently, the figure is restricted to only contain references to grid data. That is, this will fail if raw data arrays are passed in. To create and manipulate underlying grids for plots, see the grids endpoint.
Example:
// This fails because a figure field is required.
// POST https://api.plotly.com/v2/plots ---> 400 Bad Request
{}

// This fails because the figure has raw data
//POST https://api.plotly.com/v2/plots ---> 400 Bad Request
{
    "figure": {"data": [{"y": ['this', 'is', 'raw', 'data']}]}
}

// This succeeds because the figure has src keys, not raw data.
//POST https://api.plotly.com/v2/plots ---> 200 OK
{
    "figure": {"data": [{"ysrc": "sven:88:u8nd62"}]}
}
When creating a grid, you can optionally specify a source_fid to specify where a plot has come from:
- source_fid: the fid of a plot that was copied (and presumably edited) to produce this one
detail
There is a lot of meta information stored about plot files including filename, title, share_url, and content_url to name a few.
This information can only be reached with a GET to this endpoint.
Example:
// GET https://api.plotly.com/v2/plots/iheartgraphs:90
content
The contents of a plot can be downloaded via the content resource. The plot
content contains referenced grid/column data by default. If you wish to
return the raw grid/column data, the inline_data=true query must be included
in the request url. The Content-Type header will be appropriately set for the
response body.
Alternatively, you can set ?map_data=unreadable to append a mapping of
sources to data that belongs to grids which are unreadable for the
requestor. This is useful when you have read access to another users plot,
but that plot contains grid references which you don't have access to.
Examples:
// Returns referenced grid/column data
// GET https://api.plotly.com/v2/plots/iheartgraphs:90/content ---> 200 OK

// Returns full grid/column data
// GET https://api.plotly.com/v2/plots/iheartgraphs:90/content?inline_data=true ---> 200 OK

// Returns full grid/column data when requestor doesn't have permission
// to read the referenced grid.
// GET https://api.plotly.com/v2/plots/iheartgraphs:90/content?map_data=unreadable ---> 200 OK
GET /v2/plots/?cursor=cj0xJnA9MjAyNS0wNy0xMisyMyUzQTA2JTNBNTguNTg2MzkyJTJCMDAlM0EwMA%3D%3D&format=api
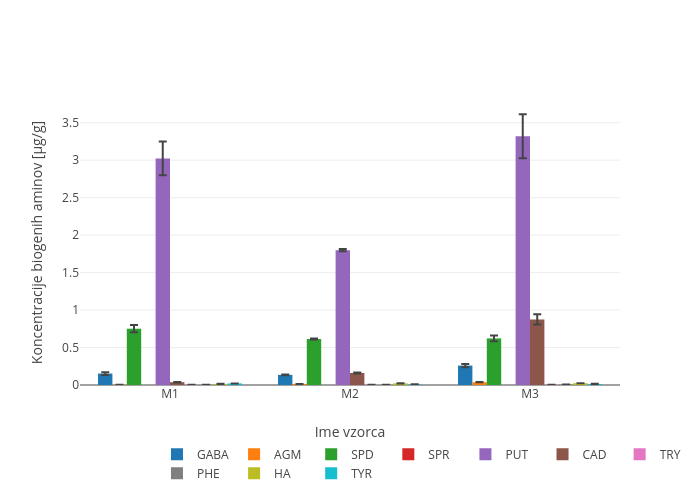
{ "next": "https://api.plotly.com/v2/plots/?cursor=cD0yMDI1LTA3LTEzKzAwJTNBMzElM0EzNi4zMTY1NTElMkIwMCUzQTAw&format=api", "previous": null, "results": [ { "creation_time": "2025-07-13T15:15:13.407661Z", "comments": { "results": [], "count": 0 }, "parented": true, "embed_url": "https://chart-studio.plotly.com/~sahaluddin/1.embed", "fid": "sahaluddin:1", "filename": "Plot 1", "filetype": "plot", "img_url": "https://api.plotly.com/v2/files/sahaluddin:1/image?image_name=list-thumb", "image_urls": { "default": "https://storage.googleapis.com/plotly-prod-images/sahaluddin/1/2_MWSJLMIIPVNHQWIR2QLBXK8P88TS5X.png", "block-thumb": "https://storage.googleapis.com/plotly-prod-images/sahaluddin/1/8_I2OKWXT0045JZQCE3NJLGGB8DWT402.png", "list-thumb": "https://api.plotly.com/v2/files/sahaluddin:1/image?image_name=list-thumb" }, "api_urls": { "files": "https://api.plotly.com/v2/files/sahaluddin:1", "plots": "https://api.plotly.com/v2/plots/sahaluddin:1", "parent": "https://api.plotly.com/v2/folders/home?user=sahaluddin" }, "owner": "sahaluddin", "parent": -1, "preview": "", "referencers": [], "references": [], "title": "", "views": 0, "web_url": "https://chart-studio.plotly.com/~sahaluddin/1/", "world_readable": true, "date_modified": "2025-07-13T15:15:13.419Z", "stars": { "results": [], "count": 0 }, "collaborators": { "results": [], "count": 0 }, "subfolder_count": null, "refresh_interval": null, "organize_view_url": "https://chart-studio.plotly.com/~sahaluddin/1/", "current_user_permission": "read", "is_theme": null, "is_template": false, "autosize": true, "caption": "", "figure": { "data": [ { "meta": { "columnNames": { "x": "data.0.x", "y": "data.0.y" } }, "type": "bar", "xsrc": "sahaluddin:0:14a0bf", "ysrc": "sahaluddin:0:c0492e" } ], "frames": [], "layout": { "xaxis": { "type": "category", "range": [ -0.5, 20.5 ], "autorange": true }, "yaxis": { "type": "linear", "range": [ 0, 61.05263157894737 ], "autorange": true }, "template": { "data": { "bar": [ { "type": "bar", "marker": { "colorbar": { "ticks": "", "outlinewidth": 0 } } } ], "table": [ { "type": "table", "cells": { "fill": { "color": "#506784" }, "line": { "color": "rgb(17,17,17)" } }, "header": { "fill": { "color": "#2a3f5f" }, "line": { "color": "rgb(17,17,17)" } } } ], "carpet": [ { "type": "carpet", "aaxis": { "gridcolor": "#506784", "linecolor": "#506784", "endlinecolor": "#A2B1C6", "minorgridcolor": "#506784", "startlinecolor": "#A2B1C6" }, "baxis": { "gridcolor": "#506784", "linecolor": "#506784", "endlinecolor": "#A2B1C6", "minorgridcolor": "#506784", "startlinecolor": "#A2B1C6" } } ], "mesh3d": [ { "type": "mesh3d", "colorbar": { "ticks": "", "outlinewidth": 0 } } ], "contour": [ { "type": "contour", "colorbar": { "ticks": "", "outlinewidth": 0 }, "autocolorscale": true } ], "heatmap": [ { "type": "heatmap", "colorbar": { "ticks": "", "outlinewidth": 0 }, "autocolorscale": true } ], "scatter": [ { "type": "scatter", "marker": { "colorbar": { "ticks": "", "outlinewidth": 0 } } } ], "surface": [ { "type": "surface", "colorbar": { "ticks": "", "outlinewidth": 0 } } ], "heatmapgl": [ { "type": "heatmapgl", "colorbar": { "ticks": "", "outlinewidth": 0 } } ], "histogram": [ { "type": "histogram", "marker": { "colorbar": { "ticks": "", "outlinewidth": 0 } } } ], "parcoords": [ { "line": { "colorbar": { "ticks": "", "outlinewidth": 0 } }, "type": "parcoords" } ], "scatter3d": [ { "type": "scatter3d", "marker": { "colorbar": { "ticks": "", "outlinewidth": 0 } } } ], "scattergl": [ { "type": "scattergl", "marker": { "colorbar": { "ticks": "", "outlinewidth": 0 } } } ], "choropleth": [ { "type": "choropleth", "colorbar": { "ticks": "", "outlinewidth": 0 } } ], "scattergeo": [ { "type": "scattergeo", "marker": { "colorbar": { "ticks": "", "outlinewidth": 0 } } } ], "histogram2d": [ { "type": "histogram2d", "colorbar": { "ticks": "", "outlinewidth": 0 }, "autocolorscale": true } ], "scatterpolar": [ { "type": "scatterpolar", "marker": { "colorbar": { "ticks": "", "outlinewidth": 0 } } } ], "contourcarpet": [ { "type": "contourcarpet", "colorbar": { "ticks": "", "outlinewidth": 0 } } ], "scattercarpet": [ { "type": "scattercarpet", "marker": { "colorbar": { "ticks": "", "outlinewidth": 0 } } } ], "scattermapbox": [ { "type": "scattermapbox", "marker": { "colorbar": { "ticks": "", "outlinewidth": 0 } } } ], "scatterpolargl": [ { "type": "scatterpolargl", "marker": { "colorbar": { "ticks": "", "outlinewidth": 0 } } } ], "scatterternary": [ { "type": "scatterternary", "marker": { "colorbar": { "ticks": "", "outlinewidth": 0 } } } ], "histogram2dcontour": [ { "type": "histogram2dcontour", "colorbar": { "ticks": "", "outlinewidth": 0 }, "autocolorscale": true } ] }, "layout": { "geo": { "bgcolor": "rgb(17,17,17)", "showland": true, "lakecolor": "rgb(17,17,17)", "landcolor": "rgb(17,17,17)", "showlakes": true, "subunitcolor": "#506784" }, "font": { "color": "#f2f5fa" }, "polar": { "bgcolor": "rgb(17,17,17)", "radialaxis": { "ticks": "", "gridcolor": "#506784", "linecolor": "#506784" }, "angularaxis": { "ticks": "", "gridcolor": "#506784", "linecolor": "#506784" } }, "scene": { "xaxis": { "ticks": "", "gridcolor": "#506784", "gridwidth": 2, "linecolor": "#506784", "zerolinecolor": "#C8D4E3", "showbackground": true, "backgroundcolor": "rgb(17,17,17)" }, "yaxis": { "ticks": "", "gridcolor": "#506784", "gridwidth": 2, "linecolor": "#506784", "zerolinecolor": "#C8D4E3", "showbackground": true, "backgroundcolor": "rgb(17,17,17)" }, "zaxis": { "ticks": "", "gridcolor": "#506784", "gridwidth": 2, "linecolor": "#506784", "zerolinecolor": "#C8D4E3", "showbackground": true, "backgroundcolor": "rgb(17,17,17)" } }, "title": { "x": 0.05 }, "xaxis": { "ticks": "", "gridcolor": "#283442", "linecolor": "#506784", "automargin": true, "zerolinecolor": "#283442", "zerolinewidth": 2 }, "yaxis": { "ticks": "", "gridcolor": "#283442", "linecolor": "#506784", "automargin": true, "zerolinecolor": "#283442", "zerolinewidth": 2 }, "ternary": { "aaxis": { "ticks": "", "gridcolor": "#506784", "linecolor": "#506784" }, "baxis": { "ticks": "", "gridcolor": "#506784", "linecolor": "#506784" }, "caxis": { "ticks": "", "gridcolor": "#506784", "linecolor": "#506784" }, "bgcolor": "rgb(17,17,17)" }, "colorway": [ "#636efa", "#EF553B", "#00cc96", "#ab63fa", "#19d3f3", "#e763fa", "#fecb52", "#ffa15a", "#ff6692", "#b6e880" ], "hovermode": "closest", "colorscale": { "diverging": [ [ 0, "#8e0152" ], [ 0.1, "#c51b7d" ], [ 0.2, "#de77ae" ], [ 0.3, "#f1b6da" ], [ 0.4, "#fde0ef" ], [ 0.5, "#f7f7f7" ], [ 0.6, "#e6f5d0" ], [ 0.7, "#b8e186" ], [ 0.8, "#7fbc41" ], [ 0.9, "#4d9221" ], [ 1, "#276419" ] ], "sequential": [ [ 0, "#0508b8" ], [ 0.0893854748603352, "#1910d8" ], [ 0.1787709497206704, "#3c19f0" ], [ 0.2681564245810056, "#6b1cfb" ], [ 0.3575418994413408, "#981cfd" ], [ 0.44692737430167595, "#bf1cfd" ], [ 0.5363128491620112, "#dd2bfd" ], [ 0.6256983240223464, "#f246fe" ], [ 0.7150837988826816, "#fc67fd" ], [ 0.8044692737430168, "#fe88fc" ], [ 0.8938547486033519, "#fea5fd" ], [ 0.9832402234636871, "#febefe" ], [ 1, "#fec3fe" ] ], "sequentialminus": [ [ 0, "#0508b8" ], [ 0.0893854748603352, "#1910d8" ], [ 0.1787709497206704, "#3c19f0" ], [ 0.2681564245810056, "#6b1cfb" ], [ 0.3575418994413408, "#981cfd" ], [ 0.44692737430167595, "#bf1cfd" ], [ 0.5363128491620112, "#dd2bfd" ], [ 0.6256983240223464, "#f246fe" ], [ 0.7150837988826816, "#fc67fd" ], [ 0.8044692737430168, "#fe88fc" ], [ 0.8938547486033519, "#fea5fd" ], [ 0.9832402234636871, "#febefe" ], [ 1, "#fec3fe" ] ] }, "plot_bgcolor": "rgb(17,17,17)", "paper_bgcolor": "rgb(17,17,17)", "shapedefaults": { "line": { "width": 0 }, "opacity": 0.4, "fillcolor": "#f2f5fa" }, "sliderdefaults": { "bgcolor": "#C8D4E3", "tickwidth": 0, "bordercolor": "rgb(17,17,17)", "borderwidth": 1 }, "annotationdefaults": { "arrowhead": 0, "arrowcolor": "#f2f5fa", "arrowwidth": 1 }, "updatemenudefaults": { "bgcolor": "#506784", "borderwidth": 0 } }, "themeRef": "PLOTLY_DARK" } } }, "height": null, "width": null, "user": { "profile_url": "https://chart-studio.plotly.com/~sahaluddin", "avatar_url": "https://storage.googleapis.com/plotly-prod-profiles/85.jpg", "background_url": "https://storage.googleapis.com/plotly-prod-profiles/bg-11.jpg", "bio": "", "nickname": "", "website": "", "stream_tokens": null, "feature_set_id": null, "csrf_token": null, "date_joined": "2025-07-13 15:13:55", "mapbox_access_tokens": null, "has_password": null, "username": "sahaluddin", "email": null, "is_active": null, "readonly": null, "is_dash_creator": null, "dash_created_count": null, "is_chart_creator": null, "charts_created_count": null } }, { "creation_time": "2025-07-13T14:54:09.437585Z", "comments": { "results": [], "count": 0 }, "parented": true, "embed_url": "https://chart-studio.plotly.com/~Vinispira/1.embed", "fid": "Vinispira:1", "filename": "Plot 1", "filetype": "plot", "img_url": "https://api.plotly.com/v2/files/Vinispira:1/image?image_name=list-thumb", "image_urls": { "default": "https://storage.googleapis.com/plotly-prod-images/Vinispira/1/2_D6M41TWVFGVHEZ2YF818QOG8TCMB3R.png", "block-thumb": "https://storage.googleapis.com/plotly-prod-images/Vinispira/1/8_GGQA2BCRK5W6RJGAVYND8KV8TGUGGQ.png", "list-thumb": "https://api.plotly.com/v2/files/Vinispira:1/image?image_name=list-thumb" }, "api_urls": { "files": "https://api.plotly.com/v2/files/Vinispira:1", "plots": "https://api.plotly.com/v2/plots/Vinispira:1", "parent": "https://api.plotly.com/v2/folders/home?user=Vinispira" }, "owner": "Vinispira", "parent": -1, "preview": "", "referencers": [], "references": [], "title": "", "views": 0, "web_url": "https://chart-studio.plotly.com/~Vinispira/1/", "world_readable": true, "date_modified": "2025-07-13T14:54:09.448Z", "stars": { "results": [], "count": 0 }, "collaborators": { "results": [], "count": 0 }, "subfolder_count": null, "refresh_interval": null, "organize_view_url": "https://chart-studio.plotly.com/~Vinispira/1/", "current_user_permission": "read", "is_theme": null, "is_template": false, "autosize": true, "caption": "", "figure": { "data": [ { "uid": "72e6b442-c1f9-11e8-96c2-c869cda04ed6", "meta": { "columnNames": { "r": "11-14 m/s, r", "text": "11-14 m/s, text; 8-11 m/s, text; 5-8 m/s, text; < 5 m/s, text" } }, "name": "11-14 m/s", "rsrc": "Vinispira:0:ab347c", "type": "barpolar", "marker": { "color": "rgb(106,81,163)" }, "textsrc": "Vinispira:0:70c651" }, { "uid": "72e6b654-c1f9-11e8-ba85-c869cda04ed6", "meta": { "columnNames": { "r": "8-11 m/s, r", "text": "11-14 m/s, text; 8-11 m/s, text; 5-8 m/s, text; < 5 m/s, text" } }, "name": "8-11 m/s", "rsrc": "Vinispira:0:210e1f", "type": "barpolar", "marker": { "color": "rgb(158,154,200)" }, "textsrc": "Vinispira:0:70c651" } ], "frames": [], "layout": { "font": { "size": 16 }, "polar": { "radialaxis": { "type": "linear", "range": [ 0, 142.10526315789474 ], "autorange": true }, "angularaxis": {} }, "title": { "text": "Wind Speed Distribution in Laurel, NE" }, "legend": { "font": { "size": 16 } }, "autosize": true, "radialaxis": { "ticksuffix": "%" }, "orientation": -90 } }, "height": null, "width": null, "user": { "profile_url": "https://chart-studio.plotly.com/~Vinispira", "avatar_url": "https://storage.googleapis.com/plotly-prod-profiles/48.jpg", "background_url": "https://storage.googleapis.com/plotly-prod-profiles/bg-10.jpg", "bio": "", "nickname": "", "website": "", "stream_tokens": null, "feature_set_id": null, "csrf_token": null, "date_joined": "2025-07-13 14:52:06", "mapbox_access_tokens": null, "has_password": null, "username": "Vinispira", "email": null, "is_active": null, "readonly": null, "is_dash_creator": null, "dash_created_count": null, "is_chart_creator": null, "charts_created_count": null } }, { "creation_time": "2025-07-13T11:26:30.703824Z", "comments": { "results": [], "count": 0 }, "parented": true, "embed_url": "https://chart-studio.plotly.com/~MrMau12/1.embed", "fid": "MrMau12:1", "filename": "Plot 1", "filetype": "plot", "img_url": "https://api.plotly.com/v2/files/MrMau12:1/image?image_name=list-thumb", "image_urls": { "default": "https://storage.googleapis.com/plotly-prod-images/MrMau12/1/2_K42F0H3ULSNQUKAZ0S0D4IY0H7HSZK.png", "block-thumb": "https://storage.googleapis.com/plotly-prod-images/MrMau12/1/8_6LRGVA0PYSONHGZO2I58ZKIP7WAY2Y.png", "list-thumb": "https://api.plotly.com/v2/files/MrMau12:1/image?image_name=list-thumb" }, "api_urls": { "files": "https://api.plotly.com/v2/files/MrMau12:1", "plots": "https://api.plotly.com/v2/plots/MrMau12:1", "parent": "https://api.plotly.com/v2/folders/home?user=MrMau12" }, "owner": "MrMau12", "parent": -1, "preview": "", "referencers": [], "references": [], "title": "", "views": 0, "web_url": "https://chart-studio.plotly.com/~MrMau12/1/", "world_readable": true, "date_modified": "2025-07-13T11:26:30.715Z", "stars": { "results": [], "count": 0 }, "collaborators": { "results": [], "count": 0 }, "subfolder_count": null, "refresh_interval": null, "organize_view_url": "https://chart-studio.plotly.com/~MrMau12/1/", "current_user_permission": "read", "is_theme": null, "is_template": false, "autosize": true, "caption": "", "figure": { "data": [ { "line": { "color": "rgb(138, 144, 218)" }, "meta": { "columnNames": { "x": "granularity - batchOrSectionSize", "y": "runtime" } }, "mode": "markers", "type": "box", "xsrc": "MrMau12:0:6c3379,423a84*", "ysrc": "MrMau12:0:153fbc", "boxpoints": false, "orientation": "v" } ], "frames": [], "layout": { "title": { "text": "Runtime for N-Batch Deletion" }, "xaxis": { "side": "bottom", "type": "multicategory", "range": [ -0.5, 14.5 ], "title": { "text": "" }, "anchor": "y", "domain": [ 0, 1 ], "autorange": false }, "yaxis": { "side": "left", "type": "linear", "range": [ -106.39361111111123, 2036.8186111111113 ], "title": { "text": "Runtime in seconds" }, "domain": [ 0, 1 ], "autorange": false }, "autosize": true, "template": { "data": { "bar": [ { "type": "bar", "marker": { "colorbar": { "ticks": "", "outlinewidth": 0 } } } ], "table": [ { "type": "table", "cells": { "fill": { "color": "#EBF0F8" }, "line": { "color": "white" } }, "header": { "fill": { "color": "#C8D4E3" }, "line": { "color": "white" } } } ], "carpet": [ { "type": "carpet", "aaxis": { "gridcolor": "#C8D4E3", "linecolor": "#C8D4E3", "endlinecolor": "#2a3f5f", "minorgridcolor": "#C8D4E3", "startlinecolor": "#2a3f5f" }, "baxis": { "gridcolor": "#C8D4E3", "linecolor": "#C8D4E3", "endlinecolor": "#2a3f5f", "minorgridcolor": "#C8D4E3", "startlinecolor": "#2a3f5f" } } ], "mesh3d": [ { "type": "mesh3d", "colorbar": { "ticks": "", "outlinewidth": 0 } } ], "contour": [ { "type": "contour", "colorbar": { "ticks": "", "outlinewidth": 0 }, "autocolorscale": true } ], "heatmap": [ { "type": "heatmap", "colorbar": { "ticks": "", "outlinewidth": 0 }, "autocolorscale": true } ], "scatter": [ { "type": "scatter", "marker": { "colorbar": { "ticks": "", "outlinewidth": 0 } } } ], "surface": [ { "type": "surface", "colorbar": { "ticks": "", "outlinewidth": 0 } } ], "heatmapgl": [ { "type": "heatmapgl", "colorbar": { "ticks": "", "outlinewidth": 0 } } ], "histogram": [ { "type": "histogram", "marker": { "colorbar": { "ticks": "", "outlinewidth": 0 } } } ], "parcoords": [ { "line": { "colorbar": { "ticks": "", "outlinewidth": 0 } }, "type": "parcoords" } ], "scatter3d": [ { "type": "scatter3d", "marker": { "colorbar": { "ticks": "", "outlinewidth": 0 } } } ], "scattergl": [ { "type": "scattergl", "marker": { "colorbar": { "ticks": "", "outlinewidth": 0 } } } ], "choropleth": [ { "type": "choropleth", "colorbar": { "ticks": "", "outlinewidth": 0 } } ], "scattergeo": [ { "type": "scattergeo", "marker": { "colorbar": { "ticks": "", "outlinewidth": 0 } } } ], "histogram2d": [ { "type": "histogram2d", "colorbar": { "ticks": "", "outlinewidth": 0 }, "autocolorscale": true } ], "scatterpolar": [ { "type": "scatterpolar", "marker": { "colorbar": { "ticks": "", "outlinewidth": 0 } } } ], "contourcarpet": [ { "type": "contourcarpet", "colorbar": { "ticks": "", "outlinewidth": 0 } } ], "scattercarpet": [ { "type": "scattercarpet", "marker": { "colorbar": { "ticks": "", "outlinewidth": 0 } } } ], "scattermapbox": [ { "type": "scattermapbox", "marker": { "colorbar": { "ticks": "", "outlinewidth": 0 } } } ], "scatterpolargl": [ { "type": "scatterpolargl", "marker": { "colorbar": { "ticks": "", "outlinewidth": 0 } } } ], "scatterternary": [ { "type": "scatterternary", "marker": { "colorbar": { "ticks": "", "outlinewidth": 0 } } } ], "histogram2dcontour": [ { "type": "histogram2dcontour", "colorbar": { "ticks": "", "outlinewidth": 0 }, "autocolorscale": true } ] }, "layout": { "geo": { "bgcolor": "white", "showland": true, "lakecolor": "white", "landcolor": "white", "showlakes": true, "subunitcolor": "#C8D4E3" }, "font": { "color": "#2a3f5f" }, "polar": { "bgcolor": "white", "radialaxis": { "ticks": "", "gridcolor": "#EBF0F8", "linecolor": "#EBF0F8" }, "angularaxis": { "ticks": "", "gridcolor": "#EBF0F8", "linecolor": "#EBF0F8" } }, "scene": { "xaxis": { "ticks": "", "gridcolor": "#DFE8F3", "gridwidth": 2, "linecolor": "#EBF0F8", "zerolinecolor": "#EBF0F8", "showbackground": true, "backgroundcolor": "white" }, "yaxis": { "ticks": "", "gridcolor": "#DFE8F3", "gridwidth": 2, "linecolor": "#EBF0F8", "zerolinecolor": "#EBF0F8", "showbackground": true, "backgroundcolor": "white" }, "zaxis": { "ticks": "", "gridcolor": "#DFE8F3", "gridwidth": 2, "linecolor": "#EBF0F8", "zerolinecolor": "#EBF0F8", "showbackground": true, "backgroundcolor": "white" } }, "title": { "x": 0.05 }, "xaxis": { "ticks": "", "gridcolor": "#EBF0F8", "linecolor": "#EBF0F8", "automargin": true, "zerolinecolor": "#EBF0F8", "zerolinewidth": 2 }, "yaxis": { "ticks": "", "gridcolor": "#EBF0F8", "linecolor": "#EBF0F8", "automargin": true, "zerolinecolor": "#EBF0F8", "zerolinewidth": 2 }, "ternary": { "aaxis": { "ticks": "", "gridcolor": "#DFE8F3", "linecolor": "#A2B1C6" }, "baxis": { "ticks": "", "gridcolor": "#DFE8F3", "linecolor": "#A2B1C6" }, "caxis": { "ticks": "", "gridcolor": "#DFE8F3", "linecolor": "#A2B1C6" }, "bgcolor": "white" }, "colorway": [ "#636efa", "#EF553B", "#00cc96", "#ab63fa", "#19d3f3", "#e763fa", "#fecb52", "#ffa15a", "#ff6692", "#b6e880" ], "hovermode": "closest", "colorscale": { "diverging": [ [ 0, "#8e0152" ], [ 0.1, "#c51b7d" ], [ 0.2, "#de77ae" ], [ 0.3, "#f1b6da" ], [ 0.4, "#fde0ef" ], [ 0.5, "#f7f7f7" ], [ 0.6, "#e6f5d0" ], [ 0.7, "#b8e186" ], [ 0.8, "#7fbc41" ], [ 0.9, "#4d9221" ], [ 1, "#276419" ] ], "sequential": [ [ 0, "#0508b8" ], [ 0.0893854748603352, "#1910d8" ], [ 0.1787709497206704, "#3c19f0" ], [ 0.2681564245810056, "#6b1cfb" ], [ 0.3575418994413408, "#981cfd" ], [ 0.44692737430167595, "#bf1cfd" ], [ 0.5363128491620112, "#dd2bfd" ], [ 0.6256983240223464, "#f246fe" ], [ 0.7150837988826816, "#fc67fd" ], [ 0.8044692737430168, "#fe88fc" ], [ 0.8938547486033519, "#fea5fd" ], [ 0.9832402234636871, "#febefe" ], [ 1, "#fec3fe" ] ], "sequentialminus": [ [ 0, "#0508b8" ], [ 0.0893854748603352, "#1910d8" ], [ 0.1787709497206704, "#3c19f0" ], [ 0.2681564245810056, "#6b1cfb" ], [ 0.3575418994413408, "#981cfd" ], [ 0.44692737430167595, "#bf1cfd" ], [ 0.5363128491620112, "#dd2bfd" ], [ 0.6256983240223464, "#f246fe" ], [ 0.7150837988826816, "#fc67fd" ], [ 0.8044692737430168, "#fe88fc" ], [ 0.8938547486033519, "#fea5fd" ], [ 0.9832402234636871, "#febefe" ], [ 1, "#fec3fe" ] ] }, "plot_bgcolor": "white", "paper_bgcolor": "white", "shapedefaults": { "line": { "width": 0 }, "opacity": 0.4, "fillcolor": "#506784" }, "annotationdefaults": { "arrowhead": 0, "arrowcolor": "#506784", "arrowwidth": 1 } }, "themeRef": "PLOTLY_WHITE" }, "hovermode": "x" } }, "height": null, "width": null, "user": { "profile_url": "https://chart-studio.plotly.com/~MrMau12", "avatar_url": "https://storage.googleapis.com/plotly-prod-profiles/45.jpg", "background_url": "https://storage.googleapis.com/plotly-prod-profiles/bg-9.jpg", "bio": "", "nickname": "", "website": "", "stream_tokens": null, "feature_set_id": null, "csrf_token": null, "date_joined": "2025-07-13 10:50:24", "mapbox_access_tokens": null, "has_password": null, "username": "MrMau12", "email": null, "is_active": null, "readonly": null, "is_dash_creator": null, "dash_created_count": null, "is_chart_creator": null, "charts_created_count": null } }, { "creation_time": "2025-07-13T10:35:24.019800Z", "comments": { "results": [], "count": 0 }, "parented": true, "embed_url": "https://chart-studio.plotly.com/~MKPOLAT/1.embed", "fid": "MKPOLAT:1", "filename": "Plot 1", "filetype": "plot", "img_url": "https://api.plotly.com/v2/files/MKPOLAT:1/image?image_name=list-thumb", "image_urls": { "default": "https://storage.googleapis.com/plotly-prod-images/MKPOLAT/1/2_O3B47U155G2C65PERQVYKXQ5C83PWU.png", "block-thumb": "https://storage.googleapis.com/plotly-prod-images/MKPOLAT/1/8_604HBY0YNVMG4I1GQ38OWPAKVIPRN8.png", "list-thumb": "https://api.plotly.com/v2/files/MKPOLAT:1/image?image_name=list-thumb" }, "api_urls": { "files": "https://api.plotly.com/v2/files/MKPOLAT:1", "plots": "https://api.plotly.com/v2/plots/MKPOLAT:1", "parent": "https://api.plotly.com/v2/folders/home?user=MKPOLAT" }, "owner": "MKPOLAT", "parent": -1, "preview": "", "referencers": [], "references": [], "title": "", "views": 0, "web_url": "https://chart-studio.plotly.com/~MKPOLAT/1/", "world_readable": true, "date_modified": "2025-07-13T10:35:24.031Z", "stars": { "results": [], "count": 0 }, "collaborators": { "results": [], "count": 0 }, "subfolder_count": null, "refresh_interval": null, "organize_view_url": "https://chart-studio.plotly.com/~MKPOLAT/1/", "current_user_permission": "read", "is_theme": null, "is_template": false, "autosize": true, "caption": "", "figure": { "data": [ { "meta": { "columnNames": { "x": "Column 2", "y": "Column 3", "z": "Column 1" } }, "mode": "markers", "type": "scatter3d", "xsrc": "MKPOLAT:0:388833", "ysrc": "MKPOLAT:0:1c2eef", "zsrc": "MKPOLAT:0:0a2969", "marker": { "size": 5, "color": "rgb(239, 42, 20)" } } ], "frames": [], "layout": { "font": { "size": 12 }, "scene": { "xaxis": { "type": "linear", "title": { "text": "EDAD" }, "showline": true, "gridcolor": "rgb(255, 254, 251)" }, "yaxis": { "type": "linear", "title": { "text": "ALTURA (cm)" }, "showline": true }, "zaxis": { "type": "linear", "title": { "text": "NOTAS" }, "showline": true, "showbackground": true, "backgroundcolor": "rgba(209, 223, 173, 0.5)" }, "camera": { "up": { "x": 0, "y": 0, "z": 1 }, "eye": { "x": 1.205538377097011, "y": -0.8288073437253354, "z": 0.7268470991239591 }, "center": { "x": 0, "y": 0, "z": 0 }, "projection": { "type": "perspective" } }, "dragmode": "zoom", "aspectmode": "auto", "aspectratio": { "x": 0.8533305183172075, "y": 1.1103277212022142, "z": 1.0554351147607566 } }, "title": { "text": "SCATTER 3D" }, "xaxis": { "type": "linear", "range": [ 2.637630662020906, 9.362369337979095 ], "autorange": true }, "yaxis": { "type": "linear", "range": [ 2.581892166836216, 9.418107833163784 ], "autorange": true }, "autosize": true, "dragmode": "zoom", "paper_bgcolor": "rgb(255, 255, 255)" } }, "height": null, "width": null, "user": { "profile_url": "https://chart-studio.plotly.com/~MKPOLAT", "avatar_url": "https://storage.googleapis.com/plotly-prod-profiles/59.jpg", "background_url": "https://storage.googleapis.com/plotly-prod-profiles/bg-1.jpg", "bio": "", "nickname": "", "website": "", "stream_tokens": null, "feature_set_id": null, "csrf_token": null, "date_joined": "2025-07-09 21:22:38", "mapbox_access_tokens": null, "has_password": null, "username": "MKPOLAT", "email": null, "is_active": null, "readonly": null, "is_dash_creator": null, "dash_created_count": null, "is_chart_creator": null, "charts_created_count": null } }, { "creation_time": "2025-07-13T09:19:22.860779Z", "comments": { "results": [], "count": 0 }, "parented": true, "embed_url": "https://chart-studio.plotly.com/~nandan123/45.embed", "fid": "nandan123:45", "filename": "Plot 45", "filetype": "plot", "img_url": "https://api.plotly.com/v2/files/nandan123:45/image?image_name=list-thumb", "image_urls": { "default": "https://storage.googleapis.com/plotly-prod-images/nandan123/45/2_5TABWL9TPB0GO9EWCW3XKP46D1E4NX.png", "block-thumb": "https://storage.googleapis.com/plotly-prod-images/nandan123/45/8_IZ2WNEBOA290EDNMXZSGBPF4ENS0UT.png", "list-thumb": "https://api.plotly.com/v2/files/nandan123:45/image?image_name=list-thumb" }, "api_urls": { "files": "https://api.plotly.com/v2/files/nandan123:45", "plots": "https://api.plotly.com/v2/plots/nandan123:45", "parent": "https://api.plotly.com/v2/folders/home?user=nandan123" }, "owner": "nandan123", "parent": -1, "preview": "", "referencers": [], "references": [], "title": "", "views": 0, "web_url": "https://chart-studio.plotly.com/~nandan123/45/", "world_readable": true, "date_modified": "2025-07-13T09:19:22.871Z", "stars": { "results": [], "count": 0 }, "collaborators": { "results": [], "count": 0 }, "subfolder_count": null, "refresh_interval": null, "organize_view_url": "https://chart-studio.plotly.com/~nandan123/45/", "current_user_permission": "read", "is_theme": null, "is_template": false, "autosize": true, "caption": "", "figure": { "data": [ { "meta": { "columnNames": { "x": "A", "y": "B" } }, "mode": "markers+lines", "name": "300 fs", "type": "scatter", "xsrc": "nandan123:41:e5d489", "ysrc": "nandan123:41:41f087" }, { "line": { "dash": "solid" }, "meta": { "columnNames": { "x": "A", "y": "B" } }, "mode": "markers+lines", "name": "500 fs", "type": "scatter", "xsrc": "nandan123:42:f35648", "ysrc": "nandan123:42:028268", "marker": { "symbol": "square" }, "stackgroup": null }, { "meta": { "columnNames": { "x": "A", "y": "B" } }, "mode": "markers+lines", "name": "700 fs", "type": "scatter", "xsrc": "nandan123:43:d09332", "ysrc": "nandan123:43:b6fc26", "marker": { "symbol": "diamond" }, "stackgroup": null }, { "meta": { "columnNames": { "x": "A", "y": "B" } }, "mode": "markers+lines", "name": "1000 fs", "type": "scatter", "xsrc": "nandan123:44:a3790d", "ysrc": "nandan123:44:7e95dd", "marker": { "size": 7, "symbol": "triangle-up" }, "stackgroup": null } ], "frames": [], "layout": { "title": { "text": "516.75 kHz, 200 mm/s" }, "xaxis": { "type": "linear", "range": [ 0, 843.8750091581801 ], "title": { "text": "Pulse Energy (nJ)" }, "autorange": false }, "yaxis": { "type": "linear", "range": [ 0, 50 ], "title": { "text": "Selectivity" }, "autorange": false }, "autosize": true, "template": { "data": { "bar": [ { "type": "bar", "marker": { "colorbar": { "ticks": "", "outlinewidth": 0 } } } ], "table": [ { "type": "table", "cells": { "fill": { "color": "#EBF0F8" }, "line": { "color": "white" } }, "header": { "fill": { "color": "#C8D4E3" }, "line": { "color": "white" } } } ], "carpet": [ { "type": "carpet", "aaxis": { "gridcolor": "#C8D4E3", "linecolor": "#C8D4E3", "endlinecolor": "#2a3f5f", "minorgridcolor": "#C8D4E3", "startlinecolor": "#2a3f5f" }, "baxis": { "gridcolor": "#C8D4E3", "linecolor": "#C8D4E3", "endlinecolor": "#2a3f5f", "minorgridcolor": "#C8D4E3", "startlinecolor": "#2a3f5f" } } ], "mesh3d": [ { "type": "mesh3d", "colorbar": { "ticks": "", "outlinewidth": 0 } } ], "contour": [ { "type": "contour", "colorbar": { "ticks": "", "outlinewidth": 0 }, "autocolorscale": true } ], "heatmap": [ { "type": "heatmap", "colorbar": { "ticks": "", "outlinewidth": 0 }, "autocolorscale": true } ], "scatter": [ { "type": "scatter", "marker": { "colorbar": { "ticks": "", "outlinewidth": 0 } } } ], "surface": [ { "type": "surface", "colorbar": { "ticks": "", "outlinewidth": 0 } } ], "heatmapgl": [ { "type": "heatmapgl", "colorbar": { "ticks": "", "outlinewidth": 0 } } ], "histogram": [ { "type": "histogram", "marker": { "colorbar": { "ticks": "", "outlinewidth": 0 } } } ], "parcoords": [ { "line": { "colorbar": { "ticks": "", "outlinewidth": 0 } }, "type": "parcoords" } ], "scatter3d": [ { "type": "scatter3d", "marker": { "colorbar": { "ticks": "", "outlinewidth": 0 } } } ], "scattergl": [ { "type": "scattergl", "marker": { "colorbar": { "ticks": "", "outlinewidth": 0 } } } ], "choropleth": [ { "type": "choropleth", "colorbar": { "ticks": "", "outlinewidth": 0 } } ], "scattergeo": [ { "type": "scattergeo", "marker": { "colorbar": { "ticks": "", "outlinewidth": 0 } } } ], "histogram2d": [ { "type": "histogram2d", "colorbar": { "ticks": "", "outlinewidth": 0 }, "autocolorscale": true } ], "scatterpolar": [ { "type": "scatterpolar", "marker": { "colorbar": { "ticks": "", "outlinewidth": 0 } } } ], "contourcarpet": [ { "type": "contourcarpet", "colorbar": { "ticks": "", "outlinewidth": 0 } } ], "scattercarpet": [ { "type": "scattercarpet", "marker": { "colorbar": { "ticks": "", "outlinewidth": 0 } } } ], "scattermapbox": [ { "type": "scattermapbox", "marker": { "colorbar": { "ticks": "", "outlinewidth": 0 } } } ], "scatterpolargl": [ { "type": "scatterpolargl", "marker": { "colorbar": { "ticks": "", "outlinewidth": 0 } } } ], "scatterternary": [ { "type": "scatterternary", "marker": { "colorbar": { "ticks": "", "outlinewidth": 0 } } } ], "histogram2dcontour": [ { "type": "histogram2dcontour", "colorbar": { "ticks": "", "outlinewidth": 0 }, "autocolorscale": true } ] }, "layout": { "geo": { "bgcolor": "white", "showland": true, "lakecolor": "white", "landcolor": "white", "showlakes": true, "subunitcolor": "#C8D4E3" }, "font": { "color": "#2a3f5f" }, "polar": { "bgcolor": "white", "radialaxis": { "ticks": "", "gridcolor": "#EBF0F8", "linecolor": "#EBF0F8" }, "angularaxis": { "ticks": "", "gridcolor": "#EBF0F8", "linecolor": "#EBF0F8" } }, "scene": { "xaxis": { "ticks": "", "gridcolor": "#DFE8F3", "gridwidth": 2, "linecolor": "#EBF0F8", "zerolinecolor": "#EBF0F8", "showbackground": true, "backgroundcolor": "white" }, "yaxis": { "ticks": "", "gridcolor": "#DFE8F3", "gridwidth": 2, "linecolor": "#EBF0F8", "zerolinecolor": "#EBF0F8", "showbackground": true, "backgroundcolor": "white" }, "zaxis": { "ticks": "", "gridcolor": "#DFE8F3", "gridwidth": 2, "linecolor": "#EBF0F8", "zerolinecolor": "#EBF0F8", "showbackground": true, "backgroundcolor": "white" } }, "title": { "x": 0.05 }, "xaxis": { "ticks": "", "gridcolor": "#EBF0F8", "linecolor": "#EBF0F8", "automargin": true, "zerolinecolor": "#EBF0F8", "zerolinewidth": 2 }, "yaxis": { "ticks": "", "gridcolor": "#EBF0F8", "linecolor": "#EBF0F8", "automargin": true, "zerolinecolor": "#EBF0F8", "zerolinewidth": 2 }, "ternary": { "aaxis": { "ticks": "", "gridcolor": "#DFE8F3", "linecolor": "#A2B1C6" }, "baxis": { "ticks": "", "gridcolor": "#DFE8F3", "linecolor": "#A2B1C6" }, "caxis": { "ticks": "", "gridcolor": "#DFE8F3", "linecolor": "#A2B1C6" }, "bgcolor": "white" }, "colorway": [ "#636efa", "#EF553B", "#00cc96", "#ab63fa", "#19d3f3", "#e763fa", "#fecb52", "#ffa15a", "#ff6692", "#b6e880" ], "hovermode": "closest", "colorscale": { "diverging": [ [ 0, "#8e0152" ], [ 0.1, "#c51b7d" ], [ 0.2, "#de77ae" ], [ 0.3, "#f1b6da" ], [ 0.4, "#fde0ef" ], [ 0.5, "#f7f7f7" ], [ 0.6, "#e6f5d0" ], [ 0.7, "#b8e186" ], [ 0.8, "#7fbc41" ], [ 0.9, "#4d9221" ], [ 1, "#276419" ] ], "sequential": [ [ 0, "#0508b8" ], [ 0.0893854748603352, "#1910d8" ], [ 0.1787709497206704, "#3c19f0" ], [ 0.2681564245810056, "#6b1cfb" ], [ 0.3575418994413408, "#981cfd" ], [ 0.44692737430167595, "#bf1cfd" ], [ 0.5363128491620112, "#dd2bfd" ], [ 0.6256983240223464, "#f246fe" ], [ 0.7150837988826816, "#fc67fd" ], [ 0.8044692737430168, "#fe88fc" ], [ 0.8938547486033519, "#fea5fd" ], [ 0.9832402234636871, "#febefe" ], [ 1, "#fec3fe" ] ], "sequentialminus": [ [ 0, "#0508b8" ], [ 0.0893854748603352, "#1910d8" ], [ 0.1787709497206704, "#3c19f0" ], [ 0.2681564245810056, "#6b1cfb" ], [ 0.3575418994413408, "#981cfd" ], [ 0.44692737430167595, "#bf1cfd" ], [ 0.5363128491620112, "#dd2bfd" ], [ 0.6256983240223464, "#f246fe" ], [ 0.7150837988826816, "#fc67fd" ], [ 0.8044692737430168, "#fe88fc" ], [ 0.8938547486033519, "#fea5fd" ], [ 0.9832402234636871, "#febefe" ], [ 1, "#fec3fe" ] ] }, "plot_bgcolor": "white", "paper_bgcolor": "white", "shapedefaults": { "line": { "width": 0 }, "opacity": 0.4, "fillcolor": "#506784" }, "annotationdefaults": { "arrowhead": 0, "arrowcolor": "#506784", "arrowwidth": 1 } }, "themeRef": "PLOTLY_WHITE" } } }, "height": null, "width": null, "user": { "profile_url": "https://chart-studio.plotly.com/~nandan123", "avatar_url": "https://storage.googleapis.com/plotly-prod-profiles/62.jpg", "background_url": "https://storage.googleapis.com/plotly-prod-profiles/bg-2.jpg", "bio": "", "nickname": "", "website": "", "stream_tokens": null, "feature_set_id": null, "csrf_token": null, "date_joined": "2025-05-14 23:12:44", "mapbox_access_tokens": null, "has_password": null, "username": "nandan123", "email": null, "is_active": null, "readonly": null, "is_dash_creator": null, "dash_created_count": null, "is_chart_creator": null, "charts_created_count": null } }, { "creation_time": "2025-07-13T09:18:12.746170Z", "comments": { "results": [], "count": 0 }, "parented": true, "embed_url": "https://chart-studio.plotly.com/~ChJus/19.embed", "fid": "ChJus:19", "filename": "MNIST-Size-Accuracy-All", "filetype": "plot", "img_url": "https://api.plotly.com/v2/files/ChJus:19/image?image_name=list-thumb", "image_urls": { "default": "https://storage.googleapis.com/plotly-prod-images/ChJus/19/2_B7ZHHBBIJJWTZ6GMVRX2A7GFZWE4J0.png", "block-thumb": "https://storage.googleapis.com/plotly-prod-images/ChJus/19/8_GONDHR26ZODGAZD6EYGEXNSJ2IEHGK.png", "list-thumb": "https://api.plotly.com/v2/files/ChJus:19/image?image_name=list-thumb" }, "api_urls": { "files": "https://api.plotly.com/v2/files/ChJus:19", "plots": "https://api.plotly.com/v2/plots/ChJus:19", "parent": "https://api.plotly.com/v2/folders/home?user=ChJus" }, "owner": "ChJus", "parent": -1, "preview": "", "referencers": [], "references": [], "title": "", "views": 1, "web_url": "https://chart-studio.plotly.com/~ChJus/19/", "world_readable": true, "date_modified": "2025-07-13T09:25:20.934Z", "stars": { "results": [], "count": 0 }, "collaborators": { "results": [], "count": 0 }, "subfolder_count": null, "refresh_interval": null, "organize_view_url": "https://chart-studio.plotly.com/~ChJus/19/", "current_user_permission": "read", "is_theme": null, "is_template": false, "autosize": true, "caption": "", "figure": { "data": [ { "meta": { "columnNames": { "x": "A", "y": "F" } }, "mode": "markers+lines", "name": "No fine-tuning (Small)", "type": "scatter", "xsrc": "ChJus:3:0f9449", "ysrc": "ChJus:3:e64161", "marker": { "color": "rgb(237, 93, 107)" }, "visible": true, "showlegend": true }, { "meta": { "columnNames": { "x": "A", "y": "G" } }, "mode": "markers+lines", "name": "Fine-tuned (Small)", "type": "scatter", "xsrc": "ChJus:3:0f9449", "ysrc": "ChJus:3:30c633", "xaxis": "x", "marker": { "color": "rgb(84, 134, 76)" }, "error_x": { "type": "percent", "color": "rgb(84, 134, 76)", "value": 10, "width": 4, "visible": false, "symmetric": true, "thickness": 2 }, "error_y": { "type": "percent", "color": "rgb(84, 134, 76)", "value": 10, "width": 4, "visible": false, "symmetric": true, "thickness": 2 }, "visible": true, "cliponaxis": true }, { "line": { "dash": "dash" }, "meta": { "columnNames": { "x": "K", "y": "P" } }, "mode": "markers+lines", "name": "No fine-tuning (Medium)", "type": "scatter", "xsrc": "ChJus:3:1b47f7", "ysrc": "ChJus:3:abe8de", "marker": { "color": "rgb(237, 93, 107)", "symbol": "square-open" }, "visible": true, "stackgroup": null }, { "line": { "dash": "dash" }, "meta": { "columnNames": { "x": "K", "y": "Q" } }, "mode": "markers+lines", "name": "Fine-tuned (Medium)", "type": "scatter", "xsrc": "ChJus:3:1b47f7", "ysrc": "ChJus:3:3558c0", "marker": { "color": "rgb(84, 134, 76)", "symbol": "square-open" }, "visible": true, "stackgroup": null }, { "line": { "dash": "dashdot" }, "meta": { "columnNames": { "x": "U", "y": "Z" } }, "mode": "markers+lines", "name": "No fine-tuning (Large)", "type": "scatter", "xsrc": "ChJus:3:e9b136", "ysrc": "ChJus:3:fee585", "marker": { "color": "rgb(237, 93, 107)", "symbol": "asterisk-open" }, "visible": true, "stackgroup": null }, { "line": { "dash": "dashdot" }, "meta": { "columnNames": { "x": "U", "y": "AA" } }, "mode": "markers+lines", "name": "Fine-tuned (Large)", "type": "scatter", "xsrc": "ChJus:3:e9b136", "ysrc": "ChJus:3:20198c", "marker": { "color": "rgb(84, 134, 76)", "symbol": "asterisk-open", "opacity": 1 }, "visible": true, "stackgroup": null } ], "frames": [], "layout": { "font": { "color": "rgb(46, 46, 46)", "family": "Balto" }, "title": { "x": 0.5, "text": "<b>Model size effect on test accuracy (MNIST)</b>" }, "xaxis": { "range": [ -62461.319574734225, 1097561.3195747342 ], "title": { "text": "Model size" }, "nticks": 12, "autorange": true, "showspikes": false, "tickformat": "", "rangeslider": { "range": [ -4971.907241819789, 84169.00265304117 ], "yaxis": {}, "visible": false, "autorange": true }, "exponentformat": "none", "separatethousands": false }, "yaxis": { "range": [ 0, 106.5277566539924 ], "title": { "text": "Test accuracy (%)" }, "nticks": 12, "autorange": true, "showspikes": false }, "legend": { "x": 1, "y": 0.01, "font": { "color": "rgb(20, 20, 20)" }, "title": { "text": "<b>Model Performance</b>" }, "valign": "top", "xanchor": "right", "yanchor": "bottom", "traceorder": "reversed", "borderwidth": 0, "orientation": "v" }, "margin": { "b": 50, "l": 50, "r": 50, "t": 50, "pad": 0 }, "shapes": [ { "x0": 0, "x1": 60000, "y0": 0, "y1": 100, "line": { "color": "#444444" }, "opacity": 0.12, "fillcolor": "#7f7f7f" } ], "autosize": true, "template": { "data": { "bar": [ { "type": "bar", "marker": { "colorbar": { "ticks": "", "outlinewidth": 0 } } } ], "table": [ { "type": "table", "cells": { "fill": { "color": "#EBF0F8" }, "line": { "color": "white" } }, "header": { "fill": { "color": "#C8D4E3" }, "line": { "color": "white" } } } ], "carpet": [ { "type": "carpet", "aaxis": { "gridcolor": "#C8D4E3", "linecolor": "#C8D4E3", "endlinecolor": "#2a3f5f", "minorgridcolor": "#C8D4E3", "startlinecolor": "#2a3f5f" }, "baxis": { "gridcolor": "#C8D4E3", "linecolor": "#C8D4E3", "endlinecolor": "#2a3f5f", "minorgridcolor": "#C8D4E3", "startlinecolor": "#2a3f5f" } } ], "mesh3d": [ { "type": "mesh3d", "colorbar": { "ticks": "", "outlinewidth": 0 } } ], "contour": [ { "type": "contour", "colorbar": { "ticks": "", "outlinewidth": 0 }, "autocolorscale": true } ], "heatmap": [ { "type": "heatmap", "colorbar": { "ticks": "", "outlinewidth": 0 }, "autocolorscale": true } ], "scatter": [ { "type": "scatter", "marker": { "colorbar": { "ticks": "", "outlinewidth": 0 } } } ], "surface": [ { "type": "surface", "colorbar": { "ticks": "", "outlinewidth": 0 } } ], "heatmapgl": [ { "type": "heatmapgl", "colorbar": { "ticks": "", "outlinewidth": 0 } } ], "histogram": [ { "type": "histogram", "marker": { "colorbar": { "ticks": "", "outlinewidth": 0 } } } ], "parcoords": [ { "line": { "colorbar": { "ticks": "", "outlinewidth": 0 } }, "type": "parcoords" } ], "scatter3d": [ { "type": "scatter3d", "marker": { "colorbar": { "ticks": "", "outlinewidth": 0 } } } ], "scattergl": [ { "type": "scattergl", "marker": { "colorbar": { "ticks": "", "outlinewidth": 0 } } } ], "choropleth": [ { "type": "choropleth", "colorbar": { "ticks": "", "outlinewidth": 0 } } ], "scattergeo": [ { "type": "scattergeo", "marker": { "colorbar": { "ticks": "", "outlinewidth": 0 } } } ], "histogram2d": [ { "type": "histogram2d", "colorbar": { "ticks": "", "outlinewidth": 0 }, "autocolorscale": true } ], "scatterpolar": [ { "type": "scatterpolar", "marker": { "colorbar": { "ticks": "", "outlinewidth": 0 } } } ], "contourcarpet": [ { "type": "contourcarpet", "colorbar": { "ticks": "", "outlinewidth": 0 } } ], "scattercarpet": [ { "type": "scattercarpet", "marker": { "colorbar": { "ticks": "", "outlinewidth": 0 } } } ], "scattermapbox": [ { "type": "scattermapbox", "marker": { "colorbar": { "ticks": "", "outlinewidth": 0 } } } ], "scatterpolargl": [ { "type": "scatterpolargl", "marker": { "colorbar": { "ticks": "", "outlinewidth": 0 } } } ], "scatterternary": [ { "type": "scatterternary", "marker": { "colorbar": { "ticks": "", "outlinewidth": 0 } } } ], "histogram2dcontour": [ { "type": "histogram2dcontour", "colorbar": { "ticks": "", "outlinewidth": 0 }, "autocolorscale": true } ] }, "layout": { "geo": { "bgcolor": "white", "showland": true, "lakecolor": "white", "landcolor": "white", "showlakes": true, "subunitcolor": "#C8D4E3" }, "font": { "color": "#2a3f5f" }, "polar": { "bgcolor": "white", "radialaxis": { "ticks": "", "gridcolor": "#EBF0F8", "linecolor": "#EBF0F8" }, "angularaxis": { "ticks": "", "gridcolor": "#EBF0F8", "linecolor": "#EBF0F8" } }, "scene": { "xaxis": { "ticks": "", "gridcolor": "#DFE8F3", "gridwidth": 2, "linecolor": "#EBF0F8", "zerolinecolor": "#EBF0F8", "showbackground": true, "backgroundcolor": "white" }, "yaxis": { "ticks": "", "gridcolor": "#DFE8F3", "gridwidth": 2, "linecolor": "#EBF0F8", "zerolinecolor": "#EBF0F8", "showbackground": true, "backgroundcolor": "white" }, "zaxis": { "ticks": "", "gridcolor": "#DFE8F3", "gridwidth": 2, "linecolor": "#EBF0F8", "zerolinecolor": "#EBF0F8", "showbackground": true, "backgroundcolor": "white" } }, "title": { "x": 0.05 }, "xaxis": { "ticks": "", "gridcolor": "#EBF0F8", "linecolor": "#EBF0F8", "automargin": true, "zerolinecolor": "#EBF0F8", "zerolinewidth": 2 }, "yaxis": { "ticks": "", "gridcolor": "#EBF0F8", "linecolor": "#EBF0F8", "automargin": true, "zerolinecolor": "#EBF0F8", "zerolinewidth": 2 }, "ternary": { "aaxis": { "ticks": "", "gridcolor": "#DFE8F3", "linecolor": "#A2B1C6" }, "baxis": { "ticks": "", "gridcolor": "#DFE8F3", "linecolor": "#A2B1C6" }, "caxis": { "ticks": "", "gridcolor": "#DFE8F3", "linecolor": "#A2B1C6" }, "bgcolor": "white" }, "colorway": [ "#636efa", "#EF553B", "#00cc96", "#ab63fa", "#19d3f3", "#e763fa", "#fecb52", "#ffa15a", "#ff6692", "#b6e880" ], "hovermode": "closest", "colorscale": { "diverging": [ [ 0, "#8e0152" ], [ 0.1, "#c51b7d" ], [ 0.2, "#de77ae" ], [ 0.3, "#f1b6da" ], [ 0.4, "#fde0ef" ], [ 0.5, "#f7f7f7" ], [ 0.6, "#e6f5d0" ], [ 0.7, "#b8e186" ], [ 0.8, "#7fbc41" ], [ 0.9, "#4d9221" ], [ 1, "#276419" ] ], "sequential": [ [ 0, "#0508b8" ], [ 0.0893854748603352, "#1910d8" ], [ 0.1787709497206704, "#3c19f0" ], [ 0.2681564245810056, "#6b1cfb" ], [ 0.3575418994413408, "#981cfd" ], [ 0.44692737430167595, "#bf1cfd" ], [ 0.5363128491620112, "#dd2bfd" ], [ 0.6256983240223464, "#f246fe" ], [ 0.7150837988826816, "#fc67fd" ], [ 0.8044692737430168, "#fe88fc" ], [ 0.8938547486033519, "#fea5fd" ], [ 0.9832402234636871, "#febefe" ], [ 1, "#fec3fe" ] ], "sequentialminus": [ [ 0, "#0508b8" ], [ 0.0893854748603352, "#1910d8" ], [ 0.1787709497206704, "#3c19f0" ], [ 0.2681564245810056, "#6b1cfb" ], [ 0.3575418994413408, "#981cfd" ], [ 0.44692737430167595, "#bf1cfd" ], [ 0.5363128491620112, "#dd2bfd" ], [ 0.6256983240223464, "#f246fe" ], [ 0.7150837988826816, "#fc67fd" ], [ 0.8044692737430168, "#fe88fc" ], [ 0.8938547486033519, "#fea5fd" ], [ 0.9832402234636871, "#febefe" ], [ 1, "#fec3fe" ] ] }, "plot_bgcolor": "white", "paper_bgcolor": "white", "shapedefaults": { "line": { "width": 0 }, "opacity": 0.4, "fillcolor": "#506784" }, "annotationdefaults": { "arrowhead": 0, "arrowcolor": "#506784", "arrowwidth": 1 } }, "themeRef": "PLOTLY_WHITE" }, "hovermode": "x", "showlegend": true, "annotations": [ { "x": 70000, "y": 2, "text": "More than number<br>of training examples", "align": "left", "xanchor": "left", "yanchor": "bottom", "showarrow": false } ] } }, "height": null, "width": null, "user": { "profile_url": "https://chart-studio.plotly.com/~ChJus", "avatar_url": "https://storage.googleapis.com/plotly-prod-profiles/13.jpg", "background_url": "https://storage.googleapis.com/plotly-prod-profiles/bg-3.jpg", "bio": "", "nickname": "", "website": "", "stream_tokens": null, "feature_set_id": null, "csrf_token": null, "date_joined": "2025-06-19 06:35:53", "mapbox_access_tokens": null, "has_password": null, "username": "ChJus", "email": null, "is_active": null, "readonly": null, "is_dash_creator": null, "dash_created_count": null, "is_chart_creator": null, "charts_created_count": null } }, { "creation_time": "2025-07-13T08:08:37.572060Z", "comments": { "results": [], "count": 0 }, "parented": true, "embed_url": "https://chart-studio.plotly.com/~majkot/18.embed", "fid": "majkot:18", "filename": "Plot 18", "filetype": "plot", "img_url": "https://api.plotly.com/v2/files/majkot:18/image?image_name=list-thumb", "image_urls": { "default": "https://storage.googleapis.com/plotly-prod-images/majkot/18/2_3FRCKY3IOIKKM9WC3RTQ7ORMYAGZS2.png", "block-thumb": "https://storage.googleapis.com/plotly-prod-images/majkot/18/8_X9FSEY2HK9ZZF0SB1HF1LK8RF59Q7A.png", "list-thumb": "https://api.plotly.com/v2/files/majkot:18/image?image_name=list-thumb" }, "api_urls": { "files": "https://api.plotly.com/v2/files/majkot:18", "plots": "https://api.plotly.com/v2/plots/majkot:18", "parent": "https://api.plotly.com/v2/folders/home?user=majkot" }, "owner": "majkot", "parent": -1, "preview": "", "referencers": [], "references": [], "title": "", "views": 0, "web_url": "https://chart-studio.plotly.com/~majkot/18/", "world_readable": true, "date_modified": "2025-07-13T08:08:37.584Z", "stars": { "results": [], "count": 0 }, "collaborators": { "results": [], "count": 0 }, "subfolder_count": null, "refresh_interval": null, "organize_view_url": "https://chart-studio.plotly.com/~majkot/18/", "current_user_permission": "read", "is_theme": null, "is_template": false, "autosize": true, "caption": "", "figure": { "data": [ { "meta": { "columnNames": { "x": "Sample Text", "y": "GABA", "error_y": { "array": "GABA SD" } } }, "mode": "markers", "name": "GABA", "type": "bar", "xsrc": "majkot:16:f07911", "ysrc": "majkot:16:72d6d2", "error_y": { "meta": { "columnNames": { "array": "GABA SD" } }, "type": "data", "visible": true, "arraysrc": "majkot:16:c6a21e", "symmetric": true }, "orientation": "v" }, { "meta": { "columnNames": { "x": "Sample Text", "y": "AGM", "error_y": { "array": "AGM SD" } } }, "name": "AGM", "type": "bar", "xsrc": "majkot:16:f07911", "ysrc": "majkot:16:7e4349", "error_y": { "meta": { "columnNames": { "array": "AGM SD" } }, "type": "data", "visible": true, "arraysrc": "majkot:16:c2b4a5", "symmetric": true }, "orientation": "v" }, { "meta": { "columnNames": { "x": "Sample Text", "y": "SPD", "error_y": { "array": "SPD SD" } } }, "name": "SPD", "type": "bar", "xsrc": "majkot:16:f07911", "ysrc": "majkot:16:70116e", "error_y": { "meta": { "columnNames": { "array": "SPD SD" } }, "type": "data", "visible": true, "arraysrc": "majkot:16:d9c7aa", "symmetric": true }, "orientation": "v" }, { "meta": { "columnNames": { "x": "Sample Text", "y": "SPR", "error_y": { "array": "SPR SD" } } }, "name": "SPR", "type": "bar", "xsrc": "majkot:16:f07911", "ysrc": "majkot:16:91c454", "error_y": { "meta": { "columnNames": { "array": "SPR SD" } }, "type": "data", "visible": true, "arraysrc": "majkot:16:58e2ba", "symmetric": true }, "orientation": "v" }, { "meta": { "columnNames": { "x": "Sample Text", "y": "PUT", "error_y": { "array": "PUT SD" } } }, "name": "PUT", "type": "bar", "xsrc": "majkot:16:f07911", "ysrc": "majkot:16:89cf93", "error_y": { "meta": { "columnNames": { "array": "PUT SD" } }, "type": "data", "visible": true, "arraysrc": "majkot:16:e79ef9", "symmetric": true }, "orientation": "v" }, { "meta": { "columnNames": { "x": "Sample Text", "y": "CAD", "error_y": { "array": "CAD SD" } } }, "name": "CAD", "type": "bar", "xsrc": "majkot:16:f07911", "ysrc": "majkot:16:5aabf9", "error_y": { "meta": { "columnNames": { "array": "CAD SD" } }, "type": "data", "visible": true, "arraysrc": "majkot:16:457b90", "symmetric": true }, "orientation": "v" }, { "meta": { "columnNames": { "x": "Sample Text", "y": "TRY", "error_y": { "array": "TRY SD" } } }, "name": "TRY", "type": "bar", "xsrc": "majkot:16:f07911", "ysrc": "majkot:16:b7e69a", "error_y": { "meta": { "columnNames": { "array": "TRY SD" } }, "type": "data", "visible": true, "arraysrc": "majkot:16:6a02e8", "symmetric": true }, "orientation": "v" }, { "meta": { "columnNames": { "x": "Sample Text", "y": "PHE", "error_y": { "array": "PHE SD" } } }, "name": "PHE", "type": "bar", "xsrc": "majkot:16:f07911", "ysrc": "majkot:16:c15c2b", "error_y": { "meta": { "columnNames": { "array": "PHE SD" } }, "type": "data", "visible": true, "arraysrc": "majkot:16:b1ac2f", "symmetric": true }, "orientation": "v" }, { "meta": { "columnNames": { "x": "Sample Text", "y": "HA", "error_y": { "array": "HA SD" } } }, "name": "HA", "type": "bar", "xsrc": "majkot:16:f07911", "ysrc": "majkot:16:9b14e2", "error_y": { "meta": { "columnNames": { "array": "HA SD" } }, "type": "data", "visible": true, "arraysrc": "majkot:16:96c3ff", "symmetric": true }, "visible": true, "orientation": "v" }, { "meta": { "columnNames": { "x": "Sample Text", "y": "TYR", "error_y": { "array": "TYR SD" } } }, "name": "TYR", "type": "bar", "xsrc": "majkot:16:f07911", "ysrc": "majkot:16:f9930d", "error_y": { "meta": { "columnNames": { "array": "TYR SD" } }, "type": "data", "visible": true, "arraysrc": "majkot:16:d9d299", "symmetric": true }, "orientation": "v" } ], "frames": [], "layout": { "title": { "text": "" }, "width": 1121, "xaxis": { "type": "category", "range": [ -0.5, 2.5 ], "title": { "text": "Ime vzorca" }, "autorange": true }, "yaxis": { "type": "linear", "range": [ 0, 3.803104541263158 ], "title": { "text": "Koncentracije biogenih aminov [µg/g]" }, "autorange": true }, "height": 487, "legend": { "x": 0.1425598335067638, "y": -0.19207673787761612, "traceorder": "normal", "orientation": "h" }, "barmode": "group", "autosize": true, "annotations": [] } }, "height": 487, "width": 1121, "user": { "profile_url": "https://chart-studio.plotly.com/~majkot", "avatar_url": "https://storage.googleapis.com/plotly-prod-profiles/99.jpg", "background_url": "https://storage.googleapis.com/plotly-prod-profiles/bg-1.jpg", "bio": "", "nickname": "", "website": "", "stream_tokens": null, "feature_set_id": null, "csrf_token": null, "date_joined": "2025-07-08 16:43:07", "mapbox_access_tokens": null, "has_password": null, "username": "majkot", "email": null, "is_active": null, "readonly": null, "is_dash_creator": null, "dash_created_count": null, "is_chart_creator": null, "charts_created_count": null } }, { "creation_time": "2025-07-13T04:28:37.086427Z", "comments": { "results": [], "count": 0 }, "parented": true, "embed_url": "https://chart-studio.plotly.com/~incidavila/1.embed", "fid": "incidavila:1", "filename": "EmoPrint1", "filetype": "plot", "img_url": "https://api.plotly.com/v2/files/incidavila:1/image?image_name=list-thumb", "image_urls": { "default": "https://storage.googleapis.com/plotly-prod-images/incidavila/1/2_9VUIURWGVVRG4C815QNA5IA152PJJ3.png", "block-thumb": "https://storage.googleapis.com/plotly-prod-images/incidavila/1/8_FTT5WG7X4CYGJV1XHSOZ2ZUNC2L60Q.png", "list-thumb": "https://api.plotly.com/v2/files/incidavila:1/image?image_name=list-thumb" }, "api_urls": { "files": "https://api.plotly.com/v2/files/incidavila:1", "plots": "https://api.plotly.com/v2/plots/incidavila:1", "parent": "https://api.plotly.com/v2/folders/home?user=incidavila" }, "owner": "incidavila", "parent": -1, "preview": "", "referencers": [], "references": [], "title": "", "views": 0, "web_url": "https://chart-studio.plotly.com/~incidavila/1/", "world_readable": true, "date_modified": "2025-07-13T04:30:04.729Z", "stars": { "results": [], "count": 0 }, "collaborators": { "results": [], "count": 0 }, "subfolder_count": null, "refresh_interval": null, "organize_view_url": "https://chart-studio.plotly.com/~incidavila/1/", "current_user_permission": "read", "is_theme": null, "is_template": false, "autosize": true, "caption": "", "figure": { "data": [ { "meta": { "columnNames": { "ids": "A", "labels": "B", "parents": "C" } }, "mode": "markers", "type": "sunburst", "level": "emotions", "idssrc": "incidavila:0:860173", "labelssrc": "incidavila:0:616109", "parentssrc": "incidavila:0:010d12" } ], "frames": [], "layout": { "xaxis": { "range": [ -1, 6 ], "autorange": true }, "yaxis": { "range": [ -1, 4 ], "autorange": true }, "autosize": true, "template": { "data": { "bar": [ { "type": "bar", "marker": { "colorbar": { "ticks": "", "outlinewidth": 0 } } } ], "table": [ { "type": "table", "cells": { "fill": { "color": "#EBF0F8" }, "line": { "color": "white" } }, "header": { "fill": { "color": "#C8D4E3" }, "line": { "color": "white" } } } ], "carpet": [ { "type": "carpet", "aaxis": { "gridcolor": "#C8D4E3", "linecolor": "#C8D4E3", "endlinecolor": "#2a3f5f", "minorgridcolor": "#C8D4E3", "startlinecolor": "#2a3f5f" }, "baxis": { "gridcolor": "#C8D4E3", "linecolor": "#C8D4E3", "endlinecolor": "#2a3f5f", "minorgridcolor": "#C8D4E3", "startlinecolor": "#2a3f5f" } } ], "mesh3d": [ { "type": "mesh3d", "colorbar": { "ticks": "", "outlinewidth": 0 } } ], "contour": [ { "type": "contour", "colorbar": { "ticks": "", "outlinewidth": 0 }, "autocolorscale": true } ], "heatmap": [ { "type": "heatmap", "colorbar": { "ticks": "", "outlinewidth": 0 }, "autocolorscale": true } ], "scatter": [ { "type": "scatter", "marker": { "colorbar": { "ticks": "", "outlinewidth": 0 } } } ], "surface": [ { "type": "surface", "colorbar": { "ticks": "", "outlinewidth": 0 } } ], "heatmapgl": [ { "type": "heatmapgl", "colorbar": { "ticks": "", "outlinewidth": 0 } } ], "histogram": [ { "type": "histogram", "marker": { "colorbar": { "ticks": "", "outlinewidth": 0 } } } ], "parcoords": [ { "line": { "colorbar": { "ticks": "", "outlinewidth": 0 } }, "type": "parcoords" } ], "scatter3d": [ { "type": "scatter3d", "marker": { "colorbar": { "ticks": "", "outlinewidth": 0 } } } ], "scattergl": [ { "type": "scattergl", "marker": { "colorbar": { "ticks": "", "outlinewidth": 0 } } } ], "choropleth": [ { "type": "choropleth", "colorbar": { "ticks": "", "outlinewidth": 0 } } ], "scattergeo": [ { "type": "scattergeo", "marker": { "colorbar": { "ticks": "", "outlinewidth": 0 } } } ], "histogram2d": [ { "type": "histogram2d", "colorbar": { "ticks": "", "outlinewidth": 0 }, "autocolorscale": true } ], "scatterpolar": [ { "type": "scatterpolar", "marker": { "colorbar": { "ticks": "", "outlinewidth": 0 } } } ], "contourcarpet": [ { "type": "contourcarpet", "colorbar": { "ticks": "", "outlinewidth": 0 } } ], "scattercarpet": [ { "type": "scattercarpet", "marker": { "colorbar": { "ticks": "", "outlinewidth": 0 } } } ], "scattermapbox": [ { "type": "scattermapbox", "marker": { "colorbar": { "ticks": "", "outlinewidth": 0 } } } ], "scatterpolargl": [ { "type": "scatterpolargl", "marker": { "colorbar": { "ticks": "", "outlinewidth": 0 } } } ], "scatterternary": [ { "type": "scatterternary", "marker": { "colorbar": { "ticks": "", "outlinewidth": 0 } } } ], "histogram2dcontour": [ { "type": "histogram2dcontour", "colorbar": { "ticks": "", "outlinewidth": 0 }, "autocolorscale": true } ] }, "layout": { "geo": { "bgcolor": "white", "showland": true, "lakecolor": "white", "landcolor": "white", "showlakes": true, "subunitcolor": "#C8D4E3" }, "font": { "color": "#2a3f5f" }, "polar": { "bgcolor": "white", "radialaxis": { "ticks": "", "gridcolor": "#EBF0F8", "linecolor": "#EBF0F8" }, "angularaxis": { "ticks": "", "gridcolor": "#EBF0F8", "linecolor": "#EBF0F8" } }, "scene": { "xaxis": { "ticks": "", "gridcolor": "#DFE8F3", "gridwidth": 2, "linecolor": "#EBF0F8", "zerolinecolor": "#EBF0F8", "showbackground": true, "backgroundcolor": "white" }, "yaxis": { "ticks": "", "gridcolor": "#DFE8F3", "gridwidth": 2, "linecolor": "#EBF0F8", "zerolinecolor": "#EBF0F8", "showbackground": true, "backgroundcolor": "white" }, "zaxis": { "ticks": "", "gridcolor": "#DFE8F3", "gridwidth": 2, "linecolor": "#EBF0F8", "zerolinecolor": "#EBF0F8", "showbackground": true, "backgroundcolor": "white" } }, "title": { "x": 0.05 }, "xaxis": { "ticks": "", "gridcolor": "#EBF0F8", "linecolor": "#EBF0F8", "automargin": true, "zerolinecolor": "#EBF0F8", "zerolinewidth": 2 }, "yaxis": { "ticks": "", "gridcolor": "#EBF0F8", "linecolor": "#EBF0F8", "automargin": true, "zerolinecolor": "#EBF0F8", "zerolinewidth": 2 }, "ternary": { "aaxis": { "ticks": "", "gridcolor": "#DFE8F3", "linecolor": "#A2B1C6" }, "baxis": { "ticks": "", "gridcolor": "#DFE8F3", "linecolor": "#A2B1C6" }, "caxis": { "ticks": "", "gridcolor": "#DFE8F3", "linecolor": "#A2B1C6" }, "bgcolor": "white" }, "colorway": [ "#636efa", "#EF553B", "#00cc96", "#ab63fa", "#19d3f3", "#e763fa", "#fecb52", "#ffa15a", "#ff6692", "#b6e880" ], "hovermode": "closest", "colorscale": { "diverging": [ [ 0, "#8e0152" ], [ 0.1, "#c51b7d" ], [ 0.2, "#de77ae" ], [ 0.3, "#f1b6da" ], [ 0.4, "#fde0ef" ], [ 0.5, "#f7f7f7" ], [ 0.6, "#e6f5d0" ], [ 0.7, "#b8e186" ], [ 0.8, "#7fbc41" ], [ 0.9, "#4d9221" ], [ 1, "#276419" ] ], "sequential": [ [ 0, "#0508b8" ], [ 0.0893854748603352, "#1910d8" ], [ 0.1787709497206704, "#3c19f0" ], [ 0.2681564245810056, "#6b1cfb" ], [ 0.3575418994413408, "#981cfd" ], [ 0.44692737430167595, "#bf1cfd" ], [ 0.5363128491620112, "#dd2bfd" ], [ 0.6256983240223464, "#f246fe" ], [ 0.7150837988826816, "#fc67fd" ], [ 0.8044692737430168, "#fe88fc" ], [ 0.8938547486033519, "#fea5fd" ], [ 0.9832402234636871, "#febefe" ], [ 1, "#fec3fe" ] ], "sequentialminus": [ [ 0, "#0508b8" ], [ 0.0893854748603352, "#1910d8" ], [ 0.1787709497206704, "#3c19f0" ], [ 0.2681564245810056, "#6b1cfb" ], [ 0.3575418994413408, "#981cfd" ], [ 0.44692737430167595, "#bf1cfd" ], [ 0.5363128491620112, "#dd2bfd" ], [ 0.6256983240223464, "#f246fe" ], [ 0.7150837988826816, "#fc67fd" ], [ 0.8044692737430168, "#fe88fc" ], [ 0.8938547486033519, "#fea5fd" ], [ 0.9832402234636871, "#febefe" ], [ 1, "#fec3fe" ] ] }, "plot_bgcolor": "white", "paper_bgcolor": "white", "shapedefaults": { "line": { "width": 0 }, "opacity": 0.4, "fillcolor": "#506784" }, "annotationdefaults": { "arrowhead": 0, "arrowcolor": "#506784", "arrowwidth": 1 } }, "themeRef": "PLOTLY_WHITE" }, "uniformtext": { "mode": false } } }, "height": null, "width": null, "user": { "profile_url": "https://chart-studio.plotly.com/~incidavila", "avatar_url": "https://storage.googleapis.com/plotly-prod-profiles/13.jpg", "background_url": "https://storage.googleapis.com/plotly-prod-profiles/bg-13.jpg", "bio": "", "nickname": "", "website": "", "stream_tokens": null, "feature_set_id": null, "csrf_token": null, "date_joined": "2025-07-13 02:11:29", "mapbox_access_tokens": null, "has_password": null, "username": "incidavila", "email": null, "is_active": null, "readonly": null, "is_dash_creator": null, "dash_created_count": null, "is_chart_creator": null, "charts_created_count": null } }, { "creation_time": "2025-07-13T00:31:36.316551Z", "comments": { "results": [], "count": 0 }, "parented": true, "embed_url": "https://chart-studio.plotly.com/~dasium/4.embed", "fid": "dasium:4", "filename": "Psychology IA graph #0", "filetype": "plot", "img_url": "https://api.plotly.com/v2/files/dasium:4/image?image_name=list-thumb", "image_urls": { "default": "https://storage.googleapis.com/plotly-prod-images/dasium/4/2_D7SEV1OVTT7H41ZAPD4JNG110Q0OWW.png", "block-thumb": "https://storage.googleapis.com/plotly-prod-images/dasium/4/8_VOX7L3GI25X9NS94CRZC6A6TC5DJU9.png", "list-thumb": "https://api.plotly.com/v2/files/dasium:4/image?image_name=list-thumb" }, "api_urls": { "files": "https://api.plotly.com/v2/files/dasium:4", "plots": "https://api.plotly.com/v2/plots/dasium:4", "parent": "https://api.plotly.com/v2/folders/home?user=dasium" }, "owner": "dasium", "parent": -1, "preview": "", "referencers": [], "references": [], "title": "", "views": 0, "web_url": "https://chart-studio.plotly.com/~dasium/4/", "world_readable": true, "date_modified": "2025-07-13T01:33:52.586Z", "stars": { "results": [], "count": 0 }, "collaborators": { "results": [], "count": 0 }, "subfolder_count": null, "refresh_interval": null, "organize_view_url": "https://chart-studio.plotly.com/~dasium/4/", "current_user_permission": "read", "is_theme": null, "is_template": false, "autosize": true, "caption": "", "figure": { "data": [ { "meta": { "columnNames": { "x": "Condition", "y": "Mean", "text": "", "error_y": { "array": "Standard Deviation", "arrayminus": "Standard Deviation" } } }, "mode": "markers", "type": "bar", "xsrc": "dasium:3:7bd261", "ysrc": "dasium:3:1b2d60", "error_y": { "meta": { "columnNames": { "array": "Standard Deviation", "arrayminus": "Standard Deviation" } }, "arraysrc": "dasium:3:8a81af", "arrayminussrc": "dasium:3:8a81af" }, "visible": true, "transforms": [ { "meta": { "columnNames": { "groups": "Recall" } }, "type": "groupby", "styles": [ { "value": { "name": "Recall 1", "error_y": { "type": "data", "color": "#444", "value": 10, "width": 4, "visible": true, "symmetric": false, "thickness": 2 }, "visible": true }, "target": "1" }, { "value": { "name": "Recall 2" }, "target": "2" } ], "groupssrc": "dasium:3:61a9b7" } ], "legendgroup": "", "orientation": "v", "selectedpoints": [ 0, 2, 4, 6, 1, 3, 5, 7 ] } ], "frames": [], "layout": { "title": { "text": "Title" }, "xaxis": { "type": "category", "range": [ -0.5, 3.5 ], "title": { "text": "Condition" }, "autorange": true }, "yaxis": { "type": "linear", "range": [ 0, 7.126315789473684 ], "title": { "text": "Mean Number of Discrete Information Recalled" }, "autorange": true }, "legend": { "title": { "text": "<br>" }, "traceorder": "normal" }, "barmode": "group", "autosize": true, "dragmode": "select", "template": { "data": { "bar": [ { "type": "bar", "marker": { "colorbar": { "ticks": "", "outlinewidth": 0 } } } ], "table": [ { "type": "table", "cells": { "fill": { "color": "#EBF0F8" }, "line": { "color": "white" } }, "header": { "fill": { "color": "#C8D4E3" }, "line": { "color": "white" } } } ], "carpet": [ { "type": "carpet", "aaxis": { "gridcolor": "#C8D4E3", "linecolor": "#C8D4E3", "endlinecolor": "#2a3f5f", "minorgridcolor": "#C8D4E3", "startlinecolor": "#2a3f5f" }, "baxis": { "gridcolor": "#C8D4E3", "linecolor": "#C8D4E3", "endlinecolor": "#2a3f5f", "minorgridcolor": "#C8D4E3", "startlinecolor": "#2a3f5f" } } ], "mesh3d": [ { "type": "mesh3d", "colorbar": { "ticks": "", "outlinewidth": 0 } } ], "contour": [ { "type": "contour", "colorbar": { "ticks": "", "outlinewidth": 0 }, "autocolorscale": true } ], "heatmap": [ { "type": "heatmap", "colorbar": { "ticks": "", "outlinewidth": 0 }, "autocolorscale": true } ], "scatter": [ { "type": "scatter", "marker": { "colorbar": { "ticks": "", "outlinewidth": 0 } } } ], "surface": [ { "type": "surface", "colorbar": { "ticks": "", "outlinewidth": 0 } } ], "heatmapgl": [ { "type": "heatmapgl", "colorbar": { "ticks": "", "outlinewidth": 0 } } ], "histogram": [ { "type": "histogram", "marker": { "colorbar": { "ticks": "", "outlinewidth": 0 } } } ], "parcoords": [ { "line": { "colorbar": { "ticks": "", "outlinewidth": 0 } }, "type": "parcoords" } ], "scatter3d": [ { "type": "scatter3d", "marker": { "colorbar": { "ticks": "", "outlinewidth": 0 } } } ], "scattergl": [ { "type": "scattergl", "marker": { "colorbar": { "ticks": "", "outlinewidth": 0 } } } ], "choropleth": [ { "type": "choropleth", "colorbar": { "ticks": "", "outlinewidth": 0 } } ], "scattergeo": [ { "type": "scattergeo", "marker": { "colorbar": { "ticks": "", "outlinewidth": 0 } } } ], "histogram2d": [ { "type": "histogram2d", "colorbar": { "ticks": "", "outlinewidth": 0 }, "autocolorscale": true } ], "scatterpolar": [ { "type": "scatterpolar", "marker": { "colorbar": { "ticks": "", "outlinewidth": 0 } } } ], "contourcarpet": [ { "type": "contourcarpet", "colorbar": { "ticks": "", "outlinewidth": 0 } } ], "scattercarpet": [ { "type": "scattercarpet", "marker": { "colorbar": { "ticks": "", "outlinewidth": 0 } } } ], "scattermapbox": [ { "type": "scattermapbox", "marker": { "colorbar": { "ticks": "", "outlinewidth": 0 } } } ], "scatterpolargl": [ { "type": "scatterpolargl", "marker": { "colorbar": { "ticks": "", "outlinewidth": 0 } } } ], "scatterternary": [ { "type": "scatterternary", "marker": { "colorbar": { "ticks": "", "outlinewidth": 0 } } } ], "histogram2dcontour": [ { "type": "histogram2dcontour", "colorbar": { "ticks": "", "outlinewidth": 0 }, "autocolorscale": true } ] }, "layout": { "geo": { "bgcolor": "white", "showland": true, "lakecolor": "white", "landcolor": "white", "showlakes": true, "subunitcolor": "#C8D4E3" }, "font": { "color": "#2a3f5f" }, "polar": { "bgcolor": "white", "radialaxis": { "ticks": "", "gridcolor": "#EBF0F8", "linecolor": "#EBF0F8" }, "angularaxis": { "ticks": "", "gridcolor": "#EBF0F8", "linecolor": "#EBF0F8" } }, "scene": { "xaxis": { "ticks": "", "gridcolor": "#DFE8F3", "gridwidth": 2, "linecolor": "#EBF0F8", "zerolinecolor": "#EBF0F8", "showbackground": true, "backgroundcolor": "white" }, "yaxis": { "ticks": "", "gridcolor": "#DFE8F3", "gridwidth": 2, "linecolor": "#EBF0F8", "zerolinecolor": "#EBF0F8", "showbackground": true, "backgroundcolor": "white" }, "zaxis": { "ticks": "", "gridcolor": "#DFE8F3", "gridwidth": 2, "linecolor": "#EBF0F8", "zerolinecolor": "#EBF0F8", "showbackground": true, "backgroundcolor": "white" } }, "title": { "x": 0.05 }, "xaxis": { "ticks": "", "gridcolor": "#EBF0F8", "linecolor": "#EBF0F8", "automargin": true, "zerolinecolor": "#EBF0F8", "zerolinewidth": 2 }, "yaxis": { "ticks": "", "gridcolor": "#EBF0F8", "linecolor": "#EBF0F8", "automargin": true, "zerolinecolor": "#EBF0F8", "zerolinewidth": 2 }, "ternary": { "aaxis": { "ticks": "", "gridcolor": "#DFE8F3", "linecolor": "#A2B1C6" }, "baxis": { "ticks": "", "gridcolor": "#DFE8F3", "linecolor": "#A2B1C6" }, "caxis": { "ticks": "", "gridcolor": "#DFE8F3", "linecolor": "#A2B1C6" }, "bgcolor": "white" }, "colorway": [ "#636efa", "#EF553B", "#00cc96", "#ab63fa", "#19d3f3", "#e763fa", "#fecb52", "#ffa15a", "#ff6692", "#b6e880" ], "hovermode": "closest", "colorscale": { "diverging": [ [ 0, "#8e0152" ], [ 0.1, "#c51b7d" ], [ 0.2, "#de77ae" ], [ 0.3, "#f1b6da" ], [ 0.4, "#fde0ef" ], [ 0.5, "#f7f7f7" ], [ 0.6, "#e6f5d0" ], [ 0.7, "#b8e186" ], [ 0.8, "#7fbc41" ], [ 0.9, "#4d9221" ], [ 1, "#276419" ] ], "sequential": [ [ 0, "#0508b8" ], [ 0.0893854748603352, "#1910d8" ], [ 0.1787709497206704, "#3c19f0" ], [ 0.2681564245810056, "#6b1cfb" ], [ 0.3575418994413408, "#981cfd" ], [ 0.44692737430167595, "#bf1cfd" ], [ 0.5363128491620112, "#dd2bfd" ], [ 0.6256983240223464, "#f246fe" ], [ 0.7150837988826816, "#fc67fd" ], [ 0.8044692737430168, "#fe88fc" ], [ 0.8938547486033519, "#fea5fd" ], [ 0.9832402234636871, "#febefe" ], [ 1, "#fec3fe" ] ], "sequentialminus": [ [ 0, "#0508b8" ], [ 0.0893854748603352, "#1910d8" ], [ 0.1787709497206704, "#3c19f0" ], [ 0.2681564245810056, "#6b1cfb" ], [ 0.3575418994413408, "#981cfd" ], [ 0.44692737430167595, "#bf1cfd" ], [ 0.5363128491620112, "#dd2bfd" ], [ 0.6256983240223464, "#f246fe" ], [ 0.7150837988826816, "#fc67fd" ], [ 0.8044692737430168, "#fe88fc" ], [ 0.8938547486033519, "#fea5fd" ], [ 0.9832402234636871, "#febefe" ], [ 1, "#fec3fe" ] ] }, "plot_bgcolor": "white", "paper_bgcolor": "white", "shapedefaults": { "line": { "width": 0 }, "opacity": 0.4, "fillcolor": "#506784" }, "annotationdefaults": { "arrowhead": 0, "arrowcolor": "#506784", "arrowwidth": 1 } }, "themeRef": "PLOTLY_WHITE" }, "hovermode": "closest", "showlegend": true } }, "height": null, "width": null, "user": { "profile_url": "https://chart-studio.plotly.com/~dasium", "avatar_url": "https://storage.googleapis.com/plotly-prod-profiles/15.jpg", "background_url": "https://storage.googleapis.com/plotly-prod-profiles/bg-4.jpg", "bio": "", "nickname": "", "website": "", "stream_tokens": null, "feature_set_id": null, "csrf_token": null, "date_joined": "2025-06-21 02:13:03", "mapbox_access_tokens": null, "has_password": null, "username": "dasium", "email": null, "is_active": null, "readonly": null, "is_dash_creator": null, "dash_created_count": null, "is_chart_creator": null, "charts_created_count": null } } ] }