Plots List
Plots
This endpoint handles manipulation of Plotly plot files.
Reference
Authorization
Any user with or without a Plotly account may view public plots. For private plots, see authentication.
Actions
list
Listing all public plots can be done via a GET request to this endpoint.
By default, plots will be listed in order of date created. The order_by
query parameter is accepted at this endpoint. Currently, only ordering by
views is supported. It is possible to filter the plots by quality
with min_quality or max_quality as query parameter.
Example:
// GET https://api.plotly.com/v2/plots/ ---> 200

// GET https://api.plotly.com/v2/plots/?order_by=-views ---> 200

// GET https://api.plotly.com/v2/plots/?min_quality=5 ---> 200

// GET https://api.plotly.com/v2/plots/?max_quality=5 ---> 200
feed
Listing all handpicked feed plots can be done via a GET request to this endpoint. By default, plots will be listed in a random order.
Example:
// GET https://api.plotly.com/v2/plots/feed ---> 200
create
You can create new plot resources here. The only required field is 'figure'. Currently, the figure is restricted to only contain references to grid data. That is, this will fail if raw data arrays are passed in. To create and manipulate underlying grids for plots, see the grids endpoint.
Example:
// This fails because a figure field is required.
// POST https://api.plotly.com/v2/plots ---> 400 Bad Request
{}

// This fails because the figure has raw data
//POST https://api.plotly.com/v2/plots ---> 400 Bad Request
{
    "figure": {"data": [{"y": ['this', 'is', 'raw', 'data']}]}
}

// This succeeds because the figure has src keys, not raw data.
//POST https://api.plotly.com/v2/plots ---> 200 OK
{
    "figure": {"data": [{"ysrc": "sven:88:u8nd62"}]}
}
When creating a grid, you can optionally specify a source_fid to specify where a plot has come from:
- source_fid: the fid of a plot that was copied (and presumably edited) to produce this one
detail
There is a lot of meta information stored about plot files including filename, title, share_url, and content_url to name a few.
This information can only be reached with a GET to this endpoint.
Example:
// GET https://api.plotly.com/v2/plots/iheartgraphs:90
content
The contents of a plot can be downloaded via the content resource. The plot
content contains referenced grid/column data by default. If you wish to
return the raw grid/column data, the inline_data=true query must be included
in the request url. The Content-Type header will be appropriately set for the
response body.
Alternatively, you can set ?map_data=unreadable to append a mapping of
sources to data that belongs to grids which are unreadable for the
requestor. This is useful when you have read access to another users plot,
but that plot contains grid references which you don't have access to.
Examples:
// Returns referenced grid/column data
// GET https://api.plotly.com/v2/plots/iheartgraphs:90/content ---> 200 OK

// Returns full grid/column data
// GET https://api.plotly.com/v2/plots/iheartgraphs:90/content?inline_data=true ---> 200 OK

// Returns full grid/column data when requestor doesn't have permission
// to read the referenced grid.
// GET https://api.plotly.com/v2/plots/iheartgraphs:90/content?map_data=unreadable ---> 200 OK
GET /v2/plots/?cursor=cj0xJnA9MjAyNS0wOC0yNSswNyUzQTQ5JTNBNTEuMzIwMjg4JTJCMDAlM0EwMA%3D%3D&format=api
{ "next": "https://api.plotly.com/v2/plots/?cursor=cD0yMDI1LTA4LTI1KzA4JTNBNDglM0E1Mi44Mjg0MjAlMkIwMCUzQTAw&format=api", "previous": "https://api.plotly.com/v2/plots/?cursor=cj0xJnA9MjAyNS0wOC0yNSsxNSUzQTQxJTNBMjMuODc5MjE1JTJCMDAlM0EwMA%3D%3D&format=api", "results": [ { "creation_time": "2025-08-25T15:41:23.879215Z", "comments": { "results": [], "count": 0 }, "parented": true, "embed_url": "https://chart-studio.plotly.com/~Rouzbeh-hg/5.embed", "fid": "Rouzbeh-hg:5", "filename": "Plot 5", "filetype": "plot", "img_url": "https://storage.googleapis.com/plotly-prod-images/Rouzbeh-hg/5/9_LN9VL5VXA2ZZHAMGSWR5DEE9TTXYQT.png", "image_urls": { "default": "https://storage.googleapis.com/plotly-prod-images/Rouzbeh-hg/5/2_ZK82VAE633040G1T9DKPF21MJR5UZT.png", "block-thumb": "https://storage.googleapis.com/plotly-prod-images/Rouzbeh-hg/5/8_DX1NPZBYV2TXPXEQVW1TG75TBVQJKN.png", "list-thumb": "https://storage.googleapis.com/plotly-prod-images/Rouzbeh-hg/5/9_LN9VL5VXA2ZZHAMGSWR5DEE9TTXYQT.png" }, "api_urls": { "files": "https://api.plotly.com/v2/files/Rouzbeh-hg:5", "plots": "https://api.plotly.com/v2/plots/Rouzbeh-hg:5", "parent": "https://api.plotly.com/v2/folders/home?user=Rouzbeh-hg" }, "owner": "Rouzbeh-hg", "parent": -1, "preview": "", "referencers": [], "references": [], "title": "", "views": 0, "web_url": "https://chart-studio.plotly.com/~Rouzbeh-hg/5/", "world_readable": true, "date_modified": "2025-08-26T15:24:41.023Z", "stars": { "results": [], "count": 0 }, "collaborators": { "results": [], "count": 0 }, "subfolder_count": null, "refresh_interval": null, "organize_view_url": "https://chart-studio.plotly.com/~Rouzbeh-hg/5/", "current_user_permission": "read", "is_theme": null, "is_template": false, "autosize": true, "caption": "", "figure": { "data": [ { "meta": { "columnNames": { "x": "P", "y": "Q" } }, "mode": "markers", "name": "Cross-section IQR values (line-based vs buffer-based)", "type": "scatter", "xsrc": "Rouzbeh-hg:4:771ee7", "ysrc": "Rouzbeh-hg:4:889520", "hoverlabel": { "align": "auto" } }, { "meta": { "columnNames": { "x": "X", "y": "Y" } }, "mode": "lines", "name": "1:1 reference line", "type": "scatter", "xsrc": "Rouzbeh-hg:4:d9c382", "ysrc": "Rouzbeh-hg:4:c8dccd" } ], "frames": [], "layout": { "font": { "size": 15 }, "xaxis": { "type": "linear", "range": [ -0.018288654854878194, 0.8 ], "title": { "font": { "family": "Times New Roman" }, "text": "Line-based IQR (m)" }, "showgrid": false, "tickfont": { "size": 20, "family": "Times New Roman" }, "autorange": true, "showspikes": false }, "yaxis": { "type": "linear", "range": [ -0.04444444444444445, 0.8444444444444446 ], "title": { "font": { "family": "Times New Roman" }, "text": "Buffer-based IQR (m)" }, "showgrid": false, "tickfont": { "size": 20, "family": "Times New Roman" }, "autorange": true, "showspikes": false }, "legend": { "font": { "family": "Times New Roman" }, "valign": "middle", "xanchor": "right", "yanchor": "auto", "orientation": "v" }, "autosize": true, "dragmode": "pan", "template": { "data": { "bar": [ { "type": "bar", "marker": { "colorbar": { "ticks": "", "outlinewidth": 0 } } } ], "table": [ { "type": "table", "cells": { "fill": { "color": "#EBF0F8" }, "line": { "color": "white" } }, "header": { "fill": { "color": "#C8D4E3" }, "line": { "color": "white" } } } ], "carpet": [ { "type": "carpet", "aaxis": { "gridcolor": "#C8D4E3", "linecolor": "#C8D4E3", "endlinecolor": "#2a3f5f", "minorgridcolor": "#C8D4E3", "startlinecolor": "#2a3f5f" }, "baxis": { "gridcolor": "#C8D4E3", "linecolor": "#C8D4E3", "endlinecolor": "#2a3f5f", "minorgridcolor": "#C8D4E3", "startlinecolor": "#2a3f5f" } } ], "mesh3d": [ { "type": "mesh3d", "colorbar": { "ticks": "", "outlinewidth": 0 } } ], "contour": [ { "type": "contour", "colorbar": { "ticks": "", "outlinewidth": 0 }, "autocolorscale": true } ], "heatmap": [ { "type": "heatmap", "colorbar": { "ticks": "", "outlinewidth": 0 }, "autocolorscale": true } ], "scatter": [ { "type": "scatter", "marker": { "colorbar": { "ticks": "", "outlinewidth": 0 } } } ], "surface": [ { "type": "surface", "colorbar": { "ticks": "", "outlinewidth": 0 } } ], "heatmapgl": [ { "type": "heatmapgl", "colorbar": { "ticks": "", "outlinewidth": 0 } } ], "histogram": [ { "type": "histogram", "marker": { "colorbar": { "ticks": "", "outlinewidth": 0 } } } ], "parcoords": [ { "line": { "colorbar": { "ticks": "", "outlinewidth": 0 } }, "type": "parcoords" } ], "scatter3d": [ { "type": "scatter3d", "marker": { "colorbar": { "ticks": "", "outlinewidth": 0 } } } ], "scattergl": [ { "type": "scattergl", "marker": { "colorbar": { "ticks": "", "outlinewidth": 0 } } } ], "choropleth": [ { "type": "choropleth", "colorbar": { "ticks": "", "outlinewidth": 0 } } ], "scattergeo": [ { "type": "scattergeo", "marker": { "colorbar": { "ticks": "", "outlinewidth": 0 } } } ], "histogram2d": [ { "type": "histogram2d", "colorbar": { "ticks": "", "outlinewidth": 0 }, "autocolorscale": true } ], "scatterpolar": [ { "type": "scatterpolar", "marker": { "colorbar": { "ticks": "", "outlinewidth": 0 } } } ], "contourcarpet": [ { "type": "contourcarpet", "colorbar": { "ticks": "", "outlinewidth": 0 } } ], "scattercarpet": [ { "type": "scattercarpet", "marker": { "colorbar": { "ticks": "", "outlinewidth": 0 } } } ], "scattermapbox": [ { "type": "scattermapbox", "marker": { "colorbar": { "ticks": "", "outlinewidth": 0 } } } ], "scatterpolargl": [ { "type": "scatterpolargl", "marker": { "colorbar": { "ticks": "", "outlinewidth": 0 } } } ], "scatterternary": [ { "type": "scatterternary", "marker": { "colorbar": { "ticks": "", "outlinewidth": 0 } } } ], "histogram2dcontour": [ { "type": "histogram2dcontour", "colorbar": { "ticks": "", "outlinewidth": 0 }, "autocolorscale": true } ] }, "layout": { "geo": { "bgcolor": "white", "showland": true, "lakecolor": "white", "landcolor": "white", "showlakes": true, "subunitcolor": "#C8D4E3" }, "font": { "color": "#2a3f5f" }, "polar": { "bgcolor": "white", "radialaxis": { "ticks": "", "gridcolor": "#EBF0F8", "linecolor": "#EBF0F8" }, "angularaxis": { "ticks": "", "gridcolor": "#EBF0F8", "linecolor": "#EBF0F8" } }, "scene": { "xaxis": { "ticks": "", "gridcolor": "#DFE8F3", "gridwidth": 2, "linecolor": "#EBF0F8", "zerolinecolor": "#EBF0F8", "showbackground": true, "backgroundcolor": "white" }, "yaxis": { "ticks": "", "gridcolor": "#DFE8F3", "gridwidth": 2, "linecolor": "#EBF0F8", "zerolinecolor": "#EBF0F8", "showbackground": true, "backgroundcolor": "white" }, "zaxis": { "ticks": "", "gridcolor": "#DFE8F3", "gridwidth": 2, "linecolor": "#EBF0F8", "zerolinecolor": "#EBF0F8", "showbackground": true, "backgroundcolor": "white" } }, "title": { "x": 0.05 }, "xaxis": { "ticks": "", "gridcolor": "#EBF0F8", "linecolor": "#EBF0F8", "automargin": true, "zerolinecolor": "#EBF0F8", "zerolinewidth": 2 }, "yaxis": { "ticks": "", "gridcolor": "#EBF0F8", "linecolor": "#EBF0F8", "automargin": true, "zerolinecolor": "#EBF0F8", "zerolinewidth": 2 }, "ternary": { "aaxis": { "ticks": "", "gridcolor": "#DFE8F3", "linecolor": "#A2B1C6" }, "baxis": { "ticks": "", "gridcolor": "#DFE8F3", "linecolor": "#A2B1C6" }, "caxis": { "ticks": "", "gridcolor": "#DFE8F3", "linecolor": "#A2B1C6" }, "bgcolor": "white" }, "colorway": [ "#636efa", "#EF553B", "#00cc96", "#ab63fa", "#19d3f3", "#e763fa", "#fecb52", "#ffa15a", "#ff6692", "#b6e880" ], "hovermode": "closest", "colorscale": { "diverging": [ [ 0, "#8e0152" ], [ 0.1, "#c51b7d" ], [ 0.2, "#de77ae" ], [ 0.3, "#f1b6da" ], [ 0.4, "#fde0ef" ], [ 0.5, "#f7f7f7" ], [ 0.6, "#e6f5d0" ], [ 0.7, "#b8e186" ], [ 0.8, "#7fbc41" ], [ 0.9, "#4d9221" ], [ 1, "#276419" ] ], "sequential": [ [ 0, "#0508b8" ], [ 0.0893854748603352, "#1910d8" ], [ 0.1787709497206704, "#3c19f0" ], [ 0.2681564245810056, "#6b1cfb" ], [ 0.3575418994413408, "#981cfd" ], [ 0.44692737430167595, "#bf1cfd" ], [ 0.5363128491620112, "#dd2bfd" ], [ 0.6256983240223464, "#f246fe" ], [ 0.7150837988826816, "#fc67fd" ], [ 0.8044692737430168, "#fe88fc" ], [ 0.8938547486033519, "#fea5fd" ], [ 0.9832402234636871, "#febefe" ], [ 1, "#fec3fe" ] ], "sequentialminus": [ [ 0, "#0508b8" ], [ 0.0893854748603352, "#1910d8" ], [ 0.1787709497206704, "#3c19f0" ], [ 0.2681564245810056, "#6b1cfb" ], [ 0.3575418994413408, "#981cfd" ], [ 0.44692737430167595, "#bf1cfd" ], [ 0.5363128491620112, "#dd2bfd" ], [ 0.6256983240223464, "#f246fe" ], [ 0.7150837988826816, "#fc67fd" ], [ 0.8044692737430168, "#fe88fc" ], [ 0.8938547486033519, "#fea5fd" ], [ 0.9832402234636871, "#febefe" ], [ 1, "#fec3fe" ] ] }, "plot_bgcolor": "white", "paper_bgcolor": "white", "shapedefaults": { "line": { "width": 0 }, "opacity": 0.4, "fillcolor": "#506784" }, "annotationdefaults": { "arrowhead": 0, "arrowcolor": "#506784", "arrowwidth": 1 } }, "themeRef": "PLOTLY_WHITE" }, "showlegend": true } }, "height": null, "width": null, "user": { "profile_url": "https://chart-studio.plotly.com/~Rouzbeh-hg", "avatar_url": "https://storage.googleapis.com/plotly-prod-profiles/59.jpg", "background_url": "https://storage.googleapis.com/plotly-prod-profiles/bg-8.jpg", "bio": "", "nickname": "", "website": "", "stream_tokens": null, "feature_set_id": null, "csrf_token": null, "date_joined": "2025-08-19 18:39:56", "mapbox_access_tokens": null, "has_password": null, "username": "Rouzbeh-hg", "email": null, "is_active": null, "readonly": null, "is_dash_creator": null, "dash_created_count": null, "is_chart_creator": null, "charts_created_count": null } }, { "creation_time": "2025-08-25T14:01:14.445693Z", "comments": { "results": [], "count": 0 }, "parented": true, "embed_url": "https://chart-studio.plotly.com/~Anzonia_Farrant/1.embed", "fid": "Anzonia_Farrant:1", "filename": "Plot 1", "filetype": "plot", "img_url": "https://storage.googleapis.com/plotly-prod-images/Anzonia_Farrant/1/9_SKHY3NQB42ERESNQKTW4T1PTCMWTYR.png", "image_urls": { "default": "https://storage.googleapis.com/plotly-prod-images/Anzonia_Farrant/1/2_WSPUJ4IVOXYUIMLLAJFHKZ5QJSW8YA.png", "block-thumb": "https://storage.googleapis.com/plotly-prod-images/Anzonia_Farrant/1/8_J67BK4TI87VQFVZP4V4D2LMQOX5QKQ.png", "list-thumb": "https://storage.googleapis.com/plotly-prod-images/Anzonia_Farrant/1/9_SKHY3NQB42ERESNQKTW4T1PTCMWTYR.png" }, "api_urls": { "files": "https://api.plotly.com/v2/files/Anzonia_Farrant:1", "plots": "https://api.plotly.com/v2/plots/Anzonia_Farrant:1", "parent": "https://api.plotly.com/v2/folders/home?user=Anzonia_Farrant" }, "owner": "Anzonia_Farrant", "parent": -1, "preview": "", "referencers": [], "references": [], "title": "", "views": 0, "web_url": "https://chart-studio.plotly.com/~Anzonia_Farrant/1/", "world_readable": true, "date_modified": "2025-08-25T14:01:14.456Z", "stars": { "results": [], "count": 0 }, "collaborators": { "results": [], "count": 0 }, "subfolder_count": null, "refresh_interval": null, "organize_view_url": "https://chart-studio.plotly.com/~Anzonia_Farrant/1/", "current_user_permission": "read", "is_theme": null, "is_template": false, "autosize": true, "caption": "", "figure": { "data": [ { "line": { "color": "rgb(0, 84, 86)" }, "meta": { "columnNames": { "x": "Baby 101", "text": "Baby 101" } }, "mode": "markers", "name": "Baby 101", "type": "box", "xsrc": "Anzonia_Farrant:0:db1616", "marker": { "line": { "color": "rgb(0, 84, 86)" }, "color": "rgb(0, 84, 86)" }, "boxmean": true, "hoveron": "boxes", "notched": false, "textsrc": "Anzonia_Farrant:0:db1616", "boxpoints": "outliers", "hoverinfo": "x+y+name", "showlegend": true, "whiskerwidth": 0.5 }, { "line": { "color": "rgb(0, 122, 123)" }, "meta": { "columnNames": { "x": "Calm Birth" } }, "name": "Calm Birth", "type": "box", "xsrc": "Anzonia_Farrant:0:c1e527", "boxmean": true, "boxpoints": "outliers", "showlegend": true }, { "line": { "color": "rgb(31, 161, 162)" }, "meta": { "columnNames": { "x": "Childbirth Education Classes In Person" } }, "name": "Childbirth Education <br>Classes In Person", "type": "box", "xsrc": "Anzonia_Farrant:0:18703e", "boxmean": true, "boxpoints": "outliers" }, { "line": { "color": "rgb(87, 203, 203)" }, "meta": { "columnNames": { "x": "D" } }, "name": "Platinum All In One Day", "type": "box", "xsrc": "Anzonia_Farrant:0:a51c63", "boxmean": true, "notched": false, "boxpoints": "outliers", "orientation": "h" } ], "frames": [], "layout": { "font": { "size": 12, "family": "Arial" }, "title": { "x": 0.5, "font": { "size": 18, "color": "rgb(104, 104, 104)" }, "text": "<b>Summary of how many weeks pregnant a mother is when registering for services</b>" }, "xaxis": { "type": "linear", "dtick": 2, "range": [ -2.797356828193833, 47.202643171806166 ], "tick0": 2, "ticks": "outside", "title": { "font": { "size": 14, "color": "rgb(104, 104, 104)" }, "text": "<b>Number of Weeks pregnant when registering for a service</b>" }, "nticks": 0, "ticklen": 6, "tickson": "labels", "showgrid": true, "showline": true, "tickfont": { "family": "Arial" }, "tickmode": "linear", "autorange": false, "gridwidth": 1, "linewidth": 2, "tickwidth": 2, "showspikes": false, "rangeslider": { "range": [ -3.3611111111111116, 47.202643171806166 ], "yaxis": {}, "visible": false, "autorange": true }, "zerolinewidth": 2, "spikethickness": 15 }, "yaxis": { "type": "category", "dtick": 0, "range": [ -0.2870722433460076, 3.7129277566539924 ], "tick0": 6, "ticks": "", "title": { "text": "" }, "nticks": -1, "tickson": "labels", "showgrid": true, "showline": false, "tickfont": { "family": "Arial" }, "tickmode": "auto", "zeroline": false, "autorange": false, "tickwidth": 2, "showspikes": true, "spikethickness": 15 }, "boxmode": "overlay", "modebar": { "color": "rgba(255, 255, 255, 0.3)", "orientation": "h" }, "autosize": true, "dragmode": "pan", "clickmode": "event", "hovermode": "closest", "annotations": [ { "x": 29.599092875948177, "y": 0.4049429657794677, "text": "Mean: 29.6", "yanchor": "middle", "showarrow": false }, { "x": 28.514280252674016, "y": 1.4239543726235742, "ax": 49, "ay": -20, "text": "Mean: 27.6", "showarrow": false }, { "x": 29.599092875948177, "y": 2.397338403041825, "text": "Mean: 29.2", "showarrow": false }, { "x": 27.330848300011294, "y": 3.3859315589353614, "text": "Mean: 27.3", "showarrow": false } ] } }, "height": null, "width": null, "user": { "profile_url": "https://chart-studio.plotly.com/~Anzonia_Farrant", "avatar_url": "https://storage.googleapis.com/plotly-prod-profiles/86.jpg", "background_url": "https://storage.googleapis.com/plotly-prod-profiles/bg-12.jpg", "bio": "", "nickname": "", "website": "", "stream_tokens": null, "feature_set_id": null, "csrf_token": null, "date_joined": "2025-08-25 14:00:04", "mapbox_access_tokens": null, "has_password": null, "username": "Anzonia_Farrant", "email": null, "is_active": null, "readonly": null, "is_dash_creator": null, "dash_created_count": null, "is_chart_creator": null, "charts_created_count": null } }, { "creation_time": "2025-08-25T12:54:25.774726Z", "comments": { "results": [], "count": 0 }, "parented": true, "embed_url": "https://chart-studio.plotly.com/~duresameen/1.embed", "fid": "duresameen:1", "filename": "Plot 1", "filetype": "plot", "img_url": "https://storage.googleapis.com/plotly-prod-images/duresameen/1/9_QUY1KBA791A1IM05O3WJL0HDA87307.png", "image_urls": { "default": "https://storage.googleapis.com/plotly-prod-images/duresameen/1/2_PVX8WJW4J0FNJTL3U7DXA9BKW9JJ6A.png", "block-thumb": "https://storage.googleapis.com/plotly-prod-images/duresameen/1/8_IDXP9YHJQGPG18824L1DKWPVM4H4FE.png", "list-thumb": "https://storage.googleapis.com/plotly-prod-images/duresameen/1/9_QUY1KBA791A1IM05O3WJL0HDA87307.png" }, "api_urls": { "files": "https://api.plotly.com/v2/files/duresameen:1", "plots": "https://api.plotly.com/v2/plots/duresameen:1", "parent": "https://api.plotly.com/v2/folders/home?user=duresameen" }, "owner": "duresameen", "parent": -1, "preview": "", "referencers": [], "references": [], "title": "", "views": 0, "web_url": "https://chart-studio.plotly.com/~duresameen/1/", "world_readable": true, "date_modified": "2025-08-25T12:54:25.785Z", "stars": { "results": [], "count": 0 }, "collaborators": { "results": [], "count": 0 }, "subfolder_count": null, "refresh_interval": null, "organize_view_url": "https://chart-studio.plotly.com/~duresameen/1/", "current_user_permission": "read", "is_theme": null, "is_template": false, "autosize": true, "caption": "", "figure": { "data": [ { "meta": { "columnNames": { "y": "TimeMs_Staging" } }, "mode": "lines", "name": "%{meta.columnNames.y}", "type": "scatter", "ysrc": "duresameen:0:1ce09c", "stackgroup": null }, { "meta": { "columnNames": { "y": " TimeMs_Production" } }, "mode": "lines", "name": "%{meta.columnNames.y}", "type": "scatter", "ysrc": "duresameen:0:178d7a", "stackgroup": null } ], "frames": [], "layout": { "title": { "text": "Click to enter Plot title" }, "xaxis": { "range": [ 55.44609665427509, 55.44609665427509 ], "title": { "text": "$\\text{}$" }, "showline": true, "autorange": false }, "yaxis": { "type": "linear", "range": [ 73303.74662162163, 73303.74662162163 ], "title": { "text": "duration ms" }, "autorange": false }, "autosize": true, "template": { "data": { "bar": [ { "type": "bar", "marker": { "colorbar": { "ticks": "", "outlinewidth": 0 } } } ], "table": [ { "type": "table", "cells": { "fill": { "color": "#EBF0F8" }, "line": { "color": "white" } }, "header": { "fill": { "color": "#C8D4E3" }, "line": { "color": "white" } } } ], "carpet": [ { "type": "carpet", "aaxis": { "gridcolor": "#C8D4E3", "linecolor": "#C8D4E3", "endlinecolor": "#2a3f5f", "minorgridcolor": "#C8D4E3", "startlinecolor": "#2a3f5f" }, "baxis": { "gridcolor": "#C8D4E3", "linecolor": "#C8D4E3", "endlinecolor": "#2a3f5f", "minorgridcolor": "#C8D4E3", "startlinecolor": "#2a3f5f" } } ], "mesh3d": [ { "type": "mesh3d", "colorbar": { "ticks": "", "outlinewidth": 0 } } ], "contour": [ { "type": "contour", "colorbar": { "ticks": "", "outlinewidth": 0 }, "autocolorscale": true } ], "heatmap": [ { "type": "heatmap", "colorbar": { "ticks": "", "outlinewidth": 0 }, "autocolorscale": true } ], "scatter": [ { "type": "scatter", "marker": { "colorbar": { "ticks": "", "outlinewidth": 0 } } } ], "surface": [ { "type": "surface", "colorbar": { "ticks": "", "outlinewidth": 0 } } ], "heatmapgl": [ { "type": "heatmapgl", "colorbar": { "ticks": "", "outlinewidth": 0 } } ], "histogram": [ { "type": "histogram", "marker": { "colorbar": { "ticks": "", "outlinewidth": 0 } } } ], "parcoords": [ { "line": { "colorbar": { "ticks": "", "outlinewidth": 0 } }, "type": "parcoords" } ], "scatter3d": [ { "type": "scatter3d", "marker": { "colorbar": { "ticks": "", "outlinewidth": 0 } } } ], "scattergl": [ { "type": "scattergl", "marker": { "colorbar": { "ticks": "", "outlinewidth": 0 } } } ], "choropleth": [ { "type": "choropleth", "colorbar": { "ticks": "", "outlinewidth": 0 } } ], "scattergeo": [ { "type": "scattergeo", "marker": { "colorbar": { "ticks": "", "outlinewidth": 0 } } } ], "histogram2d": [ { "type": "histogram2d", "colorbar": { "ticks": "", "outlinewidth": 0 }, "autocolorscale": true } ], "scatterpolar": [ { "type": "scatterpolar", "marker": { "colorbar": { "ticks": "", "outlinewidth": 0 } } } ], "contourcarpet": [ { "type": "contourcarpet", "colorbar": { "ticks": "", "outlinewidth": 0 } } ], "scattercarpet": [ { "type": "scattercarpet", "marker": { "colorbar": { "ticks": "", "outlinewidth": 0 } } } ], "scattermapbox": [ { "type": "scattermapbox", "marker": { "colorbar": { "ticks": "", "outlinewidth": 0 } } } ], "scatterpolargl": [ { "type": "scatterpolargl", "marker": { "colorbar": { "ticks": "", "outlinewidth": 0 } } } ], "scatterternary": [ { "type": "scatterternary", "marker": { "colorbar": { "ticks": "", "outlinewidth": 0 } } } ], "histogram2dcontour": [ { "type": "histogram2dcontour", "colorbar": { "ticks": "", "outlinewidth": 0 }, "autocolorscale": true } ] }, "layout": { "geo": { "bgcolor": "white", "showland": true, "lakecolor": "white", "landcolor": "white", "showlakes": true, "subunitcolor": "#C8D4E3" }, "font": { "color": "#2a3f5f" }, "polar": { "bgcolor": "white", "radialaxis": { "ticks": "", "gridcolor": "#EBF0F8", "linecolor": "#EBF0F8" }, "angularaxis": { "ticks": "", "gridcolor": "#EBF0F8", "linecolor": "#EBF0F8" } }, "scene": { "xaxis": { "ticks": "", "gridcolor": "#DFE8F3", "gridwidth": 2, "linecolor": "#EBF0F8", "zerolinecolor": "#EBF0F8", "showbackground": true, "backgroundcolor": "white" }, "yaxis": { "ticks": "", "gridcolor": "#DFE8F3", "gridwidth": 2, "linecolor": "#EBF0F8", "zerolinecolor": "#EBF0F8", "showbackground": true, "backgroundcolor": "white" }, "zaxis": { "ticks": "", "gridcolor": "#DFE8F3", "gridwidth": 2, "linecolor": "#EBF0F8", "zerolinecolor": "#EBF0F8", "showbackground": true, "backgroundcolor": "white" } }, "title": { "x": 0.05 }, "xaxis": { "ticks": "", "gridcolor": "#EBF0F8", "linecolor": "#EBF0F8", "automargin": true, "zerolinecolor": "#EBF0F8", "zerolinewidth": 2 }, "yaxis": { "ticks": "", "gridcolor": "#EBF0F8", "linecolor": "#EBF0F8", "automargin": true, "zerolinecolor": "#EBF0F8", "zerolinewidth": 2 }, "ternary": { "aaxis": { "ticks": "", "gridcolor": "#DFE8F3", "linecolor": "#A2B1C6" }, "baxis": { "ticks": "", "gridcolor": "#DFE8F3", "linecolor": "#A2B1C6" }, "caxis": { "ticks": "", "gridcolor": "#DFE8F3", "linecolor": "#A2B1C6" }, "bgcolor": "white" }, "colorway": [ "#636efa", "#EF553B", "#00cc96", "#ab63fa", "#19d3f3", "#e763fa", "#fecb52", "#ffa15a", "#ff6692", "#b6e880" ], "hovermode": "closest", "colorscale": { "diverging": [ [ 0, "#8e0152" ], [ 0.1, "#c51b7d" ], [ 0.2, "#de77ae" ], [ 0.3, "#f1b6da" ], [ 0.4, "#fde0ef" ], [ 0.5, "#f7f7f7" ], [ 0.6, "#e6f5d0" ], [ 0.7, "#b8e186" ], [ 0.8, "#7fbc41" ], [ 0.9, "#4d9221" ], [ 1, "#276419" ] ], "sequential": [ [ 0, "#0508b8" ], [ 0.0893854748603352, "#1910d8" ], [ 0.1787709497206704, "#3c19f0" ], [ 0.2681564245810056, "#6b1cfb" ], [ 0.3575418994413408, "#981cfd" ], [ 0.44692737430167595, "#bf1cfd" ], [ 0.5363128491620112, "#dd2bfd" ], [ 0.6256983240223464, "#f246fe" ], [ 0.7150837988826816, "#fc67fd" ], [ 0.8044692737430168, "#fe88fc" ], [ 0.8938547486033519, "#fea5fd" ], [ 0.9832402234636871, "#febefe" ], [ 1, "#fec3fe" ] ], "sequentialminus": [ [ 0, "#0508b8" ], [ 0.0893854748603352, "#1910d8" ], [ 0.1787709497206704, "#3c19f0" ], [ 0.2681564245810056, "#6b1cfb" ], [ 0.3575418994413408, "#981cfd" ], [ 0.44692737430167595, "#bf1cfd" ], [ 0.5363128491620112, "#dd2bfd" ], [ 0.6256983240223464, "#f246fe" ], [ 0.7150837988826816, "#fc67fd" ], [ 0.8044692737430168, "#fe88fc" ], [ 0.8938547486033519, "#fea5fd" ], [ 0.9832402234636871, "#febefe" ], [ 1, "#fec3fe" ] ] }, "plot_bgcolor": "white", "paper_bgcolor": "white", "shapedefaults": { "line": { "width": 0 }, "opacity": 0.4, "fillcolor": "#506784" }, "annotationdefaults": { "arrowhead": 0, "arrowcolor": "#506784", "arrowwidth": 1 } }, "themeRef": "PLOTLY_WHITE" } } }, "height": null, "width": null, "user": { "profile_url": "https://chart-studio.plotly.com/~duresameen", "avatar_url": "https://storage.googleapis.com/plotly-prod-profiles/96.jpg", "background_url": "https://storage.googleapis.com/plotly-prod-profiles/bg-12.jpg", "bio": "", "nickname": "", "website": "", "stream_tokens": null, "feature_set_id": null, "csrf_token": null, "date_joined": "2025-08-25 11:56:49", "mapbox_access_tokens": null, "has_password": null, "username": "duresameen", "email": null, "is_active": null, "readonly": null, "is_dash_creator": null, "dash_created_count": null, "is_chart_creator": null, "charts_created_count": null } }, { "creation_time": "2025-08-25T12:28:42.225159Z", "comments": { "results": [], "count": 0 }, "parented": true, "embed_url": "https://chart-studio.plotly.com/~chart-niko/2.embed", "fid": "chart-niko:2", "filename": "Plot 2", "filetype": "plot", "img_url": "https://storage.googleapis.com/plotly-prod-images/chart-niko/2/9_2KULSFERQ1OH3FYZL4CW6MC7LKNYPY.png", "image_urls": { "default": "https://storage.googleapis.com/plotly-prod-images/chart-niko/2/2_8WC2AAMSM2WG7J89D27EIZ1SEIQCZZ.png", "block-thumb": "https://storage.googleapis.com/plotly-prod-images/chart-niko/2/8_RDOCARNTBY8NE7CCZ0SVZ1MU7WMI9K.png", "list-thumb": "https://storage.googleapis.com/plotly-prod-images/chart-niko/2/9_2KULSFERQ1OH3FYZL4CW6MC7LKNYPY.png" }, "api_urls": { "files": "https://api.plotly.com/v2/files/chart-niko:2", "plots": "https://api.plotly.com/v2/plots/chart-niko:2", "parent": "https://api.plotly.com/v2/folders/home?user=chart-niko" }, "owner": "chart-niko", "parent": -1, "preview": "", "referencers": [], "references": [], "title": "", "views": 0, "web_url": "https://chart-studio.plotly.com/~chart-niko/2/", "world_readable": true, "date_modified": "2025-08-25T12:30:01.374Z", "stars": { "results": [], "count": 0 }, "collaborators": { "results": [], "count": 0 }, "subfolder_count": null, "refresh_interval": null, "organize_view_url": "https://chart-studio.plotly.com/~chart-niko/2/", "current_user_permission": "read", "is_theme": null, "is_template": false, "autosize": true, "caption": "", "figure": { "data": [ { "meta": { "columnNames": { "x": "Date", "y": "Average_Mark" } }, "mode": "markers", "type": "bar", "xsrc": "chart-niko:1:978324", "ysrc": "chart-niko:1:9bbc21", "orientation": "v" } ], "frames": [], "layout": { "xaxis": { "type": "date", "range": [ "2024-09-30 12:00", "2025-08-18 12:00" ], "autorange": true }, "yaxis": { "type": "linear", "range": [ 0, 81.05263157894737 ], "autorange": true }, "autosize": true, "dragmode": "zoom", "template": { "data": { "bar": [ { "type": "bar", "marker": { "colorbar": { "ticks": "", "outlinewidth": 0 } } } ], "table": [ { "type": "table", "cells": { "fill": { "color": "#EBF0F8" }, "line": { "color": "white" } }, "header": { "fill": { "color": "#C8D4E3" }, "line": { "color": "white" } } } ], "carpet": [ { "type": "carpet", "aaxis": { "gridcolor": "#C8D4E3", "linecolor": "#C8D4E3", "endlinecolor": "#2a3f5f", "minorgridcolor": "#C8D4E3", "startlinecolor": "#2a3f5f" }, "baxis": { "gridcolor": "#C8D4E3", "linecolor": "#C8D4E3", "endlinecolor": "#2a3f5f", "minorgridcolor": "#C8D4E3", "startlinecolor": "#2a3f5f" } } ], "mesh3d": [ { "type": "mesh3d", "colorbar": { "ticks": "", "outlinewidth": 0 } } ], "contour": [ { "type": "contour", "colorbar": { "ticks": "", "outlinewidth": 0 }, "autocolorscale": true } ], "heatmap": [ { "type": "heatmap", "colorbar": { "ticks": "", "outlinewidth": 0 }, "autocolorscale": true } ], "scatter": [ { "type": "scatter", "marker": { "colorbar": { "ticks": "", "outlinewidth": 0 } } } ], "surface": [ { "type": "surface", "colorbar": { "ticks": "", "outlinewidth": 0 } } ], "heatmapgl": [ { "type": "heatmapgl", "colorbar": { "ticks": "", "outlinewidth": 0 } } ], "histogram": [ { "type": "histogram", "marker": { "colorbar": { "ticks": "", "outlinewidth": 0 } } } ], "parcoords": [ { "line": { "colorbar": { "ticks": "", "outlinewidth": 0 } }, "type": "parcoords" } ], "scatter3d": [ { "type": "scatter3d", "marker": { "colorbar": { "ticks": "", "outlinewidth": 0 } } } ], "scattergl": [ { "type": "scattergl", "marker": { "colorbar": { "ticks": "", "outlinewidth": 0 } } } ], "choropleth": [ { "type": "choropleth", "colorbar": { "ticks": "", "outlinewidth": 0 } } ], "scattergeo": [ { "type": "scattergeo", "marker": { "colorbar": { "ticks": "", "outlinewidth": 0 } } } ], "histogram2d": [ { "type": "histogram2d", "colorbar": { "ticks": "", "outlinewidth": 0 }, "autocolorscale": true } ], "scatterpolar": [ { "type": "scatterpolar", "marker": { "colorbar": { "ticks": "", "outlinewidth": 0 } } } ], "contourcarpet": [ { "type": "contourcarpet", "colorbar": { "ticks": "", "outlinewidth": 0 } } ], "scattercarpet": [ { "type": "scattercarpet", "marker": { "colorbar": { "ticks": "", "outlinewidth": 0 } } } ], "scattermapbox": [ { "type": "scattermapbox", "marker": { "colorbar": { "ticks": "", "outlinewidth": 0 } } } ], "scatterpolargl": [ { "type": "scatterpolargl", "marker": { "colorbar": { "ticks": "", "outlinewidth": 0 } } } ], "scatterternary": [ { "type": "scatterternary", "marker": { "colorbar": { "ticks": "", "outlinewidth": 0 } } } ], "histogram2dcontour": [ { "type": "histogram2dcontour", "colorbar": { "ticks": "", "outlinewidth": 0 }, "autocolorscale": true } ] }, "layout": { "geo": { "bgcolor": "white", "showland": true, "lakecolor": "white", "landcolor": "white", "showlakes": true, "subunitcolor": "#C8D4E3" }, "font": { "color": "#2a3f5f" }, "polar": { "bgcolor": "white", "radialaxis": { "ticks": "", "gridcolor": "#EBF0F8", "linecolor": "#EBF0F8" }, "angularaxis": { "ticks": "", "gridcolor": "#EBF0F8", "linecolor": "#EBF0F8" } }, "scene": { "xaxis": { "ticks": "", "gridcolor": "#DFE8F3", "gridwidth": 2, "linecolor": "#EBF0F8", "zerolinecolor": "#EBF0F8", "showbackground": true, "backgroundcolor": "white" }, "yaxis": { "ticks": "", "gridcolor": "#DFE8F3", "gridwidth": 2, "linecolor": "#EBF0F8", "zerolinecolor": "#EBF0F8", "showbackground": true, "backgroundcolor": "white" }, "zaxis": { "ticks": "", "gridcolor": "#DFE8F3", "gridwidth": 2, "linecolor": "#EBF0F8", "zerolinecolor": "#EBF0F8", "showbackground": true, "backgroundcolor": "white" } }, "title": { "x": 0.05 }, "xaxis": { "ticks": "", "gridcolor": "#EBF0F8", "linecolor": "#EBF0F8", "automargin": true, "zerolinecolor": "#EBF0F8", "zerolinewidth": 2 }, "yaxis": { "ticks": "", "gridcolor": "#EBF0F8", "linecolor": "#EBF0F8", "automargin": true, "zerolinecolor": "#EBF0F8", "zerolinewidth": 2 }, "ternary": { "aaxis": { "ticks": "", "gridcolor": "#DFE8F3", "linecolor": "#A2B1C6" }, "baxis": { "ticks": "", "gridcolor": "#DFE8F3", "linecolor": "#A2B1C6" }, "caxis": { "ticks": "", "gridcolor": "#DFE8F3", "linecolor": "#A2B1C6" }, "bgcolor": "white" }, "colorway": [ "#636efa", "#EF553B", "#00cc96", "#ab63fa", "#19d3f3", "#e763fa", "#fecb52", "#ffa15a", "#ff6692", "#b6e880" ], "hovermode": "closest", "colorscale": { "diverging": [ [ 0, "#8e0152" ], [ 0.1, "#c51b7d" ], [ 0.2, "#de77ae" ], [ 0.3, "#f1b6da" ], [ 0.4, "#fde0ef" ], [ 0.5, "#f7f7f7" ], [ 0.6, "#e6f5d0" ], [ 0.7, "#b8e186" ], [ 0.8, "#7fbc41" ], [ 0.9, "#4d9221" ], [ 1, "#276419" ] ], "sequential": [ [ 0, "#0508b8" ], [ 0.0893854748603352, "#1910d8" ], [ 0.1787709497206704, "#3c19f0" ], [ 0.2681564245810056, "#6b1cfb" ], [ 0.3575418994413408, "#981cfd" ], [ 0.44692737430167595, "#bf1cfd" ], [ 0.5363128491620112, "#dd2bfd" ], [ 0.6256983240223464, "#f246fe" ], [ 0.7150837988826816, "#fc67fd" ], [ 0.8044692737430168, "#fe88fc" ], [ 0.8938547486033519, "#fea5fd" ], [ 0.9832402234636871, "#febefe" ], [ 1, "#fec3fe" ] ], "sequentialminus": [ [ 0, "#0508b8" ], [ 0.0893854748603352, "#1910d8" ], [ 0.1787709497206704, "#3c19f0" ], [ 0.2681564245810056, "#6b1cfb" ], [ 0.3575418994413408, "#981cfd" ], [ 0.44692737430167595, "#bf1cfd" ], [ 0.5363128491620112, "#dd2bfd" ], [ 0.6256983240223464, "#f246fe" ], [ 0.7150837988826816, "#fc67fd" ], [ 0.8044692737430168, "#fe88fc" ], [ 0.8938547486033519, "#fea5fd" ], [ 0.9832402234636871, "#febefe" ], [ 1, "#fec3fe" ] ] }, "plot_bgcolor": "white", "paper_bgcolor": "white", "shapedefaults": { "line": { "width": 0 }, "opacity": 0.4, "fillcolor": "#506784" }, "annotationdefaults": { "arrowhead": 0, "arrowcolor": "#506784", "arrowwidth": 1 } }, "themeRef": "PLOTLY_WHITE" } } }, "height": null, "width": null, "user": { "profile_url": "https://chart-studio.plotly.com/~chart-niko", "avatar_url": "https://storage.googleapis.com/plotly-prod-profiles/67.jpg", "background_url": "https://storage.googleapis.com/plotly-prod-profiles/bg-13.jpg", "bio": "", "nickname": "", "website": "", "stream_tokens": null, "feature_set_id": null, "csrf_token": null, "date_joined": "2025-08-25 12:13:21", "mapbox_access_tokens": null, "has_password": null, "username": "chart-niko", "email": null, "is_active": null, "readonly": null, "is_dash_creator": null, "dash_created_count": null, "is_chart_creator": null, "charts_created_count": null } }, { "creation_time": "2025-08-25T11:26:26.730654Z", "comments": { "results": [], "count": 0 }, "parented": true, "embed_url": "https://chart-studio.plotly.com/~RSk1919/1.embed", "fid": "RSk1919:1", "filename": "Plot 1", "filetype": "plot", "img_url": "https://storage.googleapis.com/plotly-prod-images/RSk1919/1/9_2HIDQRNFXF34EADZRZUB5BLE3P8LZQ.png", "image_urls": { "default": "https://storage.googleapis.com/plotly-prod-images/RSk1919/1/2_KUX85QDTE6VB1SVR8DYF528P7720FH.png", "block-thumb": "https://storage.googleapis.com/plotly-prod-images/RSk1919/1/8_13G6RUCFN1GFK7VAPRRAJAIS6D07JR.png", "list-thumb": "https://storage.googleapis.com/plotly-prod-images/RSk1919/1/9_2HIDQRNFXF34EADZRZUB5BLE3P8LZQ.png" }, "api_urls": { "files": "https://api.plotly.com/v2/files/RSk1919:1", "plots": "https://api.plotly.com/v2/plots/RSk1919:1", "parent": "https://api.plotly.com/v2/folders/home?user=RSk1919" }, "owner": "RSk1919", "parent": -1, "preview": "", "referencers": [], "references": [], "title": "", "views": 0, "web_url": "https://chart-studio.plotly.com/~RSk1919/1/", "world_readable": true, "date_modified": "2025-08-25T11:26:41.672Z", "stars": { "results": [], "count": 0 }, "collaborators": { "results": [], "count": 0 }, "subfolder_count": null, "refresh_interval": null, "organize_view_url": "https://chart-studio.plotly.com/~RSk1919/1/", "current_user_permission": "read", "is_theme": null, "is_template": false, "autosize": true, "caption": "", "figure": { "data": [ { "meta": { "columnNames": { "x": "A", "y": "B", "error_y": { "array": "C" } } }, "mode": "markers", "name": "Average (mL)", "type": "scatter", "xsrc": "RSk1919:0:bd39ef", "ysrc": "RSk1919:0:5ce43d", "xaxis": "x", "marker": { "size": 8, "color": "rgb(250, 99, 109)" }, "error_y": { "meta": { "columnNames": { "array": "C" } }, "type": "data", "color": "rgb(99, 178, 250)", "value": 9, "width": 4, "visible": true, "arraysrc": "RSk1919:0:15591d", "symmetric": true, "thickness": 2, "valueminus": 10 }, "visible": true }, { "meta": { "columnNames": { "x": "G", "y": "H" } }, "mode": "lines", "name": "Trend line for average (mL) <br>y = 0.267x² - 4.855x + 48.421<br>\nR² = 0.835", "type": "scatter", "xsrc": "RSk1919:0:ed6a2b", "ysrc": "RSk1919:0:c298d0", "xaxis": "x", "opacity": 1, "visible": true } ], "frames": [], "layout": { "title": { "text": "Effect on Matcha Concentration on Catalase Activity" }, "xaxis": { "side": "bottom", "type": "linear", "dtick": 0.5, "range": [ -0.07227158201830008, 11.18618220395173 ], "tick0": 0, "ticks": "", "title": { "text": "concentration of matcha powder (%)" }, "domain": [ 0, 1 ], "showgrid": true, "tickmode": "linear", "zeroline": true, "autorange": false, "gridwidth": 1, "showspikes": false, "rangeslider": { "range": [ -0.6292268929850153, 11.18618220395173 ], "yaxis": {}, "visible": false, "autorange": true } }, "yaxis": { "type": "linear", "dtick": 5, "range": [ 11.228333333333333, 75.86166666666666 ], "title": { "text": "Volume of oxygen produced (mL) (±0.5mL)" }, "domain": [ 0, 1 ], "tickmode": "linear", "autorange": true }, "legend": { "title": { "font": { "family": "Times New Roman" }, "text": "<br>" } }, "shapes": [], "autosize": true, "template": { "data": { "bar": [ { "type": "bar", "marker": { "colorbar": { "ticks": "", "outlinewidth": 0 } } } ], "table": [ { "type": "table", "cells": { "fill": { "color": "#EBF0F8" }, "line": { "color": "white" } }, "header": { "fill": { "color": "#C8D4E3" }, "line": { "color": "white" } } } ], "carpet": [ { "type": "carpet", "aaxis": { "gridcolor": "#C8D4E3", "linecolor": "#C8D4E3", "endlinecolor": "#2a3f5f", "minorgridcolor": "#C8D4E3", "startlinecolor": "#2a3f5f" }, "baxis": { "gridcolor": "#C8D4E3", "linecolor": "#C8D4E3", "endlinecolor": "#2a3f5f", "minorgridcolor": "#C8D4E3", "startlinecolor": "#2a3f5f" } } ], "mesh3d": [ { "type": "mesh3d", "colorbar": { "ticks": "", "outlinewidth": 0 } } ], "contour": [ { "type": "contour", "colorbar": { "ticks": "", "outlinewidth": 0 }, "autocolorscale": true } ], "heatmap": [ { "type": "heatmap", "colorbar": { "ticks": "", "outlinewidth": 0 }, "autocolorscale": true } ], "scatter": [ { "type": "scatter", "marker": { "colorbar": { "ticks": "", "outlinewidth": 0 } } } ], "surface": [ { "type": "surface", "colorbar": { "ticks": "", "outlinewidth": 0 } } ], "heatmapgl": [ { "type": "heatmapgl", "colorbar": { "ticks": "", "outlinewidth": 0 } } ], "histogram": [ { "type": "histogram", "marker": { "colorbar": { "ticks": "", "outlinewidth": 0 } } } ], "parcoords": [ { "line": { "colorbar": { "ticks": "", "outlinewidth": 0 } }, "type": "parcoords" } ], "scatter3d": [ { "type": "scatter3d", "marker": { "colorbar": { "ticks": "", "outlinewidth": 0 } } } ], "scattergl": [ { "type": "scattergl", "marker": { "colorbar": { "ticks": "", "outlinewidth": 0 } } } ], "choropleth": [ { "type": "choropleth", "colorbar": { "ticks": "", "outlinewidth": 0 } } ], "scattergeo": [ { "type": "scattergeo", "marker": { "colorbar": { "ticks": "", "outlinewidth": 0 } } } ], "histogram2d": [ { "type": "histogram2d", "colorbar": { "ticks": "", "outlinewidth": 0 }, "autocolorscale": true } ], "scatterpolar": [ { "type": "scatterpolar", "marker": { "colorbar": { "ticks": "", "outlinewidth": 0 } } } ], "contourcarpet": [ { "type": "contourcarpet", "colorbar": { "ticks": "", "outlinewidth": 0 } } ], "scattercarpet": [ { "type": "scattercarpet", "marker": { "colorbar": { "ticks": "", "outlinewidth": 0 } } } ], "scattermapbox": [ { "type": "scattermapbox", "marker": { "colorbar": { "ticks": "", "outlinewidth": 0 } } } ], "scatterpolargl": [ { "type": "scatterpolargl", "marker": { "colorbar": { "ticks": "", "outlinewidth": 0 } } } ], "scatterternary": [ { "type": "scatterternary", "marker": { "colorbar": { "ticks": "", "outlinewidth": 0 } } } ], "histogram2dcontour": [ { "type": "histogram2dcontour", "colorbar": { "ticks": "", "outlinewidth": 0 }, "autocolorscale": true } ] }, "layout": { "geo": { "bgcolor": "white", "showland": true, "lakecolor": "white", "landcolor": "white", "showlakes": true, "subunitcolor": "#C8D4E3" }, "font": { "color": "#2a3f5f" }, "polar": { "bgcolor": "white", "radialaxis": { "ticks": "", "gridcolor": "#EBF0F8", "linecolor": "#EBF0F8" }, "angularaxis": { "ticks": "", "gridcolor": "#EBF0F8", "linecolor": "#EBF0F8" } }, "scene": { "xaxis": { "ticks": "", "gridcolor": "#DFE8F3", "gridwidth": 2, "linecolor": "#EBF0F8", "zerolinecolor": "#EBF0F8", "showbackground": true, "backgroundcolor": "white" }, "yaxis": { "ticks": "", "gridcolor": "#DFE8F3", "gridwidth": 2, "linecolor": "#EBF0F8", "zerolinecolor": "#EBF0F8", "showbackground": true, "backgroundcolor": "white" }, "zaxis": { "ticks": "", "gridcolor": "#DFE8F3", "gridwidth": 2, "linecolor": "#EBF0F8", "zerolinecolor": "#EBF0F8", "showbackground": true, "backgroundcolor": "white" } }, "title": { "x": 0.05 }, "xaxis": { "ticks": "", "gridcolor": "#EBF0F8", "linecolor": "#EBF0F8", "automargin": true, "zerolinecolor": "#EBF0F8", "zerolinewidth": 2 }, "yaxis": { "ticks": "", "gridcolor": "#EBF0F8", "linecolor": "#EBF0F8", "automargin": true, "zerolinecolor": "#EBF0F8", "zerolinewidth": 2 }, "ternary": { "aaxis": { "ticks": "", "gridcolor": "#DFE8F3", "linecolor": "#A2B1C6" }, "baxis": { "ticks": "", "gridcolor": "#DFE8F3", "linecolor": "#A2B1C6" }, "caxis": { "ticks": "", "gridcolor": "#DFE8F3", "linecolor": "#A2B1C6" }, "bgcolor": "white" }, "colorway": [ "#636efa", "#EF553B", "#00cc96", "#ab63fa", "#19d3f3", "#e763fa", "#fecb52", "#ffa15a", "#ff6692", "#b6e880" ], "hovermode": "closest", "colorscale": { "diverging": [ [ 0, "#8e0152" ], [ 0.1, "#c51b7d" ], [ 0.2, "#de77ae" ], [ 0.3, "#f1b6da" ], [ 0.4, "#fde0ef" ], [ 0.5, "#f7f7f7" ], [ 0.6, "#e6f5d0" ], [ 0.7, "#b8e186" ], [ 0.8, "#7fbc41" ], [ 0.9, "#4d9221" ], [ 1, "#276419" ] ], "sequential": [ [ 0, "#0508b8" ], [ 0.0893854748603352, "#1910d8" ], [ 0.1787709497206704, "#3c19f0" ], [ 0.2681564245810056, "#6b1cfb" ], [ 0.3575418994413408, "#981cfd" ], [ 0.44692737430167595, "#bf1cfd" ], [ 0.5363128491620112, "#dd2bfd" ], [ 0.6256983240223464, "#f246fe" ], [ 0.7150837988826816, "#fc67fd" ], [ 0.8044692737430168, "#fe88fc" ], [ 0.8938547486033519, "#fea5fd" ], [ 0.9832402234636871, "#febefe" ], [ 1, "#fec3fe" ] ], "sequentialminus": [ [ 0, "#0508b8" ], [ 0.0893854748603352, "#1910d8" ], [ 0.1787709497206704, "#3c19f0" ], [ 0.2681564245810056, "#6b1cfb" ], [ 0.3575418994413408, "#981cfd" ], [ 0.44692737430167595, "#bf1cfd" ], [ 0.5363128491620112, "#dd2bfd" ], [ 0.6256983240223464, "#f246fe" ], [ 0.7150837988826816, "#fc67fd" ], [ 0.8044692737430168, "#fe88fc" ], [ 0.8938547486033519, "#fea5fd" ], [ 0.9832402234636871, "#febefe" ], [ 1, "#fec3fe" ] ] }, "plot_bgcolor": "white", "paper_bgcolor": "white", "shapedefaults": { "line": { "width": 0 }, "opacity": 0.4, "fillcolor": "#506784" }, "annotationdefaults": { "arrowhead": 0, "arrowcolor": "#506784", "arrowwidth": 1 } }, "themeRef": "PLOTLY_WHITE" }, "hovermode": "x" } }, "height": null, "width": null, "user": { "profile_url": "https://chart-studio.plotly.com/~RSk1919", "avatar_url": "https://storage.googleapis.com/plotly-prod-profiles/74.jpg", "background_url": "https://storage.googleapis.com/plotly-prod-profiles/bg-9.jpg", "bio": "", "nickname": "", "website": "", "stream_tokens": null, "feature_set_id": null, "csrf_token": null, "date_joined": "2025-08-25 11:24:27", "mapbox_access_tokens": null, "has_password": null, "username": "RSk1919", "email": null, "is_active": null, "readonly": null, "is_dash_creator": null, "dash_created_count": null, "is_chart_creator": null, "charts_created_count": null } }, { "creation_time": "2025-08-25T10:48:45.686749Z", "comments": { "results": [], "count": 0 }, "parented": true, "embed_url": "https://chart-studio.plotly.com/~bkeshav1/495.embed", "fid": "bkeshav1:495", "filename": "PowerModel3D", "filetype": "plot", "img_url": "https://storage.googleapis.com/plotly-prod-images/bkeshav1/495/9_MYFASNG6J0AVCSGPHPD82LKNIQSD81.png", "image_urls": { "default": "https://storage.googleapis.com/plotly-prod-images/bkeshav1/495/2_KFPXM77EW8HHWK0YNG9IK15U3DYF8L.png", "block-thumb": "https://storage.googleapis.com/plotly-prod-images/bkeshav1/495/8_PD6NZW11QALHYI8FC93A6YCFKOMZNO.png", "list-thumb": "https://storage.googleapis.com/plotly-prod-images/bkeshav1/495/9_MYFASNG6J0AVCSGPHPD82LKNIQSD81.png" }, "api_urls": { "files": "https://api.plotly.com/v2/files/bkeshav1:495", "plots": "https://api.plotly.com/v2/plots/bkeshav1:495", "parent": "https://api.plotly.com/v2/folders/home?user=bkeshav1" }, "owner": "bkeshav1", "parent": -1, "preview": "", "referencers": [], "references": [], "title": "", "views": 0, "web_url": "https://chart-studio.plotly.com/~bkeshav1/495/", "world_readable": true, "date_modified": "2025-08-25T11:12:21.321Z", "stars": { "results": [], "count": 0 }, "collaborators": { "results": [], "count": 0 }, "subfolder_count": null, "refresh_interval": null, "organize_view_url": "https://chart-studio.plotly.com/~bkeshav1/495/", "current_user_permission": "read", "is_theme": null, "is_template": false, "autosize": false, "caption": "", "figure": { "data": [ { "line": { "color": "rgb(0, 0, 255)", "shape": "spline", "width": 10, "smoothing": 1.3 }, "meta": { "columnNames": { "x": "v", "y": "h_cnst" } }, "mode": "lines", "name": "2D Inertial Trajectory (Horz, Constant velocity)", "type": "scatter", "xsrc": "bkeshav1:494:202d80", "ysrc": "bkeshav1:494:af11de", "connectgaps": true }, { "meta": { "columnNames": { "x": "v", "y": "h_acc" } }, "mode": "markers", "name": "<br>", "type": "scatter", "xsrc": "bkeshav1:494:202d80", "ysrc": "bkeshav1:494:3562a6", "marker": { "line": { "color": "rgb(0, 0, 0)" }, "size": 16, "color": "rgb(255, 0, 0)", "opacity": 0.5 }, "opacity": 0.5, "showlegend": false, "stackgroup": null }, { "meta": { "columnNames": { "x": "v", "y": "h_v_3d_acc" } }, "mode": "markers", "name": "<br>", "type": "scatter", "xsrc": "bkeshav1:494:202d80", "ysrc": "bkeshav1:494:963e81", "marker": { "line": { "color": "rgb(0, 0, 0)" }, "size": 16, "color": "rgb(0, 255, 0)", "opacity": 0.5 }, "opacity": 0.5, "showlegend": false, "stackgroup": null }, { "line": { "color": "rgb(255, 0, 0)", "shape": "spline", "width": 10, "smoothing": 1.3 }, "meta": { "columnNames": { "x": "v", "y": "h_acc_smoothed" } }, "mode": "lines", "name": "2D Non-Inertial Trajectory (Horz, Arbitrary trajectory with horz accelerations)", "type": "scatter", "xsrc": "bkeshav1:494:202d80", "ysrc": "bkeshav1:494:4e3320", "stackgroup": null, "connectgaps": true }, { "line": { "color": "rgb(0, 255, 0)", "shape": "spline", "width": 10, "smoothing": 1.3 }, "meta": { "columnNames": { "x": "v", "y": "h_v_3d_acc_smoothed" } }, "mode": "lines", "name": "3D Non-Inertial Trajectory (Horz + Vert, Arbitrary trajectory with horz & vert accelerations) ", "type": "scatter", "xsrc": "bkeshav1:494:202d80", "ysrc": "bkeshav1:494:ed3ee6", "stackgroup": null, "connectgaps": true } ], "frames": [], "layout": { "font": { "size": 30, "color": "rgb(0, 0, 0)", "family": "Overpass" }, "title": { "font": { "size": 1 }, "text": "<br>" }, "width": 2268, "xaxis": { "type": "linear", "range": [ 0, 55 ], "ticks": "inside", "title": { "font": { "size": 85 }, "text": "<b>U-ABS Flying Velocity in meters/second</b>" }, "mirror": "ticks", "ticklen": 12, "showline": true, "tickfont": { "size": 75 }, "zeroline": false, "autorange": false, "gridcolor": "rgb(211, 211, 211)", "gridwidth": 3, "linecolor": "rgb(0, 0, 0)", "linewidth": 6, "tickcolor": "rgb(0, 0, 0)", "tickwidth": 6, "tickformat": "", "exponentformat": "power", "separatethousands": true }, "yaxis": { "type": "log", "range": [ 2.984, 3.444 ], "ticks": "inside", "title": { "font": { "size": 85 }, "text": "<b>U-ABS Mobility Power Consumption in Watts</b>" }, "mirror": "ticks", "ticklen": 12, "showline": true, "tickfont": { "size": 75 }, "zeroline": false, "autorange": false, "gridcolor": "rgb(211, 211, 211)", "gridwidth": 3, "linecolor": "rgb(0, 0, 0)", "linewidth": 6, "tickangle": "auto", "tickcolor": "rgb(0, 0, 0)", "tickwidth": 6, "tickformat": "", "exponentformat": "power", "separatethousands": true }, "height": 2268, "legend": { "x": 0.018598117464320645, "y": 0.5032916980818767, "font": { "size": 35 }, "title": { "font": { "size": 38, "color": "rgb(69, 69, 69)" }, "text": "<b> U-ABS weight = 85 N | U-ABS rotor radius = 0.4 m<br> U-ABS rotor disc area = 0.5 m</b><sup><b>2</b></sup><b> | U-ABS blade length = 2.5 cm<br>\nRotary-wing | 4 blades on the U-ABS | U-ABS blade angular velocity = 500 rad/s<br>\n</b>" }, "bordercolor": "rgb(0, 0, 0)", "borderwidth": 5 }, "margin": { "b": 0, "l": 0, "r": 0, "t": 0 }, "autosize": false, "template": { "data": { "bar": [ { "type": "bar", "marker": { "colorbar": { "ticks": "", "outlinewidth": 0 } } } ], "table": [ { "type": "table", "cells": { "fill": { "color": "#EBF0F8" }, "line": { "color": "white" } }, "header": { "fill": { "color": "#C8D4E3" }, "line": { "color": "white" } } } ], "carpet": [ { "type": "carpet", "aaxis": { "gridcolor": "#C8D4E3", "linecolor": "#C8D4E3", "endlinecolor": "#2a3f5f", "minorgridcolor": "#C8D4E3", "startlinecolor": "#2a3f5f" }, "baxis": { "gridcolor": "#C8D4E3", "linecolor": "#C8D4E3", "endlinecolor": "#2a3f5f", "minorgridcolor": "#C8D4E3", "startlinecolor": "#2a3f5f" } } ], "mesh3d": [ { "type": "mesh3d", "colorbar": { "ticks": "", "outlinewidth": 0 } } ], "contour": [ { "type": "contour", "colorbar": { "ticks": "", "outlinewidth": 0 }, "autocolorscale": true } ], "heatmap": [ { "type": "heatmap", "colorbar": { "ticks": "", "outlinewidth": 0 }, "autocolorscale": true } ], "scatter": [ { "type": "scatter", "marker": { "colorbar": { "ticks": "", "outlinewidth": 0 } } } ], "surface": [ { "type": "surface", "colorbar": { "ticks": "", "outlinewidth": 0 } } ], "heatmapgl": [ { "type": "heatmapgl", "colorbar": { "ticks": "", "outlinewidth": 0 } } ], "histogram": [ { "type": "histogram", "marker": { "colorbar": { "ticks": "", "outlinewidth": 0 } } } ], "parcoords": [ { "line": { "colorbar": { "ticks": "", "outlinewidth": 0 } }, "type": "parcoords" } ], "scatter3d": [ { "type": "scatter3d", "marker": { "colorbar": { "ticks": "", "outlinewidth": 0 } } } ], "scattergl": [ { "type": "scattergl", "marker": { "colorbar": { "ticks": "", "outlinewidth": 0 } } } ], "choropleth": [ { "type": "choropleth", "colorbar": { "ticks": "", "outlinewidth": 0 } } ], "scattergeo": [ { "type": "scattergeo", "marker": { "colorbar": { "ticks": "", "outlinewidth": 0 } } } ], "histogram2d": [ { "type": "histogram2d", "colorbar": { "ticks": "", "outlinewidth": 0 }, "autocolorscale": true } ], "scatterpolar": [ { "type": "scatterpolar", "marker": { "colorbar": { "ticks": "", "outlinewidth": 0 } } } ], "contourcarpet": [ { "type": "contourcarpet", "colorbar": { "ticks": "", "outlinewidth": 0 } } ], "scattercarpet": [ { "type": "scattercarpet", "marker": { "colorbar": { "ticks": "", "outlinewidth": 0 } } } ], "scattermapbox": [ { "type": "scattermapbox", "marker": { "colorbar": { "ticks": "", "outlinewidth": 0 } } } ], "scatterpolargl": [ { "type": "scatterpolargl", "marker": { "colorbar": { "ticks": "", "outlinewidth": 0 } } } ], "scatterternary": [ { "type": "scatterternary", "marker": { "colorbar": { "ticks": "", "outlinewidth": 0 } } } ], "histogram2dcontour": [ { "type": "histogram2dcontour", "colorbar": { "ticks": "", "outlinewidth": 0 }, "autocolorscale": true } ] }, "layout": { "geo": { "bgcolor": "white", "showland": true, "lakecolor": "white", "landcolor": "white", "showlakes": true, "subunitcolor": "#C8D4E3" }, "font": { "color": "#2a3f5f" }, "polar": { "bgcolor": "white", "radialaxis": { "ticks": "", "gridcolor": "#EBF0F8", "linecolor": "#EBF0F8" }, "angularaxis": { "ticks": "", "gridcolor": "#EBF0F8", "linecolor": "#EBF0F8" } }, "scene": { "xaxis": { "ticks": "", "gridcolor": "#DFE8F3", "gridwidth": 2, "linecolor": "#EBF0F8", "zerolinecolor": "#EBF0F8", "showbackground": true, "backgroundcolor": "white" }, "yaxis": { "ticks": "", "gridcolor": "#DFE8F3", "gridwidth": 2, "linecolor": "#EBF0F8", "zerolinecolor": "#EBF0F8", "showbackground": true, "backgroundcolor": "white" }, "zaxis": { "ticks": "", "gridcolor": "#DFE8F3", "gridwidth": 2, "linecolor": "#EBF0F8", "zerolinecolor": "#EBF0F8", "showbackground": true, "backgroundcolor": "white" } }, "title": { "x": 0.05 }, "xaxis": { "ticks": "", "gridcolor": "#EBF0F8", "linecolor": "#EBF0F8", "automargin": true, "zerolinecolor": "#EBF0F8", "zerolinewidth": 2 }, "yaxis": { "ticks": "", "gridcolor": "#EBF0F8", "linecolor": "#EBF0F8", "automargin": true, "zerolinecolor": "#EBF0F8", "zerolinewidth": 2 }, "ternary": { "aaxis": { "ticks": "", "gridcolor": "#DFE8F3", "linecolor": "#A2B1C6" }, "baxis": { "ticks": "", "gridcolor": "#DFE8F3", "linecolor": "#A2B1C6" }, "caxis": { "ticks": "", "gridcolor": "#DFE8F3", "linecolor": "#A2B1C6" }, "bgcolor": "white" }, "colorway": [ "#636efa", "#EF553B", "#00cc96", "#ab63fa", "#19d3f3", "#e763fa", "#fecb52", "#ffa15a", "#ff6692", "#b6e880" ], "hovermode": "closest", "colorscale": { "diverging": [ [ 0, "#8e0152" ], [ 0.1, "#c51b7d" ], [ 0.2, "#de77ae" ], [ 0.3, "#f1b6da" ], [ 0.4, "#fde0ef" ], [ 0.5, "#f7f7f7" ], [ 0.6, "#e6f5d0" ], [ 0.7, "#b8e186" ], [ 0.8, "#7fbc41" ], [ 0.9, "#4d9221" ], [ 1, "#276419" ] ], "sequential": [ [ 0, "#0508b8" ], [ 0.0893854748603352, "#1910d8" ], [ 0.1787709497206704, "#3c19f0" ], [ 0.2681564245810056, "#6b1cfb" ], [ 0.3575418994413408, "#981cfd" ], [ 0.44692737430167595, "#bf1cfd" ], [ 0.5363128491620112, "#dd2bfd" ], [ 0.6256983240223464, "#f246fe" ], [ 0.7150837988826816, "#fc67fd" ], [ 0.8044692737430168, "#fe88fc" ], [ 0.8938547486033519, "#fea5fd" ], [ 0.9832402234636871, "#febefe" ], [ 1, "#fec3fe" ] ], "sequentialminus": [ [ 0, "#0508b8" ], [ 0.0893854748603352, "#1910d8" ], [ 0.1787709497206704, "#3c19f0" ], [ 0.2681564245810056, "#6b1cfb" ], [ 0.3575418994413408, "#981cfd" ], [ 0.44692737430167595, "#bf1cfd" ], [ 0.5363128491620112, "#dd2bfd" ], [ 0.6256983240223464, "#f246fe" ], [ 0.7150837988826816, "#fc67fd" ], [ 0.8044692737430168, "#fe88fc" ], [ 0.8938547486033519, "#fea5fd" ], [ 0.9832402234636871, "#febefe" ], [ 1, "#fec3fe" ] ] }, "plot_bgcolor": "white", "paper_bgcolor": "white", "shapedefaults": { "line": { "width": 0 }, "opacity": 0.4, "fillcolor": "#506784" }, "annotationdefaults": { "arrowhead": 0, "arrowcolor": "#506784", "arrowwidth": 1 } }, "themeRef": "PLOTLY_WHITE" }, "showlegend": true, "annotations": [ { "x": 22.387005649717516, "y": 3.009876818622696, "ax": 1, "ay": -613, "font": { "size": 60 }, "text": "Accounting for accelerations, adds to the <br>mobility power consumption of the U-ABS", "arrowhead": 3, "arrowcolor": "rgb(0, 0, 0)", "arrowwidth": 4 }, { "x": 16.025423728813557, "y": 3.3642428709990297, "ax": 576, "ay": -223, "font": { "size": 60 }, "text": "Accounting for vertical climbs/descents, adds to the <br>mobility power consumption of the U-ABS", "arrowhead": 3, "arrowcolor": "rgb(0, 0, 0)", "arrowwidth": 4 } ] } }, "height": 2268, "width": 2268, "user": { "profile_url": "https://chart-studio.plotly.com/~bkeshav1", "avatar_url": "https://storage.googleapis.com/plotly-prod-profiles/80.jpg", "background_url": "https://storage.googleapis.com/plotly-prod-profiles/bg-13.jpg", "bio": "", "nickname": "", "website": "", "stream_tokens": null, "feature_set_id": null, "csrf_token": null, "date_joined": "2021-11-16 22:36:37", "mapbox_access_tokens": null, "has_password": null, "username": "bkeshav1", "email": null, "is_active": null, "readonly": null, "is_dash_creator": null, "dash_created_count": null, "is_chart_creator": null, "charts_created_count": null } }, { "creation_time": "2025-08-25T10:26:14.013929Z", "comments": { "results": [], "count": 0 }, "parented": true, "embed_url": "https://chart-studio.plotly.com/~freeform2/7.embed", "fid": "freeform2:7", "filename": "Scatter plot Representation", "filetype": "plot", "img_url": "https://storage.googleapis.com/plotly-prod-images/freeform2/7/9_AJXDDWGMUFOKIAX9Y6S9S8IAQBLO52.png", "image_urls": { "default": "https://storage.googleapis.com/plotly-prod-images/freeform2/7/2_U2CUT16WIJHDN07YCF7A1KV00KQI84.png", "block-thumb": "https://storage.googleapis.com/plotly-prod-images/freeform2/7/8_7TAM5OQS05GR7XBWOCIPOOQ9WQFGHK.png", "list-thumb": "https://storage.googleapis.com/plotly-prod-images/freeform2/7/9_AJXDDWGMUFOKIAX9Y6S9S8IAQBLO52.png" }, "api_urls": { "files": "https://api.plotly.com/v2/files/freeform2:7", "plots": "https://api.plotly.com/v2/plots/freeform2:7", "parent": "https://api.plotly.com/v2/folders/home?user=freeform2" }, "owner": "freeform2", "parent": -1, "preview": "", "referencers": [], "references": [], "title": "", "views": 0, "web_url": "https://chart-studio.plotly.com/~freeform2/7/", "world_readable": true, "date_modified": "2025-08-25T10:26:14.023Z", "stars": { "results": [], "count": 0 }, "collaborators": { "results": [], "count": 0 }, "subfolder_count": null, "refresh_interval": null, "organize_view_url": "https://chart-studio.plotly.com/~freeform2/7/", "current_user_permission": "read", "is_theme": null, "is_template": false, "autosize": true, "caption": "", "figure": { "data": [ { "meta": { "columnNames": { "x": "Longitude", "y": "Latitude" } }, "mode": "markers", "type": "scatter", "xsrc": "freeform2:6:13b111", "ysrc": "freeform2:6:775618" } ], "frames": [], "layout": { "title": { "text": "Scatter plot" }, "xaxis": { "type": "linear", "range": [ -117.4548923539959, 78.63000735399591 ], "title": { "text": "Longitude" }, "autorange": true }, "yaxis": { "type": "linear", "range": [ -19.26452119038379, 144.2564621903838 ], "title": { "text": "Latitude" }, "autorange": true }, "autosize": true, "template": { "data": { "bar": [ { "type": "bar", "marker": { "colorbar": { "ticks": "", "outlinewidth": 0 } } } ], "table": [ { "type": "table", "cells": { "fill": { "color": "#EBF0F8" }, "line": { "color": "white" } }, "header": { "fill": { "color": "#C8D4E3" }, "line": { "color": "white" } } } ], "carpet": [ { "type": "carpet", "aaxis": { "gridcolor": "#C8D4E3", "linecolor": "#C8D4E3", "endlinecolor": "#2a3f5f", "minorgridcolor": "#C8D4E3", "startlinecolor": "#2a3f5f" }, "baxis": { "gridcolor": "#C8D4E3", "linecolor": "#C8D4E3", "endlinecolor": "#2a3f5f", "minorgridcolor": "#C8D4E3", "startlinecolor": "#2a3f5f" } } ], "mesh3d": [ { "type": "mesh3d", "colorbar": { "ticks": "", "outlinewidth": 0 } } ], "contour": [ { "type": "contour", "colorbar": { "ticks": "", "outlinewidth": 0 }, "autocolorscale": true } ], "heatmap": [ { "type": "heatmap", "colorbar": { "ticks": "", "outlinewidth": 0 }, "autocolorscale": true } ], "scatter": [ { "type": "scatter", "marker": { "colorbar": { "ticks": "", "outlinewidth": 0 } } } ], "surface": [ { "type": "surface", "colorbar": { "ticks": "", "outlinewidth": 0 } } ], "heatmapgl": [ { "type": "heatmapgl", "colorbar": { "ticks": "", "outlinewidth": 0 } } ], "histogram": [ { "type": "histogram", "marker": { "colorbar": { "ticks": "", "outlinewidth": 0 } } } ], "parcoords": [ { "line": { "colorbar": { "ticks": "", "outlinewidth": 0 } }, "type": "parcoords" } ], "scatter3d": [ { "type": "scatter3d", "marker": { "colorbar": { "ticks": "", "outlinewidth": 0 } } } ], "scattergl": [ { "type": "scattergl", "marker": { "colorbar": { "ticks": "", "outlinewidth": 0 } } } ], "choropleth": [ { "type": "choropleth", "colorbar": { "ticks": "", "outlinewidth": 0 } } ], "scattergeo": [ { "type": "scattergeo", "marker": { "colorbar": { "ticks": "", "outlinewidth": 0 } } } ], "histogram2d": [ { "type": "histogram2d", "colorbar": { "ticks": "", "outlinewidth": 0 }, "autocolorscale": true } ], "scatterpolar": [ { "type": "scatterpolar", "marker": { "colorbar": { "ticks": "", "outlinewidth": 0 } } } ], "contourcarpet": [ { "type": "contourcarpet", "colorbar": { "ticks": "", "outlinewidth": 0 } } ], "scattercarpet": [ { "type": "scattercarpet", "marker": { "colorbar": { "ticks": "", "outlinewidth": 0 } } } ], "scattermapbox": [ { "type": "scattermapbox", "marker": { "colorbar": { "ticks": "", "outlinewidth": 0 } } } ], "scatterpolargl": [ { "type": "scatterpolargl", "marker": { "colorbar": { "ticks": "", "outlinewidth": 0 } } } ], "scatterternary": [ { "type": "scatterternary", "marker": { "colorbar": { "ticks": "", "outlinewidth": 0 } } } ], "histogram2dcontour": [ { "type": "histogram2dcontour", "colorbar": { "ticks": "", "outlinewidth": 0 }, "autocolorscale": true } ] }, "layout": { "geo": { "bgcolor": "white", "showland": true, "lakecolor": "white", "landcolor": "white", "showlakes": true, "subunitcolor": "#C8D4E3" }, "font": { "color": "#2a3f5f" }, "polar": { "bgcolor": "white", "radialaxis": { "ticks": "", "gridcolor": "#EBF0F8", "linecolor": "#EBF0F8" }, "angularaxis": { "ticks": "", "gridcolor": "#EBF0F8", "linecolor": "#EBF0F8" } }, "scene": { "xaxis": { "ticks": "", "gridcolor": "#DFE8F3", "gridwidth": 2, "linecolor": "#EBF0F8", "zerolinecolor": "#EBF0F8", "showbackground": true, "backgroundcolor": "white" }, "yaxis": { "ticks": "", "gridcolor": "#DFE8F3", "gridwidth": 2, "linecolor": "#EBF0F8", "zerolinecolor": "#EBF0F8", "showbackground": true, "backgroundcolor": "white" }, "zaxis": { "ticks": "", "gridcolor": "#DFE8F3", "gridwidth": 2, "linecolor": "#EBF0F8", "zerolinecolor": "#EBF0F8", "showbackground": true, "backgroundcolor": "white" } }, "title": { "x": 0.05 }, "xaxis": { "ticks": "", "gridcolor": "#EBF0F8", "linecolor": "#EBF0F8", "automargin": true, "zerolinecolor": "#EBF0F8", "zerolinewidth": 2 }, "yaxis": { "ticks": "", "gridcolor": "#EBF0F8", "linecolor": "#EBF0F8", "automargin": true, "zerolinecolor": "#EBF0F8", "zerolinewidth": 2 }, "ternary": { "aaxis": { "ticks": "", "gridcolor": "#DFE8F3", "linecolor": "#A2B1C6" }, "baxis": { "ticks": "", "gridcolor": "#DFE8F3", "linecolor": "#A2B1C6" }, "caxis": { "ticks": "", "gridcolor": "#DFE8F3", "linecolor": "#A2B1C6" }, "bgcolor": "white" }, "colorway": [ "#636efa", "#EF553B", "#00cc96", "#ab63fa", "#19d3f3", "#e763fa", "#fecb52", "#ffa15a", "#ff6692", "#b6e880" ], "hovermode": "closest", "colorscale": { "diverging": [ [ 0, "#8e0152" ], [ 0.1, "#c51b7d" ], [ 0.2, "#de77ae" ], [ 0.3, "#f1b6da" ], [ 0.4, "#fde0ef" ], [ 0.5, "#f7f7f7" ], [ 0.6, "#e6f5d0" ], [ 0.7, "#b8e186" ], [ 0.8, "#7fbc41" ], [ 0.9, "#4d9221" ], [ 1, "#276419" ] ], "sequential": [ [ 0, "#0508b8" ], [ 0.0893854748603352, "#1910d8" ], [ 0.1787709497206704, "#3c19f0" ], [ 0.2681564245810056, "#6b1cfb" ], [ 0.3575418994413408, "#981cfd" ], [ 0.44692737430167595, "#bf1cfd" ], [ 0.5363128491620112, "#dd2bfd" ], [ 0.6256983240223464, "#f246fe" ], [ 0.7150837988826816, "#fc67fd" ], [ 0.8044692737430168, "#fe88fc" ], [ 0.8938547486033519, "#fea5fd" ], [ 0.9832402234636871, "#febefe" ], [ 1, "#fec3fe" ] ], "sequentialminus": [ [ 0, "#0508b8" ], [ 0.0893854748603352, "#1910d8" ], [ 0.1787709497206704, "#3c19f0" ], [ 0.2681564245810056, "#6b1cfb" ], [ 0.3575418994413408, "#981cfd" ], [ 0.44692737430167595, "#bf1cfd" ], [ 0.5363128491620112, "#dd2bfd" ], [ 0.6256983240223464, "#f246fe" ], [ 0.7150837988826816, "#fc67fd" ], [ 0.8044692737430168, "#fe88fc" ], [ 0.8938547486033519, "#fea5fd" ], [ 0.9832402234636871, "#febefe" ], [ 1, "#fec3fe" ] ] }, "plot_bgcolor": "white", "paper_bgcolor": "white", "shapedefaults": { "line": { "width": 0 }, "opacity": 0.4, "fillcolor": "#506784" }, "annotationdefaults": { "arrowhead": 0, "arrowcolor": "#506784", "arrowwidth": 1 } }, "themeRef": "PLOTLY_WHITE" } } }, "height": null, "width": null, "user": { "profile_url": "https://chart-studio.plotly.com/~freeform2", "avatar_url": "https://storage.googleapis.com/plotly-prod-profiles/48.jpg", "background_url": "https://storage.googleapis.com/plotly-prod-profiles/bg-1.jpg", "bio": "", "nickname": "", "website": "", "stream_tokens": null, "feature_set_id": null, "csrf_token": null, "date_joined": "2025-08-25 07:06:22", "mapbox_access_tokens": null, "has_password": null, "username": "freeform2", "email": null, "is_active": null, "readonly": null, "is_dash_creator": null, "dash_created_count": null, "is_chart_creator": null, "charts_created_count": null } }, { "creation_time": "2025-08-25T09:53:02.440462Z", "comments": { "results": [], "count": 0 }, "parented": true, "embed_url": "https://chart-studio.plotly.com/~maksimpoltoradnev/1.embed", "fid": "maksimpoltoradnev:1", "filename": "Candlestick_chart", "filetype": "plot", "img_url": "https://storage.googleapis.com/plotly-prod-images/maksimpoltoradnev/1/9_ZUNDFA3GNB7ORPICXTUU4QWLMSO7UM.png", "image_urls": { "default": "https://storage.googleapis.com/plotly-prod-images/maksimpoltoradnev/1/2_T42W0N7IN78QX75MTFQCX3H7HRV9AH.png", "block-thumb": "https://storage.googleapis.com/plotly-prod-images/maksimpoltoradnev/1/8_PHBO9PW8VDA9PNKZQNYOHLQ21DVS3Y.png", "list-thumb": "https://storage.googleapis.com/plotly-prod-images/maksimpoltoradnev/1/9_ZUNDFA3GNB7ORPICXTUU4QWLMSO7UM.png" }, "api_urls": { "files": "https://api.plotly.com/v2/files/maksimpoltoradnev:1", "plots": "https://api.plotly.com/v2/plots/maksimpoltoradnev:1", "parent": "https://api.plotly.com/v2/folders/home?user=maksimpoltoradnev" }, "owner": "maksimpoltoradnev", "parent": -1, "preview": "", "referencers": [], "references": [], "title": "", "views": 0, "web_url": "https://chart-studio.plotly.com/~maksimpoltoradnev/1/", "world_readable": true, "date_modified": "2025-08-26T11:48:58.169Z", "stars": { "results": [], "count": 0 }, "collaborators": { "results": [], "count": 0 }, "subfolder_count": null, "refresh_interval": null, "organize_view_url": "https://chart-studio.plotly.com/~maksimpoltoradnev/1/", "current_user_permission": "read", "is_theme": null, "is_template": false, "autosize": true, "caption": "", "figure": { "data": [ { "meta": { "columnNames": { "x": "data.0.x", "low": "data.0.low", "high": "data.0.high", "open": "data.0.open", "close": "data.0.close" } }, "name": "UREA Prilled Baltic fob", "type": "candlestick", "xsrc": "maksimpoltoradnev:2:f1ea24", "lowsrc": "maksimpoltoradnev:2:5517a6", "highsrc": "maksimpoltoradnev:2:aa53f7", "opensrc": "maksimpoltoradnev:2:e73032", "closesrc": "maksimpoltoradnev:2:bea1f4" }, { "line": { "color": "blue", "width": 1 }, "meta": { "columnNames": { "x": "data.1.x", "y": "data.1.y" } }, "mode": "lines", "name": "MA2", "type": "scatter", "xsrc": "maksimpoltoradnev:2:4eb0b3", "ysrc": "maksimpoltoradnev:2:842002" }, { "line": { "color": "orange", "width": 1 }, "meta": { "columnNames": { "x": "data.2.x", "y": "data.2.y" } }, "mode": "lines", "name": "MA7", "type": "scatter", "xsrc": "maksimpoltoradnev:2:44e492", "ysrc": "maksimpoltoradnev:2:a65a7d" } ], "frames": [], "layout": { "title": { "text": "Candlestick plot for UREA Prilled Baltic fob" }, "xaxis": { "type": "date", "range": [ "2023-08-19 17:54:02.6325", "2027-01-01 01:24:51.1777" ], "title": { "text": "Date" }, "autorange": false, "rangeslider": { "range": [ "2007-01-17", "2027-01-01 01:24:51.1777" ], "yaxis": { "rangemode": "match" }, "autorange": true } }, "yaxis": { "type": "linear", "range": [ 120.83333333333333, 1004.1666666666666 ], "title": { "text": "Price (USD/t)" }, "autorange": true, "fixedrange": false }, "shapes": [ { "x0": "2025-01-17 15:56:53.4233", "x1": "2026-05-05 03:34:48.7435", "y0": 393.3076923076923, "y1": 600.6573729863693, "line": { "color": "rgb(8, 8, 250)" }, "type": "line", "opacity": 1, "fillcolor": "#7f7f7f" }, { "x0": "2025-01-23 15:29:17.257", "x1": "2026-05-08 10:24:08.0892", "y0": 178.58974358974362, "y1": 611.4445477075589, "line": { "color": "rgb(8, 8, 250)" }, "type": "line", "opacity": 1, "fillcolor": "#7f7f7f" }, { "x0": "2025-01-12 17:12:18.8192", "x1": "2025-07-19 19:34:40.9807", "y0": 189.98316498316498, "y1": 531.2710437710438, "line": { "dash": "dot", "color": "rgb(209, 11, 14)" }, "opacity": 0.33, "fillcolor": "rgba(255, 255, 255, 0.01)" }, { "x0": "2023-11-11 04:40:50.2998", "x1": "2025-04-07 10:25:25.6942", "y0": 337.2053872053872, "y1": 343.89730639730635, "line": { "color": "#444444" }, "type": "line", "opacity": 0.3, "fillcolor": "#7f7f7f" }, { "x0": "2023-10-30 01:19:40.711", "x1": "2025-04-12 19:54:49.9559", "y0": 226.40951178451172, "y1": 226.587962962963, "line": { "color": "#444444" }, "type": "line", "opacity": 0.3, "fillcolor": "#7f7f7f" } ], "autosize": true, "template": { "data": { "bar": [ { "type": "bar", "marker": { "line": { "color": "white", "width": 0.5 }, "pattern": { "size": 10, "fillmode": "overlay", "solidity": 0.2 } }, "error_x": { "color": "#2a3f5f" }, "error_y": { "color": "#2a3f5f" } } ], "pie": [ { "type": "pie", "automargin": true } ], "table": [ { "type": "table", "cells": { "fill": { "color": "#EBF0F8" }, "line": { "color": "white" } }, "header": { "fill": { "color": "#C8D4E3" }, "line": { "color": "white" } } } ], "carpet": [ { "type": "carpet", "aaxis": { "gridcolor": "#C8D4E3", "linecolor": "#C8D4E3", "endlinecolor": "#2a3f5f", "minorgridcolor": "#C8D4E3", "startlinecolor": "#2a3f5f" }, "baxis": { "gridcolor": "#C8D4E3", "linecolor": "#C8D4E3", "endlinecolor": "#2a3f5f", "minorgridcolor": "#C8D4E3", "startlinecolor": "#2a3f5f" } } ], "mesh3d": [ { "type": "mesh3d", "colorbar": { "ticks": "", "outlinewidth": 0 } } ], "contour": [ { "type": "contour", "colorbar": { "ticks": "", "outlinewidth": 0 }, "colorscale": [ [ 0, "#0d0887" ], [ 0.1111111111111111, "#46039f" ], [ 0.2222222222222222, "#7201a8" ], [ 0.3333333333333333, "#9c179e" ], [ 0.4444444444444444, "#bd3786" ], [ 0.5555555555555556, "#d8576b" ], [ 0.6666666666666666, "#ed7953" ], [ 0.7777777777777778, "#fb9f3a" ], [ 0.8888888888888888, "#fdca26" ], [ 1, "#f0f921" ] ] } ], "heatmap": [ { "type": "heatmap", "colorbar": { "ticks": "", "outlinewidth": 0 }, "colorscale": [ [ 0, "#0d0887" ], [ 0.1111111111111111, "#46039f" ], [ 0.2222222222222222, "#7201a8" ], [ 0.3333333333333333, "#9c179e" ], [ 0.4444444444444444, "#bd3786" ], [ 0.5555555555555556, "#d8576b" ], [ 0.6666666666666666, "#ed7953" ], [ 0.7777777777777778, "#fb9f3a" ], [ 0.8888888888888888, "#fdca26" ], [ 1, "#f0f921" ] ] } ], "scatter": [ { "type": "scatter", "fillpattern": { "size": 10, "fillmode": "overlay", "solidity": 0.2 } } ], "surface": [ { "type": "surface", "colorbar": { "ticks": "", "outlinewidth": 0 }, "colorscale": [ [ 0, "#0d0887" ], [ 0.1111111111111111, "#46039f" ], [ 0.2222222222222222, "#7201a8" ], [ 0.3333333333333333, "#9c179e" ], [ 0.4444444444444444, "#bd3786" ], [ 0.5555555555555556, "#d8576b" ], [ 0.6666666666666666, "#ed7953" ], [ 0.7777777777777778, "#fb9f3a" ], [ 0.8888888888888888, "#fdca26" ], [ 1, "#f0f921" ] ] } ], "barpolar": [ { "type": "barpolar", "marker": { "line": { "color": "white", "width": 0.5 }, "pattern": { "size": 10, "fillmode": "overlay", "solidity": 0.2 } } } ], "heatmapgl": [ { "type": "heatmapgl", "colorbar": { "ticks": "", "outlinewidth": 0 }, "colorscale": [ [ 0, "#0d0887" ], [ 0.1111111111111111, "#46039f" ], [ 0.2222222222222222, "#7201a8" ], [ 0.3333333333333333, "#9c179e" ], [ 0.4444444444444444, "#bd3786" ], [ 0.5555555555555556, "#d8576b" ], [ 0.6666666666666666, "#ed7953" ], [ 0.7777777777777778, "#fb9f3a" ], [ 0.8888888888888888, "#fdca26" ], [ 1, "#f0f921" ] ] } ], "histogram": [ { "type": "histogram", "marker": { "pattern": { "size": 10, "fillmode": "overlay", "solidity": 0.2 } } } ], "parcoords": [ { "line": { "colorbar": { "ticks": "", "outlinewidth": 0 } }, "type": "parcoords" } ], "scatter3d": [ { "line": { "colorbar": { "ticks": "", "outlinewidth": 0 } }, "type": "scatter3d", "marker": { "colorbar": { "ticks": "", "outlinewidth": 0 } } } ], "scattergl": [ { "type": "scattergl", "marker": { "colorbar": { "ticks": "", "outlinewidth": 0 } } } ], "choropleth": [ { "type": "choropleth", "colorbar": { "ticks": "", "outlinewidth": 0 } } ], "scattergeo": [ { "type": "scattergeo", "marker": { "colorbar": { "ticks": "", "outlinewidth": 0 } } } ], "histogram2d": [ { "type": "histogram2d", "colorbar": { "ticks": "", "outlinewidth": 0 }, "colorscale": [ [ 0, "#0d0887" ], [ 0.1111111111111111, "#46039f" ], [ 0.2222222222222222, "#7201a8" ], [ 0.3333333333333333, "#9c179e" ], [ 0.4444444444444444, "#bd3786" ], [ 0.5555555555555556, "#d8576b" ], [ 0.6666666666666666, "#ed7953" ], [ 0.7777777777777778, "#fb9f3a" ], [ 0.8888888888888888, "#fdca26" ], [ 1, "#f0f921" ] ] } ], "scatterpolar": [ { "type": "scatterpolar", "marker": { "colorbar": { "ticks": "", "outlinewidth": 0 } } } ], "contourcarpet": [ { "type": "contourcarpet", "colorbar": { "ticks": "", "outlinewidth": 0 } } ], "scattercarpet": [ { "type": "scattercarpet", "marker": { "colorbar": { "ticks": "", "outlinewidth": 0 } } } ], "scattermapbox": [ { "type": "scattermapbox", "marker": { "colorbar": { "ticks": "", "outlinewidth": 0 } } } ], "scatterpolargl": [ { "type": "scatterpolargl", "marker": { "colorbar": { "ticks": "", "outlinewidth": 0 } } } ], "scatterternary": [ { "type": "scatterternary", "marker": { "colorbar": { "ticks": "", "outlinewidth": 0 } } } ], "histogram2dcontour": [ { "type": "histogram2dcontour", "colorbar": { "ticks": "", "outlinewidth": 0 }, "colorscale": [ [ 0, "#0d0887" ], [ 0.1111111111111111, "#46039f" ], [ 0.2222222222222222, "#7201a8" ], [ 0.3333333333333333, "#9c179e" ], [ 0.4444444444444444, "#bd3786" ], [ 0.5555555555555556, "#d8576b" ], [ 0.6666666666666666, "#ed7953" ], [ 0.7777777777777778, "#fb9f3a" ], [ 0.8888888888888888, "#fdca26" ], [ 1, "#f0f921" ] ] } ] }, "layout": { "geo": { "bgcolor": "white", "showland": true, "lakecolor": "white", "landcolor": "white", "showlakes": true, "subunitcolor": "#C8D4E3" }, "font": { "color": "#2a3f5f" }, "polar": { "bgcolor": "white", "radialaxis": { "ticks": "", "gridcolor": "#EBF0F8", "linecolor": "#EBF0F8" }, "angularaxis": { "ticks": "", "gridcolor": "#EBF0F8", "linecolor": "#EBF0F8" } }, "scene": { "xaxis": { "ticks": "", "gridcolor": "#DFE8F3", "gridwidth": 2, "linecolor": "#EBF0F8", "zerolinecolor": "#EBF0F8", "showbackground": true, "backgroundcolor": "white" }, "yaxis": { "ticks": "", "gridcolor": "#DFE8F3", "gridwidth": 2, "linecolor": "#EBF0F8", "zerolinecolor": "#EBF0F8", "showbackground": true, "backgroundcolor": "white" }, "zaxis": { "ticks": "", "gridcolor": "#DFE8F3", "gridwidth": 2, "linecolor": "#EBF0F8", "zerolinecolor": "#EBF0F8", "showbackground": true, "backgroundcolor": "white" } }, "title": { "x": 0.05 }, "xaxis": { "ticks": "", "title": { "standoff": 15 }, "gridcolor": "#EBF0F8", "linecolor": "#EBF0F8", "automargin": true, "zerolinecolor": "#EBF0F8", "zerolinewidth": 2 }, "yaxis": { "ticks": "", "title": { "standoff": 15 }, "gridcolor": "#EBF0F8", "linecolor": "#EBF0F8", "automargin": true, "zerolinecolor": "#EBF0F8", "zerolinewidth": 2 }, "mapbox": { "style": "light" }, "ternary": { "aaxis": { "ticks": "", "gridcolor": "#DFE8F3", "linecolor": "#A2B1C6" }, "baxis": { "ticks": "", "gridcolor": "#DFE8F3", "linecolor": "#A2B1C6" }, "caxis": { "ticks": "", "gridcolor": "#DFE8F3", "linecolor": "#A2B1C6" }, "bgcolor": "white" }, "colorway": [ "#636efa", "#EF553B", "#00cc96", "#ab63fa", "#FFA15A", "#19d3f3", "#FF6692", "#B6E880", "#FF97FF", "#FECB52" ], "coloraxis": { "colorbar": { "ticks": "", "outlinewidth": 0 } }, "hovermode": "closest", "colorscale": { "diverging": [ [ 0, "#8e0152" ], [ 0.1, "#c51b7d" ], [ 0.2, "#de77ae" ], [ 0.3, "#f1b6da" ], [ 0.4, "#fde0ef" ], [ 0.5, "#f7f7f7" ], [ 0.6, "#e6f5d0" ], [ 0.7, "#b8e186" ], [ 0.8, "#7fbc41" ], [ 0.9, "#4d9221" ], [ 1, "#276419" ] ], "sequential": [ [ 0, "#0d0887" ], [ 0.1111111111111111, "#46039f" ], [ 0.2222222222222222, "#7201a8" ], [ 0.3333333333333333, "#9c179e" ], [ 0.4444444444444444, "#bd3786" ], [ 0.5555555555555556, "#d8576b" ], [ 0.6666666666666666, "#ed7953" ], [ 0.7777777777777778, "#fb9f3a" ], [ 0.8888888888888888, "#fdca26" ], [ 1, "#f0f921" ] ], "sequentialminus": [ [ 0, "#0d0887" ], [ 0.1111111111111111, "#46039f" ], [ 0.2222222222222222, "#7201a8" ], [ 0.3333333333333333, "#9c179e" ], [ 0.4444444444444444, "#bd3786" ], [ 0.5555555555555556, "#d8576b" ], [ 0.6666666666666666, "#ed7953" ], [ 0.7777777777777778, "#fb9f3a" ], [ 0.8888888888888888, "#fdca26" ], [ 1, "#f0f921" ] ] }, "hoverlabel": { "align": "left" }, "plot_bgcolor": "white", "paper_bgcolor": "white", "shapedefaults": { "line": { "color": "#2a3f5f" } }, "autotypenumbers": "strict", "annotationdefaults": { "arrowhead": 0, "arrowcolor": "#2a3f5f", "arrowwidth": 1 } } }, "hovermode": "x unified", "showlegend": false, "annotations": [ { "x": "2025-03-05 06:49:25.358", "y": 404.85897435897436, "ax": 2, "ay": -45, "text": "Коррекция (дожи)" }, { "x": "2025-09-08 09:02:52.464", "y": 505.4230769230769, "ax": 15, "ay": -62, "text": "Коррекция (дожи)" }, { "x": "2025-06-04 17:52:01.1432", "y": 337.56195786864936, "ax": 33, "ay": 50, "text": "Коррекция (дожи)" }, { "x": "2025-05-15 01:05:24.2112", "y": 562.5, "ax": -31, "ay": -4, "font": { "size": 13, "color": "rgb(224, 51, 16)" }, "text": "<b>Бычья модель \"три метода\"</b>" } ] } }, "height": null, "width": null, "user": { "profile_url": "https://chart-studio.plotly.com/~maksimpoltoradnev", "avatar_url": "https://storage.googleapis.com/plotly-prod-profiles/69.jpg", "background_url": "https://storage.googleapis.com/plotly-prod-profiles/bg-12.jpg", "bio": "", "nickname": "", "website": "", "stream_tokens": null, "feature_set_id": null, "csrf_token": null, "date_joined": "2020-05-28 12:34:24", "mapbox_access_tokens": null, "has_password": null, "username": "maksimpoltoradnev", "email": null, "is_active": null, "readonly": null, "is_dash_creator": null, "dash_created_count": null, "is_chart_creator": null, "charts_created_count": null } }, { "creation_time": "2025-08-25T09:35:31.179980Z", "comments": { "results": [], "count": 0 }, "parented": true, "embed_url": "https://chart-studio.plotly.com/~mageshissivan/64.embed", "fid": "mageshissivan:64", "filename": "Plot 64", "filetype": "plot", "img_url": "https://storage.googleapis.com/plotly-prod-images/mageshissivan/64/9_JKSFL9VQQ4OSH3OIH8EHSOO3KZFKT3.png", "image_urls": { "default": "https://storage.googleapis.com/plotly-prod-images/mageshissivan/64/2_GGXY5WXVT4787T4D6B6DKOF1QTFYFL.png", "block-thumb": "https://storage.googleapis.com/plotly-prod-images/mageshissivan/64/8_7V3RQ40YMTVINANY1GF8OXZRKXDXRW.png", "list-thumb": "https://storage.googleapis.com/plotly-prod-images/mageshissivan/64/9_JKSFL9VQQ4OSH3OIH8EHSOO3KZFKT3.png" }, "api_urls": { "files": "https://api.plotly.com/v2/files/mageshissivan:64", "plots": "https://api.plotly.com/v2/plots/mageshissivan:64", "parent": "https://api.plotly.com/v2/folders/home?user=mageshissivan" }, "owner": "mageshissivan", "parent": -1, "preview": "", "referencers": [], "references": [], "title": "", "views": 0, "web_url": "https://chart-studio.plotly.com/~mageshissivan/64/", "world_readable": true, "date_modified": "2025-08-25T09:35:31.192Z", "stars": { "results": [], "count": 0 }, "collaborators": { "results": [], "count": 0 }, "subfolder_count": null, "refresh_interval": null, "organize_view_url": "https://chart-studio.plotly.com/~mageshissivan/64/", "current_user_permission": "read", "is_theme": null, "is_template": false, "autosize": true, "caption": "", "figure": { "data": [ { "meta": { "columnNames": { "y": "Cd" } }, "mode": "markers", "name": "Cd", "type": "box", "ysrc": "mageshissivan:63:3081f3", "jitter": 0.5, "marker": { "line": { "width": 1 }, "size": 12, "symbol": "circle" }, "pointpos": 0, "boxpoints": "all" } ], "frames": [], "layout": { "xaxis": { "type": "category", "range": [ -0.5, 0.5 ], "domain": [ 0, 0.125 ], "autorange": true }, "yaxis": { "type": "linear", "range": [ 0, 10 ], "title": { "text": "Concentration in ppm" }, "domain": [ 0, 1 ], "nticks": 12, "autorange": false, "zerolinewidth": 1 }, "autosize": true, "template": { "data": { "bar": [ { "type": "bar", "marker": { "colorbar": { "len": 0.2, "ticks": "inside", "ticklen": 6, "tickcolor": "rgb(237,237,237)", "outlinewidth": 0 } } } ], "table": [ { "type": "table", "cells": { "fill": { "color": "rgb(237,237,237)" }, "line": { "color": "white" } }, "header": { "fill": { "color": "rgb(217,217,217)" }, "line": { "color": "white" } } } ], "carpet": [ { "type": "carpet", "aaxis": { "gridcolor": "white", "linecolor": "white", "endlinecolor": "rgb(51,51,51)", "minorgridcolor": "white", "startlinecolor": "rgb(51,51,51)" }, "baxis": { "gridcolor": "white", "linecolor": "white", "endlinecolor": "rgb(51,51,51)", "minorgridcolor": "white", "startlinecolor": "rgb(51,51,51)" } } ], "mesh3d": [ { "type": "mesh3d", "colorbar": { "len": 0.2, "ticks": "inside", "ticklen": 6, "tickcolor": "rgb(237,237,237)", "outlinewidth": 0 } } ], "contour": [ { "type": "contour", "colorbar": { "len": 0.2, "ticks": "inside", "ticklen": 6, "tickcolor": "rgb(237,237,237)", "outlinewidth": 0 }, "autocolorscale": true } ], "heatmap": [ { "type": "heatmap", "colorbar": { "len": 0.2, "ticks": "inside", "ticklen": 6, "tickcolor": "rgb(237,237,237)", "outlinewidth": 0 }, "autocolorscale": true } ], "scatter": [ { "type": "scatter", "marker": { "colorbar": { "len": 0.2, "ticks": "inside", "ticklen": 6, "tickcolor": "rgb(237,237,237)", "outlinewidth": 0 } } } ], "surface": [ { "type": "surface", "colorbar": { "len": 0.2, "ticks": "inside", "ticklen": 6, "tickcolor": "rgb(237,237,237)", "outlinewidth": 0 } } ], "heatmapgl": [ { "type": "heatmapgl", "colorbar": { "len": 0.2, "ticks": "inside", "ticklen": 6, "tickcolor": "rgb(237,237,237)", "outlinewidth": 0 } } ], "histogram": [ { "type": "histogram", "marker": { "colorbar": { "len": 0.2, "ticks": "inside", "ticklen": 6, "tickcolor": "rgb(237,237,237)", "outlinewidth": 0 } } } ], "parcoords": [ { "line": { "colorbar": { "len": 0.2, "ticks": "inside", "ticklen": 6, "tickcolor": "rgb(237,237,237)", "outlinewidth": 0 } }, "type": "parcoords" } ], "scatter3d": [ { "type": "scatter3d", "marker": { "colorbar": { "len": 0.2, "ticks": "inside", "ticklen": 6, "tickcolor": "rgb(237,237,237)", "outlinewidth": 0 } } } ], "scattergl": [ { "type": "scattergl", "marker": { "colorbar": { "len": 0.2, "ticks": "inside", "ticklen": 6, "tickcolor": "rgb(237,237,237)", "outlinewidth": 0 } } } ], "choropleth": [ { "type": "choropleth", "colorbar": { "len": 0.2, "ticks": "inside", "ticklen": 6, "tickcolor": "rgb(237,237,237)", "outlinewidth": 0 } } ], "scattergeo": [ { "type": "scattergeo", "marker": { "colorbar": { "len": 0.2, "ticks": "inside", "ticklen": 6, "tickcolor": "rgb(237,237,237)", "outlinewidth": 0 } } } ], "histogram2d": [ { "type": "histogram2d", "colorbar": { "len": 0.2, "ticks": "inside", "ticklen": 6, "tickcolor": "rgb(237,237,237)", "outlinewidth": 0 }, "autocolorscale": true } ], "scatterpolar": [ { "type": "scatterpolar", "marker": { "colorbar": { "len": 0.2, "ticks": "inside", "ticklen": 6, "tickcolor": "rgb(237,237,237)", "outlinewidth": 0 } } } ], "contourcarpet": [ { "type": "contourcarpet", "colorbar": { "len": 0.2, "ticks": "inside", "ticklen": 6, "tickcolor": "rgb(237,237,237)", "outlinewidth": 0 } } ], "scattercarpet": [ { "type": "scattercarpet", "marker": { "colorbar": { "len": 0.2, "ticks": "inside", "ticklen": 6, "tickcolor": "rgb(237,237,237)", "outlinewidth": 0 } } } ], "scattermapbox": [ { "type": "scattermapbox", "marker": { "colorbar": { "len": 0.2, "ticks": "inside", "ticklen": 6, "tickcolor": "rgb(237,237,237)", "outlinewidth": 0 } } } ], "scatterpolargl": [ { "type": "scatterpolargl", "marker": { "colorbar": { "len": 0.2, "ticks": "inside", "ticklen": 6, "tickcolor": "rgb(237,237,237)", "outlinewidth": 0 } } } ], "scatterternary": [ { "type": "scatterternary", "marker": { "colorbar": { "len": 0.2, "ticks": "inside", "ticklen": 6, "tickcolor": "rgb(237,237,237)", "outlinewidth": 0 } } } ], "histogram2dcontour": [ { "type": "histogram2dcontour", "colorbar": { "len": 0.2, "ticks": "inside", "ticklen": 6, "tickcolor": "rgb(237,237,237)", "outlinewidth": 0 }, "autocolorscale": true } ] }, "layout": { "geo": { "bgcolor": "white", "showland": true, "lakecolor": "white", "landcolor": "rgb(237,237,237)", "showlakes": true, "subunitcolor": "white" }, "font": { "color": "rgb(51,51,51)" }, "polar": { "bgcolor": "rgb(237,237,237)", "radialaxis": { "ticks": "outside", "showgrid": true, "gridcolor": "white", "linecolor": "white", "tickcolor": "rgb(51,51,51)" }, "angularaxis": { "ticks": "outside", "showgrid": true, "gridcolor": "white", "linecolor": "white", "tickcolor": "rgb(51,51,51)" } }, "scene": { "xaxis": { "ticks": "outside", "showgrid": true, "gridcolor": "white", "gridwidth": 2, "linecolor": "white", "tickcolor": "rgb(51,51,51)", "zerolinecolor": "white", "showbackground": true, "backgroundcolor": "rgb(237,237,237)" }, "yaxis": { "ticks": "outside", "showgrid": true, "gridcolor": "white", "gridwidth": 2, "linecolor": "white", "tickcolor": "rgb(51,51,51)", "zerolinecolor": "white", "showbackground": true, "backgroundcolor": "rgb(237,237,237)" }, "zaxis": { "ticks": "outside", "showgrid": true, "gridcolor": "white", "gridwidth": 2, "linecolor": "white", "tickcolor": "rgb(51,51,51)", "zerolinecolor": "white", "showbackground": true, "backgroundcolor": "rgb(237,237,237)" } }, "xaxis": { "ticks": "outside", "showgrid": true, "gridcolor": "white", "linecolor": "white", "tickcolor": "rgb(51,51,51)", "automargin": true, "zerolinecolor": "white" }, "yaxis": { "ticks": "outside", "showgrid": true, "gridcolor": "white", "linecolor": "white", "tickcolor": "rgb(51,51,51)", "automargin": true, "zerolinecolor": "white" }, "ternary": { "aaxis": { "ticks": "outside", "showgrid": true, "gridcolor": "white", "linecolor": "white", "tickcolor": "rgb(51,51,51)" }, "baxis": { "ticks": "outside", "showgrid": true, "gridcolor": "white", "linecolor": "white", "tickcolor": "rgb(51,51,51)" }, "caxis": { "ticks": "outside", "showgrid": true, "gridcolor": "white", "linecolor": "white", "tickcolor": "rgb(51,51,51)" }, "bgcolor": "rgb(237,237,237)" }, "colorway": [ "#F8766D", "#A3A500", "#00BF7D", "#00B0F6", "#E76BF3" ], "hovermode": "closest", "colorscale": { "diverging": [ [ 0, "#40004b" ], [ 0.1, "#762a83" ], [ 0.2, "#9970ab" ], [ 0.3, "#c2a5cf" ], [ 0.4, "#e7d4e8" ], [ 0.5, "#f7f7f7" ], [ 0.6, "#d9f0d3" ], [ 0.7, "#a6dba0" ], [ 0.8, "#5aae61" ], [ 0.9, "#1b7837" ], [ 1, "#00441b" ] ], "sequential": [ [ 0, "rgb(20,44,66)" ], [ 1, "rgb(90,179,244)" ] ], "sequentialminus": [ [ 0, "rgb(20,44,66)" ], [ 1, "rgb(90,179,244)" ] ] }, "plot_bgcolor": "rgb(237,237,237)", "paper_bgcolor": "white", "shapedefaults": { "line": { "width": 0 }, "opacity": 0.3, "fillcolor": "black" }, "annotationdefaults": { "arrowhead": 0, "arrowwidth": 1 } }, "themeRef": "GGPLOT2" } } }, "height": null, "width": null, "user": { "profile_url": "https://chart-studio.plotly.com/~mageshissivan", "avatar_url": "https://storage.googleapis.com/plotly-prod-profiles/86.jpg", "background_url": "https://storage.googleapis.com/plotly-prod-profiles/bg-3.jpg", "bio": "", "nickname": "", "website": "", "stream_tokens": null, "feature_set_id": null, "csrf_token": null, "date_joined": "2020-09-02 06:08:53", "mapbox_access_tokens": null, "has_password": null, "username": "mageshissivan", "email": null, "is_active": null, "readonly": null, "is_dash_creator": null, "dash_created_count": null, "is_chart_creator": null, "charts_created_count": null } }, { "creation_time": "2025-08-25T08:48:52.828420Z", "comments": { "results": [], "count": 0 }, "parented": true, "embed_url": "https://chart-studio.plotly.com/~Adechina/1.embed", "fid": "Adechina:1", "filename": "Suivi irrigation", "filetype": "plot", "img_url": "https://storage.googleapis.com/plotly-prod-images/Adechina/1/9_1N389Z2OC3P1J6BNYB1UZCS9Z1I0SO.png", "image_urls": { "default": "https://storage.googleapis.com/plotly-prod-images/Adechina/1/2_ND768G3ZRP1S9W2CUJMMS5Z8W79DDR.png", "block-thumb": "https://storage.googleapis.com/plotly-prod-images/Adechina/1/8_HGVXUCEBH6PIIMRWWO4PXJA8VAI8C5.png", "list-thumb": "https://storage.googleapis.com/plotly-prod-images/Adechina/1/9_1N389Z2OC3P1J6BNYB1UZCS9Z1I0SO.png" }, "api_urls": { "files": "https://api.plotly.com/v2/files/Adechina:1", "plots": "https://api.plotly.com/v2/plots/Adechina:1", "parent": "https://api.plotly.com/v2/folders/home?user=Adechina" }, "owner": "Adechina", "parent": -1, "preview": "", "referencers": [], "references": [], "title": "", "views": 0, "web_url": "https://chart-studio.plotly.com/~Adechina/1/", "world_readable": true, "date_modified": "2025-08-25T08:48:52.839Z", "stars": { "results": [], "count": 0 }, "collaborators": { "results": [], "count": 0 }, "subfolder_count": null, "refresh_interval": null, "organize_view_url": "https://chart-studio.plotly.com/~Adechina/1/", "current_user_permission": "read", "is_theme": null, "is_template": false, "autosize": true, "caption": "", "figure": { "data": [ { "meta": { "columnNames": { "x": "Zone humide", "y": "Temps irri (s)" } }, "mode": "markers", "type": "box", "xsrc": "Adechina:0:cc6b41", "ysrc": "Adechina:0:1e1dbc", "boxpoints": false } ], "frames": [], "layout": { "title": { "text": "Temps d'irrigation en fonction de la zone humide " }, "xaxis": { "type": "category", "range": [ -0.5, 2.5 ], "autorange": true }, "yaxis": { "type": "linear", "range": [ 435.44444444444446, 3766.5555555555557 ], "autorange": true }, "autosize": true, "template": { "data": { "bar": [ { "type": "bar", "marker": { "colorbar": { "ticks": "", "outlinewidth": 0 } } } ], "table": [ { "type": "table", "cells": { "fill": { "color": "#EBF0F8" }, "line": { "color": "white" } }, "header": { "fill": { "color": "#C8D4E3" }, "line": { "color": "white" } } } ], "carpet": [ { "type": "carpet", "aaxis": { "gridcolor": "#C8D4E3", "linecolor": "#C8D4E3", "endlinecolor": "#2a3f5f", "minorgridcolor": "#C8D4E3", "startlinecolor": "#2a3f5f" }, "baxis": { "gridcolor": "#C8D4E3", "linecolor": "#C8D4E3", "endlinecolor": "#2a3f5f", "minorgridcolor": "#C8D4E3", "startlinecolor": "#2a3f5f" } } ], "mesh3d": [ { "type": "mesh3d", "colorbar": { "ticks": "", "outlinewidth": 0 } } ], "contour": [ { "type": "contour", "colorbar": { "ticks": "", "outlinewidth": 0 }, "autocolorscale": true } ], "heatmap": [ { "type": "heatmap", "colorbar": { "ticks": "", "outlinewidth": 0 }, "autocolorscale": true } ], "scatter": [ { "type": "scatter", "marker": { "colorbar": { "ticks": "", "outlinewidth": 0 } } } ], "surface": [ { "type": "surface", "colorbar": { "ticks": "", "outlinewidth": 0 } } ], "heatmapgl": [ { "type": "heatmapgl", "colorbar": { "ticks": "", "outlinewidth": 0 } } ], "histogram": [ { "type": "histogram", "marker": { "colorbar": { "ticks": "", "outlinewidth": 0 } } } ], "parcoords": [ { "line": { "colorbar": { "ticks": "", "outlinewidth": 0 } }, "type": "parcoords" } ], "scatter3d": [ { "type": "scatter3d", "marker": { "colorbar": { "ticks": "", "outlinewidth": 0 } } } ], "scattergl": [ { "type": "scattergl", "marker": { "colorbar": { "ticks": "", "outlinewidth": 0 } } } ], "choropleth": [ { "type": "choropleth", "colorbar": { "ticks": "", "outlinewidth": 0 } } ], "scattergeo": [ { "type": "scattergeo", "marker": { "colorbar": { "ticks": "", "outlinewidth": 0 } } } ], "histogram2d": [ { "type": "histogram2d", "colorbar": { "ticks": "", "outlinewidth": 0 }, "autocolorscale": true } ], "scatterpolar": [ { "type": "scatterpolar", "marker": { "colorbar": { "ticks": "", "outlinewidth": 0 } } } ], "contourcarpet": [ { "type": "contourcarpet", "colorbar": { "ticks": "", "outlinewidth": 0 } } ], "scattercarpet": [ { "type": "scattercarpet", "marker": { "colorbar": { "ticks": "", "outlinewidth": 0 } } } ], "scattermapbox": [ { "type": "scattermapbox", "marker": { "colorbar": { "ticks": "", "outlinewidth": 0 } } } ], "scatterpolargl": [ { "type": "scatterpolargl", "marker": { "colorbar": { "ticks": "", "outlinewidth": 0 } } } ], "scatterternary": [ { "type": "scatterternary", "marker": { "colorbar": { "ticks": "", "outlinewidth": 0 } } } ], "histogram2dcontour": [ { "type": "histogram2dcontour", "colorbar": { "ticks": "", "outlinewidth": 0 }, "autocolorscale": true } ] }, "layout": { "geo": { "bgcolor": "white", "showland": true, "lakecolor": "white", "landcolor": "white", "showlakes": true, "subunitcolor": "#C8D4E3" }, "font": { "color": "#2a3f5f" }, "polar": { "bgcolor": "white", "radialaxis": { "ticks": "", "gridcolor": "#EBF0F8", "linecolor": "#EBF0F8" }, "angularaxis": { "ticks": "", "gridcolor": "#EBF0F8", "linecolor": "#EBF0F8" } }, "scene": { "xaxis": { "ticks": "", "gridcolor": "#DFE8F3", "gridwidth": 2, "linecolor": "#EBF0F8", "zerolinecolor": "#EBF0F8", "showbackground": true, "backgroundcolor": "white" }, "yaxis": { "ticks": "", "gridcolor": "#DFE8F3", "gridwidth": 2, "linecolor": "#EBF0F8", "zerolinecolor": "#EBF0F8", "showbackground": true, "backgroundcolor": "white" }, "zaxis": { "ticks": "", "gridcolor": "#DFE8F3", "gridwidth": 2, "linecolor": "#EBF0F8", "zerolinecolor": "#EBF0F8", "showbackground": true, "backgroundcolor": "white" } }, "title": { "x": 0.05 }, "xaxis": { "ticks": "", "gridcolor": "#EBF0F8", "linecolor": "#EBF0F8", "automargin": true, "zerolinecolor": "#EBF0F8", "zerolinewidth": 2 }, "yaxis": { "ticks": "", "gridcolor": "#EBF0F8", "linecolor": "#EBF0F8", "automargin": true, "zerolinecolor": "#EBF0F8", "zerolinewidth": 2 }, "ternary": { "aaxis": { "ticks": "", "gridcolor": "#DFE8F3", "linecolor": "#A2B1C6" }, "baxis": { "ticks": "", "gridcolor": "#DFE8F3", "linecolor": "#A2B1C6" }, "caxis": { "ticks": "", "gridcolor": "#DFE8F3", "linecolor": "#A2B1C6" }, "bgcolor": "white" }, "colorway": [ "#636efa", "#EF553B", "#00cc96", "#ab63fa", "#19d3f3", "#e763fa", "#fecb52", "#ffa15a", "#ff6692", "#b6e880" ], "hovermode": "closest", "colorscale": { "diverging": [ [ 0, "#8e0152" ], [ 0.1, "#c51b7d" ], [ 0.2, "#de77ae" ], [ 0.3, "#f1b6da" ], [ 0.4, "#fde0ef" ], [ 0.5, "#f7f7f7" ], [ 0.6, "#e6f5d0" ], [ 0.7, "#b8e186" ], [ 0.8, "#7fbc41" ], [ 0.9, "#4d9221" ], [ 1, "#276419" ] ], "sequential": [ [ 0, "#0508b8" ], [ 0.0893854748603352, "#1910d8" ], [ 0.1787709497206704, "#3c19f0" ], [ 0.2681564245810056, "#6b1cfb" ], [ 0.3575418994413408, "#981cfd" ], [ 0.44692737430167595, "#bf1cfd" ], [ 0.5363128491620112, "#dd2bfd" ], [ 0.6256983240223464, "#f246fe" ], [ 0.7150837988826816, "#fc67fd" ], [ 0.8044692737430168, "#fe88fc" ], [ 0.8938547486033519, "#fea5fd" ], [ 0.9832402234636871, "#febefe" ], [ 1, "#fec3fe" ] ], "sequentialminus": [ [ 0, "#0508b8" ], [ 0.0893854748603352, "#1910d8" ], [ 0.1787709497206704, "#3c19f0" ], [ 0.2681564245810056, "#6b1cfb" ], [ 0.3575418994413408, "#981cfd" ], [ 0.44692737430167595, "#bf1cfd" ], [ 0.5363128491620112, "#dd2bfd" ], [ 0.6256983240223464, "#f246fe" ], [ 0.7150837988826816, "#fc67fd" ], [ 0.8044692737430168, "#fe88fc" ], [ 0.8938547486033519, "#fea5fd" ], [ 0.9832402234636871, "#febefe" ], [ 1, "#fec3fe" ] ] }, "plot_bgcolor": "white", "paper_bgcolor": "white", "shapedefaults": { "line": { "width": 0 }, "opacity": 0.4, "fillcolor": "#506784" }, "annotationdefaults": { "arrowhead": 0, "arrowcolor": "#506784", "arrowwidth": 1 } }, "themeRef": "PLOTLY_WHITE" } } }, "height": null, "width": null, "user": { "profile_url": "https://chart-studio.plotly.com/~Adechina", "avatar_url": "https://storage.googleapis.com/plotly-prod-profiles/59.jpg", "background_url": "https://storage.googleapis.com/plotly-prod-profiles/bg-13.jpg", "bio": "", "nickname": "", "website": "", "stream_tokens": null, "feature_set_id": null, "csrf_token": null, "date_joined": "2025-08-24 22:57:38", "mapbox_access_tokens": null, "has_password": null, "username": "Adechina", "email": null, "is_active": null, "readonly": null, "is_dash_creator": null, "dash_created_count": null, "is_chart_creator": null, "charts_created_count": null } } ] }
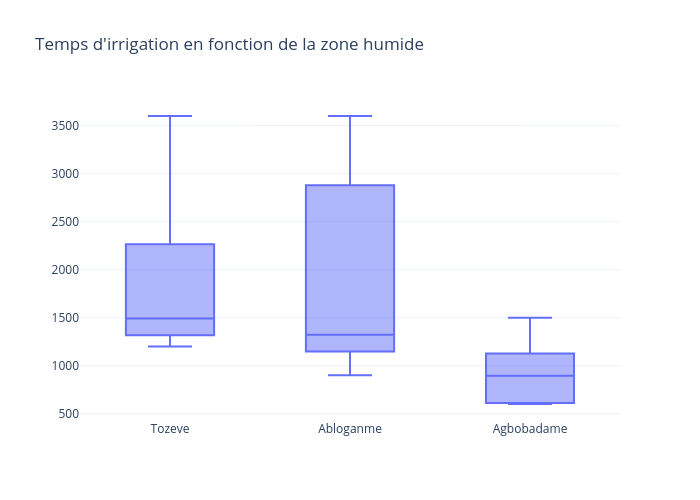
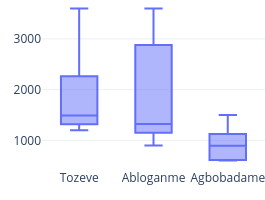