Plots List
Plots
This endpoint handles manipulation of Plotly plot files.
Reference
Authorization
Any user with or without a Plotly account may view public plots. For private plots, see authentication.
Actions
list
Listing all public plots can be done via a GET request to this endpoint.
By default, plots will be listed in order of date created. The order_by
query parameter is accepted at this endpoint. Currently, only ordering by
views is supported. It is possible to filter the plots by quality
with min_quality or max_quality as query parameter.
Example:
// GET https://api.plotly.com/v2/plots/ ---> 200

// GET https://api.plotly.com/v2/plots/?order_by=-views ---> 200

// GET https://api.plotly.com/v2/plots/?min_quality=5 ---> 200

// GET https://api.plotly.com/v2/plots/?max_quality=5 ---> 200
feed
Listing all handpicked feed plots can be done via a GET request to this endpoint. By default, plots will be listed in a random order.
Example:
// GET https://api.plotly.com/v2/plots/feed ---> 200
create
You can create new plot resources here. The only required field is 'figure'. Currently, the figure is restricted to only contain references to grid data. That is, this will fail if raw data arrays are passed in. To create and manipulate underlying grids for plots, see the grids endpoint.
Example:
// This fails because a figure field is required.
// POST https://api.plotly.com/v2/plots ---> 400 Bad Request
{}

// This fails because the figure has raw data
//POST https://api.plotly.com/v2/plots ---> 400 Bad Request
{
    "figure": {"data": [{"y": ['this', 'is', 'raw', 'data']}]}
}

// This succeeds because the figure has src keys, not raw data.
//POST https://api.plotly.com/v2/plots ---> 200 OK
{
    "figure": {"data": [{"ysrc": "sven:88:u8nd62"}]}
}
When creating a grid, you can optionally specify a source_fid to specify where a plot has come from:
- source_fid: the fid of a plot that was copied (and presumably edited) to produce this one
detail
There is a lot of meta information stored about plot files including filename, title, share_url, and content_url to name a few.
This information can only be reached with a GET to this endpoint.
Example:
// GET https://api.plotly.com/v2/plots/iheartgraphs:90
content
The contents of a plot can be downloaded via the content resource. The plot
content contains referenced grid/column data by default. If you wish to
return the raw grid/column data, the inline_data=true query must be included
in the request url. The Content-Type header will be appropriately set for the
response body.
Alternatively, you can set ?map_data=unreadable to append a mapping of
sources to data that belongs to grids which are unreadable for the
requestor. This is useful when you have read access to another users plot,
but that plot contains grid references which you don't have access to.
Examples:
// Returns referenced grid/column data
// GET https://api.plotly.com/v2/plots/iheartgraphs:90/content ---> 200 OK

// Returns full grid/column data
// GET https://api.plotly.com/v2/plots/iheartgraphs:90/content?inline_data=true ---> 200 OK

// Returns full grid/column data when requestor doesn't have permission
// to read the referenced grid.
// GET https://api.plotly.com/v2/plots/iheartgraphs:90/content?map_data=unreadable ---> 200 OK
GET /v2/plots/?cursor=cj0xJnA9MjAyNS0wOC0yOSswMSUzQTUyJTNBMjYuNjcwMDkzJTJCMDAlM0EwMA%3D%3D&format=api
{ "next": "https://api.plotly.com/v2/plots/?cursor=cD0yMDI1LTA4LTI5KzAyJTNBNDYlM0E0My45OTM3NjglMkIwMCUzQTAw&format=api", "previous": "https://api.plotly.com/v2/plots/?cursor=cj0xJnA9MjAyNS0wOC0yOSswOSUzQTM0JTNBNTQuOTU3NDgxJTJCMDAlM0EwMA%3D%3D&format=api", "results": [ { "creation_time": "2025-08-29T09:34:54.957481Z", "comments": { "results": [], "count": 0 }, "parented": true, "embed_url": "https://chart-studio.plotly.com/~kunal.patil/1.embed", "fid": "kunal.patil:1", "filename": "Plot 1", "filetype": "plot", "img_url": "https://api.plotly.com/v2/files/kunal.patil:1/image?image_name=list-thumb", "image_urls": { "default": "https://api.plotly.com/v2/files/kunal.patil:1/image?image_name=default", "block-thumb": "https://storage.googleapis.com/plotly-prod-images/kunal.patil/1/8_4YKMNITS9XLO91CDXV6XMWB7CMILCO.png", "list-thumb": "https://api.plotly.com/v2/files/kunal.patil:1/image?image_name=list-thumb" }, "api_urls": { "files": "https://api.plotly.com/v2/files/kunal.patil:1", "plots": "https://api.plotly.com/v2/plots/kunal.patil:1", "parent": "https://api.plotly.com/v2/folders/home?user=kunal.patil" }, "owner": "kunal.patil", "parent": -1, "preview": "", "referencers": [], "references": [], "title": "", "views": 0, "web_url": "https://chart-studio.plotly.com/~kunal.patil/1/", "world_readable": true, "date_modified": "2025-08-29T09:44:19.518Z", "stars": { "results": [], "count": 0 }, "collaborators": { "results": [], "count": 0 }, "subfolder_count": null, "refresh_interval": null, "organize_view_url": "https://chart-studio.plotly.com/~kunal.patil/1/", "current_user_permission": "read", "is_theme": null, "is_template": false, "autosize": true, "caption": "", "figure": { "data": [ { "meta": { "columnNames": { "z": "B", "locations": "A" } }, "mode": "markers", "type": "choropleth", "zsrc": "kunal.patil:0:7abbca", "locationmode": "country names", "locationssrc": "kunal.patil:0:3c05fd" } ], "frames": [], "layout": { "geo": {}, "xaxis": { "range": [ -1, 6 ], "autorange": true }, "yaxis": { "range": [ -1, 4 ], "autorange": true }, "autosize": true, "template": { "data": { "bar": [ { "type": "bar", "marker": { "colorbar": { "ticks": "", "outlinewidth": 0 } } } ], "table": [ { "type": "table", "cells": { "fill": { "color": "#EBF0F8" }, "line": { "color": "white" } }, "header": { "fill": { "color": "#C8D4E3" }, "line": { "color": "white" } } } ], "carpet": [ { "type": "carpet", "aaxis": { "gridcolor": "#C8D4E3", "linecolor": "#C8D4E3", "endlinecolor": "#2a3f5f", "minorgridcolor": "#C8D4E3", "startlinecolor": "#2a3f5f" }, "baxis": { "gridcolor": "#C8D4E3", "linecolor": "#C8D4E3", "endlinecolor": "#2a3f5f", "minorgridcolor": "#C8D4E3", "startlinecolor": "#2a3f5f" } } ], "mesh3d": [ { "type": "mesh3d", "colorbar": { "ticks": "", "outlinewidth": 0 } } ], "contour": [ { "type": "contour", "colorbar": { "ticks": "", "outlinewidth": 0 }, "autocolorscale": true } ], "heatmap": [ { "type": "heatmap", "colorbar": { "ticks": "", "outlinewidth": 0 }, "autocolorscale": true } ], "scatter": [ { "type": "scatter", "marker": { "colorbar": { "ticks": "", "outlinewidth": 0 } } } ], "surface": [ { "type": "surface", "colorbar": { "ticks": "", "outlinewidth": 0 } } ], "heatmapgl": [ { "type": "heatmapgl", "colorbar": { "ticks": "", "outlinewidth": 0 } } ], "histogram": [ { "type": "histogram", "marker": { "colorbar": { "ticks": "", "outlinewidth": 0 } } } ], "parcoords": [ { "line": { "colorbar": { "ticks": "", "outlinewidth": 0 } }, "type": "parcoords" } ], "scatter3d": [ { "type": "scatter3d", "marker": { "colorbar": { "ticks": "", "outlinewidth": 0 } } } ], "scattergl": [ { "type": "scattergl", "marker": { "colorbar": { "ticks": "", "outlinewidth": 0 } } } ], "choropleth": [ { "type": "choropleth", "colorbar": { "ticks": "", "outlinewidth": 0 } } ], "scattergeo": [ { "type": "scattergeo", "marker": { "colorbar": { "ticks": "", "outlinewidth": 0 } } } ], "histogram2d": [ { "type": "histogram2d", "colorbar": { "ticks": "", "outlinewidth": 0 }, "autocolorscale": true } ], "scatterpolar": [ { "type": "scatterpolar", "marker": { "colorbar": { "ticks": "", "outlinewidth": 0 } } } ], "contourcarpet": [ { "type": "contourcarpet", "colorbar": { "ticks": "", "outlinewidth": 0 } } ], "scattercarpet": [ { "type": "scattercarpet", "marker": { "colorbar": { "ticks": "", "outlinewidth": 0 } } } ], "scattermapbox": [ { "type": "scattermapbox", "marker": { "colorbar": { "ticks": "", "outlinewidth": 0 } } } ], "scatterpolargl": [ { "type": "scatterpolargl", "marker": { "colorbar": { "ticks": "", "outlinewidth": 0 } } } ], "scatterternary": [ { "type": "scatterternary", "marker": { "colorbar": { "ticks": "", "outlinewidth": 0 } } } ], "histogram2dcontour": [ { "type": "histogram2dcontour", "colorbar": { "ticks": "", "outlinewidth": 0 }, "autocolorscale": true } ] }, "layout": { "geo": { "bgcolor": "white", "showland": true, "lakecolor": "white", "landcolor": "white", "showlakes": true, "subunitcolor": "#C8D4E3" }, "font": { "color": "#2a3f5f" }, "polar": { "bgcolor": "white", "radialaxis": { "ticks": "", "gridcolor": "#EBF0F8", "linecolor": "#EBF0F8" }, "angularaxis": { "ticks": "", "gridcolor": "#EBF0F8", "linecolor": "#EBF0F8" } }, "scene": { "xaxis": { "ticks": "", "gridcolor": "#DFE8F3", "gridwidth": 2, "linecolor": "#EBF0F8", "zerolinecolor": "#EBF0F8", "showbackground": true, "backgroundcolor": "white" }, "yaxis": { "ticks": "", "gridcolor": "#DFE8F3", "gridwidth": 2, "linecolor": "#EBF0F8", "zerolinecolor": "#EBF0F8", "showbackground": true, "backgroundcolor": "white" }, "zaxis": { "ticks": "", "gridcolor": "#DFE8F3", "gridwidth": 2, "linecolor": "#EBF0F8", "zerolinecolor": "#EBF0F8", "showbackground": true, "backgroundcolor": "white" } }, "title": { "x": 0.05 }, "xaxis": { "ticks": "", "gridcolor": "#EBF0F8", "linecolor": "#EBF0F8", "automargin": true, "zerolinecolor": "#EBF0F8", "zerolinewidth": 2 }, "yaxis": { "ticks": "", "gridcolor": "#EBF0F8", "linecolor": "#EBF0F8", "automargin": true, "zerolinecolor": "#EBF0F8", "zerolinewidth": 2 }, "ternary": { "aaxis": { "ticks": "", "gridcolor": "#DFE8F3", "linecolor": "#A2B1C6" }, "baxis": { "ticks": "", "gridcolor": "#DFE8F3", "linecolor": "#A2B1C6" }, "caxis": { "ticks": "", "gridcolor": "#DFE8F3", "linecolor": "#A2B1C6" }, "bgcolor": "white" }, "colorway": [ "#636efa", "#EF553B", "#00cc96", "#ab63fa", "#19d3f3", "#e763fa", "#fecb52", "#ffa15a", "#ff6692", "#b6e880" ], "hovermode": "closest", "colorscale": { "diverging": [ [ 0, "#8e0152" ], [ 0.1, "#c51b7d" ], [ 0.2, "#de77ae" ], [ 0.3, "#f1b6da" ], [ 0.4, "#fde0ef" ], [ 0.5, "#f7f7f7" ], [ 0.6, "#e6f5d0" ], [ 0.7, "#b8e186" ], [ 0.8, "#7fbc41" ], [ 0.9, "#4d9221" ], [ 1, "#276419" ] ], "sequential": [ [ 0, "#0508b8" ], [ 0.0893854748603352, "#1910d8" ], [ 0.1787709497206704, "#3c19f0" ], [ 0.2681564245810056, "#6b1cfb" ], [ 0.3575418994413408, "#981cfd" ], [ 0.44692737430167595, "#bf1cfd" ], [ 0.5363128491620112, "#dd2bfd" ], [ 0.6256983240223464, "#f246fe" ], [ 0.7150837988826816, "#fc67fd" ], [ 0.8044692737430168, "#fe88fc" ], [ 0.8938547486033519, "#fea5fd" ], [ 0.9832402234636871, "#febefe" ], [ 1, "#fec3fe" ] ], "sequentialminus": [ [ 0, "#0508b8" ], [ 0.0893854748603352, "#1910d8" ], [ 0.1787709497206704, "#3c19f0" ], [ 0.2681564245810056, "#6b1cfb" ], [ 0.3575418994413408, "#981cfd" ], [ 0.44692737430167595, "#bf1cfd" ], [ 0.5363128491620112, "#dd2bfd" ], [ 0.6256983240223464, "#f246fe" ], [ 0.7150837988826816, "#fc67fd" ], [ 0.8044692737430168, "#fe88fc" ], [ 0.8938547486033519, "#fea5fd" ], [ 0.9832402234636871, "#febefe" ], [ 1, "#fec3fe" ] ] }, "plot_bgcolor": "white", "paper_bgcolor": "white", "shapedefaults": { "line": { "width": 0 }, "opacity": 0.4, "fillcolor": "#506784" }, "annotationdefaults": { "arrowhead": 0, "arrowcolor": "#506784", "arrowwidth": 1 } }, "themeRef": "PLOTLY_WHITE" } } }, "height": null, "width": null, "user": { "profile_url": "https://chart-studio.plotly.com/~kunal.patil", "avatar_url": "https://storage.googleapis.com/plotly-prod-profiles/6.jpg", "background_url": "https://storage.googleapis.com/plotly-prod-profiles/bg-10.jpg", "bio": "", "nickname": "", "website": "", "stream_tokens": null, "feature_set_id": null, "csrf_token": null, "date_joined": "2025-08-29 09:29:40", "mapbox_access_tokens": null, "has_password": null, "username": "kunal.patil", "email": null, "is_active": null, "readonly": null, "is_dash_creator": null, "dash_created_count": null, "is_chart_creator": null, "charts_created_count": null } }, { "creation_time": "2025-08-29T08:52:47.347679Z", "comments": { "results": [], "count": 0 }, "parented": true, "embed_url": "https://chart-studio.plotly.com/~sruthiwimi/91.embed", "fid": "sruthiwimi:91", "filename": "Edge-center APPInsi", "filetype": "plot", "img_url": "https://storage.googleapis.com/plotly-prod-images/sruthiwimi/91/9_5D90RDZF7F7QALPZPO2XT5DC6VEKP6.png", "image_urls": { "default": "https://api.plotly.com/v2/files/sruthiwimi:91/image?image_name=default", "block-thumb": "https://storage.googleapis.com/plotly-prod-images/sruthiwimi/91/8_25WQBPJFJEDZF5SZQHILUWNK48F32K.png", "list-thumb": "https://storage.googleapis.com/plotly-prod-images/sruthiwimi/91/9_5D90RDZF7F7QALPZPO2XT5DC6VEKP6.png" }, "api_urls": { "files": "https://api.plotly.com/v2/files/sruthiwimi:91", "plots": "https://api.plotly.com/v2/plots/sruthiwimi:91", "parent": "https://api.plotly.com/v2/folders/home?user=sruthiwimi" }, "owner": "sruthiwimi", "parent": -1, "preview": "", "referencers": [], "references": [], "title": "", "views": 0, "web_url": "https://chart-studio.plotly.com/~sruthiwimi/91/", "world_readable": true, "date_modified": "2025-09-03T12:13:16.577Z", "stars": { "results": [], "count": 0 }, "collaborators": { "results": [], "count": 0 }, "subfolder_count": null, "refresh_interval": null, "organize_view_url": "https://chart-studio.plotly.com/~sruthiwimi/91/", "current_user_permission": "read", "is_theme": null, "is_template": false, "autosize": true, "caption": "", "figure": { "data": [ { "meta": { "columnNames": { "x": "A", "y": "B", "error_y": { "array": "C" } } }, "mode": "markers", "name": "Edge, 50 kJ", "type": "bar", "xsrc": "sruthiwimi:90:374f87", "ysrc": "sruthiwimi:90:e56fe7", "marker": { "color": "rgb(149, 149, 157)" }, "error_y": { "meta": { "columnNames": { "array": "C" } }, "type": "data", "visible": true, "arraysrc": "sruthiwimi:90:a96db3", "symmetric": true }, "orientation": "v" }, { "meta": { "columnNames": { "x": "A", "y": "D", "error_y": { "array": "E" } } }, "name": "Edge, 150 kJ", "type": "bar", "xsrc": "sruthiwimi:90:374f87", "ysrc": "sruthiwimi:90:277e16", "marker": { "color": "rgb(134, 128, 127)" }, "error_y": { "meta": { "columnNames": { "array": "E" } }, "type": "data", "visible": true, "arraysrc": "sruthiwimi:90:93e7c4", "symmetric": true }, "orientation": "v" }, { "meta": { "columnNames": { "x": "A", "y": "F", "error_y": { "array": "G" } } }, "name": "Center, 50 kJ", "type": "bar", "xsrc": "sruthiwimi:90:374f87", "ysrc": "sruthiwimi:90:43b9da", "marker": { "color": "rgb(205, 159, 113)" }, "error_y": { "meta": { "columnNames": { "array": "G" } }, "type": "data", "visible": true, "arraysrc": "sruthiwimi:90:718a6d", "symmetric": true }, "orientation": "v" }, { "meta": { "columnNames": { "x": "A", "y": "H", "error_y": { "array": "I" } } }, "name": "Center, 150 kJ", "type": "bar", "xsrc": "sruthiwimi:90:374f87", "ysrc": "sruthiwimi:90:8ed9d3", "marker": { "color": "rgb(213, 124, 38)" }, "error_y": { "meta": { "columnNames": { "array": "I" } }, "type": "data", "visible": true, "arraysrc": "sruthiwimi:90:274301", "symmetric": true }, "orientation": "v" } ], "frames": [], "layout": { "xaxis": { "type": "linear", "range": [ -5, 55 ], "title": { "font": { "size": 25, "family": "Arial" }, "text": "APPInsi % w/w" }, "domain": [ 0, 0.5 ], "mirror": "ticks", "showgrid": false, "showline": true, "tickfont": { "size": 20, "family": "Arial" }, "autorange": true, "linecolor": "rgb(57, 58, 61)", "automargin": true }, "yaxis": { "type": "linear", "range": [ -0.12165336872157795, 34.11544728978406 ], "title": { "font": { "size": 25, "family": "Arial" }, "text": "Post-fire flexural modulus / GPa" }, "domain": [ 0.25, 1 ], "mirror": "ticks", "showgrid": false, "showline": true, "tickfont": { "size": 20, "family": "Arial" }, "autorange": false, "linecolor": "rgb(57, 58, 61)", "automargin": true }, "legend": { "x": 0.02973066846011237, "y": 0.9906955711011768, "font": { "size": 25, "family": "Arial" }, "borderwidth": 1 }, "autosize": true, "template": { "data": { "bar": [ { "type": "bar", "marker": { "colorbar": { "ticks": "", "outlinewidth": 0 } } } ], "table": [ { "type": "table", "cells": { "fill": { "color": "#EBF0F8" }, "line": { "color": "white" } }, "header": { "fill": { "color": "#C8D4E3" }, "line": { "color": "white" } } } ], "carpet": [ { "type": "carpet", "aaxis": { "gridcolor": "#C8D4E3", "linecolor": "#C8D4E3", "endlinecolor": "#2a3f5f", "minorgridcolor": "#C8D4E3", "startlinecolor": "#2a3f5f" }, "baxis": { "gridcolor": "#C8D4E3", "linecolor": "#C8D4E3", "endlinecolor": "#2a3f5f", "minorgridcolor": "#C8D4E3", "startlinecolor": "#2a3f5f" } } ], "mesh3d": [ { "type": "mesh3d", "colorbar": { "ticks": "", "outlinewidth": 0 } } ], "contour": [ { "type": "contour", "colorbar": { "ticks": "", "outlinewidth": 0 }, "autocolorscale": true } ], "heatmap": [ { "type": "heatmap", "colorbar": { "ticks": "", "outlinewidth": 0 }, "autocolorscale": true } ], "scatter": [ { "type": "scatter", "marker": { "colorbar": { "ticks": "", "outlinewidth": 0 } } } ], "surface": [ { "type": "surface", "colorbar": { "ticks": "", "outlinewidth": 0 } } ], "heatmapgl": [ { "type": "heatmapgl", "colorbar": { "ticks": "", "outlinewidth": 0 } } ], "histogram": [ { "type": "histogram", "marker": { "colorbar": { "ticks": "", "outlinewidth": 0 } } } ], "parcoords": [ { "line": { "colorbar": { "ticks": "", "outlinewidth": 0 } }, "type": "parcoords" } ], "scatter3d": [ { "type": "scatter3d", "marker": { "colorbar": { "ticks": "", "outlinewidth": 0 } } } ], "scattergl": [ { "type": "scattergl", "marker": { "colorbar": { "ticks": "", "outlinewidth": 0 } } } ], "choropleth": [ { "type": "choropleth", "colorbar": { "ticks": "", "outlinewidth": 0 } } ], "scattergeo": [ { "type": "scattergeo", "marker": { "colorbar": { "ticks": "", "outlinewidth": 0 } } } ], "histogram2d": [ { "type": "histogram2d", "colorbar": { "ticks": "", "outlinewidth": 0 }, "autocolorscale": true } ], "scatterpolar": [ { "type": "scatterpolar", "marker": { "colorbar": { "ticks": "", "outlinewidth": 0 } } } ], "contourcarpet": [ { "type": "contourcarpet", "colorbar": { "ticks": "", "outlinewidth": 0 } } ], "scattercarpet": [ { "type": "scattercarpet", "marker": { "colorbar": { "ticks": "", "outlinewidth": 0 } } } ], "scattermapbox": [ { "type": "scattermapbox", "marker": { "colorbar": { "ticks": "", "outlinewidth": 0 } } } ], "scatterpolargl": [ { "type": "scatterpolargl", "marker": { "colorbar": { "ticks": "", "outlinewidth": 0 } } } ], "scatterternary": [ { "type": "scatterternary", "marker": { "colorbar": { "ticks": "", "outlinewidth": 0 } } } ], "histogram2dcontour": [ { "type": "histogram2dcontour", "colorbar": { "ticks": "", "outlinewidth": 0 }, "autocolorscale": true } ] }, "layout": { "geo": { "bgcolor": "white", "showland": true, "lakecolor": "white", "landcolor": "white", "showlakes": true, "subunitcolor": "#C8D4E3" }, "font": { "color": "#2a3f5f" }, "polar": { "bgcolor": "white", "radialaxis": { "ticks": "", "gridcolor": "#EBF0F8", "linecolor": "#EBF0F8" }, "angularaxis": { "ticks": "", "gridcolor": "#EBF0F8", "linecolor": "#EBF0F8" } }, "scene": { "xaxis": { "ticks": "", "gridcolor": "#DFE8F3", "gridwidth": 2, "linecolor": "#EBF0F8", "zerolinecolor": "#EBF0F8", "showbackground": true, "backgroundcolor": "white" }, "yaxis": { "ticks": "", "gridcolor": "#DFE8F3", "gridwidth": 2, "linecolor": "#EBF0F8", "zerolinecolor": "#EBF0F8", "showbackground": true, "backgroundcolor": "white" }, "zaxis": { "ticks": "", "gridcolor": "#DFE8F3", "gridwidth": 2, "linecolor": "#EBF0F8", "zerolinecolor": "#EBF0F8", "showbackground": true, "backgroundcolor": "white" } }, "title": { "x": 0.05 }, "xaxis": { "ticks": "", "gridcolor": "#EBF0F8", "linecolor": "#EBF0F8", "automargin": true, "zerolinecolor": "#EBF0F8", "zerolinewidth": 2 }, "yaxis": { "ticks": "", "gridcolor": "#EBF0F8", "linecolor": "#EBF0F8", "automargin": true, "zerolinecolor": "#EBF0F8", "zerolinewidth": 2 }, "ternary": { "aaxis": { "ticks": "", "gridcolor": "#DFE8F3", "linecolor": "#A2B1C6" }, "baxis": { "ticks": "", "gridcolor": "#DFE8F3", "linecolor": "#A2B1C6" }, "caxis": { "ticks": "", "gridcolor": "#DFE8F3", "linecolor": "#A2B1C6" }, "bgcolor": "white" }, "colorway": [ "#636efa", "#EF553B", "#00cc96", "#ab63fa", "#19d3f3", "#e763fa", "#fecb52", "#ffa15a", "#ff6692", "#b6e880" ], "hovermode": "closest", "colorscale": { "diverging": [ [ 0, "#8e0152" ], [ 0.1, "#c51b7d" ], [ 0.2, "#de77ae" ], [ 0.3, "#f1b6da" ], [ 0.4, "#fde0ef" ], [ 0.5, "#f7f7f7" ], [ 0.6, "#e6f5d0" ], [ 0.7, "#b8e186" ], [ 0.8, "#7fbc41" ], [ 0.9, "#4d9221" ], [ 1, "#276419" ] ], "sequential": [ [ 0, "#0508b8" ], [ 0.0893854748603352, "#1910d8" ], [ 0.1787709497206704, "#3c19f0" ], [ 0.2681564245810056, "#6b1cfb" ], [ 0.3575418994413408, "#981cfd" ], [ 0.44692737430167595, "#bf1cfd" ], [ 0.5363128491620112, "#dd2bfd" ], [ 0.6256983240223464, "#f246fe" ], [ 0.7150837988826816, "#fc67fd" ], [ 0.8044692737430168, "#fe88fc" ], [ 0.8938547486033519, "#fea5fd" ], [ 0.9832402234636871, "#febefe" ], [ 1, "#fec3fe" ] ], "sequentialminus": [ [ 0, "#0508b8" ], [ 0.0893854748603352, "#1910d8" ], [ 0.1787709497206704, "#3c19f0" ], [ 0.2681564245810056, "#6b1cfb" ], [ 0.3575418994413408, "#981cfd" ], [ 0.44692737430167595, "#bf1cfd" ], [ 0.5363128491620112, "#dd2bfd" ], [ 0.6256983240223464, "#f246fe" ], [ 0.7150837988826816, "#fc67fd" ], [ 0.8044692737430168, "#fe88fc" ], [ 0.8938547486033519, "#fea5fd" ], [ 0.9832402234636871, "#febefe" ], [ 1, "#fec3fe" ] ] }, "plot_bgcolor": "white", "paper_bgcolor": "white", "shapedefaults": { "line": { "width": 0 }, "opacity": 0.4, "fillcolor": "#506784" }, "annotationdefaults": { "arrowhead": 0, "arrowcolor": "#506784", "arrowwidth": 1 } }, "themeRef": "PLOTLY_WHITE" } } }, "height": null, "width": null, "user": { "profile_url": "https://chart-studio.plotly.com/~sruthiwimi", "avatar_url": "https://storage.googleapis.com/plotly-prod-profiles/90.jpg", "background_url": "https://storage.googleapis.com/plotly-prod-profiles/bg-13.jpg", "bio": "", "nickname": "", "website": "", "stream_tokens": null, "feature_set_id": null, "csrf_token": null, "date_joined": "2022-01-13 16:37:50", "mapbox_access_tokens": null, "has_password": null, "username": "sruthiwimi", "email": null, "is_active": null, "readonly": null, "is_dash_creator": null, "dash_created_count": null, "is_chart_creator": null, "charts_created_count": null } }, { "creation_time": "2025-08-29T08:47:35.032278Z", "comments": { "results": [], "count": 0 }, "parented": true, "embed_url": "https://chart-studio.plotly.com/~giovanni.zanotelli/1.embed", "fid": "giovanni.zanotelli:1", "filename": "Plot 1", "filetype": "plot", "img_url": "https://api.plotly.com/v2/files/giovanni.zanotelli:1/image?image_name=list-thumb", "image_urls": { "default": "https://api.plotly.com/v2/files/giovanni.zanotelli:1/image?image_name=default", "block-thumb": "https://storage.googleapis.com/plotly-prod-images/giovanni.zanotelli/1/8_FRBYLYVPYFFLA3H654Q1Q33P01XBX1.png", "list-thumb": "https://api.plotly.com/v2/files/giovanni.zanotelli:1/image?image_name=list-thumb" }, "api_urls": { "files": "https://api.plotly.com/v2/files/giovanni.zanotelli:1", "plots": "https://api.plotly.com/v2/plots/giovanni.zanotelli:1", "parent": "https://api.plotly.com/v2/folders/home?user=giovanni.zanotelli" }, "owner": "giovanni.zanotelli", "parent": -1, "preview": "", "referencers": [], "references": [], "title": "", "views": 0, "web_url": "https://chart-studio.plotly.com/~giovanni.zanotelli/1/", "world_readable": true, "date_modified": "2025-08-29T09:08:34.567Z", "stars": { "results": [], "count": 0 }, "collaborators": { "results": [], "count": 0 }, "subfolder_count": null, "refresh_interval": null, "organize_view_url": "https://chart-studio.plotly.com/~giovanni.zanotelli/1/", "current_user_permission": "read", "is_theme": null, "is_template": false, "autosize": true, "caption": "", "figure": { "data": [ { "meta": { "columnNames": { "x": "M", "y": "N" } }, "mode": "lines", "name": "serum", "type": "scatter", "xsrc": "giovanni.zanotelli:0:fcd093", "ysrc": "giovanni.zanotelli:0:5ef506" }, { "meta": { "columnNames": { "x": "A", "y": "B" } }, "mode": "lines", "name": "", "type": "scatter", "xsrc": "giovanni.zanotelli:0:181b5c", "ysrc": "giovanni.zanotelli:0:ce2561", "opacity": 0, "visible": true, "stackgroup": null }, { "meta": { "columnNames": { "x": "Q", "y": "R" } }, "mode": "lines", "name": "CSF", "type": "scatter", "xsrc": "giovanni.zanotelli:0:36975d", "ysrc": "giovanni.zanotelli:0:c71fab", "stackgroup": null } ], "frames": [], "layout": { "title": { "text": "Click to enter Plot title" }, "xaxis": { "type": "date", "range": [ "2022-06-01", "2025-06-01" ], "autorange": true }, "yaxis": { "type": "linear", "range": [ -52.77777777777777, 1002.7777777777778 ], "title": { "text": "Anti-GABAAR titer" }, "autorange": true }, "modebar": { "orientation": "h" }, "autosize": true, "template": { "data": { "bar": [ { "type": "bar", "marker": { "colorbar": { "ticks": "", "outlinewidth": 0 } } } ], "table": [ { "type": "table", "cells": { "fill": { "color": "#EBF0F8" }, "line": { "color": "white" } }, "header": { "fill": { "color": "#C8D4E3" }, "line": { "color": "white" } } } ], "carpet": [ { "type": "carpet", "aaxis": { "gridcolor": "#C8D4E3", "linecolor": "#C8D4E3", "endlinecolor": "#2a3f5f", "minorgridcolor": "#C8D4E3", "startlinecolor": "#2a3f5f" }, "baxis": { "gridcolor": "#C8D4E3", "linecolor": "#C8D4E3", "endlinecolor": "#2a3f5f", "minorgridcolor": "#C8D4E3", "startlinecolor": "#2a3f5f" } } ], "mesh3d": [ { "type": "mesh3d", "colorbar": { "ticks": "", "outlinewidth": 0 } } ], "contour": [ { "type": "contour", "colorbar": { "ticks": "", "outlinewidth": 0 }, "autocolorscale": true } ], "heatmap": [ { "type": "heatmap", "colorbar": { "ticks": "", "outlinewidth": 0 }, "autocolorscale": true } ], "scatter": [ { "type": "scatter", "marker": { "colorbar": { "ticks": "", "outlinewidth": 0 } } } ], "surface": [ { "type": "surface", "colorbar": { "ticks": "", "outlinewidth": 0 } } ], "heatmapgl": [ { "type": "heatmapgl", "colorbar": { "ticks": "", "outlinewidth": 0 } } ], "histogram": [ { "type": "histogram", "marker": { "colorbar": { "ticks": "", "outlinewidth": 0 } } } ], "parcoords": [ { "line": { "colorbar": { "ticks": "", "outlinewidth": 0 } }, "type": "parcoords" } ], "scatter3d": [ { "type": "scatter3d", "marker": { "colorbar": { "ticks": "", "outlinewidth": 0 } } } ], "scattergl": [ { "type": "scattergl", "marker": { "colorbar": { "ticks": "", "outlinewidth": 0 } } } ], "choropleth": [ { "type": "choropleth", "colorbar": { "ticks": "", "outlinewidth": 0 } } ], "scattergeo": [ { "type": "scattergeo", "marker": { "colorbar": { "ticks": "", "outlinewidth": 0 } } } ], "histogram2d": [ { "type": "histogram2d", "colorbar": { "ticks": "", "outlinewidth": 0 }, "autocolorscale": true } ], "scatterpolar": [ { "type": "scatterpolar", "marker": { "colorbar": { "ticks": "", "outlinewidth": 0 } } } ], "contourcarpet": [ { "type": "contourcarpet", "colorbar": { "ticks": "", "outlinewidth": 0 } } ], "scattercarpet": [ { "type": "scattercarpet", "marker": { "colorbar": { "ticks": "", "outlinewidth": 0 } } } ], "scattermapbox": [ { "type": "scattermapbox", "marker": { "colorbar": { "ticks": "", "outlinewidth": 0 } } } ], "scatterpolargl": [ { "type": "scatterpolargl", "marker": { "colorbar": { "ticks": "", "outlinewidth": 0 } } } ], "scatterternary": [ { "type": "scatterternary", "marker": { "colorbar": { "ticks": "", "outlinewidth": 0 } } } ], "histogram2dcontour": [ { "type": "histogram2dcontour", "colorbar": { "ticks": "", "outlinewidth": 0 }, "autocolorscale": true } ] }, "layout": { "geo": { "bgcolor": "white", "showland": true, "lakecolor": "white", "landcolor": "white", "showlakes": true, "subunitcolor": "#C8D4E3" }, "font": { "color": "#2a3f5f" }, "polar": { "bgcolor": "white", "radialaxis": { "ticks": "", "gridcolor": "#EBF0F8", "linecolor": "#EBF0F8" }, "angularaxis": { "ticks": "", "gridcolor": "#EBF0F8", "linecolor": "#EBF0F8" } }, "scene": { "xaxis": { "ticks": "", "gridcolor": "#DFE8F3", "gridwidth": 2, "linecolor": "#EBF0F8", "zerolinecolor": "#EBF0F8", "showbackground": true, "backgroundcolor": "white" }, "yaxis": { "ticks": "", "gridcolor": "#DFE8F3", "gridwidth": 2, "linecolor": "#EBF0F8", "zerolinecolor": "#EBF0F8", "showbackground": true, "backgroundcolor": "white" }, "zaxis": { "ticks": "", "gridcolor": "#DFE8F3", "gridwidth": 2, "linecolor": "#EBF0F8", "zerolinecolor": "#EBF0F8", "showbackground": true, "backgroundcolor": "white" } }, "title": { "x": 0.05 }, "xaxis": { "ticks": "", "gridcolor": "#EBF0F8", "linecolor": "#EBF0F8", "automargin": true, "zerolinecolor": "#EBF0F8", "zerolinewidth": 2 }, "yaxis": { "ticks": "", "gridcolor": "#EBF0F8", "linecolor": "#EBF0F8", "automargin": true, "zerolinecolor": "#EBF0F8", "zerolinewidth": 2 }, "ternary": { "aaxis": { "ticks": "", "gridcolor": "#DFE8F3", "linecolor": "#A2B1C6" }, "baxis": { "ticks": "", "gridcolor": "#DFE8F3", "linecolor": "#A2B1C6" }, "caxis": { "ticks": "", "gridcolor": "#DFE8F3", "linecolor": "#A2B1C6" }, "bgcolor": "white" }, "colorway": [ "#636efa", "#EF553B", "#00cc96", "#ab63fa", "#19d3f3", "#e763fa", "#fecb52", "#ffa15a", "#ff6692", "#b6e880" ], "hovermode": "closest", "colorscale": { "diverging": [ [ 0, "#8e0152" ], [ 0.1, "#c51b7d" ], [ 0.2, "#de77ae" ], [ 0.3, "#f1b6da" ], [ 0.4, "#fde0ef" ], [ 0.5, "#f7f7f7" ], [ 0.6, "#e6f5d0" ], [ 0.7, "#b8e186" ], [ 0.8, "#7fbc41" ], [ 0.9, "#4d9221" ], [ 1, "#276419" ] ], "sequential": [ [ 0, "#0508b8" ], [ 0.0893854748603352, "#1910d8" ], [ 0.1787709497206704, "#3c19f0" ], [ 0.2681564245810056, "#6b1cfb" ], [ 0.3575418994413408, "#981cfd" ], [ 0.44692737430167595, "#bf1cfd" ], [ 0.5363128491620112, "#dd2bfd" ], [ 0.6256983240223464, "#f246fe" ], [ 0.7150837988826816, "#fc67fd" ], [ 0.8044692737430168, "#fe88fc" ], [ 0.8938547486033519, "#fea5fd" ], [ 0.9832402234636871, "#febefe" ], [ 1, "#fec3fe" ] ], "sequentialminus": [ [ 0, "#0508b8" ], [ 0.0893854748603352, "#1910d8" ], [ 0.1787709497206704, "#3c19f0" ], [ 0.2681564245810056, "#6b1cfb" ], [ 0.3575418994413408, "#981cfd" ], [ 0.44692737430167595, "#bf1cfd" ], [ 0.5363128491620112, "#dd2bfd" ], [ 0.6256983240223464, "#f246fe" ], [ 0.7150837988826816, "#fc67fd" ], [ 0.8044692737430168, "#fe88fc" ], [ 0.8938547486033519, "#fea5fd" ], [ 0.9832402234636871, "#febefe" ], [ 1, "#fec3fe" ] ] }, "plot_bgcolor": "white", "paper_bgcolor": "white", "shapedefaults": { "line": { "width": 0 }, "opacity": 0.4, "fillcolor": "#506784" }, "annotationdefaults": { "arrowhead": 0, "arrowcolor": "#506784", "arrowwidth": 1 } }, "themeRef": "PLOTLY_WHITE" }, "annotations": [] } }, "height": null, "width": null, "user": { "profile_url": "https://chart-studio.plotly.com/~giovanni.zanotelli", "avatar_url": "https://storage.googleapis.com/plotly-prod-profiles/57.jpg", "background_url": "https://storage.googleapis.com/plotly-prod-profiles/bg-14.jpg", "bio": "", "nickname": "", "website": "", "stream_tokens": null, "feature_set_id": null, "csrf_token": null, "date_joined": "2025-08-27 17:05:04", "mapbox_access_tokens": null, "has_password": null, "username": "giovanni.zanotelli", "email": null, "is_active": null, "readonly": null, "is_dash_creator": null, "dash_created_count": null, "is_chart_creator": null, "charts_created_count": null } }, { "creation_time": "2025-08-29T06:36:38.022254Z", "comments": { "results": [], "count": 0 }, "parented": true, "embed_url": "https://chart-studio.plotly.com/~LeviL/4.embed", "fid": "LeviL:4", "filename": "香港金管局市场交易+当日银行间港币流动性", "filetype": "plot", "img_url": "https://storage.googleapis.com/plotly-prod-images/LeviL/4/9_M6IAI2XCZVGO8L96T5MILMQ82K1662.png", "image_urls": { "default": "https://api.plotly.com/v2/files/LeviL:4/image?image_name=default", "block-thumb": "https://api.plotly.com/v2/files/LeviL:4/image?image_name=block-thumb", "list-thumb": "https://storage.googleapis.com/plotly-prod-images/LeviL/4/9_M6IAI2XCZVGO8L96T5MILMQ82K1662.png" }, "api_urls": { "files": "https://api.plotly.com/v2/files/LeviL:4", "plots": "https://api.plotly.com/v2/plots/LeviL:4", "parent": "https://api.plotly.com/v2/folders/home?user=LeviL" }, "owner": "LeviL", "parent": -1, "preview": "", "referencers": [], "references": [], "title": "", "views": 0, "web_url": "https://chart-studio.plotly.com/~LeviL/4/", "world_readable": true, "date_modified": "2025-09-04T03:20:32.263Z", "stars": { "results": [], "count": 0 }, "collaborators": { "results": [], "count": 0 }, "subfolder_count": null, "refresh_interval": null, "organize_view_url": "https://chart-studio.plotly.com/~LeviL/4/", "current_user_permission": "read", "is_theme": null, "is_template": null, "autosize": true, "caption": "", "figure": { "data": [ { "line": { "color": "#d62728" }, "mode": "lines", "name": "当日银行间港币流动性(折线)", "type": "scatter", "xsrc": "LeviL:40:135ca7", "ysrc": "LeviL:40:25f619", "xaxis": "x", "yaxis": "y", "hovertemplate": "%{x|%Y年%m月%d日}<br>流动性:%{y:,.2f}亿<extra></extra>" }, { "name": "金管局市场交易(柱状)", "type": "bar", "xsrc": "LeviL:40:ea6ce5", "ysrc": "LeviL:40:a67798", "xaxis": "x", "yaxis": "y2", "marker": { "color": "rgba(91, 143, 249, 0.95)" }, "opacity": 1.0, "hovertemplate": "%{x|%Y年%m月%d日}<br>市场交易:%{y:,.2f}亿<extra></extra>" } ], "layout": { "font": { "size": 12, "family": "Garamond, \"EB Garamond\", \"DFKai-SB\", \"DFKai_SB\", \"BiauKai\", \"Microsoft JhengHei\", \"PingFang TC\", \"Noto Sans CJK TC\", \"Noto Sans CJK SC\", \"Microsoft YaHei\", \"SimHei\"" }, "title": { "text": "金管局市场交易 (柱状) + 当日银行间港币流动性 (折线)" }, "xaxis": { "title": { "text": "日期" }, "anchor": "y", "domain": [ 0.0, 0.94 ], "tickformat": "%Y年%m月%d日" }, "yaxis": { "range": [ 2.7636000000000003, 4710.0234 ], "title": { "text": "当日银行间港币流动性(亿)" }, "anchor": "x", "domain": [ 0.0, 1.0 ], "tickformat": ".2f", "ticksuffix": "亿" }, "bargap": 0, "legend": { "x": 0, "y": 1.02, "xanchor": "left", "yanchor": "bottom", "orientation": "h" }, "yaxis2": { "side": "right", "range": [ -266.706, 1282.7540000000001 ], "title": { "text": "金管局市场交易(亿)" }, "anchor": "x", "overlaying": "y", "tickformat": ".2f", "ticksuffix": "亿" }, "template": { "data": { "bar": [ { "type": "bar", "marker": { "line": { "color": "white", "width": 0.5 }, "pattern": { "size": 10, "fillmode": "overlay", "solidity": 0.2 } }, "error_x": { "color": "#2a3f5f" }, "error_y": { "color": "#2a3f5f" } } ], "pie": [ { "type": "pie", "automargin": true } ], "table": [ { "type": "table", "cells": { "fill": { "color": "#EBF0F8" }, "line": { "color": "white" } }, "header": { "fill": { "color": "#C8D4E3" }, "line": { "color": "white" } } } ], "carpet": [ { "type": "carpet", "aaxis": { "gridcolor": "#C8D4E3", "linecolor": "#C8D4E3", "endlinecolor": "#2a3f5f", "minorgridcolor": "#C8D4E3", "startlinecolor": "#2a3f5f" }, "baxis": { "gridcolor": "#C8D4E3", "linecolor": "#C8D4E3", "endlinecolor": "#2a3f5f", "minorgridcolor": "#C8D4E3", "startlinecolor": "#2a3f5f" } } ], "mesh3d": [ { "type": "mesh3d", "colorbar": { "ticks": "", "outlinewidth": 0 } } ], "contour": [ { "type": "contour", "colorbar": { "ticks": "", "outlinewidth": 0 }, "colorscale": [ [ 0.0, "#0d0887" ], [ 0.1111111111111111, "#46039f" ], [ 0.2222222222222222, "#7201a8" ], [ 0.3333333333333333, "#9c179e" ], [ 0.4444444444444444, "#bd3786" ], [ 0.5555555555555556, "#d8576b" ], [ 0.6666666666666666, "#ed7953" ], [ 0.7777777777777778, "#fb9f3a" ], [ 0.8888888888888888, "#fdca26" ], [ 1.0, "#f0f921" ] ] } ], "heatmap": [ { "type": "heatmap", "colorbar": { "ticks": "", "outlinewidth": 0 }, "colorscale": [ [ 0.0, "#0d0887" ], [ 0.1111111111111111, "#46039f" ], [ 0.2222222222222222, "#7201a8" ], [ 0.3333333333333333, "#9c179e" ], [ 0.4444444444444444, "#bd3786" ], [ 0.5555555555555556, "#d8576b" ], [ 0.6666666666666666, "#ed7953" ], [ 0.7777777777777778, "#fb9f3a" ], [ 0.8888888888888888, "#fdca26" ], [ 1.0, "#f0f921" ] ] } ], "scatter": [ { "type": "scatter", "fillpattern": { "size": 10, "fillmode": "overlay", "solidity": 0.2 } } ], "surface": [ { "type": "surface", "colorbar": { "ticks": "", "outlinewidth": 0 }, "colorscale": [ [ 0.0, "#0d0887" ], [ 0.1111111111111111, "#46039f" ], [ 0.2222222222222222, "#7201a8" ], [ 0.3333333333333333, "#9c179e" ], [ 0.4444444444444444, "#bd3786" ], [ 0.5555555555555556, "#d8576b" ], [ 0.6666666666666666, "#ed7953" ], [ 0.7777777777777778, "#fb9f3a" ], [ 0.8888888888888888, "#fdca26" ], [ 1.0, "#f0f921" ] ] } ], "barpolar": [ { "type": "barpolar", "marker": { "line": { "color": "white", "width": 0.5 }, "pattern": { "size": 10, "fillmode": "overlay", "solidity": 0.2 } } } ], "heatmapgl": [ { "type": "heatmapgl", "colorbar": { "ticks": "", "outlinewidth": 0 }, "colorscale": [ [ 0.0, "#0d0887" ], [ 0.1111111111111111, "#46039f" ], [ 0.2222222222222222, "#7201a8" ], [ 0.3333333333333333, "#9c179e" ], [ 0.4444444444444444, "#bd3786" ], [ 0.5555555555555556, "#d8576b" ], [ 0.6666666666666666, "#ed7953" ], [ 0.7777777777777778, "#fb9f3a" ], [ 0.8888888888888888, "#fdca26" ], [ 1.0, "#f0f921" ] ] } ], "histogram": [ { "type": "histogram", "marker": { "pattern": { "size": 10, "fillmode": "overlay", "solidity": 0.2 } } } ], "parcoords": [ { "line": { "colorbar": { "ticks": "", "outlinewidth": 0 } }, "type": "parcoords" } ], "scatter3d": [ { "line": { "colorbar": { "ticks": "", "outlinewidth": 0 } }, "type": "scatter3d", "marker": { "colorbar": { "ticks": "", "outlinewidth": 0 } } } ], "scattergl": [ { "type": "scattergl", "marker": { "colorbar": { "ticks": "", "outlinewidth": 0 } } } ], "choropleth": [ { "type": "choropleth", "colorbar": { "ticks": "", "outlinewidth": 0 } } ], "scattergeo": [ { "type": "scattergeo", "marker": { "colorbar": { "ticks": "", "outlinewidth": 0 } } } ], "histogram2d": [ { "type": "histogram2d", "colorbar": { "ticks": "", "outlinewidth": 0 }, "colorscale": [ [ 0.0, "#0d0887" ], [ 0.1111111111111111, "#46039f" ], [ 0.2222222222222222, "#7201a8" ], [ 0.3333333333333333, "#9c179e" ], [ 0.4444444444444444, "#bd3786" ], [ 0.5555555555555556, "#d8576b" ], [ 0.6666666666666666, "#ed7953" ], [ 0.7777777777777778, "#fb9f3a" ], [ 0.8888888888888888, "#fdca26" ], [ 1.0, "#f0f921" ] ] } ], "scatterpolar": [ { "type": "scatterpolar", "marker": { "colorbar": { "ticks": "", "outlinewidth": 0 } } } ], "contourcarpet": [ { "type": "contourcarpet", "colorbar": { "ticks": "", "outlinewidth": 0 } } ], "scattercarpet": [ { "type": "scattercarpet", "marker": { "colorbar": { "ticks": "", "outlinewidth": 0 } } } ], "scattermapbox": [ { "type": "scattermapbox", "marker": { "colorbar": { "ticks": "", "outlinewidth": 0 } } } ], "scatterpolargl": [ { "type": "scatterpolargl", "marker": { "colorbar": { "ticks": "", "outlinewidth": 0 } } } ], "scatterternary": [ { "type": "scatterternary", "marker": { "colorbar": { "ticks": "", "outlinewidth": 0 } } } ], "histogram2dcontour": [ { "type": "histogram2dcontour", "colorbar": { "ticks": "", "outlinewidth": 0 }, "colorscale": [ [ 0.0, "#0d0887" ], [ 0.1111111111111111, "#46039f" ], [ 0.2222222222222222, "#7201a8" ], [ 0.3333333333333333, "#9c179e" ], [ 0.4444444444444444, "#bd3786" ], [ 0.5555555555555556, "#d8576b" ], [ 0.6666666666666666, "#ed7953" ], [ 0.7777777777777778, "#fb9f3a" ], [ 0.8888888888888888, "#fdca26" ], [ 1.0, "#f0f921" ] ] } ] }, "layout": { "geo": { "bgcolor": "white", "showland": true, "lakecolor": "white", "landcolor": "white", "showlakes": true, "subunitcolor": "#C8D4E3" }, "font": { "color": "#2a3f5f" }, "polar": { "bgcolor": "white", "radialaxis": { "ticks": "", "gridcolor": "#EBF0F8", "linecolor": "#EBF0F8" }, "angularaxis": { "ticks": "", "gridcolor": "#EBF0F8", "linecolor": "#EBF0F8" } }, "scene": { "xaxis": { "ticks": "", "gridcolor": "#DFE8F3", "gridwidth": 2, "linecolor": "#EBF0F8", "zerolinecolor": "#EBF0F8", "showbackground": true, "backgroundcolor": "white" }, "yaxis": { "ticks": "", "gridcolor": "#DFE8F3", "gridwidth": 2, "linecolor": "#EBF0F8", "zerolinecolor": "#EBF0F8", "showbackground": true, "backgroundcolor": "white" }, "zaxis": { "ticks": "", "gridcolor": "#DFE8F3", "gridwidth": 2, "linecolor": "#EBF0F8", "zerolinecolor": "#EBF0F8", "showbackground": true, "backgroundcolor": "white" } }, "title": { "x": 0.05 }, "xaxis": { "ticks": "", "title": { "standoff": 15 }, "gridcolor": "#EBF0F8", "linecolor": "#EBF0F8", "automargin": true, "zerolinecolor": "#EBF0F8", "zerolinewidth": 2 }, "yaxis": { "ticks": "", "title": { "standoff": 15 }, "gridcolor": "#EBF0F8", "linecolor": "#EBF0F8", "automargin": true, "zerolinecolor": "#EBF0F8", "zerolinewidth": 2 }, "mapbox": { "style": "light" }, "ternary": { "aaxis": { "ticks": "", "gridcolor": "#DFE8F3", "linecolor": "#A2B1C6" }, "baxis": { "ticks": "", "gridcolor": "#DFE8F3", "linecolor": "#A2B1C6" }, "caxis": { "ticks": "", "gridcolor": "#DFE8F3", "linecolor": "#A2B1C6" }, "bgcolor": "white" }, "colorway": [ "#636efa", "#EF553B", "#00cc96", "#ab63fa", "#FFA15A", "#19d3f3", "#FF6692", "#B6E880", "#FF97FF", "#FECB52" ], "coloraxis": { "colorbar": { "ticks": "", "outlinewidth": 0 } }, "hovermode": "closest", "colorscale": { "diverging": [ [ 0, "#8e0152" ], [ 0.1, "#c51b7d" ], [ 0.2, "#de77ae" ], [ 0.3, "#f1b6da" ], [ 0.4, "#fde0ef" ], [ 0.5, "#f7f7f7" ], [ 0.6, "#e6f5d0" ], [ 0.7, "#b8e186" ], [ 0.8, "#7fbc41" ], [ 0.9, "#4d9221" ], [ 1, "#276419" ] ], "sequential": [ [ 0.0, "#0d0887" ], [ 0.1111111111111111, "#46039f" ], [ 0.2222222222222222, "#7201a8" ], [ 0.3333333333333333, "#9c179e" ], [ 0.4444444444444444, "#bd3786" ], [ 0.5555555555555556, "#d8576b" ], [ 0.6666666666666666, "#ed7953" ], [ 0.7777777777777778, "#fb9f3a" ], [ 0.8888888888888888, "#fdca26" ], [ 1.0, "#f0f921" ] ], "sequentialminus": [ [ 0.0, "#0d0887" ], [ 0.1111111111111111, "#46039f" ], [ 0.2222222222222222, "#7201a8" ], [ 0.3333333333333333, "#9c179e" ], [ 0.4444444444444444, "#bd3786" ], [ 0.5555555555555556, "#d8576b" ], [ 0.6666666666666666, "#ed7953" ], [ 0.7777777777777778, "#fb9f3a" ], [ 0.8888888888888888, "#fdca26" ], [ 1.0, "#f0f921" ] ] }, "hoverlabel": { "align": "left" }, "plot_bgcolor": "white", "paper_bgcolor": "white", "shapedefaults": { "line": { "color": "#2a3f5f" } }, "autotypenumbers": "strict", "annotationdefaults": { "arrowhead": 0, "arrowcolor": "#2a3f5f", "arrowwidth": 1 } } } } }, "height": null, "width": null, "user": { "profile_url": "https://chart-studio.plotly.com/~LeviL", "avatar_url": "https://storage.googleapis.com/plotly-prod-profiles/4.jpg", "background_url": "https://storage.googleapis.com/plotly-prod-profiles/bg-0.jpg", "bio": "", "nickname": "", "website": "", "stream_tokens": null, "feature_set_id": null, "csrf_token": null, "date_joined": "2025-08-29 06:25:35", "mapbox_access_tokens": null, "has_password": null, "username": "LeviL", "email": null, "is_active": null, "readonly": null, "is_dash_creator": null, "dash_created_count": null, "is_chart_creator": null, "charts_created_count": null } }, { "creation_time": "2025-08-29T06:29:54.877934Z", "comments": { "results": [], "count": 0 }, "parented": true, "embed_url": "https://chart-studio.plotly.com/~LeviL/2.embed", "fid": "LeviL:2", "filename": "interactive-chart", "filetype": "plot", "img_url": "https://api.plotly.com/v2/files/LeviL:2/image?image_name=list-thumb", "image_urls": { "default": "https://storage.googleapis.com/plotly-prod-images/LeviL/2/2_TJIVEKMJB20P0SBULTXQJYHS54NAIB.png", "block-thumb": "https://storage.googleapis.com/plotly-prod-images/LeviL/2/8_93AUF4A4YD4WFD1ZC5GCM86QWRT0G3.png", "list-thumb": "https://api.plotly.com/v2/files/LeviL:2/image?image_name=list-thumb" }, "api_urls": { "files": "https://api.plotly.com/v2/files/LeviL:2", "plots": "https://api.plotly.com/v2/plots/LeviL:2", "parent": "https://api.plotly.com/v2/folders/home?user=LeviL" }, "owner": "LeviL", "parent": -1, "preview": "", "referencers": [], "references": [], "title": "", "views": 0, "web_url": "https://chart-studio.plotly.com/~LeviL/2/", "world_readable": true, "date_modified": "2025-08-29T06:29:54.886Z", "stars": { "results": [], "count": 0 }, "collaborators": { "results": [], "count": 0 }, "subfolder_count": null, "refresh_interval": null, "organize_view_url": "https://chart-studio.plotly.com/~LeviL/2/", "current_user_permission": "read", "is_theme": null, "is_template": null, "autosize": true, "caption": "", "figure": { "data": [ { "line": { "color": "#d62728", "width": 2.5 }, "mode": "lines", "name": "当日银行间港币流动性(折线)", "type": "scatter", "xsrc": "LeviL:1:a7f779", "ysrc": "LeviL:1:5d5190", "xaxis": "x", "yaxis": "y", "hovertemplate": "%{x|%Y年%m月%d日}<br>流动性:%{y:,.2f}亿<extra></extra>" }, { "name": "金管局市场交易(柱状)", "type": "bar", "xsrc": "LeviL:1:3cee18", "ysrc": "LeviL:1:02ff5e", "xaxis": "x", "yaxis": "y2", "marker": { "color": "#5b8ff9" }, "opacity": 0.9, "hovertemplate": "%{x|%Y年%m月%d日}<br>市场交易:%{y:,.2f}亿<extra></extra>" } ], "layout": { "font": { "size": 12, "family": "Garamond, \"EB Garamond\", \"DFKai-SB\", \"DFKai_SB\", \"BiauKai\", \"Microsoft JhengHei\", \"PingFang TC\", \"Noto Sans CJK TC\", \"Noto Sans CJK SC\", \"Microsoft YaHei\", \"SimHei\"" }, "title": { "text": "金管局市场交易 (柱状) + 当日银行间港币流动性 (折线)" }, "xaxis": { "title": { "text": "日期" }, "anchor": "y", "domain": [ 0.0, 0.94 ], "tickformat": "%Y年%m月%d日" }, "yaxis": { "title": { "text": "当日银行间港币流动性(亿)" }, "anchor": "x", "domain": [ 0.0, 1.0 ], "tickformat": ".2f", "ticksuffix": "亿" }, "bargap": 0.15, "legend": { "x": 0, "y": 1.02, "xanchor": "left", "yanchor": "bottom", "orientation": "h" }, "yaxis2": { "side": "right", "title": { "text": "金管局市场交易(亿)" }, "anchor": "x", "overlaying": "y", "tickformat": ".2f", "ticksuffix": "亿" }, "template": { "data": { "bar": [ { "type": "bar", "marker": { "line": { "color": "white", "width": 0.5 }, "pattern": { "size": 10, "fillmode": "overlay", "solidity": 0.2 } }, "error_x": { "color": "#2a3f5f" }, "error_y": { "color": "#2a3f5f" } } ], "pie": [ { "type": "pie", "automargin": true } ], "table": [ { "type": "table", "cells": { "fill": { "color": "#EBF0F8" }, "line": { "color": "white" } }, "header": { "fill": { "color": "#C8D4E3" }, "line": { "color": "white" } } } ], "carpet": [ { "type": "carpet", "aaxis": { "gridcolor": "#C8D4E3", "linecolor": "#C8D4E3", "endlinecolor": "#2a3f5f", "minorgridcolor": "#C8D4E3", "startlinecolor": "#2a3f5f" }, "baxis": { "gridcolor": "#C8D4E3", "linecolor": "#C8D4E3", "endlinecolor": "#2a3f5f", "minorgridcolor": "#C8D4E3", "startlinecolor": "#2a3f5f" } } ], "mesh3d": [ { "type": "mesh3d", "colorbar": { "ticks": "", "outlinewidth": 0 } } ], "contour": [ { "type": "contour", "colorbar": { "ticks": "", "outlinewidth": 0 }, "colorscale": [ [ 0.0, "#0d0887" ], [ 0.1111111111111111, "#46039f" ], [ 0.2222222222222222, "#7201a8" ], [ 0.3333333333333333, "#9c179e" ], [ 0.4444444444444444, "#bd3786" ], [ 0.5555555555555556, "#d8576b" ], [ 0.6666666666666666, "#ed7953" ], [ 0.7777777777777778, "#fb9f3a" ], [ 0.8888888888888888, "#fdca26" ], [ 1.0, "#f0f921" ] ] } ], "heatmap": [ { "type": "heatmap", "colorbar": { "ticks": "", "outlinewidth": 0 }, "colorscale": [ [ 0.0, "#0d0887" ], [ 0.1111111111111111, "#46039f" ], [ 0.2222222222222222, "#7201a8" ], [ 0.3333333333333333, "#9c179e" ], [ 0.4444444444444444, "#bd3786" ], [ 0.5555555555555556, "#d8576b" ], [ 0.6666666666666666, "#ed7953" ], [ 0.7777777777777778, "#fb9f3a" ], [ 0.8888888888888888, "#fdca26" ], [ 1.0, "#f0f921" ] ] } ], "scatter": [ { "type": "scatter", "fillpattern": { "size": 10, "fillmode": "overlay", "solidity": 0.2 } } ], "surface": [ { "type": "surface", "colorbar": { "ticks": "", "outlinewidth": 0 }, "colorscale": [ [ 0.0, "#0d0887" ], [ 0.1111111111111111, "#46039f" ], [ 0.2222222222222222, "#7201a8" ], [ 0.3333333333333333, "#9c179e" ], [ 0.4444444444444444, "#bd3786" ], [ 0.5555555555555556, "#d8576b" ], [ 0.6666666666666666, "#ed7953" ], [ 0.7777777777777778, "#fb9f3a" ], [ 0.8888888888888888, "#fdca26" ], [ 1.0, "#f0f921" ] ] } ], "barpolar": [ { "type": "barpolar", "marker": { "line": { "color": "white", "width": 0.5 }, "pattern": { "size": 10, "fillmode": "overlay", "solidity": 0.2 } } } ], "heatmapgl": [ { "type": "heatmapgl", "colorbar": { "ticks": "", "outlinewidth": 0 }, "colorscale": [ [ 0.0, "#0d0887" ], [ 0.1111111111111111, "#46039f" ], [ 0.2222222222222222, "#7201a8" ], [ 0.3333333333333333, "#9c179e" ], [ 0.4444444444444444, "#bd3786" ], [ 0.5555555555555556, "#d8576b" ], [ 0.6666666666666666, "#ed7953" ], [ 0.7777777777777778, "#fb9f3a" ], [ 0.8888888888888888, "#fdca26" ], [ 1.0, "#f0f921" ] ] } ], "histogram": [ { "type": "histogram", "marker": { "pattern": { "size": 10, "fillmode": "overlay", "solidity": 0.2 } } } ], "parcoords": [ { "line": { "colorbar": { "ticks": "", "outlinewidth": 0 } }, "type": "parcoords" } ], "scatter3d": [ { "line": { "colorbar": { "ticks": "", "outlinewidth": 0 } }, "type": "scatter3d", "marker": { "colorbar": { "ticks": "", "outlinewidth": 0 } } } ], "scattergl": [ { "type": "scattergl", "marker": { "colorbar": { "ticks": "", "outlinewidth": 0 } } } ], "choropleth": [ { "type": "choropleth", "colorbar": { "ticks": "", "outlinewidth": 0 } } ], "scattergeo": [ { "type": "scattergeo", "marker": { "colorbar": { "ticks": "", "outlinewidth": 0 } } } ], "histogram2d": [ { "type": "histogram2d", "colorbar": { "ticks": "", "outlinewidth": 0 }, "colorscale": [ [ 0.0, "#0d0887" ], [ 0.1111111111111111, "#46039f" ], [ 0.2222222222222222, "#7201a8" ], [ 0.3333333333333333, "#9c179e" ], [ 0.4444444444444444, "#bd3786" ], [ 0.5555555555555556, "#d8576b" ], [ 0.6666666666666666, "#ed7953" ], [ 0.7777777777777778, "#fb9f3a" ], [ 0.8888888888888888, "#fdca26" ], [ 1.0, "#f0f921" ] ] } ], "scatterpolar": [ { "type": "scatterpolar", "marker": { "colorbar": { "ticks": "", "outlinewidth": 0 } } } ], "contourcarpet": [ { "type": "contourcarpet", "colorbar": { "ticks": "", "outlinewidth": 0 } } ], "scattercarpet": [ { "type": "scattercarpet", "marker": { "colorbar": { "ticks": "", "outlinewidth": 0 } } } ], "scattermapbox": [ { "type": "scattermapbox", "marker": { "colorbar": { "ticks": "", "outlinewidth": 0 } } } ], "scatterpolargl": [ { "type": "scatterpolargl", "marker": { "colorbar": { "ticks": "", "outlinewidth": 0 } } } ], "scatterternary": [ { "type": "scatterternary", "marker": { "colorbar": { "ticks": "", "outlinewidth": 0 } } } ], "histogram2dcontour": [ { "type": "histogram2dcontour", "colorbar": { "ticks": "", "outlinewidth": 0 }, "colorscale": [ [ 0.0, "#0d0887" ], [ 0.1111111111111111, "#46039f" ], [ 0.2222222222222222, "#7201a8" ], [ 0.3333333333333333, "#9c179e" ], [ 0.4444444444444444, "#bd3786" ], [ 0.5555555555555556, "#d8576b" ], [ 0.6666666666666666, "#ed7953" ], [ 0.7777777777777778, "#fb9f3a" ], [ 0.8888888888888888, "#fdca26" ], [ 1.0, "#f0f921" ] ] } ] }, "layout": { "geo": { "bgcolor": "white", "showland": true, "lakecolor": "white", "landcolor": "white", "showlakes": true, "subunitcolor": "#C8D4E3" }, "font": { "color": "#2a3f5f" }, "polar": { "bgcolor": "white", "radialaxis": { "ticks": "", "gridcolor": "#EBF0F8", "linecolor": "#EBF0F8" }, "angularaxis": { "ticks": "", "gridcolor": "#EBF0F8", "linecolor": "#EBF0F8" } }, "scene": { "xaxis": { "ticks": "", "gridcolor": "#DFE8F3", "gridwidth": 2, "linecolor": "#EBF0F8", "zerolinecolor": "#EBF0F8", "showbackground": true, "backgroundcolor": "white" }, "yaxis": { "ticks": "", "gridcolor": "#DFE8F3", "gridwidth": 2, "linecolor": "#EBF0F8", "zerolinecolor": "#EBF0F8", "showbackground": true, "backgroundcolor": "white" }, "zaxis": { "ticks": "", "gridcolor": "#DFE8F3", "gridwidth": 2, "linecolor": "#EBF0F8", "zerolinecolor": "#EBF0F8", "showbackground": true, "backgroundcolor": "white" } }, "title": { "x": 0.05 }, "xaxis": { "ticks": "", "title": { "standoff": 15 }, "gridcolor": "#EBF0F8", "linecolor": "#EBF0F8", "automargin": true, "zerolinecolor": "#EBF0F8", "zerolinewidth": 2 }, "yaxis": { "ticks": "", "title": { "standoff": 15 }, "gridcolor": "#EBF0F8", "linecolor": "#EBF0F8", "automargin": true, "zerolinecolor": "#EBF0F8", "zerolinewidth": 2 }, "mapbox": { "style": "light" }, "ternary": { "aaxis": { "ticks": "", "gridcolor": "#DFE8F3", "linecolor": "#A2B1C6" }, "baxis": { "ticks": "", "gridcolor": "#DFE8F3", "linecolor": "#A2B1C6" }, "caxis": { "ticks": "", "gridcolor": "#DFE8F3", "linecolor": "#A2B1C6" }, "bgcolor": "white" }, "colorway": [ "#636efa", "#EF553B", "#00cc96", "#ab63fa", "#FFA15A", "#19d3f3", "#FF6692", "#B6E880", "#FF97FF", "#FECB52" ], "coloraxis": { "colorbar": { "ticks": "", "outlinewidth": 0 } }, "hovermode": "closest", "colorscale": { "diverging": [ [ 0, "#8e0152" ], [ 0.1, "#c51b7d" ], [ 0.2, "#de77ae" ], [ 0.3, "#f1b6da" ], [ 0.4, "#fde0ef" ], [ 0.5, "#f7f7f7" ], [ 0.6, "#e6f5d0" ], [ 0.7, "#b8e186" ], [ 0.8, "#7fbc41" ], [ 0.9, "#4d9221" ], [ 1, "#276419" ] ], "sequential": [ [ 0.0, "#0d0887" ], [ 0.1111111111111111, "#46039f" ], [ 0.2222222222222222, "#7201a8" ], [ 0.3333333333333333, "#9c179e" ], [ 0.4444444444444444, "#bd3786" ], [ 0.5555555555555556, "#d8576b" ], [ 0.6666666666666666, "#ed7953" ], [ 0.7777777777777778, "#fb9f3a" ], [ 0.8888888888888888, "#fdca26" ], [ 1.0, "#f0f921" ] ], "sequentialminus": [ [ 0.0, "#0d0887" ], [ 0.1111111111111111, "#46039f" ], [ 0.2222222222222222, "#7201a8" ], [ 0.3333333333333333, "#9c179e" ], [ 0.4444444444444444, "#bd3786" ], [ 0.5555555555555556, "#d8576b" ], [ 0.6666666666666666, "#ed7953" ], [ 0.7777777777777778, "#fb9f3a" ], [ 0.8888888888888888, "#fdca26" ], [ 1.0, "#f0f921" ] ] }, "hoverlabel": { "align": "left" }, "plot_bgcolor": "white", "paper_bgcolor": "white", "shapedefaults": { "line": { "color": "#2a3f5f" } }, "autotypenumbers": "strict", "annotationdefaults": { "arrowhead": 0, "arrowcolor": "#2a3f5f", "arrowwidth": 1 } } } } }, "height": null, "width": null, "user": { "profile_url": "https://chart-studio.plotly.com/~LeviL", "avatar_url": "https://storage.googleapis.com/plotly-prod-profiles/4.jpg", "background_url": "https://storage.googleapis.com/plotly-prod-profiles/bg-0.jpg", "bio": "", "nickname": "", "website": "", "stream_tokens": null, "feature_set_id": null, "csrf_token": null, "date_joined": "2025-08-29 06:25:35", "mapbox_access_tokens": null, "has_password": null, "username": "LeviL", "email": null, "is_active": null, "readonly": null, "is_dash_creator": null, "dash_created_count": null, "is_chart_creator": null, "charts_created_count": null } }, { "creation_time": "2025-08-29T03:43:35.399777Z", "comments": { "results": [], "count": 0 }, "parented": true, "embed_url": "https://chart-studio.plotly.com/~jimmyg23/637.embed", "fid": "jimmyg23:637", "filename": "UREA", "filetype": "plot", "img_url": "https://storage.googleapis.com/plotly-prod-images/jimmyg23/637/9_4CRYGHOSWPHD6JP20TE3W2I8QXS9GA.png", "image_urls": { "default": "https://api.plotly.com/v2/files/jimmyg23:637/image?image_name=default", "block-thumb": "https://storage.googleapis.com/plotly-prod-images/jimmyg23/637/8_0RA4CNUWI7OR8CD2ZMIY8XADNK710R.png", "list-thumb": "https://storage.googleapis.com/plotly-prod-images/jimmyg23/637/9_4CRYGHOSWPHD6JP20TE3W2I8QXS9GA.png" }, "api_urls": { "files": "https://api.plotly.com/v2/files/jimmyg23:637", "plots": "https://api.plotly.com/v2/plots/jimmyg23:637", "parent": "https://api.plotly.com/v2/folders/home?user=jimmyg23" }, "owner": "jimmyg23", "parent": -1, "preview": "", "referencers": [], "references": [], "title": "", "views": 0, "web_url": "https://chart-studio.plotly.com/~jimmyg23/637/", "world_readable": true, "date_modified": "2025-08-29T08:50:02.385Z", "stars": { "results": [], "count": 0 }, "collaborators": { "results": [], "count": 0 }, "subfolder_count": null, "refresh_interval": null, "organize_view_url": "https://chart-studio.plotly.com/~jimmyg23/637/", "current_user_permission": "read", "is_theme": null, "is_template": false, "autosize": false, "caption": "", "figure": { "data": [ { "line": { "color": "rgb(255, 255, 18)", "width": 4 }, "meta": { "columnNames": { "x": "DATE", "y": "UREA09" } }, "mode": "lines", "name": "<b>2009</b>", "type": "scatter", "xsrc": "jimmyg23:638:e39ed5", "ysrc": "jimmyg23:638:e2758b", "stackgroup": null }, { "line": { "width": 4 }, "meta": { "columnNames": { "x": "DATE", "y": "2010" } }, "mode": "lines", "name": "<b>%{meta.columnNames.y}</b>", "type": "scatter", "xsrc": "jimmyg23:638:e39ed5", "ysrc": "jimmyg23:638:4b117e", "stackgroup": null }, { "line": { "color": "rgb(255, 83, 127)", "width": 4 }, "meta": { "columnNames": { "x": "DATE", "y": "2011" } }, "mode": "lines", "name": "<b>%{meta.columnNames.y}</b>", "type": "scatter", "xsrc": "jimmyg23:638:e39ed5", "ysrc": "jimmyg23:638:beef4a", "stackgroup": null }, { "line": { "color": "rgb(27, 152, 0)", "width": 4 }, "meta": { "columnNames": { "x": "DATE", "y": "2012" } }, "mode": "lines", "name": "<b>%{meta.columnNames.y}</b>", "type": "scatter", "xsrc": "jimmyg23:638:e39ed5", "ysrc": "jimmyg23:638:2d6f39", "stackgroup": null }, { "line": { "width": 4 }, "meta": { "columnNames": { "x": "DATE", "y": "2013" } }, "mode": "lines", "name": "<b>%{meta.columnNames.y}</b>", "type": "scatter", "xsrc": "jimmyg23:638:e39ed5", "ysrc": "jimmyg23:638:afae68", "stackgroup": null }, { "line": { "width": 4 }, "meta": { "columnNames": { "x": "DATE", "y": "2014" } }, "mode": "lines", "name": "<b>%{meta.columnNames.y}</b>", "type": "scatter", "xsrc": "jimmyg23:638:e39ed5", "ysrc": "jimmyg23:638:e8635d", "stackgroup": null }, { "line": { "color": "rgb(125, 125, 125)", "width": 4 }, "meta": { "columnNames": { "x": "DATE", "y": "2015" } }, "mode": "lines", "name": "<b>2015</b>", "type": "scatter", "xsrc": "jimmyg23:638:e39ed5", "ysrc": "jimmyg23:638:95c5f9", "stackgroup": null }, { "line": { "width": 4 }, "meta": { "columnNames": { "x": "DATE", "y": "2016" } }, "mode": "lines", "name": "<b>%{meta.columnNames.y}</b>", "type": "scatter", "xsrc": "jimmyg23:638:e39ed5", "ysrc": "jimmyg23:638:67e196", "stackgroup": null }, { "line": { "width": 4 }, "meta": { "columnNames": { "x": "DATE", "y": "2017" } }, "mode": "lines", "name": "<b>%{meta.columnNames.y}</b>", "type": "scatter", "xsrc": "jimmyg23:638:e39ed5", "ysrc": "jimmyg23:638:0dc157", "stackgroup": null }, { "line": { "width": 4 }, "meta": { "columnNames": { "x": "DATE", "y": "2018" } }, "mode": "lines", "name": "<b>%{meta.columnNames.y}</b>", "type": "scatter", "xsrc": "jimmyg23:638:e39ed5", "ysrc": "jimmyg23:638:2d187e", "stackgroup": null }, { "line": { "width": 4 }, "meta": { "columnNames": { "x": "DATE", "y": "2019" } }, "mode": "lines", "name": "<b>%{meta.columnNames.y}</b>", "type": "scatter", "xsrc": "jimmyg23:638:e39ed5", "ysrc": "jimmyg23:638:a0f249", "stackgroup": null }, { "line": { "width": 4 }, "meta": { "columnNames": { "x": "DATE", "y": "2020" } }, "mode": "lines", "name": "<b>%{meta.columnNames.y}</b>", "type": "scatter", "xsrc": "jimmyg23:638:e39ed5", "ysrc": "jimmyg23:638:3cbaf3", "stackgroup": null }, { "line": { "color": "rgb(4, 17, 4)", "width": 4 }, "meta": { "columnNames": { "x": "DATE", "y": "2021" } }, "mode": "lines", "name": "<b>%{meta.columnNames.y}</b>", "type": "scatter", "xsrc": "jimmyg23:638:e39ed5", "ysrc": "jimmyg23:638:909d21", "stackgroup": null }, { "line": { "width": 4 }, "meta": { "columnNames": { "x": "DATE", "y": "2022" } }, "mode": "lines", "name": "<b>%{meta.columnNames.y}</b>", "type": "scatter", "xsrc": "jimmyg23:638:e39ed5", "ysrc": "jimmyg23:638:3f9c8d", "stackgroup": null }, { "line": { "width": 4 }, "meta": { "columnNames": { "x": "DATE", "y": "2023" } }, "mode": "lines", "name": "<b>%{meta.columnNames.y}</b>", "type": "scatter", "xsrc": "jimmyg23:638:e39ed5", "ysrc": "jimmyg23:638:e4284b", "stackgroup": null }, { "line": { "width": 4 }, "meta": { "columnNames": { "x": "DATE", "y": "2024" } }, "mode": "lines", "name": "<b>%{meta.columnNames.y}</b>", "type": "scatter", "xsrc": "jimmyg23:638:e39ed5", "ysrc": "jimmyg23:638:c8855c", "stackgroup": null }, { "line": { "color": "rgb(45, 56, 178)", "width": 6 }, "meta": { "columnNames": { "x": "DATE", "y": "2025" } }, "mode": "lines", "name": "<b>%{meta.columnNames.y}</b>", "type": "scatter", "xsrc": "jimmyg23:638:e39ed5", "ysrc": "jimmyg23:638:195ae7", "stackgroup": null } ], "frames": [], "layout": { "font": { "size": 17, "color": "rgb(23, 50, 80)", "family": "Droid Sans" }, "title": { "text": "UREA" }, "width": 1800, "xaxis": { "type": "category", "range": [ 0, 52 ], "ticks": "outside", "ticklen": 6, "showline": true, "tickfont": { "family": "Overpass" }, "autorange": true, "linewidth": 2, "tickangle": 45 }, "yaxis": { "type": "linear", "range": [ 67.51257552333333, 172.07809265666668 ], "ticks": "outside", "nticks": 11, "ticklen": 6, "showline": true, "autorange": true, "linewidth": 2 }, "height": 750, "legend": { "x": 1.0238596204054147, "y": 0.9110917990249785 }, "margin": { "b": 90, "l": 50, "r": 65, "t": 70, "pad": 0 }, "autosize": false, "plot_bgcolor": "rgb(255, 255, 255)", "paper_bgcolor": "rgb(255, 255, 255)" } }, "height": 750, "width": 1800, "user": { "profile_url": "https://chart-studio.plotly.com/~jimmyg23", "avatar_url": "https://storage.googleapis.com/plotly-prod-profiles/81.jpg", "background_url": "https://storage.googleapis.com/plotly-prod-profiles/bg-2.jpg", "bio": "", "nickname": "", "website": "", "stream_tokens": null, "feature_set_id": null, "csrf_token": null, "date_joined": "2025-03-19 23:02:49", "mapbox_access_tokens": null, "has_password": null, "username": "jimmyg23", "email": null, "is_active": null, "readonly": null, "is_dash_creator": null, "dash_created_count": null, "is_chart_creator": null, "charts_created_count": null } }, { "creation_time": "2025-08-29T03:24:28.308668Z", "comments": { "results": [], "count": 0 }, "parented": true, "embed_url": "https://chart-studio.plotly.com/~jimmyg23/634.embed", "fid": "jimmyg23:634", "filename": "UAN 28", "filetype": "plot", "img_url": "https://storage.googleapis.com/plotly-prod-images/jimmyg23/634/9_U464K9MPP2U9CPU87CK08UFL9RR8EP.png", "image_urls": { "default": "https://api.plotly.com/v2/files/jimmyg23:634/image?image_name=default", "block-thumb": "https://storage.googleapis.com/plotly-prod-images/jimmyg23/634/8_UYCOM2ETM7YEQYRVP00LRYJQ03OSWZ.png", "list-thumb": "https://storage.googleapis.com/plotly-prod-images/jimmyg23/634/9_U464K9MPP2U9CPU87CK08UFL9RR8EP.png" }, "api_urls": { "files": "https://api.plotly.com/v2/files/jimmyg23:634", "plots": "https://api.plotly.com/v2/plots/jimmyg23:634", "parent": "https://api.plotly.com/v2/folders/home?user=jimmyg23" }, "owner": "jimmyg23", "parent": -1, "preview": "", "referencers": [], "references": [], "title": "", "views": 0, "web_url": "https://chart-studio.plotly.com/~jimmyg23/634/", "world_readable": true, "date_modified": "2025-08-29T09:25:13.015Z", "stars": { "results": [], "count": 0 }, "collaborators": { "results": [], "count": 0 }, "subfolder_count": null, "refresh_interval": null, "organize_view_url": "https://chart-studio.plotly.com/~jimmyg23/634/", "current_user_permission": "read", "is_theme": null, "is_template": false, "autosize": false, "caption": "", "figure": { "data": [ { "line": { "color": "#AA0DFE", "width": 4 }, "meta": { "columnNames": { "x": "DATE", "y": "URAN28" } }, "mode": "lines", "name": "<b>2009</b>", "type": "scatter", "xsrc": "jimmyg23:635:99f2d2", "ysrc": "jimmyg23:635:652384", "visible": true, "stackgroup": null }, { "line": { "color": "#3283FE", "width": 4 }, "meta": { "columnNames": { "x": "DATE", "y": "2010" } }, "mode": "lines", "name": "<b>2010</b>", "type": "scatter", "xsrc": "jimmyg23:635:99f2d2", "ysrc": "jimmyg23:635:841e87", "visible": true, "stackgroup": null }, { "line": { "color": "#85660D", "width": 4 }, "meta": { "columnNames": { "x": "DATE", "y": "2011" } }, "mode": "lines", "name": "<b>2011</b>", "type": "scatter", "xsrc": "jimmyg23:635:99f2d2", "ysrc": "jimmyg23:635:71b16f", "visible": true, "stackgroup": null }, { "line": { "color": "#782AB6", "width": 4 }, "meta": { "columnNames": { "x": "DATE", "y": "2012" } }, "mode": "lines", "name": "<b>%{meta.columnNames.y}</b>", "type": "scatter", "xsrc": "jimmyg23:635:99f2d2", "ysrc": "jimmyg23:635:03f4a3", "visible": true, "stackgroup": null }, { "line": { "color": "#565656", "width": 4 }, "meta": { "columnNames": { "x": "DATE", "y": "2013" } }, "mode": "lines", "name": "<b>%{meta.columnNames.y}</b>", "type": "scatter", "xsrc": "jimmyg23:635:99f2d2", "ysrc": "jimmyg23:635:c22ff9", "visible": true, "stackgroup": null }, { "line": { "color": "rgb(230, 179, 223)", "width": 4 }, "meta": { "columnNames": { "x": "DATE", "y": "2014" } }, "mode": "lines", "name": "<b>%{meta.columnNames.y}</b>", "type": "scatter", "xsrc": "jimmyg23:635:99f2d2", "ysrc": "jimmyg23:635:ea79ae", "visible": true, "stackgroup": null }, { "line": { "color": "rgb(127, 117, 87)", "width": 4 }, "meta": { "columnNames": { "x": "DATE", "y": "2015" } }, "mode": "lines", "name": "<b>%{meta.columnNames.y}</b>", "type": "scatter", "xsrc": "jimmyg23:635:99f2d2", "ysrc": "jimmyg23:635:aea270", "visible": true, "stackgroup": null }, { "line": { "color": "#F7E1A0", "width": 4 }, "meta": { "columnNames": { "x": "DATE", "y": "2016" } }, "mode": "lines", "name": "<b>%{meta.columnNames.y}</b>", "type": "scatter", "xsrc": "jimmyg23:635:99f2d2", "ysrc": "jimmyg23:635:dc4a9e", "visible": true, "stackgroup": null }, { "line": { "color": "rgb(195, 29, 91)", "width": 4 }, "meta": { "columnNames": { "x": "DATE", "y": "2017" } }, "mode": "lines", "name": "<b>%{meta.columnNames.y}</b>", "type": "scatter", "xsrc": "jimmyg23:635:99f2d2", "ysrc": "jimmyg23:635:f58ab6", "visible": true, "stackgroup": null }, { "line": { "color": "#1CBE4F", "width": 4 }, "meta": { "columnNames": { "x": "DATE", "y": "2018" } }, "mode": "lines", "name": "<b>%{meta.columnNames.y}</b>", "type": "scatter", "xsrc": "jimmyg23:635:99f2d2", "ysrc": "jimmyg23:635:3876aa", "visible": true, "stackgroup": null }, { "line": { "color": "rgb(196, 114, 28)", "width": 4 }, "meta": { "columnNames": { "x": "DATE", "y": "2019" } }, "mode": "lines", "name": "<b>%{meta.columnNames.y}</b>", "type": "scatter", "xsrc": "jimmyg23:635:99f2d2", "ysrc": "jimmyg23:635:6e7b06", "visible": true, "stackgroup": null }, { "line": { "color": "rgb(160, 253, 226)", "width": 4 }, "meta": { "columnNames": { "x": "DATE", "y": "2020" } }, "mode": "lines", "name": "<b>%{meta.columnNames.y}</b>", "type": "scatter", "xsrc": "jimmyg23:635:99f2d2", "ysrc": "jimmyg23:635:9d67f6", "visible": true, "stackgroup": null }, { "line": { "color": "rgb(11, 10, 11)", "width": 4 }, "meta": { "columnNames": { "x": "DATE", "y": "2021" } }, "mode": "lines", "name": "<b>%{meta.columnNames.y}</b>", "type": "scatter", "xsrc": "jimmyg23:635:99f2d2", "ysrc": "jimmyg23:635:9f33dd", "visible": true, "stackgroup": null }, { "line": { "color": "rgb(43, 175, 33)", "width": 4 }, "meta": { "columnNames": { "x": "DATE", "y": "2022" } }, "mode": "lines", "name": "<b>%{meta.columnNames.y}</b>", "type": "scatter", "xsrc": "jimmyg23:635:99f2d2", "ysrc": "jimmyg23:635:6161b4", "visible": true, "stackgroup": null }, { "line": { "color": "#FEAF16", "width": 4 }, "meta": { "columnNames": { "x": "DATE", "y": "2023" } }, "mode": "lines", "name": "<b>%{meta.columnNames.y}</b>", "type": "scatter", "xsrc": "jimmyg23:635:99f2d2", "ysrc": "jimmyg23:635:9a075f", "visible": true, "stackgroup": null }, { "line": { "color": "#F8A19F", "width": 4 }, "meta": { "columnNames": { "x": "DATE", "y": "2024" } }, "mode": "lines", "name": "<b>%{meta.columnNames.y}</b>", "type": "scatter", "xsrc": "jimmyg23:635:99f2d2", "ysrc": "jimmyg23:635:6e11a7", "visible": true, "stackgroup": null }, { "line": { "color": "rgb(43, 44, 169)", "width": 7 }, "meta": { "columnNames": { "x": "DATE", "y": "2025" } }, "mode": "lines", "name": "<b>%{meta.columnNames.y}</b>", "type": "scatter", "xsrc": "jimmyg23:635:99f2d2", "ysrc": "jimmyg23:635:c4bacb", "visible": true, "stackgroup": null } ], "frames": [], "layout": { "font": { "size": 17, "color": "rgb(23, 50, 80)", "family": "Droid Sans" }, "title": { "text": "UAN 28" }, "width": 1800, "xaxis": { "type": "category", "range": [ 1, 52 ], "tick0": 0, "ticks": "outside", "title": { "font": { "color": "rgb(1, 5, 9)" } }, "ticklen": 6, "showline": true, "tickfont": { "color": "rgb(0, 7, 13)", "family": "Overpass" }, "tickmode": "linear", "autorange": false, "linewidth": 3, "tickangle": 45 }, "yaxis": { "type": "linear", "range": [ 42.25637486055556, 110.17235584944444 ], "ticks": "outside", "ticklen": 6, "showline": true, "autorange": true, "linewidth": 3 }, "height": 750, "legend": { "x": 1.0140764892391634, "y": 0.8963513610572434 }, "margin": { "b": 68, "l": 56, "r": 65, "t": 70, "pad": 0 }, "autosize": false, "plot_bgcolor": "rgb(255, 255, 255)", "paper_bgcolor": "rgb(255, 255, 255)" } }, "height": 750, "width": 1800, "user": { "profile_url": "https://chart-studio.plotly.com/~jimmyg23", "avatar_url": "https://storage.googleapis.com/plotly-prod-profiles/81.jpg", "background_url": "https://storage.googleapis.com/plotly-prod-profiles/bg-2.jpg", "bio": "", "nickname": "", "website": "", "stream_tokens": null, "feature_set_id": null, "csrf_token": null, "date_joined": "2025-03-19 23:02:49", "mapbox_access_tokens": null, "has_password": null, "username": "jimmyg23", "email": null, "is_active": null, "readonly": null, "is_dash_creator": null, "dash_created_count": null, "is_chart_creator": null, "charts_created_count": null } }, { "creation_time": "2025-08-29T03:15:14.125627Z", "comments": { "results": [], "count": 0 }, "parented": true, "embed_url": "https://chart-studio.plotly.com/~panhaplotly/1.embed", "fid": "panhaplotly:1", "filename": "Adaptive-PID Test Data", "filetype": "plot", "img_url": "https://api.plotly.com/v2/files/panhaplotly:1/image?image_name=list-thumb", "image_urls": { "default": "https://storage.googleapis.com/plotly-prod-images/panhaplotly/1/2_RQANB27T6JZ3RJOJ45XAEUH3MEBEHY.png", "block-thumb": "https://storage.googleapis.com/plotly-prod-images/panhaplotly/1/8_AWX1M1B5HG6NN55MRTWZ5UX063B94J.png", "list-thumb": "https://api.plotly.com/v2/files/panhaplotly:1/image?image_name=list-thumb" }, "api_urls": { "files": "https://api.plotly.com/v2/files/panhaplotly:1", "plots": "https://api.plotly.com/v2/plots/panhaplotly:1", "parent": "https://api.plotly.com/v2/folders/home?user=panhaplotly" }, "owner": "panhaplotly", "parent": -1, "preview": "", "referencers": [], "references": [], "title": "", "views": 0, "web_url": "https://chart-studio.plotly.com/~panhaplotly/1/", "world_readable": true, "date_modified": "2025-08-29T03:45:53.909Z", "stars": { "results": [], "count": 0 }, "collaborators": { "results": [], "count": 0 }, "subfolder_count": null, "refresh_interval": null, "organize_view_url": "https://chart-studio.plotly.com/~panhaplotly/1/", "current_user_permission": "read", "is_theme": null, "is_template": false, "autosize": true, "caption": "", "figure": { "data": [ { "fill": "none", "line": { "dash": "dashdot", "shape": "spline", "width": 2, "smoothing": 0.9 }, "meta": { "columnNames": { "x": "A", "y": "B" } }, "mode": "markers+lines", "name": "<b>20 RPM</b>", "type": "scatter", "xsrc": "panhaplotly:0:59bdb2", "ysrc": "panhaplotly:0:ede363", "marker": { "line": { "width": 0 }, "size": 6, "maxdisplayed": 0 }, "error_y": { "type": "percent", "color": "#636efa", "value": 10, "width": 4, "visible": false, "symmetric": true, "thickness": 2 }, "opacity": 1, "autocolorscale": true }, { "fill": "none", "line": { "dash": "longdashdot", "shape": "spline", "width": 2 }, "meta": { "columnNames": { "x": "A", "y": "C" } }, "mode": "markers+lines", "name": "<b>30 RPM</b>", "type": "scatter", "xsrc": "panhaplotly:0:59bdb2", "ysrc": "panhaplotly:0:c7e636", "marker": { "symbol": "circle" }, "cliponaxis": true, "stackgroup": null, "connectgaps": false, "hovertemplate": "" }, { "line": { "shape": "spline", "smoothing": 0.8 }, "meta": { "columnNames": { "x": "A", "y": "D" } }, "mode": "markers+lines", "name": "<b>50 RPM</b>", "type": "scatter", "xsrc": "panhaplotly:0:59bdb2", "ysrc": "panhaplotly:0:682168", "stackgroup": null } ], "frames": [], "layout": { "polar": { "radialaxis": { "range": [ 0, 1 ], "autorange": true }, "angularaxis": {} }, "scene": { "camera": { "up": { "x": 0, "y": 0, "z": 1 }, "eye": { "x": 0.0057735026918962614, "y": 0.005773502691896261, "z": 0.0057735026918962614 }, "center": { "x": 0, "y": 0, "z": 0 }, "projection": { "type": "perspective" } }, "aspectmode": "auto", "aspectratio": { "x": 1, "y": 1, "z": 1 } }, "title": { "x": 0.3, "font": { "size": 24 }, "text": "Data at Different Speeds and Loads:" }, "xaxis": { "type": "linear", "range": [ -0.6612132352941177, 11.561213235294119 ], "title": { "font": { "size": 20 }, "text": "LOAD(Kg)" }, "autorange": true, "showspikes": true }, "yaxis": { "type": "linear", "range": [ -0.04512743628185903, 2.445127436281859 ], "title": { "font": { "size": 20 }, "text": "CUURENT(A)" }, "autorange": true, "showspikes": true }, "legend": { "x": 1.02, "y": 1.02, "title": { "font": { "size": 18 }, "text": "<b>Speed</b>" }, "valign": "top", "xanchor": "center", "yanchor": "auto", "borderwidth": 2, "orientation": "v" }, "autosize": true, "dragmode": "pan", "template": { "data": { "bar": [ { "type": "bar", "marker": { "colorbar": { "ticks": "", "outlinewidth": 0 } } } ], "table": [ { "type": "table", "cells": { "fill": { "color": "#EBF0F8" }, "line": { "color": "white" } }, "header": { "fill": { "color": "#C8D4E3" }, "line": { "color": "white" } } } ], "carpet": [ { "type": "carpet", "aaxis": { "gridcolor": "#C8D4E3", "linecolor": "#C8D4E3", "endlinecolor": "#2a3f5f", "minorgridcolor": "#C8D4E3", "startlinecolor": "#2a3f5f" }, "baxis": { "gridcolor": "#C8D4E3", "linecolor": "#C8D4E3", "endlinecolor": "#2a3f5f", "minorgridcolor": "#C8D4E3", "startlinecolor": "#2a3f5f" } } ], "mesh3d": [ { "type": "mesh3d", "colorbar": { "ticks": "", "outlinewidth": 0 } } ], "contour": [ { "type": "contour", "colorbar": { "ticks": "", "outlinewidth": 0 }, "autocolorscale": true } ], "heatmap": [ { "type": "heatmap", "colorbar": { "ticks": "", "outlinewidth": 0 }, "autocolorscale": true } ], "scatter": [ { "type": "scatter", "marker": { "colorbar": { "ticks": "", "outlinewidth": 0 } } } ], "surface": [ { "type": "surface", "colorbar": { "ticks": "", "outlinewidth": 0 } } ], "heatmapgl": [ { "type": "heatmapgl", "colorbar": { "ticks": "", "outlinewidth": 0 } } ], "histogram": [ { "type": "histogram", "marker": { "colorbar": { "ticks": "", "outlinewidth": 0 } } } ], "parcoords": [ { "line": { "colorbar": { "ticks": "", "outlinewidth": 0 } }, "type": "parcoords" } ], "scatter3d": [ { "type": "scatter3d", "marker": { "colorbar": { "ticks": "", "outlinewidth": 0 } } } ], "scattergl": [ { "type": "scattergl", "marker": { "colorbar": { "ticks": "", "outlinewidth": 0 } } } ], "choropleth": [ { "type": "choropleth", "colorbar": { "ticks": "", "outlinewidth": 0 } } ], "scattergeo": [ { "type": "scattergeo", "marker": { "colorbar": { "ticks": "", "outlinewidth": 0 } } } ], "histogram2d": [ { "type": "histogram2d", "colorbar": { "ticks": "", "outlinewidth": 0 }, "autocolorscale": true } ], "scatterpolar": [ { "type": "scatterpolar", "marker": { "colorbar": { "ticks": "", "outlinewidth": 0 } } } ], "contourcarpet": [ { "type": "contourcarpet", "colorbar": { "ticks": "", "outlinewidth": 0 } } ], "scattercarpet": [ { "type": "scattercarpet", "marker": { "colorbar": { "ticks": "", "outlinewidth": 0 } } } ], "scattermapbox": [ { "type": "scattermapbox", "marker": { "colorbar": { "ticks": "", "outlinewidth": 0 } } } ], "scatterpolargl": [ { "type": "scatterpolargl", "marker": { "colorbar": { "ticks": "", "outlinewidth": 0 } } } ], "scatterternary": [ { "type": "scatterternary", "marker": { "colorbar": { "ticks": "", "outlinewidth": 0 } } } ], "histogram2dcontour": [ { "type": "histogram2dcontour", "colorbar": { "ticks": "", "outlinewidth": 0 }, "autocolorscale": true } ] }, "layout": { "geo": { "bgcolor": "white", "showland": true, "lakecolor": "white", "landcolor": "white", "showlakes": true, "subunitcolor": "#C8D4E3" }, "font": { "color": "#2a3f5f" }, "polar": { "bgcolor": "white", "radialaxis": { "ticks": "", "gridcolor": "#EBF0F8", "linecolor": "#EBF0F8" }, "angularaxis": { "ticks": "", "gridcolor": "#EBF0F8", "linecolor": "#EBF0F8" } }, "scene": { "xaxis": { "ticks": "", "gridcolor": "#DFE8F3", "gridwidth": 2, "linecolor": "#EBF0F8", "zerolinecolor": "#EBF0F8", "showbackground": true, "backgroundcolor": "white" }, "yaxis": { "ticks": "", "gridcolor": "#DFE8F3", "gridwidth": 2, "linecolor": "#EBF0F8", "zerolinecolor": "#EBF0F8", "showbackground": true, "backgroundcolor": "white" }, "zaxis": { "ticks": "", "gridcolor": "#DFE8F3", "gridwidth": 2, "linecolor": "#EBF0F8", "zerolinecolor": "#EBF0F8", "showbackground": true, "backgroundcolor": "white" } }, "title": { "x": 0.05 }, "xaxis": { "ticks": "", "gridcolor": "#EBF0F8", "linecolor": "#EBF0F8", "automargin": true, "zerolinecolor": "#EBF0F8", "zerolinewidth": 2 }, "yaxis": { "ticks": "", "gridcolor": "#EBF0F8", "linecolor": "#EBF0F8", "automargin": true, "zerolinecolor": "#EBF0F8", "zerolinewidth": 2 }, "ternary": { "aaxis": { "ticks": "", "gridcolor": "#DFE8F3", "linecolor": "#A2B1C6" }, "baxis": { "ticks": "", "gridcolor": "#DFE8F3", "linecolor": "#A2B1C6" }, "caxis": { "ticks": "", "gridcolor": "#DFE8F3", "linecolor": "#A2B1C6" }, "bgcolor": "white" }, "colorway": [ "#636efa", "#EF553B", "#00cc96", "#ab63fa", "#19d3f3", "#e763fa", "#fecb52", "#ffa15a", "#ff6692", "#b6e880" ], "hovermode": "closest", "colorscale": { "diverging": [ [ 0, "#8e0152" ], [ 0.1, "#c51b7d" ], [ 0.2, "#de77ae" ], [ 0.3, "#f1b6da" ], [ 0.4, "#fde0ef" ], [ 0.5, "#f7f7f7" ], [ 0.6, "#e6f5d0" ], [ 0.7, "#b8e186" ], [ 0.8, "#7fbc41" ], [ 0.9, "#4d9221" ], [ 1, "#276419" ] ], "sequential": [ [ 0, "#0508b8" ], [ 0.0893854748603352, "#1910d8" ], [ 0.1787709497206704, "#3c19f0" ], [ 0.2681564245810056, "#6b1cfb" ], [ 0.3575418994413408, "#981cfd" ], [ 0.44692737430167595, "#bf1cfd" ], [ 0.5363128491620112, "#dd2bfd" ], [ 0.6256983240223464, "#f246fe" ], [ 0.7150837988826816, "#fc67fd" ], [ 0.8044692737430168, "#fe88fc" ], [ 0.8938547486033519, "#fea5fd" ], [ 0.9832402234636871, "#febefe" ], [ 1, "#fec3fe" ] ], "sequentialminus": [ [ 0, "#0508b8" ], [ 0.0893854748603352, "#1910d8" ], [ 0.1787709497206704, "#3c19f0" ], [ 0.2681564245810056, "#6b1cfb" ], [ 0.3575418994413408, "#981cfd" ], [ 0.44692737430167595, "#bf1cfd" ], [ 0.5363128491620112, "#dd2bfd" ], [ 0.6256983240223464, "#f246fe" ], [ 0.7150837988826816, "#fc67fd" ], [ 0.8044692737430168, "#fe88fc" ], [ 0.8938547486033519, "#fea5fd" ], [ 0.9832402234636871, "#febefe" ], [ 1, "#fec3fe" ] ] }, "plot_bgcolor": "white", "paper_bgcolor": "white", "shapedefaults": { "line": { "width": 0 }, "opacity": 0.4, "fillcolor": "#506784" }, "annotationdefaults": { "arrowhead": 0, "arrowcolor": "#506784", "arrowwidth": 1 } }, "themeRef": "PLOTLY_WHITE" }, "hovermode": "x" } }, "height": null, "width": null, "user": { "profile_url": "https://chart-studio.plotly.com/~panhaplotly", "avatar_url": "https://storage.googleapis.com/plotly-prod-profiles/49.jpg", "background_url": "https://storage.googleapis.com/plotly-prod-profiles/bg-8.jpg", "bio": "", "nickname": "", "website": "", "stream_tokens": null, "feature_set_id": null, "csrf_token": null, "date_joined": "2025-08-29 03:12:44", "mapbox_access_tokens": null, "has_password": null, "username": "panhaplotly", "email": null, "is_active": null, "readonly": null, "is_dash_creator": null, "dash_created_count": null, "is_chart_creator": null, "charts_created_count": null } }, { "creation_time": "2025-08-29T03:03:00.101510Z", "comments": { "results": [], "count": 0 }, "parented": true, "embed_url": "https://chart-studio.plotly.com/~jimmyg23/631.embed", "fid": "jimmyg23:631", "filename": "POTASH", "filetype": "plot", "img_url": "https://storage.googleapis.com/plotly-prod-images/jimmyg23/631/9_0N0QX29XAR6PNPTE392EHA9H2EIJ95.png", "image_urls": { "default": "https://storage.googleapis.com/plotly-prod-images/jimmyg23/631/2_2ROFEJSZHQV8M4WE1LZ58299JAESSU.png", "block-thumb": "https://storage.googleapis.com/plotly-prod-images/jimmyg23/631/8_0JH2R4DB7P181TR2G8PUK75J67KD2T.png", "list-thumb": "https://storage.googleapis.com/plotly-prod-images/jimmyg23/631/9_0N0QX29XAR6PNPTE392EHA9H2EIJ95.png" }, "api_urls": { "files": "https://api.plotly.com/v2/files/jimmyg23:631", "plots": "https://api.plotly.com/v2/plots/jimmyg23:631", "parent": "https://api.plotly.com/v2/folders/home?user=jimmyg23" }, "owner": "jimmyg23", "parent": -1, "preview": "", "referencers": [], "references": [], "title": "", "views": 0, "web_url": "https://chart-studio.plotly.com/~jimmyg23/631/", "world_readable": true, "date_modified": "2025-08-29T03:12:54.222Z", "stars": { "results": [], "count": 0 }, "collaborators": { "results": [], "count": 0 }, "subfolder_count": null, "refresh_interval": null, "organize_view_url": "https://chart-studio.plotly.com/~jimmyg23/631/", "current_user_permission": "read", "is_theme": null, "is_template": false, "autosize": true, "caption": "", "figure": { "data": [ { "line": { "color": "#AA0DFE", "width": 4 }, "meta": { "columnNames": { "x": "DATE", "y": "POT09" } }, "mode": "lines", "name": "<b>2009</b>", "type": "scatter", "xsrc": "jimmyg23:632:9e619d", "ysrc": "jimmyg23:632:9b00d7", "stackgroup": null }, { "line": { "color": "#3283FE", "width": 4 }, "meta": { "columnNames": { "x": "DATE", "y": "2010" } }, "mode": "lines", "name": "<b>%{meta.columnNames.y}</b>", "type": "scatter", "xsrc": "jimmyg23:632:9e619d", "ysrc": "jimmyg23:632:518082", "stackgroup": null }, { "line": { "color": "#85660D", "width": 4 }, "meta": { "columnNames": { "x": "DATE", "y": "2011" } }, "mode": "lines", "name": "<b>%{meta.columnNames.y}</b>", "type": "scatter", "xsrc": "jimmyg23:632:9e619d", "ysrc": "jimmyg23:632:87d015", "stackgroup": null }, { "line": { "color": "rgb(0, 0, 0)", "width": 4 }, "meta": { "columnNames": { "x": "DATE", "y": "2012" } }, "mode": "lines", "name": "<b>%{meta.columnNames.y}</b>", "type": "scatter", "xsrc": "jimmyg23:632:9e619d", "ysrc": "jimmyg23:632:e4228c", "stackgroup": null }, { "line": { "color": "#565656", "width": 4 }, "meta": { "columnNames": { "x": "DATE", "y": "2013" } }, "mode": "lines", "name": "<b>%{meta.columnNames.y}</b>", "type": "scatter", "xsrc": "jimmyg23:632:9e619d", "ysrc": "jimmyg23:632:f820bd", "stackgroup": null }, { "line": { "color": "#1C8356", "width": 4 }, "meta": { "columnNames": { "x": "DATE", "y": "2014" } }, "mode": "lines", "name": "<b>%{meta.columnNames.y}</b>", "type": "scatter", "xsrc": "jimmyg23:632:9e619d", "ysrc": "jimmyg23:632:aca416", "stackgroup": null }, { "line": { "color": "#16FF32", "width": 4 }, "meta": { "columnNames": { "x": "DATE", "y": "2015" } }, "mode": "lines", "name": "<b>%{meta.columnNames.y}</b>", "type": "scatter", "xsrc": "jimmyg23:632:9e619d", "ysrc": "jimmyg23:632:798ecd", "stackgroup": null }, { "line": { "color": "#F7E1A0", "width": 4 }, "meta": { "columnNames": { "x": "DATE", "y": "2016" } }, "mode": "lines", "name": "<b>%{meta.columnNames.y}</b>", "type": "scatter", "xsrc": "jimmyg23:632:9e619d", "ysrc": "jimmyg23:632:a9d54e", "stackgroup": null }, { "line": { "color": "#E2E2E2", "width": 4 }, "meta": { "columnNames": { "x": "DATE", "y": "2017" } }, "mode": "lines", "name": "<b>%{meta.columnNames.y}</b>", "type": "scatter", "xsrc": "jimmyg23:632:9e619d", "ysrc": "jimmyg23:632:7ef4e0", "stackgroup": null }, { "line": { "color": "#1CBE4F", "width": 4 }, "meta": { "columnNames": { "x": "DATE", "y": "2018" } }, "mode": "lines", "name": "<b>%{meta.columnNames.y}</b>", "type": "scatter", "xsrc": "jimmyg23:632:9e619d", "ysrc": "jimmyg23:632:8f2113", "stackgroup": null }, { "line": { "color": "#C4451C", "width": 4 }, "meta": { "columnNames": { "x": "DATE", "y": "2019" } }, "mode": "lines", "name": "<b>%{meta.columnNames.y}</b>", "type": "scatter", "xsrc": "jimmyg23:632:9e619d", "ysrc": "jimmyg23:632:f4bfeb", "stackgroup": null }, { "line": { "color": "rgb(52, 203, 198)", "width": 4 }, "meta": { "columnNames": { "x": "DATE", "y": "2020" } }, "mode": "lines", "name": "<b>%{meta.columnNames.y}</b>", "type": "scatter", "xsrc": "jimmyg23:632:9e619d", "ysrc": "jimmyg23:632:ebf708", "stackgroup": null }, { "line": { "color": "rgb(228, 254, 0)", "width": 4 }, "meta": { "columnNames": { "x": "DATE", "y": "2021" } }, "mode": "lines", "name": "<b>%{meta.columnNames.y}</b>", "type": "scatter", "xsrc": "jimmyg23:632:9e619d", "ysrc": "jimmyg23:632:13947b", "stackgroup": null }, { "line": { "color": "rgb(231, 3, 0)", "width": 4 }, "meta": { "columnNames": { "x": "DATE", "y": "2022" } }, "mode": "lines", "name": "<b>%{meta.columnNames.y}</b>", "type": "scatter", "xsrc": "jimmyg23:632:9e619d", "ysrc": "jimmyg23:632:6c94b2", "stackgroup": null }, { "line": { "color": "#FEAF16", "width": 4 }, "meta": { "columnNames": { "x": "DATE", "y": "2023" } }, "mode": "lines", "name": "<b>%{meta.columnNames.y}</b>", "type": "scatter", "xsrc": "jimmyg23:632:9e619d", "ysrc": "jimmyg23:632:52f924", "stackgroup": null }, { "line": { "color": "#F8A19F", "width": 4 }, "meta": { "columnNames": { "x": "DATE", "y": "2024" } }, "mode": "lines", "name": "<b>%{meta.columnNames.y}</b>", "type": "scatter", "xsrc": "jimmyg23:632:9e619d", "ysrc": "jimmyg23:632:83dd94", "stackgroup": null }, { "line": { "color": "rgb(28, 30, 173)", "width": 6 }, "meta": { "columnNames": { "x": "DATE", "y": "2025" } }, "mode": "lines", "name": "<b>%{meta.columnNames.y}</b>", "type": "scatter", "xsrc": "jimmyg23:632:9e619d", "ysrc": "jimmyg23:632:b7daf4", "stackgroup": null } ], "frames": [], "layout": { "font": { "size": 17, "color": "rgb(23, 50, 80)", "family": "Droid Sans" }, "title": { "text": "POTASH" }, "width": 1700, "xaxis": { "type": "category", "range": [ 0, 52 ], "tick0": 0, "ticks": "outside", "showline": true, "tickfont": { "size": 18, "color": "rgb(0, 0, 0)", "family": "Overpass" }, "tickmode": "auto", "autorange": true, "linewidth": 2, "tickangle": 45 }, "yaxis": { "type": "linear", "range": [ 59.26719851499999, 243.91537281499998 ], "ticks": "outside", "showline": true, "autorange": true, "linewidth": 2 }, "height": 750, "legend": { "x": 1.085056786706324, "y": 0.9535409035409036 }, "margin": { "b": 68, "l": 50, "r": 65, "t": 70, "pad": 0 }, "autosize": true, "plot_bgcolor": "rgb(255, 255, 255)", "paper_bgcolor": "rgb(255, 255, 255)" } }, "height": 750, "width": 1700, "user": { "profile_url": "https://chart-studio.plotly.com/~jimmyg23", "avatar_url": "https://storage.googleapis.com/plotly-prod-profiles/81.jpg", "background_url": "https://storage.googleapis.com/plotly-prod-profiles/bg-2.jpg", "bio": "", "nickname": "", "website": "", "stream_tokens": null, "feature_set_id": null, "csrf_token": null, "date_joined": "2025-03-19 23:02:49", "mapbox_access_tokens": null, "has_password": null, "username": "jimmyg23", "email": null, "is_active": null, "readonly": null, "is_dash_creator": null, "dash_created_count": null, "is_chart_creator": null, "charts_created_count": null } }, { "creation_time": "2025-08-29T02:46:43.993768Z", "comments": { "results": [], "count": 0 }, "parented": true, "embed_url": "https://chart-studio.plotly.com/~jimmyg23/628.embed", "fid": "jimmyg23:628", "filename": "MAP", "filetype": "plot", "img_url": "https://storage.googleapis.com/plotly-prod-images/jimmyg23/628/9_TVQTNARHQH385XRYRXLT9M8H0Q80AF.png", "image_urls": { "default": "https://storage.googleapis.com/plotly-prod-images/jimmyg23/628/2_XGYPQF6DXU655TTRVEFWH4F6EP2C6B.png", "block-thumb": "https://storage.googleapis.com/plotly-prod-images/jimmyg23/628/8_A3XZQ7JM1IFAUS05EWNHJ4SB7LRYG6.png", "list-thumb": "https://storage.googleapis.com/plotly-prod-images/jimmyg23/628/9_TVQTNARHQH385XRYRXLT9M8H0Q80AF.png" }, "api_urls": { "files": "https://api.plotly.com/v2/files/jimmyg23:628", "plots": "https://api.plotly.com/v2/plots/jimmyg23:628", "parent": "https://api.plotly.com/v2/folders/home?user=jimmyg23" }, "owner": "jimmyg23", "parent": -1, "preview": "", "referencers": [], "references": [], "title": "", "views": 0, "web_url": "https://chart-studio.plotly.com/~jimmyg23/628/", "world_readable": true, "date_modified": "2025-08-29T02:54:05.819Z", "stars": { "results": [], "count": 0 }, "collaborators": { "results": [], "count": 0 }, "subfolder_count": null, "refresh_interval": null, "organize_view_url": "https://chart-studio.plotly.com/~jimmyg23/628/", "current_user_permission": "read", "is_theme": null, "is_template": false, "autosize": true, "caption": "", "figure": { "data": [ { "line": { "color": "#1f77b4", "width": 3 }, "meta": { "columnNames": { "x": "DATE", "y": "2009" } }, "mode": "lines", "name": "<b>%{meta.columnNames.y}</b>", "type": "scatter", "xsrc": "jimmyg23:629:ce1f5d", "ysrc": "jimmyg23:629:48a979", "stackgroup": null }, { "line": { "color": "#ff7f0e", "width": 3 }, "meta": { "columnNames": { "x": "DATE", "y": "2010" } }, "mode": "lines", "name": "<b>%{meta.columnNames.y}</b>", "type": "scatter", "xsrc": "jimmyg23:629:ce1f5d", "ysrc": "jimmyg23:629:975a27", "stackgroup": null }, { "line": { "color": "#2ca02c", "width": 3 }, "meta": { "columnNames": { "x": "DATE", "y": "2011" } }, "mode": "lines", "name": "<b>%{meta.columnNames.y}</b>", "type": "scatter", "xsrc": "jimmyg23:629:ce1f5d", "ysrc": "jimmyg23:629:5be4ef", "stackgroup": null }, { "line": { "color": "#d62728", "width": 3 }, "meta": { "columnNames": { "x": "DATE", "y": "2012" } }, "mode": "lines", "name": "<b>%{meta.columnNames.y}</b>", "type": "scatter", "xsrc": "jimmyg23:629:ce1f5d", "ysrc": "jimmyg23:629:7081ab", "stackgroup": null }, { "line": { "color": "#9467bd", "width": 3 }, "meta": { "columnNames": { "x": "DATE", "y": "2013" } }, "mode": "lines", "name": "<b>%{meta.columnNames.y}</b>", "type": "scatter", "xsrc": "jimmyg23:629:ce1f5d", "ysrc": "jimmyg23:629:631c16", "stackgroup": null }, { "line": { "color": "#8c564b", "width": 3 }, "meta": { "columnNames": { "x": "DATE", "y": "2014" } }, "mode": "lines", "name": "<b>%{meta.columnNames.y}</b>", "type": "scatter", "xsrc": "jimmyg23:629:ce1f5d", "ysrc": "jimmyg23:629:7614f7", "stackgroup": null }, { "line": { "color": "#e377c2", "width": 3 }, "meta": { "columnNames": { "x": "DATE", "y": "2015" } }, "mode": "lines", "name": "<b>%{meta.columnNames.y}</b>", "type": "scatter", "xsrc": "jimmyg23:629:ce1f5d", "ysrc": "jimmyg23:629:abf29e", "stackgroup": null }, { "line": { "color": "#7f7f7f", "width": 3 }, "meta": { "columnNames": { "x": "DATE", "y": "2016" } }, "mode": "lines", "name": "<b>%{meta.columnNames.y}</b>", "type": "scatter", "xsrc": "jimmyg23:629:ce1f5d", "ysrc": "jimmyg23:629:1404a6", "stackgroup": null }, { "line": { "color": "#bcbd22", "width": 3 }, "meta": { "columnNames": { "x": "DATE", "y": "2017" } }, "mode": "lines", "name": "<b>%{meta.columnNames.y}</b>", "type": "scatter", "xsrc": "jimmyg23:629:ce1f5d", "ysrc": "jimmyg23:629:3d4c25", "stackgroup": null }, { "line": { "color": "#17becf", "width": 3 }, "meta": { "columnNames": { "x": "DATE", "y": "2018" } }, "mode": "lines", "name": "<b>%{meta.columnNames.y}</b>", "type": "scatter", "xsrc": "jimmyg23:629:ce1f5d", "ysrc": "jimmyg23:629:3f202b", "stackgroup": null }, { "line": { "color": "#1f77b4", "width": 3 }, "meta": { "columnNames": { "x": "DATE", "y": "2019" } }, "mode": "lines", "name": "<b>%{meta.columnNames.y}</b>", "type": "scatter", "xsrc": "jimmyg23:629:ce1f5d", "ysrc": "jimmyg23:629:1ef4e3", "stackgroup": null }, { "line": { "color": "#ff7f0e", "width": 3 }, "meta": { "columnNames": { "x": "DATE", "y": "2020" } }, "mode": "lines", "name": "<b>%{meta.columnNames.y}</b>", "type": "scatter", "xsrc": "jimmyg23:629:ce1f5d", "ysrc": "jimmyg23:629:8925b3", "stackgroup": null }, { "line": { "color": "#2ca02c", "width": 3 }, "meta": { "columnNames": { "x": "DATE", "y": "2021" } }, "mode": "lines", "name": "<b>%{meta.columnNames.y}</b>", "type": "scatter", "xsrc": "jimmyg23:629:ce1f5d", "ysrc": "jimmyg23:629:db7f24", "stackgroup": null }, { "line": { "color": "#d62728", "width": 3 }, "meta": { "columnNames": { "x": "DATE", "y": "2022" } }, "mode": "lines", "name": "<b>%{meta.columnNames.y}</b>", "type": "scatter", "xsrc": "jimmyg23:629:ce1f5d", "ysrc": "jimmyg23:629:d8d99b", "stackgroup": null }, { "line": { "color": "#9467bd", "width": 3 }, "meta": { "columnNames": { "x": "DATE", "y": "2023" } }, "mode": "lines", "name": "<b>%{meta.columnNames.y}</b>", "type": "scatter", "xsrc": "jimmyg23:629:ce1f5d", "ysrc": "jimmyg23:629:544440", "stackgroup": null }, { "line": { "color": "#8c564b", "width": 3 }, "meta": { "columnNames": { "x": "DATE", "y": "2024" } }, "mode": "lines", "name": "<b>%{meta.columnNames.y}</b>", "type": "scatter", "xsrc": "jimmyg23:629:ce1f5d", "ysrc": "jimmyg23:629:09169d", "stackgroup": null }, { "line": { "color": "rgb(56, 70, 184)", "width": 6 }, "meta": { "columnNames": { "x": "DATE", "y": "MAP2025" } }, "mode": "lines", "name": "<b>2025</b>", "type": "scatter", "xsrc": "jimmyg23:629:ce1f5d", "ysrc": "jimmyg23:629:264a3c", "stackgroup": null } ], "frames": [], "layout": { "font": { "size": 17, "color": "rgb(23, 50, 80)", "family": "Droid Sans" }, "title": { "text": "MAP" }, "width": 1700, "xaxis": { "type": "category", "range": [ 0, 52 ], "ticks": "outside", "ticklen": 6, "showline": true, "tickfont": { "size": 17, "color": "rgb(0, 8, 18)", "family": "Overpass" }, "autorange": true, "linewidth": 2, "tickangle": 45 }, "yaxis": { "type": "linear", "range": [ 76.0049916761111, 228.5800807538889 ], "ticks": "outside", "showline": true, "autorange": false, "linewidth": 2 }, "height": 750, "legend": { "x": 1.0254587271082645, "y": 0.9535409035409036 }, "margin": { "b": 68, "l": 50, "r": 65, "t": 70, "pad": 0 }, "autosize": true, "plot_bgcolor": "rgb(255, 255, 255)", "paper_bgcolor": "rgb(255, 255, 255)" } }, "height": 750, "width": 1700, "user": { "profile_url": "https://chart-studio.plotly.com/~jimmyg23", "avatar_url": "https://storage.googleapis.com/plotly-prod-profiles/81.jpg", "background_url": "https://storage.googleapis.com/plotly-prod-profiles/bg-2.jpg", "bio": "", "nickname": "", "website": "", "stream_tokens": null, "feature_set_id": null, "csrf_token": null, "date_joined": "2025-03-19 23:02:49", "mapbox_access_tokens": null, "has_password": null, "username": "jimmyg23", "email": null, "is_active": null, "readonly": null, "is_dash_creator": null, "dash_created_count": null, "is_chart_creator": null, "charts_created_count": null } } ] }
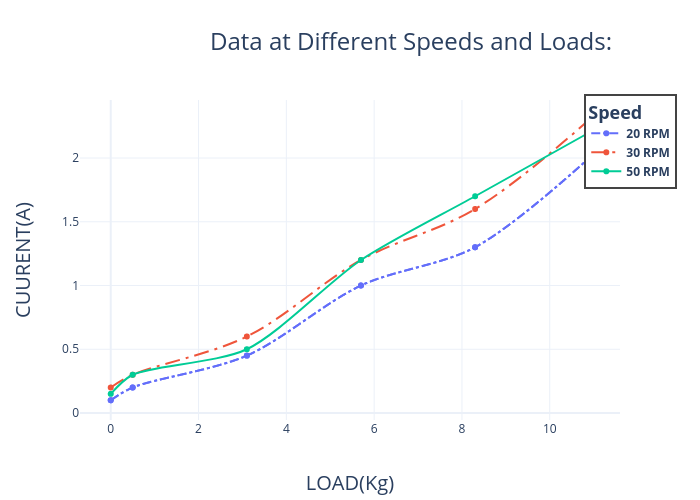