Plots List
Plots
This endpoint handles manipulation of Plotly plot files.
Reference
Authorization
Any user with or without a Plotly account may view public plots. For private plots, see authentication.
Actions
list
Listing all public plots can be done via a GET request to this endpoint.
By default, plots will be listed in order of date created. The order_by
query parameter is accepted at this endpoint. Currently, only ordering by
views is supported. It is possible to filter the plots by quality
with min_quality or max_quality as query parameter.
Example:
// GET https://api.plotly.com/v2/plots/ ---> 200

// GET https://api.plotly.com/v2/plots/?order_by=-views ---> 200

// GET https://api.plotly.com/v2/plots/?min_quality=5 ---> 200

// GET https://api.plotly.com/v2/plots/?max_quality=5 ---> 200
feed
Listing all handpicked feed plots can be done via a GET request to this endpoint. By default, plots will be listed in a random order.
Example:
// GET https://api.plotly.com/v2/plots/feed ---> 200
create
You can create new plot resources here. The only required field is 'figure'. Currently, the figure is restricted to only contain references to grid data. That is, this will fail if raw data arrays are passed in. To create and manipulate underlying grids for plots, see the grids endpoint.
Example:
// This fails because a figure field is required.
// POST https://api.plotly.com/v2/plots ---> 400 Bad Request
{}

// This fails because the figure has raw data
//POST https://api.plotly.com/v2/plots ---> 400 Bad Request
{
    "figure": {"data": [{"y": ['this', 'is', 'raw', 'data']}]}
}

// This succeeds because the figure has src keys, not raw data.
//POST https://api.plotly.com/v2/plots ---> 200 OK
{
    "figure": {"data": [{"ysrc": "sven:88:u8nd62"}]}
}
When creating a grid, you can optionally specify a source_fid to specify where a plot has come from:
- source_fid: the fid of a plot that was copied (and presumably edited) to produce this one
detail
There is a lot of meta information stored about plot files including filename, title, share_url, and content_url to name a few.
This information can only be reached with a GET to this endpoint.
Example:
// GET https://api.plotly.com/v2/plots/iheartgraphs:90
content
The contents of a plot can be downloaded via the content resource. The plot
content contains referenced grid/column data by default. If you wish to
return the raw grid/column data, the inline_data=true query must be included
in the request url. The Content-Type header will be appropriately set for the
response body.
Alternatively, you can set ?map_data=unreadable to append a mapping of
sources to data that belongs to grids which are unreadable for the
requestor. This is useful when you have read access to another users plot,
but that plot contains grid references which you don't have access to.
Examples:
// Returns referenced grid/column data
// GET https://api.plotly.com/v2/plots/iheartgraphs:90/content ---> 200 OK

// Returns full grid/column data
// GET https://api.plotly.com/v2/plots/iheartgraphs:90/content?inline_data=true ---> 200 OK

// Returns full grid/column data when requestor doesn't have permission
// to read the referenced grid.
// GET https://api.plotly.com/v2/plots/iheartgraphs:90/content?map_data=unreadable ---> 200 OK
GET /v2/plots/?cursor=cj0xJnA9MjAyNS0wOS0wMSswNiUzQTQ4JTNBMzkuODM2NTM0JTJCMDAlM0EwMA%3D%3D&format=api
{ "next": "https://api.plotly.com/v2/plots/?cursor=cD0yMDI1LTA5LTAxKzA3JTNBMTklM0ExMC4xODk3OTUlMkIwMCUzQTAw&format=api", "previous": "https://api.plotly.com/v2/plots/?cursor=cj0xJnA9MjAyNS0wOS0wMSsxMSUzQTM0JTNBMTYuNjQzNjgyJTJCMDAlM0EwMA%3D%3D&format=api", "results": [ { "creation_time": "2025-09-01T11:34:16.643682Z", "comments": { "results": [], "count": 0 }, "parented": true, "embed_url": "https://chart-studio.plotly.com/~Marja/223.embed", "fid": "Marja:223", "filename": "E.DUN_4 provenances only_1Sep2025", "filetype": "plot", "img_url": "https://api.plotly.com/v2/files/Marja:223/image?image_name=list-thumb", "image_urls": { "default": "https://storage.googleapis.com/plotly-prod-images/Marja/223/2_XR38VWDHF7P1K0M1EUCPKZDKOKP64K.png", "block-thumb": "https://storage.googleapis.com/plotly-prod-images/Marja/223/8_GM2UBZNN42C4AOSCUBZHTSQJU4C73M.png", "list-thumb": "https://api.plotly.com/v2/files/Marja:223/image?image_name=list-thumb" }, "api_urls": { "files": "https://api.plotly.com/v2/files/Marja:223", "plots": "https://api.plotly.com/v2/plots/Marja:223", "parent": "https://api.plotly.com/v2/folders/home?user=Marja" }, "owner": "Marja", "parent": -1, "preview": "", "referencers": [], "references": [], "title": "", "views": 1, "web_url": "https://chart-studio.plotly.com/~Marja/223/", "world_readable": true, "date_modified": "2025-09-01T11:34:16.655Z", "stars": { "results": [], "count": 0 }, "collaborators": { "results": [], "count": 0 }, "subfolder_count": null, "refresh_interval": null, "organize_view_url": "https://chart-studio.plotly.com/~Marja/223/", "current_user_permission": "read", "is_theme": null, "is_template": null, "autosize": true, "caption": "", "figure": { "data": [ { "line": { "color": "rgba(31,119,180,1)" }, "mode": "markers", "name": "BEAURY SF", "type": "scatter3d", "xsrc": "Marja:222:7231ba", "ysrc": "Marja:222:c0fba4", "zsrc": "Marja:222:221aed", "frame": null, "marker": { "line": { "color": "rgba(31,119,180,1)" }, "size": 5, "colorsrc": "Marja:222:a1b92b" }, "error_x": { "color": "rgba(31,119,180,1)" }, "error_y": { "color": "rgba(31,119,180,1)" }, "hovertextsrc": "Marja:222:ec2341" }, { "line": { "color": "rgba(255,127,14,1)" }, "mode": "markers", "name": "DALMAN", "type": "scatter3d", "xsrc": "Marja:222:c628e0", "ysrc": "Marja:222:9b634c", "zsrc": "Marja:222:d03d82", "frame": null, "marker": { "line": { "color": "rgba(255,127,14,1)" }, "size": 5, "colorsrc": "Marja:222:ea6922" }, "error_x": { "color": "rgba(255,127,14,1)" }, "error_y": { "color": "rgba(255,127,14,1)" }, "hovertextsrc": "Marja:222:b4e481" }, { "line": { "color": "rgba(44,160,44,1)" }, "mode": "markers", "name": "LINDESAY CREEK", "type": "scatter3d", "xsrc": "Marja:222:a53e33", "ysrc": "Marja:222:1c94e5", "zsrc": "Marja:222:e4db0b", "frame": null, "marker": { "line": { "color": "rgba(44,160,44,1)" }, "size": 5, "colorsrc": "Marja:222:f9e242" }, "error_x": { "color": "rgba(44,160,44,1)" }, "error_y": { "color": "rgba(44,160,44,1)" }, "hovertextsrc": "Marja:222:26aa59" }, { "line": { "color": "rgba(214,39,40,1)" }, "mode": "markers", "name": "TOOLOOM", "type": "scatter3d", "xsrc": "Marja:222:59a912", "ysrc": "Marja:222:4af457", "zsrc": "Marja:222:079228", "frame": null, "marker": { "line": { "color": "rgba(214,39,40,1)" }, "size": 5, "colorsrc": "Marja:222:698469" }, "error_x": { "color": "rgba(214,39,40,1)" }, "error_y": { "color": "rgba(214,39,40,1)" }, "hovertextsrc": "Marja:222:f4f081" } ], "layout": { "scene": { "xaxis": { "range": [ -0.002188448747365129, 0.0008477512083827685 ], "title": "PC1 (EV = 99.35)", "ticklen": 5, "gridwidth": 2, "zerolinewidth": 0.2 }, "yaxis": { "range": [ -0.0028822873567991457, 0.001391645544539107 ], "title": "PC2 (EV = 78.21)", "ticklen": 5, "gridwith": 2, "zerolinewidth": 0.2 }, "zaxis": { "range": [ -0.0018545205789086967, 0.0024263581651587166 ], "title": "PC3 (EV = 70.63)", "ticklen": 5, "gridwidth": 2, "zerolinewidth": 0.2 } }, "legend": { "x": 100, "y": 0.5 }, "margin": { "b": 40, "l": 60, "r": 10, "t": 25 }, "hovermode": "closest", "showlegend": true } }, "height": null, "width": null, "user": { "profile_url": "https://chart-studio.plotly.com/~Marja", "avatar_url": "https://storage.googleapis.com/plotly-prod-profiles/96.jpg", "background_url": "https://storage.googleapis.com/plotly-prod-profiles/bg-1.jpg", "bio": "", "nickname": "", "website": "", "stream_tokens": null, "feature_set_id": null, "csrf_token": null, "date_joined": "2018-09-26 06:05:46", "mapbox_access_tokens": null, "has_password": null, "username": "Marja", "email": null, "is_active": null, "readonly": null, "is_dash_creator": null, "dash_created_count": null, "is_chart_creator": null, "charts_created_count": null } }, { "creation_time": "2025-09-01T11:25:23.757271Z", "comments": { "results": [], "count": 0 }, "parented": true, "embed_url": "https://chart-studio.plotly.com/~Marja/221.embed", "fid": "Marja:221", "filename": "E.DUN_5 provenances only_1Sep2025", "filetype": "plot", "img_url": "https://api.plotly.com/v2/files/Marja:221/image?image_name=list-thumb", "image_urls": { "default": "https://storage.googleapis.com/plotly-prod-images/Marja/221/2_TRUSBNIBA8554KIXX9R1AYGX950VSC.png", "block-thumb": "https://storage.googleapis.com/plotly-prod-images/Marja/221/8_ZLX0UGLZJAPMFKI8E43VYS45EF4X73.png", "list-thumb": "https://api.plotly.com/v2/files/Marja:221/image?image_name=list-thumb" }, "api_urls": { "files": "https://api.plotly.com/v2/files/Marja:221", "plots": "https://api.plotly.com/v2/plots/Marja:221", "parent": "https://api.plotly.com/v2/folders/home?user=Marja" }, "owner": "Marja", "parent": -1, "preview": "", "referencers": [], "references": [], "title": "", "views": 1, "web_url": "https://chart-studio.plotly.com/~Marja/221/", "world_readable": true, "date_modified": "2025-09-01T11:25:23.769Z", "stars": { "results": [], "count": 0 }, "collaborators": { "results": [], "count": 0 }, "subfolder_count": null, "refresh_interval": null, "organize_view_url": "https://chart-studio.plotly.com/~Marja/221/", "current_user_permission": "read", "is_theme": null, "is_template": null, "autosize": true, "caption": "", "figure": { "data": [ { "line": { "color": "rgba(31,119,180,1)" }, "mode": "markers", "name": "BEAURY SF", "type": "scatter3d", "xsrc": "Marja:220:6ba5ea", "ysrc": "Marja:220:9aabd5", "zsrc": "Marja:220:12ac11", "frame": null, "marker": { "line": { "color": "rgba(31,119,180,1)" }, "size": 5, "colorsrc": "Marja:220:6eb502" }, "error_x": { "color": "rgba(31,119,180,1)" }, "error_y": { "color": "rgba(31,119,180,1)" }, "hovertextsrc": "Marja:220:4a0013" }, { "line": { "color": "rgba(255,127,14,1)" }, "mode": "markers", "name": "DALMAN", "type": "scatter3d", "xsrc": "Marja:220:4fd947", "ysrc": "Marja:220:c61e34", "zsrc": "Marja:220:a8e544", "frame": null, "marker": { "line": { "color": "rgba(255,127,14,1)" }, "size": 5, "colorsrc": "Marja:220:454894" }, "error_x": { "color": "rgba(255,127,14,1)" }, "error_y": { "color": "rgba(255,127,14,1)" }, "hovertextsrc": "Marja:220:0a52c2" }, { "line": { "color": "rgba(44,160,44,1)" }, "mode": "markers", "name": "LINDESAY", "type": "scatter3d", "xsrc": "Marja:220:7c1f5a", "ysrc": "Marja:220:3a4d94", "zsrc": "Marja:220:525b5c", "frame": null, "marker": { "line": { "color": "rgba(44,160,44,1)" }, "size": 5, "colorsrc": "Marja:220:92bf86" }, "error_x": { "color": "rgba(44,160,44,1)" }, "error_y": { "color": "rgba(44,160,44,1)" }, "hovertextsrc": "Marja:220:c5c51d" }, { "line": { "color": "rgba(214,39,40,1)" }, "mode": "markers", "name": "LINDESAY CREEK", "type": "scatter3d", "xsrc": "Marja:220:d15e19", "ysrc": "Marja:220:4f11cd", "zsrc": "Marja:220:adb0b8", "frame": null, "marker": { "line": { "color": "rgba(214,39,40,1)" }, "size": 5, "colorsrc": "Marja:220:80e2d4" }, "error_x": { "color": "rgba(214,39,40,1)" }, "error_y": { "color": "rgba(214,39,40,1)" }, "hovertextsrc": "Marja:220:a7d8c6" }, { "line": { "color": "rgba(148,103,189,1)" }, "mode": "markers", "name": "TOOLOOM", "type": "scatter3d", "xsrc": "Marja:220:1255e0", "ysrc": "Marja:220:4d07ba", "zsrc": "Marja:220:bc8cbb", "frame": null, "marker": { "line": { "color": "rgba(148,103,189,1)" }, "size": 5, "colorsrc": "Marja:220:8eaed0" }, "error_x": { "color": "rgba(148,103,189,1)" }, "error_y": { "color": "rgba(148,103,189,1)" }, "hovertextsrc": "Marja:220:68b1bc" } ], "layout": { "scene": { "xaxis": { "range": [ -0.000881277377059622, 0.002153878533506935 ], "title": "PC1 (EV = 80.52)", "ticklen": 5, "gridwidth": 2, "zerolinewidth": 0.2 }, "yaxis": { "range": [ -0.002025454326671264, 0.0008780127892720881 ], "title": "PC2 (EV = 76.28)", "ticklen": 5, "gridwith": 2, "zerolinewidth": 0.2 }, "zaxis": { "range": [ -0.0015478517729079287, 0.0026868374351906696 ], "title": "PC3 (EV = 63.1)", "ticklen": 5, "gridwidth": 2, "zerolinewidth": 0.2 } }, "legend": { "x": 100, "y": 0.5 }, "margin": { "b": 40, "l": 60, "r": 10, "t": 25 }, "hovermode": "closest", "showlegend": true } }, "height": null, "width": null, "user": { "profile_url": "https://chart-studio.plotly.com/~Marja", "avatar_url": "https://storage.googleapis.com/plotly-prod-profiles/96.jpg", "background_url": "https://storage.googleapis.com/plotly-prod-profiles/bg-1.jpg", "bio": "", "nickname": "", "website": "", "stream_tokens": null, "feature_set_id": null, "csrf_token": null, "date_joined": "2018-09-26 06:05:46", "mapbox_access_tokens": null, "has_password": null, "username": "Marja", "email": null, "is_active": null, "readonly": null, "is_dash_creator": null, "dash_created_count": null, "is_chart_creator": null, "charts_created_count": null } }, { "creation_time": "2025-09-01T11:15:10.882473Z", "comments": { "results": [], "count": 0 }, "parented": true, "embed_url": "https://chart-studio.plotly.com/~harsh-21g/2.embed", "fid": "harsh-21g:2", "filename": "Plot 2", "filetype": "plot", "img_url": "https://api.plotly.com/v2/files/harsh-21g:2/image?image_name=list-thumb", "image_urls": { "default": "https://storage.googleapis.com/plotly-prod-images/harsh-21g/2/2_TKA2AL79UVIVHY9HW2L0S1HUBSISHV.png", "block-thumb": "https://storage.googleapis.com/plotly-prod-images/harsh-21g/2/8_XPA6ICN8C8N5DMFA8K892RF34BKMV9.png", "list-thumb": "https://api.plotly.com/v2/files/harsh-21g:2/image?image_name=list-thumb" }, "api_urls": { "files": "https://api.plotly.com/v2/files/harsh-21g:2", "plots": "https://api.plotly.com/v2/plots/harsh-21g:2", "parent": "https://api.plotly.com/v2/folders/home?user=harsh-21g" }, "owner": "harsh-21g", "parent": -1, "preview": "", "referencers": [], "references": [], "title": "", "views": 1, "web_url": "https://chart-studio.plotly.com/~harsh-21g/2/", "world_readable": true, "date_modified": "2025-09-01T11:16:45.683Z", "stars": { "results": [], "count": 0 }, "collaborators": { "results": [], "count": 0 }, "subfolder_count": null, "refresh_interval": null, "organize_view_url": "https://chart-studio.plotly.com/~harsh-21g/2/", "current_user_permission": "read", "is_theme": null, "is_template": false, "autosize": true, "caption": "", "figure": { "data": [ { "line": { "color": "#3D9970", "width": 1 }, "meta": { "columnNames": { "x": "", "y": "", "text": "Increasing_text" } }, "mode": "lines", "name": "Increasing", "type": "scatter", "textsrc": "harsh-21g:0:947e31", "showlegend": false }, { "line": { "color": "#FF4136", "width": 1 }, "meta": { "columnNames": { "x": "A", "y": "", "low": "E", "high": "D", "open": "C", "text": "Decreasing_text", "close": "B" } }, "mode": "lines", "name": "Decreasing", "type": "candlestick", "xsrc": "harsh-21g:1:6303f7", "lowsrc": "harsh-21g:1:b99c7f", "highsrc": "harsh-21g:1:17db29", "opensrc": "harsh-21g:1:7a5909", "textsrc": "harsh-21g:0:5399b9", "closesrc": "harsh-21g:1:594636", "showlegend": false } ], "frames": [], "layout": { "title": { "text": "OHLC Chart" }, "xaxis": { "side": "bottom", "type": "category", "range": [ -0.5, 305.5 ], "title": { "text": "Click to enter X axis title" }, "anchor": "y", "zeroline": false, "autorange": false, "rangeslider": { "range": [ -0.5, 305.5 ], "yaxis": { "rangemode": "match" }, "autorange": true } }, "yaxis": { "side": "left", "range": [ -12.569444444444445, 8.819444444444445 ], "autorange": true }, "hovermode": "closest" } }, "height": null, "width": null, "user": { "profile_url": "https://chart-studio.plotly.com/~harsh-21g", "avatar_url": "https://storage.googleapis.com/plotly-prod-profiles/75.jpg", "background_url": "https://storage.googleapis.com/plotly-prod-profiles/bg-9.jpg", "bio": "", "nickname": "", "website": "", "stream_tokens": null, "feature_set_id": null, "csrf_token": null, "date_joined": "2025-09-01 11:14:15", "mapbox_access_tokens": null, "has_password": null, "username": "harsh-21g", "email": null, "is_active": null, "readonly": null, "is_dash_creator": null, "dash_created_count": null, "is_chart_creator": null, "charts_created_count": null } }, { "creation_time": "2025-09-01T11:15:02.526743Z", "comments": { "results": [], "count": 0 }, "parented": true, "embed_url": "https://chart-studio.plotly.com/~Marja/219.embed", "fid": "Marja:219", "filename": "E.DUN_PVE0120_1Sep2025", "filetype": "plot", "img_url": "https://api.plotly.com/v2/files/Marja:219/image?image_name=list-thumb", "image_urls": { "default": "https://api.plotly.com/v2/files/Marja:219/image?image_name=default", "block-thumb": "https://api.plotly.com/v2/files/Marja:219/image?image_name=block-thumb", "list-thumb": "https://api.plotly.com/v2/files/Marja:219/image?image_name=list-thumb" }, "api_urls": { "files": "https://api.plotly.com/v2/files/Marja:219", "plots": "https://api.plotly.com/v2/plots/Marja:219", "parent": "https://api.plotly.com/v2/folders/home?user=Marja" }, "owner": "Marja", "parent": -1, "preview": "", "referencers": [], "references": [], "title": "", "views": 1, "web_url": "https://chart-studio.plotly.com/~Marja/219/", "world_readable": true, "date_modified": "2025-09-09T11:56:43.845Z", "stars": { "results": [], "count": 0 }, "collaborators": { "results": [], "count": 0 }, "subfolder_count": null, "refresh_interval": null, "organize_view_url": "https://chart-studio.plotly.com/~Marja/219/", "current_user_permission": "read", "is_theme": null, "is_template": null, "autosize": true, "caption": "", "figure": { "data": [ { "line": { "color": "rgba(31,119,180,1)" }, "mode": "markers", "name": "ACACIA CREEK", "type": "scatter3d", "xsrc": "Marja:218:419322", "ysrc": "Marja:218:c92ed5", "zsrc": "Marja:218:a07eb2", "frame": null, "marker": { "line": { "color": "rgba(31,119,180,1)" }, "size": 5, "colorsrc": "Marja:218:3b2925" }, "error_x": { "color": "rgba(31,119,180,1)" }, "error_y": { "color": "rgba(31,119,180,1)" }, "hovertextsrc": "Marja:218:cfc352" }, { "line": { "color": "rgba(255,127,14,1)" }, "mode": "markers", "name": "BEAURY SF", "type": "scatter3d", "xsrc": "Marja:218:a0ce6d", "ysrc": "Marja:218:00c263", "zsrc": "Marja:218:0b39d7", "frame": null, "marker": { "line": { "color": "rgba(255,127,14,1)" }, "size": 5, "colorsrc": "Marja:218:b74227" }, "error_x": { "color": "rgba(255,127,14,1)" }, "error_y": { "color": "rgba(255,127,14,1)" }, "hovertextsrc": "Marja:218:328e43" }, { "line": { "color": "rgba(44,160,44,1)" }, "mode": "markers", "name": "BOOMI CREEK", "type": "scatter3d", "xsrc": "Marja:218:c1284c", "ysrc": "Marja:218:c40f9a", "zsrc": "Marja:218:ee2ac1", "frame": null, "marker": { "line": { "color": "rgba(44,160,44,1)" }, "size": 5, "colorsrc": "Marja:218:86ce7d" }, "error_x": { "color": "rgba(44,160,44,1)" }, "error_y": { "color": "rgba(44,160,44,1)" }, "hovertextsrc": "Marja:218:252c7b" }, { "line": { "color": "rgba(214,39,40,1)" }, "mode": "markers", "name": "CONDOMINE", "type": "scatter3d", "xsrc": "Marja:218:37c368", "ysrc": "Marja:218:1d42d7", "zsrc": "Marja:218:3a687c", "frame": null, "marker": { "line": { "color": "rgba(214,39,40,1)" }, "size": 5, "colorsrc": "Marja:218:49a4c1" }, "error_x": { "color": "rgba(214,39,40,1)" }, "error_y": { "color": "rgba(214,39,40,1)" }, "hovertextsrc": "Marja:218:cb01c7" }, { "line": { "color": "rgba(148,103,189,1)" }, "mode": "markers", "name": "DALMAN", "type": "scatter3d", "xsrc": "Marja:218:269196", "ysrc": "Marja:218:575a22", "zsrc": "Marja:218:8379d8", "frame": null, "marker": { "line": { "color": "rgba(148,103,189,1)" }, "size": 5, "colorsrc": "Marja:218:dbb886" }, "error_x": { "color": "rgba(148,103,189,1)" }, "error_y": { "color": "rgba(148,103,189,1)" }, "hovertextsrc": "Marja:218:ef145f" }, { "line": { "color": "rgba(140,86,75,1)" }, "mode": "markers", "name": "KLIPKRAAL MIX", "type": "scatter3d", "xsrc": "Marja:218:69167c", "ysrc": "Marja:218:a717a9", "zsrc": "Marja:218:c56add", "frame": null, "marker": { "line": { "color": "rgba(140,86,75,1)" }, "size": 5, "colorsrc": "Marja:218:72919c" }, "error_x": { "color": "rgba(140,86,75,1)" }, "error_y": { "color": "rgba(140,86,75,1)" }, "hovertextsrc": "Marja:218:3324bb" }, { "line": { "color": "rgba(227,119,194,1)" }, "mode": "markers", "name": "LEVUKA", "type": "scatter3d", "xsrc": "Marja:218:02b6ad", "ysrc": "Marja:218:9a1ffa", "zsrc": "Marja:218:06a975", "frame": null, "marker": { "line": { "color": "rgba(227,119,194,1)" }, "size": 5, "colorsrc": "Marja:218:df96cc" }, "error_x": { "color": "rgba(227,119,194,1)" }, "error_y": { "color": "rgba(227,119,194,1)" }, "hovertextsrc": "Marja:218:4bba46" }, { "line": { "color": "rgba(127,127,127,1)" }, "mode": "markers", "name": "LINDESAY", "type": "scatter3d", "xsrc": "Marja:218:ae1037", "ysrc": "Marja:218:f72284", "zsrc": "Marja:218:8f2e77", "frame": null, "marker": { "line": { "color": "rgba(127,127,127,1)" }, "size": 5, "colorsrc": "Marja:218:aa01e7" }, "error_x": { "color": "rgba(127,127,127,1)" }, "error_y": { "color": "rgba(127,127,127,1)" }, "hovertextsrc": "Marja:218:e7eb31" }, { "line": { "color": "rgba(188,189,34,1)" }, "mode": "markers", "name": "LINDESAY CREEK", "type": "scatter3d", "xsrc": "Marja:218:7769ab", "ysrc": "Marja:218:c82c30", "zsrc": "Marja:218:e72f12", "frame": null, "marker": { "line": { "color": "rgba(188,189,34,1)" }, "size": 5, "colorsrc": "Marja:218:3840a8" }, "error_x": { "color": "rgba(188,189,34,1)" }, "error_y": { "color": "rgba(188,189,34,1)" }, "hovertextsrc": "Marja:218:d086be" }, { "line": { "color": "rgba(23,190,207,1)" }, "mode": "markers", "name": "MOLETON NSW", "type": "scatter3d", "xsrc": "Marja:218:1f8ad2", "ysrc": "Marja:218:8375f9", "zsrc": "Marja:218:69cbb7", "frame": null, "marker": { "line": { "color": "rgba(23,190,207,1)" }, "size": 5, "colorsrc": "Marja:218:57f598" }, "error_x": { "color": "rgba(23,190,207,1)" }, "error_y": { "color": "rgba(23,190,207,1)" }, "hovertextsrc": "Marja:218:7285be" }, { "line": { "color": "rgba(31,119,180,1)" }, "mode": "markers", "name": "OAKY HILL", "type": "scatter3d", "xsrc": "Marja:218:df238b", "ysrc": "Marja:218:a80441", "zsrc": "Marja:218:1ee9a9", "frame": null, "marker": { "line": { "color": "rgba(31,119,180,1)" }, "size": 5, "colorsrc": "Marja:218:2ad7d3" }, "error_x": { "color": "rgba(31,119,180,1)" }, "error_y": { "color": "rgba(31,119,180,1)" }, "hovertextsrc": "Marja:218:41189e" }, { "line": { "color": "rgba(255,127,14,1)" }, "mode": "markers", "name": "TOOLOOM", "type": "scatter3d", "xsrc": "Marja:218:33cfb6", "ysrc": "Marja:218:3bf359", "zsrc": "Marja:218:d07c02", "frame": null, "marker": { "line": { "color": "rgba(255,127,14,1)" }, "size": 5, "colorsrc": "Marja:218:15c1bd" }, "error_x": { "color": "rgba(255,127,14,1)" }, "error_y": { "color": "rgba(255,127,14,1)" }, "hovertextsrc": "Marja:218:a7b531" }, { "line": { "color": "rgba(44,160,44,1)" }, "mode": "markers", "name": "WALLABY CREEK", "type": "scatter3d", "xsrc": "Marja:218:bfee3b", "ysrc": "Marja:218:7793b6", "zsrc": "Marja:218:b7f8c2", "frame": null, "marker": { "line": { "color": "rgba(44,160,44,1)" }, "size": 5, "colorsrc": "Marja:218:ac03e0" }, "error_x": { "color": "rgba(44,160,44,1)" }, "error_y": { "color": "rgba(44,160,44,1)" }, "hovertextsrc": "Marja:218:a96203" } ], "layout": { "scene": { "xaxis": { "range": [ -0.00010911927540579745, 0.0006065794781277611 ], "title": "PC1 (EV = 74.06)", "ticklen": 5, "gridwidth": 2, "zerolinewidth": 0.2 }, "yaxis": { "range": [ -0.0011550322742597114, 0.000386611743872057 ], "title": "PC2 (EV = 35.07)", "ticklen": 5, "gridwith": 2, "zerolinewidth": 0.2 }, "zaxis": { "range": [ -0.0008187111666607006, 0.000654074322535373 ], "title": "PC3 (EV = 29.82)", "ticklen": 5, "gridwidth": 2, "zerolinewidth": 0.2 } }, "legend": { "x": 100, "y": 0.5 }, "margin": { "b": 40, "l": 60, "r": 10, "t": 25 }, "hovermode": "closest", "showlegend": true } }, "height": null, "width": null, "user": { "profile_url": "https://chart-studio.plotly.com/~Marja", "avatar_url": "https://storage.googleapis.com/plotly-prod-profiles/96.jpg", "background_url": "https://storage.googleapis.com/plotly-prod-profiles/bg-1.jpg", "bio": "", "nickname": "", "website": "", "stream_tokens": null, "feature_set_id": null, "csrf_token": null, "date_joined": "2018-09-26 06:05:46", "mapbox_access_tokens": null, "has_password": null, "username": "Marja", "email": null, "is_active": null, "readonly": null, "is_dash_creator": null, "dash_created_count": null, "is_chart_creator": null, "charts_created_count": null } }, { "creation_time": "2025-09-01T11:12:29.942116Z", "comments": { "results": [], "count": 0 }, "parented": true, "embed_url": "https://chart-studio.plotly.com/~f_midd01/1053.embed", "fid": "f_midd01:1053", "filename": "RQT_Universe_Inclusion_ac", "filetype": "plot", "img_url": "https://api.plotly.com/v2/files/f_midd01:1053/image?image_name=list-thumb", "image_urls": { "default": "https://storage.googleapis.com/plotly-prod-images/f_midd01/1053/2_78QNG45P9NMRXDMIE6WBYXH81O7XAE.png", "block-thumb": "https://storage.googleapis.com/plotly-prod-images/f_midd01/1053/8_MRE7T9IS4YF365YPB9NMB8OTA7L7MY.png", "list-thumb": "https://api.plotly.com/v2/files/f_midd01:1053/image?image_name=list-thumb" }, "api_urls": { "files": "https://api.plotly.com/v2/files/f_midd01:1053", "plots": "https://api.plotly.com/v2/plots/f_midd01:1053", "parent": "https://api.plotly.com/v2/folders/home?user=f_midd01" }, "owner": "f_midd01", "parent": -1, "preview": "", "referencers": [], "references": [], "title": "", "views": 426, "web_url": "https://chart-studio.plotly.com/~f_midd01/1053/", "world_readable": true, "date_modified": "2025-09-01T12:58:37.647Z", "stars": { "results": [], "count": 0 }, "collaborators": { "results": [], "count": 0 }, "subfolder_count": null, "refresh_interval": null, "organize_view_url": "https://chart-studio.plotly.com/~f_midd01/1053/", "current_user_permission": "read", "is_theme": null, "is_template": null, "autosize": true, "caption": "", "figure": { "data": [ { "line": { "color": "#1F77B4" }, "mode": "lines", "name": "Commodities", "type": "scatter", "xsrc": "f_midd01:1054:0f29f8", "ysrc": "f_midd01:1054:c93d4e", "xaxis": "x", "yaxis": "y", "marker": { "symbol": "circle" }, "showlegend": true, "stackgroup": "1", "fillpattern": { "shape": "" }, "legendgroup": "Commodities", "orientation": "v", "hovertemplate": "Asset Class=Commodities<br>Date=%{x}<br>Number Indices=%{y}<extra></extra>" }, { "line": { "color": "#FF7F0E" }, "mode": "lines", "name": "Credit", "type": "scatter", "xsrc": "f_midd01:1054:d18caa", "ysrc": "f_midd01:1054:40ad57", "xaxis": "x", "yaxis": "y", "marker": { "symbol": "circle" }, "showlegend": true, "stackgroup": "1", "fillpattern": { "shape": "" }, "legendgroup": "Credit", "orientation": "v", "hovertemplate": "Asset Class=Credit<br>Date=%{x}<br>Number Indices=%{y}<extra></extra>" }, { "line": { "color": "#2CA02C" }, "mode": "lines", "name": "Equities", "type": "scatter", "xsrc": "f_midd01:1054:79ac80", "ysrc": "f_midd01:1054:929587", "xaxis": "x", "yaxis": "y", "marker": { "symbol": "circle" }, "showlegend": true, "stackgroup": "1", "fillpattern": { "shape": "" }, "legendgroup": "Equities", "orientation": "v", "hovertemplate": "Asset Class=Equities<br>Date=%{x}<br>Number Indices=%{y}<extra></extra>" }, { "line": { "color": "#D62728" }, "mode": "lines", "name": "FX", "type": "scatter", "xsrc": "f_midd01:1054:1822ce", "ysrc": "f_midd01:1054:1db8c3", "xaxis": "x", "yaxis": "y", "marker": { "symbol": "circle" }, "showlegend": true, "stackgroup": "1", "fillpattern": { "shape": "" }, "legendgroup": "FX", "orientation": "v", "hovertemplate": "Asset Class=FX<br>Date=%{x}<br>Number Indices=%{y}<extra></extra>" }, { "line": { "color": "#9467BD" }, "mode": "lines", "name": "Multi-Asset", "type": "scatter", "xsrc": "f_midd01:1054:0688a9", "ysrc": "f_midd01:1054:93c8d0", "xaxis": "x", "yaxis": "y", "marker": { "symbol": "circle" }, "showlegend": true, "stackgroup": "1", "fillpattern": { "shape": "" }, "legendgroup": "Multi-Asset", "orientation": "v", "hovertemplate": "Asset Class=Multi-Asset<br>Date=%{x}<br>Number Indices=%{y}<extra></extra>" }, { "line": { "color": "#8C564B" }, "mode": "lines", "name": "Rates", "type": "scatter", "xsrc": "f_midd01:1054:c8c065", "ysrc": "f_midd01:1054:092be5", "xaxis": "x", "yaxis": "y", "marker": { "symbol": "circle" }, "showlegend": true, "stackgroup": "1", "fillpattern": { "shape": "" }, "legendgroup": "Rates", "orientation": "v", "hovertemplate": "Asset Class=Rates<br>Date=%{x}<br>Number Indices=%{y}<extra></extra>" } ], "layout": { "xaxis": { "title": { "text": "Date" }, "anchor": "y", "domain": [ 0.0, 1.0 ] }, "yaxis": { "range": [ 0, 200 ], "title": { "text": "Number Indices" }, "anchor": "x", "domain": [ 0.0, 1.0 ] }, "legend": { "title": { "text": "Asset Class" }, "tracegroupgap": 0 }, "margin": { "t": 60 }, "template": { "data": { "bar": [ { "type": "bar", "marker": { "line": { "color": "white", "width": 0.5 }, "pattern": { "size": 10, "fillmode": "overlay", "solidity": 0.2 } }, "error_x": { "color": "rgb(36,36,36)" }, "error_y": { "color": "rgb(36,36,36)" } } ], "pie": [ { "type": "pie", "automargin": true } ], "table": [ { "type": "table", "cells": { "fill": { "color": "rgb(237,237,237)" }, "line": { "color": "white" } }, "header": { "fill": { "color": "rgb(217,217,217)" }, "line": { "color": "white" } } } ], "carpet": [ { "type": "carpet", "aaxis": { "gridcolor": "white", "linecolor": "white", "endlinecolor": "rgb(36,36,36)", "minorgridcolor": "white", "startlinecolor": "rgb(36,36,36)" }, "baxis": { "gridcolor": "white", "linecolor": "white", "endlinecolor": "rgb(36,36,36)", "minorgridcolor": "white", "startlinecolor": "rgb(36,36,36)" } } ], "mesh3d": [ { "type": "mesh3d", "colorbar": { "ticks": "outside", "tickcolor": "rgb(36,36,36)", "outlinewidth": 1 } } ], "contour": [ { "type": "contour", "colorbar": { "ticks": "outside", "tickcolor": "rgb(36,36,36)", "outlinewidth": 1 }, "colorscale": [ [ 0.0, "#440154" ], [ 0.1111111111111111, "#482878" ], [ 0.2222222222222222, "#3e4989" ], [ 0.3333333333333333, "#31688e" ], [ 0.4444444444444444, "#26828e" ], [ 0.5555555555555556, "#1f9e89" ], [ 0.6666666666666666, "#35b779" ], [ 0.7777777777777778, "#6ece58" ], [ 0.8888888888888888, "#b5de2b" ], [ 1.0, "#fde725" ] ] } ], "heatmap": [ { "type": "heatmap", "colorbar": { "ticks": "outside", "tickcolor": "rgb(36,36,36)", "outlinewidth": 1 }, "colorscale": [ [ 0.0, "#440154" ], [ 0.1111111111111111, "#482878" ], [ 0.2222222222222222, "#3e4989" ], [ 0.3333333333333333, "#31688e" ], [ 0.4444444444444444, "#26828e" ], [ 0.5555555555555556, "#1f9e89" ], [ 0.6666666666666666, "#35b779" ], [ 0.7777777777777778, "#6ece58" ], [ 0.8888888888888888, "#b5de2b" ], [ 1.0, "#fde725" ] ] } ], "scatter": [ { "type": "scatter", "fillpattern": { "size": 10, "fillmode": "overlay", "solidity": 0.2 } } ], "surface": [ { "type": "surface", "colorbar": { "ticks": "outside", "tickcolor": "rgb(36,36,36)", "outlinewidth": 1 }, "colorscale": [ [ 0.0, "#440154" ], [ 0.1111111111111111, "#482878" ], [ 0.2222222222222222, "#3e4989" ], [ 0.3333333333333333, "#31688e" ], [ 0.4444444444444444, "#26828e" ], [ 0.5555555555555556, "#1f9e89" ], [ 0.6666666666666666, "#35b779" ], [ 0.7777777777777778, "#6ece58" ], [ 0.8888888888888888, "#b5de2b" ], [ 1.0, "#fde725" ] ] } ], "barpolar": [ { "type": "barpolar", "marker": { "line": { "color": "white", "width": 0.5 }, "pattern": { "size": 10, "fillmode": "overlay", "solidity": 0.2 } } } ], "heatmapgl": [ { "type": "heatmapgl", "colorbar": { "ticks": "outside", "tickcolor": "rgb(36,36,36)", "outlinewidth": 1 }, "colorscale": [ [ 0.0, "#440154" ], [ 0.1111111111111111, "#482878" ], [ 0.2222222222222222, "#3e4989" ], [ 0.3333333333333333, "#31688e" ], [ 0.4444444444444444, "#26828e" ], [ 0.5555555555555556, "#1f9e89" ], [ 0.6666666666666666, "#35b779" ], [ 0.7777777777777778, "#6ece58" ], [ 0.8888888888888888, "#b5de2b" ], [ 1.0, "#fde725" ] ] } ], "histogram": [ { "type": "histogram", "marker": { "line": { "color": "white", "width": 0.6 } } } ], "parcoords": [ { "line": { "colorbar": { "ticks": "outside", "tickcolor": "rgb(36,36,36)", "outlinewidth": 1 } }, "type": "parcoords" } ], "scatter3d": [ { "line": { "colorbar": { "ticks": "outside", "tickcolor": "rgb(36,36,36)", "outlinewidth": 1 } }, "type": "scatter3d", "marker": { "colorbar": { "ticks": "outside", "tickcolor": "rgb(36,36,36)", "outlinewidth": 1 } } } ], "scattergl": [ { "type": "scattergl", "marker": { "colorbar": { "ticks": "outside", "tickcolor": "rgb(36,36,36)", "outlinewidth": 1 } } } ], "choropleth": [ { "type": "choropleth", "colorbar": { "ticks": "outside", "tickcolor": "rgb(36,36,36)", "outlinewidth": 1 } } ], "scattergeo": [ { "type": "scattergeo", "marker": { "colorbar": { "ticks": "outside", "tickcolor": "rgb(36,36,36)", "outlinewidth": 1 } } } ], "histogram2d": [ { "type": "histogram2d", "colorbar": { "ticks": "outside", "tickcolor": "rgb(36,36,36)", "outlinewidth": 1 }, "colorscale": [ [ 0.0, "#440154" ], [ 0.1111111111111111, "#482878" ], [ 0.2222222222222222, "#3e4989" ], [ 0.3333333333333333, "#31688e" ], [ 0.4444444444444444, "#26828e" ], [ 0.5555555555555556, "#1f9e89" ], [ 0.6666666666666666, "#35b779" ], [ 0.7777777777777778, "#6ece58" ], [ 0.8888888888888888, "#b5de2b" ], [ 1.0, "#fde725" ] ] } ], "scatterpolar": [ { "type": "scatterpolar", "marker": { "colorbar": { "ticks": "outside", "tickcolor": "rgb(36,36,36)", "outlinewidth": 1 } } } ], "contourcarpet": [ { "type": "contourcarpet", "colorbar": { "ticks": "outside", "tickcolor": "rgb(36,36,36)", "outlinewidth": 1 } } ], "scattercarpet": [ { "type": "scattercarpet", "marker": { "colorbar": { "ticks": "outside", "tickcolor": "rgb(36,36,36)", "outlinewidth": 1 } } } ], "scattermapbox": [ { "type": "scattermapbox", "marker": { "colorbar": { "ticks": "outside", "tickcolor": "rgb(36,36,36)", "outlinewidth": 1 } } } ], "scatterpolargl": [ { "type": "scatterpolargl", "marker": { "colorbar": { "ticks": "outside", "tickcolor": "rgb(36,36,36)", "outlinewidth": 1 } } } ], "scatterternary": [ { "type": "scatterternary", "marker": { "colorbar": { "ticks": "outside", "tickcolor": "rgb(36,36,36)", "outlinewidth": 1 } } } ], "histogram2dcontour": [ { "type": "histogram2dcontour", "colorbar": { "ticks": "outside", "tickcolor": "rgb(36,36,36)", "outlinewidth": 1 }, "colorscale": [ [ 0.0, "#440154" ], [ 0.1111111111111111, "#482878" ], [ 0.2222222222222222, "#3e4989" ], [ 0.3333333333333333, "#31688e" ], [ 0.4444444444444444, "#26828e" ], [ 0.5555555555555556, "#1f9e89" ], [ 0.6666666666666666, "#35b779" ], [ 0.7777777777777778, "#6ece58" ], [ 0.8888888888888888, "#b5de2b" ], [ 1.0, "#fde725" ] ] } ] }, "layout": { "geo": { "bgcolor": "white", "showland": true, "lakecolor": "white", "landcolor": "white", "showlakes": true, "subunitcolor": "white" }, "font": { "color": "rgb(36,36,36)" }, "polar": { "bgcolor": "white", "radialaxis": { "ticks": "outside", "showgrid": false, "showline": true, "gridcolor": "rgb(232,232,232)", "linecolor": "rgb(36,36,36)" }, "angularaxis": { "ticks": "outside", "showgrid": false, "showline": true, "gridcolor": "rgb(232,232,232)", "linecolor": "rgb(36,36,36)" } }, "scene": { "xaxis": { "ticks": "outside", "showgrid": false, "showline": true, "zeroline": false, "gridcolor": "rgb(232,232,232)", "gridwidth": 2, "linecolor": "rgb(36,36,36)", "zerolinecolor": "rgb(36,36,36)", "showbackground": true, "backgroundcolor": "white" }, "yaxis": { "ticks": "outside", "showgrid": false, "showline": true, "zeroline": false, "gridcolor": "rgb(232,232,232)", "gridwidth": 2, "linecolor": "rgb(36,36,36)", "zerolinecolor": "rgb(36,36,36)", "showbackground": true, "backgroundcolor": "white" }, "zaxis": { "ticks": "outside", "showgrid": false, "showline": true, "zeroline": false, "gridcolor": "rgb(232,232,232)", "gridwidth": 2, "linecolor": "rgb(36,36,36)", "zerolinecolor": "rgb(36,36,36)", "showbackground": true, "backgroundcolor": "white" } }, "title": { "x": 0.05 }, "xaxis": { "ticks": "outside", "title": { "standoff": 15 }, "showgrid": false, "showline": true, "zeroline": false, "gridcolor": "rgb(232,232,232)", "linecolor": "rgb(36,36,36)", "automargin": true, "zerolinecolor": "rgb(36,36,36)" }, "yaxis": { "ticks": "outside", "title": { "standoff": 15 }, "showgrid": false, "showline": true, "zeroline": false, "gridcolor": "rgb(232,232,232)", "linecolor": "rgb(36,36,36)", "automargin": true, "zerolinecolor": "rgb(36,36,36)" }, "mapbox": { "style": "light" }, "ternary": { "aaxis": { "ticks": "outside", "showgrid": false, "showline": true, "gridcolor": "rgb(232,232,232)", "linecolor": "rgb(36,36,36)" }, "baxis": { "ticks": "outside", "showgrid": false, "showline": true, "gridcolor": "rgb(232,232,232)", "linecolor": "rgb(36,36,36)" }, "caxis": { "ticks": "outside", "showgrid": false, "showline": true, "gridcolor": "rgb(232,232,232)", "linecolor": "rgb(36,36,36)" }, "bgcolor": "white" }, "colorway": [ "#1F77B4", "#FF7F0E", "#2CA02C", "#D62728", "#9467BD", "#8C564B", "#E377C2", "#7F7F7F", "#BCBD22", "#17BECF" ], "coloraxis": { "colorbar": { "ticks": "outside", "tickcolor": "rgb(36,36,36)", "outlinewidth": 1 } }, "hovermode": "closest", "colorscale": { "diverging": [ [ 0.0, "rgb(103,0,31)" ], [ 0.1, "rgb(178,24,43)" ], [ 0.2, "rgb(214,96,77)" ], [ 0.3, "rgb(244,165,130)" ], [ 0.4, "rgb(253,219,199)" ], [ 0.5, "rgb(247,247,247)" ], [ 0.6, "rgb(209,229,240)" ], [ 0.7, "rgb(146,197,222)" ], [ 0.8, "rgb(67,147,195)" ], [ 0.9, "rgb(33,102,172)" ], [ 1.0, "rgb(5,48,97)" ] ], "sequential": [ [ 0.0, "#440154" ], [ 0.1111111111111111, "#482878" ], [ 0.2222222222222222, "#3e4989" ], [ 0.3333333333333333, "#31688e" ], [ 0.4444444444444444, "#26828e" ], [ 0.5555555555555556, "#1f9e89" ], [ 0.6666666666666666, "#35b779" ], [ 0.7777777777777778, "#6ece58" ], [ 0.8888888888888888, "#b5de2b" ], [ 1.0, "#fde725" ] ], "sequentialminus": [ [ 0.0, "#440154" ], [ 0.1111111111111111, "#482878" ], [ 0.2222222222222222, "#3e4989" ], [ 0.3333333333333333, "#31688e" ], [ 0.4444444444444444, "#26828e" ], [ 0.5555555555555556, "#1f9e89" ], [ 0.6666666666666666, "#35b779" ], [ 0.7777777777777778, "#6ece58" ], [ 0.8888888888888888, "#b5de2b" ], [ 1.0, "#fde725" ] ] }, "hoverlabel": { "align": "left" }, "plot_bgcolor": "white", "paper_bgcolor": "white", "shapedefaults": { "line": { "width": 0 }, "opacity": 0.3, "fillcolor": "black" }, "autotypenumbers": "strict", "annotationdefaults": { "arrowhead": 0, "arrowwidth": 1 } } } } }, "height": null, "width": null, "user": { "profile_url": "https://chart-studio.plotly.com/~f_midd01", "avatar_url": "https://storage.googleapis.com/plotly-prod-profiles/45.jpg", "background_url": "https://storage.googleapis.com/plotly-prod-profiles/bg-14.jpg", "bio": "", "nickname": "", "website": "", "stream_tokens": null, "feature_set_id": null, "csrf_token": null, "date_joined": "2023-03-31 13:11:04", "mapbox_access_tokens": null, "has_password": null, "username": "f_midd01", "email": null, "is_active": null, "readonly": null, "is_dash_creator": null, "dash_created_count": null, "is_chart_creator": null, "charts_created_count": null } }, { "creation_time": "2025-09-01T09:01:10.803625Z", "comments": { "results": [], "count": 0 }, "parented": true, "embed_url": "https://chart-studio.plotly.com/~ShirleyW/2.embed", "fid": "ShirleyW:2", "filename": "Plot 2", "filetype": "plot", "img_url": "https://api.plotly.com/v2/files/ShirleyW:2/image?image_name=list-thumb", "image_urls": { "default": "https://storage.googleapis.com/plotly-prod-images/ShirleyW/2/2_VCOYCQCIWNVC7UE9IABS5QWBGLXZPQ.png", "block-thumb": "https://storage.googleapis.com/plotly-prod-images/ShirleyW/2/8_5ZE6Z5FPM4H44NF2ESAPDE1DPAP3QI.png", "list-thumb": "https://api.plotly.com/v2/files/ShirleyW:2/image?image_name=list-thumb" }, "api_urls": { "files": "https://api.plotly.com/v2/files/ShirleyW:2", "plots": "https://api.plotly.com/v2/plots/ShirleyW:2", "parent": "https://api.plotly.com/v2/folders/home?user=ShirleyW" }, "owner": "ShirleyW", "parent": -1, "preview": "", "referencers": [], "references": [], "title": "", "views": 0, "web_url": "https://chart-studio.plotly.com/~ShirleyW/2/", "world_readable": true, "date_modified": "2025-09-01T09:01:10.819Z", "stars": { "results": [], "count": 0 }, "collaborators": { "results": [], "count": 0 }, "subfolder_count": null, "refresh_interval": null, "organize_view_url": "https://chart-studio.plotly.com/~ShirleyW/2/", "current_user_permission": "read", "is_theme": null, "is_template": false, "autosize": true, "caption": "", "figure": { "data": [ { "meta": { "columnNames": { "x": "%MeOH", "y": "MeOH (g/h)", "z": "Glycerol (g/h)" } }, "mode": "markers", "type": "scatter3d", "xsrc": "ShirleyW:0:4de64f", "ysrc": "ShirleyW:0:c3bdd0", "zsrc": "ShirleyW:0:7b79f6", "marker": { "size": 11, "color": "rgb(41, 55, 223)" } } ], "frames": [], "layout": { "scene": { "xaxis": { "type": "linear", "tick0": 15, "ticks": "inside", "title": { "font": { "size": 22, "family": "Arial" }, "text": "% MeOH" }, "mirror": false, "nticks": 7, "ticklen": 8, "showline": true, "tickfont": { "size": 14 }, "tickmode": "auto", "zeroline": true, "gridcolor": "rgb(160, 161, 163)", "gridwidth": 4, "linecolor": "rgb(8, 8, 8)", "linewidth": 3, "tickangle": 45, "tickformat": "", "showbackground": true, "spikethickness": 3 }, "yaxis": { "type": "linear", "tick0": 15, "ticks": "inside", "title": { "font": { "size": 22, "family": "Arial" }, "text": "MeOH (g/h)" }, "mirror": false, "nticks": 7, "ticklen": 8, "showline": true, "tickfont": { "size": 14 }, "tickmode": "auto", "zeroline": true, "gridcolor": "rgb(160, 161, 163)", "gridwidth": 4, "linecolor": "rgb(8, 8, 8)", "linewidth": 3, "tickangle": 45, "tickformat": "", "showbackground": true, "spikethickness": 3 }, "zaxis": { "type": "linear", "tick0": 15, "ticks": "inside", "title": { "font": { "size": 22, "family": "Arial" }, "text": "Glycerol (g/h)" }, "mirror": false, "nticks": 7, "ticklen": 8, "showline": true, "tickfont": { "size": 14 }, "tickmode": "auto", "zeroline": true, "gridcolor": "rgb(160, 161, 163)", "gridwidth": 4, "linecolor": "rgb(8, 8, 8)", "linewidth": 3, "tickangle": 45, "tickformat": "", "showbackground": true, "spikethickness": 3 }, "camera": { "up": { "x": 0, "y": 0, "z": 1 }, "eye": { "x": -1.3999255474680494, "y": 0.6661052550083103, "z": -2.2257276886534405 }, "center": { "x": 0, "y": 0, "z": 0 }, "projection": { "type": "perspective" } }, "aspectmode": "auto", "aspectratio": { "x": 1, "y": 1, "z": 1 } }, "title": { "text": "Click to enter Plot title" }, "xaxis": { "range": [ -1, 6 ], "autorange": true }, "yaxis": { "range": [ -1, 4 ], "autorange": true }, "autosize": true, "template": { "data": { "bar": [ { "type": "bar", "marker": { "colorbar": { "ticks": "", "outlinewidth": 0 } } } ], "table": [ { "type": "table", "cells": { "fill": { "color": "#EBF0F8" }, "line": { "color": "white" } }, "header": { "fill": { "color": "#C8D4E3" }, "line": { "color": "white" } } } ], "carpet": [ { "type": "carpet", "aaxis": { "gridcolor": "#C8D4E3", "linecolor": "#C8D4E3", "endlinecolor": "#2a3f5f", "minorgridcolor": "#C8D4E3", "startlinecolor": "#2a3f5f" }, "baxis": { "gridcolor": "#C8D4E3", "linecolor": "#C8D4E3", "endlinecolor": "#2a3f5f", "minorgridcolor": "#C8D4E3", "startlinecolor": "#2a3f5f" } } ], "mesh3d": [ { "type": "mesh3d", "colorbar": { "ticks": "", "outlinewidth": 0 } } ], "contour": [ { "type": "contour", "colorbar": { "ticks": "", "outlinewidth": 0 }, "autocolorscale": true } ], "heatmap": [ { "type": "heatmap", "colorbar": { "ticks": "", "outlinewidth": 0 }, "autocolorscale": true } ], "scatter": [ { "type": "scatter", "marker": { "colorbar": { "ticks": "", "outlinewidth": 0 } } } ], "surface": [ { "type": "surface", "colorbar": { "ticks": "", "outlinewidth": 0 } } ], "heatmapgl": [ { "type": "heatmapgl", "colorbar": { "ticks": "", "outlinewidth": 0 } } ], "histogram": [ { "type": "histogram", "marker": { "colorbar": { "ticks": "", "outlinewidth": 0 } } } ], "parcoords": [ { "line": { "colorbar": { "ticks": "", "outlinewidth": 0 } }, "type": "parcoords" } ], "scatter3d": [ { "type": "scatter3d", "marker": { "colorbar": { "ticks": "", "outlinewidth": 0 } } } ], "scattergl": [ { "type": "scattergl", "marker": { "colorbar": { "ticks": "", "outlinewidth": 0 } } } ], "choropleth": [ { "type": "choropleth", "colorbar": { "ticks": "", "outlinewidth": 0 } } ], "scattergeo": [ { "type": "scattergeo", "marker": { "colorbar": { "ticks": "", "outlinewidth": 0 } } } ], "histogram2d": [ { "type": "histogram2d", "colorbar": { "ticks": "", "outlinewidth": 0 }, "autocolorscale": true } ], "scatterpolar": [ { "type": "scatterpolar", "marker": { "colorbar": { "ticks": "", "outlinewidth": 0 } } } ], "contourcarpet": [ { "type": "contourcarpet", "colorbar": { "ticks": "", "outlinewidth": 0 } } ], "scattercarpet": [ { "type": "scattercarpet", "marker": { "colorbar": { "ticks": "", "outlinewidth": 0 } } } ], "scattermapbox": [ { "type": "scattermapbox", "marker": { "colorbar": { "ticks": "", "outlinewidth": 0 } } } ], "scatterpolargl": [ { "type": "scatterpolargl", "marker": { "colorbar": { "ticks": "", "outlinewidth": 0 } } } ], "scatterternary": [ { "type": "scatterternary", "marker": { "colorbar": { "ticks": "", "outlinewidth": 0 } } } ], "histogram2dcontour": [ { "type": "histogram2dcontour", "colorbar": { "ticks": "", "outlinewidth": 0 }, "autocolorscale": true } ] }, "layout": { "geo": { "bgcolor": "white", "showland": true, "lakecolor": "white", "landcolor": "white", "showlakes": true, "subunitcolor": "#C8D4E3" }, "font": { "color": "#2a3f5f" }, "polar": { "bgcolor": "white", "radialaxis": { "ticks": "", "gridcolor": "#EBF0F8", "linecolor": "#EBF0F8" }, "angularaxis": { "ticks": "", "gridcolor": "#EBF0F8", "linecolor": "#EBF0F8" } }, "scene": { "xaxis": { "ticks": "", "gridcolor": "#DFE8F3", "gridwidth": 2, "linecolor": "#EBF0F8", "zerolinecolor": "#EBF0F8", "showbackground": true, "backgroundcolor": "white" }, "yaxis": { "ticks": "", "gridcolor": "#DFE8F3", "gridwidth": 2, "linecolor": "#EBF0F8", "zerolinecolor": "#EBF0F8", "showbackground": true, "backgroundcolor": "white" }, "zaxis": { "ticks": "", "gridcolor": "#DFE8F3", "gridwidth": 2, "linecolor": "#EBF0F8", "zerolinecolor": "#EBF0F8", "showbackground": true, "backgroundcolor": "white" } }, "title": { "x": 0.05 }, "xaxis": { "ticks": "", "gridcolor": "#EBF0F8", "linecolor": "#EBF0F8", "automargin": true, "zerolinecolor": "#EBF0F8", "zerolinewidth": 2 }, "yaxis": { "ticks": "", "gridcolor": "#EBF0F8", "linecolor": "#EBF0F8", "automargin": true, "zerolinecolor": "#EBF0F8", "zerolinewidth": 2 }, "ternary": { "aaxis": { "ticks": "", "gridcolor": "#DFE8F3", "linecolor": "#A2B1C6" }, "baxis": { "ticks": "", "gridcolor": "#DFE8F3", "linecolor": "#A2B1C6" }, "caxis": { "ticks": "", "gridcolor": "#DFE8F3", "linecolor": "#A2B1C6" }, "bgcolor": "white" }, "colorway": [ "#636efa", "#EF553B", "#00cc96", "#ab63fa", "#19d3f3", "#e763fa", "#fecb52", "#ffa15a", "#ff6692", "#b6e880" ], "hovermode": "closest", "colorscale": { "diverging": [ [ 0, "#8e0152" ], [ 0.1, "#c51b7d" ], [ 0.2, "#de77ae" ], [ 0.3, "#f1b6da" ], [ 0.4, "#fde0ef" ], [ 0.5, "#f7f7f7" ], [ 0.6, "#e6f5d0" ], [ 0.7, "#b8e186" ], [ 0.8, "#7fbc41" ], [ 0.9, "#4d9221" ], [ 1, "#276419" ] ], "sequential": [ [ 0, "#0508b8" ], [ 0.0893854748603352, "#1910d8" ], [ 0.1787709497206704, "#3c19f0" ], [ 0.2681564245810056, "#6b1cfb" ], [ 0.3575418994413408, "#981cfd" ], [ 0.44692737430167595, "#bf1cfd" ], [ 0.5363128491620112, "#dd2bfd" ], [ 0.6256983240223464, "#f246fe" ], [ 0.7150837988826816, "#fc67fd" ], [ 0.8044692737430168, "#fe88fc" ], [ 0.8938547486033519, "#fea5fd" ], [ 0.9832402234636871, "#febefe" ], [ 1, "#fec3fe" ] ], "sequentialminus": [ [ 0, "#0508b8" ], [ 0.0893854748603352, "#1910d8" ], [ 0.1787709497206704, "#3c19f0" ], [ 0.2681564245810056, "#6b1cfb" ], [ 0.3575418994413408, "#981cfd" ], [ 0.44692737430167595, "#bf1cfd" ], [ 0.5363128491620112, "#dd2bfd" ], [ 0.6256983240223464, "#f246fe" ], [ 0.7150837988826816, "#fc67fd" ], [ 0.8044692737430168, "#fe88fc" ], [ 0.8938547486033519, "#fea5fd" ], [ 0.9832402234636871, "#febefe" ], [ 1, "#fec3fe" ] ] }, "plot_bgcolor": "white", "paper_bgcolor": "white", "shapedefaults": { "line": { "width": 0 }, "opacity": 0.4, "fillcolor": "#506784" }, "annotationdefaults": { "arrowhead": 0, "arrowcolor": "#506784", "arrowwidth": 1 } }, "themeRef": "PLOTLY_WHITE" }, "colorscale": { "sequential": [ [ 0, "#f7fcf0" ], [ 0.125, "#e0f3db" ], [ 0.25, "#ccebc5" ], [ 0.375, "#a8ddb5" ], [ 0.5, "#7bccc4" ], [ 0.625, "#4eb3d3" ], [ 0.75, "#2b8cbe" ], [ 0.875, "#0868ac" ], [ 1, "#084081" ] ] }, "showlegend": false } }, "height": null, "width": null, "user": { "profile_url": "https://chart-studio.plotly.com/~ShirleyW", "avatar_url": "https://storage.googleapis.com/plotly-prod-profiles/38.jpg", "background_url": "https://storage.googleapis.com/plotly-prod-profiles/bg-10.jpg", "bio": "", "nickname": "", "website": "", "stream_tokens": null, "feature_set_id": null, "csrf_token": null, "date_joined": "2025-09-01 06:20:50", "mapbox_access_tokens": null, "has_password": null, "username": "ShirleyW", "email": null, "is_active": null, "readonly": null, "is_dash_creator": null, "dash_created_count": null, "is_chart_creator": null, "charts_created_count": null } }, { "creation_time": "2025-09-01T08:51:01.674622Z", "comments": { "results": [], "count": 0 }, "parented": true, "embed_url": "https://chart-studio.plotly.com/~f_midd01/1049.embed", "fid": "f_midd01:1049", "filename": "RQT_Universe_Inclusion", "filetype": "plot", "img_url": "https://api.plotly.com/v2/files/f_midd01:1049/image?image_name=list-thumb", "image_urls": { "default": "https://storage.googleapis.com/plotly-prod-images/f_midd01/1049/2_XU8S8PUDT2SI6NCKK1W7SEVULUS60M.png", "block-thumb": "https://storage.googleapis.com/plotly-prod-images/f_midd01/1049/8_TSX7Q84JS5I014QQ7SC4ZENVWRMCLY.png", "list-thumb": "https://api.plotly.com/v2/files/f_midd01:1049/image?image_name=list-thumb" }, "api_urls": { "files": "https://api.plotly.com/v2/files/f_midd01:1049", "plots": "https://api.plotly.com/v2/plots/f_midd01:1049", "parent": "https://api.plotly.com/v2/folders/home?user=f_midd01" }, "owner": "f_midd01", "parent": -1, "preview": "", "referencers": [], "references": [], "title": "", "views": 443, "web_url": "https://chart-studio.plotly.com/~f_midd01/1049/", "world_readable": true, "date_modified": "2025-09-01T11:12:12.171Z", "stars": { "results": [], "count": 0 }, "collaborators": { "results": [], "count": 0 }, "subfolder_count": null, "refresh_interval": null, "organize_view_url": "https://chart-studio.plotly.com/~f_midd01/1049/", "current_user_permission": "read", "is_theme": null, "is_template": null, "autosize": true, "caption": "", "figure": { "data": [ { "line": { "color": "#1F77B4" }, "mode": "lines", "name": "Included Strategies", "type": "scatter", "xsrc": "f_midd01:1051:a0467d", "ysrc": "f_midd01:1051:aed7b0", "xaxis": "x", "yaxis": "y", "marker": { "symbol": "circle" }, "showlegend": true, "stackgroup": "1", "fillpattern": { "shape": "" }, "legendgroup": "Included Strategies", "orientation": "v", "hovertemplate": "Type=Included Strategies<br>Date=%{x}<br>Share=%{y}<extra></extra>" }, { "line": { "color": "#FF7F0E" }, "mode": "lines", "name": "Excluded Strategies", "type": "scatter", "xsrc": "f_midd01:1051:faecc9", "ysrc": "f_midd01:1051:0adac4", "xaxis": "x", "yaxis": "y", "marker": { "symbol": "circle" }, "showlegend": true, "stackgroup": "1", "fillpattern": { "shape": "" }, "legendgroup": "Excluded Strategies", "orientation": "v", "hovertemplate": "Type=Excluded Strategies<br>Date=%{x}<br>Share=%{y}<extra></extra>" } ], "layout": { "xaxis": { "title": { "text": "Date" }, "anchor": "y", "domain": [ 0.0, 1.0 ] }, "yaxis": { "title": { "text": "Share" }, "anchor": "x", "domain": [ 0.0, 1.0 ], "tickformat": ".0%" }, "legend": { "title": { "text": "Type" }, "tracegroupgap": 0 }, "margin": { "t": 60 }, "template": { "data": { "bar": [ { "type": "bar", "marker": { "line": { "color": "white", "width": 0.5 }, "pattern": { "size": 10, "fillmode": "overlay", "solidity": 0.2 } }, "error_x": { "color": "rgb(36,36,36)" }, "error_y": { "color": "rgb(36,36,36)" } } ], "pie": [ { "type": "pie", "automargin": true } ], "table": [ { "type": "table", "cells": { "fill": { "color": "rgb(237,237,237)" }, "line": { "color": "white" } }, "header": { "fill": { "color": "rgb(217,217,217)" }, "line": { "color": "white" } } } ], "carpet": [ { "type": "carpet", "aaxis": { "gridcolor": "white", "linecolor": "white", "endlinecolor": "rgb(36,36,36)", "minorgridcolor": "white", "startlinecolor": "rgb(36,36,36)" }, "baxis": { "gridcolor": "white", "linecolor": "white", "endlinecolor": "rgb(36,36,36)", "minorgridcolor": "white", "startlinecolor": "rgb(36,36,36)" } } ], "mesh3d": [ { "type": "mesh3d", "colorbar": { "ticks": "outside", "tickcolor": "rgb(36,36,36)", "outlinewidth": 1 } } ], "contour": [ { "type": "contour", "colorbar": { "ticks": "outside", "tickcolor": "rgb(36,36,36)", "outlinewidth": 1 }, "colorscale": [ [ 0.0, "#440154" ], [ 0.1111111111111111, "#482878" ], [ 0.2222222222222222, "#3e4989" ], [ 0.3333333333333333, "#31688e" ], [ 0.4444444444444444, "#26828e" ], [ 0.5555555555555556, "#1f9e89" ], [ 0.6666666666666666, "#35b779" ], [ 0.7777777777777778, "#6ece58" ], [ 0.8888888888888888, "#b5de2b" ], [ 1.0, "#fde725" ] ] } ], "heatmap": [ { "type": "heatmap", "colorbar": { "ticks": "outside", "tickcolor": "rgb(36,36,36)", "outlinewidth": 1 }, "colorscale": [ [ 0.0, "#440154" ], [ 0.1111111111111111, "#482878" ], [ 0.2222222222222222, "#3e4989" ], [ 0.3333333333333333, "#31688e" ], [ 0.4444444444444444, "#26828e" ], [ 0.5555555555555556, "#1f9e89" ], [ 0.6666666666666666, "#35b779" ], [ 0.7777777777777778, "#6ece58" ], [ 0.8888888888888888, "#b5de2b" ], [ 1.0, "#fde725" ] ] } ], "scatter": [ { "type": "scatter", "fillpattern": { "size": 10, "fillmode": "overlay", "solidity": 0.2 } } ], "surface": [ { "type": "surface", "colorbar": { "ticks": "outside", "tickcolor": "rgb(36,36,36)", "outlinewidth": 1 }, "colorscale": [ [ 0.0, "#440154" ], [ 0.1111111111111111, "#482878" ], [ 0.2222222222222222, "#3e4989" ], [ 0.3333333333333333, "#31688e" ], [ 0.4444444444444444, "#26828e" ], [ 0.5555555555555556, "#1f9e89" ], [ 0.6666666666666666, "#35b779" ], [ 0.7777777777777778, "#6ece58" ], [ 0.8888888888888888, "#b5de2b" ], [ 1.0, "#fde725" ] ] } ], "barpolar": [ { "type": "barpolar", "marker": { "line": { "color": "white", "width": 0.5 }, "pattern": { "size": 10, "fillmode": "overlay", "solidity": 0.2 } } } ], "heatmapgl": [ { "type": "heatmapgl", "colorbar": { "ticks": "outside", "tickcolor": "rgb(36,36,36)", "outlinewidth": 1 }, "colorscale": [ [ 0.0, "#440154" ], [ 0.1111111111111111, "#482878" ], [ 0.2222222222222222, "#3e4989" ], [ 0.3333333333333333, "#31688e" ], [ 0.4444444444444444, "#26828e" ], [ 0.5555555555555556, "#1f9e89" ], [ 0.6666666666666666, "#35b779" ], [ 0.7777777777777778, "#6ece58" ], [ 0.8888888888888888, "#b5de2b" ], [ 1.0, "#fde725" ] ] } ], "histogram": [ { "type": "histogram", "marker": { "line": { "color": "white", "width": 0.6 } } } ], "parcoords": [ { "line": { "colorbar": { "ticks": "outside", "tickcolor": "rgb(36,36,36)", "outlinewidth": 1 } }, "type": "parcoords" } ], "scatter3d": [ { "line": { "colorbar": { "ticks": "outside", "tickcolor": "rgb(36,36,36)", "outlinewidth": 1 } }, "type": "scatter3d", "marker": { "colorbar": { "ticks": "outside", "tickcolor": "rgb(36,36,36)", "outlinewidth": 1 } } } ], "scattergl": [ { "type": "scattergl", "marker": { "colorbar": { "ticks": "outside", "tickcolor": "rgb(36,36,36)", "outlinewidth": 1 } } } ], "choropleth": [ { "type": "choropleth", "colorbar": { "ticks": "outside", "tickcolor": "rgb(36,36,36)", "outlinewidth": 1 } } ], "scattergeo": [ { "type": "scattergeo", "marker": { "colorbar": { "ticks": "outside", "tickcolor": "rgb(36,36,36)", "outlinewidth": 1 } } } ], "histogram2d": [ { "type": "histogram2d", "colorbar": { "ticks": "outside", "tickcolor": "rgb(36,36,36)", "outlinewidth": 1 }, "colorscale": [ [ 0.0, "#440154" ], [ 0.1111111111111111, "#482878" ], [ 0.2222222222222222, "#3e4989" ], [ 0.3333333333333333, "#31688e" ], [ 0.4444444444444444, "#26828e" ], [ 0.5555555555555556, "#1f9e89" ], [ 0.6666666666666666, "#35b779" ], [ 0.7777777777777778, "#6ece58" ], [ 0.8888888888888888, "#b5de2b" ], [ 1.0, "#fde725" ] ] } ], "scatterpolar": [ { "type": "scatterpolar", "marker": { "colorbar": { "ticks": "outside", "tickcolor": "rgb(36,36,36)", "outlinewidth": 1 } } } ], "contourcarpet": [ { "type": "contourcarpet", "colorbar": { "ticks": "outside", "tickcolor": "rgb(36,36,36)", "outlinewidth": 1 } } ], "scattercarpet": [ { "type": "scattercarpet", "marker": { "colorbar": { "ticks": "outside", "tickcolor": "rgb(36,36,36)", "outlinewidth": 1 } } } ], "scattermapbox": [ { "type": "scattermapbox", "marker": { "colorbar": { "ticks": "outside", "tickcolor": "rgb(36,36,36)", "outlinewidth": 1 } } } ], "scatterpolargl": [ { "type": "scatterpolargl", "marker": { "colorbar": { "ticks": "outside", "tickcolor": "rgb(36,36,36)", "outlinewidth": 1 } } } ], "scatterternary": [ { "type": "scatterternary", "marker": { "colorbar": { "ticks": "outside", "tickcolor": "rgb(36,36,36)", "outlinewidth": 1 } } } ], "histogram2dcontour": [ { "type": "histogram2dcontour", "colorbar": { "ticks": "outside", "tickcolor": "rgb(36,36,36)", "outlinewidth": 1 }, "colorscale": [ [ 0.0, "#440154" ], [ 0.1111111111111111, "#482878" ], [ 0.2222222222222222, "#3e4989" ], [ 0.3333333333333333, "#31688e" ], [ 0.4444444444444444, "#26828e" ], [ 0.5555555555555556, "#1f9e89" ], [ 0.6666666666666666, "#35b779" ], [ 0.7777777777777778, "#6ece58" ], [ 0.8888888888888888, "#b5de2b" ], [ 1.0, "#fde725" ] ] } ] }, "layout": { "geo": { "bgcolor": "white", "showland": true, "lakecolor": "white", "landcolor": "white", "showlakes": true, "subunitcolor": "white" }, "font": { "color": "rgb(36,36,36)" }, "polar": { "bgcolor": "white", "radialaxis": { "ticks": "outside", "showgrid": false, "showline": true, "gridcolor": "rgb(232,232,232)", "linecolor": "rgb(36,36,36)" }, "angularaxis": { "ticks": "outside", "showgrid": false, "showline": true, "gridcolor": "rgb(232,232,232)", "linecolor": "rgb(36,36,36)" } }, "scene": { "xaxis": { "ticks": "outside", "showgrid": false, "showline": true, "zeroline": false, "gridcolor": "rgb(232,232,232)", "gridwidth": 2, "linecolor": "rgb(36,36,36)", "zerolinecolor": "rgb(36,36,36)", "showbackground": true, "backgroundcolor": "white" }, "yaxis": { "ticks": "outside", "showgrid": false, "showline": true, "zeroline": false, "gridcolor": "rgb(232,232,232)", "gridwidth": 2, "linecolor": "rgb(36,36,36)", "zerolinecolor": "rgb(36,36,36)", "showbackground": true, "backgroundcolor": "white" }, "zaxis": { "ticks": "outside", "showgrid": false, "showline": true, "zeroline": false, "gridcolor": "rgb(232,232,232)", "gridwidth": 2, "linecolor": "rgb(36,36,36)", "zerolinecolor": "rgb(36,36,36)", "showbackground": true, "backgroundcolor": "white" } }, "title": { "x": 0.05 }, "xaxis": { "ticks": "outside", "title": { "standoff": 15 }, "showgrid": false, "showline": true, "zeroline": false, "gridcolor": "rgb(232,232,232)", "linecolor": "rgb(36,36,36)", "automargin": true, "zerolinecolor": "rgb(36,36,36)" }, "yaxis": { "ticks": "outside", "title": { "standoff": 15 }, "showgrid": false, "showline": true, "zeroline": false, "gridcolor": "rgb(232,232,232)", "linecolor": "rgb(36,36,36)", "automargin": true, "zerolinecolor": "rgb(36,36,36)" }, "mapbox": { "style": "light" }, "ternary": { "aaxis": { "ticks": "outside", "showgrid": false, "showline": true, "gridcolor": "rgb(232,232,232)", "linecolor": "rgb(36,36,36)" }, "baxis": { "ticks": "outside", "showgrid": false, "showline": true, "gridcolor": "rgb(232,232,232)", "linecolor": "rgb(36,36,36)" }, "caxis": { "ticks": "outside", "showgrid": false, "showline": true, "gridcolor": "rgb(232,232,232)", "linecolor": "rgb(36,36,36)" }, "bgcolor": "white" }, "colorway": [ "#1F77B4", "#FF7F0E", "#2CA02C", "#D62728", "#9467BD", "#8C564B", "#E377C2", "#7F7F7F", "#BCBD22", "#17BECF" ], "coloraxis": { "colorbar": { "ticks": "outside", "tickcolor": "rgb(36,36,36)", "outlinewidth": 1 } }, "hovermode": "closest", "colorscale": { "diverging": [ [ 0.0, "rgb(103,0,31)" ], [ 0.1, "rgb(178,24,43)" ], [ 0.2, "rgb(214,96,77)" ], [ 0.3, "rgb(244,165,130)" ], [ 0.4, "rgb(253,219,199)" ], [ 0.5, "rgb(247,247,247)" ], [ 0.6, "rgb(209,229,240)" ], [ 0.7, "rgb(146,197,222)" ], [ 0.8, "rgb(67,147,195)" ], [ 0.9, "rgb(33,102,172)" ], [ 1.0, "rgb(5,48,97)" ] ], "sequential": [ [ 0.0, "#440154" ], [ 0.1111111111111111, "#482878" ], [ 0.2222222222222222, "#3e4989" ], [ 0.3333333333333333, "#31688e" ], [ 0.4444444444444444, "#26828e" ], [ 0.5555555555555556, "#1f9e89" ], [ 0.6666666666666666, "#35b779" ], [ 0.7777777777777778, "#6ece58" ], [ 0.8888888888888888, "#b5de2b" ], [ 1.0, "#fde725" ] ], "sequentialminus": [ [ 0.0, "#440154" ], [ 0.1111111111111111, "#482878" ], [ 0.2222222222222222, "#3e4989" ], [ 0.3333333333333333, "#31688e" ], [ 0.4444444444444444, "#26828e" ], [ 0.5555555555555556, "#1f9e89" ], [ 0.6666666666666666, "#35b779" ], [ 0.7777777777777778, "#6ece58" ], [ 0.8888888888888888, "#b5de2b" ], [ 1.0, "#fde725" ] ] }, "hoverlabel": { "align": "left" }, "plot_bgcolor": "white", "paper_bgcolor": "white", "shapedefaults": { "line": { "width": 0 }, "opacity": 0.3, "fillcolor": "black" }, "autotypenumbers": "strict", "annotationdefaults": { "arrowhead": 0, "arrowwidth": 1 } } } } }, "height": null, "width": null, "user": { "profile_url": "https://chart-studio.plotly.com/~f_midd01", "avatar_url": "https://storage.googleapis.com/plotly-prod-profiles/45.jpg", "background_url": "https://storage.googleapis.com/plotly-prod-profiles/bg-14.jpg", "bio": "", "nickname": "", "website": "", "stream_tokens": null, "feature_set_id": null, "csrf_token": null, "date_joined": "2023-03-31 13:11:04", "mapbox_access_tokens": null, "has_password": null, "username": "f_midd01", "email": null, "is_active": null, "readonly": null, "is_dash_creator": null, "dash_created_count": null, "is_chart_creator": null, "charts_created_count": null } }, { "creation_time": "2025-09-01T08:48:33.994260Z", "comments": { "results": [], "count": 0 }, "parented": true, "embed_url": "https://chart-studio.plotly.com/~f_midd01/1047.embed", "fid": "f_midd01:1047", "filename": "RQT_Comparison", "filetype": "plot", "img_url": "https://api.plotly.com/v2/files/f_midd01:1047/image?image_name=list-thumb", "image_urls": { "default": "https://storage.googleapis.com/plotly-prod-images/f_midd01/1047/2_A310VNM3L34LDVD659VHY74ICHTGAZ.png", "block-thumb": "https://api.plotly.com/v2/files/f_midd01:1047/image?image_name=block-thumb", "list-thumb": "https://api.plotly.com/v2/files/f_midd01:1047/image?image_name=list-thumb" }, "api_urls": { "files": "https://api.plotly.com/v2/files/f_midd01:1047", "plots": "https://api.plotly.com/v2/plots/f_midd01:1047", "parent": "https://api.plotly.com/v2/folders/home?user=f_midd01" }, "owner": "f_midd01", "parent": -1, "preview": "", "referencers": [], "references": [], "title": "", "views": 394, "web_url": "https://chart-studio.plotly.com/~f_midd01/1047/", "world_readable": true, "date_modified": "2025-09-01T12:59:36.749Z", "stars": { "results": [], "count": 0 }, "collaborators": { "results": [], "count": 0 }, "subfolder_count": null, "refresh_interval": null, "organize_view_url": "https://chart-studio.plotly.com/~f_midd01/1047/", "current_user_permission": "read", "is_theme": null, "is_template": null, "autosize": true, "caption": "", "figure": { "data": [ { "line": { "dash": "solid", "color": "#1F77B4" }, "mode": "lines", "name": "RQT Index", "type": "scatter", "xsrc": "f_midd01:1055:027160", "ysrc": "f_midd01:1055:ecb6fc", "xaxis": "x", "yaxis": "y", "marker": { "symbol": "circle" }, "showlegend": true, "legendgroup": "RQT Index", "orientation": "v", "hovertemplate": "Index=RQT Index<br>Date=%{x}<br>Cumulative Return=%{y}<extra></extra>" }, { "line": { "dash": "solid", "color": "#FF7F0E" }, "mode": "lines", "name": "NEIXCTAT Index", "type": "scatter", "xsrc": "f_midd01:1055:de6ef0", "ysrc": "f_midd01:1055:1de18f", "xaxis": "x", "yaxis": "y", "marker": { "symbol": "circle" }, "showlegend": true, "legendgroup": "NEIXCTAT Index", "orientation": "v", "hovertemplate": "Index=NEIXCTAT Index<br>Date=%{x}<br>Cumulative Return=%{y}<extra></extra>" }, { "line": { "dash": "solid", "color": "#2CA02C" }, "mode": "lines", "name": "HFRIMTI Index", "type": "scatter", "xsrc": "f_midd01:1055:b3eea0", "ysrc": "f_midd01:1055:be8e2a", "xaxis": "x", "yaxis": "y", "marker": { "symbol": "circle" }, "showlegend": true, "legendgroup": "HFRIMTI Index", "orientation": "v", "hovertemplate": "Index=HFRIMTI Index<br>Date=%{x}<br>Cumulative Return=%{y}<extra></extra>" } ], "layout": { "xaxis": { "title": { "text": "Date" }, "anchor": "y", "domain": [ 0.0, 1.0 ] }, "yaxis": { "range": [ -0.2, 1 ], "title": { "text": "Cumulative Return" }, "anchor": "x", "domain": [ 0.0, 1.0 ], "tickformat": ".2%" }, "legend": { "title": { "text": "Index" }, "tracegroupgap": 0 }, "margin": { "t": 60 }, "template": { "data": { "bar": [ { "type": "bar", "marker": { "line": { "color": "white", "width": 0.5 }, "pattern": { "size": 10, "fillmode": "overlay", "solidity": 0.2 } }, "error_x": { "color": "rgb(36,36,36)" }, "error_y": { "color": "rgb(36,36,36)" } } ], "pie": [ { "type": "pie", "automargin": true } ], "table": [ { "type": "table", "cells": { "fill": { "color": "rgb(237,237,237)" }, "line": { "color": "white" } }, "header": { "fill": { "color": "rgb(217,217,217)" }, "line": { "color": "white" } } } ], "carpet": [ { "type": "carpet", "aaxis": { "gridcolor": "white", "linecolor": "white", "endlinecolor": "rgb(36,36,36)", "minorgridcolor": "white", "startlinecolor": "rgb(36,36,36)" }, "baxis": { "gridcolor": "white", "linecolor": "white", "endlinecolor": "rgb(36,36,36)", "minorgridcolor": "white", "startlinecolor": "rgb(36,36,36)" } } ], "mesh3d": [ { "type": "mesh3d", "colorbar": { "ticks": "outside", "tickcolor": "rgb(36,36,36)", "outlinewidth": 1 } } ], "contour": [ { "type": "contour", "colorbar": { "ticks": "outside", "tickcolor": "rgb(36,36,36)", "outlinewidth": 1 }, "colorscale": [ [ 0.0, "#440154" ], [ 0.1111111111111111, "#482878" ], [ 0.2222222222222222, "#3e4989" ], [ 0.3333333333333333, "#31688e" ], [ 0.4444444444444444, "#26828e" ], [ 0.5555555555555556, "#1f9e89" ], [ 0.6666666666666666, "#35b779" ], [ 0.7777777777777778, "#6ece58" ], [ 0.8888888888888888, "#b5de2b" ], [ 1.0, "#fde725" ] ] } ], "heatmap": [ { "type": "heatmap", "colorbar": { "ticks": "outside", "tickcolor": "rgb(36,36,36)", "outlinewidth": 1 }, "colorscale": [ [ 0.0, "#440154" ], [ 0.1111111111111111, "#482878" ], [ 0.2222222222222222, "#3e4989" ], [ 0.3333333333333333, "#31688e" ], [ 0.4444444444444444, "#26828e" ], [ 0.5555555555555556, "#1f9e89" ], [ 0.6666666666666666, "#35b779" ], [ 0.7777777777777778, "#6ece58" ], [ 0.8888888888888888, "#b5de2b" ], [ 1.0, "#fde725" ] ] } ], "scatter": [ { "type": "scatter", "fillpattern": { "size": 10, "fillmode": "overlay", "solidity": 0.2 } } ], "surface": [ { "type": "surface", "colorbar": { "ticks": "outside", "tickcolor": "rgb(36,36,36)", "outlinewidth": 1 }, "colorscale": [ [ 0.0, "#440154" ], [ 0.1111111111111111, "#482878" ], [ 0.2222222222222222, "#3e4989" ], [ 0.3333333333333333, "#31688e" ], [ 0.4444444444444444, "#26828e" ], [ 0.5555555555555556, "#1f9e89" ], [ 0.6666666666666666, "#35b779" ], [ 0.7777777777777778, "#6ece58" ], [ 0.8888888888888888, "#b5de2b" ], [ 1.0, "#fde725" ] ] } ], "barpolar": [ { "type": "barpolar", "marker": { "line": { "color": "white", "width": 0.5 }, "pattern": { "size": 10, "fillmode": "overlay", "solidity": 0.2 } } } ], "heatmapgl": [ { "type": "heatmapgl", "colorbar": { "ticks": "outside", "tickcolor": "rgb(36,36,36)", "outlinewidth": 1 }, "colorscale": [ [ 0.0, "#440154" ], [ 0.1111111111111111, "#482878" ], [ 0.2222222222222222, "#3e4989" ], [ 0.3333333333333333, "#31688e" ], [ 0.4444444444444444, "#26828e" ], [ 0.5555555555555556, "#1f9e89" ], [ 0.6666666666666666, "#35b779" ], [ 0.7777777777777778, "#6ece58" ], [ 0.8888888888888888, "#b5de2b" ], [ 1.0, "#fde725" ] ] } ], "histogram": [ { "type": "histogram", "marker": { "line": { "color": "white", "width": 0.6 } } } ], "parcoords": [ { "line": { "colorbar": { "ticks": "outside", "tickcolor": "rgb(36,36,36)", "outlinewidth": 1 } }, "type": "parcoords" } ], "scatter3d": [ { "line": { "colorbar": { "ticks": "outside", "tickcolor": "rgb(36,36,36)", "outlinewidth": 1 } }, "type": "scatter3d", "marker": { "colorbar": { "ticks": "outside", "tickcolor": "rgb(36,36,36)", "outlinewidth": 1 } } } ], "scattergl": [ { "type": "scattergl", "marker": { "colorbar": { "ticks": "outside", "tickcolor": "rgb(36,36,36)", "outlinewidth": 1 } } } ], "choropleth": [ { "type": "choropleth", "colorbar": { "ticks": "outside", "tickcolor": "rgb(36,36,36)", "outlinewidth": 1 } } ], "scattergeo": [ { "type": "scattergeo", "marker": { "colorbar": { "ticks": "outside", "tickcolor": "rgb(36,36,36)", "outlinewidth": 1 } } } ], "histogram2d": [ { "type": "histogram2d", "colorbar": { "ticks": "outside", "tickcolor": "rgb(36,36,36)", "outlinewidth": 1 }, "colorscale": [ [ 0.0, "#440154" ], [ 0.1111111111111111, "#482878" ], [ 0.2222222222222222, "#3e4989" ], [ 0.3333333333333333, "#31688e" ], [ 0.4444444444444444, "#26828e" ], [ 0.5555555555555556, "#1f9e89" ], [ 0.6666666666666666, "#35b779" ], [ 0.7777777777777778, "#6ece58" ], [ 0.8888888888888888, "#b5de2b" ], [ 1.0, "#fde725" ] ] } ], "scatterpolar": [ { "type": "scatterpolar", "marker": { "colorbar": { "ticks": "outside", "tickcolor": "rgb(36,36,36)", "outlinewidth": 1 } } } ], "contourcarpet": [ { "type": "contourcarpet", "colorbar": { "ticks": "outside", "tickcolor": "rgb(36,36,36)", "outlinewidth": 1 } } ], "scattercarpet": [ { "type": "scattercarpet", "marker": { "colorbar": { "ticks": "outside", "tickcolor": "rgb(36,36,36)", "outlinewidth": 1 } } } ], "scattermapbox": [ { "type": "scattermapbox", "marker": { "colorbar": { "ticks": "outside", "tickcolor": "rgb(36,36,36)", "outlinewidth": 1 } } } ], "scatterpolargl": [ { "type": "scatterpolargl", "marker": { "colorbar": { "ticks": "outside", "tickcolor": "rgb(36,36,36)", "outlinewidth": 1 } } } ], "scatterternary": [ { "type": "scatterternary", "marker": { "colorbar": { "ticks": "outside", "tickcolor": "rgb(36,36,36)", "outlinewidth": 1 } } } ], "histogram2dcontour": [ { "type": "histogram2dcontour", "colorbar": { "ticks": "outside", "tickcolor": "rgb(36,36,36)", "outlinewidth": 1 }, "colorscale": [ [ 0.0, "#440154" ], [ 0.1111111111111111, "#482878" ], [ 0.2222222222222222, "#3e4989" ], [ 0.3333333333333333, "#31688e" ], [ 0.4444444444444444, "#26828e" ], [ 0.5555555555555556, "#1f9e89" ], [ 0.6666666666666666, "#35b779" ], [ 0.7777777777777778, "#6ece58" ], [ 0.8888888888888888, "#b5de2b" ], [ 1.0, "#fde725" ] ] } ] }, "layout": { "geo": { "bgcolor": "white", "showland": true, "lakecolor": "white", "landcolor": "white", "showlakes": true, "subunitcolor": "white" }, "font": { "color": "rgb(36,36,36)" }, "polar": { "bgcolor": "white", "radialaxis": { "ticks": "outside", "showgrid": false, "showline": true, "gridcolor": "rgb(232,232,232)", "linecolor": "rgb(36,36,36)" }, "angularaxis": { "ticks": "outside", "showgrid": false, "showline": true, "gridcolor": "rgb(232,232,232)", "linecolor": "rgb(36,36,36)" } }, "scene": { "xaxis": { "ticks": "outside", "showgrid": false, "showline": true, "zeroline": false, "gridcolor": "rgb(232,232,232)", "gridwidth": 2, "linecolor": "rgb(36,36,36)", "zerolinecolor": "rgb(36,36,36)", "showbackground": true, "backgroundcolor": "white" }, "yaxis": { "ticks": "outside", "showgrid": false, "showline": true, "zeroline": false, "gridcolor": "rgb(232,232,232)", "gridwidth": 2, "linecolor": "rgb(36,36,36)", "zerolinecolor": "rgb(36,36,36)", "showbackground": true, "backgroundcolor": "white" }, "zaxis": { "ticks": "outside", "showgrid": false, "showline": true, "zeroline": false, "gridcolor": "rgb(232,232,232)", "gridwidth": 2, "linecolor": "rgb(36,36,36)", "zerolinecolor": "rgb(36,36,36)", "showbackground": true, "backgroundcolor": "white" } }, "title": { "x": 0.05 }, "xaxis": { "ticks": "outside", "title": { "standoff": 15 }, "showgrid": false, "showline": true, "zeroline": false, "gridcolor": "rgb(232,232,232)", "linecolor": "rgb(36,36,36)", "automargin": true, "zerolinecolor": "rgb(36,36,36)" }, "yaxis": { "ticks": "outside", "title": { "standoff": 15 }, "showgrid": false, "showline": true, "zeroline": false, "gridcolor": "rgb(232,232,232)", "linecolor": "rgb(36,36,36)", "automargin": true, "zerolinecolor": "rgb(36,36,36)" }, "mapbox": { "style": "light" }, "ternary": { "aaxis": { "ticks": "outside", "showgrid": false, "showline": true, "gridcolor": "rgb(232,232,232)", "linecolor": "rgb(36,36,36)" }, "baxis": { "ticks": "outside", "showgrid": false, "showline": true, "gridcolor": "rgb(232,232,232)", "linecolor": "rgb(36,36,36)" }, "caxis": { "ticks": "outside", "showgrid": false, "showline": true, "gridcolor": "rgb(232,232,232)", "linecolor": "rgb(36,36,36)" }, "bgcolor": "white" }, "colorway": [ "#1F77B4", "#FF7F0E", "#2CA02C", "#D62728", "#9467BD", "#8C564B", "#E377C2", "#7F7F7F", "#BCBD22", "#17BECF" ], "coloraxis": { "colorbar": { "ticks": "outside", "tickcolor": "rgb(36,36,36)", "outlinewidth": 1 } }, "hovermode": "closest", "colorscale": { "diverging": [ [ 0.0, "rgb(103,0,31)" ], [ 0.1, "rgb(178,24,43)" ], [ 0.2, "rgb(214,96,77)" ], [ 0.3, "rgb(244,165,130)" ], [ 0.4, "rgb(253,219,199)" ], [ 0.5, "rgb(247,247,247)" ], [ 0.6, "rgb(209,229,240)" ], [ 0.7, "rgb(146,197,222)" ], [ 0.8, "rgb(67,147,195)" ], [ 0.9, "rgb(33,102,172)" ], [ 1.0, "rgb(5,48,97)" ] ], "sequential": [ [ 0.0, "#440154" ], [ 0.1111111111111111, "#482878" ], [ 0.2222222222222222, "#3e4989" ], [ 0.3333333333333333, "#31688e" ], [ 0.4444444444444444, "#26828e" ], [ 0.5555555555555556, "#1f9e89" ], [ 0.6666666666666666, "#35b779" ], [ 0.7777777777777778, "#6ece58" ], [ 0.8888888888888888, "#b5de2b" ], [ 1.0, "#fde725" ] ], "sequentialminus": [ [ 0.0, "#440154" ], [ 0.1111111111111111, "#482878" ], [ 0.2222222222222222, "#3e4989" ], [ 0.3333333333333333, "#31688e" ], [ 0.4444444444444444, "#26828e" ], [ 0.5555555555555556, "#1f9e89" ], [ 0.6666666666666666, "#35b779" ], [ 0.7777777777777778, "#6ece58" ], [ 0.8888888888888888, "#b5de2b" ], [ 1.0, "#fde725" ] ] }, "hoverlabel": { "align": "left" }, "plot_bgcolor": "white", "paper_bgcolor": "white", "shapedefaults": { "line": { "width": 0 }, "opacity": 0.3, "fillcolor": "black" }, "autotypenumbers": "strict", "annotationdefaults": { "arrowhead": 0, "arrowwidth": 1 } } } } }, "height": null, "width": null, "user": { "profile_url": "https://chart-studio.plotly.com/~f_midd01", "avatar_url": "https://storage.googleapis.com/plotly-prod-profiles/45.jpg", "background_url": "https://storage.googleapis.com/plotly-prod-profiles/bg-14.jpg", "bio": "", "nickname": "", "website": "", "stream_tokens": null, "feature_set_id": null, "csrf_token": null, "date_joined": "2023-03-31 13:11:04", "mapbox_access_tokens": null, "has_password": null, "username": "f_midd01", "email": null, "is_active": null, "readonly": null, "is_dash_creator": null, "dash_created_count": null, "is_chart_creator": null, "charts_created_count": null } }, { "creation_time": "2025-09-01T07:19:50.189592Z", "comments": { "results": [], "count": 0 }, "parented": true, "embed_url": "https://chart-studio.plotly.com/~handigital/3.embed", "fid": "handigital:3", "filename": "Monthly Training Participation (Jan-Jul)", "filetype": "plot", "img_url": "https://storage.googleapis.com/plotly-prod-images/handigital/3/9_G3DVA05IH269GYUTOFD19VKSJQ8PP5.png", "image_urls": { "default": "https://storage.googleapis.com/plotly-prod-images/handigital/3/2_QPTWLNN5U5QDEP3PMU0QQLPXI9F7UG.png", "block-thumb": "https://storage.googleapis.com/plotly-prod-images/handigital/3/8_0J8ZFXD89NFZ5GKQVLHG1YP3U6IDX0.png", "list-thumb": "https://storage.googleapis.com/plotly-prod-images/handigital/3/9_G3DVA05IH269GYUTOFD19VKSJQ8PP5.png" }, "api_urls": { "files": "https://api.plotly.com/v2/files/handigital:3", "plots": "https://api.plotly.com/v2/plots/handigital:3", "parent": "https://api.plotly.com/v2/folders/home?user=handigital" }, "owner": "handigital", "parent": -1, "preview": "", "referencers": [], "references": [], "title": "", "views": 2, "web_url": "https://chart-studio.plotly.com/~handigital/3/", "world_readable": true, "date_modified": "2025-09-01T07:19:50.203Z", "stars": { "results": [], "count": 0 }, "collaborators": { "results": [], "count": 0 }, "subfolder_count": null, "refresh_interval": null, "organize_view_url": "https://chart-studio.plotly.com/~handigital/3/", "current_user_permission": "read", "is_theme": null, "is_template": false, "autosize": true, "caption": "", "figure": { "data": [ { "meta": { "columnNames": { "x": "Month", "y": "Health & Safety" } }, "mode": "markers", "name": "Health & Safety", "type": "bar", "xsrc": "handigital:2:3ad5dd", "ysrc": "handigital:2:f72224", "orientation": "v" }, { "meta": { "columnNames": { "x": "Month", "y": "Cybersecurity" } }, "name": "Cybersecurity", "type": "bar", "xsrc": "handigital:2:3ad5dd", "ysrc": "handigital:2:4aa3ae", "orientation": "v" }, { "meta": { "columnNames": { "x": "Month", "y": "Diversity & Inclusion" } }, "name": "Diversity & Inclusion", "type": "bar", "xsrc": "handigital:2:3ad5dd", "ysrc": "handigital:2:6e6823", "orientation": "v" } ], "frames": [], "layout": { "title": { "text": "Monthly Training Participation (Jan-Jul)" }, "xaxis": { "type": "category", "range": [ -0.5, 6.5 ], "title": { "text": "Month" }, "autorange": true }, "yaxis": { "type": "linear", "range": [ 0, 55.78947368421053 ], "title": { "text": "Number of Participants" }, "autorange": true }, "autosize": true, "template": { "data": { "bar": [ { "type": "bar", "marker": { "colorbar": { "ticks": "", "outlinewidth": 0 } } } ], "table": [ { "type": "table", "cells": { "fill": { "color": "#EBF0F8" }, "line": { "color": "white" } }, "header": { "fill": { "color": "#C8D4E3" }, "line": { "color": "white" } } } ], "carpet": [ { "type": "carpet", "aaxis": { "gridcolor": "#C8D4E3", "linecolor": "#C8D4E3", "endlinecolor": "#2a3f5f", "minorgridcolor": "#C8D4E3", "startlinecolor": "#2a3f5f" }, "baxis": { "gridcolor": "#C8D4E3", "linecolor": "#C8D4E3", "endlinecolor": "#2a3f5f", "minorgridcolor": "#C8D4E3", "startlinecolor": "#2a3f5f" } } ], "mesh3d": [ { "type": "mesh3d", "colorbar": { "ticks": "", "outlinewidth": 0 } } ], "contour": [ { "type": "contour", "colorbar": { "ticks": "", "outlinewidth": 0 }, "autocolorscale": true } ], "heatmap": [ { "type": "heatmap", "colorbar": { "ticks": "", "outlinewidth": 0 }, "autocolorscale": true } ], "scatter": [ { "type": "scatter", "marker": { "colorbar": { "ticks": "", "outlinewidth": 0 } } } ], "surface": [ { "type": "surface", "colorbar": { "ticks": "", "outlinewidth": 0 } } ], "heatmapgl": [ { "type": "heatmapgl", "colorbar": { "ticks": "", "outlinewidth": 0 } } ], "histogram": [ { "type": "histogram", "marker": { "colorbar": { "ticks": "", "outlinewidth": 0 } } } ], "parcoords": [ { "line": { "colorbar": { "ticks": "", "outlinewidth": 0 } }, "type": "parcoords" } ], "scatter3d": [ { "type": "scatter3d", "marker": { "colorbar": { "ticks": "", "outlinewidth": 0 } } } ], "scattergl": [ { "type": "scattergl", "marker": { "colorbar": { "ticks": "", "outlinewidth": 0 } } } ], "choropleth": [ { "type": "choropleth", "colorbar": { "ticks": "", "outlinewidth": 0 } } ], "scattergeo": [ { "type": "scattergeo", "marker": { "colorbar": { "ticks": "", "outlinewidth": 0 } } } ], "histogram2d": [ { "type": "histogram2d", "colorbar": { "ticks": "", "outlinewidth": 0 }, "autocolorscale": true } ], "scatterpolar": [ { "type": "scatterpolar", "marker": { "colorbar": { "ticks": "", "outlinewidth": 0 } } } ], "contourcarpet": [ { "type": "contourcarpet", "colorbar": { "ticks": "", "outlinewidth": 0 } } ], "scattercarpet": [ { "type": "scattercarpet", "marker": { "colorbar": { "ticks": "", "outlinewidth": 0 } } } ], "scattermapbox": [ { "type": "scattermapbox", "marker": { "colorbar": { "ticks": "", "outlinewidth": 0 } } } ], "scatterpolargl": [ { "type": "scatterpolargl", "marker": { "colorbar": { "ticks": "", "outlinewidth": 0 } } } ], "scatterternary": [ { "type": "scatterternary", "marker": { "colorbar": { "ticks": "", "outlinewidth": 0 } } } ], "histogram2dcontour": [ { "type": "histogram2dcontour", "colorbar": { "ticks": "", "outlinewidth": 0 }, "autocolorscale": true } ] }, "layout": { "geo": { "bgcolor": "white", "showland": true, "lakecolor": "white", "landcolor": "white", "showlakes": true, "subunitcolor": "#C8D4E3" }, "font": { "color": "#2a3f5f" }, "polar": { "bgcolor": "white", "radialaxis": { "ticks": "", "gridcolor": "#EBF0F8", "linecolor": "#EBF0F8" }, "angularaxis": { "ticks": "", "gridcolor": "#EBF0F8", "linecolor": "#EBF0F8" } }, "scene": { "xaxis": { "ticks": "", "gridcolor": "#DFE8F3", "gridwidth": 2, "linecolor": "#EBF0F8", "zerolinecolor": "#EBF0F8", "showbackground": true, "backgroundcolor": "white" }, "yaxis": { "ticks": "", "gridcolor": "#DFE8F3", "gridwidth": 2, "linecolor": "#EBF0F8", "zerolinecolor": "#EBF0F8", "showbackground": true, "backgroundcolor": "white" }, "zaxis": { "ticks": "", "gridcolor": "#DFE8F3", "gridwidth": 2, "linecolor": "#EBF0F8", "zerolinecolor": "#EBF0F8", "showbackground": true, "backgroundcolor": "white" } }, "title": { "x": 0.05 }, "xaxis": { "ticks": "", "gridcolor": "#EBF0F8", "linecolor": "#EBF0F8", "automargin": true, "zerolinecolor": "#EBF0F8", "zerolinewidth": 2 }, "yaxis": { "ticks": "", "gridcolor": "#EBF0F8", "linecolor": "#EBF0F8", "automargin": true, "zerolinecolor": "#EBF0F8", "zerolinewidth": 2 }, "ternary": { "aaxis": { "ticks": "", "gridcolor": "#DFE8F3", "linecolor": "#A2B1C6" }, "baxis": { "ticks": "", "gridcolor": "#DFE8F3", "linecolor": "#A2B1C6" }, "caxis": { "ticks": "", "gridcolor": "#DFE8F3", "linecolor": "#A2B1C6" }, "bgcolor": "white" }, "colorway": [ "#636efa", "#EF553B", "#00cc96", "#ab63fa", "#19d3f3", "#e763fa", "#fecb52", "#ffa15a", "#ff6692", "#b6e880" ], "hovermode": "closest", "colorscale": { "diverging": [ [ 0, "#8e0152" ], [ 0.1, "#c51b7d" ], [ 0.2, "#de77ae" ], [ 0.3, "#f1b6da" ], [ 0.4, "#fde0ef" ], [ 0.5, "#f7f7f7" ], [ 0.6, "#e6f5d0" ], [ 0.7, "#b8e186" ], [ 0.8, "#7fbc41" ], [ 0.9, "#4d9221" ], [ 1, "#276419" ] ], "sequential": [ [ 0, "#0508b8" ], [ 0.0893854748603352, "#1910d8" ], [ 0.1787709497206704, "#3c19f0" ], [ 0.2681564245810056, "#6b1cfb" ], [ 0.3575418994413408, "#981cfd" ], [ 0.44692737430167595, "#bf1cfd" ], [ 0.5363128491620112, "#dd2bfd" ], [ 0.6256983240223464, "#f246fe" ], [ 0.7150837988826816, "#fc67fd" ], [ 0.8044692737430168, "#fe88fc" ], [ 0.8938547486033519, "#fea5fd" ], [ 0.9832402234636871, "#febefe" ], [ 1, "#fec3fe" ] ], "sequentialminus": [ [ 0, "#0508b8" ], [ 0.0893854748603352, "#1910d8" ], [ 0.1787709497206704, "#3c19f0" ], [ 0.2681564245810056, "#6b1cfb" ], [ 0.3575418994413408, "#981cfd" ], [ 0.44692737430167595, "#bf1cfd" ], [ 0.5363128491620112, "#dd2bfd" ], [ 0.6256983240223464, "#f246fe" ], [ 0.7150837988826816, "#fc67fd" ], [ 0.8044692737430168, "#fe88fc" ], [ 0.8938547486033519, "#fea5fd" ], [ 0.9832402234636871, "#febefe" ], [ 1, "#fec3fe" ] ] }, "plot_bgcolor": "white", "paper_bgcolor": "white", "shapedefaults": { "line": { "width": 0 }, "opacity": 0.4, "fillcolor": "#506784" }, "annotationdefaults": { "arrowhead": 0, "arrowcolor": "#506784", "arrowwidth": 1 } }, "themeRef": "PLOTLY_WHITE" } } }, "height": null, "width": null, "user": { "profile_url": "https://chart-studio.plotly.com/~handigital", "avatar_url": "https://storage.googleapis.com/plotly-prod-profiles/77.jpg", "background_url": "https://storage.googleapis.com/plotly-prod-profiles/bg-2.jpg", "bio": "", "nickname": "", "website": "", "stream_tokens": null, "feature_set_id": null, "csrf_token": null, "date_joined": "2025-08-11 11:45:18", "mapbox_access_tokens": null, "has_password": null, "username": "handigital", "email": null, "is_active": null, "readonly": null, "is_dash_creator": null, "dash_created_count": null, "is_chart_creator": null, "charts_created_count": null } }, { "creation_time": "2025-09-01T07:19:10.189795Z", "comments": { "results": [], "count": 0 }, "parented": true, "embed_url": "https://chart-studio.plotly.com/~handigital/1.embed", "fid": "handigital:1", "filename": "Plot 1", "filetype": "plot", "img_url": "https://storage.googleapis.com/plotly-prod-images/handigital/1/9_R2FUMOFAQAK0QI7QFD2R0GMBR3F3VF.png", "image_urls": { "default": "https://storage.googleapis.com/plotly-prod-images/handigital/1/2_I2ON16QKLE6JIV84POGZMPD2I9T1BE.png", "block-thumb": "https://storage.googleapis.com/plotly-prod-images/handigital/1/8_57LYVI9SJ40IY5Y81J1WZWIAWEMHE6.png", "list-thumb": "https://storage.googleapis.com/plotly-prod-images/handigital/1/9_R2FUMOFAQAK0QI7QFD2R0GMBR3F3VF.png" }, "api_urls": { "files": "https://api.plotly.com/v2/files/handigital:1", "plots": "https://api.plotly.com/v2/plots/handigital:1", "parent": "https://api.plotly.com/v2/folders/home?user=handigital" }, "owner": "handigital", "parent": -1, "preview": "", "referencers": [], "references": [], "title": "", "views": 2, "web_url": "https://chart-studio.plotly.com/~handigital/1/", "world_readable": true, "date_modified": "2025-09-01T07:19:10.204Z", "stars": { "results": [], "count": 0 }, "collaborators": { "results": [], "count": 0 }, "subfolder_count": null, "refresh_interval": null, "organize_view_url": "https://chart-studio.plotly.com/~handigital/1/", "current_user_permission": "read", "is_theme": null, "is_template": false, "autosize": true, "caption": "", "figure": { "data": [ { "meta": { "columnNames": { "x": "month", "y": "Health & Safety" } }, "mode": "markers", "name": "Health", "type": "bar", "xsrc": "handigital:0:1ecff4", "ysrc": "handigital:0:b299a2", "orientation": "v" }, { "meta": { "columnNames": { "x": "month", "y": "Cybersecurity" } }, "type": "bar", "xsrc": "handigital:0:1ecff4", "ysrc": "handigital:0:0acb05", "orientation": "v" }, { "meta": { "columnNames": { "x": "month", "y": "Diversity & Inclusion" } }, "type": "bar", "xsrc": "handigital:0:1ecff4", "ysrc": "handigital:0:102424", "orientation": "v" } ], "frames": [], "layout": { "title": { "text": "" }, "xaxis": { "type": "category", "range": [ -0.5, 5.5 ], "autorange": true }, "yaxis": { "type": "linear", "range": [ 0, 55.78947368421053 ], "autorange": true }, "autosize": true, "template": { "data": { "bar": [ { "type": "bar", "marker": { "colorbar": { "ticks": "", "outlinewidth": 0 } } } ], "table": [ { "type": "table", "cells": { "fill": { "color": "#EBF0F8" }, "line": { "color": "white" } }, "header": { "fill": { "color": "#C8D4E3" }, "line": { "color": "white" } } } ], "carpet": [ { "type": "carpet", "aaxis": { "gridcolor": "#C8D4E3", "linecolor": "#C8D4E3", "endlinecolor": "#2a3f5f", "minorgridcolor": "#C8D4E3", "startlinecolor": "#2a3f5f" }, "baxis": { "gridcolor": "#C8D4E3", "linecolor": "#C8D4E3", "endlinecolor": "#2a3f5f", "minorgridcolor": "#C8D4E3", "startlinecolor": "#2a3f5f" } } ], "mesh3d": [ { "type": "mesh3d", "colorbar": { "ticks": "", "outlinewidth": 0 } } ], "contour": [ { "type": "contour", "colorbar": { "ticks": "", "outlinewidth": 0 }, "autocolorscale": true } ], "heatmap": [ { "type": "heatmap", "colorbar": { "ticks": "", "outlinewidth": 0 }, "autocolorscale": true } ], "scatter": [ { "type": "scatter", "marker": { "colorbar": { "ticks": "", "outlinewidth": 0 } } } ], "surface": [ { "type": "surface", "colorbar": { "ticks": "", "outlinewidth": 0 } } ], "heatmapgl": [ { "type": "heatmapgl", "colorbar": { "ticks": "", "outlinewidth": 0 } } ], "histogram": [ { "type": "histogram", "marker": { "colorbar": { "ticks": "", "outlinewidth": 0 } } } ], "parcoords": [ { "line": { "colorbar": { "ticks": "", "outlinewidth": 0 } }, "type": "parcoords" } ], "scatter3d": [ { "type": "scatter3d", "marker": { "colorbar": { "ticks": "", "outlinewidth": 0 } } } ], "scattergl": [ { "type": "scattergl", "marker": { "colorbar": { "ticks": "", "outlinewidth": 0 } } } ], "choropleth": [ { "type": "choropleth", "colorbar": { "ticks": "", "outlinewidth": 0 } } ], "scattergeo": [ { "type": "scattergeo", "marker": { "colorbar": { "ticks": "", "outlinewidth": 0 } } } ], "histogram2d": [ { "type": "histogram2d", "colorbar": { "ticks": "", "outlinewidth": 0 }, "autocolorscale": true } ], "scatterpolar": [ { "type": "scatterpolar", "marker": { "colorbar": { "ticks": "", "outlinewidth": 0 } } } ], "contourcarpet": [ { "type": "contourcarpet", "colorbar": { "ticks": "", "outlinewidth": 0 } } ], "scattercarpet": [ { "type": "scattercarpet", "marker": { "colorbar": { "ticks": "", "outlinewidth": 0 } } } ], "scattermapbox": [ { "type": "scattermapbox", "marker": { "colorbar": { "ticks": "", "outlinewidth": 0 } } } ], "scatterpolargl": [ { "type": "scatterpolargl", "marker": { "colorbar": { "ticks": "", "outlinewidth": 0 } } } ], "scatterternary": [ { "type": "scatterternary", "marker": { "colorbar": { "ticks": "", "outlinewidth": 0 } } } ], "histogram2dcontour": [ { "type": "histogram2dcontour", "colorbar": { "ticks": "", "outlinewidth": 0 }, "autocolorscale": true } ] }, "layout": { "geo": { "bgcolor": "white", "showland": true, "lakecolor": "white", "landcolor": "white", "showlakes": true, "subunitcolor": "#C8D4E3" }, "font": { "color": "#2a3f5f" }, "polar": { "bgcolor": "white", "radialaxis": { "ticks": "", "gridcolor": "#EBF0F8", "linecolor": "#EBF0F8" }, "angularaxis": { "ticks": "", "gridcolor": "#EBF0F8", "linecolor": "#EBF0F8" } }, "scene": { "xaxis": { "ticks": "", "gridcolor": "#DFE8F3", "gridwidth": 2, "linecolor": "#EBF0F8", "zerolinecolor": "#EBF0F8", "showbackground": true, "backgroundcolor": "white" }, "yaxis": { "ticks": "", "gridcolor": "#DFE8F3", "gridwidth": 2, "linecolor": "#EBF0F8", "zerolinecolor": "#EBF0F8", "showbackground": true, "backgroundcolor": "white" }, "zaxis": { "ticks": "", "gridcolor": "#DFE8F3", "gridwidth": 2, "linecolor": "#EBF0F8", "zerolinecolor": "#EBF0F8", "showbackground": true, "backgroundcolor": "white" } }, "title": { "x": 0.05 }, "xaxis": { "ticks": "", "gridcolor": "#EBF0F8", "linecolor": "#EBF0F8", "automargin": true, "zerolinecolor": "#EBF0F8", "zerolinewidth": 2 }, "yaxis": { "ticks": "", "gridcolor": "#EBF0F8", "linecolor": "#EBF0F8", "automargin": true, "zerolinecolor": "#EBF0F8", "zerolinewidth": 2 }, "ternary": { "aaxis": { "ticks": "", "gridcolor": "#DFE8F3", "linecolor": "#A2B1C6" }, "baxis": { "ticks": "", "gridcolor": "#DFE8F3", "linecolor": "#A2B1C6" }, "caxis": { "ticks": "", "gridcolor": "#DFE8F3", "linecolor": "#A2B1C6" }, "bgcolor": "white" }, "colorway": [ "#636efa", "#EF553B", "#00cc96", "#ab63fa", "#19d3f3", "#e763fa", "#fecb52", "#ffa15a", "#ff6692", "#b6e880" ], "hovermode": "closest", "colorscale": { "diverging": [ [ 0, "#8e0152" ], [ 0.1, "#c51b7d" ], [ 0.2, "#de77ae" ], [ 0.3, "#f1b6da" ], [ 0.4, "#fde0ef" ], [ 0.5, "#f7f7f7" ], [ 0.6, "#e6f5d0" ], [ 0.7, "#b8e186" ], [ 0.8, "#7fbc41" ], [ 0.9, "#4d9221" ], [ 1, "#276419" ] ], "sequential": [ [ 0, "#0508b8" ], [ 0.0893854748603352, "#1910d8" ], [ 0.1787709497206704, "#3c19f0" ], [ 0.2681564245810056, "#6b1cfb" ], [ 0.3575418994413408, "#981cfd" ], [ 0.44692737430167595, "#bf1cfd" ], [ 0.5363128491620112, "#dd2bfd" ], [ 0.6256983240223464, "#f246fe" ], [ 0.7150837988826816, "#fc67fd" ], [ 0.8044692737430168, "#fe88fc" ], [ 0.8938547486033519, "#fea5fd" ], [ 0.9832402234636871, "#febefe" ], [ 1, "#fec3fe" ] ], "sequentialminus": [ [ 0, "#0508b8" ], [ 0.0893854748603352, "#1910d8" ], [ 0.1787709497206704, "#3c19f0" ], [ 0.2681564245810056, "#6b1cfb" ], [ 0.3575418994413408, "#981cfd" ], [ 0.44692737430167595, "#bf1cfd" ], [ 0.5363128491620112, "#dd2bfd" ], [ 0.6256983240223464, "#f246fe" ], [ 0.7150837988826816, "#fc67fd" ], [ 0.8044692737430168, "#fe88fc" ], [ 0.8938547486033519, "#fea5fd" ], [ 0.9832402234636871, "#febefe" ], [ 1, "#fec3fe" ] ] }, "plot_bgcolor": "white", "paper_bgcolor": "white", "shapedefaults": { "line": { "width": 0 }, "opacity": 0.4, "fillcolor": "#506784" }, "annotationdefaults": { "arrowhead": 0, "arrowcolor": "#506784", "arrowwidth": 1 } }, "themeRef": "PLOTLY_WHITE" } } }, "height": null, "width": null, "user": { "profile_url": "https://chart-studio.plotly.com/~handigital", "avatar_url": "https://storage.googleapis.com/plotly-prod-profiles/77.jpg", "background_url": "https://storage.googleapis.com/plotly-prod-profiles/bg-2.jpg", "bio": "", "nickname": "", "website": "", "stream_tokens": null, "feature_set_id": null, "csrf_token": null, "date_joined": "2025-08-11 11:45:18", "mapbox_access_tokens": null, "has_password": null, "username": "handigital", "email": null, "is_active": null, "readonly": null, "is_dash_creator": null, "dash_created_count": null, "is_chart_creator": null, "charts_created_count": null } } ] }
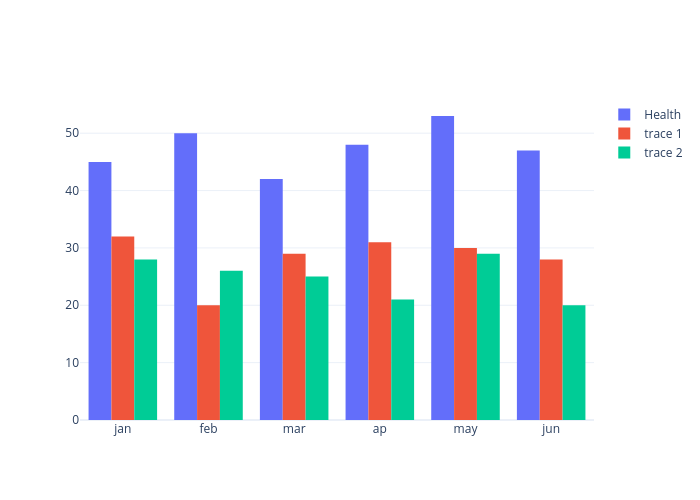