Plots List
Plots
This endpoint handles manipulation of Plotly plot files.
Reference
Authorization
Any user with or without a Plotly account may view public plots. For private plots, see authentication.
Actions
list
Listing all public plots can be done via a GET request to this endpoint.
By default, plots will be listed in order of date created. The order_by
query parameter is accepted at this endpoint. Currently, only ordering by
views is supported. It is possible to filter the plots by quality
with min_quality or max_quality as query parameter.
Example:
// GET https://api.plotly.com/v2/plots/ ---> 200

// GET https://api.plotly.com/v2/plots/?order_by=-views ---> 200

// GET https://api.plotly.com/v2/plots/?min_quality=5 ---> 200

// GET https://api.plotly.com/v2/plots/?max_quality=5 ---> 200
feed
Listing all handpicked feed plots can be done via a GET request to this endpoint. By default, plots will be listed in a random order.
Example:
// GET https://api.plotly.com/v2/plots/feed ---> 200
create
You can create new plot resources here. The only required field is 'figure'. Currently, the figure is restricted to only contain references to grid data. That is, this will fail if raw data arrays are passed in. To create and manipulate underlying grids for plots, see the grids endpoint.
Example:
// This fails because a figure field is required.
// POST https://api.plotly.com/v2/plots ---> 400 Bad Request
{}

// This fails because the figure has raw data
//POST https://api.plotly.com/v2/plots ---> 400 Bad Request
{
    "figure": {"data": [{"y": ['this', 'is', 'raw', 'data']}]}
}

// This succeeds because the figure has src keys, not raw data.
//POST https://api.plotly.com/v2/plots ---> 200 OK
{
    "figure": {"data": [{"ysrc": "sven:88:u8nd62"}]}
}
When creating a grid, you can optionally specify a source_fid to specify where a plot has come from:
- source_fid: the fid of a plot that was copied (and presumably edited) to produce this one
detail
There is a lot of meta information stored about plot files including filename, title, share_url, and content_url to name a few.
This information can only be reached with a GET to this endpoint.
Example:
// GET https://api.plotly.com/v2/plots/iheartgraphs:90
content
The contents of a plot can be downloaded via the content resource. The plot
content contains referenced grid/column data by default. If you wish to
return the raw grid/column data, the inline_data=true query must be included
in the request url. The Content-Type header will be appropriately set for the
response body.
Alternatively, you can set ?map_data=unreadable to append a mapping of
sources to data that belongs to grids which are unreadable for the
requestor. This is useful when you have read access to another users plot,
but that plot contains grid references which you don't have access to.
Examples:
// Returns referenced grid/column data
// GET https://api.plotly.com/v2/plots/iheartgraphs:90/content ---> 200 OK

// Returns full grid/column data
// GET https://api.plotly.com/v2/plots/iheartgraphs:90/content?inline_data=true ---> 200 OK

// Returns full grid/column data when requestor doesn't have permission
// to read the referenced grid.
// GET https://api.plotly.com/v2/plots/iheartgraphs:90/content?map_data=unreadable ---> 200 OK
GET /v2/plots/?cursor=cj0xJnA9MjAyNS0wOS0wMisxMSUzQTAzJTNBNTkuNjkwMzgzJTJCMDAlM0EwMA%3D%3D&format=api
{ "next": "https://api.plotly.com/v2/plots/?cursor=cD0yMDI1LTA5LTAyKzExJTNBMDUlM0EwNC4xNjQyNTklMkIwMCUzQTAw&format=api", "previous": "https://api.plotly.com/v2/plots/?cursor=cj0xJnA9MjAyNS0wOS0wMisxMyUzQTE4JTNBMDguNDIxMDUwJTJCMDAlM0EwMA%3D%3D&format=api", "results": [ { "creation_time": "2025-09-02T13:18:08.421050Z", "comments": { "results": [], "count": 0 }, "parented": true, "embed_url": "https://chart-studio.plotly.com/~sruthiwimi/95.embed", "fid": "sruthiwimi:95", "filename": "pHRR 5.3", "filetype": "plot", "img_url": "https://storage.googleapis.com/plotly-prod-images/sruthiwimi/95/9_ZPOR66WLTGQSS9CULGFGBSPUX6ORHU.png", "image_urls": { "default": "https://api.plotly.com/v2/files/sruthiwimi:95/image?image_name=default", "block-thumb": "https://api.plotly.com/v2/files/sruthiwimi:95/image?image_name=block-thumb", "list-thumb": "https://storage.googleapis.com/plotly-prod-images/sruthiwimi/95/9_ZPOR66WLTGQSS9CULGFGBSPUX6ORHU.png" }, "api_urls": { "files": "https://api.plotly.com/v2/files/sruthiwimi:95", "plots": "https://api.plotly.com/v2/plots/sruthiwimi:95", "parent": "https://api.plotly.com/v2/folders/home?user=sruthiwimi" }, "owner": "sruthiwimi", "parent": -1, "preview": "", "referencers": [], "references": [], "title": "", "views": 0, "web_url": "https://chart-studio.plotly.com/~sruthiwimi/95/", "world_readable": true, "date_modified": "2025-09-03T08:05:30.444Z", "stars": { "results": [], "count": 0 }, "collaborators": { "results": [], "count": 0 }, "subfolder_count": null, "refresh_interval": null, "organize_view_url": "https://chart-studio.plotly.com/~sruthiwimi/95/", "current_user_permission": "read", "is_theme": null, "is_template": false, "autosize": true, "caption": "", "figure": { "data": [ { "meta": { "columnNames": { "x": "A", "y": "B", "error_y": { "array": "D" } } }, "mode": "markers", "type": "bar", "xsrc": "sruthiwimi:94:2b10b9", "ysrc": "sruthiwimi:94:1fde49", "yaxis": "y", "marker": { "color": "rgb(60, 60, 66)" }, "error_y": { "meta": { "columnNames": { "array": "D" } }, "type": "data", "color": "#444", "value": 10, "width": 4, "visible": true, "arraysrc": "sruthiwimi:94:7d625f", "symmetric": true, "thickness": 2, "valueminus": 10 }, "orientation": "v" } ], "frames": [], "layout": { "xaxis": { "type": "linear", "range": [ -5, 55 ], "ticks": "inside", "title": { "font": { "size": 25, "family": "Arial" }, "text": "APPInsi % w/w" }, "domain": [ 0, 0.5 ], "mirror": "ticks", "showgrid": false, "showline": true, "tickfont": { "size": 25, "family": "Arial" }, "autorange": true, "linecolor": "rgb(63, 64, 66)", "linewidth": 1 }, "yaxis": { "type": "linear", "range": [ 0, 1470.5263157894738 ], "ticks": "inside", "title": { "font": { "size": 25, "family": "Arial" }, "text": "pHRR / kWm<sup>-2</sup>" }, "domain": [ 0.25, 1 ], "mirror": "ticks", "showgrid": false, "showline": true, "tickfont": { "size": 25, "family": "Arial" }, "autorange": true, "linecolor": "rgb(63, 64, 66)", "linewidth": 1 }, "barmode": "group", "autosize": true, "template": { "data": { "bar": [ { "type": "bar", "marker": { "colorbar": { "ticks": "", "outlinewidth": 0 } } } ], "table": [ { "type": "table", "cells": { "fill": { "color": "#EBF0F8" }, "line": { "color": "white" } }, "header": { "fill": { "color": "#C8D4E3" }, "line": { "color": "white" } } } ], "carpet": [ { "type": "carpet", "aaxis": { "gridcolor": "#C8D4E3", "linecolor": "#C8D4E3", "endlinecolor": "#2a3f5f", "minorgridcolor": "#C8D4E3", "startlinecolor": "#2a3f5f" }, "baxis": { "gridcolor": "#C8D4E3", "linecolor": "#C8D4E3", "endlinecolor": "#2a3f5f", "minorgridcolor": "#C8D4E3", "startlinecolor": "#2a3f5f" } } ], "mesh3d": [ { "type": "mesh3d", "colorbar": { "ticks": "", "outlinewidth": 0 } } ], "contour": [ { "type": "contour", "colorbar": { "ticks": "", "outlinewidth": 0 }, "autocolorscale": true } ], "heatmap": [ { "type": "heatmap", "colorbar": { "ticks": "", "outlinewidth": 0 }, "autocolorscale": true } ], "scatter": [ { "type": "scatter", "marker": { "colorbar": { "ticks": "", "outlinewidth": 0 } } } ], "surface": [ { "type": "surface", "colorbar": { "ticks": "", "outlinewidth": 0 } } ], "heatmapgl": [ { "type": "heatmapgl", "colorbar": { "ticks": "", "outlinewidth": 0 } } ], "histogram": [ { "type": "histogram", "marker": { "colorbar": { "ticks": "", "outlinewidth": 0 } } } ], "parcoords": [ { "line": { "colorbar": { "ticks": "", "outlinewidth": 0 } }, "type": "parcoords" } ], "scatter3d": [ { "type": "scatter3d", "marker": { "colorbar": { "ticks": "", "outlinewidth": 0 } } } ], "scattergl": [ { "type": "scattergl", "marker": { "colorbar": { "ticks": "", "outlinewidth": 0 } } } ], "choropleth": [ { "type": "choropleth", "colorbar": { "ticks": "", "outlinewidth": 0 } } ], "scattergeo": [ { "type": "scattergeo", "marker": { "colorbar": { "ticks": "", "outlinewidth": 0 } } } ], "histogram2d": [ { "type": "histogram2d", "colorbar": { "ticks": "", "outlinewidth": 0 }, "autocolorscale": true } ], "scatterpolar": [ { "type": "scatterpolar", "marker": { "colorbar": { "ticks": "", "outlinewidth": 0 } } } ], "contourcarpet": [ { "type": "contourcarpet", "colorbar": { "ticks": "", "outlinewidth": 0 } } ], "scattercarpet": [ { "type": "scattercarpet", "marker": { "colorbar": { "ticks": "", "outlinewidth": 0 } } } ], "scattermapbox": [ { "type": "scattermapbox", "marker": { "colorbar": { "ticks": "", "outlinewidth": 0 } } } ], "scatterpolargl": [ { "type": "scatterpolargl", "marker": { "colorbar": { "ticks": "", "outlinewidth": 0 } } } ], "scatterternary": [ { "type": "scatterternary", "marker": { "colorbar": { "ticks": "", "outlinewidth": 0 } } } ], "histogram2dcontour": [ { "type": "histogram2dcontour", "colorbar": { "ticks": "", "outlinewidth": 0 }, "autocolorscale": true } ] }, "layout": { "geo": { "bgcolor": "white", "showland": true, "lakecolor": "white", "landcolor": "white", "showlakes": true, "subunitcolor": "#C8D4E3" }, "font": { "color": "#2a3f5f" }, "polar": { "bgcolor": "white", "radialaxis": { "ticks": "", "gridcolor": "#EBF0F8", "linecolor": "#EBF0F8" }, "angularaxis": { "ticks": "", "gridcolor": "#EBF0F8", "linecolor": "#EBF0F8" } }, "scene": { "xaxis": { "ticks": "", "gridcolor": "#DFE8F3", "gridwidth": 2, "linecolor": "#EBF0F8", "zerolinecolor": "#EBF0F8", "showbackground": true, "backgroundcolor": "white" }, "yaxis": { "ticks": "", "gridcolor": "#DFE8F3", "gridwidth": 2, "linecolor": "#EBF0F8", "zerolinecolor": "#EBF0F8", "showbackground": true, "backgroundcolor": "white" }, "zaxis": { "ticks": "", "gridcolor": "#DFE8F3", "gridwidth": 2, "linecolor": "#EBF0F8", "zerolinecolor": "#EBF0F8", "showbackground": true, "backgroundcolor": "white" } }, "title": { "x": 0.05 }, "xaxis": { "ticks": "", "gridcolor": "#EBF0F8", "linecolor": "#EBF0F8", "automargin": true, "zerolinecolor": "#EBF0F8", "zerolinewidth": 2 }, "yaxis": { "ticks": "", "gridcolor": "#EBF0F8", "linecolor": "#EBF0F8", "automargin": true, "zerolinecolor": "#EBF0F8", "zerolinewidth": 2 }, "ternary": { "aaxis": { "ticks": "", "gridcolor": "#DFE8F3", "linecolor": "#A2B1C6" }, "baxis": { "ticks": "", "gridcolor": "#DFE8F3", "linecolor": "#A2B1C6" }, "caxis": { "ticks": "", "gridcolor": "#DFE8F3", "linecolor": "#A2B1C6" }, "bgcolor": "white" }, "colorway": [ "#636efa", "#EF553B", "#00cc96", "#ab63fa", "#19d3f3", "#e763fa", "#fecb52", "#ffa15a", "#ff6692", "#b6e880" ], "hovermode": "closest", "colorscale": { "diverging": [ [ 0, "#8e0152" ], [ 0.1, "#c51b7d" ], [ 0.2, "#de77ae" ], [ 0.3, "#f1b6da" ], [ 0.4, "#fde0ef" ], [ 0.5, "#f7f7f7" ], [ 0.6, "#e6f5d0" ], [ 0.7, "#b8e186" ], [ 0.8, "#7fbc41" ], [ 0.9, "#4d9221" ], [ 1, "#276419" ] ], "sequential": [ [ 0, "#0508b8" ], [ 0.0893854748603352, "#1910d8" ], [ 0.1787709497206704, "#3c19f0" ], [ 0.2681564245810056, "#6b1cfb" ], [ 0.3575418994413408, "#981cfd" ], [ 0.44692737430167595, "#bf1cfd" ], [ 0.5363128491620112, "#dd2bfd" ], [ 0.6256983240223464, "#f246fe" ], [ 0.7150837988826816, "#fc67fd" ], [ 0.8044692737430168, "#fe88fc" ], [ 0.8938547486033519, "#fea5fd" ], [ 0.9832402234636871, "#febefe" ], [ 1, "#fec3fe" ] ], "sequentialminus": [ [ 0, "#0508b8" ], [ 0.0893854748603352, "#1910d8" ], [ 0.1787709497206704, "#3c19f0" ], [ 0.2681564245810056, "#6b1cfb" ], [ 0.3575418994413408, "#981cfd" ], [ 0.44692737430167595, "#bf1cfd" ], [ 0.5363128491620112, "#dd2bfd" ], [ 0.6256983240223464, "#f246fe" ], [ 0.7150837988826816, "#fc67fd" ], [ 0.8044692737430168, "#fe88fc" ], [ 0.8938547486033519, "#fea5fd" ], [ 0.9832402234636871, "#febefe" ], [ 1, "#fec3fe" ] ] }, "plot_bgcolor": "white", "paper_bgcolor": "white", "shapedefaults": { "line": { "width": 0 }, "opacity": 0.4, "fillcolor": "#506784" }, "annotationdefaults": { "arrowhead": 0, "arrowcolor": "#506784", "arrowwidth": 1 } }, "themeRef": "PLOTLY_WHITE" }, "bargroupgap": 0.08 } }, "height": null, "width": null, "user": { "profile_url": "https://chart-studio.plotly.com/~sruthiwimi", "avatar_url": "https://storage.googleapis.com/plotly-prod-profiles/90.jpg", "background_url": "https://storage.googleapis.com/plotly-prod-profiles/bg-13.jpg", "bio": "", "nickname": "", "website": "", "stream_tokens": null, "feature_set_id": null, "csrf_token": null, "date_joined": "2022-01-13 16:37:50", "mapbox_access_tokens": null, "has_password": null, "username": "sruthiwimi", "email": null, "is_active": null, "readonly": null, "is_dash_creator": null, "dash_created_count": null, "is_chart_creator": null, "charts_created_count": null } }, { "creation_time": "2025-09-02T13:09:24.543583Z", "comments": { "results": [], "count": 0 }, "parented": true, "embed_url": "https://chart-studio.plotly.com/~GuidoGabriel/1.embed", "fid": "GuidoGabriel:1", "filename": "Plot 1", "filetype": "plot", "img_url": "https://storage.googleapis.com/plotly-prod-images/GuidoGabriel/1/9_HG9GRBG5QH6P9LQ02M1DYN93K4TBD6.png", "image_urls": { "default": "https://storage.googleapis.com/plotly-prod-images/GuidoGabriel/1/2_6OUKACEU5I0BOT1HTYHKWOM6ZVOMTK.png", "block-thumb": "https://storage.googleapis.com/plotly-prod-images/GuidoGabriel/1/8_F7581EJVB8KGE8GJXFGK7BML8KGRIR.png", "list-thumb": "https://storage.googleapis.com/plotly-prod-images/GuidoGabriel/1/9_HG9GRBG5QH6P9LQ02M1DYN93K4TBD6.png" }, "api_urls": { "files": "https://api.plotly.com/v2/files/GuidoGabriel:1", "plots": "https://api.plotly.com/v2/plots/GuidoGabriel:1", "parent": "https://api.plotly.com/v2/folders/home?user=GuidoGabriel" }, "owner": "GuidoGabriel", "parent": -1, "preview": "", "referencers": [], "references": [], "title": "", "views": 0, "web_url": "https://chart-studio.plotly.com/~GuidoGabriel/1/", "world_readable": true, "date_modified": "2025-09-02T13:09:24.555Z", "stars": { "results": [], "count": 0 }, "collaborators": { "results": [], "count": 0 }, "subfolder_count": null, "refresh_interval": null, "organize_view_url": "https://chart-studio.plotly.com/~GuidoGabriel/1/", "current_user_permission": "read", "is_theme": null, "is_template": false, "autosize": true, "caption": "", "figure": { "data": [ { "meta": { "columnNames": { "x": "x", "y": "y" } }, "mode": "lines", "type": "scatter", "xsrc": "GuidoGabriel:0:6d6362", "ysrc": "GuidoGabriel:0:cbadef" } ], "frames": [], "layout": { "xaxis": { "type": "linear", "range": [ 0.19940594059405947, 1.6945158936946325 ], "autorange": true }, "yaxis": { "type": "linear", "range": [ -49.28674841796135, 1100.4391364641046 ], "autorange": true }, "autosize": true } }, "height": null, "width": null, "user": { "profile_url": "https://chart-studio.plotly.com/~GuidoGabriel", "avatar_url": "https://storage.googleapis.com/plotly-prod-profiles/66.jpg", "background_url": "https://storage.googleapis.com/plotly-prod-profiles/bg-5.jpg", "bio": "", "nickname": "", "website": "", "stream_tokens": null, "feature_set_id": null, "csrf_token": null, "date_joined": "2025-09-02 13:06:16", "mapbox_access_tokens": null, "has_password": null, "username": "GuidoGabriel", "email": null, "is_active": null, "readonly": null, "is_dash_creator": null, "dash_created_count": null, "is_chart_creator": null, "charts_created_count": null } }, { "creation_time": "2025-09-02T12:42:20.277914Z", "comments": { "results": [], "count": 0 }, "parented": true, "embed_url": "https://chart-studio.plotly.com/~duganivan/30.embed", "fid": "duganivan:30", "filename": "Plot 30", "filetype": "plot", "img_url": "https://api.plotly.com/v2/files/duganivan:30/image?image_name=list-thumb", "image_urls": { "default": "https://storage.googleapis.com/plotly-prod-images/duganivan/30/2_SSRR44TWMJQJEYCY3OZ3SEIWEZ63M8.png", "block-thumb": "https://storage.googleapis.com/plotly-prod-images/duganivan/30/8_O76UGGJO6HLJN9B27ZXDBAFC6O4BS3.png", "list-thumb": "https://api.plotly.com/v2/files/duganivan:30/image?image_name=list-thumb" }, "api_urls": { "files": "https://api.plotly.com/v2/files/duganivan:30", "plots": "https://api.plotly.com/v2/plots/duganivan:30", "parent": "https://api.plotly.com/v2/folders/home?user=duganivan" }, "owner": "duganivan", "parent": -1, "preview": "", "referencers": [], "references": [], "title": "", "views": 0, "web_url": "https://chart-studio.plotly.com/~duganivan/30/", "world_readable": true, "date_modified": "2025-09-02T12:42:20.289Z", "stars": { "results": [], "count": 0 }, "collaborators": { "results": [], "count": 0 }, "subfolder_count": null, "refresh_interval": null, "organize_view_url": "https://chart-studio.plotly.com/~duganivan/30/", "current_user_permission": "read", "is_theme": null, "is_template": false, "autosize": true, "caption": "", "figure": { "data": [ { "meta": { "columnNames": { "x": "A", "y": "B" } }, "mode": "markers", "type": "box", "xsrc": "duganivan:29:e9b54c", "ysrc": "duganivan:29:e6e8c3", "marker": { "line": { "color": "rgb(0, 0, 0)", "width": 2 }, "size": 10, "color": "rgb(17, 106, 187)" }, "opacity": 1, "boxpoints": "all" }, { "meta": { "columnNames": { "x": "C", "y": "D" } }, "type": "box", "xsrc": "duganivan:29:7c2c4a", "ysrc": "duganivan:29:421cda", "marker": { "line": { "color": "rgb(0, 0, 0)", "width": 2 }, "size": 10, "color": "rgb(15, 188, 18)" }, "boxpoints": "all" }, { "line": { "color": "rgb(250, 8, 55)" }, "meta": { "columnNames": { "x": "E", "y": "F" } }, "type": "box", "xsrc": "duganivan:29:98743c", "ysrc": "duganivan:29:a848fa", "marker": { "line": { "color": "rgb(0, 0, 0)", "width": 2 }, "size": 10, "color": "rgb(193, 24, 46)" }, "boxpoints": "all" }, { "line": { "color": "rgb(171, 138, 90)" }, "meta": { "columnNames": { "x": "G", "y": "H" } }, "type": "box", "xsrc": "duganivan:29:510e1e", "ysrc": "duganivan:29:341e0a", "marker": { "line": { "width": 2 }, "size": 10 }, "notched": false, "boxpoints": "all" }, { "meta": { "columnNames": { "x": "I", "y": "J" } }, "type": "box", "xsrc": "duganivan:29:c02ac5", "ysrc": "duganivan:29:7d4586", "marker": { "line": { "width": 2 }, "size": 10 }, "boxpoints": "all" }, { "meta": { "columnNames": { "x": "K", "y": "L" } }, "type": "box", "xsrc": "duganivan:29:25cf7f", "ysrc": "duganivan:29:4939ae", "marker": { "line": { "width": 2 }, "size": 10 }, "boxpoints": "all" }, { "type": "box", "boxpoints": false }, { "type": "box", "boxpoints": false }, { "type": "box", "boxpoints": false } ], "frames": [], "layout": { "font": { "size": 31 }, "title": { "text": "" }, "xaxis": { "type": "category", "range": [ -0.5242718446601942, 5.5 ], "title": { "font": { "size": 34, "color": "rgb(0, 0, 0)", "family": "Arial" }, "text": "Treatment" }, "tickfont": { "size": 34, "color": "rgb(0, 0, 0)", "family": "Arial" }, "autorange": true }, "yaxis": { "type": "linear", "range": [ -3.018333333333333, 49.34833333333333 ], "title": { "font": { "size": 34, "color": "rgb(0, 0, 0)", "family": "Arial" }, "text": "<b>C-CO</b><sub><b>2</b></sub><b> (kg ha</b><sup><b>-1</b></sup><b> day</b><sup><b>-1</b></sup><b>)</b>" }, "tickfont": { "size": 26, "color": "rgb(0, 0, 0)", "family": "Arial" }, "autorange": false }, "autosize": true, "template": { "data": { "bar": [ { "type": "bar", "marker": { "colorbar": { "len": 0.2, "ticks": "inside", "ticklen": 6, "tickcolor": "rgb(237,237,237)", "outlinewidth": 0 } } } ], "table": [ { "type": "table", "cells": { "fill": { "color": "rgb(237,237,237)" }, "line": { "color": "white" } }, "header": { "fill": { "color": "rgb(217,217,217)" }, "line": { "color": "white" } } } ], "carpet": [ { "type": "carpet", "aaxis": { "gridcolor": "white", "linecolor": "white", "endlinecolor": "rgb(51,51,51)", "minorgridcolor": "white", "startlinecolor": "rgb(51,51,51)" }, "baxis": { "gridcolor": "white", "linecolor": "white", "endlinecolor": "rgb(51,51,51)", "minorgridcolor": "white", "startlinecolor": "rgb(51,51,51)" } } ], "mesh3d": [ { "type": "mesh3d", "colorbar": { "len": 0.2, "ticks": "inside", "ticklen": 6, "tickcolor": "rgb(237,237,237)", "outlinewidth": 0 } } ], "contour": [ { "type": "contour", "colorbar": { "len": 0.2, "ticks": "inside", "ticklen": 6, "tickcolor": "rgb(237,237,237)", "outlinewidth": 0 }, "autocolorscale": true } ], "heatmap": [ { "type": "heatmap", "colorbar": { "len": 0.2, "ticks": "inside", "ticklen": 6, "tickcolor": "rgb(237,237,237)", "outlinewidth": 0 }, "autocolorscale": true } ], "scatter": [ { "type": "scatter", "marker": { "colorbar": { "len": 0.2, "ticks": "inside", "ticklen": 6, "tickcolor": "rgb(237,237,237)", "outlinewidth": 0 } } } ], "surface": [ { "type": "surface", "colorbar": { "len": 0.2, "ticks": "inside", "ticklen": 6, "tickcolor": "rgb(237,237,237)", "outlinewidth": 0 } } ], "heatmapgl": [ { "type": "heatmapgl", "colorbar": { "len": 0.2, "ticks": "inside", "ticklen": 6, "tickcolor": "rgb(237,237,237)", "outlinewidth": 0 } } ], "histogram": [ { "type": "histogram", "marker": { "colorbar": { "len": 0.2, "ticks": "inside", "ticklen": 6, "tickcolor": "rgb(237,237,237)", "outlinewidth": 0 } } } ], "parcoords": [ { "line": { "colorbar": { "len": 0.2, "ticks": "inside", "ticklen": 6, "tickcolor": "rgb(237,237,237)", "outlinewidth": 0 } }, "type": "parcoords" } ], "scatter3d": [ { "type": "scatter3d", "marker": { "colorbar": { "len": 0.2, "ticks": "inside", "ticklen": 6, "tickcolor": "rgb(237,237,237)", "outlinewidth": 0 } } } ], "scattergl": [ { "type": "scattergl", "marker": { "colorbar": { "len": 0.2, "ticks": "inside", "ticklen": 6, "tickcolor": "rgb(237,237,237)", "outlinewidth": 0 } } } ], "choropleth": [ { "type": "choropleth", "colorbar": { "len": 0.2, "ticks": "inside", "ticklen": 6, "tickcolor": "rgb(237,237,237)", "outlinewidth": 0 } } ], "scattergeo": [ { "type": "scattergeo", "marker": { "colorbar": { "len": 0.2, "ticks": "inside", "ticklen": 6, "tickcolor": "rgb(237,237,237)", "outlinewidth": 0 } } } ], "histogram2d": [ { "type": "histogram2d", "colorbar": { "len": 0.2, "ticks": "inside", "ticklen": 6, "tickcolor": "rgb(237,237,237)", "outlinewidth": 0 }, "autocolorscale": true } ], "scatterpolar": [ { "type": "scatterpolar", "marker": { "colorbar": { "len": 0.2, "ticks": "inside", "ticklen": 6, "tickcolor": "rgb(237,237,237)", "outlinewidth": 0 } } } ], "contourcarpet": [ { "type": "contourcarpet", "colorbar": { "len": 0.2, "ticks": "inside", "ticklen": 6, "tickcolor": "rgb(237,237,237)", "outlinewidth": 0 } } ], "scattercarpet": [ { "type": "scattercarpet", "marker": { "colorbar": { "len": 0.2, "ticks": "inside", "ticklen": 6, "tickcolor": "rgb(237,237,237)", "outlinewidth": 0 } } } ], "scattermapbox": [ { "type": "scattermapbox", "marker": { "colorbar": { "len": 0.2, "ticks": "inside", "ticklen": 6, "tickcolor": "rgb(237,237,237)", "outlinewidth": 0 } } } ], "scatterpolargl": [ { "type": "scatterpolargl", "marker": { "colorbar": { "len": 0.2, "ticks": "inside", "ticklen": 6, "tickcolor": "rgb(237,237,237)", "outlinewidth": 0 } } } ], "scatterternary": [ { "type": "scatterternary", "marker": { "colorbar": { "len": 0.2, "ticks": "inside", "ticklen": 6, "tickcolor": "rgb(237,237,237)", "outlinewidth": 0 } } } ], "histogram2dcontour": [ { "type": "histogram2dcontour", "colorbar": { "len": 0.2, "ticks": "inside", "ticklen": 6, "tickcolor": "rgb(237,237,237)", "outlinewidth": 0 }, "autocolorscale": true } ] }, "layout": { "geo": { "bgcolor": "white", "showland": true, "lakecolor": "white", "landcolor": "rgb(237,237,237)", "showlakes": true, "subunitcolor": "white" }, "font": { "color": "rgb(51,51,51)" }, "polar": { "bgcolor": "rgb(237,237,237)", "radialaxis": { "ticks": "outside", "showgrid": true, "gridcolor": "white", "linecolor": "white", "tickcolor": "rgb(51,51,51)" }, "angularaxis": { "ticks": "outside", "showgrid": true, "gridcolor": "white", "linecolor": "white", "tickcolor": "rgb(51,51,51)" } }, "scene": { "xaxis": { "ticks": "outside", "showgrid": true, "gridcolor": "white", "gridwidth": 2, "linecolor": "white", "tickcolor": "rgb(51,51,51)", "zerolinecolor": "white", "showbackground": true, "backgroundcolor": "rgb(237,237,237)" }, "yaxis": { "ticks": "outside", "showgrid": true, "gridcolor": "white", "gridwidth": 2, "linecolor": "white", "tickcolor": "rgb(51,51,51)", "zerolinecolor": "white", "showbackground": true, "backgroundcolor": "rgb(237,237,237)" }, "zaxis": { "ticks": "outside", "showgrid": true, "gridcolor": "white", "gridwidth": 2, "linecolor": "white", "tickcolor": "rgb(51,51,51)", "zerolinecolor": "white", "showbackground": true, "backgroundcolor": "rgb(237,237,237)" } }, "xaxis": { "ticks": "outside", "showgrid": true, "gridcolor": "white", "linecolor": "white", "tickcolor": "rgb(51,51,51)", "automargin": true, "zerolinecolor": "white" }, "yaxis": { "ticks": "outside", "showgrid": true, "gridcolor": "white", "linecolor": "white", "tickcolor": "rgb(51,51,51)", "automargin": true, "zerolinecolor": "white" }, "ternary": { "aaxis": { "ticks": "outside", "showgrid": true, "gridcolor": "white", "linecolor": "white", "tickcolor": "rgb(51,51,51)" }, "baxis": { "ticks": "outside", "showgrid": true, "gridcolor": "white", "linecolor": "white", "tickcolor": "rgb(51,51,51)" }, "caxis": { "ticks": "outside", "showgrid": true, "gridcolor": "white", "linecolor": "white", "tickcolor": "rgb(51,51,51)" }, "bgcolor": "rgb(237,237,237)" }, "colorway": [ "#F8766D", "#A3A500", "#00BF7D", "#00B0F6", "#E76BF3" ], "hovermode": "closest", "colorscale": { "diverging": [ [ 0, "#40004b" ], [ 0.1, "#762a83" ], [ 0.2, "#9970ab" ], [ 0.3, "#c2a5cf" ], [ 0.4, "#e7d4e8" ], [ 0.5, "#f7f7f7" ], [ 0.6, "#d9f0d3" ], [ 0.7, "#a6dba0" ], [ 0.8, "#5aae61" ], [ 0.9, "#1b7837" ], [ 1, "#00441b" ] ], "sequential": [ [ 0, "rgb(20,44,66)" ], [ 1, "rgb(90,179,244)" ] ], "sequentialminus": [ [ 0, "rgb(20,44,66)" ], [ 1, "rgb(90,179,244)" ] ] }, "plot_bgcolor": "rgb(237,237,237)", "paper_bgcolor": "white", "shapedefaults": { "line": { "width": 0 }, "opacity": 0.3, "fillcolor": "black" }, "annotationdefaults": { "arrowhead": 0, "arrowwidth": 1 } }, "themeRef": "GGPLOT2" }, "showlegend": false, "boxgroupgap": 0.3 } }, "height": null, "width": null, "user": { "profile_url": "https://chart-studio.plotly.com/~duganivan", "avatar_url": "https://storage.googleapis.com/plotly-prod-profiles/20.jpg", "background_url": "https://storage.googleapis.com/plotly-prod-profiles/bg-8.jpg", "bio": "", "nickname": "", "website": "", "stream_tokens": null, "feature_set_id": null, "csrf_token": null, "date_joined": "2022-01-06 09:56:45", "mapbox_access_tokens": null, "has_password": null, "username": "duganivan", "email": null, "is_active": null, "readonly": null, "is_dash_creator": null, "dash_created_count": null, "is_chart_creator": null, "charts_created_count": null } }, { "creation_time": "2025-09-02T12:41:25.306793Z", "comments": { "results": [], "count": 0 }, "parented": true, "embed_url": "https://chart-studio.plotly.com/~duganivan/28.embed", "fid": "duganivan:28", "filename": "Plot 28", "filetype": "plot", "img_url": "https://storage.googleapis.com/plotly-prod-images/duganivan/28/9_D16ZCX4QFJIN65YFEOZKG5FEBZJDXG.png", "image_urls": { "default": "https://storage.googleapis.com/plotly-prod-images/duganivan/28/2_CFOB367M9YJX5I421L8BL87OZ9MOHJ.png", "block-thumb": "https://storage.googleapis.com/plotly-prod-images/duganivan/28/8_UAXUE1YR8R81W0KCUDH1Q6QJF5WI6X.png", "list-thumb": "https://storage.googleapis.com/plotly-prod-images/duganivan/28/9_D16ZCX4QFJIN65YFEOZKG5FEBZJDXG.png" }, "api_urls": { "files": "https://api.plotly.com/v2/files/duganivan:28", "plots": "https://api.plotly.com/v2/plots/duganivan:28", "parent": "https://api.plotly.com/v2/folders/home?user=duganivan" }, "owner": "duganivan", "parent": -1, "preview": "", "referencers": [], "references": [], "title": "", "views": 0, "web_url": "https://chart-studio.plotly.com/~duganivan/28/", "world_readable": true, "date_modified": "2025-09-02T12:41:25.319Z", "stars": { "results": [], "count": 0 }, "collaborators": { "results": [], "count": 0 }, "subfolder_count": null, "refresh_interval": null, "organize_view_url": "https://chart-studio.plotly.com/~duganivan/28/", "current_user_permission": "read", "is_theme": null, "is_template": false, "autosize": true, "caption": "", "figure": { "data": [ { "meta": { "columnNames": { "x": "A", "y": "B" } }, "mode": "markers", "type": "box", "xsrc": "duganivan:27:8a2349", "ysrc": "duganivan:27:1f5b1d", "marker": { "line": { "color": "rgb(0, 0, 0)", "width": 2 }, "size": 10, "color": "rgb(17, 106, 187)" }, "opacity": 1, "boxpoints": "all" }, { "meta": { "columnNames": { "x": "C", "y": "D" } }, "type": "box", "xsrc": "duganivan:27:a8d789", "ysrc": "duganivan:27:acec57", "marker": { "line": { "color": "rgb(0, 0, 0)", "width": 2 }, "size": 10, "color": "rgb(15, 188, 18)" }, "boxpoints": "all" }, { "line": { "color": "rgb(250, 8, 55)" }, "meta": { "columnNames": { "x": "E", "y": "F" } }, "type": "box", "xsrc": "duganivan:27:50e491", "ysrc": "duganivan:27:03cf92", "marker": { "line": { "color": "rgb(0, 0, 0)", "width": 2 }, "size": 10, "color": "rgb(193, 24, 46)" }, "boxpoints": "all" }, { "line": { "color": "rgb(171, 138, 90)" }, "meta": { "columnNames": { "x": "G", "y": "H" } }, "type": "box", "xsrc": "duganivan:27:b2ef60", "ysrc": "duganivan:27:8ceec7", "marker": { "line": { "width": 2 }, "size": 10 }, "notched": false, "boxpoints": "all" }, { "meta": { "columnNames": { "x": "I", "y": "J" } }, "type": "box", "xsrc": "duganivan:27:6f05af", "ysrc": "duganivan:27:dc3151", "marker": { "line": { "width": 2 }, "size": 10 }, "boxpoints": "all" }, { "meta": { "columnNames": { "x": "K", "y": "L" } }, "type": "box", "xsrc": "duganivan:27:b02fc6", "ysrc": "duganivan:27:76a546", "marker": { "line": { "width": 2 }, "size": 10 }, "boxpoints": "all" }, { "type": "box", "boxpoints": false }, { "type": "box", "boxpoints": false }, { "type": "box", "boxpoints": false } ], "frames": [], "layout": { "font": { "size": 31 }, "title": { "text": "Abandoned\n land" }, "xaxis": { "type": "category", "range": [ -0.5242718446601942, 5.5 ], "title": { "font": { "size": 34, "color": "rgb(0, 0, 0)", "family": "Arial" }, "text": "Treatment" }, "tickfont": { "size": 34, "color": "rgb(0, 0, 0)", "family": "Arial" }, "autorange": true }, "yaxis": { "type": "linear", "range": [ -3.018333333333333, 49.34833333333333 ], "title": { "font": { "size": 34, "color": "rgb(0, 0, 0)", "family": "Arial" }, "text": "<b>C-CO</b><sub><b>2</b></sub><b> (kg ha</b><sup><b>-1</b></sup><b> day</b><sup><b>-1</b></sup><b>)</b>" }, "tickfont": { "size": 26, "color": "rgb(0, 0, 0)", "family": "Arial" }, "autorange": false }, "autosize": true, "template": { "data": { "bar": [ { "type": "bar", "marker": { "colorbar": { "len": 0.2, "ticks": "inside", "ticklen": 6, "tickcolor": "rgb(237,237,237)", "outlinewidth": 0 } } } ], "table": [ { "type": "table", "cells": { "fill": { "color": "rgb(237,237,237)" }, "line": { "color": "white" } }, "header": { "fill": { "color": "rgb(217,217,217)" }, "line": { "color": "white" } } } ], "carpet": [ { "type": "carpet", "aaxis": { "gridcolor": "white", "linecolor": "white", "endlinecolor": "rgb(51,51,51)", "minorgridcolor": "white", "startlinecolor": "rgb(51,51,51)" }, "baxis": { "gridcolor": "white", "linecolor": "white", "endlinecolor": "rgb(51,51,51)", "minorgridcolor": "white", "startlinecolor": "rgb(51,51,51)" } } ], "mesh3d": [ { "type": "mesh3d", "colorbar": { "len": 0.2, "ticks": "inside", "ticklen": 6, "tickcolor": "rgb(237,237,237)", "outlinewidth": 0 } } ], "contour": [ { "type": "contour", "colorbar": { "len": 0.2, "ticks": "inside", "ticklen": 6, "tickcolor": "rgb(237,237,237)", "outlinewidth": 0 }, "autocolorscale": true } ], "heatmap": [ { "type": "heatmap", "colorbar": { "len": 0.2, "ticks": "inside", "ticklen": 6, "tickcolor": "rgb(237,237,237)", "outlinewidth": 0 }, "autocolorscale": true } ], "scatter": [ { "type": "scatter", "marker": { "colorbar": { "len": 0.2, "ticks": "inside", "ticklen": 6, "tickcolor": "rgb(237,237,237)", "outlinewidth": 0 } } } ], "surface": [ { "type": "surface", "colorbar": { "len": 0.2, "ticks": "inside", "ticklen": 6, "tickcolor": "rgb(237,237,237)", "outlinewidth": 0 } } ], "heatmapgl": [ { "type": "heatmapgl", "colorbar": { "len": 0.2, "ticks": "inside", "ticklen": 6, "tickcolor": "rgb(237,237,237)", "outlinewidth": 0 } } ], "histogram": [ { "type": "histogram", "marker": { "colorbar": { "len": 0.2, "ticks": "inside", "ticklen": 6, "tickcolor": "rgb(237,237,237)", "outlinewidth": 0 } } } ], "parcoords": [ { "line": { "colorbar": { "len": 0.2, "ticks": "inside", "ticklen": 6, "tickcolor": "rgb(237,237,237)", "outlinewidth": 0 } }, "type": "parcoords" } ], "scatter3d": [ { "type": "scatter3d", "marker": { "colorbar": { "len": 0.2, "ticks": "inside", "ticklen": 6, "tickcolor": "rgb(237,237,237)", "outlinewidth": 0 } } } ], "scattergl": [ { "type": "scattergl", "marker": { "colorbar": { "len": 0.2, "ticks": "inside", "ticklen": 6, "tickcolor": "rgb(237,237,237)", "outlinewidth": 0 } } } ], "choropleth": [ { "type": "choropleth", "colorbar": { "len": 0.2, "ticks": "inside", "ticklen": 6, "tickcolor": "rgb(237,237,237)", "outlinewidth": 0 } } ], "scattergeo": [ { "type": "scattergeo", "marker": { "colorbar": { "len": 0.2, "ticks": "inside", "ticklen": 6, "tickcolor": "rgb(237,237,237)", "outlinewidth": 0 } } } ], "histogram2d": [ { "type": "histogram2d", "colorbar": { "len": 0.2, "ticks": "inside", "ticklen": 6, "tickcolor": "rgb(237,237,237)", "outlinewidth": 0 }, "autocolorscale": true } ], "scatterpolar": [ { "type": "scatterpolar", "marker": { "colorbar": { "len": 0.2, "ticks": "inside", "ticklen": 6, "tickcolor": "rgb(237,237,237)", "outlinewidth": 0 } } } ], "contourcarpet": [ { "type": "contourcarpet", "colorbar": { "len": 0.2, "ticks": "inside", "ticklen": 6, "tickcolor": "rgb(237,237,237)", "outlinewidth": 0 } } ], "scattercarpet": [ { "type": "scattercarpet", "marker": { "colorbar": { "len": 0.2, "ticks": "inside", "ticklen": 6, "tickcolor": "rgb(237,237,237)", "outlinewidth": 0 } } } ], "scattermapbox": [ { "type": "scattermapbox", "marker": { "colorbar": { "len": 0.2, "ticks": "inside", "ticklen": 6, "tickcolor": "rgb(237,237,237)", "outlinewidth": 0 } } } ], "scatterpolargl": [ { "type": "scatterpolargl", "marker": { "colorbar": { "len": 0.2, "ticks": "inside", "ticklen": 6, "tickcolor": "rgb(237,237,237)", "outlinewidth": 0 } } } ], "scatterternary": [ { "type": "scatterternary", "marker": { "colorbar": { "len": 0.2, "ticks": "inside", "ticklen": 6, "tickcolor": "rgb(237,237,237)", "outlinewidth": 0 } } } ], "histogram2dcontour": [ { "type": "histogram2dcontour", "colorbar": { "len": 0.2, "ticks": "inside", "ticklen": 6, "tickcolor": "rgb(237,237,237)", "outlinewidth": 0 }, "autocolorscale": true } ] }, "layout": { "geo": { "bgcolor": "white", "showland": true, "lakecolor": "white", "landcolor": "rgb(237,237,237)", "showlakes": true, "subunitcolor": "white" }, "font": { "color": "rgb(51,51,51)" }, "polar": { "bgcolor": "rgb(237,237,237)", "radialaxis": { "ticks": "outside", "showgrid": true, "gridcolor": "white", "linecolor": "white", "tickcolor": "rgb(51,51,51)" }, "angularaxis": { "ticks": "outside", "showgrid": true, "gridcolor": "white", "linecolor": "white", "tickcolor": "rgb(51,51,51)" } }, "scene": { "xaxis": { "ticks": "outside", "showgrid": true, "gridcolor": "white", "gridwidth": 2, "linecolor": "white", "tickcolor": "rgb(51,51,51)", "zerolinecolor": "white", "showbackground": true, "backgroundcolor": "rgb(237,237,237)" }, "yaxis": { "ticks": "outside", "showgrid": true, "gridcolor": "white", "gridwidth": 2, "linecolor": "white", "tickcolor": "rgb(51,51,51)", "zerolinecolor": "white", "showbackground": true, "backgroundcolor": "rgb(237,237,237)" }, "zaxis": { "ticks": "outside", "showgrid": true, "gridcolor": "white", "gridwidth": 2, "linecolor": "white", "tickcolor": "rgb(51,51,51)", "zerolinecolor": "white", "showbackground": true, "backgroundcolor": "rgb(237,237,237)" } }, "xaxis": { "ticks": "outside", "showgrid": true, "gridcolor": "white", "linecolor": "white", "tickcolor": "rgb(51,51,51)", "automargin": true, "zerolinecolor": "white" }, "yaxis": { "ticks": "outside", "showgrid": true, "gridcolor": "white", "linecolor": "white", "tickcolor": "rgb(51,51,51)", "automargin": true, "zerolinecolor": "white" }, "ternary": { "aaxis": { "ticks": "outside", "showgrid": true, "gridcolor": "white", "linecolor": "white", "tickcolor": "rgb(51,51,51)" }, "baxis": { "ticks": "outside", "showgrid": true, "gridcolor": "white", "linecolor": "white", "tickcolor": "rgb(51,51,51)" }, "caxis": { "ticks": "outside", "showgrid": true, "gridcolor": "white", "linecolor": "white", "tickcolor": "rgb(51,51,51)" }, "bgcolor": "rgb(237,237,237)" }, "colorway": [ "#F8766D", "#A3A500", "#00BF7D", "#00B0F6", "#E76BF3" ], "hovermode": "closest", "colorscale": { "diverging": [ [ 0, "#40004b" ], [ 0.1, "#762a83" ], [ 0.2, "#9970ab" ], [ 0.3, "#c2a5cf" ], [ 0.4, "#e7d4e8" ], [ 0.5, "#f7f7f7" ], [ 0.6, "#d9f0d3" ], [ 0.7, "#a6dba0" ], [ 0.8, "#5aae61" ], [ 0.9, "#1b7837" ], [ 1, "#00441b" ] ], "sequential": [ [ 0, "rgb(20,44,66)" ], [ 1, "rgb(90,179,244)" ] ], "sequentialminus": [ [ 0, "rgb(20,44,66)" ], [ 1, "rgb(90,179,244)" ] ] }, "plot_bgcolor": "rgb(237,237,237)", "paper_bgcolor": "white", "shapedefaults": { "line": { "width": 0 }, "opacity": 0.3, "fillcolor": "black" }, "annotationdefaults": { "arrowhead": 0, "arrowwidth": 1 } }, "themeRef": "GGPLOT2" }, "showlegend": false, "boxgroupgap": 0.3 } }, "height": null, "width": null, "user": { "profile_url": "https://chart-studio.plotly.com/~duganivan", "avatar_url": "https://storage.googleapis.com/plotly-prod-profiles/20.jpg", "background_url": "https://storage.googleapis.com/plotly-prod-profiles/bg-8.jpg", "bio": "", "nickname": "", "website": "", "stream_tokens": null, "feature_set_id": null, "csrf_token": null, "date_joined": "2022-01-06 09:56:45", "mapbox_access_tokens": null, "has_password": null, "username": "duganivan", "email": null, "is_active": null, "readonly": null, "is_dash_creator": null, "dash_created_count": null, "is_chart_creator": null, "charts_created_count": null } }, { "creation_time": "2025-09-02T12:14:30.460795Z", "comments": { "results": [], "count": 0 }, "parented": true, "embed_url": "https://chart-studio.plotly.com/~alexros/7.embed", "fid": "alexros:7", "filename": "Plot 7", "filetype": "plot", "img_url": "https://storage.googleapis.com/plotly-prod-images/alexros/7/9_4V0LPWM7X1G8ZS9CA24IRFHVZ7JB3A.png", "image_urls": { "default": "https://storage.googleapis.com/plotly-prod-images/alexros/7/2_0LSTDRBYQYJ4OR9RMPXBFK4XGP5IBA.png", "block-thumb": "https://storage.googleapis.com/plotly-prod-images/alexros/7/8_06M9SWNHSHDP5PYRXKX93X0RSK9B9N.png", "list-thumb": "https://storage.googleapis.com/plotly-prod-images/alexros/7/9_4V0LPWM7X1G8ZS9CA24IRFHVZ7JB3A.png" }, "api_urls": { "files": "https://api.plotly.com/v2/files/alexros:7", "plots": "https://api.plotly.com/v2/plots/alexros:7", "parent": "https://api.plotly.com/v2/folders/home?user=alexros" }, "owner": "alexros", "parent": -1, "preview": "", "referencers": [], "references": [], "title": "", "views": 0, "web_url": "https://chart-studio.plotly.com/~alexros/7/", "world_readable": true, "date_modified": "2025-09-02T12:14:30.472Z", "stars": { "results": [], "count": 0 }, "collaborators": { "results": [], "count": 0 }, "subfolder_count": null, "refresh_interval": null, "organize_view_url": "https://chart-studio.plotly.com/~alexros/7/", "current_user_permission": "read", "is_theme": null, "is_template": false, "autosize": true, "caption": "", "figure": { "data": [ { "meta": { "columnNames": { "x": "revenue", "y": "cost of goods sold" } }, "mode": "markers", "type": "bar", "xsrc": "alexros:6:c96c45", "ysrc": "alexros:6:2a3690", "orientation": "v" } ], "frames": [], "layout": { "title": { "text": "financial_performance_visualisation" }, "xaxis": { "range": [ 77500, 122500 ], "title": { "text": "revenue" }, "autorange": true }, "yaxis": { "range": [ 0, 57894.73684210527 ], "title": { "text": "cost_of_goods_sold" }, "autorange": true }, "autosize": true, "template": { "data": { "bar": [ { "type": "bar", "marker": { "colorbar": { "ticks": "", "outlinewidth": 0 } } } ], "table": [ { "type": "table", "cells": { "fill": { "color": "#EBF0F8" }, "line": { "color": "white" } }, "header": { "fill": { "color": "#C8D4E3" }, "line": { "color": "white" } } } ], "carpet": [ { "type": "carpet", "aaxis": { "gridcolor": "#C8D4E3", "linecolor": "#C8D4E3", "endlinecolor": "#2a3f5f", "minorgridcolor": "#C8D4E3", "startlinecolor": "#2a3f5f" }, "baxis": { "gridcolor": "#C8D4E3", "linecolor": "#C8D4E3", "endlinecolor": "#2a3f5f", "minorgridcolor": "#C8D4E3", "startlinecolor": "#2a3f5f" } } ], "mesh3d": [ { "type": "mesh3d", "colorbar": { "ticks": "", "outlinewidth": 0 } } ], "contour": [ { "type": "contour", "colorbar": { "ticks": "", "outlinewidth": 0 }, "autocolorscale": true } ], "heatmap": [ { "type": "heatmap", "colorbar": { "ticks": "", "outlinewidth": 0 }, "autocolorscale": true } ], "scatter": [ { "type": "scatter", "marker": { "colorbar": { "ticks": "", "outlinewidth": 0 } } } ], "surface": [ { "type": "surface", "colorbar": { "ticks": "", "outlinewidth": 0 } } ], "heatmapgl": [ { "type": "heatmapgl", "colorbar": { "ticks": "", "outlinewidth": 0 } } ], "histogram": [ { "type": "histogram", "marker": { "colorbar": { "ticks": "", "outlinewidth": 0 } } } ], "parcoords": [ { "line": { "colorbar": { "ticks": "", "outlinewidth": 0 } }, "type": "parcoords" } ], "scatter3d": [ { "type": "scatter3d", "marker": { "colorbar": { "ticks": "", "outlinewidth": 0 } } } ], "scattergl": [ { "type": "scattergl", "marker": { "colorbar": { "ticks": "", "outlinewidth": 0 } } } ], "choropleth": [ { "type": "choropleth", "colorbar": { "ticks": "", "outlinewidth": 0 } } ], "scattergeo": [ { "type": "scattergeo", "marker": { "colorbar": { "ticks": "", "outlinewidth": 0 } } } ], "histogram2d": [ { "type": "histogram2d", "colorbar": { "ticks": "", "outlinewidth": 0 }, "autocolorscale": true } ], "scatterpolar": [ { "type": "scatterpolar", "marker": { "colorbar": { "ticks": "", "outlinewidth": 0 } } } ], "contourcarpet": [ { "type": "contourcarpet", "colorbar": { "ticks": "", "outlinewidth": 0 } } ], "scattercarpet": [ { "type": "scattercarpet", "marker": { "colorbar": { "ticks": "", "outlinewidth": 0 } } } ], "scattermapbox": [ { "type": "scattermapbox", "marker": { "colorbar": { "ticks": "", "outlinewidth": 0 } } } ], "scatterpolargl": [ { "type": "scatterpolargl", "marker": { "colorbar": { "ticks": "", "outlinewidth": 0 } } } ], "scatterternary": [ { "type": "scatterternary", "marker": { "colorbar": { "ticks": "", "outlinewidth": 0 } } } ], "histogram2dcontour": [ { "type": "histogram2dcontour", "colorbar": { "ticks": "", "outlinewidth": 0 }, "autocolorscale": true } ] }, "layout": { "geo": { "bgcolor": "white", "showland": true, "lakecolor": "white", "landcolor": "white", "showlakes": true, "subunitcolor": "#C8D4E3" }, "font": { "color": "#2a3f5f" }, "polar": { "bgcolor": "white", "radialaxis": { "ticks": "", "gridcolor": "#EBF0F8", "linecolor": "#EBF0F8" }, "angularaxis": { "ticks": "", "gridcolor": "#EBF0F8", "linecolor": "#EBF0F8" } }, "scene": { "xaxis": { "ticks": "", "gridcolor": "#DFE8F3", "gridwidth": 2, "linecolor": "#EBF0F8", "zerolinecolor": "#EBF0F8", "showbackground": true, "backgroundcolor": "white" }, "yaxis": { "ticks": "", "gridcolor": "#DFE8F3", "gridwidth": 2, "linecolor": "#EBF0F8", "zerolinecolor": "#EBF0F8", "showbackground": true, "backgroundcolor": "white" }, "zaxis": { "ticks": "", "gridcolor": "#DFE8F3", "gridwidth": 2, "linecolor": "#EBF0F8", "zerolinecolor": "#EBF0F8", "showbackground": true, "backgroundcolor": "white" } }, "title": { "x": 0.05 }, "xaxis": { "ticks": "", "gridcolor": "#EBF0F8", "linecolor": "#EBF0F8", "automargin": true, "zerolinecolor": "#EBF0F8", "zerolinewidth": 2 }, "yaxis": { "ticks": "", "gridcolor": "#EBF0F8", "linecolor": "#EBF0F8", "automargin": true, "zerolinecolor": "#EBF0F8", "zerolinewidth": 2 }, "ternary": { "aaxis": { "ticks": "", "gridcolor": "#DFE8F3", "linecolor": "#A2B1C6" }, "baxis": { "ticks": "", "gridcolor": "#DFE8F3", "linecolor": "#A2B1C6" }, "caxis": { "ticks": "", "gridcolor": "#DFE8F3", "linecolor": "#A2B1C6" }, "bgcolor": "white" }, "colorway": [ "#636efa", "#EF553B", "#00cc96", "#ab63fa", "#19d3f3", "#e763fa", "#fecb52", "#ffa15a", "#ff6692", "#b6e880" ], "hovermode": "closest", "colorscale": { "diverging": [ [ 0, "#8e0152" ], [ 0.1, "#c51b7d" ], [ 0.2, "#de77ae" ], [ 0.3, "#f1b6da" ], [ 0.4, "#fde0ef" ], [ 0.5, "#f7f7f7" ], [ 0.6, "#e6f5d0" ], [ 0.7, "#b8e186" ], [ 0.8, "#7fbc41" ], [ 0.9, "#4d9221" ], [ 1, "#276419" ] ], "sequential": [ [ 0, "#0508b8" ], [ 0.0893854748603352, "#1910d8" ], [ 0.1787709497206704, "#3c19f0" ], [ 0.2681564245810056, "#6b1cfb" ], [ 0.3575418994413408, "#981cfd" ], [ 0.44692737430167595, "#bf1cfd" ], [ 0.5363128491620112, "#dd2bfd" ], [ 0.6256983240223464, "#f246fe" ], [ 0.7150837988826816, "#fc67fd" ], [ 0.8044692737430168, "#fe88fc" ], [ 0.8938547486033519, "#fea5fd" ], [ 0.9832402234636871, "#febefe" ], [ 1, "#fec3fe" ] ], "sequentialminus": [ [ 0, "#0508b8" ], [ 0.0893854748603352, "#1910d8" ], [ 0.1787709497206704, "#3c19f0" ], [ 0.2681564245810056, "#6b1cfb" ], [ 0.3575418994413408, "#981cfd" ], [ 0.44692737430167595, "#bf1cfd" ], [ 0.5363128491620112, "#dd2bfd" ], [ 0.6256983240223464, "#f246fe" ], [ 0.7150837988826816, "#fc67fd" ], [ 0.8044692737430168, "#fe88fc" ], [ 0.8938547486033519, "#fea5fd" ], [ 0.9832402234636871, "#febefe" ], [ 1, "#fec3fe" ] ] }, "plot_bgcolor": "white", "paper_bgcolor": "white", "shapedefaults": { "line": { "width": 0 }, "opacity": 0.4, "fillcolor": "#506784" }, "annotationdefaults": { "arrowhead": 0, "arrowcolor": "#506784", "arrowwidth": 1 } }, "themeRef": "PLOTLY_WHITE" } } }, "height": null, "width": null, "user": { "profile_url": "https://chart-studio.plotly.com/~alexros", "avatar_url": "https://storage.googleapis.com/plotly-prod-profiles/94.jpg", "background_url": "https://storage.googleapis.com/plotly-prod-profiles/bg-8.jpg", "bio": "", "nickname": "", "website": "", "stream_tokens": null, "feature_set_id": null, "csrf_token": null, "date_joined": "2025-09-02 05:45:53", "mapbox_access_tokens": null, "has_password": null, "username": "alexros", "email": null, "is_active": null, "readonly": null, "is_dash_creator": null, "dash_created_count": null, "is_chart_creator": null, "charts_created_count": null } }, { "creation_time": "2025-09-02T11:51:08.895760Z", "comments": { "results": [], "count": 0 }, "parented": true, "embed_url": "https://chart-studio.plotly.com/~l-schulte/1.embed", "fid": "l-schulte:1", "filename": "Plot 1", "filetype": "plot", "img_url": "https://storage.googleapis.com/plotly-prod-images/l-schulte/1/9_9I0SWUL9MXLDIBG9B0PLRBNHY8I96Q.png", "image_urls": { "default": "https://storage.googleapis.com/plotly-prod-images/l-schulte/1/2_2PHZQBRLO4TCZ6YUYFSVD3UVR572HL.png", "block-thumb": "https://storage.googleapis.com/plotly-prod-images/l-schulte/1/8_WQOGGH0IYKIO9ZOR1L4GBKW85QD0NP.png", "list-thumb": "https://storage.googleapis.com/plotly-prod-images/l-schulte/1/9_9I0SWUL9MXLDIBG9B0PLRBNHY8I96Q.png" }, "api_urls": { "files": "https://api.plotly.com/v2/files/l-schulte:1", "plots": "https://api.plotly.com/v2/plots/l-schulte:1", "parent": "https://api.plotly.com/v2/folders/home?user=l-schulte" }, "owner": "l-schulte", "parent": -1, "preview": "", "referencers": [], "references": [], "title": "", "views": 0, "web_url": "https://chart-studio.plotly.com/~l-schulte/1/", "world_readable": true, "date_modified": "2025-09-02T11:51:08.907Z", "stars": { "results": [], "count": 0 }, "collaborators": { "results": [], "count": 0 }, "subfolder_count": null, "refresh_interval": null, "organize_view_url": "https://chart-studio.plotly.com/~l-schulte/1/", "current_user_permission": "read", "is_theme": null, "is_template": false, "autosize": true, "caption": "", "figure": { "data": [ { "meta": { "columnNames": { "x": "A", "y": "B" } }, "mode": "lines", "type": "scatter", "xsrc": "l-schulte:0:a2220c", "ysrc": "l-schulte:0:045815", "orientation": "v" } ], "frames": [], "layout": { "font": { "color": "rgb(75, 73, 73)" }, "title": { "text": "Student registrations for the AI Engineering Lab" }, "xaxis": { "type": "linear", "range": [ 2020.5, 2026.5 ], "title": { "text": "Year" }, "autorange": false, "showspikes": false }, "yaxis": { "type": "linear", "range": [ 22.77777777777777, 67.22222222222223 ], "title": { "text": "#Students" }, "autorange": false, "showspikes": false }, "margin": { "pad": 30 }, "autosize": true, "template": { "data": { "bar": [ { "type": "bar", "marker": { "colorbar": { "ticks": "", "outlinewidth": 0 } } } ], "table": [ { "type": "table", "cells": { "fill": { "color": "#EBF0F8" }, "line": { "color": "white" } }, "header": { "fill": { "color": "#C8D4E3" }, "line": { "color": "white" } } } ], "carpet": [ { "type": "carpet", "aaxis": { "gridcolor": "#C8D4E3", "linecolor": "#C8D4E3", "endlinecolor": "#2a3f5f", "minorgridcolor": "#C8D4E3", "startlinecolor": "#2a3f5f" }, "baxis": { "gridcolor": "#C8D4E3", "linecolor": "#C8D4E3", "endlinecolor": "#2a3f5f", "minorgridcolor": "#C8D4E3", "startlinecolor": "#2a3f5f" } } ], "mesh3d": [ { "type": "mesh3d", "colorbar": { "ticks": "", "outlinewidth": 0 } } ], "contour": [ { "type": "contour", "colorbar": { "ticks": "", "outlinewidth": 0 }, "autocolorscale": true } ], "heatmap": [ { "type": "heatmap", "colorbar": { "ticks": "", "outlinewidth": 0 }, "autocolorscale": true } ], "scatter": [ { "type": "scatter", "marker": { "colorbar": { "ticks": "", "outlinewidth": 0 } } } ], "surface": [ { "type": "surface", "colorbar": { "ticks": "", "outlinewidth": 0 } } ], "heatmapgl": [ { "type": "heatmapgl", "colorbar": { "ticks": "", "outlinewidth": 0 } } ], "histogram": [ { "type": "histogram", "marker": { "colorbar": { "ticks": "", "outlinewidth": 0 } } } ], "parcoords": [ { "line": { "colorbar": { "ticks": "", "outlinewidth": 0 } }, "type": "parcoords" } ], "scatter3d": [ { "type": "scatter3d", "marker": { "colorbar": { "ticks": "", "outlinewidth": 0 } } } ], "scattergl": [ { "type": "scattergl", "marker": { "colorbar": { "ticks": "", "outlinewidth": 0 } } } ], "choropleth": [ { "type": "choropleth", "colorbar": { "ticks": "", "outlinewidth": 0 } } ], "scattergeo": [ { "type": "scattergeo", "marker": { "colorbar": { "ticks": "", "outlinewidth": 0 } } } ], "histogram2d": [ { "type": "histogram2d", "colorbar": { "ticks": "", "outlinewidth": 0 }, "autocolorscale": true } ], "scatterpolar": [ { "type": "scatterpolar", "marker": { "colorbar": { "ticks": "", "outlinewidth": 0 } } } ], "contourcarpet": [ { "type": "contourcarpet", "colorbar": { "ticks": "", "outlinewidth": 0 } } ], "scattercarpet": [ { "type": "scattercarpet", "marker": { "colorbar": { "ticks": "", "outlinewidth": 0 } } } ], "scattermapbox": [ { "type": "scattermapbox", "marker": { "colorbar": { "ticks": "", "outlinewidth": 0 } } } ], "scatterpolargl": [ { "type": "scatterpolargl", "marker": { "colorbar": { "ticks": "", "outlinewidth": 0 } } } ], "scatterternary": [ { "type": "scatterternary", "marker": { "colorbar": { "ticks": "", "outlinewidth": 0 } } } ], "histogram2dcontour": [ { "type": "histogram2dcontour", "colorbar": { "ticks": "", "outlinewidth": 0 }, "autocolorscale": true } ] }, "layout": { "geo": { "bgcolor": "white", "showland": true, "lakecolor": "white", "landcolor": "white", "showlakes": true, "subunitcolor": "#C8D4E3" }, "font": { "color": "#2a3f5f" }, "polar": { "bgcolor": "white", "radialaxis": { "ticks": "", "gridcolor": "#EBF0F8", "linecolor": "#EBF0F8" }, "angularaxis": { "ticks": "", "gridcolor": "#EBF0F8", "linecolor": "#EBF0F8" } }, "scene": { "xaxis": { "ticks": "", "gridcolor": "#DFE8F3", "gridwidth": 2, "linecolor": "#EBF0F8", "zerolinecolor": "#EBF0F8", "showbackground": true, "backgroundcolor": "white" }, "yaxis": { "ticks": "", "gridcolor": "#DFE8F3", "gridwidth": 2, "linecolor": "#EBF0F8", "zerolinecolor": "#EBF0F8", "showbackground": true, "backgroundcolor": "white" }, "zaxis": { "ticks": "", "gridcolor": "#DFE8F3", "gridwidth": 2, "linecolor": "#EBF0F8", "zerolinecolor": "#EBF0F8", "showbackground": true, "backgroundcolor": "white" } }, "title": { "x": 0.05 }, "xaxis": { "ticks": "", "gridcolor": "#EBF0F8", "linecolor": "#EBF0F8", "automargin": true, "zerolinecolor": "#EBF0F8", "zerolinewidth": 2 }, "yaxis": { "ticks": "", "gridcolor": "#EBF0F8", "linecolor": "#EBF0F8", "automargin": true, "zerolinecolor": "#EBF0F8", "zerolinewidth": 2 }, "ternary": { "aaxis": { "ticks": "", "gridcolor": "#DFE8F3", "linecolor": "#A2B1C6" }, "baxis": { "ticks": "", "gridcolor": "#DFE8F3", "linecolor": "#A2B1C6" }, "caxis": { "ticks": "", "gridcolor": "#DFE8F3", "linecolor": "#A2B1C6" }, "bgcolor": "white" }, "colorway": [ "#636efa", "#EF553B", "#00cc96", "#ab63fa", "#19d3f3", "#e763fa", "#fecb52", "#ffa15a", "#ff6692", "#b6e880" ], "hovermode": "closest", "colorscale": { "diverging": [ [ 0, "#8e0152" ], [ 0.1, "#c51b7d" ], [ 0.2, "#de77ae" ], [ 0.3, "#f1b6da" ], [ 0.4, "#fde0ef" ], [ 0.5, "#f7f7f7" ], [ 0.6, "#e6f5d0" ], [ 0.7, "#b8e186" ], [ 0.8, "#7fbc41" ], [ 0.9, "#4d9221" ], [ 1, "#276419" ] ], "sequential": [ [ 0, "#0508b8" ], [ 0.0893854748603352, "#1910d8" ], [ 0.1787709497206704, "#3c19f0" ], [ 0.2681564245810056, "#6b1cfb" ], [ 0.3575418994413408, "#981cfd" ], [ 0.44692737430167595, "#bf1cfd" ], [ 0.5363128491620112, "#dd2bfd" ], [ 0.6256983240223464, "#f246fe" ], [ 0.7150837988826816, "#fc67fd" ], [ 0.8044692737430168, "#fe88fc" ], [ 0.8938547486033519, "#fea5fd" ], [ 0.9832402234636871, "#febefe" ], [ 1, "#fec3fe" ] ], "sequentialminus": [ [ 0, "#0508b8" ], [ 0.0893854748603352, "#1910d8" ], [ 0.1787709497206704, "#3c19f0" ], [ 0.2681564245810056, "#6b1cfb" ], [ 0.3575418994413408, "#981cfd" ], [ 0.44692737430167595, "#bf1cfd" ], [ 0.5363128491620112, "#dd2bfd" ], [ 0.6256983240223464, "#f246fe" ], [ 0.7150837988826816, "#fc67fd" ], [ 0.8044692737430168, "#fe88fc" ], [ 0.8938547486033519, "#fea5fd" ], [ 0.9832402234636871, "#febefe" ], [ 1, "#fec3fe" ] ] }, "plot_bgcolor": "white", "paper_bgcolor": "white", "shapedefaults": { "line": { "width": 0 }, "opacity": 0.4, "fillcolor": "#506784" }, "annotationdefaults": { "arrowhead": 0, "arrowcolor": "#506784", "arrowwidth": 1 } }, "themeRef": "PLOTLY_WHITE" }, "hovermode": "closest" } }, "height": null, "width": null, "user": { "profile_url": "https://chart-studio.plotly.com/~l-schulte", "avatar_url": "https://storage.googleapis.com/plotly-prod-profiles/1.jpg", "background_url": "https://storage.googleapis.com/plotly-prod-profiles/bg-14.jpg", "bio": "", "nickname": "", "website": "", "stream_tokens": null, "feature_set_id": null, "csrf_token": null, "date_joined": "2025-09-02 11:47:10", "mapbox_access_tokens": null, "has_password": null, "username": "l-schulte", "email": null, "is_active": null, "readonly": null, "is_dash_creator": null, "dash_created_count": null, "is_chart_creator": null, "charts_created_count": null } }, { "creation_time": "2025-09-02T11:28:25.921167Z", "comments": { "results": [], "count": 0 }, "parented": true, "embed_url": "https://chart-studio.plotly.com/~abbaskoohfar/1.embed", "fid": "abbaskoohfar:1", "filename": "Plot 1", "filetype": "plot", "img_url": "https://api.plotly.com/v2/files/abbaskoohfar:1/image?image_name=list-thumb", "image_urls": { "default": "https://storage.googleapis.com/plotly-prod-images/abbaskoohfar/1/2_MIN6TT7L2RU65RBQZFHQC9JK5EU0V4.png", "block-thumb": "https://storage.googleapis.com/plotly-prod-images/abbaskoohfar/1/8_FVJUVAJFV7D434PAS61BRISHG5RR9M.png", "list-thumb": "https://api.plotly.com/v2/files/abbaskoohfar:1/image?image_name=list-thumb" }, "api_urls": { "files": "https://api.plotly.com/v2/files/abbaskoohfar:1", "plots": "https://api.plotly.com/v2/plots/abbaskoohfar:1", "parent": "https://api.plotly.com/v2/folders/home?user=abbaskoohfar" }, "owner": "abbaskoohfar", "parent": -1, "preview": "", "referencers": [], "references": [], "title": "", "views": 0, "web_url": "https://chart-studio.plotly.com/~abbaskoohfar/1/", "world_readable": true, "date_modified": "2025-09-02T11:28:25.932Z", "stars": { "results": [], "count": 0 }, "collaborators": { "results": [], "count": 0 }, "subfolder_count": null, "refresh_interval": null, "organize_view_url": "https://chart-studio.plotly.com/~abbaskoohfar/1/", "current_user_permission": "read", "is_theme": null, "is_template": false, "autosize": true, "caption": "", "figure": { "data": [ { "meta": { "columnNames": { "x": "A", "y": "B" } }, "name": "%{meta.columnNames.y}", "type": "bar", "xsrc": "abbaskoohfar:0:d698e1", "ysrc": "abbaskoohfar:0:27ae3b", "orientation": "v" } ], "frames": [], "layout": { "title": { "text": "Click to enter Plot title" }, "xaxis": { "type": "linear", "range": [ 2014.5, 2025.5 ], "title": { "text": "A" }, "autorange": true }, "yaxis": { "type": "linear", "range": [ 0.9792693432580604, 1.116447231061416 ], "autorange": false }, "barmode": "stack", "autosize": true, "colorway": [ "#AA0DFE", "#3283FE", "#85660D", "#782AB6", "#565656", "#1C8356", "#16FF32", "#F7E1A0", "#E2E2E2", "#1CBE4F", "#C4451C", "#DEA0FD", "#FE00FA", "#325A9B", "#FEAF16", "#F8A19F", "#90AD1C", "#F6222E", "#1CFFCE", "#2ED9FF", "#B10DA1", "#C075A6", "#FC1CBF", "#B00068", "#FBE426", "#FA0087" ], "template": { "data": { "bar": [ { "type": "bar", "marker": { "colorbar": { "ticks": "", "outlinewidth": 0 } } } ], "table": [ { "type": "table", "cells": { "fill": { "color": "#EBF0F8" }, "line": { "color": "white" } }, "header": { "fill": { "color": "#C8D4E3" }, "line": { "color": "white" } } } ], "carpet": [ { "type": "carpet", "aaxis": { "gridcolor": "#C8D4E3", "linecolor": "#C8D4E3", "endlinecolor": "#2a3f5f", "minorgridcolor": "#C8D4E3", "startlinecolor": "#2a3f5f" }, "baxis": { "gridcolor": "#C8D4E3", "linecolor": "#C8D4E3", "endlinecolor": "#2a3f5f", "minorgridcolor": "#C8D4E3", "startlinecolor": "#2a3f5f" } } ], "mesh3d": [ { "type": "mesh3d", "colorbar": { "ticks": "", "outlinewidth": 0 } } ], "contour": [ { "type": "contour", "colorbar": { "ticks": "", "outlinewidth": 0 }, "autocolorscale": true } ], "heatmap": [ { "type": "heatmap", "colorbar": { "ticks": "", "outlinewidth": 0 }, "autocolorscale": true } ], "scatter": [ { "type": "scatter", "marker": { "colorbar": { "ticks": "", "outlinewidth": 0 } } } ], "surface": [ { "type": "surface", "colorbar": { "ticks": "", "outlinewidth": 0 } } ], "heatmapgl": [ { "type": "heatmapgl", "colorbar": { "ticks": "", "outlinewidth": 0 } } ], "histogram": [ { "type": "histogram", "marker": { "colorbar": { "ticks": "", "outlinewidth": 0 } } } ], "parcoords": [ { "line": { "colorbar": { "ticks": "", "outlinewidth": 0 } }, "type": "parcoords" } ], "scatter3d": [ { "type": "scatter3d", "marker": { "colorbar": { "ticks": "", "outlinewidth": 0 } } } ], "scattergl": [ { "type": "scattergl", "marker": { "colorbar": { "ticks": "", "outlinewidth": 0 } } } ], "choropleth": [ { "type": "choropleth", "colorbar": { "ticks": "", "outlinewidth": 0 } } ], "scattergeo": [ { "type": "scattergeo", "marker": { "colorbar": { "ticks": "", "outlinewidth": 0 } } } ], "histogram2d": [ { "type": "histogram2d", "colorbar": { "ticks": "", "outlinewidth": 0 }, "autocolorscale": true } ], "scatterpolar": [ { "type": "scatterpolar", "marker": { "colorbar": { "ticks": "", "outlinewidth": 0 } } } ], "contourcarpet": [ { "type": "contourcarpet", "colorbar": { "ticks": "", "outlinewidth": 0 } } ], "scattercarpet": [ { "type": "scattercarpet", "marker": { "colorbar": { "ticks": "", "outlinewidth": 0 } } } ], "scattermapbox": [ { "type": "scattermapbox", "marker": { "colorbar": { "ticks": "", "outlinewidth": 0 } } } ], "scatterpolargl": [ { "type": "scatterpolargl", "marker": { "colorbar": { "ticks": "", "outlinewidth": 0 } } } ], "scatterternary": [ { "type": "scatterternary", "marker": { "colorbar": { "ticks": "", "outlinewidth": 0 } } } ], "histogram2dcontour": [ { "type": "histogram2dcontour", "colorbar": { "ticks": "", "outlinewidth": 0 }, "autocolorscale": true } ] }, "layout": { "geo": { "bgcolor": "white", "showland": true, "lakecolor": "white", "landcolor": "white", "showlakes": true, "subunitcolor": "#C8D4E3" }, "font": { "color": "#2a3f5f" }, "polar": { "bgcolor": "white", "radialaxis": { "ticks": "", "gridcolor": "#EBF0F8", "linecolor": "#EBF0F8" }, "angularaxis": { "ticks": "", "gridcolor": "#EBF0F8", "linecolor": "#EBF0F8" } }, "scene": { "xaxis": { "ticks": "", "gridcolor": "#DFE8F3", "gridwidth": 2, "linecolor": "#EBF0F8", "zerolinecolor": "#EBF0F8", "showbackground": true, "backgroundcolor": "white" }, "yaxis": { "ticks": "", "gridcolor": "#DFE8F3", "gridwidth": 2, "linecolor": "#EBF0F8", "zerolinecolor": "#EBF0F8", "showbackground": true, "backgroundcolor": "white" }, "zaxis": { "ticks": "", "gridcolor": "#DFE8F3", "gridwidth": 2, "linecolor": "#EBF0F8", "zerolinecolor": "#EBF0F8", "showbackground": true, "backgroundcolor": "white" } }, "title": { "x": 0.05 }, "xaxis": { "ticks": "", "gridcolor": "#EBF0F8", "linecolor": "#EBF0F8", "automargin": true, "zerolinecolor": "#EBF0F8", "zerolinewidth": 2 }, "yaxis": { "ticks": "", "gridcolor": "#EBF0F8", "linecolor": "#EBF0F8", "automargin": true, "zerolinecolor": "#EBF0F8", "zerolinewidth": 2 }, "ternary": { "aaxis": { "ticks": "", "gridcolor": "#DFE8F3", "linecolor": "#A2B1C6" }, "baxis": { "ticks": "", "gridcolor": "#DFE8F3", "linecolor": "#A2B1C6" }, "caxis": { "ticks": "", "gridcolor": "#DFE8F3", "linecolor": "#A2B1C6" }, "bgcolor": "white" }, "colorway": [ "#636efa", "#EF553B", "#00cc96", "#ab63fa", "#19d3f3", "#e763fa", "#fecb52", "#ffa15a", "#ff6692", "#b6e880" ], "hovermode": "closest", "colorscale": { "diverging": [ [ 0, "#8e0152" ], [ 0.1, "#c51b7d" ], [ 0.2, "#de77ae" ], [ 0.3, "#f1b6da" ], [ 0.4, "#fde0ef" ], [ 0.5, "#f7f7f7" ], [ 0.6, "#e6f5d0" ], [ 0.7, "#b8e186" ], [ 0.8, "#7fbc41" ], [ 0.9, "#4d9221" ], [ 1, "#276419" ] ], "sequential": [ [ 0, "#0508b8" ], [ 0.0893854748603352, "#1910d8" ], [ 0.1787709497206704, "#3c19f0" ], [ 0.2681564245810056, "#6b1cfb" ], [ 0.3575418994413408, "#981cfd" ], [ 0.44692737430167595, "#bf1cfd" ], [ 0.5363128491620112, "#dd2bfd" ], [ 0.6256983240223464, "#f246fe" ], [ 0.7150837988826816, "#fc67fd" ], [ 0.8044692737430168, "#fe88fc" ], [ 0.8938547486033519, "#fea5fd" ], [ 0.9832402234636871, "#febefe" ], [ 1, "#fec3fe" ] ], "sequentialminus": [ [ 0, "#0508b8" ], [ 0.0893854748603352, "#1910d8" ], [ 0.1787709497206704, "#3c19f0" ], [ 0.2681564245810056, "#6b1cfb" ], [ 0.3575418994413408, "#981cfd" ], [ 0.44692737430167595, "#bf1cfd" ], [ 0.5363128491620112, "#dd2bfd" ], [ 0.6256983240223464, "#f246fe" ], [ 0.7150837988826816, "#fc67fd" ], [ 0.8044692737430168, "#fe88fc" ], [ 0.8938547486033519, "#fea5fd" ], [ 0.9832402234636871, "#febefe" ], [ 1, "#fec3fe" ] ] }, "plot_bgcolor": "white", "paper_bgcolor": "white", "shapedefaults": { "line": { "width": 0 }, "opacity": 0.4, "fillcolor": "#506784" }, "annotationdefaults": { "arrowhead": 0, "arrowcolor": "#506784", "arrowwidth": 1 } }, "themeRef": "PLOTLY_WHITE" }, "paper_bgcolor": "rgb(243, 174, 174)" } }, "height": null, "width": null, "user": { "profile_url": "https://chart-studio.plotly.com/~abbaskoohfar", "avatar_url": "https://storage.googleapis.com/plotly-prod-profiles/34.jpg", "background_url": "https://storage.googleapis.com/plotly-prod-profiles/bg-4.jpg", "bio": "", "nickname": "", "website": "", "stream_tokens": null, "feature_set_id": null, "csrf_token": null, "date_joined": "2025-09-02 11:23:00", "mapbox_access_tokens": null, "has_password": null, "username": "abbaskoohfar", "email": null, "is_active": null, "readonly": null, "is_dash_creator": null, "dash_created_count": null, "is_chart_creator": null, "charts_created_count": null } }, { "creation_time": "2025-09-02T11:25:47.944489Z", "comments": { "results": [], "count": 0 }, "parented": true, "embed_url": "https://chart-studio.plotly.com/~freeform2/9.embed", "fid": "freeform2:9", "filename": "dynamic_scatter_plot", "filetype": "plot", "img_url": "https://storage.googleapis.com/plotly-prod-images/freeform2/9/9_WXJ0FSWCNXIZ69SFLPKN6BRDNTVZBT.png", "image_urls": { "default": "https://storage.googleapis.com/plotly-prod-images/freeform2/9/2_CA76CZJL9RRA6B1PTUN7QBCI3J7WYX.png", "block-thumb": "https://storage.googleapis.com/plotly-prod-images/freeform2/9/8_2FCIIIDUJ36PPVGNMXEG192FGII3WO.png", "list-thumb": "https://storage.googleapis.com/plotly-prod-images/freeform2/9/9_WXJ0FSWCNXIZ69SFLPKN6BRDNTVZBT.png" }, "api_urls": { "files": "https://api.plotly.com/v2/files/freeform2:9", "plots": "https://api.plotly.com/v2/plots/freeform2:9", "parent": "https://api.plotly.com/v2/folders/home?user=freeform2" }, "owner": "freeform2", "parent": -1, "preview": "", "referencers": [], "references": [], "title": "", "views": 0, "web_url": "https://chart-studio.plotly.com/~freeform2/9/", "world_readable": true, "date_modified": "2025-09-02T11:25:47.954Z", "stars": { "results": [], "count": 0 }, "collaborators": { "results": [], "count": 0 }, "subfolder_count": null, "refresh_interval": null, "organize_view_url": "https://chart-studio.plotly.com/~freeform2/9/", "current_user_permission": "read", "is_theme": null, "is_template": false, "autosize": true, "caption": "", "figure": { "data": [ { "meta": { "columnNames": { "x": "@type", "y": "dcat:Dataset" } }, "mode": "markers", "type": "scatter", "xsrc": "freeform2:8:0a9e44", "ysrc": "freeform2:8:781ffc" } ], "frames": [], "layout": { "title": { "text": "Scatter Plot" }, "xaxis": { "type": "category", "range": [ -0.8813709820635769, 14.881370982063578 ], "title": { "text": "Type" }, "autorange": true }, "yaxis": { "type": "date", "range": [ "2023-01-30 22:39:23.331", "2023-01-30 22:39:23.333" ], "title": { "text": "Dataset" }, "autorange": true }, "autosize": true, "template": { "data": { "bar": [ { "type": "bar", "marker": { "colorbar": { "ticks": "", "outlinewidth": 0 } } } ], "table": [ { "type": "table", "cells": { "fill": { "color": "#EBF0F8" }, "line": { "color": "white" } }, "header": { "fill": { "color": "#C8D4E3" }, "line": { "color": "white" } } } ], "carpet": [ { "type": "carpet", "aaxis": { "gridcolor": "#C8D4E3", "linecolor": "#C8D4E3", "endlinecolor": "#2a3f5f", "minorgridcolor": "#C8D4E3", "startlinecolor": "#2a3f5f" }, "baxis": { "gridcolor": "#C8D4E3", "linecolor": "#C8D4E3", "endlinecolor": "#2a3f5f", "minorgridcolor": "#C8D4E3", "startlinecolor": "#2a3f5f" } } ], "mesh3d": [ { "type": "mesh3d", "colorbar": { "ticks": "", "outlinewidth": 0 } } ], "contour": [ { "type": "contour", "colorbar": { "ticks": "", "outlinewidth": 0 }, "autocolorscale": true } ], "heatmap": [ { "type": "heatmap", "colorbar": { "ticks": "", "outlinewidth": 0 }, "autocolorscale": true } ], "scatter": [ { "type": "scatter", "marker": { "colorbar": { "ticks": "", "outlinewidth": 0 } } } ], "surface": [ { "type": "surface", "colorbar": { "ticks": "", "outlinewidth": 0 } } ], "heatmapgl": [ { "type": "heatmapgl", "colorbar": { "ticks": "", "outlinewidth": 0 } } ], "histogram": [ { "type": "histogram", "marker": { "colorbar": { "ticks": "", "outlinewidth": 0 } } } ], "parcoords": [ { "line": { "colorbar": { "ticks": "", "outlinewidth": 0 } }, "type": "parcoords" } ], "scatter3d": [ { "type": "scatter3d", "marker": { "colorbar": { "ticks": "", "outlinewidth": 0 } } } ], "scattergl": [ { "type": "scattergl", "marker": { "colorbar": { "ticks": "", "outlinewidth": 0 } } } ], "choropleth": [ { "type": "choropleth", "colorbar": { "ticks": "", "outlinewidth": 0 } } ], "scattergeo": [ { "type": "scattergeo", "marker": { "colorbar": { "ticks": "", "outlinewidth": 0 } } } ], "histogram2d": [ { "type": "histogram2d", "colorbar": { "ticks": "", "outlinewidth": 0 }, "autocolorscale": true } ], "scatterpolar": [ { "type": "scatterpolar", "marker": { "colorbar": { "ticks": "", "outlinewidth": 0 } } } ], "contourcarpet": [ { "type": "contourcarpet", "colorbar": { "ticks": "", "outlinewidth": 0 } } ], "scattercarpet": [ { "type": "scattercarpet", "marker": { "colorbar": { "ticks": "", "outlinewidth": 0 } } } ], "scattermapbox": [ { "type": "scattermapbox", "marker": { "colorbar": { "ticks": "", "outlinewidth": 0 } } } ], "scatterpolargl": [ { "type": "scatterpolargl", "marker": { "colorbar": { "ticks": "", "outlinewidth": 0 } } } ], "scatterternary": [ { "type": "scatterternary", "marker": { "colorbar": { "ticks": "", "outlinewidth": 0 } } } ], "histogram2dcontour": [ { "type": "histogram2dcontour", "colorbar": { "ticks": "", "outlinewidth": 0 }, "autocolorscale": true } ] }, "layout": { "geo": { "bgcolor": "white", "showland": true, "lakecolor": "white", "landcolor": "white", "showlakes": true, "subunitcolor": "#C8D4E3" }, "font": { "color": "#2a3f5f" }, "polar": { "bgcolor": "white", "radialaxis": { "ticks": "", "gridcolor": "#EBF0F8", "linecolor": "#EBF0F8" }, "angularaxis": { "ticks": "", "gridcolor": "#EBF0F8", "linecolor": "#EBF0F8" } }, "scene": { "xaxis": { "ticks": "", "gridcolor": "#DFE8F3", "gridwidth": 2, "linecolor": "#EBF0F8", "zerolinecolor": "#EBF0F8", "showbackground": true, "backgroundcolor": "white" }, "yaxis": { "ticks": "", "gridcolor": "#DFE8F3", "gridwidth": 2, "linecolor": "#EBF0F8", "zerolinecolor": "#EBF0F8", "showbackground": true, "backgroundcolor": "white" }, "zaxis": { "ticks": "", "gridcolor": "#DFE8F3", "gridwidth": 2, "linecolor": "#EBF0F8", "zerolinecolor": "#EBF0F8", "showbackground": true, "backgroundcolor": "white" } }, "title": { "x": 0.05 }, "xaxis": { "ticks": "", "gridcolor": "#EBF0F8", "linecolor": "#EBF0F8", "automargin": true, "zerolinecolor": "#EBF0F8", "zerolinewidth": 2 }, "yaxis": { "ticks": "", "gridcolor": "#EBF0F8", "linecolor": "#EBF0F8", "automargin": true, "zerolinecolor": "#EBF0F8", "zerolinewidth": 2 }, "ternary": { "aaxis": { "ticks": "", "gridcolor": "#DFE8F3", "linecolor": "#A2B1C6" }, "baxis": { "ticks": "", "gridcolor": "#DFE8F3", "linecolor": "#A2B1C6" }, "caxis": { "ticks": "", "gridcolor": "#DFE8F3", "linecolor": "#A2B1C6" }, "bgcolor": "white" }, "colorway": [ "#636efa", "#EF553B", "#00cc96", "#ab63fa", "#19d3f3", "#e763fa", "#fecb52", "#ffa15a", "#ff6692", "#b6e880" ], "hovermode": "closest", "colorscale": { "diverging": [ [ 0, "#8e0152" ], [ 0.1, "#c51b7d" ], [ 0.2, "#de77ae" ], [ 0.3, "#f1b6da" ], [ 0.4, "#fde0ef" ], [ 0.5, "#f7f7f7" ], [ 0.6, "#e6f5d0" ], [ 0.7, "#b8e186" ], [ 0.8, "#7fbc41" ], [ 0.9, "#4d9221" ], [ 1, "#276419" ] ], "sequential": [ [ 0, "#0508b8" ], [ 0.0893854748603352, "#1910d8" ], [ 0.1787709497206704, "#3c19f0" ], [ 0.2681564245810056, "#6b1cfb" ], [ 0.3575418994413408, "#981cfd" ], [ 0.44692737430167595, "#bf1cfd" ], [ 0.5363128491620112, "#dd2bfd" ], [ 0.6256983240223464, "#f246fe" ], [ 0.7150837988826816, "#fc67fd" ], [ 0.8044692737430168, "#fe88fc" ], [ 0.8938547486033519, "#fea5fd" ], [ 0.9832402234636871, "#febefe" ], [ 1, "#fec3fe" ] ], "sequentialminus": [ [ 0, "#0508b8" ], [ 0.0893854748603352, "#1910d8" ], [ 0.1787709497206704, "#3c19f0" ], [ 0.2681564245810056, "#6b1cfb" ], [ 0.3575418994413408, "#981cfd" ], [ 0.44692737430167595, "#bf1cfd" ], [ 0.5363128491620112, "#dd2bfd" ], [ 0.6256983240223464, "#f246fe" ], [ 0.7150837988826816, "#fc67fd" ], [ 0.8044692737430168, "#fe88fc" ], [ 0.8938547486033519, "#fea5fd" ], [ 0.9832402234636871, "#febefe" ], [ 1, "#fec3fe" ] ] }, "plot_bgcolor": "white", "paper_bgcolor": "white", "shapedefaults": { "line": { "width": 0 }, "opacity": 0.4, "fillcolor": "#506784" }, "annotationdefaults": { "arrowhead": 0, "arrowcolor": "#506784", "arrowwidth": 1 } }, "themeRef": "PLOTLY_WHITE" } } }, "height": null, "width": null, "user": { "profile_url": "https://chart-studio.plotly.com/~freeform2", "avatar_url": "https://storage.googleapis.com/plotly-prod-profiles/48.jpg", "background_url": "https://storage.googleapis.com/plotly-prod-profiles/bg-1.jpg", "bio": "", "nickname": "", "website": "", "stream_tokens": null, "feature_set_id": null, "csrf_token": null, "date_joined": "2025-08-25 07:06:22", "mapbox_access_tokens": null, "has_password": null, "username": "freeform2", "email": null, "is_active": null, "readonly": null, "is_dash_creator": null, "dash_created_count": null, "is_chart_creator": null, "charts_created_count": null } }, { "creation_time": "2025-09-02T11:15:18.748183Z", "comments": { "results": [], "count": 0 }, "parented": true, "embed_url": "https://chart-studio.plotly.com/~Divyam9024/1.embed", "fid": "Divyam9024:1", "filename": "Stress vs Strain & Displacement Curve", "filetype": "plot", "img_url": "https://storage.googleapis.com/plotly-prod-images/Divyam9024/1/9_J56QURZY43E4CXELS30279SYUEOSU4.png", "image_urls": { "default": "https://storage.googleapis.com/plotly-prod-images/Divyam9024/1/2_C5QPHKX2UAP2X6JVX43ZVDMKOOZHAT.png", "block-thumb": "https://storage.googleapis.com/plotly-prod-images/Divyam9024/1/8_SKGA1M2SZOWR9OZS0RRP7NMX0MD4LX.png", "list-thumb": "https://storage.googleapis.com/plotly-prod-images/Divyam9024/1/9_J56QURZY43E4CXELS30279SYUEOSU4.png" }, "api_urls": { "files": "https://api.plotly.com/v2/files/Divyam9024:1", "plots": "https://api.plotly.com/v2/plots/Divyam9024:1", "parent": "https://api.plotly.com/v2/folders/home?user=Divyam9024" }, "owner": "Divyam9024", "parent": -1, "preview": "", "referencers": [], "references": [], "title": "", "views": 0, "web_url": "https://chart-studio.plotly.com/~Divyam9024/1/", "world_readable": true, "date_modified": "2025-09-02T11:15:18.757Z", "stars": { "results": [], "count": 0 }, "collaborators": { "results": [], "count": 0 }, "subfolder_count": null, "refresh_interval": null, "organize_view_url": "https://chart-studio.plotly.com/~Divyam9024/1/", "current_user_permission": "read", "is_theme": null, "is_template": false, "autosize": true, "caption": "", "figure": { "data": [ { "meta": { "columnNames": { "x": "E", "y": "D" } }, "mode": "markers", "type": "scatter", "xsrc": "Divyam9024:0:abbac4", "ysrc": "Divyam9024:0:cf255e", "marker": { "color": "rgb(250, 198, 99)", "symbol": "circle" } }, { "meta": { "columnNames": { "x": "G", "y": "D" } }, "mode": "markers", "type": "scatter", "xsrc": "Divyam9024:0:037062", "ysrc": "Divyam9024:0:cf255e", "marker": { "color": "rgb(59, 201, 239)", "symbol": "square" }, "stackgroup": null } ], "frames": [], "layout": { "title": { "text": "Stress vs Strain & Displacement Curve" }, "xaxis": { "type": "linear", "range": [ -0.8433753008895866, 0.7709753008895865 ], "title": { "text": "Strain (%) | -Displacement (mm)" }, "showgrid": true, "autorange": true, "gridcolor": "rgb(203, 214, 232)", "gridwidth": 1 }, "yaxis": { "type": "linear", "range": [ -1.3487393721543255, 21.917139372154324 ], "title": { "text": "Stress (MPa)" }, "autorange": true }, "autosize": true, "template": { "data": { "bar": [ { "type": "bar", "marker": { "colorbar": { "ticks": "", "outlinewidth": 0 } } } ], "table": [ { "type": "table", "cells": { "fill": { "color": "#EBF0F8" }, "line": { "color": "white" } }, "header": { "fill": { "color": "#C8D4E3" }, "line": { "color": "white" } } } ], "carpet": [ { "type": "carpet", "aaxis": { "gridcolor": "#C8D4E3", "linecolor": "#C8D4E3", "endlinecolor": "#2a3f5f", "minorgridcolor": "#C8D4E3", "startlinecolor": "#2a3f5f" }, "baxis": { "gridcolor": "#C8D4E3", "linecolor": "#C8D4E3", "endlinecolor": "#2a3f5f", "minorgridcolor": "#C8D4E3", "startlinecolor": "#2a3f5f" } } ], "mesh3d": [ { "type": "mesh3d", "colorbar": { "ticks": "", "outlinewidth": 0 } } ], "contour": [ { "type": "contour", "colorbar": { "ticks": "", "outlinewidth": 0 }, "autocolorscale": true } ], "heatmap": [ { "type": "heatmap", "colorbar": { "ticks": "", "outlinewidth": 0 }, "autocolorscale": true } ], "scatter": [ { "type": "scatter", "marker": { "colorbar": { "ticks": "", "outlinewidth": 0 } } } ], "surface": [ { "type": "surface", "colorbar": { "ticks": "", "outlinewidth": 0 } } ], "heatmapgl": [ { "type": "heatmapgl", "colorbar": { "ticks": "", "outlinewidth": 0 } } ], "histogram": [ { "type": "histogram", "marker": { "colorbar": { "ticks": "", "outlinewidth": 0 } } } ], "parcoords": [ { "line": { "colorbar": { "ticks": "", "outlinewidth": 0 } }, "type": "parcoords" } ], "scatter3d": [ { "type": "scatter3d", "marker": { "colorbar": { "ticks": "", "outlinewidth": 0 } } } ], "scattergl": [ { "type": "scattergl", "marker": { "colorbar": { "ticks": "", "outlinewidth": 0 } } } ], "choropleth": [ { "type": "choropleth", "colorbar": { "ticks": "", "outlinewidth": 0 } } ], "scattergeo": [ { "type": "scattergeo", "marker": { "colorbar": { "ticks": "", "outlinewidth": 0 } } } ], "histogram2d": [ { "type": "histogram2d", "colorbar": { "ticks": "", "outlinewidth": 0 }, "autocolorscale": true } ], "scatterpolar": [ { "type": "scatterpolar", "marker": { "colorbar": { "ticks": "", "outlinewidth": 0 } } } ], "contourcarpet": [ { "type": "contourcarpet", "colorbar": { "ticks": "", "outlinewidth": 0 } } ], "scattercarpet": [ { "type": "scattercarpet", "marker": { "colorbar": { "ticks": "", "outlinewidth": 0 } } } ], "scattermapbox": [ { "type": "scattermapbox", "marker": { "colorbar": { "ticks": "", "outlinewidth": 0 } } } ], "scatterpolargl": [ { "type": "scatterpolargl", "marker": { "colorbar": { "ticks": "", "outlinewidth": 0 } } } ], "scatterternary": [ { "type": "scatterternary", "marker": { "colorbar": { "ticks": "", "outlinewidth": 0 } } } ], "histogram2dcontour": [ { "type": "histogram2dcontour", "colorbar": { "ticks": "", "outlinewidth": 0 }, "autocolorscale": true } ] }, "layout": { "geo": { "bgcolor": "white", "showland": true, "lakecolor": "white", "landcolor": "white", "showlakes": true, "subunitcolor": "#C8D4E3" }, "font": { "color": "#2a3f5f" }, "polar": { "bgcolor": "white", "radialaxis": { "ticks": "", "gridcolor": "#EBF0F8", "linecolor": "#EBF0F8" }, "angularaxis": { "ticks": "", "gridcolor": "#EBF0F8", "linecolor": "#EBF0F8" } }, "scene": { "xaxis": { "ticks": "", "gridcolor": "#DFE8F3", "gridwidth": 2, "linecolor": "#EBF0F8", "zerolinecolor": "#EBF0F8", "showbackground": true, "backgroundcolor": "white" }, "yaxis": { "ticks": "", "gridcolor": "#DFE8F3", "gridwidth": 2, "linecolor": "#EBF0F8", "zerolinecolor": "#EBF0F8", "showbackground": true, "backgroundcolor": "white" }, "zaxis": { "ticks": "", "gridcolor": "#DFE8F3", "gridwidth": 2, "linecolor": "#EBF0F8", "zerolinecolor": "#EBF0F8", "showbackground": true, "backgroundcolor": "white" } }, "title": { "x": 0.05 }, "xaxis": { "ticks": "", "gridcolor": "#EBF0F8", "linecolor": "#EBF0F8", "automargin": true, "zerolinecolor": "#EBF0F8", "zerolinewidth": 2 }, "yaxis": { "ticks": "", "gridcolor": "#EBF0F8", "linecolor": "#EBF0F8", "automargin": true, "zerolinecolor": "#EBF0F8", "zerolinewidth": 2 }, "ternary": { "aaxis": { "ticks": "", "gridcolor": "#DFE8F3", "linecolor": "#A2B1C6" }, "baxis": { "ticks": "", "gridcolor": "#DFE8F3", "linecolor": "#A2B1C6" }, "caxis": { "ticks": "", "gridcolor": "#DFE8F3", "linecolor": "#A2B1C6" }, "bgcolor": "white" }, "colorway": [ "#636efa", "#EF553B", "#00cc96", "#ab63fa", "#19d3f3", "#e763fa", "#fecb52", "#ffa15a", "#ff6692", "#b6e880" ], "hovermode": "closest", "colorscale": { "diverging": [ [ 0, "#8e0152" ], [ 0.1, "#c51b7d" ], [ 0.2, "#de77ae" ], [ 0.3, "#f1b6da" ], [ 0.4, "#fde0ef" ], [ 0.5, "#f7f7f7" ], [ 0.6, "#e6f5d0" ], [ 0.7, "#b8e186" ], [ 0.8, "#7fbc41" ], [ 0.9, "#4d9221" ], [ 1, "#276419" ] ], "sequential": [ [ 0, "#0508b8" ], [ 0.0893854748603352, "#1910d8" ], [ 0.1787709497206704, "#3c19f0" ], [ 0.2681564245810056, "#6b1cfb" ], [ 0.3575418994413408, "#981cfd" ], [ 0.44692737430167595, "#bf1cfd" ], [ 0.5363128491620112, "#dd2bfd" ], [ 0.6256983240223464, "#f246fe" ], [ 0.7150837988826816, "#fc67fd" ], [ 0.8044692737430168, "#fe88fc" ], [ 0.8938547486033519, "#fea5fd" ], [ 0.9832402234636871, "#febefe" ], [ 1, "#fec3fe" ] ], "sequentialminus": [ [ 0, "#0508b8" ], [ 0.0893854748603352, "#1910d8" ], [ 0.1787709497206704, "#3c19f0" ], [ 0.2681564245810056, "#6b1cfb" ], [ 0.3575418994413408, "#981cfd" ], [ 0.44692737430167595, "#bf1cfd" ], [ 0.5363128491620112, "#dd2bfd" ], [ 0.6256983240223464, "#f246fe" ], [ 0.7150837988826816, "#fc67fd" ], [ 0.8044692737430168, "#fe88fc" ], [ 0.8938547486033519, "#fea5fd" ], [ 0.9832402234636871, "#febefe" ], [ 1, "#fec3fe" ] ] }, "plot_bgcolor": "white", "paper_bgcolor": "white", "shapedefaults": { "line": { "width": 0 }, "opacity": 0.4, "fillcolor": "#506784" }, "annotationdefaults": { "arrowhead": 0, "arrowcolor": "#506784", "arrowwidth": 1 } }, "themeRef": "PLOTLY_WHITE" } } }, "height": null, "width": null, "user": { "profile_url": "https://chart-studio.plotly.com/~Divyam9024", "avatar_url": "https://storage.googleapis.com/plotly-prod-profiles/85.jpg", "background_url": "https://storage.googleapis.com/plotly-prod-profiles/bg-9.jpg", "bio": "", "nickname": "", "website": "", "stream_tokens": null, "feature_set_id": null, "csrf_token": null, "date_joined": "2025-09-02 11:03:46", "mapbox_access_tokens": null, "has_password": null, "username": "Divyam9024", "email": null, "is_active": null, "readonly": null, "is_dash_creator": null, "dash_created_count": null, "is_chart_creator": null, "charts_created_count": null } }, { "creation_time": "2025-09-02T11:05:04.164259Z", "comments": { "results": [], "count": 0 }, "parented": true, "embed_url": "https://chart-studio.plotly.com/~tinkasingh/274.embed", "fid": "tinkasingh:274", "filename": "Plot 274", "filetype": "plot", "img_url": "https://storage.googleapis.com/plotly-prod-images/tinkasingh/274/9_11YFKSUCF3FCZT09TYXXF8N2SDFETG.png", "image_urls": { "default": "https://storage.googleapis.com/plotly-prod-images/tinkasingh/274/2_L7LAZVGAZ49VRDYNKA18P5NKJKGIGS.png", "block-thumb": "https://storage.googleapis.com/plotly-prod-images/tinkasingh/274/8_GOBUTZT6MVDPZLWZU5O0UO9DF8E2I7.png", "list-thumb": "https://storage.googleapis.com/plotly-prod-images/tinkasingh/274/9_11YFKSUCF3FCZT09TYXXF8N2SDFETG.png" }, "api_urls": { "files": "https://api.plotly.com/v2/files/tinkasingh:274", "plots": "https://api.plotly.com/v2/plots/tinkasingh:274", "parent": "https://api.plotly.com/v2/folders/home?user=tinkasingh" }, "owner": "tinkasingh", "parent": -1, "preview": "", "referencers": [], "references": [], "title": "", "views": 0, "web_url": "https://chart-studio.plotly.com/~tinkasingh/274/", "world_readable": true, "date_modified": "2025-09-02T11:05:04.176Z", "stars": { "results": [], "count": 0 }, "collaborators": { "results": [], "count": 0 }, "subfolder_count": null, "refresh_interval": null, "organize_view_url": "https://chart-studio.plotly.com/~tinkasingh/274/", "current_user_permission": "read", "is_theme": null, "is_template": false, "autosize": true, "caption": "", "figure": { "data": [ { "line": { "color": "#317DBD", "shape": "spline" }, "meta": { "columnNames": { "x": "AnandVihar PM value, x", "y": "AnandVihar PM value, y" } }, "mode": "lines", "name": "Pan Bazaar", "type": "scatter", "xsrc": "tinkasingh:272:8bd8fa", "ysrc": "tinkasingh:272:1f4a1a", "opacity": 0.8, "visible": true }, { "meta": { "columnNames": { "x": "Detected Peaks, x", "y": "Detected Peaks, y" } }, "mode": "markers", "name": "Detected Peaks", "type": "scatter", "xsrc": "tinkasingh:272:d97c84", "ysrc": "tinkasingh:272:769e98", "marker": { "size": 8, "color": "rgb(255,0,0)", "symbol": "cross" } }, { "meta": { "columnNames": { "x": "Detected Peaks My ALGO, x", "y": "Detected Peaks My ALGO, y" } }, "mode": "markers", "name": "Detected Peaks MLP", "type": "scatter", "xsrc": "tinkasingh:272:8d3c16", "ysrc": "tinkasingh:272:52b440", "marker": { "size": 8, "color": "rgb(0,128,128)", "symbol": "cross" } } ], "frames": [], "layout": { "title": { "text": "PM 2.5" }, "xaxis": { "type": "date", "range": [ "2015-12-02 02:11:39.5536", "2017-06-09 09:48:20.4464" ], "title": { "text": "Time" }, "autorange": true, "showspikes": false, "rangeslider": { "range": [ "2015-12-02 02:11:39.5536", "2017-06-09 09:48:20.4464" ], "yaxis": {}, "visible": false, "autorange": true }, "rangeselector": { "buttons": [ { "step": "day", "count": 1, "label": "1 day", "stepmode": "backward" }, { "step": "hour", "count": 6, "label": "6 hours", "stepmode": "backward" }, { "step": "month", "count": 1, "label": "1 month", "stepmode": "backward" }, { "step": "all" } ] } }, "yaxis": { "type": "linear", "range": [ -57.961736369608055, 1051.272991022553 ], "title": { "text": "PM 2.5 (µg/m³)" }, "autorange": true, "showspikes": false }, "autosize": true, "hovermode": "x", "showlegend": true } }, "height": null, "width": null, "user": { "profile_url": "https://chart-studio.plotly.com/~tinkasingh", "avatar_url": "https://storage.googleapis.com/plotly-prod-profiles/38.jpg", "background_url": "https://storage.googleapis.com/plotly-prod-profiles/bg-5.jpg", "bio": "", "nickname": "", "website": "", "stream_tokens": null, "feature_set_id": null, "csrf_token": null, "date_joined": "2017-11-05 14:36:17", "mapbox_access_tokens": null, "has_password": null, "username": "tinkasingh", "email": null, "is_active": null, "readonly": null, "is_dash_creator": null, "dash_created_count": null, "is_chart_creator": null, "charts_created_count": null } } ] }
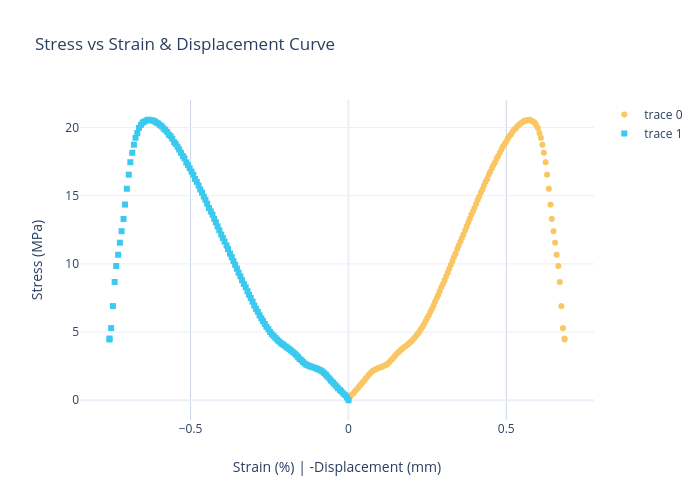