Plots List
Plots
This endpoint handles manipulation of Plotly plot files.
Reference
Authorization
Any user with or without a Plotly account may view public plots. For private plots, see authentication.
Actions
list
Listing all public plots can be done via a GET request to this endpoint.
By default, plots will be listed in order of date created. The order_by
query parameter is accepted at this endpoint. Currently, only ordering by
views is supported. It is possible to filter the plots by quality
with min_quality or max_quality as query parameter.
Example:
// GET https://api.plotly.com/v2/plots/ ---> 200

// GET https://api.plotly.com/v2/plots/?order_by=-views ---> 200

// GET https://api.plotly.com/v2/plots/?min_quality=5 ---> 200

// GET https://api.plotly.com/v2/plots/?max_quality=5 ---> 200
feed
Listing all handpicked feed plots can be done via a GET request to this endpoint. By default, plots will be listed in a random order.
Example:
// GET https://api.plotly.com/v2/plots/feed ---> 200
create
You can create new plot resources here. The only required field is 'figure'. Currently, the figure is restricted to only contain references to grid data. That is, this will fail if raw data arrays are passed in. To create and manipulate underlying grids for plots, see the grids endpoint.
Example:
// This fails because a figure field is required.
// POST https://api.plotly.com/v2/plots ---> 400 Bad Request
{}

// This fails because the figure has raw data
//POST https://api.plotly.com/v2/plots ---> 400 Bad Request
{
    "figure": {"data": [{"y": ['this', 'is', 'raw', 'data']}]}
}

// This succeeds because the figure has src keys, not raw data.
//POST https://api.plotly.com/v2/plots ---> 200 OK
{
    "figure": {"data": [{"ysrc": "sven:88:u8nd62"}]}
}
When creating a grid, you can optionally specify a source_fid to specify where a plot has come from:
- source_fid: the fid of a plot that was copied (and presumably edited) to produce this one
detail
There is a lot of meta information stored about plot files including filename, title, share_url, and content_url to name a few.
This information can only be reached with a GET to this endpoint.
Example:
// GET https://api.plotly.com/v2/plots/iheartgraphs:90
content
The contents of a plot can be downloaded via the content resource. The plot
content contains referenced grid/column data by default. If you wish to
return the raw grid/column data, the inline_data=true query must be included
in the request url. The Content-Type header will be appropriately set for the
response body.
Alternatively, you can set ?map_data=unreadable to append a mapping of
sources to data that belongs to grids which are unreadable for the
requestor. This is useful when you have read access to another users plot,
but that plot contains grid references which you don't have access to.
Examples:
// Returns referenced grid/column data
// GET https://api.plotly.com/v2/plots/iheartgraphs:90/content ---> 200 OK

// Returns full grid/column data
// GET https://api.plotly.com/v2/plots/iheartgraphs:90/content?inline_data=true ---> 200 OK

// Returns full grid/column data when requestor doesn't have permission
// to read the referenced grid.
// GET https://api.plotly.com/v2/plots/iheartgraphs:90/content?map_data=unreadable ---> 200 OK
GET /v2/plots/?cursor=cj0xJnA9MjAyNS0wOS0wNSsxOSUzQTI0JTNBMTcuMjE3ODUwJTJCMDAlM0EwMA%3D%3D&format=api
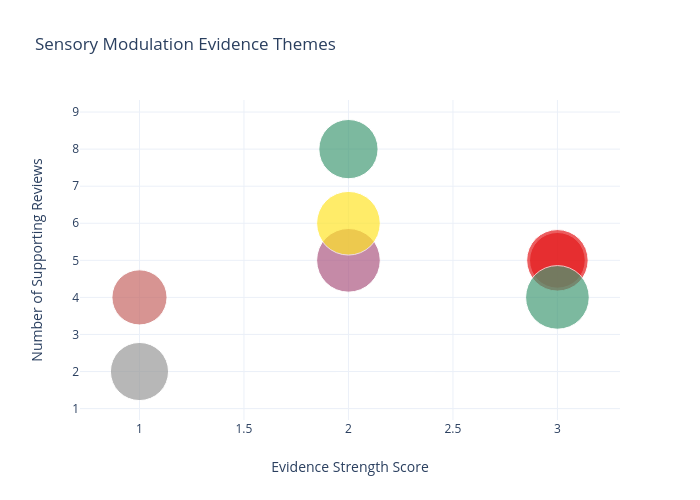
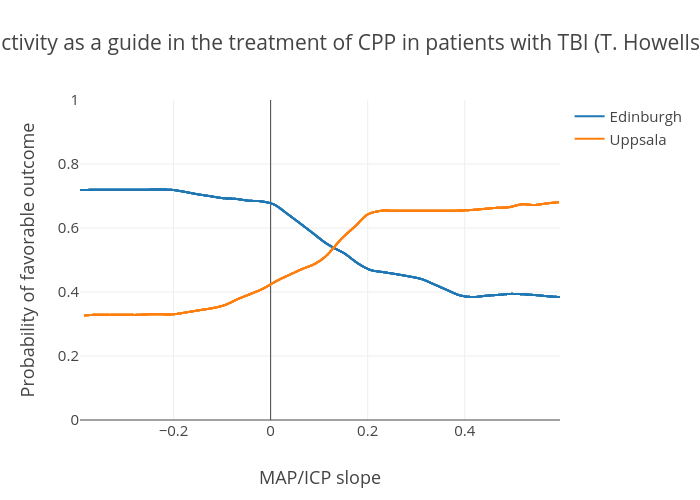
{ "next": "https://api.plotly.com/v2/plots/?cursor=cD0yMDI1LTA5LTA1KzE5JTNBMjUlM0E0Ni45NDc1MDklMkIwMCUzQTAw&format=api", "previous": "https://api.plotly.com/v2/plots/?cursor=cj0xJnA9MjAyNS0wOS0wNisxMCUzQTU3JTNBMzQuMDI5OTc3JTJCMDAlM0EwMA%3D%3D&format=api", "results": [ { "creation_time": "2025-09-06T10:57:34.029977Z", "comments": { "results": [], "count": 0 }, "parented": true, "embed_url": "https://chart-studio.plotly.com/~bmarinob/38.embed", "fid": "bmarinob:38", "filename": "Plot 38", "filetype": "plot", "img_url": "https://api.plotly.com/v2/files/bmarinob:38/image?image_name=list-thumb", "image_urls": { "default": "https://api.plotly.com/v2/files/bmarinob:38/image?image_name=default", "block-thumb": "https://storage.googleapis.com/plotly-prod-images/bmarinob/38/8_YTPLCX8V5JWD092V6LTG0W77E86QIS.png", "list-thumb": "https://api.plotly.com/v2/files/bmarinob:38/image?image_name=list-thumb" }, "api_urls": { "files": "https://api.plotly.com/v2/files/bmarinob:38", "plots": "https://api.plotly.com/v2/plots/bmarinob:38", "parent": "https://api.plotly.com/v2/folders/home?user=bmarinob" }, "owner": "bmarinob", "parent": -1, "preview": "", "referencers": [], "references": [], "title": "", "views": 0, "web_url": "https://chart-studio.plotly.com/~bmarinob/38/", "world_readable": true, "date_modified": "2025-09-14T16:22:59.478Z", "stars": { "results": [], "count": 0 }, "collaborators": { "results": [], "count": 0 }, "subfolder_count": null, "refresh_interval": null, "organize_view_url": "https://chart-studio.plotly.com/~bmarinob/38/", "current_user_permission": "read", "is_theme": null, "is_template": false, "autosize": true, "caption": "", "figure": { "data": [ { "line": { "width": 1 }, "meta": { "columnNames": { "x": "Year-4968", "y": "tCO2-4968" } }, "mode": "markers+lines", "name": "4968", "type": "scatter", "xsrc": "bmarinob:37:43910b", "ysrc": "bmarinob:37:32926f", "marker": { "size": 10, "color": "rgb(2, 5, 39)", "symbol": "circle-open" }, "selectedpoints": [ 0, 1, 2, 3, 4, 5, 6, 7, 8, 9, 10, 11, 12, 13, 14, 15, 16, 17, 18, 19, 20, 21, 22, 23, 24, 25, 26, 27, 28, 29, 30 ] }, { "line": { "width": 1 }, "meta": { "columnNames": { "x": "Year -3711", "y": "tCO2-3711" } }, "mode": "markers+lines", "name": "3711", "type": "scatter", "xsrc": "bmarinob:37:079fd7", "ysrc": "bmarinob:37:81f93a", "marker": { "size": 10, "color": "rgb(21, 21, 21)", "symbol": "square" }, "visible": true, "stackgroup": null, "selectedpoints": [ 0, 1, 2, 3, 4, 5, 6, 7, 8, 9, 10, 11, 12, 13, 14, 15, 16, 17, 18, 19, 20, 21, 22, 23, 24, 25, 26, 27, 28, 29, 30 ] }, { "line": { "width": 1 }, "meta": { "columnNames": { "x": "Year-3575", "y": "TCO2-3575" } }, "mode": "markers+lines", "name": "3575", "type": "scatter", "xsrc": "bmarinob:37:e48b59", "ysrc": "bmarinob:37:b5a3d0", "marker": { "size": 10, "color": "rgb(16, 16, 16)", "symbol": "diamond-open" }, "stackgroup": null, "selectedpoints": [ 0, 1, 2, 3, 4, 5, 6, 7, 8, 9, 10, 11, 12, 13, 14, 15, 16, 17, 18, 19, 20, 21, 22, 23, 24, 25, 26, 27, 28, 29, 30 ] }, { "line": { "width": 1 }, "meta": { "columnNames": { "x": "Year-3589", "y": "tCO2-3589" } }, "mode": "markers+lines", "name": "3589", "type": "scatter", "xsrc": "bmarinob:37:4697d9", "ysrc": "bmarinob:37:f35ecd", "marker": { "size": 10, "color": "rgb(10, 1, 20)", "symbol": "diamond-tall-open" }, "stackgroup": null, "selectedpoints": [ 0, 1, 2, 3, 4, 5, 6, 7, 8, 9, 10, 11, 12, 13, 14, 15, 16, 17, 18, 19, 20, 21, 22, 23, 24, 25, 26, 27, 28, 29, 30 ] }, { "line": { "width": 1 }, "meta": { "columnNames": { "x": "Year-934", "y": "tCO2-934" } }, "mode": "markers+lines", "name": "934", "type": "scatter", "xsrc": "bmarinob:37:a860f9", "ysrc": "bmarinob:37:8a99ee", "marker": { "size": 10, "color": "rgb(1, 13, 15)" }, "visible": true, "stackgroup": null, "selectedpoints": [ 0, 1, 2, 3, 4, 5, 6, 7, 8, 9, 10, 11, 12, 13, 14, 15, 16, 17, 18, 19, 20, 21, 22, 23, 24, 25, 26, 27, 28, 29, 30 ] }, { "meta": { "columnNames": { "x": "Year-3592", "y": "tCO2-3592" } }, "mode": "markers+lines", "name": "3592", "type": "scatter", "xsrc": "bmarinob:37:ba5237", "ysrc": "bmarinob:37:f9587d", "marker": { "size": 10, "color": "rgb(38, 37, 38)", "symbol": "star-square-open" }, "stackgroup": null, "selectedpoints": [ 0, 1, 2, 3, 4, 5, 6, 7, 8, 9, 10, 11, 12, 13, 14, 15, 16, 17, 18, 19, 20, 21, 22, 23, 24, 25, 26, 27, 28, 29 ] }, { "line": { "width": 1 }, "meta": { "columnNames": { "x": "Year-2363", "y": "tCO2-2363" } }, "mode": "markers+lines", "name": "2363", "type": "scatter", "xsrc": "bmarinob:37:92dd90", "ysrc": "bmarinob:37:2b59d0", "marker": { "size": 10, "color": "rgb(24, 24, 23)", "symbol": "square-open" }, "visible": true, "stackgroup": null, "selectedpoints": [ 0, 1, 2, 3, 4, 5, 6, 7, 8, 9, 10, 11, 12, 13, 14, 15, 16, 17, 18, 19, 20, 21, 22, 23, 24, 25, 26, 27, 28, 29 ] }, { "line": { "width": 1 }, "meta": { "columnNames": { "x": "Year-562", "y": "tCO2-562" } }, "mode": "markers+lines", "name": "562", "type": "scatter", "xsrc": "bmarinob:37:89479e", "ysrc": "bmarinob:37:82571c", "marker": { "size": 10, "color": "rgb(18, 18, 18)", "symbol": "diamond-open" }, "stackgroup": null, "selectedpoints": [ 0, 1, 2, 3, 4, 5, 6, 7, 8, 9, 10, 11, 12, 13, 14, 15, 16, 17, 18, 19, 20, 21, 22, 23, 24, 25, 26, 27, 28 ] }, { "line": { "width": 1 }, "meta": { "columnNames": { "x": "Year-1408", "y": "tCO2-1408" } }, "mode": "markers+lines", "name": "1408", "type": "scatter", "xsrc": "bmarinob:37:0d6107", "ysrc": "bmarinob:37:eb1b97", "marker": { "size": 10, "color": "rgb(28, 27, 27)", "symbol": "cross-open" }, "stackgroup": null, "selectedpoints": [ 0, 1, 2, 3, 4, 5, 6, 7, 8, 9, 10, 11, 12, 13, 14, 15, 16, 17, 18, 19, 20, 21, 22, 23, 24, 25, 26, 27, 28, 29 ] }, { "line": { "width": 1 }, "meta": { "columnNames": { "x": "Year-612", "y": "tCO2-612" } }, "mode": "markers+lines", "name": "612", "type": "scatter", "xsrc": "bmarinob:37:33fcb3", "ysrc": "bmarinob:37:f5e658", "marker": { "size": 10, "color": "rgb(16, 16, 16)", "symbol": "triangle-down-open" }, "stackgroup": null, "selectedpoints": [ 0, 1, 2, 3, 4, 5, 6, 7, 8, 9, 10, 11, 12, 13, 14, 15, 16, 17, 18, 19, 20, 21, 22, 23, 24, 25, 26, 27, 28, 29, 30 ] }, { "mode": "markers", "type": "scatter", "stackgroup": null } ], "frames": [], "layout": { "xaxis": { "type": "linear", "range": [ 2001.870152574698, 2055.129847425302 ], "title": { "font": { "size": 20 }, "text": "YEAR" }, "autorange": true }, "yaxis": { "type": "linear", "range": [ -42.59024135788033, 2.775845957880328 ], "title": { "font": { "size": 19 }, "text": "Net CO<sub>2</sub> Removal" }, "autorange": true }, "legend": { "x": 0.9621082713406205, "y": 0.7637377637377637, "title": { "text": "Project ID" } }, "margin": { "b": 0, "l": 80, "t": 0 }, "autosize": true, "dragmode": "select", "template": { "data": { "bar": [ { "type": "bar", "marker": { "colorbar": { "ticks": "", "outlinewidth": 0 } } } ], "table": [ { "type": "table", "cells": { "fill": { "color": "#EBF0F8" }, "line": { "color": "white" } }, "header": { "fill": { "color": "#C8D4E3" }, "line": { "color": "white" } } } ], "carpet": [ { "type": "carpet", "aaxis": { "gridcolor": "#C8D4E3", "linecolor": "#C8D4E3", "endlinecolor": "#2a3f5f", "minorgridcolor": "#C8D4E3", "startlinecolor": "#2a3f5f" }, "baxis": { "gridcolor": "#C8D4E3", "linecolor": "#C8D4E3", "endlinecolor": "#2a3f5f", "minorgridcolor": "#C8D4E3", "startlinecolor": "#2a3f5f" } } ], "mesh3d": [ { "type": "mesh3d", "colorbar": { "ticks": "", "outlinewidth": 0 } } ], "contour": [ { "type": "contour", "colorbar": { "ticks": "", "outlinewidth": 0 }, "autocolorscale": true } ], "heatmap": [ { "type": "heatmap", "colorbar": { "ticks": "", "outlinewidth": 0 }, "autocolorscale": true } ], "scatter": [ { "type": "scatter", "marker": { "colorbar": { "ticks": "", "outlinewidth": 0 } } } ], "surface": [ { "type": "surface", "colorbar": { "ticks": "", "outlinewidth": 0 } } ], "heatmapgl": [ { "type": "heatmapgl", "colorbar": { "ticks": "", "outlinewidth": 0 } } ], "histogram": [ { "type": "histogram", "marker": { "colorbar": { "ticks": "", "outlinewidth": 0 } } } ], "parcoords": [ { "line": { "colorbar": { "ticks": "", "outlinewidth": 0 } }, "type": "parcoords" } ], "scatter3d": [ { "type": "scatter3d", "marker": { "colorbar": { "ticks": "", "outlinewidth": 0 } } } ], "scattergl": [ { "type": "scattergl", "marker": { "colorbar": { "ticks": "", "outlinewidth": 0 } } } ], "choropleth": [ { "type": "choropleth", "colorbar": { "ticks": "", "outlinewidth": 0 } } ], "scattergeo": [ { "type": "scattergeo", "marker": { "colorbar": { "ticks": "", "outlinewidth": 0 } } } ], "histogram2d": [ { "type": "histogram2d", "colorbar": { "ticks": "", "outlinewidth": 0 }, "autocolorscale": true } ], "scatterpolar": [ { "type": "scatterpolar", "marker": { "colorbar": { "ticks": "", "outlinewidth": 0 } } } ], "contourcarpet": [ { "type": "contourcarpet", "colorbar": { "ticks": "", "outlinewidth": 0 } } ], "scattercarpet": [ { "type": "scattercarpet", "marker": { "colorbar": { "ticks": "", "outlinewidth": 0 } } } ], "scattermapbox": [ { "type": "scattermapbox", "marker": { "colorbar": { "ticks": "", "outlinewidth": 0 } } } ], "scatterpolargl": [ { "type": "scatterpolargl", "marker": { "colorbar": { "ticks": "", "outlinewidth": 0 } } } ], "scatterternary": [ { "type": "scatterternary", "marker": { "colorbar": { "ticks": "", "outlinewidth": 0 } } } ], "histogram2dcontour": [ { "type": "histogram2dcontour", "colorbar": { "ticks": "", "outlinewidth": 0 }, "autocolorscale": true } ] }, "layout": { "geo": { "bgcolor": "white", "showland": true, "lakecolor": "white", "landcolor": "white", "showlakes": true, "subunitcolor": "#C8D4E3" }, "font": { "color": "#2a3f5f" }, "polar": { "bgcolor": "white", "radialaxis": { "ticks": "", "gridcolor": "#EBF0F8", "linecolor": "#EBF0F8" }, "angularaxis": { "ticks": "", "gridcolor": "#EBF0F8", "linecolor": "#EBF0F8" } }, "scene": { "xaxis": { "ticks": "", "gridcolor": "#DFE8F3", "gridwidth": 2, "linecolor": "#EBF0F8", "zerolinecolor": "#EBF0F8", "showbackground": true, "backgroundcolor": "white" }, "yaxis": { "ticks": "", "gridcolor": "#DFE8F3", "gridwidth": 2, "linecolor": "#EBF0F8", "zerolinecolor": "#EBF0F8", "showbackground": true, "backgroundcolor": "white" }, "zaxis": { "ticks": "", "gridcolor": "#DFE8F3", "gridwidth": 2, "linecolor": "#EBF0F8", "zerolinecolor": "#EBF0F8", "showbackground": true, "backgroundcolor": "white" } }, "title": { "x": 0.05 }, "xaxis": { "ticks": "", "gridcolor": "#EBF0F8", "linecolor": "#EBF0F8", "automargin": true, "zerolinecolor": "#EBF0F8", "zerolinewidth": 2 }, "yaxis": { "ticks": "", "gridcolor": "#EBF0F8", "linecolor": "#EBF0F8", "automargin": true, "zerolinecolor": "#EBF0F8", "zerolinewidth": 2 }, "ternary": { "aaxis": { "ticks": "", "gridcolor": "#DFE8F3", "linecolor": "#A2B1C6" }, "baxis": { "ticks": "", "gridcolor": "#DFE8F3", "linecolor": "#A2B1C6" }, "caxis": { "ticks": "", "gridcolor": "#DFE8F3", "linecolor": "#A2B1C6" }, "bgcolor": "white" }, "colorway": [ "#636efa", "#EF553B", "#00cc96", "#ab63fa", "#19d3f3", "#e763fa", "#fecb52", "#ffa15a", "#ff6692", "#b6e880" ], "hovermode": "closest", "colorscale": { "diverging": [ [ 0, "#8e0152" ], [ 0.1, "#c51b7d" ], [ 0.2, "#de77ae" ], [ 0.3, "#f1b6da" ], [ 0.4, "#fde0ef" ], [ 0.5, "#f7f7f7" ], [ 0.6, "#e6f5d0" ], [ 0.7, "#b8e186" ], [ 0.8, "#7fbc41" ], [ 0.9, "#4d9221" ], [ 1, "#276419" ] ], "sequential": [ [ 0, "#0508b8" ], [ 0.0893854748603352, "#1910d8" ], [ 0.1787709497206704, "#3c19f0" ], [ 0.2681564245810056, "#6b1cfb" ], [ 0.3575418994413408, "#981cfd" ], [ 0.44692737430167595, "#bf1cfd" ], [ 0.5363128491620112, "#dd2bfd" ], [ 0.6256983240223464, "#f246fe" ], [ 0.7150837988826816, "#fc67fd" ], [ 0.8044692737430168, "#fe88fc" ], [ 0.8938547486033519, "#fea5fd" ], [ 0.9832402234636871, "#febefe" ], [ 1, "#fec3fe" ] ], "sequentialminus": [ [ 0, "#0508b8" ], [ 0.0893854748603352, "#1910d8" ], [ 0.1787709497206704, "#3c19f0" ], [ 0.2681564245810056, "#6b1cfb" ], [ 0.3575418994413408, "#981cfd" ], [ 0.44692737430167595, "#bf1cfd" ], [ 0.5363128491620112, "#dd2bfd" ], [ 0.6256983240223464, "#f246fe" ], [ 0.7150837988826816, "#fc67fd" ], [ 0.8044692737430168, "#fe88fc" ], [ 0.8938547486033519, "#fea5fd" ], [ 0.9832402234636871, "#febefe" ], [ 1, "#fec3fe" ] ] }, "plot_bgcolor": "white", "paper_bgcolor": "white", "shapedefaults": { "line": { "width": 0 }, "opacity": 0.4, "fillcolor": "#506784" }, "annotationdefaults": { "arrowhead": 0, "arrowcolor": "#506784", "arrowwidth": 1 } }, "themeRef": "PLOTLY_WHITE" }, "hovermode": "closest" } }, "height": null, "width": null, "user": { "profile_url": "https://chart-studio.plotly.com/~bmarinob", "avatar_url": "https://storage.googleapis.com/plotly-prod-profiles/67.jpg", "background_url": "https://storage.googleapis.com/plotly-prod-profiles/bg-0.jpg", "bio": "", "nickname": "", "website": "", "stream_tokens": null, "feature_set_id": null, "csrf_token": null, "date_joined": "2016-02-23 18:05:26", "mapbox_access_tokens": null, "has_password": null, "username": "bmarinob", "email": null, "is_active": null, "readonly": null, "is_dash_creator": null, "dash_created_count": null, "is_chart_creator": null, "charts_created_count": null } }, { "creation_time": "2025-09-06T09:41:38.423226Z", "comments": { "results": [], "count": 0 }, "parented": true, "embed_url": "https://chart-studio.plotly.com/~Ditari/1.embed", "fid": "Ditari:1", "filename": "Plot 1", "filetype": "plot", "img_url": "https://api.plotly.com/v2/files/Ditari:1/image?image_name=list-thumb", "image_urls": { "default": "https://api.plotly.com/v2/files/Ditari:1/image?image_name=default", "block-thumb": "https://storage.googleapis.com/plotly-prod-images/Ditari/1/8_7RU7W95OF6YXSK5Q8DXFWN165HIII2.png", "list-thumb": "https://api.plotly.com/v2/files/Ditari:1/image?image_name=list-thumb" }, "api_urls": { "files": "https://api.plotly.com/v2/files/Ditari:1", "plots": "https://api.plotly.com/v2/plots/Ditari:1", "parent": "https://api.plotly.com/v2/folders/home?user=Ditari" }, "owner": "Ditari", "parent": -1, "preview": "", "referencers": [], "references": [], "title": "", "views": 0, "web_url": "https://chart-studio.plotly.com/~Ditari/1/", "world_readable": true, "date_modified": "2025-09-06T09:41:38.434Z", "stars": { "results": [], "count": 0 }, "collaborators": { "results": [], "count": 0 }, "subfolder_count": null, "refresh_interval": null, "organize_view_url": "https://chart-studio.plotly.com/~Ditari/1/", "current_user_permission": "read", "is_theme": null, "is_template": false, "autosize": true, "caption": "", "figure": { "data": [ { "uid": "e60d71", "cmax": 7.99662, "cmin": -6.326524, "meta": { "columnNames": { "x": "x[0] - x[1] - x[2] - x[3] - x[4] - x[5] - x[6] - x[7] - x[8] - x[9] - x[10] - x[11] - x[12] - x[13] - x[14] - x[15] - x[16] - x[17] - x[18] - x[19] - x[20] - x[21] - x[22] - x[23] - x[24]", "y": "y[0] - y[1] - y[2] - y[3] - y[4] - y[5] - y[6] - y[7] - y[8] - y[9] - y[10] - y[11] - y[12] - y[13] - y[14] - y[15] - y[16] - y[17] - y[18] - y[19] - y[20] - y[21] - y[22] - y[23] - y[24]", "z": "z[0] - z[1] - z[2] - z[3] - z[4] - z[5] - z[6] - z[7] - z[8] - z[9] - z[10] - z[11] - z[12] - z[13] - z[14] - z[15] - z[16] - z[17] - z[18] - z[19] - z[20] - z[21] - z[22] - z[23] - z[24]" } }, "name": "", "type": "surface", "xsrc": "Ditari:0:06f98d,9c676d,6283a3,8c47de,e19191,7e0fc8,1b2b7c,e932f0,35e574,46593e,336921,08e266,4d8a3c,f3ab2f,d239ac,fac495,daa4f1,c0818d,7932bd,92a49e,5cf290,8d7981,d415a6,ac2eb5,fe532b", "ysrc": "Ditari:0:6095c0,69090d,5def62,70245c,d286f1,1d9fa5,d380ef,677cae,6066b9,bb886a,5a509a,29be7a,8a2edf,fef7e8,3ca645,a95daa,4871ed,e30849,688788,76757a,7836fa,ebefe2,87fc99,9a87f7,479cf2", "zmax": 7.99662, "zmin": -6.326524, "zsrc": "Ditari:0:ad2006,4fcf98,7cb594,3b3eaf,d30dc1,1de250,a41f62,042c78,da1fa5,56aa1e,7966ef,13b6f9,e41938,04c333,fd32fe,f61ebe,81d93f,5bfa3b,81cc30,fbc878,271ea5,280866,c8ba1b,7dfcfe,3dfe8d", "xaxis": "x", "yaxis": "y", "visible": true, "showscale": false, "colorscale": [ [ 0, "#440154" ], [ 0.06274509803921569, "#48186a" ], [ 0.12549019607843137, "#472d7b" ], [ 0.18823529411764706, "#424086" ], [ 0.25098039215686274, "#3b528b" ], [ 0.3137254901960784, "#33638d" ], [ 0.3764705882352941, "#2c728e" ], [ 0.4392156862745098, "#26828e" ], [ 0.5019607843137255, "#21918c" ], [ 0.5647058823529412, "#1fa088" ], [ 0.6274509803921569, "#28ae80" ], [ 0.6901960784313725, "#3fbc73" ], [ 0.7529411764705882, "#5ec962" ], [ 0.8156862745098039, "#84d44b" ], [ 0.8784313725490196, "#addc30" ], [ 0.9411764705882353, "#d8e219" ], [ 1, "#fde725" ] ], "showlegend": true, "autocolorscale": false } ], "frames": [], "layout": { "scene": { "xaxis": { "type": "linear", "gridcolor": "rgb(255, 255, 255)", "zerolinecolor": "rgb(255, 255, 255)", "showbackground": true, "backgroundcolor": "rgb(217, 217, 217)" }, "yaxis": { "type": "linear", "gridcolor": "rgb(255, 255, 255)", "zerolinecolor": "rgb(255, 255, 255)", "showbackground": true, "backgroundcolor": "rgb(217, 217, 217)" }, "zaxis": { "type": "linear", "gridcolor": "rgb(255, 255, 255)", "zerolinecolor": "rgb(255, 255, 255)", "showbackground": true, "backgroundcolor": "rgb(217, 217, 217)" }, "camera": { "up": { "x": 0, "y": 0, "z": 1 }, "eye": { "x": 0.6327354564971086, "y": 0.6494984255868516, "z": 0.874324975443727 }, "center": { "x": -0.030844038895567277, "y": 0.00222098940216298, "z": 0.02233581882146454 }, "projection": { "type": "perspective" } }, "dragmode": "turntable", "aspectratio": { "x": 1, "y": 1, "z": 1 } }, "width": 840, "xaxis": { "side": "bottom", "type": "linear", "anchor": "y", "domain": [ 0.13, 0.905 ] }, "yaxis": { "side": "left", "type": "linear", "anchor": "x", "domain": [ 0.11, 0.925 ] }, "height": 630, "margin": { "b": 0, "l": 0, "r": 0, "t": 0, "pad": 0 }, "dragmode": "zoom", "showlegend": false, "annotations": [ { "x": 0.5175, "y": 0.935, "text": "<b><b></b></b>", "xref": "paper", "yref": "paper", "align": "center", "xanchor": "center", "yanchor": "bottom", "showarrow": false } ] } }, "height": 630, "width": 840, "user": { "profile_url": "https://chart-studio.plotly.com/~Ditari", "avatar_url": "https://storage.googleapis.com/plotly-prod-profiles/89.jpg", "background_url": "https://storage.googleapis.com/plotly-prod-profiles/bg-0.jpg", "bio": "", "nickname": "", "website": "", "stream_tokens": null, "feature_set_id": null, "csrf_token": null, "date_joined": "2025-09-05 13:16:20", "mapbox_access_tokens": null, "has_password": null, "username": "Ditari", "email": null, "is_active": null, "readonly": null, "is_dash_creator": null, "dash_created_count": null, "is_chart_creator": null, "charts_created_count": null } }, { "creation_time": "2025-09-06T04:31:35.589084Z", "comments": { "results": [], "count": 0 }, "parented": true, "embed_url": "https://chart-studio.plotly.com/~SCM040/1.embed", "fid": "SCM040:1", "filename": "SM in MH settings", "filetype": "plot", "img_url": "https://storage.googleapis.com/plotly-prod-images/SCM040/1/9_SH61PZGHCPJ6CGQ0VC4SODTRTLA93Q.png", "image_urls": { "default": "https://storage.googleapis.com/plotly-prod-images/SCM040/1/2_ZITJGLW1VAGYXCRUMAT3DPQBRR2POG.png", "block-thumb": "https://storage.googleapis.com/plotly-prod-images/SCM040/1/8_QLO41618XKOEYIDJU5ENJ38W6R31YC.png", "list-thumb": "https://storage.googleapis.com/plotly-prod-images/SCM040/1/9_SH61PZGHCPJ6CGQ0VC4SODTRTLA93Q.png" }, "api_urls": { "files": "https://api.plotly.com/v2/files/SCM040:1", "plots": "https://api.plotly.com/v2/plots/SCM040:1", "parent": "https://api.plotly.com/v2/folders/home?user=SCM040" }, "owner": "SCM040", "parent": -1, "preview": "", "referencers": [], "references": [], "title": "", "views": 0, "web_url": "https://chart-studio.plotly.com/~SCM040/1/", "world_readable": true, "date_modified": "2025-09-06T11:04:28.213Z", "stars": { "results": [], "count": 0 }, "collaborators": { "results": [], "count": 0 }, "subfolder_count": null, "refresh_interval": null, "organize_view_url": "https://chart-studio.plotly.com/~SCM040/1/", "current_user_permission": "read", "is_theme": null, "is_template": false, "autosize": true, "caption": "", "figure": { "data": [ { "meta": { "columnNames": { "x": "Evidence Strength Score", "y": "Number Supporting Reviews ", "text": "Theme Name", "marker": { "size": "Average Quality Score ", "color": "Stakeholder Category " } } }, "mode": "markers", "type": "scatter", "xsrc": "SCM040:0:4f4866", "ysrc": "SCM040:0:29867e", "marker": { "meta": { "columnNames": { "size": "Average Quality Score ", "color": "Stakeholder Category " } }, "sizeref": 0.0014814814814814814, "sizesrc": "SCM040:0:51af51", "colorsrc": "SCM040:0:064234", "sizemode": "area", "colorscale": [ [ 0, "#e41a1c" ], [ 0.125, "#377eb8" ], [ 0.25, "#4daf4a" ], [ 0.375, "#984ea3" ], [ 0.5, "#ff7f00" ], [ 0.625, "#ffff33" ], [ 0.75, "#a65628" ], [ 0.875, "#f781bf" ], [ 1, "#999999" ] ] }, "textsrc": "SCM040:0:3d24ca", "cliponaxis": true, "autocolorscale": false } ], "frames": [], "layout": { "title": { "text": "Sensory Modulation Evidence Themes" }, "xaxis": { "type": "linear", "range": [ 0.7805063130171728, 3.2287595963707396 ], "title": { "text": "Evidence Strength Score" }, "autorange": true }, "yaxis": { "type": "linear", "range": [ 0.7514799703043031, 9.264815735241 ], "title": { "text": "Number of Supporting Reviews" }, "autorange": true }, "legend": { "title": { "text": "Stakeholder Categories <br>1=Patient Outcomes, 2=System Changes, 3=Staff Experiences, 4=Implementation, 5=Clinical Outcomes, 6=Professional Roles" } }, "autosize": true, "colorway": [ "#8dd3c7", "#ffffb3", "#bebada", "#fb8072", "#80b1d3", "#fdb462", "#b3de69", "#fccde5", "#d9d9d9", "#bc80bd", "#ccebc5", "#ffed6f" ], "template": { "data": { "bar": [ { "type": "bar", "marker": { "colorbar": { "ticks": "", "outlinewidth": 0 } } } ], "table": [ { "type": "table", "cells": { "fill": { "color": "#EBF0F8" }, "line": { "color": "white" } }, "header": { "fill": { "color": "#C8D4E3" }, "line": { "color": "white" } } } ], "carpet": [ { "type": "carpet", "aaxis": { "gridcolor": "#C8D4E3", "linecolor": "#C8D4E3", "endlinecolor": "#2a3f5f", "minorgridcolor": "#C8D4E3", "startlinecolor": "#2a3f5f" }, "baxis": { "gridcolor": "#C8D4E3", "linecolor": "#C8D4E3", "endlinecolor": "#2a3f5f", "minorgridcolor": "#C8D4E3", "startlinecolor": "#2a3f5f" } } ], "mesh3d": [ { "type": "mesh3d", "colorbar": { "ticks": "", "outlinewidth": 0 } } ], "contour": [ { "type": "contour", "colorbar": { "ticks": "", "outlinewidth": 0 }, "autocolorscale": true } ], "heatmap": [ { "type": "heatmap", "colorbar": { "ticks": "", "outlinewidth": 0 }, "autocolorscale": true } ], "scatter": [ { "type": "scatter", "marker": { "colorbar": { "ticks": "", "outlinewidth": 0 } } } ], "surface": [ { "type": "surface", "colorbar": { "ticks": "", "outlinewidth": 0 } } ], "heatmapgl": [ { "type": "heatmapgl", "colorbar": { "ticks": "", "outlinewidth": 0 } } ], "histogram": [ { "type": "histogram", "marker": { "colorbar": { "ticks": "", "outlinewidth": 0 } } } ], "parcoords": [ { "line": { "colorbar": { "ticks": "", "outlinewidth": 0 } }, "type": "parcoords" } ], "scatter3d": [ { "type": "scatter3d", "marker": { "colorbar": { "ticks": "", "outlinewidth": 0 } } } ], "scattergl": [ { "type": "scattergl", "marker": { "colorbar": { "ticks": "", "outlinewidth": 0 } } } ], "choropleth": [ { "type": "choropleth", "colorbar": { "ticks": "", "outlinewidth": 0 } } ], "scattergeo": [ { "type": "scattergeo", "marker": { "colorbar": { "ticks": "", "outlinewidth": 0 } } } ], "histogram2d": [ { "type": "histogram2d", "colorbar": { "ticks": "", "outlinewidth": 0 }, "autocolorscale": true } ], "scatterpolar": [ { "type": "scatterpolar", "marker": { "colorbar": { "ticks": "", "outlinewidth": 0 } } } ], "contourcarpet": [ { "type": "contourcarpet", "colorbar": { "ticks": "", "outlinewidth": 0 } } ], "scattercarpet": [ { "type": "scattercarpet", "marker": { "colorbar": { "ticks": "", "outlinewidth": 0 } } } ], "scattermapbox": [ { "type": "scattermapbox", "marker": { "colorbar": { "ticks": "", "outlinewidth": 0 } } } ], "scatterpolargl": [ { "type": "scatterpolargl", "marker": { "colorbar": { "ticks": "", "outlinewidth": 0 } } } ], "scatterternary": [ { "type": "scatterternary", "marker": { "colorbar": { "ticks": "", "outlinewidth": 0 } } } ], "histogram2dcontour": [ { "type": "histogram2dcontour", "colorbar": { "ticks": "", "outlinewidth": 0 }, "autocolorscale": true } ] }, "layout": { "geo": { "bgcolor": "white", "showland": true, "lakecolor": "white", "landcolor": "white", "showlakes": true, "subunitcolor": "#C8D4E3" }, "font": { "color": "#2a3f5f" }, "polar": { "bgcolor": "white", "radialaxis": { "ticks": "", "gridcolor": "#EBF0F8", "linecolor": "#EBF0F8" }, "angularaxis": { "ticks": "", "gridcolor": "#EBF0F8", "linecolor": "#EBF0F8" } }, "scene": { "xaxis": { "ticks": "", "gridcolor": "#DFE8F3", "gridwidth": 2, "linecolor": "#EBF0F8", "zerolinecolor": "#EBF0F8", "showbackground": true, "backgroundcolor": "white" }, "yaxis": { "ticks": "", "gridcolor": "#DFE8F3", "gridwidth": 2, "linecolor": "#EBF0F8", "zerolinecolor": "#EBF0F8", "showbackground": true, "backgroundcolor": "white" }, "zaxis": { "ticks": "", "gridcolor": "#DFE8F3", "gridwidth": 2, "linecolor": "#EBF0F8", "zerolinecolor": "#EBF0F8", "showbackground": true, "backgroundcolor": "white" } }, "title": { "x": 0.05 }, "xaxis": { "ticks": "", "gridcolor": "#EBF0F8", "linecolor": "#EBF0F8", "automargin": true, "zerolinecolor": "#EBF0F8", "zerolinewidth": 2 }, "yaxis": { "ticks": "", "gridcolor": "#EBF0F8", "linecolor": "#EBF0F8", "automargin": true, "zerolinecolor": "#EBF0F8", "zerolinewidth": 2 }, "ternary": { "aaxis": { "ticks": "", "gridcolor": "#DFE8F3", "linecolor": "#A2B1C6" }, "baxis": { "ticks": "", "gridcolor": "#DFE8F3", "linecolor": "#A2B1C6" }, "caxis": { "ticks": "", "gridcolor": "#DFE8F3", "linecolor": "#A2B1C6" }, "bgcolor": "white" }, "colorway": [ "#636efa", "#EF553B", "#00cc96", "#ab63fa", "#19d3f3", "#e763fa", "#fecb52", "#ffa15a", "#ff6692", "#b6e880" ], "hovermode": "closest", "colorscale": { "diverging": [ [ 0, "#8e0152" ], [ 0.1, "#c51b7d" ], [ 0.2, "#de77ae" ], [ 0.3, "#f1b6da" ], [ 0.4, "#fde0ef" ], [ 0.5, "#f7f7f7" ], [ 0.6, "#e6f5d0" ], [ 0.7, "#b8e186" ], [ 0.8, "#7fbc41" ], [ 0.9, "#4d9221" ], [ 1, "#276419" ] ], "sequential": [ [ 0, "#0508b8" ], [ 0.0893854748603352, "#1910d8" ], [ 0.1787709497206704, "#3c19f0" ], [ 0.2681564245810056, "#6b1cfb" ], [ 0.3575418994413408, "#981cfd" ], [ 0.44692737430167595, "#bf1cfd" ], [ 0.5363128491620112, "#dd2bfd" ], [ 0.6256983240223464, "#f246fe" ], [ 0.7150837988826816, "#fc67fd" ], [ 0.8044692737430168, "#fe88fc" ], [ 0.8938547486033519, "#fea5fd" ], [ 0.9832402234636871, "#febefe" ], [ 1, "#fec3fe" ] ], "sequentialminus": [ [ 0, "#0508b8" ], [ 0.0893854748603352, "#1910d8" ], [ 0.1787709497206704, "#3c19f0" ], [ 0.2681564245810056, "#6b1cfb" ], [ 0.3575418994413408, "#981cfd" ], [ 0.44692737430167595, "#bf1cfd" ], [ 0.5363128491620112, "#dd2bfd" ], [ 0.6256983240223464, "#f246fe" ], [ 0.7150837988826816, "#fc67fd" ], [ 0.8044692737430168, "#fe88fc" ], [ 0.8938547486033519, "#fea5fd" ], [ 0.9832402234636871, "#febefe" ], [ 1, "#fec3fe" ] ] }, "plot_bgcolor": "white", "paper_bgcolor": "white", "shapedefaults": { "line": { "width": 0 }, "opacity": 0.4, "fillcolor": "#506784" }, "annotationdefaults": { "arrowhead": 0, "arrowcolor": "#506784", "arrowwidth": 1 } }, "themeRef": "PLOTLY_WHITE" }, "showlegend": false } }, "height": null, "width": null, "user": { "profile_url": "https://chart-studio.plotly.com/~SCM040", "avatar_url": "https://storage.googleapis.com/plotly-prod-profiles/68.jpg", "background_url": "https://storage.googleapis.com/plotly-prod-profiles/bg-7.jpg", "bio": "", "nickname": "", "website": "", "stream_tokens": null, "feature_set_id": null, "csrf_token": null, "date_joined": "2025-09-06 04:07:47", "mapbox_access_tokens": null, "has_password": null, "username": "SCM040", "email": null, "is_active": null, "readonly": null, "is_dash_creator": null, "dash_created_count": null, "is_chart_creator": null, "charts_created_count": null } }, { "creation_time": "2025-09-06T03:38:43.276100Z", "comments": { "results": [], "count": 0 }, "parented": true, "embed_url": "https://chart-studio.plotly.com/~fmichael1/1.embed", "fid": "fmichael1:1", "filename": "Plot 1", "filetype": "plot", "img_url": "https://storage.googleapis.com/plotly-prod-images/fmichael1/1/9_J21GVLS98HXRM9FDHQP2R4ZMCDQS0P.png", "image_urls": { "default": "https://storage.googleapis.com/plotly-prod-images/fmichael1/1/2_CF0GQCX26UE2IXCS9Z5MNIXERNPN90.png", "block-thumb": "https://storage.googleapis.com/plotly-prod-images/fmichael1/1/8_WL192Z4SPCIDMF8A30HL8WZI5A4EJV.png", "list-thumb": "https://storage.googleapis.com/plotly-prod-images/fmichael1/1/9_J21GVLS98HXRM9FDHQP2R4ZMCDQS0P.png" }, "api_urls": { "files": "https://api.plotly.com/v2/files/fmichael1:1", "plots": "https://api.plotly.com/v2/plots/fmichael1:1", "parent": "https://api.plotly.com/v2/folders/home?user=fmichael1" }, "owner": "fmichael1", "parent": -1, "preview": "", "referencers": [], "references": [], "title": "", "views": 0, "web_url": "https://chart-studio.plotly.com/~fmichael1/1/", "world_readable": true, "date_modified": "2025-09-06T03:50:52.196Z", "stars": { "results": [], "count": 0 }, "collaborators": { "results": [], "count": 0 }, "subfolder_count": null, "refresh_interval": null, "organize_view_url": "https://chart-studio.plotly.com/~fmichael1/1/", "current_user_permission": "read", "is_theme": null, "is_template": false, "autosize": true, "caption": "", "figure": { "data": [ { "line": { "shape": "spline" }, "meta": { "columnNames": { "x": "Trace 0, x", "y": "Trace 0, y" } }, "mode": "lines", "name": "Edinburgh", "type": "scatter", "xsrc": "fmichael1:0:859392", "ysrc": "fmichael1:0:dfeb60" }, { "line": { "shape": "spline", "width": 2 }, "meta": { "columnNames": { "x": "Trace 1, x", "y": "Trace 1, y" } }, "mode": "lines", "name": "Uppsala", "type": "scatter", "xsrc": "fmichael1:0:180d17", "ysrc": "fmichael1:0:48b4bf" } ], "frames": [], "layout": { "font": { "size": 15 }, "title": { "text": "Pressure reactivity as a guide in the treatment of CPP in patients with TBI (T. Howells, et al., 2005)" }, "xaxis": { "type": "linear", "range": [ -0.39283388671088504, 0.5963330443551249 ], "title": { "text": "MAP/ICP slope" }, "autorange": true }, "yaxis": { "type": "linear", "range": [ 0, 1 ], "title": { "text": "Probability of favorable outcome" }, "autorange": false }, "autosize": true } }, "height": null, "width": null, "user": { "profile_url": "https://chart-studio.plotly.com/~fmichael1", "avatar_url": "https://storage.googleapis.com/plotly-prod-profiles/2.jpg", "background_url": "https://storage.googleapis.com/plotly-prod-profiles/bg-9.jpg", "bio": "", "nickname": "", "website": "", "stream_tokens": null, "feature_set_id": null, "csrf_token": null, "date_joined": "2025-09-06 03:32:20", "mapbox_access_tokens": null, "has_password": null, "username": "fmichael1", "email": null, "is_active": null, "readonly": null, "is_dash_creator": null, "dash_created_count": null, "is_chart_creator": null, "charts_created_count": null } }, { "creation_time": "2025-09-06T01:52:49.172569Z", "comments": { "results": [], "count": 0 }, "parented": true, "embed_url": "https://chart-studio.plotly.com/~hoapenncho/11.embed", "fid": "hoapenncho:11", "filename": "Plot 11", "filetype": "plot", "img_url": "https://storage.googleapis.com/plotly-prod-images/hoapenncho/11/9_6TPB1UZZDRBRQSOJ2E3QS3NVQC1RNU.png", "image_urls": { "default": "https://storage.googleapis.com/plotly-prod-images/hoapenncho/11/2_1GJIM2CAM5A0TH6T2HGOMYLSJYTWRH.png", "block-thumb": "https://storage.googleapis.com/plotly-prod-images/hoapenncho/11/8_E11C7DYJ1KYDW4C2LKVJZK14SB7I44.png", "list-thumb": "https://storage.googleapis.com/plotly-prod-images/hoapenncho/11/9_6TPB1UZZDRBRQSOJ2E3QS3NVQC1RNU.png" }, "api_urls": { "files": "https://api.plotly.com/v2/files/hoapenncho:11", "plots": "https://api.plotly.com/v2/plots/hoapenncho:11", "parent": "https://api.plotly.com/v2/folders/home?user=hoapenncho" }, "owner": "hoapenncho", "parent": -1, "preview": "", "referencers": [], "references": [], "title": "", "views": 1, "web_url": "https://chart-studio.plotly.com/~hoapenncho/11/", "world_readable": true, "date_modified": "2025-09-06T01:52:49.183Z", "stars": { "results": [], "count": 0 }, "collaborators": { "results": [], "count": 0 }, "subfolder_count": null, "refresh_interval": null, "organize_view_url": "https://chart-studio.plotly.com/~hoapenncho/11/", "current_user_permission": "read", "is_theme": null, "is_template": false, "autosize": true, "caption": "", "figure": { "data": [ { "meta": { "columnNames": { "x": "Trace 0, x", "y": "Trace 0, y" } }, "mode": "lines", "type": "scatter", "xsrc": "hoapenncho:10:d4eeeb", "ysrc": "hoapenncho:10:371f62" }, { "meta": { "columnNames": { "x": "Trace 1, x", "y": "Trace 1, y" } }, "mode": "lines", "type": "scatter", "xsrc": "hoapenncho:10:9aa5ee", "ysrc": "hoapenncho:10:7c1d45" }, { "meta": { "columnNames": { "x": "Trace 2, x", "y": "Trace 2, y" } }, "mode": "lines", "type": "scatter", "xsrc": "hoapenncho:10:da6021", "ysrc": "hoapenncho:10:07cbe6" } ], "frames": [], "layout": { "xaxis": { "type": "linear", "range": [ -77.7511961722488, 632.3763955342903 ], "autorange": true }, "yaxis": { "type": "linear", "range": [ -154.051172707889, 2351.279317697228 ], "autorange": true }, "autosize": true } }, "height": null, "width": null, "user": { "profile_url": "https://chart-studio.plotly.com/~hoapenncho", "avatar_url": "https://storage.googleapis.com/plotly-prod-profiles/23.jpg", "background_url": "https://storage.googleapis.com/plotly-prod-profiles/bg-7.jpg", "bio": "", "nickname": "", "website": "", "stream_tokens": null, "feature_set_id": null, "csrf_token": null, "date_joined": "2025-08-21 07:08:22", "mapbox_access_tokens": null, "has_password": null, "username": "hoapenncho", "email": null, "is_active": null, "readonly": null, "is_dash_creator": null, "dash_created_count": null, "is_chart_creator": null, "charts_created_count": null } }, { "creation_time": "2025-09-05T23:48:50.431587Z", "comments": { "results": [], "count": 0 }, "parented": true, "embed_url": "https://chart-studio.plotly.com/~jimmyg23/649.embed", "fid": "jimmyg23:649", "filename": "soybean meal v bean v all copy", "filetype": "plot", "img_url": "https://storage.googleapis.com/plotly-prod-images/jimmyg23/649/9_BFCOBX8XSTEF1H270QWALBQ58QCSKR.png", "image_urls": { "default": "https://storage.googleapis.com/plotly-prod-images/jimmyg23/649/2_IY482KJEVXDC1MCQKM4NGAKN9Y9LBL.png", "block-thumb": "https://storage.googleapis.com/plotly-prod-images/jimmyg23/649/8_8EDH7G1XSPAIRLY09IWSNER5V3EPKW.png", "list-thumb": "https://storage.googleapis.com/plotly-prod-images/jimmyg23/649/9_BFCOBX8XSTEF1H270QWALBQ58QCSKR.png" }, "api_urls": { "files": "https://api.plotly.com/v2/files/jimmyg23:649", "plots": "https://api.plotly.com/v2/plots/jimmyg23:649", "parent": "https://api.plotly.com/v2/folders/home?user=jimmyg23" }, "owner": "jimmyg23", "parent": -1, "preview": "", "referencers": [], "references": [], "title": "", "views": 2, "web_url": "https://chart-studio.plotly.com/~jimmyg23/649/", "world_readable": true, "date_modified": "2025-09-06T08:50:13.304Z", "stars": { "results": [], "count": 0 }, "collaborators": { "results": [], "count": 0 }, "subfolder_count": null, "refresh_interval": null, "organize_view_url": "https://chart-studio.plotly.com/~jimmyg23/649/", "current_user_permission": "read", "is_theme": null, "is_template": false, "autosize": true, "caption": "", "figure": { "data": [ { "fill": "none", "line": { "dash": "solid", "color": "rgb(72, 158, 218)", "width": 7 }, "meta": { "columnNames": { "x": "Year", "y": "Soybeans (Bu)" } }, "mode": "lines", "name": "<b>%{meta.columnNames.y}</b>", "type": "scatter", "xsrc": "jimmyg23:651:0763b4", "ysrc": "jimmyg23:651:0ea56c", "visible": true, "stackgroup": 1, "legendgroup": 1 }, { "line": { "color": "rgb(255, 34, 14)", "width": 7 }, "meta": { "columnNames": { "x": "Year", "y": "Soybean Meal (Bu)" } }, "mode": "lines", "name": "<b>%{meta.columnNames.y}</b>", "type": "scatter", "xsrc": "jimmyg23:651:0763b4", "ysrc": "jimmyg23:651:f2ab41", "yaxis": "y2", "visible": true, "stackgroup": null, "legendgroup": 1 }, { "meta": { "columnNames": { "x": "Year", "y": "Total Bushels (All)" } }, "name": "Total Bushels Combined", "type": "bar", "xsrc": "jimmyg23:651:0763b4", "ysrc": "jimmyg23:651:32b79f", "marker": { "color": "rgb(23, 50, 80)", "opacity": 0.65 }, "visible": true, "legendgroup": 2, "orientation": "v" }, { "line": { "dash": "dot", "color": "rgb(1, 0, 0)", "width": 6 }, "meta": { "columnNames": { "x": "Year", "y": "J" } }, "mode": "lines", "name": "5 Year Average Total ", "type": "scatter", "xsrc": "jimmyg23:651:0763b4", "ysrc": "jimmyg23:651:519534", "stackgroup": null } ], "frames": [], "layout": { "font": { "size": 18, "family": "Overpass" }, "title": { "text": "<br>" }, "xaxis": { "type": "linear", "range": [ 2010, 2025.2 ], "ticks": "outside", "nticks": 0, "ticklen": 9, "showline": true, "tickmode": "linear", "autorange": false, "linewidth": 3, "tickangle": 45 }, "yaxis": { "side": "right", "type": "linear", "dtick": 250000000, "range": [ 0, 2969870497.894737 ], "tick0": 190000000, "ticks": "outside", "title": { "font": { "color": "rgb(1, 7, 11)" }, "text": "Soybeans (Bu)" }, "nticks": 14, "ticklen": 11, "showline": true, "tickfont": { "color": "rgb(78, 137, 213)" }, "tickmode": "linear", "autorange": true, "gridcolor": "rgb(107, 153, 231)", "linewidth": 3, "tickcolor": "rgb(96, 147, 233)" }, "bargap": 0.6599999999999999, "legend": { "x": -0.02844887994353343, "y": 1.2151299300262626, "itemsizing": "constant", "traceorder": "normal" }, "margin": { "l": 95, "r": 100, "pad": 0 }, "yaxis2": { "side": "left", "type": "linear", "dtick": 60000000, "range": [ 329931199.2777778, 656448213.7222222 ], "tick0": 15000000, "ticks": "outside", "title": { "font": { "size": 20 }, "text": "Soybean Meal (Bu)" }, "nticks": 6, "ticklen": 10, "showline": true, "tickfont": { "color": "rgb(224, 9, 9)" }, "tickmode": "linear", "autorange": false, "gridcolor": "rgb(223, 14, 14)", "linewidth": 3, "tickcolor": "rgb(226, 32, 32)", "overlaying": "y", "zerolinewidth": 1 }, "barmode": "group", "autosize": true, "showlegend": true, "bargroupgap": 0, "plot_bgcolor": "rgb(255, 255, 255)" } }, "height": null, "width": null, "user": { "profile_url": "https://chart-studio.plotly.com/~jimmyg23", "avatar_url": "https://storage.googleapis.com/plotly-prod-profiles/81.jpg", "background_url": "https://storage.googleapis.com/plotly-prod-profiles/bg-2.jpg", "bio": "", "nickname": "", "website": "", "stream_tokens": null, "feature_set_id": null, "csrf_token": null, "date_joined": "2025-03-19 23:02:49", "mapbox_access_tokens": null, "has_password": null, "username": "jimmyg23", "email": null, "is_active": null, "readonly": null, "is_dash_creator": null, "dash_created_count": null, "is_chart_creator": null, "charts_created_count": null } }, { "creation_time": "2025-09-05T22:45:07.679928Z", "comments": { "results": [], "count": 0 }, "parented": true, "embed_url": "https://chart-studio.plotly.com/~mohammed_elsayed/5.embed", "fid": "mohammed_elsayed:5", "filename": "fig.3.a.", "filetype": "plot", "img_url": "https://api.plotly.com/v2/files/mohammed_elsayed:5/image?image_name=list-thumb", "image_urls": { "default": "https://storage.googleapis.com/plotly-prod-images/mohammed_elsayed/5/2_9GI33TBW27S4THRFX9JOH03ZLSZ9RS.png", "block-thumb": "https://storage.googleapis.com/plotly-prod-images/mohammed_elsayed/5/8_T9A07C9DCUY0OHUQL17O147TM25D1X.png", "list-thumb": "https://api.plotly.com/v2/files/mohammed_elsayed:5/image?image_name=list-thumb" }, "api_urls": { "files": "https://api.plotly.com/v2/files/mohammed_elsayed:5", "plots": "https://api.plotly.com/v2/plots/mohammed_elsayed:5", "parent": "https://api.plotly.com/v2/folders/home?user=mohammed_elsayed" }, "owner": "mohammed_elsayed", "parent": -1, "preview": "", "referencers": [], "references": [], "title": "", "views": 0, "web_url": "https://chart-studio.plotly.com/~mohammed_elsayed/5/", "world_readable": true, "date_modified": "2025-09-08T12:08:03.981Z", "stars": { "results": [], "count": 0 }, "collaborators": { "results": [], "count": 0 }, "subfolder_count": null, "refresh_interval": null, "organize_view_url": "https://chart-studio.plotly.com/~mohammed_elsayed/5/", "current_user_permission": "read", "is_theme": null, "is_template": false, "autosize": true, "caption": "", "figure": { "data": [ { "meta": { "columnNames": { "x": "Trace 0, x", "y": "Trace 0, y", "text": "Trace 0, x" } }, "mode": "lines", "name": "S/C=0.5", "type": "scatter", "xsrc": "mohammed_elsayed:4:5e96eb", "ysrc": "mohammed_elsayed:4:b39439", "textsrc": "mohammed_elsayed:4:5e96eb" }, { "meta": { "columnNames": { "x": "Trace 1, x", "y": "Trace 1, y", "text": "Trace 0, x" } }, "mode": "lines", "name": "<b>S/C=0.56</b>", "type": "scatter", "xsrc": "mohammed_elsayed:4:084edc", "ysrc": "mohammed_elsayed:4:521915", "textsrc": "mohammed_elsayed:4:5e96eb" }, { "meta": { "columnNames": { "x": "Trace 2, x", "y": "Trace 2, y", "text": "Trace 0, x" } }, "mode": "lines", "name": "<b>S/C=0.75</b>", "type": "scatter", "xsrc": "mohammed_elsayed:4:8c30da", "ysrc": "mohammed_elsayed:4:c27c76", "textsrc": "mohammed_elsayed:4:5e96eb" }, { "meta": { "columnNames": { "x": "Trace 3, x", "y": "Trace 3, y", "text": "Trace 0, x" } }, "mode": "lines", "name": "<b>S/C=0.94</b>", "type": "scatter", "xsrc": "mohammed_elsayed:4:62bc65", "ysrc": "mohammed_elsayed:4:d9a752", "textsrc": "mohammed_elsayed:4:5e96eb" }, { "meta": { "columnNames": { "x": "Trace 4, x", "y": "Trace 4, y", "text": "Trace 0, x" } }, "mode": "lines", "name": "<b>S/C=1.5</b>", "type": "scatter", "xsrc": "mohammed_elsayed:4:4067d5", "ysrc": "mohammed_elsayed:4:d76b24", "textsrc": "mohammed_elsayed:4:5e96eb" } ], "frames": [], "layout": { "title": { "text": "fig.3.a" }, "xaxis": { "type": "linear", "range": [ -80, -20 ], "title": { "text": "<b>Outlet Angle, α</b><sub><b>2</b></sub><b> (degrees)</b>" }, "mirror": "ticks", "showgrid": true, "showline": true, "zeroline": true, "autorange": false, "fixedrange": false, "showticklabels": true }, "yaxis": { "side": "left", "type": "linear", "range": [ 0, 0.08 ], "title": { "text": "<b>Profile Loss Coefficient, Y</b><sub><b>p</b></sub>" }, "mirror": "ticks", "showline": true, "autorange": false }, "legend": { "x": 0.8599999999999999, "y": 0.96 }, "autosize": true } }, "height": null, "width": null, "user": { "profile_url": "https://chart-studio.plotly.com/~mohammed_elsayed", "avatar_url": "https://storage.googleapis.com/plotly-prod-profiles/0.jpg", "background_url": "https://storage.googleapis.com/plotly-prod-profiles/bg-11.jpg", "bio": "", "nickname": "", "website": "", "stream_tokens": null, "feature_set_id": null, "csrf_token": null, "date_joined": "2025-09-05 22:10:59", "mapbox_access_tokens": null, "has_password": null, "username": "mohammed_elsayed", "email": null, "is_active": null, "readonly": null, "is_dash_creator": null, "dash_created_count": null, "is_chart_creator": null, "charts_created_count": null } }, { "creation_time": "2025-09-05T20:02:11.881694Z", "comments": { "results": [], "count": 0 }, "parented": true, "embed_url": "https://chart-studio.plotly.com/~MB97/210.embed", "fid": "MB97:210", "filename": "Plot 210", "filetype": "plot", "img_url": "https://storage.googleapis.com/plotly-prod-images/MB97/210/9_ZESHQXES6R4PS7SH2RUL9AZZAEMZGG.png", "image_urls": { "default": "https://storage.googleapis.com/plotly-prod-images/MB97/210/2_WZT5157TG8RH9YTKAMU2P5JRLN0WJG.png", "block-thumb": "https://storage.googleapis.com/plotly-prod-images/MB97/210/8_X607RR4NA2G3U8W6HG5XVUNZFTTEO8.png", "list-thumb": "https://storage.googleapis.com/plotly-prod-images/MB97/210/9_ZESHQXES6R4PS7SH2RUL9AZZAEMZGG.png" }, "api_urls": { "files": "https://api.plotly.com/v2/files/MB97:210", "plots": "https://api.plotly.com/v2/plots/MB97:210", "parent": "https://api.plotly.com/v2/folders/home?user=MB97" }, "owner": "MB97", "parent": -1, "preview": "", "referencers": [], "references": [], "title": "", "views": 0, "web_url": "https://chart-studio.plotly.com/~MB97/210/", "world_readable": true, "date_modified": "2025-09-06T10:53:43.863Z", "stars": { "results": [], "count": 0 }, "collaborators": { "results": [], "count": 0 }, "subfolder_count": null, "refresh_interval": null, "organize_view_url": "https://chart-studio.plotly.com/~MB97/210/", "current_user_permission": "read", "is_theme": null, "is_template": false, "autosize": true, "caption": "", "figure": { "data": [ { "uid": "6812da", "line": { "color": "rgb(48, 63, 252)" }, "meta": { "columnNames": { "x": "observation_date", "y": "CMRO" } }, "mode": "lines", "name": "CMRO (monthly, indicator units, Right Y axis) ", "type": "scatter", "xsrc": "MB97:209:eb62a7", "ysrc": "MB97:209:9888e2", "yaxis": "y2", "showlegend": true }, { "uid": "ff9d11", "meta": { "columnNames": { "x": "observation_date", "y": "U6RATE" } }, "mode": "lines", "name": "trace 1", "type": "scatter", "xsrc": "MB97:209:eb62a7", "ysrc": "MB97:209:97d5dd", "opacity": 0, "showlegend": false, "stackgroup": null }, { "uid": "22631a", "line": { "color": "rgb(226, 33, 1)", "width": 2 }, "name": "U-6 unemployment rate 3-month MA (monthly, %, Left Y axis)", "opacity": 1, "transforms": [ { "type": "moving-average", "inputUid": "ff9d11", "windowtype": "boxcar", "windowlength": 3 } ] } ], "frames": [], "layout": { "title": { "text": "Our proprietary Composite Macroeconomic Risk Oscillator (CMRO) vs the parameter of our own Sahm Rule-type model (ours uses the U-6 UR, which leads the U-3<br>measure by two months on average). The first model implicitly reflects all macroeconomic risks (Growth, Recession, Inflation, Stagflation), while the second, being a<br>recession nowcasting model, confirms the occurrence of recessionary events. Their outputs are both parameters of our recession risk-repricing event nowcasting model." }, "xaxis": { "type": "date", "range": [ "1993-12-28 02:58:16.32", "2025-09-05 21:01:43.68" ], "autorange": true }, "yaxis": { "type": "linear", "range": [ 5.694444444444445, 23.805555555555554 ], "title": { "text": "%" }, "autorange": true }, "legend": { "x": 0.023703989088102267, "y": 0.9557692307692308 }, "shapes": [ { "x0": "1994-01-01 18:00", "x1": "2025-09-01 06:00", "y0": -3.1, "y1": -3.1, "line": { "color": "rgb(0, 0, 0)", "width": 1 }, "type": "line", "yref": "y2", "opacity": 1, "fillcolor": "rgb(0, 0, 0)" }, { "x0": "1994-01-01 22:46:11.1628", "x1": "2025-09-01 01:13:48.8372", "y0": -5.99, "y1": -5.99, "line": { "color": "rgb(57, 217, 0)", "width": 1 }, "type": "line", "yref": "y2", "opacity": 1, "fillcolor": "rgb(54, 196, 3)" }, { "x0": "2001-04-01 18:57:48.888", "x1": "2001-04-01 14:19:16.296", "y0": 60, "y1": -50, "line": { "color": "rgb(0, 0, 0)", "width": 1 }, "type": "line", "yref": "y2", "opacity": 1, "fillcolor": "rgb(0, 0, 0)" }, { "x0": "2007-11-01 18:57:48.888", "x1": "2007-11-01 14:19:16.296", "y0": 60, "y1": -50, "line": { "color": "rgb(0, 0, 0)", "width": 1 }, "yref": "y2", "opacity": 1, "fillcolor": "rgb(0, 0, 0)" }, { "x0": "2020-02-01 18:57:48.888", "x1": "2020-02-01 14:19:16.296", "y0": 60, "y1": -50, "line": { "color": "rgb(0, 0, 0)", "width": 1 }, "type": "line", "yref": "y2", "opacity": 1, "fillcolor": "rgb(0, 0, 0)" }, { "x0": "2002-10-01 18:57:48.888", "x1": "2002-10-01 14:19:16.296", "y0": 60, "y1": -50, "line": { "color": "rgb(46, 230, 1)", "width": 1 }, "yref": "y2", "opacity": 1, "fillcolor": "rgb(46, 230, 1)" }, { "x0": "2009-07-01 18:57:48.888", "x1": "2009-07-01 14:19:16.296", "y0": 60, "y1": -50, "line": { "color": "rgb(46, 230, 1)", "width": 1 }, "yref": "y2", "opacity": 1, "fillcolor": "rgb(46, 230, 1)" }, { "x0": "2020-05-01 18:57:48.888", "x1": "2020-05-01 14:19:16.296", "y0": 60, "y1": -50, "line": { "dash": "solid", "color": "rgb(46, 230, 1)", "width": 1 }, "type": "line", "yref": "y2", "opacity": 1, "fillcolor": "rgb(46, 230, 1)" }, { "x0": "2022-09-01 18:57:48.888", "x1": "2022-09-01 14:19:16.296", "y0": 60, "y1": -50, "line": { "color": "rgb(46, 230, 1)", "width": 1 }, "type": "line", "yref": "y2", "opacity": 1, "fillcolor": "rgb(46, 230, 1)" }, { "x0": "2024-01-01 18:57:48.888", "x1": "2024-01-01 14:19:16.296", "y0": 60, "y1": -50, "line": { "color": "rgb(240, 0, 0)", "width": 1 }, "type": "line", "yref": "y2", "opacity": 1, "fillcolor": "rgb(0, 0, 0)" } ], "yaxis2": { "side": "right", "type": "linear", "range": [ -50.5254, 60.221199999999996 ], "title": { "text": "Indicator units" }, "autorange": true, "overlaying": "y" }, "autosize": true, "template": { "data": { "bar": [ { "type": "bar", "marker": { "colorbar": { "ticks": "", "outlinewidth": 0 } } } ], "table": [ { "type": "table", "cells": { "fill": { "color": "#EBF0F8" }, "line": { "color": "white" } }, "header": { "fill": { "color": "#C8D4E3" }, "line": { "color": "white" } } } ], "carpet": [ { "type": "carpet", "aaxis": { "gridcolor": "#C8D4E3", "linecolor": "#C8D4E3", "endlinecolor": "#2a3f5f", "minorgridcolor": "#C8D4E3", "startlinecolor": "#2a3f5f" }, "baxis": { "gridcolor": "#C8D4E3", "linecolor": "#C8D4E3", "endlinecolor": "#2a3f5f", "minorgridcolor": "#C8D4E3", "startlinecolor": "#2a3f5f" } } ], "mesh3d": [ { "type": "mesh3d", "colorbar": { "ticks": "", "outlinewidth": 0 } } ], "contour": [ { "type": "contour", "colorbar": { "ticks": "", "outlinewidth": 0 }, "autocolorscale": true } ], "heatmap": [ { "type": "heatmap", "colorbar": { "ticks": "", "outlinewidth": 0 }, "autocolorscale": true } ], "scatter": [ { "type": "scatter", "marker": { "colorbar": { "ticks": "", "outlinewidth": 0 } } } ], "surface": [ { "type": "surface", "colorbar": { "ticks": "", "outlinewidth": 0 } } ], "heatmapgl": [ { "type": "heatmapgl", "colorbar": { "ticks": "", "outlinewidth": 0 } } ], "histogram": [ { "type": "histogram", "marker": { "colorbar": { "ticks": "", "outlinewidth": 0 } } } ], "parcoords": [ { "line": { "colorbar": { "ticks": "", "outlinewidth": 0 } }, "type": "parcoords" } ], "scatter3d": [ { "type": "scatter3d", "marker": { "colorbar": { "ticks": "", "outlinewidth": 0 } } } ], "scattergl": [ { "type": "scattergl", "marker": { "colorbar": { "ticks": "", "outlinewidth": 0 } } } ], "choropleth": [ { "type": "choropleth", "colorbar": { "ticks": "", "outlinewidth": 0 } } ], "scattergeo": [ { "type": "scattergeo", "marker": { "colorbar": { "ticks": "", "outlinewidth": 0 } } } ], "histogram2d": [ { "type": "histogram2d", "colorbar": { "ticks": "", "outlinewidth": 0 }, "autocolorscale": true } ], "scatterpolar": [ { "type": "scatterpolar", "marker": { "colorbar": { "ticks": "", "outlinewidth": 0 } } } ], "contourcarpet": [ { "type": "contourcarpet", "colorbar": { "ticks": "", "outlinewidth": 0 } } ], "scattercarpet": [ { "type": "scattercarpet", "marker": { "colorbar": { "ticks": "", "outlinewidth": 0 } } } ], "scattermapbox": [ { "type": "scattermapbox", "marker": { "colorbar": { "ticks": "", "outlinewidth": 0 } } } ], "scatterpolargl": [ { "type": "scatterpolargl", "marker": { "colorbar": { "ticks": "", "outlinewidth": 0 } } } ], "scatterternary": [ { "type": "scatterternary", "marker": { "colorbar": { "ticks": "", "outlinewidth": 0 } } } ], "histogram2dcontour": [ { "type": "histogram2dcontour", "colorbar": { "ticks": "", "outlinewidth": 0 }, "autocolorscale": true } ] }, "layout": { "geo": { "bgcolor": "white", "showland": true, "lakecolor": "white", "landcolor": "white", "showlakes": true, "subunitcolor": "#C8D4E3" }, "font": { "color": "#2a3f5f" }, "polar": { "bgcolor": "white", "radialaxis": { "ticks": "", "gridcolor": "#EBF0F8", "linecolor": "#EBF0F8" }, "angularaxis": { "ticks": "", "gridcolor": "#EBF0F8", "linecolor": "#EBF0F8" } }, "scene": { "xaxis": { "ticks": "", "gridcolor": "#DFE8F3", "gridwidth": 2, "linecolor": "#EBF0F8", "zerolinecolor": "#EBF0F8", "showbackground": true, "backgroundcolor": "white" }, "yaxis": { "ticks": "", "gridcolor": "#DFE8F3", "gridwidth": 2, "linecolor": "#EBF0F8", "zerolinecolor": "#EBF0F8", "showbackground": true, "backgroundcolor": "white" }, "zaxis": { "ticks": "", "gridcolor": "#DFE8F3", "gridwidth": 2, "linecolor": "#EBF0F8", "zerolinecolor": "#EBF0F8", "showbackground": true, "backgroundcolor": "white" } }, "title": { "x": 0.05 }, "xaxis": { "ticks": "", "gridcolor": "#EBF0F8", "linecolor": "#EBF0F8", "automargin": true, "zerolinecolor": "#EBF0F8", "zerolinewidth": 2 }, "yaxis": { "ticks": "", "gridcolor": "#EBF0F8", "linecolor": "#EBF0F8", "automargin": true, "zerolinecolor": "#EBF0F8", "zerolinewidth": 2 }, "ternary": { "aaxis": { "ticks": "", "gridcolor": "#DFE8F3", "linecolor": "#A2B1C6" }, "baxis": { "ticks": "", "gridcolor": "#DFE8F3", "linecolor": "#A2B1C6" }, "caxis": { "ticks": "", "gridcolor": "#DFE8F3", "linecolor": "#A2B1C6" }, "bgcolor": "white" }, "colorway": [ "#636efa", "#EF553B", "#00cc96", "#ab63fa", "#19d3f3", "#e763fa", "#fecb52", "#ffa15a", "#ff6692", "#b6e880" ], "hovermode": "closest", "colorscale": { "diverging": [ [ 0, "#8e0152" ], [ 0.1, "#c51b7d" ], [ 0.2, "#de77ae" ], [ 0.3, "#f1b6da" ], [ 0.4, "#fde0ef" ], [ 0.5, "#f7f7f7" ], [ 0.6, "#e6f5d0" ], [ 0.7, "#b8e186" ], [ 0.8, "#7fbc41" ], [ 0.9, "#4d9221" ], [ 1, "#276419" ] ], "sequential": [ [ 0, "#0508b8" ], [ 0.0893854748603352, "#1910d8" ], [ 0.1787709497206704, "#3c19f0" ], [ 0.2681564245810056, "#6b1cfb" ], [ 0.3575418994413408, "#981cfd" ], [ 0.44692737430167595, "#bf1cfd" ], [ 0.5363128491620112, "#dd2bfd" ], [ 0.6256983240223464, "#f246fe" ], [ 0.7150837988826816, "#fc67fd" ], [ 0.8044692737430168, "#fe88fc" ], [ 0.8938547486033519, "#fea5fd" ], [ 0.9832402234636871, "#febefe" ], [ 1, "#fec3fe" ] ], "sequentialminus": [ [ 0, "#0508b8" ], [ 0.0893854748603352, "#1910d8" ], [ 0.1787709497206704, "#3c19f0" ], [ 0.2681564245810056, "#6b1cfb" ], [ 0.3575418994413408, "#981cfd" ], [ 0.44692737430167595, "#bf1cfd" ], [ 0.5363128491620112, "#dd2bfd" ], [ 0.6256983240223464, "#f246fe" ], [ 0.7150837988826816, "#fc67fd" ], [ 0.8044692737430168, "#fe88fc" ], [ 0.8938547486033519, "#fea5fd" ], [ 0.9832402234636871, "#febefe" ], [ 1, "#fec3fe" ] ] }, "plot_bgcolor": "white", "paper_bgcolor": "white", "shapedefaults": { "line": { "width": 0 }, "opacity": 0.4, "fillcolor": "#506784" }, "annotationdefaults": { "arrowhead": 0, "arrowcolor": "#506784", "arrowwidth": 1 } }, "themeRef": "PLOTLY_WHITE" }, "annotations": [ { "x": "1997-11-15 09:44:00.3719", "y": 11.01125356125356, "text": "Models and data visualization built by<br> Astraios Research (@StranAmorePFS)", "showarrow": false }, { "x": "2001-04-07 12:51:28.1054", "y": 15.719017094017094, "ax": -88, "ay": -33, "text": "April 2001, re-pricing of<br>U.S. recession risk factor" }, { "x": "2007-10-24 12:48:07.253", "y": 16.018874643874643, "ax": -88, "ay": -30, "text": "November 2007<b>, </b>re-pricing of <br>U.S. recession risk factor" }, { "x": "2020-01-26 02:37:28.4308", "y": 15.449145299145298, "ax": -98, "ay": -30, "text": "February 2020, re-pricing of<br>U.S. recession risk factor" }, { "x": "2023-12-27 05:13:08.0666", "y": 16.58860398860399, "ax": -28, "ay": -95, "text": "Jan 2024, re-pricing of<br>U.S. stagflation risk factor" } ] } }, "height": null, "width": null, "user": { "profile_url": "https://chart-studio.plotly.com/~MB97", "avatar_url": "https://storage.googleapis.com/plotly-prod-profiles/20.jpg", "background_url": "https://storage.googleapis.com/plotly-prod-profiles/bg-3.jpg", "bio": "", "nickname": "", "website": "", "stream_tokens": null, "feature_set_id": null, "csrf_token": null, "date_joined": "2024-08-12 11:04:27", "mapbox_access_tokens": null, "has_password": null, "username": "MB97", "email": null, "is_active": null, "readonly": null, "is_dash_creator": null, "dash_created_count": null, "is_chart_creator": null, "charts_created_count": null } }, { "creation_time": "2025-09-05T19:27:15.653691Z", "comments": { "results": [], "count": 0 }, "parented": true, "embed_url": "https://chart-studio.plotly.com/~lexieledis/56.embed", "fid": "lexieledis:56", "filename": "breath", "filetype": "plot", "img_url": "https://storage.googleapis.com/plotly-prod-images/lexieledis/56/9_MOE7NTBCT82X411UH7LHBYS19WJCR6.png", "image_urls": { "default": "https://storage.googleapis.com/plotly-prod-images/lexieledis/56/2_XOFZA6VABJF1VBY4OGERA82GR57WU2.png", "block-thumb": "https://storage.googleapis.com/plotly-prod-images/lexieledis/56/8_EFFVD6RQXB2JBHLCN0JOS515EA704B.png", "list-thumb": "https://storage.googleapis.com/plotly-prod-images/lexieledis/56/9_MOE7NTBCT82X411UH7LHBYS19WJCR6.png" }, "api_urls": { "files": "https://api.plotly.com/v2/files/lexieledis:56", "plots": "https://api.plotly.com/v2/plots/lexieledis:56", "parent": "https://api.plotly.com/v2/folders/home?user=lexieledis" }, "owner": "lexieledis", "parent": -1, "preview": "", "referencers": [], "references": [], "title": "", "views": 0, "web_url": "https://chart-studio.plotly.com/~lexieledis/56/", "world_readable": true, "date_modified": "2025-09-08T21:02:07.093Z", "stars": { "results": [], "count": 0 }, "collaborators": { "results": [], "count": 0 }, "subfolder_count": null, "refresh_interval": null, "organize_view_url": "https://chart-studio.plotly.com/~lexieledis/56/", "current_user_permission": "read", "is_theme": null, "is_template": false, "autosize": true, "caption": "", "figure": { "data": [ { "line": { "shape": "linear" }, "meta": { "columnNames": { "x": "A", "y": "B" } }, "mode": "markers+lines", "type": "scatter", "xsrc": "lexieledis:55:75168d", "ysrc": "lexieledis:55:46738c", "connectgaps": false } ], "frames": [], "layout": { "title": { "text": "Breathing" }, "xaxis": { "type": "linear", "range": [ -0.5472054380664653, 9.547205438066465 ], "title": { "text": "Duration of Exercise (minutes)" }, "autorange": true, "showspikes": false }, "yaxis": { "type": "linear", "range": [ 11.691434963247044, 33.30856503675296 ], "title": { "text": "Breathing Rate (breaths per minute)" }, "autorange": true, "showspikes": false }, "autosize": true, "template": { "data": { "bar": [ { "type": "bar", "marker": { "colorbar": { "ticks": "", "outlinewidth": 0 } } } ], "table": [ { "type": "table", "cells": { "fill": { "color": "#EBF0F8" }, "line": { "color": "white" } }, "header": { "fill": { "color": "#C8D4E3" }, "line": { "color": "white" } } } ], "carpet": [ { "type": "carpet", "aaxis": { "gridcolor": "#C8D4E3", "linecolor": "#C8D4E3", "endlinecolor": "#2a3f5f", "minorgridcolor": "#C8D4E3", "startlinecolor": "#2a3f5f" }, "baxis": { "gridcolor": "#C8D4E3", "linecolor": "#C8D4E3", "endlinecolor": "#2a3f5f", "minorgridcolor": "#C8D4E3", "startlinecolor": "#2a3f5f" } } ], "mesh3d": [ { "type": "mesh3d", "colorbar": { "ticks": "", "outlinewidth": 0 } } ], "contour": [ { "type": "contour", "colorbar": { "ticks": "", "outlinewidth": 0 }, "autocolorscale": true } ], "heatmap": [ { "type": "heatmap", "colorbar": { "ticks": "", "outlinewidth": 0 }, "autocolorscale": true } ], "scatter": [ { "type": "scatter", "marker": { "colorbar": { "ticks": "", "outlinewidth": 0 } } } ], "surface": [ { "type": "surface", "colorbar": { "ticks": "", "outlinewidth": 0 } } ], "heatmapgl": [ { "type": "heatmapgl", "colorbar": { "ticks": "", "outlinewidth": 0 } } ], "histogram": [ { "type": "histogram", "marker": { "colorbar": { "ticks": "", "outlinewidth": 0 } } } ], "parcoords": [ { "line": { "colorbar": { "ticks": "", "outlinewidth": 0 } }, "type": "parcoords" } ], "scatter3d": [ { "type": "scatter3d", "marker": { "colorbar": { "ticks": "", "outlinewidth": 0 } } } ], "scattergl": [ { "type": "scattergl", "marker": { "colorbar": { "ticks": "", "outlinewidth": 0 } } } ], "choropleth": [ { "type": "choropleth", "colorbar": { "ticks": "", "outlinewidth": 0 } } ], "scattergeo": [ { "type": "scattergeo", "marker": { "colorbar": { "ticks": "", "outlinewidth": 0 } } } ], "histogram2d": [ { "type": "histogram2d", "colorbar": { "ticks": "", "outlinewidth": 0 }, "autocolorscale": true } ], "scatterpolar": [ { "type": "scatterpolar", "marker": { "colorbar": { "ticks": "", "outlinewidth": 0 } } } ], "contourcarpet": [ { "type": "contourcarpet", "colorbar": { "ticks": "", "outlinewidth": 0 } } ], "scattercarpet": [ { "type": "scattercarpet", "marker": { "colorbar": { "ticks": "", "outlinewidth": 0 } } } ], "scattermapbox": [ { "type": "scattermapbox", "marker": { "colorbar": { "ticks": "", "outlinewidth": 0 } } } ], "scatterpolargl": [ { "type": "scatterpolargl", "marker": { "colorbar": { "ticks": "", "outlinewidth": 0 } } } ], "scatterternary": [ { "type": "scatterternary", "marker": { "colorbar": { "ticks": "", "outlinewidth": 0 } } } ], "histogram2dcontour": [ { "type": "histogram2dcontour", "colorbar": { "ticks": "", "outlinewidth": 0 }, "autocolorscale": true } ] }, "layout": { "geo": { "bgcolor": "white", "showland": true, "lakecolor": "white", "landcolor": "white", "showlakes": true, "subunitcolor": "#C8D4E3" }, "font": { "color": "#2a3f5f" }, "polar": { "bgcolor": "white", "radialaxis": { "ticks": "", "gridcolor": "#EBF0F8", "linecolor": "#EBF0F8" }, "angularaxis": { "ticks": "", "gridcolor": "#EBF0F8", "linecolor": "#EBF0F8" } }, "scene": { "xaxis": { "ticks": "", "gridcolor": "#DFE8F3", "gridwidth": 2, "linecolor": "#EBF0F8", "zerolinecolor": "#EBF0F8", "showbackground": true, "backgroundcolor": "white" }, "yaxis": { "ticks": "", "gridcolor": "#DFE8F3", "gridwidth": 2, "linecolor": "#EBF0F8", "zerolinecolor": "#EBF0F8", "showbackground": true, "backgroundcolor": "white" }, "zaxis": { "ticks": "", "gridcolor": "#DFE8F3", "gridwidth": 2, "linecolor": "#EBF0F8", "zerolinecolor": "#EBF0F8", "showbackground": true, "backgroundcolor": "white" } }, "title": { "x": 0.05 }, "xaxis": { "ticks": "", "gridcolor": "#EBF0F8", "linecolor": "#EBF0F8", "automargin": true, "zerolinecolor": "#EBF0F8", "zerolinewidth": 2 }, "yaxis": { "ticks": "", "gridcolor": "#EBF0F8", "linecolor": "#EBF0F8", "automargin": true, "zerolinecolor": "#EBF0F8", "zerolinewidth": 2 }, "ternary": { "aaxis": { "ticks": "", "gridcolor": "#DFE8F3", "linecolor": "#A2B1C6" }, "baxis": { "ticks": "", "gridcolor": "#DFE8F3", "linecolor": "#A2B1C6" }, "caxis": { "ticks": "", "gridcolor": "#DFE8F3", "linecolor": "#A2B1C6" }, "bgcolor": "white" }, "colorway": [ "#636efa", "#EF553B", "#00cc96", "#ab63fa", "#19d3f3", "#e763fa", "#fecb52", "#ffa15a", "#ff6692", "#b6e880" ], "hovermode": "closest", "colorscale": { "diverging": [ [ 0, "#8e0152" ], [ 0.1, "#c51b7d" ], [ 0.2, "#de77ae" ], [ 0.3, "#f1b6da" ], [ 0.4, "#fde0ef" ], [ 0.5, "#f7f7f7" ], [ 0.6, "#e6f5d0" ], [ 0.7, "#b8e186" ], [ 0.8, "#7fbc41" ], [ 0.9, "#4d9221" ], [ 1, "#276419" ] ], "sequential": [ [ 0, "#0508b8" ], [ 0.0893854748603352, "#1910d8" ], [ 0.1787709497206704, "#3c19f0" ], [ 0.2681564245810056, "#6b1cfb" ], [ 0.3575418994413408, "#981cfd" ], [ 0.44692737430167595, "#bf1cfd" ], [ 0.5363128491620112, "#dd2bfd" ], [ 0.6256983240223464, "#f246fe" ], [ 0.7150837988826816, "#fc67fd" ], [ 0.8044692737430168, "#fe88fc" ], [ 0.8938547486033519, "#fea5fd" ], [ 0.9832402234636871, "#febefe" ], [ 1, "#fec3fe" ] ], "sequentialminus": [ [ 0, "#0508b8" ], [ 0.0893854748603352, "#1910d8" ], [ 0.1787709497206704, "#3c19f0" ], [ 0.2681564245810056, "#6b1cfb" ], [ 0.3575418994413408, "#981cfd" ], [ 0.44692737430167595, "#bf1cfd" ], [ 0.5363128491620112, "#dd2bfd" ], [ 0.6256983240223464, "#f246fe" ], [ 0.7150837988826816, "#fc67fd" ], [ 0.8044692737430168, "#fe88fc" ], [ 0.8938547486033519, "#fea5fd" ], [ 0.9832402234636871, "#febefe" ], [ 1, "#fec3fe" ] ] }, "plot_bgcolor": "white", "paper_bgcolor": "white", "shapedefaults": { "line": { "width": 0 }, "opacity": 0.4, "fillcolor": "#506784" }, "annotationdefaults": { "arrowhead": 0, "arrowcolor": "#506784", "arrowwidth": 1 } }, "themeRef": "PLOTLY_WHITE" } } }, "height": null, "width": null, "user": { "profile_url": "https://chart-studio.plotly.com/~lexieledis", "avatar_url": "https://storage.googleapis.com/plotly-prod-profiles/37.jpg", "background_url": "https://storage.googleapis.com/plotly-prod-profiles/bg-4.jpg", "bio": "", "nickname": "", "website": "", "stream_tokens": null, "feature_set_id": null, "csrf_token": null, "date_joined": "2024-08-30 18:21:26", "mapbox_access_tokens": null, "has_password": null, "username": "lexieledis", "email": null, "is_active": null, "readonly": null, "is_dash_creator": null, "dash_created_count": null, "is_chart_creator": null, "charts_created_count": null } }, { "creation_time": "2025-09-05T19:25:46.947509Z", "comments": { "results": [], "count": 0 }, "parented": true, "embed_url": "https://chart-studio.plotly.com/~lexieledis/54.embed", "fid": "lexieledis:54", "filename": "di press", "filetype": "plot", "img_url": "https://storage.googleapis.com/plotly-prod-images/lexieledis/54/9_J0KIHT67FJ1A7HK27B9TLT7JYX5MWW.png", "image_urls": { "default": "https://storage.googleapis.com/plotly-prod-images/lexieledis/54/2_8XFHFSACH6F4D3D9BBK9QAXZNSOSTG.png", "block-thumb": "https://storage.googleapis.com/plotly-prod-images/lexieledis/54/8_3YJOUR4A0ZCWWBS01Q0E97RCTB56OC.png", "list-thumb": "https://storage.googleapis.com/plotly-prod-images/lexieledis/54/9_J0KIHT67FJ1A7HK27B9TLT7JYX5MWW.png" }, "api_urls": { "files": "https://api.plotly.com/v2/files/lexieledis:54", "plots": "https://api.plotly.com/v2/plots/lexieledis:54", "parent": "https://api.plotly.com/v2/folders/home?user=lexieledis" }, "owner": "lexieledis", "parent": -1, "preview": "", "referencers": [], "references": [], "title": "", "views": 0, "web_url": "https://chart-studio.plotly.com/~lexieledis/54/", "world_readable": true, "date_modified": "2025-09-08T21:01:43.900Z", "stars": { "results": [], "count": 0 }, "collaborators": { "results": [], "count": 0 }, "subfolder_count": null, "refresh_interval": null, "organize_view_url": "https://chart-studio.plotly.com/~lexieledis/54/", "current_user_permission": "read", "is_theme": null, "is_template": false, "autosize": true, "caption": "", "figure": { "data": [ { "meta": { "columnNames": { "x": "A", "y": "B" } }, "mode": "markers+lines", "type": "scatter", "xsrc": "lexieledis:53:7993eb", "ysrc": "lexieledis:53:e8e433" } ], "frames": [], "layout": { "title": { "text": "Diastolic Pressure" }, "xaxis": { "type": "linear", "range": [ -0.5472054380664653, 9.547205438066465 ], "title": { "text": "Duration of Exercise (minutes)" }, "autorange": true }, "yaxis": { "type": "linear", "range": [ 56.69143496324704, 78.30856503675295 ], "title": { "text": "Diastolic Pressure (mmHg)" }, "autorange": true }, "autosize": true, "template": { "data": { "bar": [ { "type": "bar", "marker": { "colorbar": { "ticks": "", "outlinewidth": 0 } } } ], "table": [ { "type": "table", "cells": { "fill": { "color": "#EBF0F8" }, "line": { "color": "white" } }, "header": { "fill": { "color": "#C8D4E3" }, "line": { "color": "white" } } } ], "carpet": [ { "type": "carpet", "aaxis": { "gridcolor": "#C8D4E3", "linecolor": "#C8D4E3", "endlinecolor": "#2a3f5f", "minorgridcolor": "#C8D4E3", "startlinecolor": "#2a3f5f" }, "baxis": { "gridcolor": "#C8D4E3", "linecolor": "#C8D4E3", "endlinecolor": "#2a3f5f", "minorgridcolor": "#C8D4E3", "startlinecolor": "#2a3f5f" } } ], "mesh3d": [ { "type": "mesh3d", "colorbar": { "ticks": "", "outlinewidth": 0 } } ], "contour": [ { "type": "contour", "colorbar": { "ticks": "", "outlinewidth": 0 }, "autocolorscale": true } ], "heatmap": [ { "type": "heatmap", "colorbar": { "ticks": "", "outlinewidth": 0 }, "autocolorscale": true } ], "scatter": [ { "type": "scatter", "marker": { "colorbar": { "ticks": "", "outlinewidth": 0 } } } ], "surface": [ { "type": "surface", "colorbar": { "ticks": "", "outlinewidth": 0 } } ], "heatmapgl": [ { "type": "heatmapgl", "colorbar": { "ticks": "", "outlinewidth": 0 } } ], "histogram": [ { "type": "histogram", "marker": { "colorbar": { "ticks": "", "outlinewidth": 0 } } } ], "parcoords": [ { "line": { "colorbar": { "ticks": "", "outlinewidth": 0 } }, "type": "parcoords" } ], "scatter3d": [ { "type": "scatter3d", "marker": { "colorbar": { "ticks": "", "outlinewidth": 0 } } } ], "scattergl": [ { "type": "scattergl", "marker": { "colorbar": { "ticks": "", "outlinewidth": 0 } } } ], "choropleth": [ { "type": "choropleth", "colorbar": { "ticks": "", "outlinewidth": 0 } } ], "scattergeo": [ { "type": "scattergeo", "marker": { "colorbar": { "ticks": "", "outlinewidth": 0 } } } ], "histogram2d": [ { "type": "histogram2d", "colorbar": { "ticks": "", "outlinewidth": 0 }, "autocolorscale": true } ], "scatterpolar": [ { "type": "scatterpolar", "marker": { "colorbar": { "ticks": "", "outlinewidth": 0 } } } ], "contourcarpet": [ { "type": "contourcarpet", "colorbar": { "ticks": "", "outlinewidth": 0 } } ], "scattercarpet": [ { "type": "scattercarpet", "marker": { "colorbar": { "ticks": "", "outlinewidth": 0 } } } ], "scattermapbox": [ { "type": "scattermapbox", "marker": { "colorbar": { "ticks": "", "outlinewidth": 0 } } } ], "scatterpolargl": [ { "type": "scatterpolargl", "marker": { "colorbar": { "ticks": "", "outlinewidth": 0 } } } ], "scatterternary": [ { "type": "scatterternary", "marker": { "colorbar": { "ticks": "", "outlinewidth": 0 } } } ], "histogram2dcontour": [ { "type": "histogram2dcontour", "colorbar": { "ticks": "", "outlinewidth": 0 }, "autocolorscale": true } ] }, "layout": { "geo": { "bgcolor": "white", "showland": true, "lakecolor": "white", "landcolor": "white", "showlakes": true, "subunitcolor": "#C8D4E3" }, "font": { "color": "#2a3f5f" }, "polar": { "bgcolor": "white", "radialaxis": { "ticks": "", "gridcolor": "#EBF0F8", "linecolor": "#EBF0F8" }, "angularaxis": { "ticks": "", "gridcolor": "#EBF0F8", "linecolor": "#EBF0F8" } }, "scene": { "xaxis": { "ticks": "", "gridcolor": "#DFE8F3", "gridwidth": 2, "linecolor": "#EBF0F8", "zerolinecolor": "#EBF0F8", "showbackground": true, "backgroundcolor": "white" }, "yaxis": { "ticks": "", "gridcolor": "#DFE8F3", "gridwidth": 2, "linecolor": "#EBF0F8", "zerolinecolor": "#EBF0F8", "showbackground": true, "backgroundcolor": "white" }, "zaxis": { "ticks": "", "gridcolor": "#DFE8F3", "gridwidth": 2, "linecolor": "#EBF0F8", "zerolinecolor": "#EBF0F8", "showbackground": true, "backgroundcolor": "white" } }, "title": { "x": 0.05 }, "xaxis": { "ticks": "", "gridcolor": "#EBF0F8", "linecolor": "#EBF0F8", "automargin": true, "zerolinecolor": "#EBF0F8", "zerolinewidth": 2 }, "yaxis": { "ticks": "", "gridcolor": "#EBF0F8", "linecolor": "#EBF0F8", "automargin": true, "zerolinecolor": "#EBF0F8", "zerolinewidth": 2 }, "ternary": { "aaxis": { "ticks": "", "gridcolor": "#DFE8F3", "linecolor": "#A2B1C6" }, "baxis": { "ticks": "", "gridcolor": "#DFE8F3", "linecolor": "#A2B1C6" }, "caxis": { "ticks": "", "gridcolor": "#DFE8F3", "linecolor": "#A2B1C6" }, "bgcolor": "white" }, "colorway": [ "#636efa", "#EF553B", "#00cc96", "#ab63fa", "#19d3f3", "#e763fa", "#fecb52", "#ffa15a", "#ff6692", "#b6e880" ], "hovermode": "closest", "colorscale": { "diverging": [ [ 0, "#8e0152" ], [ 0.1, "#c51b7d" ], [ 0.2, "#de77ae" ], [ 0.3, "#f1b6da" ], [ 0.4, "#fde0ef" ], [ 0.5, "#f7f7f7" ], [ 0.6, "#e6f5d0" ], [ 0.7, "#b8e186" ], [ 0.8, "#7fbc41" ], [ 0.9, "#4d9221" ], [ 1, "#276419" ] ], "sequential": [ [ 0, "#0508b8" ], [ 0.0893854748603352, "#1910d8" ], [ 0.1787709497206704, "#3c19f0" ], [ 0.2681564245810056, "#6b1cfb" ], [ 0.3575418994413408, "#981cfd" ], [ 0.44692737430167595, "#bf1cfd" ], [ 0.5363128491620112, "#dd2bfd" ], [ 0.6256983240223464, "#f246fe" ], [ 0.7150837988826816, "#fc67fd" ], [ 0.8044692737430168, "#fe88fc" ], [ 0.8938547486033519, "#fea5fd" ], [ 0.9832402234636871, "#febefe" ], [ 1, "#fec3fe" ] ], "sequentialminus": [ [ 0, "#0508b8" ], [ 0.0893854748603352, "#1910d8" ], [ 0.1787709497206704, "#3c19f0" ], [ 0.2681564245810056, "#6b1cfb" ], [ 0.3575418994413408, "#981cfd" ], [ 0.44692737430167595, "#bf1cfd" ], [ 0.5363128491620112, "#dd2bfd" ], [ 0.6256983240223464, "#f246fe" ], [ 0.7150837988826816, "#fc67fd" ], [ 0.8044692737430168, "#fe88fc" ], [ 0.8938547486033519, "#fea5fd" ], [ 0.9832402234636871, "#febefe" ], [ 1, "#fec3fe" ] ] }, "plot_bgcolor": "white", "paper_bgcolor": "white", "shapedefaults": { "line": { "width": 0 }, "opacity": 0.4, "fillcolor": "#506784" }, "annotationdefaults": { "arrowhead": 0, "arrowcolor": "#506784", "arrowwidth": 1 } }, "themeRef": "PLOTLY_WHITE" } } }, "height": null, "width": null, "user": { "profile_url": "https://chart-studio.plotly.com/~lexieledis", "avatar_url": "https://storage.googleapis.com/plotly-prod-profiles/37.jpg", "background_url": "https://storage.googleapis.com/plotly-prod-profiles/bg-4.jpg", "bio": "", "nickname": "", "website": "", "stream_tokens": null, "feature_set_id": null, "csrf_token": null, "date_joined": "2024-08-30 18:21:26", "mapbox_access_tokens": null, "has_password": null, "username": "lexieledis", "email": null, "is_active": null, "readonly": null, "is_dash_creator": null, "dash_created_count": null, "is_chart_creator": null, "charts_created_count": null } } ] }