Plots List
Plots
This endpoint handles manipulation of Plotly plot files.
Reference
Authorization
Any user with or without a Plotly account may view public plots. For private plots, see authentication.
Actions
list
Listing all public plots can be done via a GET request to this endpoint.
By default, plots will be listed in order of date created. The order_by
query parameter is accepted at this endpoint. Currently, only ordering by
views is supported. It is possible to filter the plots by quality
with min_quality or max_quality as query parameter.
Example:
// GET https://api.plotly.com/v2/plots/ ---> 200

// GET https://api.plotly.com/v2/plots/?order_by=-views ---> 200

// GET https://api.plotly.com/v2/plots/?min_quality=5 ---> 200

// GET https://api.plotly.com/v2/plots/?max_quality=5 ---> 200
feed
Listing all handpicked feed plots can be done via a GET request to this endpoint. By default, plots will be listed in a random order.
Example:
// GET https://api.plotly.com/v2/plots/feed ---> 200
create
You can create new plot resources here. The only required field is 'figure'. Currently, the figure is restricted to only contain references to grid data. That is, this will fail if raw data arrays are passed in. To create and manipulate underlying grids for plots, see the grids endpoint.
Example:
// This fails because a figure field is required.
// POST https://api.plotly.com/v2/plots ---> 400 Bad Request
{}

// This fails because the figure has raw data
//POST https://api.plotly.com/v2/plots ---> 400 Bad Request
{
    "figure": {"data": [{"y": ['this', 'is', 'raw', 'data']}]}
}

// This succeeds because the figure has src keys, not raw data.
//POST https://api.plotly.com/v2/plots ---> 200 OK
{
    "figure": {"data": [{"ysrc": "sven:88:u8nd62"}]}
}
When creating a grid, you can optionally specify a source_fid to specify where a plot has come from:
- source_fid: the fid of a plot that was copied (and presumably edited) to produce this one
detail
There is a lot of meta information stored about plot files including filename, title, share_url, and content_url to name a few.
This information can only be reached with a GET to this endpoint.
Example:
// GET https://api.plotly.com/v2/plots/iheartgraphs:90
content
The contents of a plot can be downloaded via the content resource. The plot
content contains referenced grid/column data by default. If you wish to
return the raw grid/column data, the inline_data=true query must be included
in the request url. The Content-Type header will be appropriately set for the
response body.
Alternatively, you can set ?map_data=unreadable to append a mapping of
sources to data that belongs to grids which are unreadable for the
requestor. This is useful when you have read access to another users plot,
but that plot contains grid references which you don't have access to.
Examples:
// Returns referenced grid/column data
// GET https://api.plotly.com/v2/plots/iheartgraphs:90/content ---> 200 OK

// Returns full grid/column data
// GET https://api.plotly.com/v2/plots/iheartgraphs:90/content?inline_data=true ---> 200 OK

// Returns full grid/column data when requestor doesn't have permission
// to read the referenced grid.
// GET https://api.plotly.com/v2/plots/iheartgraphs:90/content?map_data=unreadable ---> 200 OK
GET /v2/plots/?cursor=cj0xJnA9MjAyNS0wOS0xMCsxMCUzQTEwJTNBMzguMzczNTIyJTJCMDAlM0EwMA%3D%3D&format=api
{ "next": "https://api.plotly.com/v2/plots/?cursor=cD0yMDI1LTA5LTEwKzEwJTNBMjYlM0EzMi45MjA3NzklMkIwMCUzQTAw&format=api", "previous": "https://api.plotly.com/v2/plots/?cursor=cj0xJnA9MjAyNS0wOS0xMCsxMyUzQTU3JTNBMDAuMDA2NDE2JTJCMDAlM0EwMA%3D%3D&format=api", "results": [ { "creation_time": "2025-09-10T13:57:00.006416Z", "comments": { "results": [], "count": 0 }, "parented": true, "embed_url": "https://chart-studio.plotly.com/~alexhewson/1858.embed", "fid": "alexhewson:1858", "filename": "operational_capacity", "filetype": "plot", "img_url": "https://api.plotly.com/v2/files/alexhewson:1858/image?image_name=list-thumb", "image_urls": { "default": "https://api.plotly.com/v2/files/alexhewson:1858/image?image_name=default", "block-thumb": "https://api.plotly.com/v2/files/alexhewson:1858/image?image_name=block-thumb", "list-thumb": "https://api.plotly.com/v2/files/alexhewson:1858/image?image_name=list-thumb" }, "api_urls": { "files": "https://api.plotly.com/v2/files/alexhewson:1858", "plots": "https://api.plotly.com/v2/plots/alexhewson:1858", "parent": "https://api.plotly.com/v2/folders/home?user=alexhewson" }, "owner": "alexhewson", "parent": -1, "preview": "", "referencers": [], "references": [], "title": "", "views": 1, "web_url": "https://chart-studio.plotly.com/~alexhewson/1858/", "world_readable": true, "date_modified": "2025-09-15T12:57:04.825Z", "stars": { "results": [], "count": 0 }, "collaborators": { "results": [], "count": 0 }, "subfolder_count": null, "refresh_interval": null, "organize_view_url": "https://chart-studio.plotly.com/~alexhewson/1858/", "current_user_permission": "read", "is_theme": null, "is_template": null, "autosize": true, "caption": "", "figure": { "data": [ { "mode": "lines", "name": "2021", "type": "scatter", "xsrc": "alexhewson:1872:75f519", "ysrc": "alexhewson:1872:e6de3c", "connectgaps": true, "hovertextsrc": "alexhewson:1872:609dd1", "hovertemplate": "<b>%{hovertext}</b><br>%{y:,.0f}" }, { "mode": "lines", "name": "2022", "type": "scatter", "xsrc": "alexhewson:1872:5731e6", "ysrc": "alexhewson:1872:06067e", "connectgaps": true, "hovertextsrc": "alexhewson:1872:7dfe58", "hovertemplate": "<b>%{hovertext}</b><br>%{y:,.0f}" }, { "mode": "lines", "name": "2023", "type": "scatter", "xsrc": "alexhewson:1872:c17636", "ysrc": "alexhewson:1872:ca3046", "connectgaps": true, "hovertextsrc": "alexhewson:1872:07facf", "hovertemplate": "<b>%{hovertext}</b><br>%{y:,.0f}" }, { "mode": "lines", "name": "2024", "type": "scatter", "xsrc": "alexhewson:1872:954a18", "ysrc": "alexhewson:1872:dc61c2", "connectgaps": true, "hovertextsrc": "alexhewson:1872:608fd0", "hovertemplate": "<b>%{hovertext}</b><br>%{y:,.0f}" }, { "mode": "lines", "name": "2025", "type": "scatter", "xsrc": "alexhewson:1872:76b062", "ysrc": "alexhewson:1872:13eeb3", "connectgaps": true, "hovertextsrc": "alexhewson:1872:c0dbb4", "hovertemplate": "<b>%{hovertext}</b><br>%{y:,.0f}" } ], "layout": { "title": { "text": "<b>Operational capacity in England and Wales</b>" }, "width": 655, "xaxis": { "range": [ 1, 53 ], "ticktext": [ "Jan", "Feb", "Mar", "Apr", "May", "Jun", "Jul", "Aug", "Sep", "Oct", "Nov", "Dec" ], "tickvals": [ 3, 6, 10, 15, 19, 23, 27, 32, 36, 40, 45, 49 ] }, "yaxis": { "dtick": 2000, "range": [ 75900, 90100 ], "nticks": 6 }, "height": 500, "images": [ { "x": -0.08, "y": 1.25, "xref": "paper", "yref": "paper", "sizex": 0.15, "sizey": 0.15, "source": "https://i.ibb.co/jhfYbyc/PRTlogo-RGB.png", "xanchor": "left", "yanchor": "top" } ], "margin": { "b": 75, "l": 64, "r": 64, "pad": 10 }, "template": { "layout": { "font": { "size": 12, "color": "#54565B", "family": "Helvetica Neue, Arial" }, "title": { "y": 0.94, "font": { "size": 17, "family": "Helvetica Neue, Arial" }, "yanchor": "bottom" }, "width": 655, "xaxis": { "showgrid": false, "tickcolor": "#54565B" }, "yaxis": { "title": { "text": "" }, "tickformat": ",.0f" }, "height": 500, "margin": { "b": 75, "l": 60 }, "modebar": { "activecolor": "#A01D28" }, "autosize": false, "colorway": [ "#A01D28", "#499CC9", "#F9A237", "#6FBA3A", "#573D6B" ], "hovermode": "x unified", "showlegend": false, "plot_bgcolor": "#F7F2F2", "paper_bgcolor": "#F7F2F2" } }, "hovermode": "x", "annotations": [ { "x": 53, "y": 81195.0, "font": { "size": 10, "color": "#A01D28" }, "text": "2021", "xref": "x", "yref": "y", "align": "left", "xanchor": "left", "showarrow": false }, { "x": 53, "y": 84385.0, "font": { "size": 10, "color": "#499CC9" }, "text": "2022", "xref": "x", "yref": "y", "align": "left", "xanchor": "left", "showarrow": false }, { "x": 53, "y": 89387.0, "font": { "size": 10, "color": "#F9A237" }, "text": "2023", "xref": "x", "yref": "y", "align": "left", "xanchor": "left", "showarrow": false }, { "x": 53, "y": 88688.0, "font": { "size": 10, "color": "#6FBA3A" }, "text": "2024", "xref": "x", "yref": "y", "align": "left", "xanchor": "left", "showarrow": false }, { "x": 37, "y": 89664.0, "font": { "size": 10, "color": "#573D6B" }, "text": "2025", "xref": "x", "yref": "y", "align": "left", "xanchor": "left", "showarrow": false }, { "x": -0.08, "y": -0.19, "font": { "size": 12 }, "text": "<b>Source: Ministry of Justice Prison Population Bulletin</b>", "xref": "paper", "yref": "paper", "align": "left", "showarrow": false }, { "x": 1, "y": 1.04, "font": { "size": 12 }, "text": "Prison places", "xref": "x", "yref": "paper", "align": "left", "xanchor": "left", "showarrow": false } ] } }, "height": 500, "width": 655, "user": { "profile_url": "https://chart-studio.plotly.com/~alexhewson", "avatar_url": "https://storage.googleapis.com/plotly-prod-profiles/87.jpg", "background_url": "https://storage.googleapis.com/plotly-prod-profiles/bg-11.jpg", "bio": "", "nickname": "", "website": "", "stream_tokens": null, "feature_set_id": null, "csrf_token": null, "date_joined": "2019-06-12 13:15:26", "mapbox_access_tokens": null, "has_password": null, "username": "alexhewson", "email": null, "is_active": null, "readonly": null, "is_dash_creator": null, "dash_created_count": null, "is_chart_creator": null, "charts_created_count": null } }, { "creation_time": "2025-09-10T13:19:58.360735Z", "comments": { "results": [], "count": 0 }, "parented": true, "embed_url": "https://chart-studio.plotly.com/~lunayang/1.embed", "fid": "lunayang:1", "filename": "3D Vector Project", "filetype": "plot", "img_url": "https://storage.googleapis.com/plotly-prod-images/lunayang/1/9_XHFXEZKEP6YAEZYTY3WY4AJ431CU9F.png", "image_urls": { "default": "https://storage.googleapis.com/plotly-prod-images/lunayang/1/2_N1IEQI2V1WTXY6BA2U29I98Z6VHDX5.png", "block-thumb": "https://storage.googleapis.com/plotly-prod-images/lunayang/1/8_U3YD2HL9UA9VYQ66J8JYJGM1L0QD6Y.png", "list-thumb": "https://storage.googleapis.com/plotly-prod-images/lunayang/1/9_XHFXEZKEP6YAEZYTY3WY4AJ431CU9F.png" }, "api_urls": { "files": "https://api.plotly.com/v2/files/lunayang:1", "plots": "https://api.plotly.com/v2/plots/lunayang:1", "parent": "https://api.plotly.com/v2/folders/home?user=lunayang" }, "owner": "lunayang", "parent": -1, "preview": "", "referencers": [], "references": [], "title": "", "views": 1, "web_url": "https://chart-studio.plotly.com/~lunayang/1/", "world_readable": true, "date_modified": "2025-09-10T13:19:58.372Z", "stars": { "results": [], "count": 0 }, "collaborators": { "results": [], "count": 0 }, "subfolder_count": null, "refresh_interval": null, "organize_view_url": "https://chart-studio.plotly.com/~lunayang/1/", "current_user_permission": "read", "is_theme": null, "is_template": false, "autosize": true, "caption": "", "figure": { "data": [ { "meta": { "columnNames": { "x": "A", "y": "B", "z": "C" } }, "mode": "lines", "type": "scatter3d", "xsrc": "lunayang:0:5113eb", "ysrc": "lunayang:0:d27adb", "zsrc": "lunayang:0:2072df" }, { "meta": { "columnNames": { "x": "D", "y": "E", "z": "F" } }, "mode": "lines", "type": "scatter3d", "xsrc": "lunayang:0:bec7b1", "ysrc": "lunayang:0:5ae6ec", "zsrc": "lunayang:0:6e55c9" } ], "frames": [], "layout": { "scene": { "camera": { "up": { "x": -0.042142878521290505, "y": -0.24356788943028806, "z": 0.9689678328140803 }, "eye": { "x": 1.8249167063969987, "y": -0.3655110825973784, "z": -0.012507659668395468 }, "center": { "x": 0, "y": 0, "z": 0 }, "projection": { "type": "perspective" } }, "aspectmode": "auto", "aspectratio": { "x": 1, "y": 1, "z": 1 } }, "xaxis": { "range": [ -1, 6 ], "autorange": true }, "yaxis": { "range": [ -1, 4 ], "autorange": true }, "autosize": true, "template": { "data": { "bar": [ { "type": "bar", "marker": { "colorbar": { "ticks": "", "outlinewidth": 0 } } } ], "table": [ { "type": "table", "cells": { "fill": { "color": "#EBF0F8" }, "line": { "color": "white" } }, "header": { "fill": { "color": "#C8D4E3" }, "line": { "color": "white" } } } ], "carpet": [ { "type": "carpet", "aaxis": { "gridcolor": "#C8D4E3", "linecolor": "#C8D4E3", "endlinecolor": "#2a3f5f", "minorgridcolor": "#C8D4E3", "startlinecolor": "#2a3f5f" }, "baxis": { "gridcolor": "#C8D4E3", "linecolor": "#C8D4E3", "endlinecolor": "#2a3f5f", "minorgridcolor": "#C8D4E3", "startlinecolor": "#2a3f5f" } } ], "mesh3d": [ { "type": "mesh3d", "colorbar": { "ticks": "", "outlinewidth": 0 } } ], "contour": [ { "type": "contour", "colorbar": { "ticks": "", "outlinewidth": 0 }, "autocolorscale": true } ], "heatmap": [ { "type": "heatmap", "colorbar": { "ticks": "", "outlinewidth": 0 }, "autocolorscale": true } ], "scatter": [ { "type": "scatter", "marker": { "colorbar": { "ticks": "", "outlinewidth": 0 } } } ], "surface": [ { "type": "surface", "colorbar": { "ticks": "", "outlinewidth": 0 } } ], "heatmapgl": [ { "type": "heatmapgl", "colorbar": { "ticks": "", "outlinewidth": 0 } } ], "histogram": [ { "type": "histogram", "marker": { "colorbar": { "ticks": "", "outlinewidth": 0 } } } ], "parcoords": [ { "line": { "colorbar": { "ticks": "", "outlinewidth": 0 } }, "type": "parcoords" } ], "scatter3d": [ { "type": "scatter3d", "marker": { "colorbar": { "ticks": "", "outlinewidth": 0 } } } ], "scattergl": [ { "type": "scattergl", "marker": { "colorbar": { "ticks": "", "outlinewidth": 0 } } } ], "choropleth": [ { "type": "choropleth", "colorbar": { "ticks": "", "outlinewidth": 0 } } ], "scattergeo": [ { "type": "scattergeo", "marker": { "colorbar": { "ticks": "", "outlinewidth": 0 } } } ], "histogram2d": [ { "type": "histogram2d", "colorbar": { "ticks": "", "outlinewidth": 0 }, "autocolorscale": true } ], "scatterpolar": [ { "type": "scatterpolar", "marker": { "colorbar": { "ticks": "", "outlinewidth": 0 } } } ], "contourcarpet": [ { "type": "contourcarpet", "colorbar": { "ticks": "", "outlinewidth": 0 } } ], "scattercarpet": [ { "type": "scattercarpet", "marker": { "colorbar": { "ticks": "", "outlinewidth": 0 } } } ], "scattermapbox": [ { "type": "scattermapbox", "marker": { "colorbar": { "ticks": "", "outlinewidth": 0 } } } ], "scatterpolargl": [ { "type": "scatterpolargl", "marker": { "colorbar": { "ticks": "", "outlinewidth": 0 } } } ], "scatterternary": [ { "type": "scatterternary", "marker": { "colorbar": { "ticks": "", "outlinewidth": 0 } } } ], "histogram2dcontour": [ { "type": "histogram2dcontour", "colorbar": { "ticks": "", "outlinewidth": 0 }, "autocolorscale": true } ] }, "layout": { "geo": { "bgcolor": "white", "showland": true, "lakecolor": "white", "landcolor": "white", "showlakes": true, "subunitcolor": "#C8D4E3" }, "font": { "color": "#2a3f5f" }, "polar": { "bgcolor": "white", "radialaxis": { "ticks": "", "gridcolor": "#EBF0F8", "linecolor": "#EBF0F8" }, "angularaxis": { "ticks": "", "gridcolor": "#EBF0F8", "linecolor": "#EBF0F8" } }, "scene": { "xaxis": { "ticks": "", "gridcolor": "#DFE8F3", "gridwidth": 2, "linecolor": "#EBF0F8", "zerolinecolor": "#EBF0F8", "showbackground": true, "backgroundcolor": "white" }, "yaxis": { "ticks": "", "gridcolor": "#DFE8F3", "gridwidth": 2, "linecolor": "#EBF0F8", "zerolinecolor": "#EBF0F8", "showbackground": true, "backgroundcolor": "white" }, "zaxis": { "ticks": "", "gridcolor": "#DFE8F3", "gridwidth": 2, "linecolor": "#EBF0F8", "zerolinecolor": "#EBF0F8", "showbackground": true, "backgroundcolor": "white" } }, "title": { "x": 0.05 }, "xaxis": { "ticks": "", "gridcolor": "#EBF0F8", "linecolor": "#EBF0F8", "automargin": true, "zerolinecolor": "#EBF0F8", "zerolinewidth": 2 }, "yaxis": { "ticks": "", "gridcolor": "#EBF0F8", "linecolor": "#EBF0F8", "automargin": true, "zerolinecolor": "#EBF0F8", "zerolinewidth": 2 }, "ternary": { "aaxis": { "ticks": "", "gridcolor": "#DFE8F3", "linecolor": "#A2B1C6" }, "baxis": { "ticks": "", "gridcolor": "#DFE8F3", "linecolor": "#A2B1C6" }, "caxis": { "ticks": "", "gridcolor": "#DFE8F3", "linecolor": "#A2B1C6" }, "bgcolor": "white" }, "colorway": [ "#636efa", "#EF553B", "#00cc96", "#ab63fa", "#19d3f3", "#e763fa", "#fecb52", "#ffa15a", "#ff6692", "#b6e880" ], "hovermode": "closest", "colorscale": { "diverging": [ [ 0, "#8e0152" ], [ 0.1, "#c51b7d" ], [ 0.2, "#de77ae" ], [ 0.3, "#f1b6da" ], [ 0.4, "#fde0ef" ], [ 0.5, "#f7f7f7" ], [ 0.6, "#e6f5d0" ], [ 0.7, "#b8e186" ], [ 0.8, "#7fbc41" ], [ 0.9, "#4d9221" ], [ 1, "#276419" ] ], "sequential": [ [ 0, "#0508b8" ], [ 0.0893854748603352, "#1910d8" ], [ 0.1787709497206704, "#3c19f0" ], [ 0.2681564245810056, "#6b1cfb" ], [ 0.3575418994413408, "#981cfd" ], [ 0.44692737430167595, "#bf1cfd" ], [ 0.5363128491620112, "#dd2bfd" ], [ 0.6256983240223464, "#f246fe" ], [ 0.7150837988826816, "#fc67fd" ], [ 0.8044692737430168, "#fe88fc" ], [ 0.8938547486033519, "#fea5fd" ], [ 0.9832402234636871, "#febefe" ], [ 1, "#fec3fe" ] ], "sequentialminus": [ [ 0, "#0508b8" ], [ 0.0893854748603352, "#1910d8" ], [ 0.1787709497206704, "#3c19f0" ], [ 0.2681564245810056, "#6b1cfb" ], [ 0.3575418994413408, "#981cfd" ], [ 0.44692737430167595, "#bf1cfd" ], [ 0.5363128491620112, "#dd2bfd" ], [ 0.6256983240223464, "#f246fe" ], [ 0.7150837988826816, "#fc67fd" ], [ 0.8044692737430168, "#fe88fc" ], [ 0.8938547486033519, "#fea5fd" ], [ 0.9832402234636871, "#febefe" ], [ 1, "#fec3fe" ] ] }, "plot_bgcolor": "white", "paper_bgcolor": "white", "shapedefaults": { "line": { "width": 0 }, "opacity": 0.4, "fillcolor": "#506784" }, "annotationdefaults": { "arrowhead": 0, "arrowcolor": "#506784", "arrowwidth": 1 } }, "themeRef": "PLOTLY_WHITE" } } }, "height": null, "width": null, "user": { "profile_url": "https://chart-studio.plotly.com/~lunayang", "avatar_url": "https://storage.googleapis.com/plotly-prod-profiles/87.jpg", "background_url": "https://storage.googleapis.com/plotly-prod-profiles/bg-3.jpg", "bio": "", "nickname": "", "website": "", "stream_tokens": null, "feature_set_id": null, "csrf_token": null, "date_joined": "2025-09-09 20:52:32", "mapbox_access_tokens": null, "has_password": null, "username": "lunayang", "email": null, "is_active": null, "readonly": null, "is_dash_creator": null, "dash_created_count": null, "is_chart_creator": null, "charts_created_count": null } }, { "creation_time": "2025-09-10T13:19:45.639766Z", "comments": { "results": [], "count": 0 }, "parented": true, "embed_url": "https://chart-studio.plotly.com/~AOCallaghan/1.embed", "fid": "AOCallaghan:1", "filename": "Plot 1", "filetype": "plot", "img_url": "https://storage.googleapis.com/plotly-prod-images/AOCallaghan/1/9_1B27VV566DKHVVRKO9CQAQ4Q2TUVD1.png", "image_urls": { "default": "https://storage.googleapis.com/plotly-prod-images/AOCallaghan/1/2_2XW99BEO6SAVECL4X8HFK3L6I1S0FO.png", "block-thumb": "https://storage.googleapis.com/plotly-prod-images/AOCallaghan/1/8_JCP95GN7RVOBQ0TYM41CKORD41FNDN.png", "list-thumb": "https://storage.googleapis.com/plotly-prod-images/AOCallaghan/1/9_1B27VV566DKHVVRKO9CQAQ4Q2TUVD1.png" }, "api_urls": { "files": "https://api.plotly.com/v2/files/AOCallaghan:1", "plots": "https://api.plotly.com/v2/plots/AOCallaghan:1", "parent": "https://api.plotly.com/v2/folders/home?user=AOCallaghan" }, "owner": "AOCallaghan", "parent": -1, "preview": "", "referencers": [], "references": [], "title": "", "views": 1, "web_url": "https://chart-studio.plotly.com/~AOCallaghan/1/", "world_readable": true, "date_modified": "2025-09-10T13:19:45.653Z", "stars": { "results": [], "count": 0 }, "collaborators": { "results": [], "count": 0 }, "subfolder_count": null, "refresh_interval": null, "organize_view_url": "https://chart-studio.plotly.com/~AOCallaghan/1/", "current_user_permission": "read", "is_theme": null, "is_template": false, "autosize": true, "caption": "", "figure": { "data": [ { "meta": { "columnNames": { "x": "D", "y": "E", "z": "F" } }, "mode": "lines", "type": "scatter3d", "xsrc": "AOCallaghan:0:e1a384", "ysrc": "AOCallaghan:0:7f8768", "zsrc": "AOCallaghan:0:b0c21c" }, { "meta": { "columnNames": { "x": "A", "y": "B", "z": "C" } }, "mode": "lines", "type": "scatter3d", "xsrc": "AOCallaghan:0:bcd1a1", "ysrc": "AOCallaghan:0:2a0d96", "zsrc": "AOCallaghan:0:0e5dc9" } ], "frames": [], "layout": { "scene": { "camera": { "up": { "x": -0.024640534596265196, "y": -0.028143260110220947, "z": 0.9993001555914915 }, "eye": { "x": 1.541407239479338, "y": -0.9604702695649275, "z": 0.010958002683731033 }, "center": { "x": 1.1102230246251565e-16, "y": 0, "z": 1.6653345369377348e-16 }, "projection": { "type": "perspective" } }, "aspectmode": "auto", "aspectratio": { "x": 1, "y": 1, "z": 1 } }, "xaxis": { "range": [ -1, 6 ], "autorange": true }, "yaxis": { "range": [ -1, 4 ], "autorange": true }, "autosize": true, "template": { "data": { "bar": [ { "type": "bar", "marker": { "colorbar": { "ticks": "", "outlinewidth": 0 } } } ], "table": [ { "type": "table", "cells": { "fill": { "color": "#EBF0F8" }, "line": { "color": "white" } }, "header": { "fill": { "color": "#C8D4E3" }, "line": { "color": "white" } } } ], "carpet": [ { "type": "carpet", "aaxis": { "gridcolor": "#C8D4E3", "linecolor": "#C8D4E3", "endlinecolor": "#2a3f5f", "minorgridcolor": "#C8D4E3", "startlinecolor": "#2a3f5f" }, "baxis": { "gridcolor": "#C8D4E3", "linecolor": "#C8D4E3", "endlinecolor": "#2a3f5f", "minorgridcolor": "#C8D4E3", "startlinecolor": "#2a3f5f" } } ], "mesh3d": [ { "type": "mesh3d", "colorbar": { "ticks": "", "outlinewidth": 0 } } ], "contour": [ { "type": "contour", "colorbar": { "ticks": "", "outlinewidth": 0 }, "autocolorscale": true } ], "heatmap": [ { "type": "heatmap", "colorbar": { "ticks": "", "outlinewidth": 0 }, "autocolorscale": true } ], "scatter": [ { "type": "scatter", "marker": { "colorbar": { "ticks": "", "outlinewidth": 0 } } } ], "surface": [ { "type": "surface", "colorbar": { "ticks": "", "outlinewidth": 0 } } ], "heatmapgl": [ { "type": "heatmapgl", "colorbar": { "ticks": "", "outlinewidth": 0 } } ], "histogram": [ { "type": "histogram", "marker": { "colorbar": { "ticks": "", "outlinewidth": 0 } } } ], "parcoords": [ { "line": { "colorbar": { "ticks": "", "outlinewidth": 0 } }, "type": "parcoords" } ], "scatter3d": [ { "type": "scatter3d", "marker": { "colorbar": { "ticks": "", "outlinewidth": 0 } } } ], "scattergl": [ { "type": "scattergl", "marker": { "colorbar": { "ticks": "", "outlinewidth": 0 } } } ], "choropleth": [ { "type": "choropleth", "colorbar": { "ticks": "", "outlinewidth": 0 } } ], "scattergeo": [ { "type": "scattergeo", "marker": { "colorbar": { "ticks": "", "outlinewidth": 0 } } } ], "histogram2d": [ { "type": "histogram2d", "colorbar": { "ticks": "", "outlinewidth": 0 }, "autocolorscale": true } ], "scatterpolar": [ { "type": "scatterpolar", "marker": { "colorbar": { "ticks": "", "outlinewidth": 0 } } } ], "contourcarpet": [ { "type": "contourcarpet", "colorbar": { "ticks": "", "outlinewidth": 0 } } ], "scattercarpet": [ { "type": "scattercarpet", "marker": { "colorbar": { "ticks": "", "outlinewidth": 0 } } } ], "scattermapbox": [ { "type": "scattermapbox", "marker": { "colorbar": { "ticks": "", "outlinewidth": 0 } } } ], "scatterpolargl": [ { "type": "scatterpolargl", "marker": { "colorbar": { "ticks": "", "outlinewidth": 0 } } } ], "scatterternary": [ { "type": "scatterternary", "marker": { "colorbar": { "ticks": "", "outlinewidth": 0 } } } ], "histogram2dcontour": [ { "type": "histogram2dcontour", "colorbar": { "ticks": "", "outlinewidth": 0 }, "autocolorscale": true } ] }, "layout": { "geo": { "bgcolor": "white", "showland": true, "lakecolor": "white", "landcolor": "white", "showlakes": true, "subunitcolor": "#C8D4E3" }, "font": { "color": "#2a3f5f" }, "polar": { "bgcolor": "white", "radialaxis": { "ticks": "", "gridcolor": "#EBF0F8", "linecolor": "#EBF0F8" }, "angularaxis": { "ticks": "", "gridcolor": "#EBF0F8", "linecolor": "#EBF0F8" } }, "scene": { "xaxis": { "ticks": "", "gridcolor": "#DFE8F3", "gridwidth": 2, "linecolor": "#EBF0F8", "zerolinecolor": "#EBF0F8", "showbackground": true, "backgroundcolor": "white" }, "yaxis": { "ticks": "", "gridcolor": "#DFE8F3", "gridwidth": 2, "linecolor": "#EBF0F8", "zerolinecolor": "#EBF0F8", "showbackground": true, "backgroundcolor": "white" }, "zaxis": { "ticks": "", "gridcolor": "#DFE8F3", "gridwidth": 2, "linecolor": "#EBF0F8", "zerolinecolor": "#EBF0F8", "showbackground": true, "backgroundcolor": "white" } }, "title": { "x": 0.05 }, "xaxis": { "ticks": "", "gridcolor": "#EBF0F8", "linecolor": "#EBF0F8", "automargin": true, "zerolinecolor": "#EBF0F8", "zerolinewidth": 2 }, "yaxis": { "ticks": "", "gridcolor": "#EBF0F8", "linecolor": "#EBF0F8", "automargin": true, "zerolinecolor": "#EBF0F8", "zerolinewidth": 2 }, "ternary": { "aaxis": { "ticks": "", "gridcolor": "#DFE8F3", "linecolor": "#A2B1C6" }, "baxis": { "ticks": "", "gridcolor": "#DFE8F3", "linecolor": "#A2B1C6" }, "caxis": { "ticks": "", "gridcolor": "#DFE8F3", "linecolor": "#A2B1C6" }, "bgcolor": "white" }, "colorway": [ "#636efa", "#EF553B", "#00cc96", "#ab63fa", "#19d3f3", "#e763fa", "#fecb52", "#ffa15a", "#ff6692", "#b6e880" ], "hovermode": "closest", "colorscale": { "diverging": [ [ 0, "#8e0152" ], [ 0.1, "#c51b7d" ], [ 0.2, "#de77ae" ], [ 0.3, "#f1b6da" ], [ 0.4, "#fde0ef" ], [ 0.5, "#f7f7f7" ], [ 0.6, "#e6f5d0" ], [ 0.7, "#b8e186" ], [ 0.8, "#7fbc41" ], [ 0.9, "#4d9221" ], [ 1, "#276419" ] ], "sequential": [ [ 0, "#0508b8" ], [ 0.0893854748603352, "#1910d8" ], [ 0.1787709497206704, "#3c19f0" ], [ 0.2681564245810056, "#6b1cfb" ], [ 0.3575418994413408, "#981cfd" ], [ 0.44692737430167595, "#bf1cfd" ], [ 0.5363128491620112, "#dd2bfd" ], [ 0.6256983240223464, "#f246fe" ], [ 0.7150837988826816, "#fc67fd" ], [ 0.8044692737430168, "#fe88fc" ], [ 0.8938547486033519, "#fea5fd" ], [ 0.9832402234636871, "#febefe" ], [ 1, "#fec3fe" ] ], "sequentialminus": [ [ 0, "#0508b8" ], [ 0.0893854748603352, "#1910d8" ], [ 0.1787709497206704, "#3c19f0" ], [ 0.2681564245810056, "#6b1cfb" ], [ 0.3575418994413408, "#981cfd" ], [ 0.44692737430167595, "#bf1cfd" ], [ 0.5363128491620112, "#dd2bfd" ], [ 0.6256983240223464, "#f246fe" ], [ 0.7150837988826816, "#fc67fd" ], [ 0.8044692737430168, "#fe88fc" ], [ 0.8938547486033519, "#fea5fd" ], [ 0.9832402234636871, "#febefe" ], [ 1, "#fec3fe" ] ] }, "plot_bgcolor": "white", "paper_bgcolor": "white", "shapedefaults": { "line": { "width": 0 }, "opacity": 0.4, "fillcolor": "#506784" }, "annotationdefaults": { "arrowhead": 0, "arrowcolor": "#506784", "arrowwidth": 1 } }, "themeRef": "PLOTLY_WHITE" } } }, "height": null, "width": null, "user": { "profile_url": "https://chart-studio.plotly.com/~AOCallaghan", "avatar_url": "https://storage.googleapis.com/plotly-prod-profiles/55.jpg", "background_url": "https://storage.googleapis.com/plotly-prod-profiles/bg-8.jpg", "bio": "", "nickname": "", "website": "", "stream_tokens": null, "feature_set_id": null, "csrf_token": null, "date_joined": "2025-09-09 14:43:21", "mapbox_access_tokens": null, "has_password": null, "username": "AOCallaghan", "email": null, "is_active": null, "readonly": null, "is_dash_creator": null, "dash_created_count": null, "is_chart_creator": null, "charts_created_count": null } }, { "creation_time": "2025-09-10T13:14:56.490783Z", "comments": { "results": [], "count": 0 }, "parented": true, "embed_url": "https://chart-studio.plotly.com/~dandelone/16.embed", "fid": "dandelone:16", "filename": "Plot 16", "filetype": "plot", "img_url": "https://storage.googleapis.com/plotly-prod-images/dandelone/16/9_I9DTAAQ24B3NCO37RZ7E2ML6Z1YKLW.png", "image_urls": { "default": "https://storage.googleapis.com/plotly-prod-images/dandelone/16/2_M3OIKY8B2LWKJMW6ODT6ECL9N0FGV0.png", "block-thumb": "https://storage.googleapis.com/plotly-prod-images/dandelone/16/8_VF9Y6U7411SDI2TWK8NKC23CE83M3O.png", "list-thumb": "https://storage.googleapis.com/plotly-prod-images/dandelone/16/9_I9DTAAQ24B3NCO37RZ7E2ML6Z1YKLW.png" }, "api_urls": { "files": "https://api.plotly.com/v2/files/dandelone:16", "plots": "https://api.plotly.com/v2/plots/dandelone:16", "parent": "https://api.plotly.com/v2/folders/home?user=dandelone" }, "owner": "dandelone", "parent": -1, "preview": "", "referencers": [], "references": [], "title": "", "views": 1, "web_url": "https://chart-studio.plotly.com/~dandelone/16/", "world_readable": true, "date_modified": "2025-09-10T13:14:56.504Z", "stars": { "results": [], "count": 0 }, "collaborators": { "results": [], "count": 0 }, "subfolder_count": null, "refresh_interval": null, "organize_view_url": "https://chart-studio.plotly.com/~dandelone/16/", "current_user_permission": "read", "is_theme": null, "is_template": false, "autosize": true, "caption": "", "figure": { "data": [ { "meta": { "columnNames": { "x": "time", "y": "fps" } }, "mode": "lines", "name": "fps", "type": "scatter", "xsrc": "dandelone:15:00d6fb", "ysrc": "dandelone:15:e444d6" }, { "meta": { "columnNames": { "x": "time", "y": "total" } }, "mode": "lines", "name": "total", "type": "scatter", "xsrc": "dandelone:15:00d6fb", "ysrc": "dandelone:15:0c24f0", "stackgroup": null }, { "meta": { "columnNames": { "x": "time", "y": "alloc" } }, "mode": "lines", "type": "scatter", "xsrc": "dandelone:15:00d6fb", "ysrc": "dandelone:15:00a4fb", "stackgroup": null } ], "frames": [], "layout": { "xaxis": { "type": "date", "range": [ "2025-09-10 16:09:56.2228", "2025-09-10 16:10:20.3459" ], "autorange": true }, "yaxis": { "type": "linear", "range": [ -4.430000000000003, 584.17 ], "autorange": true }, "autosize": true, "template": { "data": { "bar": [ { "type": "bar", "marker": { "colorbar": { "ticks": "", "outlinewidth": 0 } } } ], "table": [ { "type": "table", "cells": { "fill": { "color": "#EBF0F8" }, "line": { "color": "white" } }, "header": { "fill": { "color": "#C8D4E3" }, "line": { "color": "white" } } } ], "carpet": [ { "type": "carpet", "aaxis": { "gridcolor": "#C8D4E3", "linecolor": "#C8D4E3", "endlinecolor": "#2a3f5f", "minorgridcolor": "#C8D4E3", "startlinecolor": "#2a3f5f" }, "baxis": { "gridcolor": "#C8D4E3", "linecolor": "#C8D4E3", "endlinecolor": "#2a3f5f", "minorgridcolor": "#C8D4E3", "startlinecolor": "#2a3f5f" } } ], "mesh3d": [ { "type": "mesh3d", "colorbar": { "ticks": "", "outlinewidth": 0 } } ], "contour": [ { "type": "contour", "colorbar": { "ticks": "", "outlinewidth": 0 }, "autocolorscale": true } ], "heatmap": [ { "type": "heatmap", "colorbar": { "ticks": "", "outlinewidth": 0 }, "autocolorscale": true } ], "scatter": [ { "type": "scatter", "marker": { "colorbar": { "ticks": "", "outlinewidth": 0 } } } ], "surface": [ { "type": "surface", "colorbar": { "ticks": "", "outlinewidth": 0 } } ], "heatmapgl": [ { "type": "heatmapgl", "colorbar": { "ticks": "", "outlinewidth": 0 } } ], "histogram": [ { "type": "histogram", "marker": { "colorbar": { "ticks": "", "outlinewidth": 0 } } } ], "parcoords": [ { "line": { "colorbar": { "ticks": "", "outlinewidth": 0 } }, "type": "parcoords" } ], "scatter3d": [ { "type": "scatter3d", "marker": { "colorbar": { "ticks": "", "outlinewidth": 0 } } } ], "scattergl": [ { "type": "scattergl", "marker": { "colorbar": { "ticks": "", "outlinewidth": 0 } } } ], "choropleth": [ { "type": "choropleth", "colorbar": { "ticks": "", "outlinewidth": 0 } } ], "scattergeo": [ { "type": "scattergeo", "marker": { "colorbar": { "ticks": "", "outlinewidth": 0 } } } ], "histogram2d": [ { "type": "histogram2d", "colorbar": { "ticks": "", "outlinewidth": 0 }, "autocolorscale": true } ], "scatterpolar": [ { "type": "scatterpolar", "marker": { "colorbar": { "ticks": "", "outlinewidth": 0 } } } ], "contourcarpet": [ { "type": "contourcarpet", "colorbar": { "ticks": "", "outlinewidth": 0 } } ], "scattercarpet": [ { "type": "scattercarpet", "marker": { "colorbar": { "ticks": "", "outlinewidth": 0 } } } ], "scattermapbox": [ { "type": "scattermapbox", "marker": { "colorbar": { "ticks": "", "outlinewidth": 0 } } } ], "scatterpolargl": [ { "type": "scatterpolargl", "marker": { "colorbar": { "ticks": "", "outlinewidth": 0 } } } ], "scatterternary": [ { "type": "scatterternary", "marker": { "colorbar": { "ticks": "", "outlinewidth": 0 } } } ], "histogram2dcontour": [ { "type": "histogram2dcontour", "colorbar": { "ticks": "", "outlinewidth": 0 }, "autocolorscale": true } ] }, "layout": { "geo": { "bgcolor": "white", "showland": true, "lakecolor": "white", "landcolor": "white", "showlakes": true, "subunitcolor": "#C8D4E3" }, "font": { "color": "#2a3f5f" }, "polar": { "bgcolor": "white", "radialaxis": { "ticks": "", "gridcolor": "#EBF0F8", "linecolor": "#EBF0F8" }, "angularaxis": { "ticks": "", "gridcolor": "#EBF0F8", "linecolor": "#EBF0F8" } }, "scene": { "xaxis": { "ticks": "", "gridcolor": "#DFE8F3", "gridwidth": 2, "linecolor": "#EBF0F8", "zerolinecolor": "#EBF0F8", "showbackground": true, "backgroundcolor": "white" }, "yaxis": { "ticks": "", "gridcolor": "#DFE8F3", "gridwidth": 2, "linecolor": "#EBF0F8", "zerolinecolor": "#EBF0F8", "showbackground": true, "backgroundcolor": "white" }, "zaxis": { "ticks": "", "gridcolor": "#DFE8F3", "gridwidth": 2, "linecolor": "#EBF0F8", "zerolinecolor": "#EBF0F8", "showbackground": true, "backgroundcolor": "white" } }, "title": { "x": 0.05 }, "xaxis": { "ticks": "", "gridcolor": "#EBF0F8", "linecolor": "#EBF0F8", "automargin": true, "zerolinecolor": "#EBF0F8", "zerolinewidth": 2 }, "yaxis": { "ticks": "", "gridcolor": "#EBF0F8", "linecolor": "#EBF0F8", "automargin": true, "zerolinecolor": "#EBF0F8", "zerolinewidth": 2 }, "ternary": { "aaxis": { "ticks": "", "gridcolor": "#DFE8F3", "linecolor": "#A2B1C6" }, "baxis": { "ticks": "", "gridcolor": "#DFE8F3", "linecolor": "#A2B1C6" }, "caxis": { "ticks": "", "gridcolor": "#DFE8F3", "linecolor": "#A2B1C6" }, "bgcolor": "white" }, "colorway": [ "#636efa", "#EF553B", "#00cc96", "#ab63fa", "#19d3f3", "#e763fa", "#fecb52", "#ffa15a", "#ff6692", "#b6e880" ], "hovermode": "closest", "colorscale": { "diverging": [ [ 0, "#8e0152" ], [ 0.1, "#c51b7d" ], [ 0.2, "#de77ae" ], [ 0.3, "#f1b6da" ], [ 0.4, "#fde0ef" ], [ 0.5, "#f7f7f7" ], [ 0.6, "#e6f5d0" ], [ 0.7, "#b8e186" ], [ 0.8, "#7fbc41" ], [ 0.9, "#4d9221" ], [ 1, "#276419" ] ], "sequential": [ [ 0, "#0508b8" ], [ 0.0893854748603352, "#1910d8" ], [ 0.1787709497206704, "#3c19f0" ], [ 0.2681564245810056, "#6b1cfb" ], [ 0.3575418994413408, "#981cfd" ], [ 0.44692737430167595, "#bf1cfd" ], [ 0.5363128491620112, "#dd2bfd" ], [ 0.6256983240223464, "#f246fe" ], [ 0.7150837988826816, "#fc67fd" ], [ 0.8044692737430168, "#fe88fc" ], [ 0.8938547486033519, "#fea5fd" ], [ 0.9832402234636871, "#febefe" ], [ 1, "#fec3fe" ] ], "sequentialminus": [ [ 0, "#0508b8" ], [ 0.0893854748603352, "#1910d8" ], [ 0.1787709497206704, "#3c19f0" ], [ 0.2681564245810056, "#6b1cfb" ], [ 0.3575418994413408, "#981cfd" ], [ 0.44692737430167595, "#bf1cfd" ], [ 0.5363128491620112, "#dd2bfd" ], [ 0.6256983240223464, "#f246fe" ], [ 0.7150837988826816, "#fc67fd" ], [ 0.8044692737430168, "#fe88fc" ], [ 0.8938547486033519, "#fea5fd" ], [ 0.9832402234636871, "#febefe" ], [ 1, "#fec3fe" ] ] }, "plot_bgcolor": "white", "paper_bgcolor": "white", "shapedefaults": { "line": { "width": 0 }, "opacity": 0.4, "fillcolor": "#506784" }, "annotationdefaults": { "arrowhead": 0, "arrowcolor": "#506784", "arrowwidth": 1 } }, "themeRef": "PLOTLY_WHITE" } } }, "height": null, "width": null, "user": { "profile_url": "https://chart-studio.plotly.com/~dandelone", "avatar_url": "https://storage.googleapis.com/plotly-prod-profiles/84.jpg", "background_url": "https://storage.googleapis.com/plotly-prod-profiles/bg-3.jpg", "bio": "", "nickname": "", "website": "", "stream_tokens": null, "feature_set_id": null, "csrf_token": null, "date_joined": "2025-08-27 11:35:09", "mapbox_access_tokens": null, "has_password": null, "username": "dandelone", "email": null, "is_active": null, "readonly": null, "is_dash_creator": null, "dash_created_count": null, "is_chart_creator": null, "charts_created_count": null } }, { "creation_time": "2025-09-10T13:00:30.617289Z", "comments": { "results": [], "count": 0 }, "parented": true, "embed_url": "https://chart-studio.plotly.com/~Gonzo420/1.embed", "fid": "Gonzo420:1", "filename": "Lined Seedeater", "filetype": "plot", "img_url": "https://storage.googleapis.com/plotly-prod-images/Gonzo420/1/9_3DUNMCNDX0ETMO042SZYAD593JT4FY.png", "image_urls": { "default": "https://storage.googleapis.com/plotly-prod-images/Gonzo420/1/2_AANYUIG5298Q61OP24I1C9OV213A3V.png", "block-thumb": "https://storage.googleapis.com/plotly-prod-images/Gonzo420/1/8_X8ZYA4C2KRD6DISVXVADR19L8AS7H4.png", "list-thumb": "https://storage.googleapis.com/plotly-prod-images/Gonzo420/1/9_3DUNMCNDX0ETMO042SZYAD593JT4FY.png" }, "api_urls": { "files": "https://api.plotly.com/v2/files/Gonzo420:1", "plots": "https://api.plotly.com/v2/plots/Gonzo420:1", "parent": "https://api.plotly.com/v2/folders/home?user=Gonzo420" }, "owner": "Gonzo420", "parent": -1, "preview": "", "referencers": [], "references": [], "title": "", "views": 1, "web_url": "https://chart-studio.plotly.com/~Gonzo420/1/", "world_readable": true, "date_modified": "2025-09-10T13:00:30.630Z", "stars": { "results": [], "count": 0 }, "collaborators": { "results": [], "count": 0 }, "subfolder_count": null, "refresh_interval": null, "organize_view_url": "https://chart-studio.plotly.com/~Gonzo420/1/", "current_user_permission": "read", "is_theme": null, "is_template": false, "autosize": true, "caption": "", "figure": { "data": [ { "meta": { "columnNames": { "x": "Territory Size (ha)", "y": "Clutch Size (#eggs)" } }, "mode": "lines", "type": "bar", "xsrc": "Gonzo420:0:d86fca", "ysrc": "Gonzo420:0:05aa97", "boxpoints": false, "orientation": "v" } ], "frames": [], "layout": { "title": { "text": "Number of eggs per territory size (ha)" }, "xaxis": { "type": "linear", "range": [ 0.15000000000000002, 0.75 ], "title": { "text": "Territory Size (ha)" }, "autorange": true }, "yaxis": { "type": "linear", "range": [ 0, 4.2105263157894735 ], "title": { "text": "Clutch Size (#eggs)" }, "autorange": true }, "autosize": true, "template": { "data": { "bar": [ { "type": "bar", "marker": { "colorbar": { "ticks": "", "outlinewidth": 0 } } } ], "table": [ { "type": "table", "cells": { "fill": { "color": "#EBF0F8" }, "line": { "color": "white" } }, "header": { "fill": { "color": "#C8D4E3" }, "line": { "color": "white" } } } ], "carpet": [ { "type": "carpet", "aaxis": { "gridcolor": "#C8D4E3", "linecolor": "#C8D4E3", "endlinecolor": "#2a3f5f", "minorgridcolor": "#C8D4E3", "startlinecolor": "#2a3f5f" }, "baxis": { "gridcolor": "#C8D4E3", "linecolor": "#C8D4E3", "endlinecolor": "#2a3f5f", "minorgridcolor": "#C8D4E3", "startlinecolor": "#2a3f5f" } } ], "mesh3d": [ { "type": "mesh3d", "colorbar": { "ticks": "", "outlinewidth": 0 } } ], "contour": [ { "type": "contour", "colorbar": { "ticks": "", "outlinewidth": 0 }, "autocolorscale": true } ], "heatmap": [ { "type": "heatmap", "colorbar": { "ticks": "", "outlinewidth": 0 }, "autocolorscale": true } ], "scatter": [ { "type": "scatter", "marker": { "colorbar": { "ticks": "", "outlinewidth": 0 } } } ], "surface": [ { "type": "surface", "colorbar": { "ticks": "", "outlinewidth": 0 } } ], "heatmapgl": [ { "type": "heatmapgl", "colorbar": { "ticks": "", "outlinewidth": 0 } } ], "histogram": [ { "type": "histogram", "marker": { "colorbar": { "ticks": "", "outlinewidth": 0 } } } ], "parcoords": [ { "line": { "colorbar": { "ticks": "", "outlinewidth": 0 } }, "type": "parcoords" } ], "scatter3d": [ { "type": "scatter3d", "marker": { "colorbar": { "ticks": "", "outlinewidth": 0 } } } ], "scattergl": [ { "type": "scattergl", "marker": { "colorbar": { "ticks": "", "outlinewidth": 0 } } } ], "choropleth": [ { "type": "choropleth", "colorbar": { "ticks": "", "outlinewidth": 0 } } ], "scattergeo": [ { "type": "scattergeo", "marker": { "colorbar": { "ticks": "", "outlinewidth": 0 } } } ], "histogram2d": [ { "type": "histogram2d", "colorbar": { "ticks": "", "outlinewidth": 0 }, "autocolorscale": true } ], "scatterpolar": [ { "type": "scatterpolar", "marker": { "colorbar": { "ticks": "", "outlinewidth": 0 } } } ], "contourcarpet": [ { "type": "contourcarpet", "colorbar": { "ticks": "", "outlinewidth": 0 } } ], "scattercarpet": [ { "type": "scattercarpet", "marker": { "colorbar": { "ticks": "", "outlinewidth": 0 } } } ], "scattermapbox": [ { "type": "scattermapbox", "marker": { "colorbar": { "ticks": "", "outlinewidth": 0 } } } ], "scatterpolargl": [ { "type": "scatterpolargl", "marker": { "colorbar": { "ticks": "", "outlinewidth": 0 } } } ], "scatterternary": [ { "type": "scatterternary", "marker": { "colorbar": { "ticks": "", "outlinewidth": 0 } } } ], "histogram2dcontour": [ { "type": "histogram2dcontour", "colorbar": { "ticks": "", "outlinewidth": 0 }, "autocolorscale": true } ] }, "layout": { "geo": { "bgcolor": "white", "showland": true, "lakecolor": "white", "landcolor": "white", "showlakes": true, "subunitcolor": "#C8D4E3" }, "font": { "color": "#2a3f5f" }, "polar": { "bgcolor": "white", "radialaxis": { "ticks": "", "gridcolor": "#EBF0F8", "linecolor": "#EBF0F8" }, "angularaxis": { "ticks": "", "gridcolor": "#EBF0F8", "linecolor": "#EBF0F8" } }, "scene": { "xaxis": { "ticks": "", "gridcolor": "#DFE8F3", "gridwidth": 2, "linecolor": "#EBF0F8", "zerolinecolor": "#EBF0F8", "showbackground": true, "backgroundcolor": "white" }, "yaxis": { "ticks": "", "gridcolor": "#DFE8F3", "gridwidth": 2, "linecolor": "#EBF0F8", "zerolinecolor": "#EBF0F8", "showbackground": true, "backgroundcolor": "white" }, "zaxis": { "ticks": "", "gridcolor": "#DFE8F3", "gridwidth": 2, "linecolor": "#EBF0F8", "zerolinecolor": "#EBF0F8", "showbackground": true, "backgroundcolor": "white" } }, "title": { "x": 0.05 }, "xaxis": { "ticks": "", "gridcolor": "#EBF0F8", "linecolor": "#EBF0F8", "automargin": true, "zerolinecolor": "#EBF0F8", "zerolinewidth": 2 }, "yaxis": { "ticks": "", "gridcolor": "#EBF0F8", "linecolor": "#EBF0F8", "automargin": true, "zerolinecolor": "#EBF0F8", "zerolinewidth": 2 }, "ternary": { "aaxis": { "ticks": "", "gridcolor": "#DFE8F3", "linecolor": "#A2B1C6" }, "baxis": { "ticks": "", "gridcolor": "#DFE8F3", "linecolor": "#A2B1C6" }, "caxis": { "ticks": "", "gridcolor": "#DFE8F3", "linecolor": "#A2B1C6" }, "bgcolor": "white" }, "colorway": [ "#636efa", "#EF553B", "#00cc96", "#ab63fa", "#19d3f3", "#e763fa", "#fecb52", "#ffa15a", "#ff6692", "#b6e880" ], "hovermode": "closest", "colorscale": { "diverging": [ [ 0, "#8e0152" ], [ 0.1, "#c51b7d" ], [ 0.2, "#de77ae" ], [ 0.3, "#f1b6da" ], [ 0.4, "#fde0ef" ], [ 0.5, "#f7f7f7" ], [ 0.6, "#e6f5d0" ], [ 0.7, "#b8e186" ], [ 0.8, "#7fbc41" ], [ 0.9, "#4d9221" ], [ 1, "#276419" ] ], "sequential": [ [ 0, "#0508b8" ], [ 0.0893854748603352, "#1910d8" ], [ 0.1787709497206704, "#3c19f0" ], [ 0.2681564245810056, "#6b1cfb" ], [ 0.3575418994413408, "#981cfd" ], [ 0.44692737430167595, "#bf1cfd" ], [ 0.5363128491620112, "#dd2bfd" ], [ 0.6256983240223464, "#f246fe" ], [ 0.7150837988826816, "#fc67fd" ], [ 0.8044692737430168, "#fe88fc" ], [ 0.8938547486033519, "#fea5fd" ], [ 0.9832402234636871, "#febefe" ], [ 1, "#fec3fe" ] ], "sequentialminus": [ [ 0, "#0508b8" ], [ 0.0893854748603352, "#1910d8" ], [ 0.1787709497206704, "#3c19f0" ], [ 0.2681564245810056, "#6b1cfb" ], [ 0.3575418994413408, "#981cfd" ], [ 0.44692737430167595, "#bf1cfd" ], [ 0.5363128491620112, "#dd2bfd" ], [ 0.6256983240223464, "#f246fe" ], [ 0.7150837988826816, "#fc67fd" ], [ 0.8044692737430168, "#fe88fc" ], [ 0.8938547486033519, "#fea5fd" ], [ 0.9832402234636871, "#febefe" ], [ 1, "#fec3fe" ] ] }, "plot_bgcolor": "white", "paper_bgcolor": "white", "shapedefaults": { "line": { "width": 0 }, "opacity": 0.4, "fillcolor": "#506784" }, "annotationdefaults": { "arrowhead": 0, "arrowcolor": "#506784", "arrowwidth": 1 } }, "themeRef": "PLOTLY_WHITE" } } }, "height": null, "width": null, "user": { "profile_url": "https://chart-studio.plotly.com/~Gonzo420", "avatar_url": "https://storage.googleapis.com/plotly-prod-profiles/28.jpg", "background_url": "https://storage.googleapis.com/plotly-prod-profiles/bg-14.jpg", "bio": "", "nickname": "", "website": "", "stream_tokens": null, "feature_set_id": null, "csrf_token": null, "date_joined": "2025-09-10 12:59:10", "mapbox_access_tokens": null, "has_password": null, "username": "Gonzo420", "email": null, "is_active": null, "readonly": null, "is_dash_creator": null, "dash_created_count": null, "is_chart_creator": null, "charts_created_count": null } }, { "creation_time": "2025-09-10T12:48:16.056151Z", "comments": { "results": [], "count": 0 }, "parented": true, "embed_url": "https://chart-studio.plotly.com/~dandelone/14.embed", "fid": "dandelone:14", "filename": "Plot 14", "filetype": "plot", "img_url": "https://storage.googleapis.com/plotly-prod-images/dandelone/14/9_3IQSCGMV5AKTGJPJOK13MYRJUYUSJO.png", "image_urls": { "default": "https://storage.googleapis.com/plotly-prod-images/dandelone/14/2_U7T2SQ0KI66WO3IBQGQDF9DUP3MYOV.png", "block-thumb": "https://storage.googleapis.com/plotly-prod-images/dandelone/14/8_ZOPAJL42FZ7LTILQZT0UTFAVMR9E0A.png", "list-thumb": "https://storage.googleapis.com/plotly-prod-images/dandelone/14/9_3IQSCGMV5AKTGJPJOK13MYRJUYUSJO.png" }, "api_urls": { "files": "https://api.plotly.com/v2/files/dandelone:14", "plots": "https://api.plotly.com/v2/plots/dandelone:14", "parent": "https://api.plotly.com/v2/folders/home?user=dandelone" }, "owner": "dandelone", "parent": -1, "preview": "", "referencers": [], "references": [], "title": "", "views": 1, "web_url": "https://chart-studio.plotly.com/~dandelone/14/", "world_readable": true, "date_modified": "2025-09-10T12:48:16.068Z", "stars": { "results": [], "count": 0 }, "collaborators": { "results": [], "count": 0 }, "subfolder_count": null, "refresh_interval": null, "organize_view_url": "https://chart-studio.plotly.com/~dandelone/14/", "current_user_permission": "read", "is_theme": null, "is_template": false, "autosize": true, "caption": "", "figure": { "data": [ { "meta": { "columnNames": { "x": "time", "y": "fps" } }, "mode": "lines", "name": "fps", "type": "scatter", "xsrc": "dandelone:13:e197ec", "ysrc": "dandelone:13:2057da" }, { "meta": { "columnNames": { "x": "time", "y": "total" } }, "mode": "lines", "name": "total", "type": "scatter", "xsrc": "dandelone:13:e197ec", "ysrc": "dandelone:13:1b5cb2", "stackgroup": null }, { "meta": { "columnNames": { "x": "time", "y": "alloc" } }, "mode": "lines", "name": "alloc", "type": "scatter", "xsrc": "dandelone:13:e197ec", "ysrc": "dandelone:13:b0ae4e", "stackgroup": null } ], "frames": [], "layout": { "xaxis": { "type": "date", "range": [ "2025-09-10 15:28:17.8274", "2025-09-10 15:30:52.8894" ], "autorange": true }, "yaxis": { "type": "linear", "range": [ -3.545555555555559, 667.3655555555556 ], "autorange": true }, "autosize": true, "template": { "data": { "bar": [ { "type": "bar", "marker": { "colorbar": { "ticks": "", "outlinewidth": 0 } } } ], "table": [ { "type": "table", "cells": { "fill": { "color": "#EBF0F8" }, "line": { "color": "white" } }, "header": { "fill": { "color": "#C8D4E3" }, "line": { "color": "white" } } } ], "carpet": [ { "type": "carpet", "aaxis": { "gridcolor": "#C8D4E3", "linecolor": "#C8D4E3", "endlinecolor": "#2a3f5f", "minorgridcolor": "#C8D4E3", "startlinecolor": "#2a3f5f" }, "baxis": { "gridcolor": "#C8D4E3", "linecolor": "#C8D4E3", "endlinecolor": "#2a3f5f", "minorgridcolor": "#C8D4E3", "startlinecolor": "#2a3f5f" } } ], "mesh3d": [ { "type": "mesh3d", "colorbar": { "ticks": "", "outlinewidth": 0 } } ], "contour": [ { "type": "contour", "colorbar": { "ticks": "", "outlinewidth": 0 }, "autocolorscale": true } ], "heatmap": [ { "type": "heatmap", "colorbar": { "ticks": "", "outlinewidth": 0 }, "autocolorscale": true } ], "scatter": [ { "type": "scatter", "marker": { "colorbar": { "ticks": "", "outlinewidth": 0 } } } ], "surface": [ { "type": "surface", "colorbar": { "ticks": "", "outlinewidth": 0 } } ], "heatmapgl": [ { "type": "heatmapgl", "colorbar": { "ticks": "", "outlinewidth": 0 } } ], "histogram": [ { "type": "histogram", "marker": { "colorbar": { "ticks": "", "outlinewidth": 0 } } } ], "parcoords": [ { "line": { "colorbar": { "ticks": "", "outlinewidth": 0 } }, "type": "parcoords" } ], "scatter3d": [ { "type": "scatter3d", "marker": { "colorbar": { "ticks": "", "outlinewidth": 0 } } } ], "scattergl": [ { "type": "scattergl", "marker": { "colorbar": { "ticks": "", "outlinewidth": 0 } } } ], "choropleth": [ { "type": "choropleth", "colorbar": { "ticks": "", "outlinewidth": 0 } } ], "scattergeo": [ { "type": "scattergeo", "marker": { "colorbar": { "ticks": "", "outlinewidth": 0 } } } ], "histogram2d": [ { "type": "histogram2d", "colorbar": { "ticks": "", "outlinewidth": 0 }, "autocolorscale": true } ], "scatterpolar": [ { "type": "scatterpolar", "marker": { "colorbar": { "ticks": "", "outlinewidth": 0 } } } ], "contourcarpet": [ { "type": "contourcarpet", "colorbar": { "ticks": "", "outlinewidth": 0 } } ], "scattercarpet": [ { "type": "scattercarpet", "marker": { "colorbar": { "ticks": "", "outlinewidth": 0 } } } ], "scattermapbox": [ { "type": "scattermapbox", "marker": { "colorbar": { "ticks": "", "outlinewidth": 0 } } } ], "scatterpolargl": [ { "type": "scatterpolargl", "marker": { "colorbar": { "ticks": "", "outlinewidth": 0 } } } ], "scatterternary": [ { "type": "scatterternary", "marker": { "colorbar": { "ticks": "", "outlinewidth": 0 } } } ], "histogram2dcontour": [ { "type": "histogram2dcontour", "colorbar": { "ticks": "", "outlinewidth": 0 }, "autocolorscale": true } ] }, "layout": { "geo": { "bgcolor": "white", "showland": true, "lakecolor": "white", "landcolor": "white", "showlakes": true, "subunitcolor": "#C8D4E3" }, "font": { "color": "#2a3f5f" }, "polar": { "bgcolor": "white", "radialaxis": { "ticks": "", "gridcolor": "#EBF0F8", "linecolor": "#EBF0F8" }, "angularaxis": { "ticks": "", "gridcolor": "#EBF0F8", "linecolor": "#EBF0F8" } }, "scene": { "xaxis": { "ticks": "", "gridcolor": "#DFE8F3", "gridwidth": 2, "linecolor": "#EBF0F8", "zerolinecolor": "#EBF0F8", "showbackground": true, "backgroundcolor": "white" }, "yaxis": { "ticks": "", "gridcolor": "#DFE8F3", "gridwidth": 2, "linecolor": "#EBF0F8", "zerolinecolor": "#EBF0F8", "showbackground": true, "backgroundcolor": "white" }, "zaxis": { "ticks": "", "gridcolor": "#DFE8F3", "gridwidth": 2, "linecolor": "#EBF0F8", "zerolinecolor": "#EBF0F8", "showbackground": true, "backgroundcolor": "white" } }, "title": { "x": 0.05 }, "xaxis": { "ticks": "", "gridcolor": "#EBF0F8", "linecolor": "#EBF0F8", "automargin": true, "zerolinecolor": "#EBF0F8", "zerolinewidth": 2 }, "yaxis": { "ticks": "", "gridcolor": "#EBF0F8", "linecolor": "#EBF0F8", "automargin": true, "zerolinecolor": "#EBF0F8", "zerolinewidth": 2 }, "ternary": { "aaxis": { "ticks": "", "gridcolor": "#DFE8F3", "linecolor": "#A2B1C6" }, "baxis": { "ticks": "", "gridcolor": "#DFE8F3", "linecolor": "#A2B1C6" }, "caxis": { "ticks": "", "gridcolor": "#DFE8F3", "linecolor": "#A2B1C6" }, "bgcolor": "white" }, "colorway": [ "#636efa", "#EF553B", "#00cc96", "#ab63fa", "#19d3f3", "#e763fa", "#fecb52", "#ffa15a", "#ff6692", "#b6e880" ], "hovermode": "closest", "colorscale": { "diverging": [ [ 0, "#8e0152" ], [ 0.1, "#c51b7d" ], [ 0.2, "#de77ae" ], [ 0.3, "#f1b6da" ], [ 0.4, "#fde0ef" ], [ 0.5, "#f7f7f7" ], [ 0.6, "#e6f5d0" ], [ 0.7, "#b8e186" ], [ 0.8, "#7fbc41" ], [ 0.9, "#4d9221" ], [ 1, "#276419" ] ], "sequential": [ [ 0, "#0508b8" ], [ 0.0893854748603352, "#1910d8" ], [ 0.1787709497206704, "#3c19f0" ], [ 0.2681564245810056, "#6b1cfb" ], [ 0.3575418994413408, "#981cfd" ], [ 0.44692737430167595, "#bf1cfd" ], [ 0.5363128491620112, "#dd2bfd" ], [ 0.6256983240223464, "#f246fe" ], [ 0.7150837988826816, "#fc67fd" ], [ 0.8044692737430168, "#fe88fc" ], [ 0.8938547486033519, "#fea5fd" ], [ 0.9832402234636871, "#febefe" ], [ 1, "#fec3fe" ] ], "sequentialminus": [ [ 0, "#0508b8" ], [ 0.0893854748603352, "#1910d8" ], [ 0.1787709497206704, "#3c19f0" ], [ 0.2681564245810056, "#6b1cfb" ], [ 0.3575418994413408, "#981cfd" ], [ 0.44692737430167595, "#bf1cfd" ], [ 0.5363128491620112, "#dd2bfd" ], [ 0.6256983240223464, "#f246fe" ], [ 0.7150837988826816, "#fc67fd" ], [ 0.8044692737430168, "#fe88fc" ], [ 0.8938547486033519, "#fea5fd" ], [ 0.9832402234636871, "#febefe" ], [ 1, "#fec3fe" ] ] }, "plot_bgcolor": "white", "paper_bgcolor": "white", "shapedefaults": { "line": { "width": 0 }, "opacity": 0.4, "fillcolor": "#506784" }, "annotationdefaults": { "arrowhead": 0, "arrowcolor": "#506784", "arrowwidth": 1 } }, "themeRef": "PLOTLY_WHITE" } } }, "height": null, "width": null, "user": { "profile_url": "https://chart-studio.plotly.com/~dandelone", "avatar_url": "https://storage.googleapis.com/plotly-prod-profiles/84.jpg", "background_url": "https://storage.googleapis.com/plotly-prod-profiles/bg-3.jpg", "bio": "", "nickname": "", "website": "", "stream_tokens": null, "feature_set_id": null, "csrf_token": null, "date_joined": "2025-08-27 11:35:09", "mapbox_access_tokens": null, "has_password": null, "username": "dandelone", "email": null, "is_active": null, "readonly": null, "is_dash_creator": null, "dash_created_count": null, "is_chart_creator": null, "charts_created_count": null } }, { "creation_time": "2025-09-10T12:45:47.873654Z", "comments": { "results": [], "count": 0 }, "parented": true, "embed_url": "https://chart-studio.plotly.com/~dandelone/12.embed", "fid": "dandelone:12", "filename": "Plot 12", "filetype": "plot", "img_url": "https://storage.googleapis.com/plotly-prod-images/dandelone/12/9_XO8L3TE549H5PCNWDCTTGENID1D65G.png", "image_urls": { "default": "https://storage.googleapis.com/plotly-prod-images/dandelone/12/2_G9T1281TMZM0YE84Q8RSNJT4I3OGE3.png", "block-thumb": "https://storage.googleapis.com/plotly-prod-images/dandelone/12/8_OVFS49O987LD2PHU88XZSJZD4W631R.png", "list-thumb": "https://storage.googleapis.com/plotly-prod-images/dandelone/12/9_XO8L3TE549H5PCNWDCTTGENID1D65G.png" }, "api_urls": { "files": "https://api.plotly.com/v2/files/dandelone:12", "plots": "https://api.plotly.com/v2/plots/dandelone:12", "parent": "https://api.plotly.com/v2/folders/home?user=dandelone" }, "owner": "dandelone", "parent": -1, "preview": "", "referencers": [], "references": [], "title": "", "views": 1, "web_url": "https://chart-studio.plotly.com/~dandelone/12/", "world_readable": true, "date_modified": "2025-09-10T12:45:51.667Z", "stars": { "results": [], "count": 0 }, "collaborators": { "results": [], "count": 0 }, "subfolder_count": null, "refresh_interval": null, "organize_view_url": "https://chart-studio.plotly.com/~dandelone/12/", "current_user_permission": "read", "is_theme": null, "is_template": false, "autosize": true, "caption": "", "figure": { "data": [ { "meta": { "columnNames": { "x": "time", "y": "fps" } }, "mode": "lines", "name": "fps", "type": "scatter", "xsrc": "dandelone:11:410022", "ysrc": "dandelone:11:12b3db" }, { "meta": { "columnNames": { "x": "time", "y": "total" } }, "mode": "lines", "name": "total", "type": "scatter", "xsrc": "dandelone:11:410022", "ysrc": "dandelone:11:19a853", "stackgroup": null }, { "meta": { "columnNames": { "x": "time", "y": "alloc" } }, "mode": "lines", "name": "alloc", "type": "scatter", "xsrc": "dandelone:11:410022", "ysrc": "dandelone:11:b58c66", "stackgroup": null } ], "frames": [], "layout": { "xaxis": { "type": "date", "range": [ "2025-09-10 15:16:12.5922", "2025-09-10 15:16:37.8169" ], "autorange": true }, "yaxis": { "type": "linear", "range": [ -12.041111111111114, 608.7811111111112 ], "autorange": true }, "autosize": true, "template": { "data": { "bar": [ { "type": "bar", "marker": { "colorbar": { "ticks": "", "outlinewidth": 0 } } } ], "table": [ { "type": "table", "cells": { "fill": { "color": "#EBF0F8" }, "line": { "color": "white" } }, "header": { "fill": { "color": "#C8D4E3" }, "line": { "color": "white" } } } ], "carpet": [ { "type": "carpet", "aaxis": { "gridcolor": "#C8D4E3", "linecolor": "#C8D4E3", "endlinecolor": "#2a3f5f", "minorgridcolor": "#C8D4E3", "startlinecolor": "#2a3f5f" }, "baxis": { "gridcolor": "#C8D4E3", "linecolor": "#C8D4E3", "endlinecolor": "#2a3f5f", "minorgridcolor": "#C8D4E3", "startlinecolor": "#2a3f5f" } } ], "mesh3d": [ { "type": "mesh3d", "colorbar": { "ticks": "", "outlinewidth": 0 } } ], "contour": [ { "type": "contour", "colorbar": { "ticks": "", "outlinewidth": 0 }, "autocolorscale": true } ], "heatmap": [ { "type": "heatmap", "colorbar": { "ticks": "", "outlinewidth": 0 }, "autocolorscale": true } ], "scatter": [ { "type": "scatter", "marker": { "colorbar": { "ticks": "", "outlinewidth": 0 } } } ], "surface": [ { "type": "surface", "colorbar": { "ticks": "", "outlinewidth": 0 } } ], "heatmapgl": [ { "type": "heatmapgl", "colorbar": { "ticks": "", "outlinewidth": 0 } } ], "histogram": [ { "type": "histogram", "marker": { "colorbar": { "ticks": "", "outlinewidth": 0 } } } ], "parcoords": [ { "line": { "colorbar": { "ticks": "", "outlinewidth": 0 } }, "type": "parcoords" } ], "scatter3d": [ { "type": "scatter3d", "marker": { "colorbar": { "ticks": "", "outlinewidth": 0 } } } ], "scattergl": [ { "type": "scattergl", "marker": { "colorbar": { "ticks": "", "outlinewidth": 0 } } } ], "choropleth": [ { "type": "choropleth", "colorbar": { "ticks": "", "outlinewidth": 0 } } ], "scattergeo": [ { "type": "scattergeo", "marker": { "colorbar": { "ticks": "", "outlinewidth": 0 } } } ], "histogram2d": [ { "type": "histogram2d", "colorbar": { "ticks": "", "outlinewidth": 0 }, "autocolorscale": true } ], "scatterpolar": [ { "type": "scatterpolar", "marker": { "colorbar": { "ticks": "", "outlinewidth": 0 } } } ], "contourcarpet": [ { "type": "contourcarpet", "colorbar": { "ticks": "", "outlinewidth": 0 } } ], "scattercarpet": [ { "type": "scattercarpet", "marker": { "colorbar": { "ticks": "", "outlinewidth": 0 } } } ], "scattermapbox": [ { "type": "scattermapbox", "marker": { "colorbar": { "ticks": "", "outlinewidth": 0 } } } ], "scatterpolargl": [ { "type": "scatterpolargl", "marker": { "colorbar": { "ticks": "", "outlinewidth": 0 } } } ], "scatterternary": [ { "type": "scatterternary", "marker": { "colorbar": { "ticks": "", "outlinewidth": 0 } } } ], "histogram2dcontour": [ { "type": "histogram2dcontour", "colorbar": { "ticks": "", "outlinewidth": 0 }, "autocolorscale": true } ] }, "layout": { "geo": { "bgcolor": "white", "showland": true, "lakecolor": "white", "landcolor": "white", "showlakes": true, "subunitcolor": "#C8D4E3" }, "font": { "color": "#2a3f5f" }, "polar": { "bgcolor": "white", "radialaxis": { "ticks": "", "gridcolor": "#EBF0F8", "linecolor": "#EBF0F8" }, "angularaxis": { "ticks": "", "gridcolor": "#EBF0F8", "linecolor": "#EBF0F8" } }, "scene": { "xaxis": { "ticks": "", "gridcolor": "#DFE8F3", "gridwidth": 2, "linecolor": "#EBF0F8", "zerolinecolor": "#EBF0F8", "showbackground": true, "backgroundcolor": "white" }, "yaxis": { "ticks": "", "gridcolor": "#DFE8F3", "gridwidth": 2, "linecolor": "#EBF0F8", "zerolinecolor": "#EBF0F8", "showbackground": true, "backgroundcolor": "white" }, "zaxis": { "ticks": "", "gridcolor": "#DFE8F3", "gridwidth": 2, "linecolor": "#EBF0F8", "zerolinecolor": "#EBF0F8", "showbackground": true, "backgroundcolor": "white" } }, "title": { "x": 0.05 }, "xaxis": { "ticks": "", "gridcolor": "#EBF0F8", "linecolor": "#EBF0F8", "automargin": true, "zerolinecolor": "#EBF0F8", "zerolinewidth": 2 }, "yaxis": { "ticks": "", "gridcolor": "#EBF0F8", "linecolor": "#EBF0F8", "automargin": true, "zerolinecolor": "#EBF0F8", "zerolinewidth": 2 }, "ternary": { "aaxis": { "ticks": "", "gridcolor": "#DFE8F3", "linecolor": "#A2B1C6" }, "baxis": { "ticks": "", "gridcolor": "#DFE8F3", "linecolor": "#A2B1C6" }, "caxis": { "ticks": "", "gridcolor": "#DFE8F3", "linecolor": "#A2B1C6" }, "bgcolor": "white" }, "colorway": [ "#636efa", "#EF553B", "#00cc96", "#ab63fa", "#19d3f3", "#e763fa", "#fecb52", "#ffa15a", "#ff6692", "#b6e880" ], "hovermode": "closest", "colorscale": { "diverging": [ [ 0, "#8e0152" ], [ 0.1, "#c51b7d" ], [ 0.2, "#de77ae" ], [ 0.3, "#f1b6da" ], [ 0.4, "#fde0ef" ], [ 0.5, "#f7f7f7" ], [ 0.6, "#e6f5d0" ], [ 0.7, "#b8e186" ], [ 0.8, "#7fbc41" ], [ 0.9, "#4d9221" ], [ 1, "#276419" ] ], "sequential": [ [ 0, "#0508b8" ], [ 0.0893854748603352, "#1910d8" ], [ 0.1787709497206704, "#3c19f0" ], [ 0.2681564245810056, "#6b1cfb" ], [ 0.3575418994413408, "#981cfd" ], [ 0.44692737430167595, "#bf1cfd" ], [ 0.5363128491620112, "#dd2bfd" ], [ 0.6256983240223464, "#f246fe" ], [ 0.7150837988826816, "#fc67fd" ], [ 0.8044692737430168, "#fe88fc" ], [ 0.8938547486033519, "#fea5fd" ], [ 0.9832402234636871, "#febefe" ], [ 1, "#fec3fe" ] ], "sequentialminus": [ [ 0, "#0508b8" ], [ 0.0893854748603352, "#1910d8" ], [ 0.1787709497206704, "#3c19f0" ], [ 0.2681564245810056, "#6b1cfb" ], [ 0.3575418994413408, "#981cfd" ], [ 0.44692737430167595, "#bf1cfd" ], [ 0.5363128491620112, "#dd2bfd" ], [ 0.6256983240223464, "#f246fe" ], [ 0.7150837988826816, "#fc67fd" ], [ 0.8044692737430168, "#fe88fc" ], [ 0.8938547486033519, "#fea5fd" ], [ 0.9832402234636871, "#febefe" ], [ 1, "#fec3fe" ] ] }, "plot_bgcolor": "white", "paper_bgcolor": "white", "shapedefaults": { "line": { "width": 0 }, "opacity": 0.4, "fillcolor": "#506784" }, "annotationdefaults": { "arrowhead": 0, "arrowcolor": "#506784", "arrowwidth": 1 } }, "themeRef": "PLOTLY_WHITE" } } }, "height": null, "width": null, "user": { "profile_url": "https://chart-studio.plotly.com/~dandelone", "avatar_url": "https://storage.googleapis.com/plotly-prod-profiles/84.jpg", "background_url": "https://storage.googleapis.com/plotly-prod-profiles/bg-3.jpg", "bio": "", "nickname": "", "website": "", "stream_tokens": null, "feature_set_id": null, "csrf_token": null, "date_joined": "2025-08-27 11:35:09", "mapbox_access_tokens": null, "has_password": null, "username": "dandelone", "email": null, "is_active": null, "readonly": null, "is_dash_creator": null, "dash_created_count": null, "is_chart_creator": null, "charts_created_count": null } }, { "creation_time": "2025-09-10T10:38:55.348639Z", "comments": { "results": [], "count": 0 }, "parented": true, "embed_url": "https://chart-studio.plotly.com/~opencv.korea/127.embed", "fid": "opencv.korea:127", "filename": "test-chart-slide", "filetype": "plot", "img_url": "https://storage.googleapis.com/plotly-prod-images/opencv.korea/127/9_7L7V1EVI4VNTSV6O1J5Y8FHAP23TPI.png", "image_urls": { "default": "https://storage.googleapis.com/plotly-prod-images/opencv.korea/127/2_LPWT4VDTS4ZXD1W10ZYB7SDN3EWT19.png", "block-thumb": "https://storage.googleapis.com/plotly-prod-images/opencv.korea/127/8_QB2B76OIYRJSO2R6IFSIEI1463QSGT.png", "list-thumb": "https://storage.googleapis.com/plotly-prod-images/opencv.korea/127/9_7L7V1EVI4VNTSV6O1J5Y8FHAP23TPI.png" }, "api_urls": { "files": "https://api.plotly.com/v2/files/opencv.korea:127", "plots": "https://api.plotly.com/v2/plots/opencv.korea:127", "parent": "https://api.plotly.com/v2/folders/home?user=opencv.korea" }, "owner": "opencv.korea", "parent": -1, "preview": "", "referencers": [], "references": [], "title": "", "views": 2, "web_url": "https://chart-studio.plotly.com/~opencv.korea/127/", "world_readable": true, "date_modified": "2025-09-10T10:38:55.362Z", "stars": { "results": [], "count": 0 }, "collaborators": { "results": [], "count": 0 }, "subfolder_count": null, "refresh_interval": null, "organize_view_url": "https://chart-studio.plotly.com/~opencv.korea/127/", "current_user_permission": "read", "is_theme": null, "is_template": null, "autosize": true, "caption": "", "figure": { "data": [ { "mode": "markers", "name": "Asia", "type": "scatter", "xsrc": "opencv.korea:126:40fcac", "ysrc": "opencv.korea:126:62c598", "xaxis": "x", "yaxis": "y", "marker": { "color": "#636efa", "symbol": "circle" }, "showlegend": true, "legendgroup": "Asia", "orientation": "v", "hovertemplate": "continent=Asia<br>year=1952<br>gdpPercap=%{x}<br>lifeExp=%{y}<extra></extra>" }, { "mode": "markers", "name": "Europe", "type": "scatter", "xsrc": "opencv.korea:126:0b6f10", "ysrc": "opencv.korea:126:8d3b99", "xaxis": "x", "yaxis": "y", "marker": { "color": "#EF553B", "symbol": "circle" }, "showlegend": true, "legendgroup": "Europe", "orientation": "v", "hovertemplate": "continent=Europe<br>year=1952<br>gdpPercap=%{x}<br>lifeExp=%{y}<extra></extra>" }, { "mode": "markers", "name": "Africa", "type": "scatter", "xsrc": "opencv.korea:126:0c0379", "ysrc": "opencv.korea:126:376719", "xaxis": "x", "yaxis": "y", "marker": { "color": "#00cc96", "symbol": "circle" }, "showlegend": true, "legendgroup": "Africa", "orientation": "v", "hovertemplate": "continent=Africa<br>year=1952<br>gdpPercap=%{x}<br>lifeExp=%{y}<extra></extra>" }, { "mode": "markers", "name": "Americas", "type": "scatter", "xsrc": "opencv.korea:126:fe4b60", "ysrc": "opencv.korea:126:53042a", "xaxis": "x", "yaxis": "y", "marker": { "color": "#ab63fa", "symbol": "circle" }, "showlegend": true, "legendgroup": "Americas", "orientation": "v", "hovertemplate": "continent=Americas<br>year=1952<br>gdpPercap=%{x}<br>lifeExp=%{y}<extra></extra>" }, { "mode": "markers", "name": "Oceania", "type": "scatter", "xsrc": "opencv.korea:126:22a3fd", "ysrc": "opencv.korea:126:236bb9", "xaxis": "x", "yaxis": "y", "marker": { "color": "#FFA15A", "symbol": "circle" }, "showlegend": true, "legendgroup": "Oceania", "orientation": "v", "hovertemplate": "continent=Oceania<br>year=1952<br>gdpPercap=%{x}<br>lifeExp=%{y}<extra></extra>" } ], "frames": [ { "data": [ { "mode": "markers", "name": "Asia", "type": "scatter", "xsrc": "opencv.korea:126:a17599", "ysrc": "opencv.korea:126:fc4593", "xaxis": "x", "yaxis": "y", "marker": { "color": "#636efa", "symbol": "circle" }, "showlegend": true, "legendgroup": "Asia", "orientation": "v", "hovertemplate": "continent=Asia<br>year=1952<br>gdpPercap=%{x}<br>lifeExp=%{y}<extra></extra>" }, { "mode": "markers", "name": "Europe", "type": "scatter", "xsrc": "opencv.korea:126:8d1e83", "ysrc": "opencv.korea:126:043dd9", "xaxis": "x", "yaxis": "y", "marker": { "color": "#EF553B", "symbol": "circle" }, "showlegend": true, "legendgroup": "Europe", "orientation": "v", "hovertemplate": "continent=Europe<br>year=1952<br>gdpPercap=%{x}<br>lifeExp=%{y}<extra></extra>" }, { "mode": "markers", "name": "Africa", "type": "scatter", "xsrc": "opencv.korea:126:52eca0", "ysrc": "opencv.korea:126:f3aa97", "xaxis": "x", "yaxis": "y", "marker": { "color": "#00cc96", "symbol": "circle" }, "showlegend": true, "legendgroup": "Africa", "orientation": "v", "hovertemplate": "continent=Africa<br>year=1952<br>gdpPercap=%{x}<br>lifeExp=%{y}<extra></extra>" }, { "mode": "markers", "name": "Americas", "type": "scatter", "xsrc": "opencv.korea:126:4e4a46", "ysrc": "opencv.korea:126:fc42de", "xaxis": "x", "yaxis": "y", "marker": { "color": "#ab63fa", "symbol": "circle" }, "showlegend": true, "legendgroup": "Americas", "orientation": "v", "hovertemplate": "continent=Americas<br>year=1952<br>gdpPercap=%{x}<br>lifeExp=%{y}<extra></extra>" }, { "mode": "markers", "name": "Oceania", "type": "scatter", "xsrc": "opencv.korea:126:5c2b5f", "ysrc": "opencv.korea:126:53dad0", "xaxis": "x", "yaxis": "y", "marker": { "color": "#FFA15A", "symbol": "circle" }, "showlegend": true, "legendgroup": "Oceania", "orientation": "v", "hovertemplate": "continent=Oceania<br>year=1952<br>gdpPercap=%{x}<br>lifeExp=%{y}<extra></extra>" } ], "name": "1952" }, { "data": [ { "mode": "markers", "name": "Asia", "type": "scatter", "xsrc": "opencv.korea:126:6004f5", "ysrc": "opencv.korea:126:66e08d", "xaxis": "x", "yaxis": "y", "marker": { "color": "#636efa", "symbol": "circle" }, "showlegend": true, "legendgroup": "Asia", "orientation": "v", "hovertemplate": "continent=Asia<br>year=1957<br>gdpPercap=%{x}<br>lifeExp=%{y}<extra></extra>" }, { "mode": "markers", "name": "Europe", "type": "scatter", "xsrc": "opencv.korea:126:ad53b7", "ysrc": "opencv.korea:126:effa50", "xaxis": "x", "yaxis": "y", "marker": { "color": "#EF553B", "symbol": "circle" }, "showlegend": true, "legendgroup": "Europe", "orientation": "v", "hovertemplate": "continent=Europe<br>year=1957<br>gdpPercap=%{x}<br>lifeExp=%{y}<extra></extra>" }, { "mode": "markers", "name": "Africa", "type": "scatter", "xsrc": "opencv.korea:126:d4f4c8", "ysrc": "opencv.korea:126:26b815", "xaxis": "x", "yaxis": "y", "marker": { "color": "#00cc96", "symbol": "circle" }, "showlegend": true, "legendgroup": "Africa", "orientation": "v", "hovertemplate": "continent=Africa<br>year=1957<br>gdpPercap=%{x}<br>lifeExp=%{y}<extra></extra>" }, { "mode": "markers", "name": "Americas", "type": "scatter", "xsrc": "opencv.korea:126:02b906", "ysrc": "opencv.korea:126:d23bf3", "xaxis": "x", "yaxis": "y", "marker": { "color": "#ab63fa", "symbol": "circle" }, "showlegend": true, "legendgroup": "Americas", "orientation": "v", "hovertemplate": "continent=Americas<br>year=1957<br>gdpPercap=%{x}<br>lifeExp=%{y}<extra></extra>" }, { "mode": "markers", "name": "Oceania", "type": "scatter", "xsrc": "opencv.korea:126:c74c70", "ysrc": "opencv.korea:126:f1201c", "xaxis": "x", "yaxis": "y", "marker": { "color": "#FFA15A", "symbol": "circle" }, "showlegend": true, "legendgroup": "Oceania", "orientation": "v", "hovertemplate": "continent=Oceania<br>year=1957<br>gdpPercap=%{x}<br>lifeExp=%{y}<extra></extra>" } ], "name": "1957" }, { "data": [ { "mode": "markers", "name": "Asia", "type": "scatter", "xsrc": "opencv.korea:126:618060", "ysrc": "opencv.korea:126:283ec4", "xaxis": "x", "yaxis": "y", "marker": { "color": "#636efa", "symbol": "circle" }, "showlegend": true, "legendgroup": "Asia", "orientation": "v", "hovertemplate": "continent=Asia<br>year=1962<br>gdpPercap=%{x}<br>lifeExp=%{y}<extra></extra>" }, { "mode": "markers", "name": "Europe", "type": "scatter", "xsrc": "opencv.korea:126:88e3af", "ysrc": "opencv.korea:126:240126", "xaxis": "x", "yaxis": "y", "marker": { "color": "#EF553B", "symbol": "circle" }, "showlegend": true, "legendgroup": "Europe", "orientation": "v", "hovertemplate": "continent=Europe<br>year=1962<br>gdpPercap=%{x}<br>lifeExp=%{y}<extra></extra>" }, { "mode": "markers", "name": "Africa", "type": "scatter", "xsrc": "opencv.korea:126:9527a5", "ysrc": "opencv.korea:126:1e1ad1", "xaxis": "x", "yaxis": "y", "marker": { "color": "#00cc96", "symbol": "circle" }, "showlegend": true, "legendgroup": "Africa", "orientation": "v", "hovertemplate": "continent=Africa<br>year=1962<br>gdpPercap=%{x}<br>lifeExp=%{y}<extra></extra>" }, { "mode": "markers", "name": "Americas", "type": "scatter", "xsrc": "opencv.korea:126:5ca3a0", "ysrc": "opencv.korea:126:f6f93f", "xaxis": "x", "yaxis": "y", "marker": { "color": "#ab63fa", "symbol": "circle" }, "showlegend": true, "legendgroup": "Americas", "orientation": "v", "hovertemplate": "continent=Americas<br>year=1962<br>gdpPercap=%{x}<br>lifeExp=%{y}<extra></extra>" }, { "mode": "markers", "name": "Oceania", "type": "scatter", "xsrc": "opencv.korea:126:03cf2c", "ysrc": "opencv.korea:126:77ba0a", "xaxis": "x", "yaxis": "y", "marker": { "color": "#FFA15A", "symbol": "circle" }, "showlegend": true, "legendgroup": "Oceania", "orientation": "v", "hovertemplate": "continent=Oceania<br>year=1962<br>gdpPercap=%{x}<br>lifeExp=%{y}<extra></extra>" } ], "name": "1962" }, { "data": [ { "mode": "markers", "name": "Asia", "type": "scatter", "xsrc": "opencv.korea:126:e4a3d7", "ysrc": "opencv.korea:126:01277e", "xaxis": "x", "yaxis": "y", "marker": { "color": "#636efa", "symbol": "circle" }, "showlegend": true, "legendgroup": "Asia", "orientation": "v", "hovertemplate": "continent=Asia<br>year=1967<br>gdpPercap=%{x}<br>lifeExp=%{y}<extra></extra>" }, { "mode": "markers", "name": "Europe", "type": "scatter", "xsrc": "opencv.korea:126:b24b01", "ysrc": "opencv.korea:126:6ec21a", "xaxis": "x", "yaxis": "y", "marker": { "color": "#EF553B", "symbol": "circle" }, "showlegend": true, "legendgroup": "Europe", "orientation": "v", "hovertemplate": "continent=Europe<br>year=1967<br>gdpPercap=%{x}<br>lifeExp=%{y}<extra></extra>" }, { "mode": "markers", "name": "Africa", "type": "scatter", "xsrc": "opencv.korea:126:29f78c", "ysrc": "opencv.korea:126:c4322c", "xaxis": "x", "yaxis": "y", "marker": { "color": "#00cc96", "symbol": "circle" }, "showlegend": true, "legendgroup": "Africa", "orientation": "v", "hovertemplate": "continent=Africa<br>year=1967<br>gdpPercap=%{x}<br>lifeExp=%{y}<extra></extra>" }, { "mode": "markers", "name": "Americas", "type": "scatter", "xsrc": "opencv.korea:126:b81a53", "ysrc": "opencv.korea:126:fb7a5f", "xaxis": "x", "yaxis": "y", "marker": { "color": "#ab63fa", "symbol": "circle" }, "showlegend": true, "legendgroup": "Americas", "orientation": "v", "hovertemplate": "continent=Americas<br>year=1967<br>gdpPercap=%{x}<br>lifeExp=%{y}<extra></extra>" }, { "mode": "markers", "name": "Oceania", "type": "scatter", "xsrc": "opencv.korea:126:e256f9", "ysrc": "opencv.korea:126:8c4011", "xaxis": "x", "yaxis": "y", "marker": { "color": "#FFA15A", "symbol": "circle" }, "showlegend": true, "legendgroup": "Oceania", "orientation": "v", "hovertemplate": "continent=Oceania<br>year=1967<br>gdpPercap=%{x}<br>lifeExp=%{y}<extra></extra>" } ], "name": "1967" }, { "data": [ { "mode": "markers", "name": "Asia", "type": "scatter", "xsrc": "opencv.korea:126:dc9b1c", "ysrc": "opencv.korea:126:ccd003", "xaxis": "x", "yaxis": "y", "marker": { "color": "#636efa", "symbol": "circle" }, "showlegend": true, "legendgroup": "Asia", "orientation": "v", "hovertemplate": "continent=Asia<br>year=1972<br>gdpPercap=%{x}<br>lifeExp=%{y}<extra></extra>" }, { "mode": "markers", "name": "Europe", "type": "scatter", "xsrc": "opencv.korea:126:bbc887", "ysrc": "opencv.korea:126:92f58b", "xaxis": "x", "yaxis": "y", "marker": { "color": "#EF553B", "symbol": "circle" }, "showlegend": true, "legendgroup": "Europe", "orientation": "v", "hovertemplate": "continent=Europe<br>year=1972<br>gdpPercap=%{x}<br>lifeExp=%{y}<extra></extra>" }, { "mode": "markers", "name": "Africa", "type": "scatter", "xsrc": "opencv.korea:126:c4be6e", "ysrc": "opencv.korea:126:a19acf", "xaxis": "x", "yaxis": "y", "marker": { "color": "#00cc96", "symbol": "circle" }, "showlegend": true, "legendgroup": "Africa", "orientation": "v", "hovertemplate": "continent=Africa<br>year=1972<br>gdpPercap=%{x}<br>lifeExp=%{y}<extra></extra>" }, { "mode": "markers", "name": "Americas", "type": "scatter", "xsrc": "opencv.korea:126:e42fd4", "ysrc": "opencv.korea:126:f491f1", "xaxis": "x", "yaxis": "y", "marker": { "color": "#ab63fa", "symbol": "circle" }, "showlegend": true, "legendgroup": "Americas", "orientation": "v", "hovertemplate": "continent=Americas<br>year=1972<br>gdpPercap=%{x}<br>lifeExp=%{y}<extra></extra>" }, { "mode": "markers", "name": "Oceania", "type": "scatter", "xsrc": "opencv.korea:126:3458b5", "ysrc": "opencv.korea:126:f40c1b", "xaxis": "x", "yaxis": "y", "marker": { "color": "#FFA15A", "symbol": "circle" }, "showlegend": true, "legendgroup": "Oceania", "orientation": "v", "hovertemplate": "continent=Oceania<br>year=1972<br>gdpPercap=%{x}<br>lifeExp=%{y}<extra></extra>" } ], "name": "1972" }, { "data": [ { "mode": "markers", "name": "Asia", "type": "scatter", "xsrc": "opencv.korea:126:9bf750", "ysrc": "opencv.korea:126:276ae3", "xaxis": "x", "yaxis": "y", "marker": { "color": "#636efa", "symbol": "circle" }, "showlegend": true, "legendgroup": "Asia", "orientation": "v", "hovertemplate": "continent=Asia<br>year=1977<br>gdpPercap=%{x}<br>lifeExp=%{y}<extra></extra>" }, { "mode": "markers", "name": "Europe", "type": "scatter", "xsrc": "opencv.korea:126:639ad8", "ysrc": "opencv.korea:126:5a6b10", "xaxis": "x", "yaxis": "y", "marker": { "color": "#EF553B", "symbol": "circle" }, "showlegend": true, "legendgroup": "Europe", "orientation": "v", "hovertemplate": "continent=Europe<br>year=1977<br>gdpPercap=%{x}<br>lifeExp=%{y}<extra></extra>" }, { "mode": "markers", "name": "Africa", "type": "scatter", "xsrc": "opencv.korea:126:5cc1ad", "ysrc": "opencv.korea:126:5691e5", "xaxis": "x", "yaxis": "y", "marker": { "color": "#00cc96", "symbol": "circle" }, "showlegend": true, "legendgroup": "Africa", "orientation": "v", "hovertemplate": "continent=Africa<br>year=1977<br>gdpPercap=%{x}<br>lifeExp=%{y}<extra></extra>" }, { "mode": "markers", "name": "Americas", "type": "scatter", "xsrc": "opencv.korea:126:0ae42d", "ysrc": "opencv.korea:126:01c2ee", "xaxis": "x", "yaxis": "y", "marker": { "color": "#ab63fa", "symbol": "circle" }, "showlegend": true, "legendgroup": "Americas", "orientation": "v", "hovertemplate": "continent=Americas<br>year=1977<br>gdpPercap=%{x}<br>lifeExp=%{y}<extra></extra>" }, { "mode": "markers", "name": "Oceania", "type": "scatter", "xsrc": "opencv.korea:126:dcff1b", "ysrc": "opencv.korea:126:0450d3", "xaxis": "x", "yaxis": "y", "marker": { "color": "#FFA15A", "symbol": "circle" }, "showlegend": true, "legendgroup": "Oceania", "orientation": "v", "hovertemplate": "continent=Oceania<br>year=1977<br>gdpPercap=%{x}<br>lifeExp=%{y}<extra></extra>" } ], "name": "1977" }, { "data": [ { "mode": "markers", "name": "Asia", "type": "scatter", "xsrc": "opencv.korea:126:68407e", "ysrc": "opencv.korea:126:8926e1", "xaxis": "x", "yaxis": "y", "marker": { "color": "#636efa", "symbol": "circle" }, "showlegend": true, "legendgroup": "Asia", "orientation": "v", "hovertemplate": "continent=Asia<br>year=1982<br>gdpPercap=%{x}<br>lifeExp=%{y}<extra></extra>" }, { "mode": "markers", "name": "Europe", "type": "scatter", "xsrc": "opencv.korea:126:2bff74", "ysrc": "opencv.korea:126:cc0fac", "xaxis": "x", "yaxis": "y", "marker": { "color": "#EF553B", "symbol": "circle" }, "showlegend": true, "legendgroup": "Europe", "orientation": "v", "hovertemplate": "continent=Europe<br>year=1982<br>gdpPercap=%{x}<br>lifeExp=%{y}<extra></extra>" }, { "mode": "markers", "name": "Africa", "type": "scatter", "xsrc": "opencv.korea:126:5f2179", "ysrc": "opencv.korea:126:0234bd", "xaxis": "x", "yaxis": "y", "marker": { "color": "#00cc96", "symbol": "circle" }, "showlegend": true, "legendgroup": "Africa", "orientation": "v", "hovertemplate": "continent=Africa<br>year=1982<br>gdpPercap=%{x}<br>lifeExp=%{y}<extra></extra>" }, { "mode": "markers", "name": "Americas", "type": "scatter", "xsrc": "opencv.korea:126:dcf8cc", "ysrc": "opencv.korea:126:0d16e4", "xaxis": "x", "yaxis": "y", "marker": { "color": "#ab63fa", "symbol": "circle" }, "showlegend": true, "legendgroup": "Americas", "orientation": "v", "hovertemplate": "continent=Americas<br>year=1982<br>gdpPercap=%{x}<br>lifeExp=%{y}<extra></extra>" }, { "mode": "markers", "name": "Oceania", "type": "scatter", "xsrc": "opencv.korea:126:0fea99", "ysrc": "opencv.korea:126:da0d4d", "xaxis": "x", "yaxis": "y", "marker": { "color": "#FFA15A", "symbol": "circle" }, "showlegend": true, "legendgroup": "Oceania", "orientation": "v", "hovertemplate": "continent=Oceania<br>year=1982<br>gdpPercap=%{x}<br>lifeExp=%{y}<extra></extra>" } ], "name": "1982" }, { "data": [ { "mode": "markers", "name": "Asia", "type": "scatter", "xsrc": "opencv.korea:126:4b5673", "ysrc": "opencv.korea:126:4f9eff", "xaxis": "x", "yaxis": "y", "marker": { "color": "#636efa", "symbol": "circle" }, "showlegend": true, "legendgroup": "Asia", "orientation": "v", "hovertemplate": "continent=Asia<br>year=1987<br>gdpPercap=%{x}<br>lifeExp=%{y}<extra></extra>" }, { "mode": "markers", "name": "Europe", "type": "scatter", "xsrc": "opencv.korea:126:63aaab", "ysrc": "opencv.korea:126:6c99e4", "xaxis": "x", "yaxis": "y", "marker": { "color": "#EF553B", "symbol": "circle" }, "showlegend": true, "legendgroup": "Europe", "orientation": "v", "hovertemplate": "continent=Europe<br>year=1987<br>gdpPercap=%{x}<br>lifeExp=%{y}<extra></extra>" }, { "mode": "markers", "name": "Africa", "type": "scatter", "xsrc": "opencv.korea:126:63e9ee", "ysrc": "opencv.korea:126:a99705", "xaxis": "x", "yaxis": "y", "marker": { "color": "#00cc96", "symbol": "circle" }, "showlegend": true, "legendgroup": "Africa", "orientation": "v", "hovertemplate": "continent=Africa<br>year=1987<br>gdpPercap=%{x}<br>lifeExp=%{y}<extra></extra>" }, { "mode": "markers", "name": "Americas", "type": "scatter", "xsrc": "opencv.korea:126:146213", "ysrc": "opencv.korea:126:a32149", "xaxis": "x", "yaxis": "y", "marker": { "color": "#ab63fa", "symbol": "circle" }, "showlegend": true, "legendgroup": "Americas", "orientation": "v", "hovertemplate": "continent=Americas<br>year=1987<br>gdpPercap=%{x}<br>lifeExp=%{y}<extra></extra>" }, { "mode": "markers", "name": "Oceania", "type": "scatter", "xsrc": "opencv.korea:126:ce49c1", "ysrc": "opencv.korea:126:c07547", "xaxis": "x", "yaxis": "y", "marker": { "color": "#FFA15A", "symbol": "circle" }, "showlegend": true, "legendgroup": "Oceania", "orientation": "v", "hovertemplate": "continent=Oceania<br>year=1987<br>gdpPercap=%{x}<br>lifeExp=%{y}<extra></extra>" } ], "name": "1987" }, { "data": [ { "mode": "markers", "name": "Asia", "type": "scatter", "xsrc": "opencv.korea:126:eee75f", "ysrc": "opencv.korea:126:dd7eec", "xaxis": "x", "yaxis": "y", "marker": { "color": "#636efa", "symbol": "circle" }, "showlegend": true, "legendgroup": "Asia", "orientation": "v", "hovertemplate": "continent=Asia<br>year=1992<br>gdpPercap=%{x}<br>lifeExp=%{y}<extra></extra>" }, { "mode": "markers", "name": "Europe", "type": "scatter", "xsrc": "opencv.korea:126:ba40a2", "ysrc": "opencv.korea:126:78ae7d", "xaxis": "x", "yaxis": "y", "marker": { "color": "#EF553B", "symbol": "circle" }, "showlegend": true, "legendgroup": "Europe", "orientation": "v", "hovertemplate": "continent=Europe<br>year=1992<br>gdpPercap=%{x}<br>lifeExp=%{y}<extra></extra>" }, { "mode": "markers", "name": "Africa", "type": "scatter", "xsrc": "opencv.korea:126:41575c", "ysrc": "opencv.korea:126:a663b0", "xaxis": "x", "yaxis": "y", "marker": { "color": "#00cc96", "symbol": "circle" }, "showlegend": true, "legendgroup": "Africa", "orientation": "v", "hovertemplate": "continent=Africa<br>year=1992<br>gdpPercap=%{x}<br>lifeExp=%{y}<extra></extra>" }, { "mode": "markers", "name": "Americas", "type": "scatter", "xsrc": "opencv.korea:126:c7ee5c", "ysrc": "opencv.korea:126:8116c9", "xaxis": "x", "yaxis": "y", "marker": { "color": "#ab63fa", "symbol": "circle" }, "showlegend": true, "legendgroup": "Americas", "orientation": "v", "hovertemplate": "continent=Americas<br>year=1992<br>gdpPercap=%{x}<br>lifeExp=%{y}<extra></extra>" }, { "mode": "markers", "name": "Oceania", "type": "scatter", "xsrc": "opencv.korea:126:54942f", "ysrc": "opencv.korea:126:faa9a2", "xaxis": "x", "yaxis": "y", "marker": { "color": "#FFA15A", "symbol": "circle" }, "showlegend": true, "legendgroup": "Oceania", "orientation": "v", "hovertemplate": "continent=Oceania<br>year=1992<br>gdpPercap=%{x}<br>lifeExp=%{y}<extra></extra>" } ], "name": "1992" }, { "data": [ { "mode": "markers", "name": "Asia", "type": "scatter", "xsrc": "opencv.korea:126:1332b0", "ysrc": "opencv.korea:126:08951f", "xaxis": "x", "yaxis": "y", "marker": { "color": "#636efa", "symbol": "circle" }, "showlegend": true, "legendgroup": "Asia", "orientation": "v", "hovertemplate": "continent=Asia<br>year=1997<br>gdpPercap=%{x}<br>lifeExp=%{y}<extra></extra>" }, { "mode": "markers", "name": "Europe", "type": "scatter", "xsrc": "opencv.korea:126:7e83a8", "ysrc": "opencv.korea:126:f4f386", "xaxis": "x", "yaxis": "y", "marker": { "color": "#EF553B", "symbol": "circle" }, "showlegend": true, "legendgroup": "Europe", "orientation": "v", "hovertemplate": "continent=Europe<br>year=1997<br>gdpPercap=%{x}<br>lifeExp=%{y}<extra></extra>" }, { "mode": "markers", "name": "Africa", "type": "scatter", "xsrc": "opencv.korea:126:9688e1", "ysrc": "opencv.korea:126:472540", "xaxis": "x", "yaxis": "y", "marker": { "color": "#00cc96", "symbol": "circle" }, "showlegend": true, "legendgroup": "Africa", "orientation": "v", "hovertemplate": "continent=Africa<br>year=1997<br>gdpPercap=%{x}<br>lifeExp=%{y}<extra></extra>" }, { "mode": "markers", "name": "Americas", "type": "scatter", "xsrc": "opencv.korea:126:f07e68", "ysrc": "opencv.korea:126:3deb06", "xaxis": "x", "yaxis": "y", "marker": { "color": "#ab63fa", "symbol": "circle" }, "showlegend": true, "legendgroup": "Americas", "orientation": "v", "hovertemplate": "continent=Americas<br>year=1997<br>gdpPercap=%{x}<br>lifeExp=%{y}<extra></extra>" }, { "mode": "markers", "name": "Oceania", "type": "scatter", "xsrc": "opencv.korea:126:7ca1cf", "ysrc": "opencv.korea:126:ce793c", "xaxis": "x", "yaxis": "y", "marker": { "color": "#FFA15A", "symbol": "circle" }, "showlegend": true, "legendgroup": "Oceania", "orientation": "v", "hovertemplate": "continent=Oceania<br>year=1997<br>gdpPercap=%{x}<br>lifeExp=%{y}<extra></extra>" } ], "name": "1997" }, { "data": [ { "mode": "markers", "name": "Asia", "type": "scatter", "xsrc": "opencv.korea:126:c4d0b5", "ysrc": "opencv.korea:126:e8e121", "xaxis": "x", "yaxis": "y", "marker": { "color": "#636efa", "symbol": "circle" }, "showlegend": true, "legendgroup": "Asia", "orientation": "v", "hovertemplate": "continent=Asia<br>year=2002<br>gdpPercap=%{x}<br>lifeExp=%{y}<extra></extra>" }, { "mode": "markers", "name": "Europe", "type": "scatter", "xsrc": "opencv.korea:126:0c5310", "ysrc": "opencv.korea:126:962d39", "xaxis": "x", "yaxis": "y", "marker": { "color": "#EF553B", "symbol": "circle" }, "showlegend": true, "legendgroup": "Europe", "orientation": "v", "hovertemplate": "continent=Europe<br>year=2002<br>gdpPercap=%{x}<br>lifeExp=%{y}<extra></extra>" }, { "mode": "markers", "name": "Africa", "type": "scatter", "xsrc": "opencv.korea:126:f17813", "ysrc": "opencv.korea:126:156530", "xaxis": "x", "yaxis": "y", "marker": { "color": "#00cc96", "symbol": "circle" }, "showlegend": true, "legendgroup": "Africa", "orientation": "v", "hovertemplate": "continent=Africa<br>year=2002<br>gdpPercap=%{x}<br>lifeExp=%{y}<extra></extra>" }, { "mode": "markers", "name": "Americas", "type": "scatter", "xsrc": "opencv.korea:126:1c8325", "ysrc": "opencv.korea:126:38d8c5", "xaxis": "x", "yaxis": "y", "marker": { "color": "#ab63fa", "symbol": "circle" }, "showlegend": true, "legendgroup": "Americas", "orientation": "v", "hovertemplate": "continent=Americas<br>year=2002<br>gdpPercap=%{x}<br>lifeExp=%{y}<extra></extra>" }, { "mode": "markers", "name": "Oceania", "type": "scatter", "xsrc": "opencv.korea:126:dd058e", "ysrc": "opencv.korea:126:6f497c", "xaxis": "x", "yaxis": "y", "marker": { "color": "#FFA15A", "symbol": "circle" }, "showlegend": true, "legendgroup": "Oceania", "orientation": "v", "hovertemplate": "continent=Oceania<br>year=2002<br>gdpPercap=%{x}<br>lifeExp=%{y}<extra></extra>" } ], "name": "2002" }, { "data": [ { "mode": "markers", "name": "Asia", "type": "scatter", "xsrc": "opencv.korea:126:3d9d36", "ysrc": "opencv.korea:126:49d481", "xaxis": "x", "yaxis": "y", "marker": { "color": "#636efa", "symbol": "circle" }, "showlegend": true, "legendgroup": "Asia", "orientation": "v", "hovertemplate": "continent=Asia<br>year=2007<br>gdpPercap=%{x}<br>lifeExp=%{y}<extra></extra>" }, { "mode": "markers", "name": "Europe", "type": "scatter", "xsrc": "opencv.korea:126:5d81c8", "ysrc": "opencv.korea:126:7ca3f4", "xaxis": "x", "yaxis": "y", "marker": { "color": "#EF553B", "symbol": "circle" }, "showlegend": true, "legendgroup": "Europe", "orientation": "v", "hovertemplate": "continent=Europe<br>year=2007<br>gdpPercap=%{x}<br>lifeExp=%{y}<extra></extra>" }, { "mode": "markers", "name": "Africa", "type": "scatter", "xsrc": "opencv.korea:126:25b76d", "ysrc": "opencv.korea:126:1c35c2", "xaxis": "x", "yaxis": "y", "marker": { "color": "#00cc96", "symbol": "circle" }, "showlegend": true, "legendgroup": "Africa", "orientation": "v", "hovertemplate": "continent=Africa<br>year=2007<br>gdpPercap=%{x}<br>lifeExp=%{y}<extra></extra>" }, { "mode": "markers", "name": "Americas", "type": "scatter", "xsrc": "opencv.korea:126:56faef", "ysrc": "opencv.korea:126:7a4039", "xaxis": "x", "yaxis": "y", "marker": { "color": "#ab63fa", "symbol": "circle" }, "showlegend": true, "legendgroup": "Americas", "orientation": "v", "hovertemplate": "continent=Americas<br>year=2007<br>gdpPercap=%{x}<br>lifeExp=%{y}<extra></extra>" }, { "mode": "markers", "name": "Oceania", "type": "scatter", "xsrc": "opencv.korea:126:fc0903", "ysrc": "opencv.korea:126:e2aed6", "xaxis": "x", "yaxis": "y", "marker": { "color": "#FFA15A", "symbol": "circle" }, "showlegend": true, "legendgroup": "Oceania", "orientation": "v", "hovertemplate": "continent=Oceania<br>year=2007<br>gdpPercap=%{x}<br>lifeExp=%{y}<extra></extra>" } ], "name": "2007" } ], "layout": { "xaxis": { "range": [ 100, 100000 ], "title": { "text": "gdpPercap" }, "anchor": "y", "domain": [ 0.0, 1.0 ] }, "yaxis": { "range": [ 25, 90 ], "title": { "text": "lifeExp" }, "anchor": "x", "domain": [ 0.0, 1.0 ] }, "legend": { "title": { "text": "continent" }, "tracegroupgap": 0 }, "margin": { "t": 60 }, "sliders": [ { "x": 0.1, "y": 0, "len": 0.9, "pad": { "b": 10, "t": 60 }, "steps": [ { "args": [ [ "1952" ], { "mode": "immediate", "frame": { "redraw": false, "duration": 0 }, "transition": { "easing": "linear", "duration": 0 }, "fromcurrent": true } ], "label": "1952", "method": "animate" }, { "args": [ [ "1957" ], { "mode": "immediate", "frame": { "redraw": false, "duration": 0 }, "transition": { "easing": "linear", "duration": 0 }, "fromcurrent": true } ], "label": "1957", "method": "animate" }, { "args": [ [ "1962" ], { "mode": "immediate", "frame": { "redraw": false, "duration": 0 }, "transition": { "easing": "linear", "duration": 0 }, "fromcurrent": true } ], "label": "1962", "method": "animate" }, { "args": [ [ "1967" ], { "mode": "immediate", "frame": { "redraw": false, "duration": 0 }, "transition": { "easing": "linear", "duration": 0 }, "fromcurrent": true } ], "label": "1967", "method": "animate" }, { "args": [ [ "1972" ], { "mode": "immediate", "frame": { "redraw": false, "duration": 0 }, "transition": { "easing": "linear", "duration": 0 }, "fromcurrent": true } ], "label": "1972", "method": "animate" }, { "args": [ [ "1977" ], { "mode": "immediate", "frame": { "redraw": false, "duration": 0 }, "transition": { "easing": "linear", "duration": 0 }, "fromcurrent": true } ], "label": "1977", "method": "animate" }, { "args": [ [ "1982" ], { "mode": "immediate", "frame": { "redraw": false, "duration": 0 }, "transition": { "easing": "linear", "duration": 0 }, "fromcurrent": true } ], "label": "1982", "method": "animate" }, { "args": [ [ "1987" ], { "mode": "immediate", "frame": { "redraw": false, "duration": 0 }, "transition": { "easing": "linear", "duration": 0 }, "fromcurrent": true } ], "label": "1987", "method": "animate" }, { "args": [ [ "1992" ], { "mode": "immediate", "frame": { "redraw": false, "duration": 0 }, "transition": { "easing": "linear", "duration": 0 }, "fromcurrent": true } ], "label": "1992", "method": "animate" }, { "args": [ [ "1997" ], { "mode": "immediate", "frame": { "redraw": false, "duration": 0 }, "transition": { "easing": "linear", "duration": 0 }, "fromcurrent": true } ], "label": "1997", "method": "animate" }, { "args": [ [ "2002" ], { "mode": "immediate", "frame": { "redraw": false, "duration": 0 }, "transition": { "easing": "linear", "duration": 0 }, "fromcurrent": true } ], "label": "2002", "method": "animate" }, { "args": [ [ "2007" ], { "mode": "immediate", "frame": { "redraw": false, "duration": 0 }, "transition": { "easing": "linear", "duration": 0 }, "fromcurrent": true } ], "label": "2007", "method": "animate" } ], "active": 0, "xanchor": "left", "yanchor": "top", "currentvalue": { "prefix": "year=" } } ], "template": { "data": { "bar": [ { "type": "bar", "marker": { "line": { "color": "#E5ECF6", "width": 0.5 }, "pattern": { "size": 10, "fillmode": "overlay", "solidity": 0.2 } }, "error_x": { "color": "#2a3f5f" }, "error_y": { "color": "#2a3f5f" } } ], "pie": [ { "type": "pie", "automargin": true } ], "table": [ { "type": "table", "cells": { "fill": { "color": "#EBF0F8" }, "line": { "color": "white" } }, "header": { "fill": { "color": "#C8D4E3" }, "line": { "color": "white" } } } ], "carpet": [ { "type": "carpet", "aaxis": { "gridcolor": "white", "linecolor": "white", "endlinecolor": "#2a3f5f", "minorgridcolor": "white", "startlinecolor": "#2a3f5f" }, "baxis": { "gridcolor": "white", "linecolor": "white", "endlinecolor": "#2a3f5f", "minorgridcolor": "white", "startlinecolor": "#2a3f5f" } } ], "mesh3d": [ { "type": "mesh3d", "colorbar": { "ticks": "", "outlinewidth": 0 } } ], "contour": [ { "type": "contour", "colorbar": { "ticks": "", "outlinewidth": 0 }, "colorscale": [ [ 0.0, "#0d0887" ], [ 0.1111111111111111, "#46039f" ], [ 0.2222222222222222, "#7201a8" ], [ 0.3333333333333333, "#9c179e" ], [ 0.4444444444444444, "#bd3786" ], [ 0.5555555555555556, "#d8576b" ], [ 0.6666666666666666, "#ed7953" ], [ 0.7777777777777778, "#fb9f3a" ], [ 0.8888888888888888, "#fdca26" ], [ 1.0, "#f0f921" ] ] } ], "heatmap": [ { "type": "heatmap", "colorbar": { "ticks": "", "outlinewidth": 0 }, "colorscale": [ [ 0.0, "#0d0887" ], [ 0.1111111111111111, "#46039f" ], [ 0.2222222222222222, "#7201a8" ], [ 0.3333333333333333, "#9c179e" ], [ 0.4444444444444444, "#bd3786" ], [ 0.5555555555555556, "#d8576b" ], [ 0.6666666666666666, "#ed7953" ], [ 0.7777777777777778, "#fb9f3a" ], [ 0.8888888888888888, "#fdca26" ], [ 1.0, "#f0f921" ] ] } ], "scatter": [ { "type": "scatter", "fillpattern": { "size": 10, "fillmode": "overlay", "solidity": 0.2 } } ], "surface": [ { "type": "surface", "colorbar": { "ticks": "", "outlinewidth": 0 }, "colorscale": [ [ 0.0, "#0d0887" ], [ 0.1111111111111111, "#46039f" ], [ 0.2222222222222222, "#7201a8" ], [ 0.3333333333333333, "#9c179e" ], [ 0.4444444444444444, "#bd3786" ], [ 0.5555555555555556, "#d8576b" ], [ 0.6666666666666666, "#ed7953" ], [ 0.7777777777777778, "#fb9f3a" ], [ 0.8888888888888888, "#fdca26" ], [ 1.0, "#f0f921" ] ] } ], "barpolar": [ { "type": "barpolar", "marker": { "line": { "color": "#E5ECF6", "width": 0.5 }, "pattern": { "size": 10, "fillmode": "overlay", "solidity": 0.2 } } } ], "heatmapgl": [ { "type": "heatmapgl", "colorbar": { "ticks": "", "outlinewidth": 0 }, "colorscale": [ [ 0.0, "#0d0887" ], [ 0.1111111111111111, "#46039f" ], [ 0.2222222222222222, "#7201a8" ], [ 0.3333333333333333, "#9c179e" ], [ 0.4444444444444444, "#bd3786" ], [ 0.5555555555555556, "#d8576b" ], [ 0.6666666666666666, "#ed7953" ], [ 0.7777777777777778, "#fb9f3a" ], [ 0.8888888888888888, "#fdca26" ], [ 1.0, "#f0f921" ] ] } ], "histogram": [ { "type": "histogram", "marker": { "pattern": { "size": 10, "fillmode": "overlay", "solidity": 0.2 } } } ], "parcoords": [ { "line": { "colorbar": { "ticks": "", "outlinewidth": 0 } }, "type": "parcoords" } ], "scatter3d": [ { "line": { "colorbar": { "ticks": "", "outlinewidth": 0 } }, "type": "scatter3d", "marker": { "colorbar": { "ticks": "", "outlinewidth": 0 } } } ], "scattergl": [ { "type": "scattergl", "marker": { "colorbar": { "ticks": "", "outlinewidth": 0 } } } ], "choropleth": [ { "type": "choropleth", "colorbar": { "ticks": "", "outlinewidth": 0 } } ], "scattergeo": [ { "type": "scattergeo", "marker": { "colorbar": { "ticks": "", "outlinewidth": 0 } } } ], "histogram2d": [ { "type": "histogram2d", "colorbar": { "ticks": "", "outlinewidth": 0 }, "colorscale": [ [ 0.0, "#0d0887" ], [ 0.1111111111111111, "#46039f" ], [ 0.2222222222222222, "#7201a8" ], [ 0.3333333333333333, "#9c179e" ], [ 0.4444444444444444, "#bd3786" ], [ 0.5555555555555556, "#d8576b" ], [ 0.6666666666666666, "#ed7953" ], [ 0.7777777777777778, "#fb9f3a" ], [ 0.8888888888888888, "#fdca26" ], [ 1.0, "#f0f921" ] ] } ], "scatterpolar": [ { "type": "scatterpolar", "marker": { "colorbar": { "ticks": "", "outlinewidth": 0 } } } ], "contourcarpet": [ { "type": "contourcarpet", "colorbar": { "ticks": "", "outlinewidth": 0 } } ], "scattercarpet": [ { "type": "scattercarpet", "marker": { "colorbar": { "ticks": "", "outlinewidth": 0 } } } ], "scattermapbox": [ { "type": "scattermapbox", "marker": { "colorbar": { "ticks": "", "outlinewidth": 0 } } } ], "scatterpolargl": [ { "type": "scatterpolargl", "marker": { "colorbar": { "ticks": "", "outlinewidth": 0 } } } ], "scatterternary": [ { "type": "scatterternary", "marker": { "colorbar": { "ticks": "", "outlinewidth": 0 } } } ], "histogram2dcontour": [ { "type": "histogram2dcontour", "colorbar": { "ticks": "", "outlinewidth": 0 }, "colorscale": [ [ 0.0, "#0d0887" ], [ 0.1111111111111111, "#46039f" ], [ 0.2222222222222222, "#7201a8" ], [ 0.3333333333333333, "#9c179e" ], [ 0.4444444444444444, "#bd3786" ], [ 0.5555555555555556, "#d8576b" ], [ 0.6666666666666666, "#ed7953" ], [ 0.7777777777777778, "#fb9f3a" ], [ 0.8888888888888888, "#fdca26" ], [ 1.0, "#f0f921" ] ] } ] }, "layout": { "geo": { "bgcolor": "white", "showland": true, "lakecolor": "white", "landcolor": "#E5ECF6", "showlakes": true, "subunitcolor": "white" }, "font": { "color": "#2a3f5f" }, "polar": { "bgcolor": "#E5ECF6", "radialaxis": { "ticks": "", "gridcolor": "white", "linecolor": "white" }, "angularaxis": { "ticks": "", "gridcolor": "white", "linecolor": "white" } }, "scene": { "xaxis": { "ticks": "", "gridcolor": "white", "gridwidth": 2, "linecolor": "white", "zerolinecolor": "white", "showbackground": true, "backgroundcolor": "#E5ECF6" }, "yaxis": { "ticks": "", "gridcolor": "white", "gridwidth": 2, "linecolor": "white", "zerolinecolor": "white", "showbackground": true, "backgroundcolor": "#E5ECF6" }, "zaxis": { "ticks": "", "gridcolor": "white", "gridwidth": 2, "linecolor": "white", "zerolinecolor": "white", "showbackground": true, "backgroundcolor": "#E5ECF6" } }, "title": { "x": 0.05 }, "xaxis": { "ticks": "", "title": { "standoff": 15 }, "gridcolor": "white", "linecolor": "white", "automargin": true, "zerolinecolor": "white", "zerolinewidth": 2 }, "yaxis": { "ticks": "", "title": { "standoff": 15 }, "gridcolor": "white", "linecolor": "white", "automargin": true, "zerolinecolor": "white", "zerolinewidth": 2 }, "mapbox": { "style": "light" }, "ternary": { "aaxis": { "ticks": "", "gridcolor": "white", "linecolor": "white" }, "baxis": { "ticks": "", "gridcolor": "white", "linecolor": "white" }, "caxis": { "ticks": "", "gridcolor": "white", "linecolor": "white" }, "bgcolor": "#E5ECF6" }, "colorway": [ "#636efa", "#EF553B", "#00cc96", "#ab63fa", "#FFA15A", "#19d3f3", "#FF6692", "#B6E880", "#FF97FF", "#FECB52" ], "coloraxis": { "colorbar": { "ticks": "", "outlinewidth": 0 } }, "hovermode": "closest", "colorscale": { "diverging": [ [ 0, "#8e0152" ], [ 0.1, "#c51b7d" ], [ 0.2, "#de77ae" ], [ 0.3, "#f1b6da" ], [ 0.4, "#fde0ef" ], [ 0.5, "#f7f7f7" ], [ 0.6, "#e6f5d0" ], [ 0.7, "#b8e186" ], [ 0.8, "#7fbc41" ], [ 0.9, "#4d9221" ], [ 1, "#276419" ] ], "sequential": [ [ 0.0, "#0d0887" ], [ 0.1111111111111111, "#46039f" ], [ 0.2222222222222222, "#7201a8" ], [ 0.3333333333333333, "#9c179e" ], [ 0.4444444444444444, "#bd3786" ], [ 0.5555555555555556, "#d8576b" ], [ 0.6666666666666666, "#ed7953" ], [ 0.7777777777777778, "#fb9f3a" ], [ 0.8888888888888888, "#fdca26" ], [ 1.0, "#f0f921" ] ], "sequentialminus": [ [ 0.0, "#0d0887" ], [ 0.1111111111111111, "#46039f" ], [ 0.2222222222222222, "#7201a8" ], [ 0.3333333333333333, "#9c179e" ], [ 0.4444444444444444, "#bd3786" ], [ 0.5555555555555556, "#d8576b" ], [ 0.6666666666666666, "#ed7953" ], [ 0.7777777777777778, "#fb9f3a" ], [ 0.8888888888888888, "#fdca26" ], [ 1.0, "#f0f921" ] ] }, "hoverlabel": { "align": "left" }, "plot_bgcolor": "#E5ECF6", "paper_bgcolor": "white", "shapedefaults": { "line": { "color": "#2a3f5f" } }, "autotypenumbers": "strict", "annotationdefaults": { "arrowhead": 0, "arrowcolor": "#2a3f5f", "arrowwidth": 1 } } } } }, "height": null, "width": null, "user": { "profile_url": "https://chart-studio.plotly.com/~opencv.korea", "avatar_url": "https://storage.googleapis.com/plotly-prod-profiles/GPDKQ7OAFE318I3TRAFP4MVAXP7TZP.jpg", "background_url": "https://storage.googleapis.com/plotly-prod-profiles/bg-6.jpg", "bio": "", "nickname": "", "website": "", "stream_tokens": null, "feature_set_id": null, "csrf_token": null, "date_joined": "2022-03-16 13:01:08", "mapbox_access_tokens": null, "has_password": null, "username": "opencv.korea", "email": null, "is_active": null, "readonly": null, "is_dash_creator": null, "dash_created_count": null, "is_chart_creator": null, "charts_created_count": null } }, { "creation_time": "2025-09-10T10:31:17.491818Z", "comments": { "results": [], "count": 0 }, "parented": true, "embed_url": "https://chart-studio.plotly.com/~wl10tn10/5.embed", "fid": "wl10tn10:5", "filename": "Plot 5", "filetype": "plot", "img_url": "https://storage.googleapis.com/plotly-prod-images/wl10tn10/5/9_PJ0LSGG208I04326DYZ1AVIUVB3YQS.png", "image_urls": { "default": "https://storage.googleapis.com/plotly-prod-images/wl10tn10/5/2_BJ1NDSX8M4RVHSOZ9AD4RMKCS83ZXP.png", "block-thumb": "https://storage.googleapis.com/plotly-prod-images/wl10tn10/5/8_RWWDLOI4MT4CKH8Q0Z1MO9661HJ02P.png", "list-thumb": "https://storage.googleapis.com/plotly-prod-images/wl10tn10/5/9_PJ0LSGG208I04326DYZ1AVIUVB3YQS.png" }, "api_urls": { "files": "https://api.plotly.com/v2/files/wl10tn10:5", "plots": "https://api.plotly.com/v2/plots/wl10tn10:5", "parent": "https://api.plotly.com/v2/folders/home?user=wl10tn10" }, "owner": "wl10tn10", "parent": -1, "preview": "", "referencers": [], "references": [], "title": "", "views": 1, "web_url": "https://chart-studio.plotly.com/~wl10tn10/5/", "world_readable": true, "date_modified": "2025-09-10T10:31:17.503Z", "stars": { "results": [], "count": 0 }, "collaborators": { "results": [], "count": 0 }, "subfolder_count": null, "refresh_interval": null, "organize_view_url": "https://chart-studio.plotly.com/~wl10tn10/5/", "current_user_permission": "read", "is_theme": null, "is_template": false, "autosize": true, "caption": "", "figure": { "data": [ { "meta": { "columnNames": { "x": "x (m)", "y": "r (m)" } }, "mode": "lines", "type": "scatter", "xsrc": "wl10tn10:4:c8c293", "ysrc": "wl10tn10:4:538f01" } ], "frames": [], "layout": { "xaxis": { "type": "linear", "range": [ -0.5027720364949273, 1.2643678409601198 ], "autorange": true }, "yaxis": { "type": "linear", "range": [ 0.06816331567165945, 0.5690440360172812 ], "autorange": true }, "autosize": true, "template": { "data": { "bar": [ { "type": "bar", "marker": { "colorbar": { "ticks": "", "outlinewidth": 0 } } } ], "table": [ { "type": "table", "cells": { "fill": { "color": "#EBF0F8" }, "line": { "color": "white" } }, "header": { "fill": { "color": "#C8D4E3" }, "line": { "color": "white" } } } ], "carpet": [ { "type": "carpet", "aaxis": { "gridcolor": "#C8D4E3", "linecolor": "#C8D4E3", "endlinecolor": "#2a3f5f", "minorgridcolor": "#C8D4E3", "startlinecolor": "#2a3f5f" }, "baxis": { "gridcolor": "#C8D4E3", "linecolor": "#C8D4E3", "endlinecolor": "#2a3f5f", "minorgridcolor": "#C8D4E3", "startlinecolor": "#2a3f5f" } } ], "mesh3d": [ { "type": "mesh3d", "colorbar": { "ticks": "", "outlinewidth": 0 } } ], "contour": [ { "type": "contour", "colorbar": { "ticks": "", "outlinewidth": 0 }, "autocolorscale": true } ], "heatmap": [ { "type": "heatmap", "colorbar": { "ticks": "", "outlinewidth": 0 }, "autocolorscale": true } ], "scatter": [ { "type": "scatter", "marker": { "colorbar": { "ticks": "", "outlinewidth": 0 } } } ], "surface": [ { "type": "surface", "colorbar": { "ticks": "", "outlinewidth": 0 } } ], "heatmapgl": [ { "type": "heatmapgl", "colorbar": { "ticks": "", "outlinewidth": 0 } } ], "histogram": [ { "type": "histogram", "marker": { "colorbar": { "ticks": "", "outlinewidth": 0 } } } ], "parcoords": [ { "line": { "colorbar": { "ticks": "", "outlinewidth": 0 } }, "type": "parcoords" } ], "scatter3d": [ { "type": "scatter3d", "marker": { "colorbar": { "ticks": "", "outlinewidth": 0 } } } ], "scattergl": [ { "type": "scattergl", "marker": { "colorbar": { "ticks": "", "outlinewidth": 0 } } } ], "choropleth": [ { "type": "choropleth", "colorbar": { "ticks": "", "outlinewidth": 0 } } ], "scattergeo": [ { "type": "scattergeo", "marker": { "colorbar": { "ticks": "", "outlinewidth": 0 } } } ], "histogram2d": [ { "type": "histogram2d", "colorbar": { "ticks": "", "outlinewidth": 0 }, "autocolorscale": true } ], "scatterpolar": [ { "type": "scatterpolar", "marker": { "colorbar": { "ticks": "", "outlinewidth": 0 } } } ], "contourcarpet": [ { "type": "contourcarpet", "colorbar": { "ticks": "", "outlinewidth": 0 } } ], "scattercarpet": [ { "type": "scattercarpet", "marker": { "colorbar": { "ticks": "", "outlinewidth": 0 } } } ], "scattermapbox": [ { "type": "scattermapbox", "marker": { "colorbar": { "ticks": "", "outlinewidth": 0 } } } ], "scatterpolargl": [ { "type": "scatterpolargl", "marker": { "colorbar": { "ticks": "", "outlinewidth": 0 } } } ], "scatterternary": [ { "type": "scatterternary", "marker": { "colorbar": { "ticks": "", "outlinewidth": 0 } } } ], "histogram2dcontour": [ { "type": "histogram2dcontour", "colorbar": { "ticks": "", "outlinewidth": 0 }, "autocolorscale": true } ] }, "layout": { "geo": { "bgcolor": "white", "showland": true, "lakecolor": "white", "landcolor": "white", "showlakes": true, "subunitcolor": "#C8D4E3" }, "font": { "color": "#2a3f5f" }, "polar": { "bgcolor": "white", "radialaxis": { "ticks": "", "gridcolor": "#EBF0F8", "linecolor": "#EBF0F8" }, "angularaxis": { "ticks": "", "gridcolor": "#EBF0F8", "linecolor": "#EBF0F8" } }, "scene": { "xaxis": { "ticks": "", "gridcolor": "#DFE8F3", "gridwidth": 2, "linecolor": "#EBF0F8", "zerolinecolor": "#EBF0F8", "showbackground": true, "backgroundcolor": "white" }, "yaxis": { "ticks": "", "gridcolor": "#DFE8F3", "gridwidth": 2, "linecolor": "#EBF0F8", "zerolinecolor": "#EBF0F8", "showbackground": true, "backgroundcolor": "white" }, "zaxis": { "ticks": "", "gridcolor": "#DFE8F3", "gridwidth": 2, "linecolor": "#EBF0F8", "zerolinecolor": "#EBF0F8", "showbackground": true, "backgroundcolor": "white" } }, "title": { "x": 0.05 }, "xaxis": { "ticks": "", "gridcolor": "#EBF0F8", "linecolor": "#EBF0F8", "automargin": true, "zerolinecolor": "#EBF0F8", "zerolinewidth": 2 }, "yaxis": { "ticks": "", "gridcolor": "#EBF0F8", "linecolor": "#EBF0F8", "automargin": true, "zerolinecolor": "#EBF0F8", "zerolinewidth": 2 }, "ternary": { "aaxis": { "ticks": "", "gridcolor": "#DFE8F3", "linecolor": "#A2B1C6" }, "baxis": { "ticks": "", "gridcolor": "#DFE8F3", "linecolor": "#A2B1C6" }, "caxis": { "ticks": "", "gridcolor": "#DFE8F3", "linecolor": "#A2B1C6" }, "bgcolor": "white" }, "colorway": [ "#636efa", "#EF553B", "#00cc96", "#ab63fa", "#19d3f3", "#e763fa", "#fecb52", "#ffa15a", "#ff6692", "#b6e880" ], "hovermode": "closest", "colorscale": { "diverging": [ [ 0, "#8e0152" ], [ 0.1, "#c51b7d" ], [ 0.2, "#de77ae" ], [ 0.3, "#f1b6da" ], [ 0.4, "#fde0ef" ], [ 0.5, "#f7f7f7" ], [ 0.6, "#e6f5d0" ], [ 0.7, "#b8e186" ], [ 0.8, "#7fbc41" ], [ 0.9, "#4d9221" ], [ 1, "#276419" ] ], "sequential": [ [ 0, "#0508b8" ], [ 0.0893854748603352, "#1910d8" ], [ 0.1787709497206704, "#3c19f0" ], [ 0.2681564245810056, "#6b1cfb" ], [ 0.3575418994413408, "#981cfd" ], [ 0.44692737430167595, "#bf1cfd" ], [ 0.5363128491620112, "#dd2bfd" ], [ 0.6256983240223464, "#f246fe" ], [ 0.7150837988826816, "#fc67fd" ], [ 0.8044692737430168, "#fe88fc" ], [ 0.8938547486033519, "#fea5fd" ], [ 0.9832402234636871, "#febefe" ], [ 1, "#fec3fe" ] ], "sequentialminus": [ [ 0, "#0508b8" ], [ 0.0893854748603352, "#1910d8" ], [ 0.1787709497206704, "#3c19f0" ], [ 0.2681564245810056, "#6b1cfb" ], [ 0.3575418994413408, "#981cfd" ], [ 0.44692737430167595, "#bf1cfd" ], [ 0.5363128491620112, "#dd2bfd" ], [ 0.6256983240223464, "#f246fe" ], [ 0.7150837988826816, "#fc67fd" ], [ 0.8044692737430168, "#fe88fc" ], [ 0.8938547486033519, "#fea5fd" ], [ 0.9832402234636871, "#febefe" ], [ 1, "#fec3fe" ] ] }, "plot_bgcolor": "white", "paper_bgcolor": "white", "shapedefaults": { "line": { "width": 0 }, "opacity": 0.4, "fillcolor": "#506784" }, "annotationdefaults": { "arrowhead": 0, "arrowcolor": "#506784", "arrowwidth": 1 } }, "themeRef": "PLOTLY_WHITE" } } }, "height": null, "width": null, "user": { "profile_url": "https://chart-studio.plotly.com/~wl10tn10", "avatar_url": "https://storage.googleapis.com/plotly-prod-profiles/8.jpg", "background_url": "https://storage.googleapis.com/plotly-prod-profiles/bg-3.jpg", "bio": "", "nickname": "", "website": "", "stream_tokens": null, "feature_set_id": null, "csrf_token": null, "date_joined": "2025-09-10 01:32:15", "mapbox_access_tokens": null, "has_password": null, "username": "wl10tn10", "email": null, "is_active": null, "readonly": null, "is_dash_creator": null, "dash_created_count": null, "is_chart_creator": null, "charts_created_count": null } }, { "creation_time": "2025-09-10T10:26:32.920779Z", "comments": { "results": [], "count": 0 }, "parented": true, "embed_url": "https://chart-studio.plotly.com/~opencv.korea/125.embed", "fid": "opencv.korea:125", "filename": "test-chart-violin", "filetype": "plot", "img_url": "https://storage.googleapis.com/plotly-prod-images/opencv.korea/125/9_NI00YRBZ5KY9HN6F85XSV0CANSFDJU.png", "image_urls": { "default": "https://storage.googleapis.com/plotly-prod-images/opencv.korea/125/2_T74EMUEQ6EVQTLVHUH4I69YB66UJ7O.png", "block-thumb": "https://storage.googleapis.com/plotly-prod-images/opencv.korea/125/8_262YNHTO83DTVCCB2MI8P3T5S5LYJ9.png", "list-thumb": "https://storage.googleapis.com/plotly-prod-images/opencv.korea/125/9_NI00YRBZ5KY9HN6F85XSV0CANSFDJU.png" }, "api_urls": { "files": "https://api.plotly.com/v2/files/opencv.korea:125", "plots": "https://api.plotly.com/v2/plots/opencv.korea:125", "parent": "https://api.plotly.com/v2/folders/home?user=opencv.korea" }, "owner": "opencv.korea", "parent": -1, "preview": "", "referencers": [], "references": [], "title": "", "views": 225, "web_url": "https://chart-studio.plotly.com/~opencv.korea/125/", "world_readable": true, "date_modified": "2025-09-12T00:05:30.869Z", "stars": { "results": [], "count": 0 }, "collaborators": { "results": [], "count": 0 }, "subfolder_count": null, "refresh_interval": null, "organize_view_url": "https://chart-studio.plotly.com/~opencv.korea/125/", "current_user_permission": "read", "is_theme": null, "is_template": null, "autosize": true, "caption": "", "figure": { "data": [ { "y": { "bdata": "PQrXo3D9MEDXo3A9Cpc4QOF6FK5HoUFAKVyPwvWoLUApXI/C9agkQLgehetR+DBACtejcD1KNEAK16NwPYovQGZmZmZmpjNAH4XrUbgeLkBxPQrXo7A0QK5H4XoU7jBAFK5H4XqUJEBI4XoUrmdBQClcj8L1aDpAMzMzMzNzMECPwvUoXI8IQFK4HoXrETFAXI/C9SjcOkBI4XoUrkc5QPYoXI/CdS1ApHA9CtcjJEAK16NwPWpBQAAAAAAAABdAUrgehetRMEAAAAAAAMA2QDMzMzMzsyZAw/UoXI/CLkBmZmZmZiZGQOxRuB6FazZA7FG4HoXrNEAfhetRuJ4sQAAAAAAAAB1A9ihcj8K1OUCPwvUoXE8xQM3MzMzMTCVAXI/C9SjcKEAUrkfhehQ4QNejcD0K1ypA9ihcj8L1KEDNzMzMzMw9QArXo3A9Ci1Aw/UoXI/CJkCF61G4HkU0QNejcD0KVyZAhetRuB6FKEDD9Shcj0IyQIXrUbgeBSFAKVyPwvWoJEDNzMzMzEwsQFK4HoXrUSpAuB6F61F4MUDNzMzMzAw7QK5H4XoUbjBAMzMzMzOzIECkcD0K16MyQD0K16NwvSdAmpmZmZnZPUAAAAAAAAA5QEjhehSuxypA9ihcj8I1MEDD9Shcj4IxQK5H4XoULiVAw/UoXI9CJUAzMzMzMzMjQGZmZmZm5jRAZmZmZmYmMkCPwvUoXM8zQK5H4XoUjkVAAAAAAAAAKkB7FK5H4XopQAAAAAAAACpAZmZmZmZmMEC4HoXrUXgwQIXrUbgehSlACtejcD2KKkDsUbgehSs8QM3MzMzMzClApHA9CtcjPkDXo3A9CtcqQPYoXI/C9S9AhetRuB5FMECuR+F6FC4kQB+F61G4HjZACtejcD3qQUCuR+F6FC47QEjhehSuxzJA", "dtype": "f8" }, "x0": " ", "y0": " ", "box": { "visible": false }, "name": "Female", "type": "violin", "xaxis": "x", "yaxis": "y", "marker": { "color": "#636efa" }, "scalegroup": "True", "showlegend": true, "legendgroup": "Female", "offsetgroup": "Female", "orientation": "v", "hovertemplate": "sex=Female<br>total_bill=%{y}<extra></extra>", "alignmentgroup": "True" }, { "y": { "bdata": "rkfhehSuJEDD9ShcjwI1QK5H4XoUrjdACtejcD1KOUAK16NwPYohQOF6FK5H4TpAFK5H4XoULkCPwvUoXI8tQArXo3A9iiRA16NwPQrXLkCuR+F6FG4yQBSuR+F6lDVACtejcD1KMEBmZmZmZqY0QOxRuB6F6zFA9ihcj8K1Q0BSuB6F69EzQI/C9ShczzFAPQrXo3C9KkDhehSuR2EpQDMzMzMzszVAmpmZmZkZI0CamZmZmVkyQEjhehSuxzFAj8L1KFwPOECPwvUoXE8wQHE9CtejsDJAhetRuB5FP0AK16NwPQowQPYoXI/CdTFA4XoUrkfhK0Bcj8L1KFwjQGZmZmZmZj5ACtejcD1KMkB7FK5H4To2QDMzMzMzM0BAzczMzMyMPEAK16NwPQoyQBSuR+F6FClA4XoUrkfhI0CPwvUoXI85QD0K16NwfTNA4XoUrkcBQ0B7FK5H4XomQMP1KFyPIkhACtejcD1KNEAfhetRuJ4rQArXo3A9CiZACtejcD1KMkDXo3A9CpcxQBSuR+F6FDRAexSuR+E6NECF61G4HgUuQArXo3A9CihAhetRuB4FJUDsUbgehesxQDMzMzMzMztAw/UoXI/CNkAK16NwPUoxQHE9CtejcDNAKVyPwvWoMEDXo3A9CldAQPYoXI/C9S9Aj8L1KFwPKkBI4XoUrkcyQPYoXI/CtThAKVyPwvUoNUC4HoXrUfg8QD0K16NwfTZA9ihcj8IVREBI4XoUrkc7QI/C9ShcDyhAw/UoXI8CNUDsUbgehesoQLgehetRuC5APQrXo3B9NED2KFyPwjU5QD0K16NwPTJAAAAAAAAALEApXI/C9QhDQDMzMzMz8zdArkfhehTuPUDhehSuR2EnQIXrUbgehSxAZmZmZmbmL0AK16NwPQohQFK4HoXr0TZAFK5H4XoUM0AAAAAAAAAwQGZmZmZmJkFAuB6F61GYRECPwvUoXI8jQArXo3A9Ch5ApHA9CtcjLEDD9Shcj0IqQMP1KFyPQjFAzczMzMyMOECF61G4HsUzQPYoXI/CFUhAPQrXo3B9MEAAAAAAAIA1QFK4HoXrUSlAH4XrUbieK0CF61G4HoU4QMP1KFyPwjRA9ihcj8K1P0BI4XoUrmdJQB+F61G4ni9AAAAAAAAAHUCamZmZmdk/QFK4HoXr0TBAMzMzMzNzQECkcD0K1+MxQPYoXI/C9SxAcT0K16NQQUAzMzMzM1NBQBSuR+F6VDdAzczMzMysRkDsUbgehSs3QGZmZmZmRkRAcT0K16OwNED2KFyPwnU+QJqZmZmZGTdA4XoUrkdhL0BxPQrXo3A8QPYoXI/C9S5AFK5H4XqUMEA9CtejcD0eQK5H4XoUriRAhetRuB4FK0D2KFyPwrUyQEjhehSuhzRA16NwPQqXOkA9CtejcF1DQIXrUbgeRThAj8L1KFwPPkCkcD0K1+M5QArXo3A9KkhAZmZmZmYmPECuR+F6FC4nQPYoXI/C9R5AUrgehetRKEApXI/C9SghQNejcD0K1ypAMzMzMzNzNECPwvUoXI8qQMP1KFyPAjhA4XoUrkdhL0C4HoXrUTgnQArXo3A9iiVAj8L1KFwPL0CkcD0K1yMkQDMzMzMzMylACtejcD1qQEBI4XoUrgc9QOxRuB6FqzZAUrgehevRMUA=", "dtype": "f8" }, "x0": " ", "y0": " ", "box": { "visible": false }, "name": "Male", "type": "violin", "xaxis": "x", "yaxis": "y", "marker": { "color": "#EF553B" }, "scalegroup": "True", "showlegend": true, "legendgroup": "Male", "offsetgroup": "Male", "orientation": "v", "hovertemplate": "sex=Male<br>total_bill=%{y}<extra></extra>", "alignmentgroup": "True" } ], "layout": { "width": 600, "xaxis": { "anchor": "y", "domain": [ 0.0, 1.0 ] }, "yaxis": { "title": { "text": "total_bill" }, "anchor": "x", "domain": [ 0.0, 1.0 ] }, "height": 300, "legend": { "title": { "text": "sex" }, "tracegroupgap": 0 }, "margin": { "t": 60 }, "template": { "data": { "bar": [ { "type": "bar", "marker": { "line": { "color": "#E5ECF6", "width": 0.5 }, "pattern": { "size": 10, "fillmode": "overlay", "solidity": 0.2 } }, "error_x": { "color": "#2a3f5f" }, "error_y": { "color": "#2a3f5f" } } ], "pie": [ { "type": "pie", "automargin": true } ], "table": [ { "type": "table", "cells": { "fill": { "color": "#EBF0F8" }, "line": { "color": "white" } }, "header": { "fill": { "color": "#C8D4E3" }, "line": { "color": "white" } } } ], "carpet": [ { "type": "carpet", "aaxis": { "gridcolor": "white", "linecolor": "white", "endlinecolor": "#2a3f5f", "minorgridcolor": "white", "startlinecolor": "#2a3f5f" }, "baxis": { "gridcolor": "white", "linecolor": "white", "endlinecolor": "#2a3f5f", "minorgridcolor": "white", "startlinecolor": "#2a3f5f" } } ], "mesh3d": [ { "type": "mesh3d", "colorbar": { "ticks": "", "outlinewidth": 0 } } ], "contour": [ { "type": "contour", "colorbar": { "ticks": "", "outlinewidth": 0 }, "colorscale": [ [ 0.0, "#0d0887" ], [ 0.1111111111111111, "#46039f" ], [ 0.2222222222222222, "#7201a8" ], [ 0.3333333333333333, "#9c179e" ], [ 0.4444444444444444, "#bd3786" ], [ 0.5555555555555556, "#d8576b" ], [ 0.6666666666666666, "#ed7953" ], [ 0.7777777777777778, "#fb9f3a" ], [ 0.8888888888888888, "#fdca26" ], [ 1.0, "#f0f921" ] ] } ], "heatmap": [ { "type": "heatmap", "colorbar": { "ticks": "", "outlinewidth": 0 }, "colorscale": [ [ 0.0, "#0d0887" ], [ 0.1111111111111111, "#46039f" ], [ 0.2222222222222222, "#7201a8" ], [ 0.3333333333333333, "#9c179e" ], [ 0.4444444444444444, "#bd3786" ], [ 0.5555555555555556, "#d8576b" ], [ 0.6666666666666666, "#ed7953" ], [ 0.7777777777777778, "#fb9f3a" ], [ 0.8888888888888888, "#fdca26" ], [ 1.0, "#f0f921" ] ] } ], "scatter": [ { "type": "scatter", "fillpattern": { "size": 10, "fillmode": "overlay", "solidity": 0.2 } } ], "surface": [ { "type": "surface", "colorbar": { "ticks": "", "outlinewidth": 0 }, "colorscale": [ [ 0.0, "#0d0887" ], [ 0.1111111111111111, "#46039f" ], [ 0.2222222222222222, "#7201a8" ], [ 0.3333333333333333, "#9c179e" ], [ 0.4444444444444444, "#bd3786" ], [ 0.5555555555555556, "#d8576b" ], [ 0.6666666666666666, "#ed7953" ], [ 0.7777777777777778, "#fb9f3a" ], [ 0.8888888888888888, "#fdca26" ], [ 1.0, "#f0f921" ] ] } ], "barpolar": [ { "type": "barpolar", "marker": { "line": { "color": "#E5ECF6", "width": 0.5 }, "pattern": { "size": 10, "fillmode": "overlay", "solidity": 0.2 } } } ], "histogram": [ { "type": "histogram", "marker": { "pattern": { "size": 10, "fillmode": "overlay", "solidity": 0.2 } } } ], "parcoords": [ { "line": { "colorbar": { "ticks": "", "outlinewidth": 0 } }, "type": "parcoords" } ], "scatter3d": [ { "line": { "colorbar": { "ticks": "", "outlinewidth": 0 } }, "type": "scatter3d", "marker": { "colorbar": { "ticks": "", "outlinewidth": 0 } } } ], "scattergl": [ { "type": "scattergl", "marker": { "colorbar": { "ticks": "", "outlinewidth": 0 } } } ], "choropleth": [ { "type": "choropleth", "colorbar": { "ticks": "", "outlinewidth": 0 } } ], "scattergeo": [ { "type": "scattergeo", "marker": { "colorbar": { "ticks": "", "outlinewidth": 0 } } } ], "scattermap": [ { "type": "scattermap", "marker": { "colorbar": { "ticks": "", "outlinewidth": 0 } } } ], "histogram2d": [ { "type": "histogram2d", "colorbar": { "ticks": "", "outlinewidth": 0 }, "colorscale": [ [ 0.0, "#0d0887" ], [ 0.1111111111111111, "#46039f" ], [ 0.2222222222222222, "#7201a8" ], [ 0.3333333333333333, "#9c179e" ], [ 0.4444444444444444, "#bd3786" ], [ 0.5555555555555556, "#d8576b" ], [ 0.6666666666666666, "#ed7953" ], [ 0.7777777777777778, "#fb9f3a" ], [ 0.8888888888888888, "#fdca26" ], [ 1.0, "#f0f921" ] ] } ], "scatterpolar": [ { "type": "scatterpolar", "marker": { "colorbar": { "ticks": "", "outlinewidth": 0 } } } ], "contourcarpet": [ { "type": "contourcarpet", "colorbar": { "ticks": "", "outlinewidth": 0 } } ], "scattercarpet": [ { "type": "scattercarpet", "marker": { "colorbar": { "ticks": "", "outlinewidth": 0 } } } ], "scattermapbox": [ { "type": "scattermapbox", "marker": { "colorbar": { "ticks": "", "outlinewidth": 0 } } } ], "scatterpolargl": [ { "type": "scatterpolargl", "marker": { "colorbar": { "ticks": "", "outlinewidth": 0 } } } ], "scatterternary": [ { "type": "scatterternary", "marker": { "colorbar": { "ticks": "", "outlinewidth": 0 } } } ], "histogram2dcontour": [ { "type": "histogram2dcontour", "colorbar": { "ticks": "", "outlinewidth": 0 }, "colorscale": [ [ 0.0, "#0d0887" ], [ 0.1111111111111111, "#46039f" ], [ 0.2222222222222222, "#7201a8" ], [ 0.3333333333333333, "#9c179e" ], [ 0.4444444444444444, "#bd3786" ], [ 0.5555555555555556, "#d8576b" ], [ 0.6666666666666666, "#ed7953" ], [ 0.7777777777777778, "#fb9f3a" ], [ 0.8888888888888888, "#fdca26" ], [ 1.0, "#f0f921" ] ] } ] }, "layout": { "geo": { "bgcolor": "white", "showland": true, "lakecolor": "white", "landcolor": "#E5ECF6", "showlakes": true, "subunitcolor": "white" }, "font": { "color": "#2a3f5f" }, "polar": { "bgcolor": "#E5ECF6", "radialaxis": { "ticks": "", "gridcolor": "white", "linecolor": "white" }, "angularaxis": { "ticks": "", "gridcolor": "white", "linecolor": "white" } }, "scene": { "xaxis": { "ticks": "", "gridcolor": "white", "gridwidth": 2, "linecolor": "white", "zerolinecolor": "white", "showbackground": true, "backgroundcolor": "#E5ECF6" }, "yaxis": { "ticks": "", "gridcolor": "white", "gridwidth": 2, "linecolor": "white", "zerolinecolor": "white", "showbackground": true, "backgroundcolor": "#E5ECF6" }, "zaxis": { "ticks": "", "gridcolor": "white", "gridwidth": 2, "linecolor": "white", "zerolinecolor": "white", "showbackground": true, "backgroundcolor": "#E5ECF6" } }, "title": { "x": 0.05 }, "xaxis": { "ticks": "", "title": { "standoff": 15 }, "gridcolor": "white", "linecolor": "white", "automargin": true, "zerolinecolor": "white", "zerolinewidth": 2 }, "yaxis": { "ticks": "", "title": { "standoff": 15 }, "gridcolor": "white", "linecolor": "white", "automargin": true, "zerolinecolor": "white", "zerolinewidth": 2 }, "mapbox": { "style": "light" }, "ternary": { "aaxis": { "ticks": "", "gridcolor": "white", "linecolor": "white" }, "baxis": { "ticks": "", "gridcolor": "white", "linecolor": "white" }, "caxis": { "ticks": "", "gridcolor": "white", "linecolor": "white" }, "bgcolor": "#E5ECF6" }, "colorway": [ "#636efa", "#EF553B", "#00cc96", "#ab63fa", "#FFA15A", "#19d3f3", "#FF6692", "#B6E880", "#FF97FF", "#FECB52" ], "coloraxis": { "colorbar": { "ticks": "", "outlinewidth": 0 } }, "hovermode": "closest", "colorscale": { "diverging": [ [ 0, "#8e0152" ], [ 0.1, "#c51b7d" ], [ 0.2, "#de77ae" ], [ 0.3, "#f1b6da" ], [ 0.4, "#fde0ef" ], [ 0.5, "#f7f7f7" ], [ 0.6, "#e6f5d0" ], [ 0.7, "#b8e186" ], [ 0.8, "#7fbc41" ], [ 0.9, "#4d9221" ], [ 1, "#276419" ] ], "sequential": [ [ 0.0, "#0d0887" ], [ 0.1111111111111111, "#46039f" ], [ 0.2222222222222222, "#7201a8" ], [ 0.3333333333333333, "#9c179e" ], [ 0.4444444444444444, "#bd3786" ], [ 0.5555555555555556, "#d8576b" ], [ 0.6666666666666666, "#ed7953" ], [ 0.7777777777777778, "#fb9f3a" ], [ 0.8888888888888888, "#fdca26" ], [ 1.0, "#f0f921" ] ], "sequentialminus": [ [ 0.0, "#0d0887" ], [ 0.1111111111111111, "#46039f" ], [ 0.2222222222222222, "#7201a8" ], [ 0.3333333333333333, "#9c179e" ], [ 0.4444444444444444, "#bd3786" ], [ 0.5555555555555556, "#d8576b" ], [ 0.6666666666666666, "#ed7953" ], [ 0.7777777777777778, "#fb9f3a" ], [ 0.8888888888888888, "#fdca26" ], [ 1.0, "#f0f921" ] ] }, "hoverlabel": { "align": "left" }, "plot_bgcolor": "#E5ECF6", "paper_bgcolor": "white", "shapedefaults": { "line": { "color": "#2a3f5f" } }, "autotypenumbers": "strict", "annotationdefaults": { "arrowhead": 0, "arrowcolor": "#2a3f5f", "arrowwidth": 1 } } }, "violinmode": "group" } }, "height": 300, "width": 600, "user": { "profile_url": "https://chart-studio.plotly.com/~opencv.korea", "avatar_url": "https://storage.googleapis.com/plotly-prod-profiles/GPDKQ7OAFE318I3TRAFP4MVAXP7TZP.jpg", "background_url": "https://storage.googleapis.com/plotly-prod-profiles/bg-6.jpg", "bio": "", "nickname": "", "website": "", "stream_tokens": null, "feature_set_id": null, "csrf_token": null, "date_joined": "2022-03-16 13:01:08", "mapbox_access_tokens": null, "has_password": null, "username": "opencv.korea", "email": null, "is_active": null, "readonly": null, "is_dash_creator": null, "dash_created_count": null, "is_chart_creator": null, "charts_created_count": null } } ] }
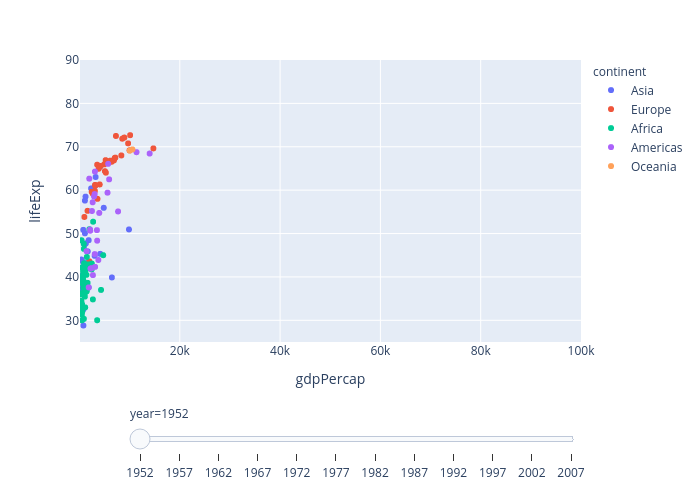