Plots List
Plots
This endpoint handles manipulation of Plotly plot files.
Reference
Authorization
Any user with or without a Plotly account may view public plots. For private plots, see authentication.
Actions
list
Listing all public plots can be done via a GET request to this endpoint.
By default, plots will be listed in order of date created. The order_by
query parameter is accepted at this endpoint. Currently, only ordering by
views is supported. It is possible to filter the plots by quality
with min_quality or max_quality as query parameter.
Example:
// GET https://api.plotly.com/v2/plots/ ---> 200

// GET https://api.plotly.com/v2/plots/?order_by=-views ---> 200

// GET https://api.plotly.com/v2/plots/?min_quality=5 ---> 200

// GET https://api.plotly.com/v2/plots/?max_quality=5 ---> 200
feed
Listing all handpicked feed plots can be done via a GET request to this endpoint. By default, plots will be listed in a random order.
Example:
// GET https://api.plotly.com/v2/plots/feed ---> 200
create
You can create new plot resources here. The only required field is 'figure'. Currently, the figure is restricted to only contain references to grid data. That is, this will fail if raw data arrays are passed in. To create and manipulate underlying grids for plots, see the grids endpoint.
Example:
// This fails because a figure field is required.
// POST https://api.plotly.com/v2/plots ---> 400 Bad Request
{}

// This fails because the figure has raw data
//POST https://api.plotly.com/v2/plots ---> 400 Bad Request
{
    "figure": {"data": [{"y": ['this', 'is', 'raw', 'data']}]}
}

// This succeeds because the figure has src keys, not raw data.
//POST https://api.plotly.com/v2/plots ---> 200 OK
{
    "figure": {"data": [{"ysrc": "sven:88:u8nd62"}]}
}
When creating a grid, you can optionally specify a source_fid to specify where a plot has come from:
- source_fid: the fid of a plot that was copied (and presumably edited) to produce this one
detail
There is a lot of meta information stored about plot files including filename, title, share_url, and content_url to name a few.
This information can only be reached with a GET to this endpoint.
Example:
// GET https://api.plotly.com/v2/plots/iheartgraphs:90
content
The contents of a plot can be downloaded via the content resource. The plot
content contains referenced grid/column data by default. If you wish to
return the raw grid/column data, the inline_data=true query must be included
in the request url. The Content-Type header will be appropriately set for the
response body.
Alternatively, you can set ?map_data=unreadable to append a mapping of
sources to data that belongs to grids which are unreadable for the
requestor. This is useful when you have read access to another users plot,
but that plot contains grid references which you don't have access to.
Examples:
// Returns referenced grid/column data
// GET https://api.plotly.com/v2/plots/iheartgraphs:90/content ---> 200 OK

// Returns full grid/column data
// GET https://api.plotly.com/v2/plots/iheartgraphs:90/content?inline_data=true ---> 200 OK

// Returns full grid/column data when requestor doesn't have permission
// to read the referenced grid.
// GET https://api.plotly.com/v2/plots/iheartgraphs:90/content?map_data=unreadable ---> 200 OK
GET /v2/plots/?cursor=cj0xJnA9MjAyNS0wOS0xNSsxOSUzQTAzJTNBNTAuNTY5MzY2JTJCMDAlM0EwMA%3D%3D&format=api
{ "next": "https://api.plotly.com/v2/plots/?cursor=cD0yMDI1LTA5LTE1KzE5JTNBMDQlM0ExMS4wNzc4NzIlMkIwMCUzQTAw&format=api", "previous": "https://api.plotly.com/v2/plots/?cursor=cj0xJnA9MjAyNS0wOS0xNSsxOSUzQTA3JTNBNTguMTU4MTc2JTJCMDAlM0EwMA%3D%3D&format=api", "results": [ { "creation_time": "2025-09-15T19:07:58.158176Z", "comments": { "results": [], "count": 0 }, "parented": true, "embed_url": "https://chart-studio.plotly.com/~kiran_bommapala/122.embed", "fid": "kiran_bommapala:122", "filename": "infracost-costs-1757963271", "filetype": "plot", "img_url": "https://storage.googleapis.com/plotly-prod-images/kiran_bommapala/122/9_3HEGFW4ZAV79O0410WCCM8Z4ZA6GD8.png", "image_urls": { "default": "https://storage.googleapis.com/plotly-prod-images/kiran_bommapala/122/2_7K92E46UDRZ7MC6NR63JFJNXQYUSL7.png", "block-thumb": "https://storage.googleapis.com/plotly-prod-images/kiran_bommapala/122/8_9XYN2N1R0YP9AAT8ED624MVZTY8Y8K.png", "list-thumb": "https://storage.googleapis.com/plotly-prod-images/kiran_bommapala/122/9_3HEGFW4ZAV79O0410WCCM8Z4ZA6GD8.png" }, "api_urls": { "files": "https://api.plotly.com/v2/files/kiran_bommapala:122", "plots": "https://api.plotly.com/v2/plots/kiran_bommapala:122", "parent": "https://api.plotly.com/v2/folders/home?user=kiran_bommapala" }, "owner": "kiran_bommapala", "parent": -1, "preview": "", "referencers": [], "references": [], "title": "", "views": 0, "web_url": "https://chart-studio.plotly.com/~kiran_bommapala/122/", "world_readable": true, "date_modified": "2025-09-15T19:07:58.169Z", "stars": { "results": [], "count": 0 }, "collaborators": { "results": [], "count": 0 }, "subfolder_count": null, "refresh_interval": null, "organize_view_url": "https://chart-studio.plotly.com/~kiran_bommapala/122/", "current_user_permission": "read", "is_theme": null, "is_template": null, "autosize": true, "caption": "", "figure": { "data": [ { "name": "aws_lb.hack_lb", "type": "bar", "xsrc": "kiran_bommapala:117:4e4ac9", "ysrc": "kiran_bommapala:117:845e76", "xaxis": "x", "yaxis": "y", "marker": { "color": "#636EFA", "pattern": { "shape": "" } }, "showlegend": true, "legendgroup": "aws_lb.hack_lb", "offsetgroup": "aws_lb.hack_lb", "orientation": "v", "textposition": "auto", "hovertemplate": "Resource=%{x}<br>Monthly Cost ($)=%{y}<extra></extra>", "alignmentgroup": "True" }, { "name": "aws_db_instance.hack_db", "type": "bar", "xsrc": "kiran_bommapala:117:8c136e", "ysrc": "kiran_bommapala:117:8dfb47", "xaxis": "x", "yaxis": "y", "marker": { "color": "#EF553B", "pattern": { "shape": "" } }, "showlegend": true, "legendgroup": "aws_db_instance.hack_db", "offsetgroup": "aws_db_instance.hack_db", "orientation": "v", "textposition": "auto", "hovertemplate": "Resource=%{x}<br>Monthly Cost ($)=%{y}<extra></extra>", "alignmentgroup": "True" }, { "name": "aws_instance.hack_vm", "type": "bar", "xsrc": "kiran_bommapala:117:2e8a9b", "ysrc": "kiran_bommapala:117:82ab4a", "xaxis": "x", "yaxis": "y", "marker": { "color": "#00CC96", "pattern": { "shape": "" } }, "showlegend": true, "legendgroup": "aws_instance.hack_vm", "offsetgroup": "aws_instance.hack_vm", "orientation": "v", "textposition": "auto", "hovertemplate": "Resource=%{x}<br>Monthly Cost ($)=%{y}<extra></extra>", "alignmentgroup": "True" }, { "name": "aws_instance.hack_vm2", "type": "bar", "xsrc": "kiran_bommapala:117:9d990f", "ysrc": "kiran_bommapala:117:538928", "xaxis": "x", "yaxis": "y", "marker": { "color": "#AB63FA", "pattern": { "shape": "" } }, "showlegend": true, "legendgroup": "aws_instance.hack_vm2", "offsetgroup": "aws_instance.hack_vm2", "orientation": "v", "textposition": "auto", "hovertemplate": "Resource=%{x}<br>Monthly Cost ($)=%{y}<extra></extra>", "alignmentgroup": "True" }, { "name": "aws_ebs_volume.hack_volume", "type": "bar", "xsrc": "kiran_bommapala:117:514fba", "ysrc": "kiran_bommapala:117:94bccb", "xaxis": "x", "yaxis": "y", "marker": { "color": "#FFA15A", "pattern": { "shape": "" } }, "showlegend": true, "legendgroup": "aws_ebs_volume.hack_volume", "offsetgroup": "aws_ebs_volume.hack_volume", "orientation": "v", "textposition": "auto", "hovertemplate": "Resource=%{x}<br>Monthly Cost ($)=%{y}<extra></extra>", "alignmentgroup": "True" } ], "layout": { "title": { "text": "Monthly Infracost Breakdown per Resource" }, "xaxis": { "title": { "text": "Resource" }, "anchor": "y", "domain": [ 0.0, 1.0 ], "tickangle": -45, "categoryarray": [ "aws_lb.hack_lb", "aws_db_instance.hack_db", "aws_instance.hack_vm", "aws_instance.hack_vm2", "aws_ebs_volume.hack_volume" ], "categoryorder": "array" }, "yaxis": { "title": { "text": "Monthly Cost ($)" }, "anchor": "x", "domain": [ 0.0, 1.0 ] }, "legend": { "title": { "text": "Resource" }, "tracegroupgap": 0 }, "barmode": "relative", "template": { "data": { "table": [ { "type": "table", "cells": { "fill": { "color": "#000038" }, "font": { "color": "#000037" }, "line": { "color": "#000039" } }, "header": { "fill": { "color": "#000040" }, "font": { "color": "#000036" }, "line": { "color": "#000039" } } } ], "icicle": [ { "type": "icicle", "textfont": { "color": "white" } } ], "sankey": [ { "type": "sankey", "textfont": { "color": "#000036" } } ], "contour": [ { "type": "contour", "colorscale": [ [ 0.0, "#000011" ], [ 0.1111111111111111, "#000012" ], [ 0.2222222222222222, "#000013" ], [ 0.3333333333333333, "#000014" ], [ 0.4444444444444444, "#000015" ], [ 0.5555555555555556, "#000016" ], [ 0.6666666666666666, "#000017" ], [ 0.7777777777777778, "#000018" ], [ 0.8888888888888888, "#000019" ], [ 1.0, "#000020" ] ] } ], "heatmap": [ { "type": "heatmap", "colorscale": [ [ 0.0, "#000011" ], [ 0.1111111111111111, "#000012" ], [ 0.2222222222222222, "#000013" ], [ 0.3333333333333333, "#000014" ], [ 0.4444444444444444, "#000015" ], [ 0.5555555555555556, "#000016" ], [ 0.6666666666666666, "#000017" ], [ 0.7777777777777778, "#000018" ], [ 0.8888888888888888, "#000019" ], [ 1.0, "#000020" ] ] } ], "scatter": [ { "type": "scatter", "marker": { "line": { "width": 0 } } } ], "waterfall": [ { "type": "waterfall", "totals": { "marker": { "color": "#000034" } }, "connector": { "line": { "color": "#000036", "width": 2 } }, "decreasing": { "marker": { "color": "#000033" } }, "increasing": { "marker": { "color": "#000032" } } } ], "candlestick": [ { "type": "candlestick", "decreasing": { "line": { "color": "#000033" } }, "increasing": { "line": { "color": "#000032" } } } ], "histogram2d": [ { "type": "histogram2d", "colorscale": [ [ 0.0, "#000011" ], [ 0.1111111111111111, "#000012" ], [ 0.2222222222222222, "#000013" ], [ 0.3333333333333333, "#000014" ], [ 0.4444444444444444, "#000015" ], [ 0.5555555555555556, "#000016" ], [ 0.6666666666666666, "#000017" ], [ 0.7777777777777778, "#000018" ], [ 0.8888888888888888, "#000019" ], [ 1.0, "#000020" ] ] } ], "contourcarpet": [ { "type": "contourcarpet", "colorscale": [ [ 0.0, "#000011" ], [ 0.1111111111111111, "#000012" ], [ 0.2222222222222222, "#000013" ], [ 0.3333333333333333, "#000014" ], [ 0.4444444444444444, "#000015" ], [ 0.5555555555555556, "#000016" ], [ 0.6666666666666666, "#000017" ], [ 0.7777777777777778, "#000018" ], [ 0.8888888888888888, "#000019" ], [ 1.0, "#000020" ] ] } ] }, "layout": { "colorway": [ "#000001", "#000002", "#000003", "#000004", "#000005", "#000006", "#000007", "#000008", "#000009", "#000010" ], "coloraxis": { "colorscale": [ [ 0.0, "#000011" ], [ 0.1111111111111111, "#000012" ], [ 0.2222222222222222, "#000013" ], [ 0.3333333333333333, "#000014" ], [ 0.4444444444444444, "#000015" ], [ 0.5555555555555556, "#000016" ], [ 0.6666666666666666, "#000017" ], [ 0.7777777777777778, "#000018" ], [ 0.8888888888888888, "#000019" ], [ 1.0, "#000020" ] ] }, "colorscale": { "diverging": [ [ 0.0, "#000021" ], [ 0.1, "#000022" ], [ 0.2, "#000023" ], [ 0.3, "#000024" ], [ 0.4, "#000025" ], [ 0.5, "#000026" ], [ 0.6, "#000027" ], [ 0.7, "#000028" ], [ 0.8, "#000029" ], [ 0.9, "#000030" ], [ 1.0, "#000031" ] ], "sequential": [ [ 0.0, "#000011" ], [ 0.1111111111111111, "#000012" ], [ 0.2222222222222222, "#000013" ], [ 0.3333333333333333, "#000014" ], [ 0.4444444444444444, "#000015" ], [ 0.5555555555555556, "#000016" ], [ 0.6666666666666666, "#000017" ], [ 0.7777777777777778, "#000018" ], [ 0.8888888888888888, "#000019" ], [ 1.0, "#000020" ] ], "sequentialminus": [ [ 0.0, "#000011" ], [ 0.1111111111111111, "#000012" ], [ 0.2222222222222222, "#000013" ], [ 0.3333333333333333, "#000014" ], [ 0.4444444444444444, "#000015" ], [ 0.5555555555555556, "#000016" ], [ 0.6666666666666666, "#000017" ], [ 0.7777777777777778, "#000018" ], [ 0.8888888888888888, "#000019" ], [ 1.0, "#000020" ] ] } } }, "showlegend": true } }, "height": null, "width": null, "user": { "profile_url": "https://chart-studio.plotly.com/~kiran_bommapala", "avatar_url": "https://storage.googleapis.com/plotly-prod-profiles/97.jpg", "background_url": "https://storage.googleapis.com/plotly-prod-profiles/bg-12.jpg", "bio": "", "nickname": "", "website": "", "stream_tokens": null, "feature_set_id": null, "csrf_token": null, "date_joined": "2025-09-14 06:32:42", "mapbox_access_tokens": null, "has_password": null, "username": "kiran_bommapala", "email": null, "is_active": null, "readonly": null, "is_dash_creator": null, "dash_created_count": null, "is_chart_creator": null, "charts_created_count": null } }, { "creation_time": "2025-09-15T19:07:57.828365Z", "comments": { "results": [], "count": 0 }, "parented": true, "embed_url": "https://chart-studio.plotly.com/~kiran_bommapala/121.embed", "fid": "kiran_bommapala:121", "filename": "infracost-costs-1757963270", "filetype": "plot", "img_url": "https://storage.googleapis.com/plotly-prod-images/kiran_bommapala/121/9_9NKFAIEP6SNDN0WFTMDIQ4WBBOAZBT.png", "image_urls": { "default": "https://storage.googleapis.com/plotly-prod-images/kiran_bommapala/121/2_ZV9ACI6TH3258KRA3SPFTDWYSE44ZY.png", "block-thumb": "https://storage.googleapis.com/plotly-prod-images/kiran_bommapala/121/8_M1GI89U8OWN4LF4IPH2F9ZV5004PYR.png", "list-thumb": "https://storage.googleapis.com/plotly-prod-images/kiran_bommapala/121/9_9NKFAIEP6SNDN0WFTMDIQ4WBBOAZBT.png" }, "api_urls": { "files": "https://api.plotly.com/v2/files/kiran_bommapala:121", "plots": "https://api.plotly.com/v2/plots/kiran_bommapala:121", "parent": "https://api.plotly.com/v2/folders/home?user=kiran_bommapala" }, "owner": "kiran_bommapala", "parent": -1, "preview": "", "referencers": [], "references": [], "title": "", "views": 0, "web_url": "https://chart-studio.plotly.com/~kiran_bommapala/121/", "world_readable": true, "date_modified": "2025-09-15T19:07:57.840Z", "stars": { "results": [], "count": 0 }, "collaborators": { "results": [], "count": 0 }, "subfolder_count": null, "refresh_interval": null, "organize_view_url": "https://chart-studio.plotly.com/~kiran_bommapala/121/", "current_user_permission": "read", "is_theme": null, "is_template": null, "autosize": true, "caption": "", "figure": { "data": [ { "name": "aws_lb.hack_lb", "type": "bar", "xsrc": "kiran_bommapala:116:cccad5", "ysrc": "kiran_bommapala:116:dbd62d", "xaxis": "x", "yaxis": "y", "marker": { "color": "#636EFA", "pattern": { "shape": "" } }, "showlegend": true, "legendgroup": "aws_lb.hack_lb", "offsetgroup": "aws_lb.hack_lb", "orientation": "v", "textposition": "auto", "hovertemplate": "Resource=%{x}<br>Monthly Cost ($)=%{y}<extra></extra>", "alignmentgroup": "True" }, { "name": "aws_db_instance.hack_db", "type": "bar", "xsrc": "kiran_bommapala:116:86dafb", "ysrc": "kiran_bommapala:116:5eb545", "xaxis": "x", "yaxis": "y", "marker": { "color": "#EF553B", "pattern": { "shape": "" } }, "showlegend": true, "legendgroup": "aws_db_instance.hack_db", "offsetgroup": "aws_db_instance.hack_db", "orientation": "v", "textposition": "auto", "hovertemplate": "Resource=%{x}<br>Monthly Cost ($)=%{y}<extra></extra>", "alignmentgroup": "True" }, { "name": "aws_instance.hack_vm", "type": "bar", "xsrc": "kiran_bommapala:116:46bd25", "ysrc": "kiran_bommapala:116:508c78", "xaxis": "x", "yaxis": "y", "marker": { "color": "#00CC96", "pattern": { "shape": "" } }, "showlegend": true, "legendgroup": "aws_instance.hack_vm", "offsetgroup": "aws_instance.hack_vm", "orientation": "v", "textposition": "auto", "hovertemplate": "Resource=%{x}<br>Monthly Cost ($)=%{y}<extra></extra>", "alignmentgroup": "True" }, { "name": "aws_instance.hack_vm2", "type": "bar", "xsrc": "kiran_bommapala:116:0be34f", "ysrc": "kiran_bommapala:116:5227d1", "xaxis": "x", "yaxis": "y", "marker": { "color": "#AB63FA", "pattern": { "shape": "" } }, "showlegend": true, "legendgroup": "aws_instance.hack_vm2", "offsetgroup": "aws_instance.hack_vm2", "orientation": "v", "textposition": "auto", "hovertemplate": "Resource=%{x}<br>Monthly Cost ($)=%{y}<extra></extra>", "alignmentgroup": "True" }, { "name": "aws_ebs_volume.hack_volume", "type": "bar", "xsrc": "kiran_bommapala:116:bba444", "ysrc": "kiran_bommapala:116:85a38d", "xaxis": "x", "yaxis": "y", "marker": { "color": "#FFA15A", "pattern": { "shape": "" } }, "showlegend": true, "legendgroup": "aws_ebs_volume.hack_volume", "offsetgroup": "aws_ebs_volume.hack_volume", "orientation": "v", "textposition": "auto", "hovertemplate": "Resource=%{x}<br>Monthly Cost ($)=%{y}<extra></extra>", "alignmentgroup": "True" } ], "layout": { "title": { "text": "Monthly Infracost Breakdown per Resource" }, "xaxis": { "title": { "text": "Resource" }, "anchor": "y", "domain": [ 0.0, 1.0 ], "tickangle": -45, "categoryarray": [ "aws_lb.hack_lb", "aws_db_instance.hack_db", "aws_instance.hack_vm", "aws_instance.hack_vm2", "aws_ebs_volume.hack_volume" ], "categoryorder": "array" }, "yaxis": { "title": { "text": "Monthly Cost ($)" }, "anchor": "x", "domain": [ 0.0, 1.0 ] }, "legend": { "title": { "text": "Resource" }, "tracegroupgap": 0 }, "barmode": "relative", "template": { "data": { "table": [ { "type": "table", "cells": { "fill": { "color": "#000038" }, "font": { "color": "#000037" }, "line": { "color": "#000039" } }, "header": { "fill": { "color": "#000040" }, "font": { "color": "#000036" }, "line": { "color": "#000039" } } } ], "icicle": [ { "type": "icicle", "textfont": { "color": "white" } } ], "sankey": [ { "type": "sankey", "textfont": { "color": "#000036" } } ], "contour": [ { "type": "contour", "colorscale": [ [ 0.0, "#000011" ], [ 0.1111111111111111, "#000012" ], [ 0.2222222222222222, "#000013" ], [ 0.3333333333333333, "#000014" ], [ 0.4444444444444444, "#000015" ], [ 0.5555555555555556, "#000016" ], [ 0.6666666666666666, "#000017" ], [ 0.7777777777777778, "#000018" ], [ 0.8888888888888888, "#000019" ], [ 1.0, "#000020" ] ] } ], "heatmap": [ { "type": "heatmap", "colorscale": [ [ 0.0, "#000011" ], [ 0.1111111111111111, "#000012" ], [ 0.2222222222222222, "#000013" ], [ 0.3333333333333333, "#000014" ], [ 0.4444444444444444, "#000015" ], [ 0.5555555555555556, "#000016" ], [ 0.6666666666666666, "#000017" ], [ 0.7777777777777778, "#000018" ], [ 0.8888888888888888, "#000019" ], [ 1.0, "#000020" ] ] } ], "scatter": [ { "type": "scatter", "marker": { "line": { "width": 0 } } } ], "waterfall": [ { "type": "waterfall", "totals": { "marker": { "color": "#000034" } }, "connector": { "line": { "color": "#000036", "width": 2 } }, "decreasing": { "marker": { "color": "#000033" } }, "increasing": { "marker": { "color": "#000032" } } } ], "candlestick": [ { "type": "candlestick", "decreasing": { "line": { "color": "#000033" } }, "increasing": { "line": { "color": "#000032" } } } ], "histogram2d": [ { "type": "histogram2d", "colorscale": [ [ 0.0, "#000011" ], [ 0.1111111111111111, "#000012" ], [ 0.2222222222222222, "#000013" ], [ 0.3333333333333333, "#000014" ], [ 0.4444444444444444, "#000015" ], [ 0.5555555555555556, "#000016" ], [ 0.6666666666666666, "#000017" ], [ 0.7777777777777778, "#000018" ], [ 0.8888888888888888, "#000019" ], [ 1.0, "#000020" ] ] } ], "contourcarpet": [ { "type": "contourcarpet", "colorscale": [ [ 0.0, "#000011" ], [ 0.1111111111111111, "#000012" ], [ 0.2222222222222222, "#000013" ], [ 0.3333333333333333, "#000014" ], [ 0.4444444444444444, "#000015" ], [ 0.5555555555555556, "#000016" ], [ 0.6666666666666666, "#000017" ], [ 0.7777777777777778, "#000018" ], [ 0.8888888888888888, "#000019" ], [ 1.0, "#000020" ] ] } ] }, "layout": { "colorway": [ "#000001", "#000002", "#000003", "#000004", "#000005", "#000006", "#000007", "#000008", "#000009", "#000010" ], "coloraxis": { "colorscale": [ [ 0.0, "#000011" ], [ 0.1111111111111111, "#000012" ], [ 0.2222222222222222, "#000013" ], [ 0.3333333333333333, "#000014" ], [ 0.4444444444444444, "#000015" ], [ 0.5555555555555556, "#000016" ], [ 0.6666666666666666, "#000017" ], [ 0.7777777777777778, "#000018" ], [ 0.8888888888888888, "#000019" ], [ 1.0, "#000020" ] ] }, "colorscale": { "diverging": [ [ 0.0, "#000021" ], [ 0.1, "#000022" ], [ 0.2, "#000023" ], [ 0.3, "#000024" ], [ 0.4, "#000025" ], [ 0.5, "#000026" ], [ 0.6, "#000027" ], [ 0.7, "#000028" ], [ 0.8, "#000029" ], [ 0.9, "#000030" ], [ 1.0, "#000031" ] ], "sequential": [ [ 0.0, "#000011" ], [ 0.1111111111111111, "#000012" ], [ 0.2222222222222222, "#000013" ], [ 0.3333333333333333, "#000014" ], [ 0.4444444444444444, "#000015" ], [ 0.5555555555555556, "#000016" ], [ 0.6666666666666666, "#000017" ], [ 0.7777777777777778, "#000018" ], [ 0.8888888888888888, "#000019" ], [ 1.0, "#000020" ] ], "sequentialminus": [ [ 0.0, "#000011" ], [ 0.1111111111111111, "#000012" ], [ 0.2222222222222222, "#000013" ], [ 0.3333333333333333, "#000014" ], [ 0.4444444444444444, "#000015" ], [ 0.5555555555555556, "#000016" ], [ 0.6666666666666666, "#000017" ], [ 0.7777777777777778, "#000018" ], [ 0.8888888888888888, "#000019" ], [ 1.0, "#000020" ] ] } } }, "showlegend": true } }, "height": null, "width": null, "user": { "profile_url": "https://chart-studio.plotly.com/~kiran_bommapala", "avatar_url": "https://storage.googleapis.com/plotly-prod-profiles/97.jpg", "background_url": "https://storage.googleapis.com/plotly-prod-profiles/bg-12.jpg", "bio": "", "nickname": "", "website": "", "stream_tokens": null, "feature_set_id": null, "csrf_token": null, "date_joined": "2025-09-14 06:32:42", "mapbox_access_tokens": null, "has_password": null, "username": "kiran_bommapala", "email": null, "is_active": null, "readonly": null, "is_dash_creator": null, "dash_created_count": null, "is_chart_creator": null, "charts_created_count": null } }, { "creation_time": "2025-09-15T19:07:55.486544Z", "comments": { "results": [], "count": 0 }, "parented": true, "embed_url": "https://chart-studio.plotly.com/~kiran_bommapala/119.embed", "fid": "kiran_bommapala:119", "filename": "infracost-costs-1757963268", "filetype": "plot", "img_url": "https://storage.googleapis.com/plotly-prod-images/kiran_bommapala/119/9_GI21SMCLIS72TMEE1UXNWC2JI2P7E3.png", "image_urls": { "default": "https://storage.googleapis.com/plotly-prod-images/kiran_bommapala/119/2_OUD601LU4TQISOBURFGW7HSFQSIXRD.png", "block-thumb": "https://storage.googleapis.com/plotly-prod-images/kiran_bommapala/119/8_78QGUH9Z5BELUN4WG3SUCC6F9TKNRP.png", "list-thumb": "https://storage.googleapis.com/plotly-prod-images/kiran_bommapala/119/9_GI21SMCLIS72TMEE1UXNWC2JI2P7E3.png" }, "api_urls": { "files": "https://api.plotly.com/v2/files/kiran_bommapala:119", "plots": "https://api.plotly.com/v2/plots/kiran_bommapala:119", "parent": "https://api.plotly.com/v2/folders/home?user=kiran_bommapala" }, "owner": "kiran_bommapala", "parent": -1, "preview": "", "referencers": [], "references": [], "title": "", "views": 0, "web_url": "https://chart-studio.plotly.com/~kiran_bommapala/119/", "world_readable": true, "date_modified": "2025-09-15T19:07:55.497Z", "stars": { "results": [], "count": 0 }, "collaborators": { "results": [], "count": 0 }, "subfolder_count": null, "refresh_interval": null, "organize_view_url": "https://chart-studio.plotly.com/~kiran_bommapala/119/", "current_user_permission": "read", "is_theme": null, "is_template": null, "autosize": true, "caption": "", "figure": { "data": [ { "name": "aws_lb.hack_lb", "type": "bar", "xsrc": "kiran_bommapala:113:47fa2e", "ysrc": "kiran_bommapala:113:c45384", "xaxis": "x", "yaxis": "y", "marker": { "color": "#636EFA", "pattern": { "shape": "" } }, "showlegend": true, "legendgroup": "aws_lb.hack_lb", "offsetgroup": "aws_lb.hack_lb", "orientation": "v", "textposition": "auto", "hovertemplate": "Resource=%{x}<br>Monthly Cost ($)=%{y}<extra></extra>", "alignmentgroup": "True" }, { "name": "aws_db_instance.hack_db", "type": "bar", "xsrc": "kiran_bommapala:113:517ac3", "ysrc": "kiran_bommapala:113:170f77", "xaxis": "x", "yaxis": "y", "marker": { "color": "#EF553B", "pattern": { "shape": "" } }, "showlegend": true, "legendgroup": "aws_db_instance.hack_db", "offsetgroup": "aws_db_instance.hack_db", "orientation": "v", "textposition": "auto", "hovertemplate": "Resource=%{x}<br>Monthly Cost ($)=%{y}<extra></extra>", "alignmentgroup": "True" }, { "name": "aws_instance.hack_vm", "type": "bar", "xsrc": "kiran_bommapala:113:ff5cb7", "ysrc": "kiran_bommapala:113:0c7444", "xaxis": "x", "yaxis": "y", "marker": { "color": "#00CC96", "pattern": { "shape": "" } }, "showlegend": true, "legendgroup": "aws_instance.hack_vm", "offsetgroup": "aws_instance.hack_vm", "orientation": "v", "textposition": "auto", "hovertemplate": "Resource=%{x}<br>Monthly Cost ($)=%{y}<extra></extra>", "alignmentgroup": "True" }, { "name": "aws_instance.hack_vm2", "type": "bar", "xsrc": "kiran_bommapala:113:e1d6e4", "ysrc": "kiran_bommapala:113:039ea5", "xaxis": "x", "yaxis": "y", "marker": { "color": "#AB63FA", "pattern": { "shape": "" } }, "showlegend": true, "legendgroup": "aws_instance.hack_vm2", "offsetgroup": "aws_instance.hack_vm2", "orientation": "v", "textposition": "auto", "hovertemplate": "Resource=%{x}<br>Monthly Cost ($)=%{y}<extra></extra>", "alignmentgroup": "True" }, { "name": "aws_ebs_volume.hack_volume", "type": "bar", "xsrc": "kiran_bommapala:113:0e9cb5", "ysrc": "kiran_bommapala:113:418426", "xaxis": "x", "yaxis": "y", "marker": { "color": "#FFA15A", "pattern": { "shape": "" } }, "showlegend": true, "legendgroup": "aws_ebs_volume.hack_volume", "offsetgroup": "aws_ebs_volume.hack_volume", "orientation": "v", "textposition": "auto", "hovertemplate": "Resource=%{x}<br>Monthly Cost ($)=%{y}<extra></extra>", "alignmentgroup": "True" } ], "layout": { "title": { "text": "Monthly Infracost Breakdown per Resource" }, "xaxis": { "title": { "text": "Resource" }, "anchor": "y", "domain": [ 0.0, 1.0 ], "tickangle": -45, "categoryarray": [ "aws_lb.hack_lb", "aws_db_instance.hack_db", "aws_instance.hack_vm", "aws_instance.hack_vm2", "aws_ebs_volume.hack_volume" ], "categoryorder": "array" }, "yaxis": { "title": { "text": "Monthly Cost ($)" }, "anchor": "x", "domain": [ 0.0, 1.0 ] }, "legend": { "title": { "text": "Resource" }, "tracegroupgap": 0 }, "barmode": "relative", "template": { "data": { "table": [ { "type": "table", "cells": { "fill": { "color": "#000038" }, "font": { "color": "#000037" }, "line": { "color": "#000039" } }, "header": { "fill": { "color": "#000040" }, "font": { "color": "#000036" }, "line": { "color": "#000039" } } } ], "icicle": [ { "type": "icicle", "textfont": { "color": "white" } } ], "sankey": [ { "type": "sankey", "textfont": { "color": "#000036" } } ], "contour": [ { "type": "contour", "colorscale": [ [ 0.0, "#000011" ], [ 0.1111111111111111, "#000012" ], [ 0.2222222222222222, "#000013" ], [ 0.3333333333333333, "#000014" ], [ 0.4444444444444444, "#000015" ], [ 0.5555555555555556, "#000016" ], [ 0.6666666666666666, "#000017" ], [ 0.7777777777777778, "#000018" ], [ 0.8888888888888888, "#000019" ], [ 1.0, "#000020" ] ] } ], "heatmap": [ { "type": "heatmap", "colorscale": [ [ 0.0, "#000011" ], [ 0.1111111111111111, "#000012" ], [ 0.2222222222222222, "#000013" ], [ 0.3333333333333333, "#000014" ], [ 0.4444444444444444, "#000015" ], [ 0.5555555555555556, "#000016" ], [ 0.6666666666666666, "#000017" ], [ 0.7777777777777778, "#000018" ], [ 0.8888888888888888, "#000019" ], [ 1.0, "#000020" ] ] } ], "scatter": [ { "type": "scatter", "marker": { "line": { "width": 0 } } } ], "waterfall": [ { "type": "waterfall", "totals": { "marker": { "color": "#000034" } }, "connector": { "line": { "color": "#000036", "width": 2 } }, "decreasing": { "marker": { "color": "#000033" } }, "increasing": { "marker": { "color": "#000032" } } } ], "candlestick": [ { "type": "candlestick", "decreasing": { "line": { "color": "#000033" } }, "increasing": { "line": { "color": "#000032" } } } ], "histogram2d": [ { "type": "histogram2d", "colorscale": [ [ 0.0, "#000011" ], [ 0.1111111111111111, "#000012" ], [ 0.2222222222222222, "#000013" ], [ 0.3333333333333333, "#000014" ], [ 0.4444444444444444, "#000015" ], [ 0.5555555555555556, "#000016" ], [ 0.6666666666666666, "#000017" ], [ 0.7777777777777778, "#000018" ], [ 0.8888888888888888, "#000019" ], [ 1.0, "#000020" ] ] } ], "contourcarpet": [ { "type": "contourcarpet", "colorscale": [ [ 0.0, "#000011" ], [ 0.1111111111111111, "#000012" ], [ 0.2222222222222222, "#000013" ], [ 0.3333333333333333, "#000014" ], [ 0.4444444444444444, "#000015" ], [ 0.5555555555555556, "#000016" ], [ 0.6666666666666666, "#000017" ], [ 0.7777777777777778, "#000018" ], [ 0.8888888888888888, "#000019" ], [ 1.0, "#000020" ] ] } ] }, "layout": { "colorway": [ "#000001", "#000002", "#000003", "#000004", "#000005", "#000006", "#000007", "#000008", "#000009", "#000010" ], "coloraxis": { "colorscale": [ [ 0.0, "#000011" ], [ 0.1111111111111111, "#000012" ], [ 0.2222222222222222, "#000013" ], [ 0.3333333333333333, "#000014" ], [ 0.4444444444444444, "#000015" ], [ 0.5555555555555556, "#000016" ], [ 0.6666666666666666, "#000017" ], [ 0.7777777777777778, "#000018" ], [ 0.8888888888888888, "#000019" ], [ 1.0, "#000020" ] ] }, "colorscale": { "diverging": [ [ 0.0, "#000021" ], [ 0.1, "#000022" ], [ 0.2, "#000023" ], [ 0.3, "#000024" ], [ 0.4, "#000025" ], [ 0.5, "#000026" ], [ 0.6, "#000027" ], [ 0.7, "#000028" ], [ 0.8, "#000029" ], [ 0.9, "#000030" ], [ 1.0, "#000031" ] ], "sequential": [ [ 0.0, "#000011" ], [ 0.1111111111111111, "#000012" ], [ 0.2222222222222222, "#000013" ], [ 0.3333333333333333, "#000014" ], [ 0.4444444444444444, "#000015" ], [ 0.5555555555555556, "#000016" ], [ 0.6666666666666666, "#000017" ], [ 0.7777777777777778, "#000018" ], [ 0.8888888888888888, "#000019" ], [ 1.0, "#000020" ] ], "sequentialminus": [ [ 0.0, "#000011" ], [ 0.1111111111111111, "#000012" ], [ 0.2222222222222222, "#000013" ], [ 0.3333333333333333, "#000014" ], [ 0.4444444444444444, "#000015" ], [ 0.5555555555555556, "#000016" ], [ 0.6666666666666666, "#000017" ], [ 0.7777777777777778, "#000018" ], [ 0.8888888888888888, "#000019" ], [ 1.0, "#000020" ] ] } } }, "showlegend": true } }, "height": null, "width": null, "user": { "profile_url": "https://chart-studio.plotly.com/~kiran_bommapala", "avatar_url": "https://storage.googleapis.com/plotly-prod-profiles/97.jpg", "background_url": "https://storage.googleapis.com/plotly-prod-profiles/bg-12.jpg", "bio": "", "nickname": "", "website": "", "stream_tokens": null, "feature_set_id": null, "csrf_token": null, "date_joined": "2025-09-14 06:32:42", "mapbox_access_tokens": null, "has_password": null, "username": "kiran_bommapala", "email": null, "is_active": null, "readonly": null, "is_dash_creator": null, "dash_created_count": null, "is_chart_creator": null, "charts_created_count": null } }, { "creation_time": "2025-09-15T19:07:55.475085Z", "comments": { "results": [], "count": 0 }, "parented": true, "embed_url": "https://chart-studio.plotly.com/~kiran_bommapala/118.embed", "fid": "kiran_bommapala:118", "filename": "infracost-costs-1757963268", "filetype": "plot", "img_url": "https://storage.googleapis.com/plotly-prod-images/kiran_bommapala/118/9_8ZPY08M4C9RJFOYYO4B4DNWEJYJ3T0.png", "image_urls": { "default": "https://storage.googleapis.com/plotly-prod-images/kiran_bommapala/118/2_YAUQSNYG87WDW7ELVG5U2LU9TZVRDX.png", "block-thumb": "https://storage.googleapis.com/plotly-prod-images/kiran_bommapala/118/8_L2FKO155I54GGUOAR34BOLXIXWSSM7.png", "list-thumb": "https://storage.googleapis.com/plotly-prod-images/kiran_bommapala/118/9_8ZPY08M4C9RJFOYYO4B4DNWEJYJ3T0.png" }, "api_urls": { "files": "https://api.plotly.com/v2/files/kiran_bommapala:118", "plots": "https://api.plotly.com/v2/plots/kiran_bommapala:118", "parent": "https://api.plotly.com/v2/folders/home?user=kiran_bommapala" }, "owner": "kiran_bommapala", "parent": -1, "preview": "", "referencers": [], "references": [], "title": "", "views": 0, "web_url": "https://chart-studio.plotly.com/~kiran_bommapala/118/", "world_readable": true, "date_modified": "2025-09-15T19:07:55.487Z", "stars": { "results": [], "count": 0 }, "collaborators": { "results": [], "count": 0 }, "subfolder_count": null, "refresh_interval": null, "organize_view_url": "https://chart-studio.plotly.com/~kiran_bommapala/118/", "current_user_permission": "read", "is_theme": null, "is_template": null, "autosize": true, "caption": "", "figure": { "data": [ { "name": "aws_lb.hack_lb", "type": "bar", "xsrc": "kiran_bommapala:112:25b88e", "ysrc": "kiran_bommapala:112:f93968", "xaxis": "x", "yaxis": "y", "marker": { "color": "#636EFA", "pattern": { "shape": "" } }, "showlegend": true, "legendgroup": "aws_lb.hack_lb", "offsetgroup": "aws_lb.hack_lb", "orientation": "v", "textposition": "auto", "hovertemplate": "Resource=%{x}<br>Monthly Cost ($)=%{y}<extra></extra>", "alignmentgroup": "True" }, { "name": "aws_db_instance.hack_db", "type": "bar", "xsrc": "kiran_bommapala:112:1b80d3", "ysrc": "kiran_bommapala:112:c9e283", "xaxis": "x", "yaxis": "y", "marker": { "color": "#EF553B", "pattern": { "shape": "" } }, "showlegend": true, "legendgroup": "aws_db_instance.hack_db", "offsetgroup": "aws_db_instance.hack_db", "orientation": "v", "textposition": "auto", "hovertemplate": "Resource=%{x}<br>Monthly Cost ($)=%{y}<extra></extra>", "alignmentgroup": "True" }, { "name": "aws_instance.hack_vm", "type": "bar", "xsrc": "kiran_bommapala:112:327fe7", "ysrc": "kiran_bommapala:112:bde96f", "xaxis": "x", "yaxis": "y", "marker": { "color": "#00CC96", "pattern": { "shape": "" } }, "showlegend": true, "legendgroup": "aws_instance.hack_vm", "offsetgroup": "aws_instance.hack_vm", "orientation": "v", "textposition": "auto", "hovertemplate": "Resource=%{x}<br>Monthly Cost ($)=%{y}<extra></extra>", "alignmentgroup": "True" }, { "name": "aws_instance.hack_vm2", "type": "bar", "xsrc": "kiran_bommapala:112:36c6e0", "ysrc": "kiran_bommapala:112:2c76bb", "xaxis": "x", "yaxis": "y", "marker": { "color": "#AB63FA", "pattern": { "shape": "" } }, "showlegend": true, "legendgroup": "aws_instance.hack_vm2", "offsetgroup": "aws_instance.hack_vm2", "orientation": "v", "textposition": "auto", "hovertemplate": "Resource=%{x}<br>Monthly Cost ($)=%{y}<extra></extra>", "alignmentgroup": "True" }, { "name": "aws_ebs_volume.hack_volume", "type": "bar", "xsrc": "kiran_bommapala:112:6d5158", "ysrc": "kiran_bommapala:112:c2e48d", "xaxis": "x", "yaxis": "y", "marker": { "color": "#FFA15A", "pattern": { "shape": "" } }, "showlegend": true, "legendgroup": "aws_ebs_volume.hack_volume", "offsetgroup": "aws_ebs_volume.hack_volume", "orientation": "v", "textposition": "auto", "hovertemplate": "Resource=%{x}<br>Monthly Cost ($)=%{y}<extra></extra>", "alignmentgroup": "True" } ], "layout": { "title": { "text": "Monthly Infracost Breakdown per Resource" }, "xaxis": { "title": { "text": "Resource" }, "anchor": "y", "domain": [ 0.0, 1.0 ], "tickangle": -45, "categoryarray": [ "aws_lb.hack_lb", "aws_db_instance.hack_db", "aws_instance.hack_vm", "aws_instance.hack_vm2", "aws_ebs_volume.hack_volume" ], "categoryorder": "array" }, "yaxis": { "title": { "text": "Monthly Cost ($)" }, "anchor": "x", "domain": [ 0.0, 1.0 ] }, "legend": { "title": { "text": "Resource" }, "tracegroupgap": 0 }, "barmode": "relative", "template": { "data": { "table": [ { "type": "table", "cells": { "fill": { "color": "#000038" }, "font": { "color": "#000037" }, "line": { "color": "#000039" } }, "header": { "fill": { "color": "#000040" }, "font": { "color": "#000036" }, "line": { "color": "#000039" } } } ], "icicle": [ { "type": "icicle", "textfont": { "color": "white" } } ], "sankey": [ { "type": "sankey", "textfont": { "color": "#000036" } } ], "contour": [ { "type": "contour", "colorscale": [ [ 0.0, "#000011" ], [ 0.1111111111111111, "#000012" ], [ 0.2222222222222222, "#000013" ], [ 0.3333333333333333, "#000014" ], [ 0.4444444444444444, "#000015" ], [ 0.5555555555555556, "#000016" ], [ 0.6666666666666666, "#000017" ], [ 0.7777777777777778, "#000018" ], [ 0.8888888888888888, "#000019" ], [ 1.0, "#000020" ] ] } ], "heatmap": [ { "type": "heatmap", "colorscale": [ [ 0.0, "#000011" ], [ 0.1111111111111111, "#000012" ], [ 0.2222222222222222, "#000013" ], [ 0.3333333333333333, "#000014" ], [ 0.4444444444444444, "#000015" ], [ 0.5555555555555556, "#000016" ], [ 0.6666666666666666, "#000017" ], [ 0.7777777777777778, "#000018" ], [ 0.8888888888888888, "#000019" ], [ 1.0, "#000020" ] ] } ], "scatter": [ { "type": "scatter", "marker": { "line": { "width": 0 } } } ], "waterfall": [ { "type": "waterfall", "totals": { "marker": { "color": "#000034" } }, "connector": { "line": { "color": "#000036", "width": 2 } }, "decreasing": { "marker": { "color": "#000033" } }, "increasing": { "marker": { "color": "#000032" } } } ], "candlestick": [ { "type": "candlestick", "decreasing": { "line": { "color": "#000033" } }, "increasing": { "line": { "color": "#000032" } } } ], "histogram2d": [ { "type": "histogram2d", "colorscale": [ [ 0.0, "#000011" ], [ 0.1111111111111111, "#000012" ], [ 0.2222222222222222, "#000013" ], [ 0.3333333333333333, "#000014" ], [ 0.4444444444444444, "#000015" ], [ 0.5555555555555556, "#000016" ], [ 0.6666666666666666, "#000017" ], [ 0.7777777777777778, "#000018" ], [ 0.8888888888888888, "#000019" ], [ 1.0, "#000020" ] ] } ], "contourcarpet": [ { "type": "contourcarpet", "colorscale": [ [ 0.0, "#000011" ], [ 0.1111111111111111, "#000012" ], [ 0.2222222222222222, "#000013" ], [ 0.3333333333333333, "#000014" ], [ 0.4444444444444444, "#000015" ], [ 0.5555555555555556, "#000016" ], [ 0.6666666666666666, "#000017" ], [ 0.7777777777777778, "#000018" ], [ 0.8888888888888888, "#000019" ], [ 1.0, "#000020" ] ] } ] }, "layout": { "colorway": [ "#000001", "#000002", "#000003", "#000004", "#000005", "#000006", "#000007", "#000008", "#000009", "#000010" ], "coloraxis": { "colorscale": [ [ 0.0, "#000011" ], [ 0.1111111111111111, "#000012" ], [ 0.2222222222222222, "#000013" ], [ 0.3333333333333333, "#000014" ], [ 0.4444444444444444, "#000015" ], [ 0.5555555555555556, "#000016" ], [ 0.6666666666666666, "#000017" ], [ 0.7777777777777778, "#000018" ], [ 0.8888888888888888, "#000019" ], [ 1.0, "#000020" ] ] }, "colorscale": { "diverging": [ [ 0.0, "#000021" ], [ 0.1, "#000022" ], [ 0.2, "#000023" ], [ 0.3, "#000024" ], [ 0.4, "#000025" ], [ 0.5, "#000026" ], [ 0.6, "#000027" ], [ 0.7, "#000028" ], [ 0.8, "#000029" ], [ 0.9, "#000030" ], [ 1.0, "#000031" ] ], "sequential": [ [ 0.0, "#000011" ], [ 0.1111111111111111, "#000012" ], [ 0.2222222222222222, "#000013" ], [ 0.3333333333333333, "#000014" ], [ 0.4444444444444444, "#000015" ], [ 0.5555555555555556, "#000016" ], [ 0.6666666666666666, "#000017" ], [ 0.7777777777777778, "#000018" ], [ 0.8888888888888888, "#000019" ], [ 1.0, "#000020" ] ], "sequentialminus": [ [ 0.0, "#000011" ], [ 0.1111111111111111, "#000012" ], [ 0.2222222222222222, "#000013" ], [ 0.3333333333333333, "#000014" ], [ 0.4444444444444444, "#000015" ], [ 0.5555555555555556, "#000016" ], [ 0.6666666666666666, "#000017" ], [ 0.7777777777777778, "#000018" ], [ 0.8888888888888888, "#000019" ], [ 1.0, "#000020" ] ] } } }, "showlegend": true } }, "height": null, "width": null, "user": { "profile_url": "https://chart-studio.plotly.com/~kiran_bommapala", "avatar_url": "https://storage.googleapis.com/plotly-prod-profiles/97.jpg", "background_url": "https://storage.googleapis.com/plotly-prod-profiles/bg-12.jpg", "bio": "", "nickname": "", "website": "", "stream_tokens": null, "feature_set_id": null, "csrf_token": null, "date_joined": "2025-09-14 06:32:42", "mapbox_access_tokens": null, "has_password": null, "username": "kiran_bommapala", "email": null, "is_active": null, "readonly": null, "is_dash_creator": null, "dash_created_count": null, "is_chart_creator": null, "charts_created_count": null } }, { "creation_time": "2025-09-15T19:07:53.650872Z", "comments": { "results": [], "count": 0 }, "parented": true, "embed_url": "https://chart-studio.plotly.com/~kiran_bommapala/115.embed", "fid": "kiran_bommapala:115", "filename": "infracost-costs-1757963266", "filetype": "plot", "img_url": "https://storage.googleapis.com/plotly-prod-images/kiran_bommapala/115/9_1HLGXX5A5686LDDGENX0TXX053K0S0.png", "image_urls": { "default": "https://storage.googleapis.com/plotly-prod-images/kiran_bommapala/115/2_4VDTC1EMNKQ99MPQE6MMLWUECUH81U.png", "block-thumb": "https://storage.googleapis.com/plotly-prod-images/kiran_bommapala/115/8_1C27QBOEF950KIHU1RWOC3JCX82A7B.png", "list-thumb": "https://storage.googleapis.com/plotly-prod-images/kiran_bommapala/115/9_1HLGXX5A5686LDDGENX0TXX053K0S0.png" }, "api_urls": { "files": "https://api.plotly.com/v2/files/kiran_bommapala:115", "plots": "https://api.plotly.com/v2/plots/kiran_bommapala:115", "parent": "https://api.plotly.com/v2/folders/home?user=kiran_bommapala" }, "owner": "kiran_bommapala", "parent": -1, "preview": "", "referencers": [], "references": [], "title": "", "views": 0, "web_url": "https://chart-studio.plotly.com/~kiran_bommapala/115/", "world_readable": true, "date_modified": "2025-09-15T19:07:53.661Z", "stars": { "results": [], "count": 0 }, "collaborators": { "results": [], "count": 0 }, "subfolder_count": null, "refresh_interval": null, "organize_view_url": "https://chart-studio.plotly.com/~kiran_bommapala/115/", "current_user_permission": "read", "is_theme": null, "is_template": null, "autosize": true, "caption": "", "figure": { "data": [ { "name": "aws_lb.hack_lb", "type": "bar", "xsrc": "kiran_bommapala:111:3a9bf5", "ysrc": "kiran_bommapala:111:65b5d8", "xaxis": "x", "yaxis": "y", "marker": { "color": "#636EFA", "pattern": { "shape": "" } }, "showlegend": true, "legendgroup": "aws_lb.hack_lb", "offsetgroup": "aws_lb.hack_lb", "orientation": "v", "textposition": "auto", "hovertemplate": "Resource=%{x}<br>Monthly Cost ($)=%{y}<extra></extra>", "alignmentgroup": "True" }, { "name": "aws_db_instance.hack_db", "type": "bar", "xsrc": "kiran_bommapala:111:dcebdc", "ysrc": "kiran_bommapala:111:91bda7", "xaxis": "x", "yaxis": "y", "marker": { "color": "#EF553B", "pattern": { "shape": "" } }, "showlegend": true, "legendgroup": "aws_db_instance.hack_db", "offsetgroup": "aws_db_instance.hack_db", "orientation": "v", "textposition": "auto", "hovertemplate": "Resource=%{x}<br>Monthly Cost ($)=%{y}<extra></extra>", "alignmentgroup": "True" }, { "name": "aws_instance.hack_vm", "type": "bar", "xsrc": "kiran_bommapala:111:bc38b7", "ysrc": "kiran_bommapala:111:55580a", "xaxis": "x", "yaxis": "y", "marker": { "color": "#00CC96", "pattern": { "shape": "" } }, "showlegend": true, "legendgroup": "aws_instance.hack_vm", "offsetgroup": "aws_instance.hack_vm", "orientation": "v", "textposition": "auto", "hovertemplate": "Resource=%{x}<br>Monthly Cost ($)=%{y}<extra></extra>", "alignmentgroup": "True" }, { "name": "aws_instance.hack_vm2", "type": "bar", "xsrc": "kiran_bommapala:111:06f0e7", "ysrc": "kiran_bommapala:111:3ecb65", "xaxis": "x", "yaxis": "y", "marker": { "color": "#AB63FA", "pattern": { "shape": "" } }, "showlegend": true, "legendgroup": "aws_instance.hack_vm2", "offsetgroup": "aws_instance.hack_vm2", "orientation": "v", "textposition": "auto", "hovertemplate": "Resource=%{x}<br>Monthly Cost ($)=%{y}<extra></extra>", "alignmentgroup": "True" }, { "name": "aws_ebs_volume.hack_volume", "type": "bar", "xsrc": "kiran_bommapala:111:f2f31b", "ysrc": "kiran_bommapala:111:a90bc6", "xaxis": "x", "yaxis": "y", "marker": { "color": "#FFA15A", "pattern": { "shape": "" } }, "showlegend": true, "legendgroup": "aws_ebs_volume.hack_volume", "offsetgroup": "aws_ebs_volume.hack_volume", "orientation": "v", "textposition": "auto", "hovertemplate": "Resource=%{x}<br>Monthly Cost ($)=%{y}<extra></extra>", "alignmentgroup": "True" } ], "layout": { "title": { "text": "Monthly Infracost Breakdown per Resource" }, "xaxis": { "title": { "text": "Resource" }, "anchor": "y", "domain": [ 0.0, 1.0 ], "tickangle": -45, "categoryarray": [ "aws_lb.hack_lb", "aws_db_instance.hack_db", "aws_instance.hack_vm", "aws_instance.hack_vm2", "aws_ebs_volume.hack_volume" ], "categoryorder": "array" }, "yaxis": { "title": { "text": "Monthly Cost ($)" }, "anchor": "x", "domain": [ 0.0, 1.0 ] }, "legend": { "title": { "text": "Resource" }, "tracegroupgap": 0 }, "barmode": "relative", "template": { "data": { "table": [ { "type": "table", "cells": { "fill": { "color": "#000038" }, "font": { "color": "#000037" }, "line": { "color": "#000039" } }, "header": { "fill": { "color": "#000040" }, "font": { "color": "#000036" }, "line": { "color": "#000039" } } } ], "icicle": [ { "type": "icicle", "textfont": { "color": "white" } } ], "sankey": [ { "type": "sankey", "textfont": { "color": "#000036" } } ], "contour": [ { "type": "contour", "colorscale": [ [ 0.0, "#000011" ], [ 0.1111111111111111, "#000012" ], [ 0.2222222222222222, "#000013" ], [ 0.3333333333333333, "#000014" ], [ 0.4444444444444444, "#000015" ], [ 0.5555555555555556, "#000016" ], [ 0.6666666666666666, "#000017" ], [ 0.7777777777777778, "#000018" ], [ 0.8888888888888888, "#000019" ], [ 1.0, "#000020" ] ] } ], "heatmap": [ { "type": "heatmap", "colorscale": [ [ 0.0, "#000011" ], [ 0.1111111111111111, "#000012" ], [ 0.2222222222222222, "#000013" ], [ 0.3333333333333333, "#000014" ], [ 0.4444444444444444, "#000015" ], [ 0.5555555555555556, "#000016" ], [ 0.6666666666666666, "#000017" ], [ 0.7777777777777778, "#000018" ], [ 0.8888888888888888, "#000019" ], [ 1.0, "#000020" ] ] } ], "scatter": [ { "type": "scatter", "marker": { "line": { "width": 0 } } } ], "waterfall": [ { "type": "waterfall", "totals": { "marker": { "color": "#000034" } }, "connector": { "line": { "color": "#000036", "width": 2 } }, "decreasing": { "marker": { "color": "#000033" } }, "increasing": { "marker": { "color": "#000032" } } } ], "candlestick": [ { "type": "candlestick", "decreasing": { "line": { "color": "#000033" } }, "increasing": { "line": { "color": "#000032" } } } ], "histogram2d": [ { "type": "histogram2d", "colorscale": [ [ 0.0, "#000011" ], [ 0.1111111111111111, "#000012" ], [ 0.2222222222222222, "#000013" ], [ 0.3333333333333333, "#000014" ], [ 0.4444444444444444, "#000015" ], [ 0.5555555555555556, "#000016" ], [ 0.6666666666666666, "#000017" ], [ 0.7777777777777778, "#000018" ], [ 0.8888888888888888, "#000019" ], [ 1.0, "#000020" ] ] } ], "contourcarpet": [ { "type": "contourcarpet", "colorscale": [ [ 0.0, "#000011" ], [ 0.1111111111111111, "#000012" ], [ 0.2222222222222222, "#000013" ], [ 0.3333333333333333, "#000014" ], [ 0.4444444444444444, "#000015" ], [ 0.5555555555555556, "#000016" ], [ 0.6666666666666666, "#000017" ], [ 0.7777777777777778, "#000018" ], [ 0.8888888888888888, "#000019" ], [ 1.0, "#000020" ] ] } ] }, "layout": { "colorway": [ "#000001", "#000002", "#000003", "#000004", "#000005", "#000006", "#000007", "#000008", "#000009", "#000010" ], "coloraxis": { "colorscale": [ [ 0.0, "#000011" ], [ 0.1111111111111111, "#000012" ], [ 0.2222222222222222, "#000013" ], [ 0.3333333333333333, "#000014" ], [ 0.4444444444444444, "#000015" ], [ 0.5555555555555556, "#000016" ], [ 0.6666666666666666, "#000017" ], [ 0.7777777777777778, "#000018" ], [ 0.8888888888888888, "#000019" ], [ 1.0, "#000020" ] ] }, "colorscale": { "diverging": [ [ 0.0, "#000021" ], [ 0.1, "#000022" ], [ 0.2, "#000023" ], [ 0.3, "#000024" ], [ 0.4, "#000025" ], [ 0.5, "#000026" ], [ 0.6, "#000027" ], [ 0.7, "#000028" ], [ 0.8, "#000029" ], [ 0.9, "#000030" ], [ 1.0, "#000031" ] ], "sequential": [ [ 0.0, "#000011" ], [ 0.1111111111111111, "#000012" ], [ 0.2222222222222222, "#000013" ], [ 0.3333333333333333, "#000014" ], [ 0.4444444444444444, "#000015" ], [ 0.5555555555555556, "#000016" ], [ 0.6666666666666666, "#000017" ], [ 0.7777777777777778, "#000018" ], [ 0.8888888888888888, "#000019" ], [ 1.0, "#000020" ] ], "sequentialminus": [ [ 0.0, "#000011" ], [ 0.1111111111111111, "#000012" ], [ 0.2222222222222222, "#000013" ], [ 0.3333333333333333, "#000014" ], [ 0.4444444444444444, "#000015" ], [ 0.5555555555555556, "#000016" ], [ 0.6666666666666666, "#000017" ], [ 0.7777777777777778, "#000018" ], [ 0.8888888888888888, "#000019" ], [ 1.0, "#000020" ] ] } } }, "showlegend": true } }, "height": null, "width": null, "user": { "profile_url": "https://chart-studio.plotly.com/~kiran_bommapala", "avatar_url": "https://storage.googleapis.com/plotly-prod-profiles/97.jpg", "background_url": "https://storage.googleapis.com/plotly-prod-profiles/bg-12.jpg", "bio": "", "nickname": "", "website": "", "stream_tokens": null, "feature_set_id": null, "csrf_token": null, "date_joined": "2025-09-14 06:32:42", "mapbox_access_tokens": null, "has_password": null, "username": "kiran_bommapala", "email": null, "is_active": null, "readonly": null, "is_dash_creator": null, "dash_created_count": null, "is_chart_creator": null, "charts_created_count": null } }, { "creation_time": "2025-09-15T19:07:51.881942Z", "comments": { "results": [], "count": 0 }, "parented": true, "embed_url": "https://chart-studio.plotly.com/~kiran_bommapala/114.embed", "fid": "kiran_bommapala:114", "filename": "infracost-costs-1757963265", "filetype": "plot", "img_url": "https://storage.googleapis.com/plotly-prod-images/kiran_bommapala/114/9_YSBGI4YKFNTPKTVMEPVYN4AW15VZHU.png", "image_urls": { "default": "https://storage.googleapis.com/plotly-prod-images/kiran_bommapala/114/2_DGPUMFCP5RBUFELAUW2RWR71BF153M.png", "block-thumb": "https://storage.googleapis.com/plotly-prod-images/kiran_bommapala/114/8_409QWI3UU38O3LIT9VC2JDSSJE9PFR.png", "list-thumb": "https://storage.googleapis.com/plotly-prod-images/kiran_bommapala/114/9_YSBGI4YKFNTPKTVMEPVYN4AW15VZHU.png" }, "api_urls": { "files": "https://api.plotly.com/v2/files/kiran_bommapala:114", "plots": "https://api.plotly.com/v2/plots/kiran_bommapala:114", "parent": "https://api.plotly.com/v2/folders/home?user=kiran_bommapala" }, "owner": "kiran_bommapala", "parent": -1, "preview": "", "referencers": [], "references": [], "title": "", "views": 0, "web_url": "https://chart-studio.plotly.com/~kiran_bommapala/114/", "world_readable": true, "date_modified": "2025-09-15T19:07:51.896Z", "stars": { "results": [], "count": 0 }, "collaborators": { "results": [], "count": 0 }, "subfolder_count": null, "refresh_interval": null, "organize_view_url": "https://chart-studio.plotly.com/~kiran_bommapala/114/", "current_user_permission": "read", "is_theme": null, "is_template": null, "autosize": true, "caption": "", "figure": { "data": [ { "name": "aws_lb.hack_lb", "type": "bar", "xsrc": "kiran_bommapala:110:c84bea", "ysrc": "kiran_bommapala:110:2804fa", "xaxis": "x", "yaxis": "y", "marker": { "color": "#636EFA", "pattern": { "shape": "" } }, "showlegend": true, "legendgroup": "aws_lb.hack_lb", "offsetgroup": "aws_lb.hack_lb", "orientation": "v", "textposition": "auto", "hovertemplate": "Resource=%{x}<br>Monthly Cost ($)=%{y}<extra></extra>", "alignmentgroup": "True" }, { "name": "aws_db_instance.hack_db", "type": "bar", "xsrc": "kiran_bommapala:110:b99a52", "ysrc": "kiran_bommapala:110:f3bcba", "xaxis": "x", "yaxis": "y", "marker": { "color": "#EF553B", "pattern": { "shape": "" } }, "showlegend": true, "legendgroup": "aws_db_instance.hack_db", "offsetgroup": "aws_db_instance.hack_db", "orientation": "v", "textposition": "auto", "hovertemplate": "Resource=%{x}<br>Monthly Cost ($)=%{y}<extra></extra>", "alignmentgroup": "True" }, { "name": "aws_instance.hack_vm", "type": "bar", "xsrc": "kiran_bommapala:110:ca3996", "ysrc": "kiran_bommapala:110:0ba92d", "xaxis": "x", "yaxis": "y", "marker": { "color": "#00CC96", "pattern": { "shape": "" } }, "showlegend": true, "legendgroup": "aws_instance.hack_vm", "offsetgroup": "aws_instance.hack_vm", "orientation": "v", "textposition": "auto", "hovertemplate": "Resource=%{x}<br>Monthly Cost ($)=%{y}<extra></extra>", "alignmentgroup": "True" }, { "name": "aws_instance.hack_vm2", "type": "bar", "xsrc": "kiran_bommapala:110:3afe72", "ysrc": "kiran_bommapala:110:ad8ead", "xaxis": "x", "yaxis": "y", "marker": { "color": "#AB63FA", "pattern": { "shape": "" } }, "showlegend": true, "legendgroup": "aws_instance.hack_vm2", "offsetgroup": "aws_instance.hack_vm2", "orientation": "v", "textposition": "auto", "hovertemplate": "Resource=%{x}<br>Monthly Cost ($)=%{y}<extra></extra>", "alignmentgroup": "True" }, { "name": "aws_ebs_volume.hack_volume", "type": "bar", "xsrc": "kiran_bommapala:110:263706", "ysrc": "kiran_bommapala:110:827614", "xaxis": "x", "yaxis": "y", "marker": { "color": "#FFA15A", "pattern": { "shape": "" } }, "showlegend": true, "legendgroup": "aws_ebs_volume.hack_volume", "offsetgroup": "aws_ebs_volume.hack_volume", "orientation": "v", "textposition": "auto", "hovertemplate": "Resource=%{x}<br>Monthly Cost ($)=%{y}<extra></extra>", "alignmentgroup": "True" } ], "layout": { "title": { "text": "Monthly Infracost Breakdown per Resource" }, "xaxis": { "title": { "text": "Resource" }, "anchor": "y", "domain": [ 0.0, 1.0 ], "tickangle": -45, "categoryarray": [ "aws_lb.hack_lb", "aws_db_instance.hack_db", "aws_instance.hack_vm", "aws_instance.hack_vm2", "aws_ebs_volume.hack_volume" ], "categoryorder": "array" }, "yaxis": { "title": { "text": "Monthly Cost ($)" }, "anchor": "x", "domain": [ 0.0, 1.0 ] }, "legend": { "title": { "text": "Resource" }, "tracegroupgap": 0 }, "barmode": "relative", "template": { "data": { "table": [ { "type": "table", "cells": { "fill": { "color": "#000038" }, "font": { "color": "#000037" }, "line": { "color": "#000039" } }, "header": { "fill": { "color": "#000040" }, "font": { "color": "#000036" }, "line": { "color": "#000039" } } } ], "icicle": [ { "type": "icicle", "textfont": { "color": "white" } } ], "sankey": [ { "type": "sankey", "textfont": { "color": "#000036" } } ], "contour": [ { "type": "contour", "colorscale": [ [ 0.0, "#000011" ], [ 0.1111111111111111, "#000012" ], [ 0.2222222222222222, "#000013" ], [ 0.3333333333333333, "#000014" ], [ 0.4444444444444444, "#000015" ], [ 0.5555555555555556, "#000016" ], [ 0.6666666666666666, "#000017" ], [ 0.7777777777777778, "#000018" ], [ 0.8888888888888888, "#000019" ], [ 1.0, "#000020" ] ] } ], "heatmap": [ { "type": "heatmap", "colorscale": [ [ 0.0, "#000011" ], [ 0.1111111111111111, "#000012" ], [ 0.2222222222222222, "#000013" ], [ 0.3333333333333333, "#000014" ], [ 0.4444444444444444, "#000015" ], [ 0.5555555555555556, "#000016" ], [ 0.6666666666666666, "#000017" ], [ 0.7777777777777778, "#000018" ], [ 0.8888888888888888, "#000019" ], [ 1.0, "#000020" ] ] } ], "scatter": [ { "type": "scatter", "marker": { "line": { "width": 0 } } } ], "waterfall": [ { "type": "waterfall", "totals": { "marker": { "color": "#000034" } }, "connector": { "line": { "color": "#000036", "width": 2 } }, "decreasing": { "marker": { "color": "#000033" } }, "increasing": { "marker": { "color": "#000032" } } } ], "candlestick": [ { "type": "candlestick", "decreasing": { "line": { "color": "#000033" } }, "increasing": { "line": { "color": "#000032" } } } ], "histogram2d": [ { "type": "histogram2d", "colorscale": [ [ 0.0, "#000011" ], [ 0.1111111111111111, "#000012" ], [ 0.2222222222222222, "#000013" ], [ 0.3333333333333333, "#000014" ], [ 0.4444444444444444, "#000015" ], [ 0.5555555555555556, "#000016" ], [ 0.6666666666666666, "#000017" ], [ 0.7777777777777778, "#000018" ], [ 0.8888888888888888, "#000019" ], [ 1.0, "#000020" ] ] } ], "contourcarpet": [ { "type": "contourcarpet", "colorscale": [ [ 0.0, "#000011" ], [ 0.1111111111111111, "#000012" ], [ 0.2222222222222222, "#000013" ], [ 0.3333333333333333, "#000014" ], [ 0.4444444444444444, "#000015" ], [ 0.5555555555555556, "#000016" ], [ 0.6666666666666666, "#000017" ], [ 0.7777777777777778, "#000018" ], [ 0.8888888888888888, "#000019" ], [ 1.0, "#000020" ] ] } ] }, "layout": { "colorway": [ "#000001", "#000002", "#000003", "#000004", "#000005", "#000006", "#000007", "#000008", "#000009", "#000010" ], "coloraxis": { "colorscale": [ [ 0.0, "#000011" ], [ 0.1111111111111111, "#000012" ], [ 0.2222222222222222, "#000013" ], [ 0.3333333333333333, "#000014" ], [ 0.4444444444444444, "#000015" ], [ 0.5555555555555556, "#000016" ], [ 0.6666666666666666, "#000017" ], [ 0.7777777777777778, "#000018" ], [ 0.8888888888888888, "#000019" ], [ 1.0, "#000020" ] ] }, "colorscale": { "diverging": [ [ 0.0, "#000021" ], [ 0.1, "#000022" ], [ 0.2, "#000023" ], [ 0.3, "#000024" ], [ 0.4, "#000025" ], [ 0.5, "#000026" ], [ 0.6, "#000027" ], [ 0.7, "#000028" ], [ 0.8, "#000029" ], [ 0.9, "#000030" ], [ 1.0, "#000031" ] ], "sequential": [ [ 0.0, "#000011" ], [ 0.1111111111111111, "#000012" ], [ 0.2222222222222222, "#000013" ], [ 0.3333333333333333, "#000014" ], [ 0.4444444444444444, "#000015" ], [ 0.5555555555555556, "#000016" ], [ 0.6666666666666666, "#000017" ], [ 0.7777777777777778, "#000018" ], [ 0.8888888888888888, "#000019" ], [ 1.0, "#000020" ] ], "sequentialminus": [ [ 0.0, "#000011" ], [ 0.1111111111111111, "#000012" ], [ 0.2222222222222222, "#000013" ], [ 0.3333333333333333, "#000014" ], [ 0.4444444444444444, "#000015" ], [ 0.5555555555555556, "#000016" ], [ 0.6666666666666666, "#000017" ], [ 0.7777777777777778, "#000018" ], [ 0.8888888888888888, "#000019" ], [ 1.0, "#000020" ] ] } } }, "showlegend": true } }, "height": null, "width": null, "user": { "profile_url": "https://chart-studio.plotly.com/~kiran_bommapala", "avatar_url": "https://storage.googleapis.com/plotly-prod-profiles/97.jpg", "background_url": "https://storage.googleapis.com/plotly-prod-profiles/bg-12.jpg", "bio": "", "nickname": "", "website": "", "stream_tokens": null, "feature_set_id": null, "csrf_token": null, "date_joined": "2025-09-14 06:32:42", "mapbox_access_tokens": null, "has_password": null, "username": "kiran_bommapala", "email": null, "is_active": null, "readonly": null, "is_dash_creator": null, "dash_created_count": null, "is_chart_creator": null, "charts_created_count": null } }, { "creation_time": "2025-09-15T19:07:29.356736Z", "comments": { "results": [], "count": 0 }, "parented": true, "embed_url": "https://chart-studio.plotly.com/~Shangkuan/1.embed", "fid": "Shangkuan:1", "filename": "Plot 1", "filetype": "plot", "img_url": "https://api.plotly.com/v2/files/Shangkuan:1/image?image_name=list-thumb", "image_urls": { "default": "https://storage.googleapis.com/plotly-prod-images/Shangkuan/1/2_HV3QX625KZTX7QGRLWSU4TR38MFT1C.png", "block-thumb": "https://storage.googleapis.com/plotly-prod-images/Shangkuan/1/8_5RXVNETWJ0GGKGNMXDWDK8R52KRZXU.png", "list-thumb": "https://api.plotly.com/v2/files/Shangkuan:1/image?image_name=list-thumb" }, "api_urls": { "files": "https://api.plotly.com/v2/files/Shangkuan:1", "plots": "https://api.plotly.com/v2/plots/Shangkuan:1", "parent": "https://api.plotly.com/v2/folders/home?user=Shangkuan" }, "owner": "Shangkuan", "parent": -1, "preview": "", "referencers": [], "references": [], "title": "", "views": 0, "web_url": "https://chart-studio.plotly.com/~Shangkuan/1/", "world_readable": true, "date_modified": "2025-09-15T19:09:14.337Z", "stars": { "results": [], "count": 0 }, "collaborators": { "results": [], "count": 0 }, "subfolder_count": null, "refresh_interval": null, "organize_view_url": "https://chart-studio.plotly.com/~Shangkuan/1/", "current_user_permission": "read", "is_theme": null, "is_template": false, "autosize": true, "caption": "", "figure": { "data": [ { "meta": { "columnNames": { "x": "A", "y": "B" } }, "mode": "lines", "type": "scatter", "xsrc": "Shangkuan:0:4f8be6", "ysrc": "Shangkuan:0:f10e30" }, { "meta": { "columnNames": { "x": "C", "y": "D" } }, "mode": "lines", "type": "scatter", "xsrc": "Shangkuan:0:cee01b", "ysrc": "Shangkuan:0:4632b5", "stackgroup": null } ], "frames": [], "layout": { "xaxis": { "type": "linear", "range": [ 0, 40 ], "autorange": true }, "yaxis": { "type": "linear", "range": [ -0.4444444444444444, 8.444444444444445 ], "autorange": true }, "autosize": true, "template": { "data": { "bar": [ { "type": "bar", "marker": { "colorbar": { "ticks": "", "outlinewidth": 0 } } } ], "table": [ { "type": "table", "cells": { "fill": { "color": "#EBF0F8" }, "line": { "color": "white" } }, "header": { "fill": { "color": "#C8D4E3" }, "line": { "color": "white" } } } ], "carpet": [ { "type": "carpet", "aaxis": { "gridcolor": "#C8D4E3", "linecolor": "#C8D4E3", "endlinecolor": "#2a3f5f", "minorgridcolor": "#C8D4E3", "startlinecolor": "#2a3f5f" }, "baxis": { "gridcolor": "#C8D4E3", "linecolor": "#C8D4E3", "endlinecolor": "#2a3f5f", "minorgridcolor": "#C8D4E3", "startlinecolor": "#2a3f5f" } } ], "mesh3d": [ { "type": "mesh3d", "colorbar": { "ticks": "", "outlinewidth": 0 } } ], "contour": [ { "type": "contour", "colorbar": { "ticks": "", "outlinewidth": 0 }, "autocolorscale": true } ], "heatmap": [ { "type": "heatmap", "colorbar": { "ticks": "", "outlinewidth": 0 }, "autocolorscale": true } ], "scatter": [ { "type": "scatter", "marker": { "colorbar": { "ticks": "", "outlinewidth": 0 } } } ], "surface": [ { "type": "surface", "colorbar": { "ticks": "", "outlinewidth": 0 } } ], "heatmapgl": [ { "type": "heatmapgl", "colorbar": { "ticks": "", "outlinewidth": 0 } } ], "histogram": [ { "type": "histogram", "marker": { "colorbar": { "ticks": "", "outlinewidth": 0 } } } ], "parcoords": [ { "line": { "colorbar": { "ticks": "", "outlinewidth": 0 } }, "type": "parcoords" } ], "scatter3d": [ { "type": "scatter3d", "marker": { "colorbar": { "ticks": "", "outlinewidth": 0 } } } ], "scattergl": [ { "type": "scattergl", "marker": { "colorbar": { "ticks": "", "outlinewidth": 0 } } } ], "choropleth": [ { "type": "choropleth", "colorbar": { "ticks": "", "outlinewidth": 0 } } ], "scattergeo": [ { "type": "scattergeo", "marker": { "colorbar": { "ticks": "", "outlinewidth": 0 } } } ], "histogram2d": [ { "type": "histogram2d", "colorbar": { "ticks": "", "outlinewidth": 0 }, "autocolorscale": true } ], "scatterpolar": [ { "type": "scatterpolar", "marker": { "colorbar": { "ticks": "", "outlinewidth": 0 } } } ], "contourcarpet": [ { "type": "contourcarpet", "colorbar": { "ticks": "", "outlinewidth": 0 } } ], "scattercarpet": [ { "type": "scattercarpet", "marker": { "colorbar": { "ticks": "", "outlinewidth": 0 } } } ], "scattermapbox": [ { "type": "scattermapbox", "marker": { "colorbar": { "ticks": "", "outlinewidth": 0 } } } ], "scatterpolargl": [ { "type": "scatterpolargl", "marker": { "colorbar": { "ticks": "", "outlinewidth": 0 } } } ], "scatterternary": [ { "type": "scatterternary", "marker": { "colorbar": { "ticks": "", "outlinewidth": 0 } } } ], "histogram2dcontour": [ { "type": "histogram2dcontour", "colorbar": { "ticks": "", "outlinewidth": 0 }, "autocolorscale": true } ] }, "layout": { "geo": { "bgcolor": "white", "showland": true, "lakecolor": "white", "landcolor": "white", "showlakes": true, "subunitcolor": "#C8D4E3" }, "font": { "color": "#2a3f5f" }, "polar": { "bgcolor": "white", "radialaxis": { "ticks": "", "gridcolor": "#EBF0F8", "linecolor": "#EBF0F8" }, "angularaxis": { "ticks": "", "gridcolor": "#EBF0F8", "linecolor": "#EBF0F8" } }, "scene": { "xaxis": { "ticks": "", "gridcolor": "#DFE8F3", "gridwidth": 2, "linecolor": "#EBF0F8", "zerolinecolor": "#EBF0F8", "showbackground": true, "backgroundcolor": "white" }, "yaxis": { "ticks": "", "gridcolor": "#DFE8F3", "gridwidth": 2, "linecolor": "#EBF0F8", "zerolinecolor": "#EBF0F8", "showbackground": true, "backgroundcolor": "white" }, "zaxis": { "ticks": "", "gridcolor": "#DFE8F3", "gridwidth": 2, "linecolor": "#EBF0F8", "zerolinecolor": "#EBF0F8", "showbackground": true, "backgroundcolor": "white" } }, "title": { "x": 0.05 }, "xaxis": { "ticks": "", "gridcolor": "#EBF0F8", "linecolor": "#EBF0F8", "automargin": true, "zerolinecolor": "#EBF0F8", "zerolinewidth": 2 }, "yaxis": { "ticks": "", "gridcolor": "#EBF0F8", "linecolor": "#EBF0F8", "automargin": true, "zerolinecolor": "#EBF0F8", "zerolinewidth": 2 }, "ternary": { "aaxis": { "ticks": "", "gridcolor": "#DFE8F3", "linecolor": "#A2B1C6" }, "baxis": { "ticks": "", "gridcolor": "#DFE8F3", "linecolor": "#A2B1C6" }, "caxis": { "ticks": "", "gridcolor": "#DFE8F3", "linecolor": "#A2B1C6" }, "bgcolor": "white" }, "colorway": [ "#636efa", "#EF553B", "#00cc96", "#ab63fa", "#19d3f3", "#e763fa", "#fecb52", "#ffa15a", "#ff6692", "#b6e880" ], "hovermode": "closest", "colorscale": { "diverging": [ [ 0, "#8e0152" ], [ 0.1, "#c51b7d" ], [ 0.2, "#de77ae" ], [ 0.3, "#f1b6da" ], [ 0.4, "#fde0ef" ], [ 0.5, "#f7f7f7" ], [ 0.6, "#e6f5d0" ], [ 0.7, "#b8e186" ], [ 0.8, "#7fbc41" ], [ 0.9, "#4d9221" ], [ 1, "#276419" ] ], "sequential": [ [ 0, "#0508b8" ], [ 0.0893854748603352, "#1910d8" ], [ 0.1787709497206704, "#3c19f0" ], [ 0.2681564245810056, "#6b1cfb" ], [ 0.3575418994413408, "#981cfd" ], [ 0.44692737430167595, "#bf1cfd" ], [ 0.5363128491620112, "#dd2bfd" ], [ 0.6256983240223464, "#f246fe" ], [ 0.7150837988826816, "#fc67fd" ], [ 0.8044692737430168, "#fe88fc" ], [ 0.8938547486033519, "#fea5fd" ], [ 0.9832402234636871, "#febefe" ], [ 1, "#fec3fe" ] ], "sequentialminus": [ [ 0, "#0508b8" ], [ 0.0893854748603352, "#1910d8" ], [ 0.1787709497206704, "#3c19f0" ], [ 0.2681564245810056, "#6b1cfb" ], [ 0.3575418994413408, "#981cfd" ], [ 0.44692737430167595, "#bf1cfd" ], [ 0.5363128491620112, "#dd2bfd" ], [ 0.6256983240223464, "#f246fe" ], [ 0.7150837988826816, "#fc67fd" ], [ 0.8044692737430168, "#fe88fc" ], [ 0.8938547486033519, "#fea5fd" ], [ 0.9832402234636871, "#febefe" ], [ 1, "#fec3fe" ] ] }, "plot_bgcolor": "white", "paper_bgcolor": "white", "shapedefaults": { "line": { "width": 0 }, "opacity": 0.4, "fillcolor": "#506784" }, "annotationdefaults": { "arrowhead": 0, "arrowcolor": "#506784", "arrowwidth": 1 } }, "themeRef": "PLOTLY_WHITE" } } }, "height": null, "width": null, "user": { "profile_url": "https://chart-studio.plotly.com/~Shangkuan", "avatar_url": "https://storage.googleapis.com/plotly-prod-profiles/19.jpg", "background_url": "https://storage.googleapis.com/plotly-prod-profiles/bg-9.jpg", "bio": "", "nickname": "", "website": "", "stream_tokens": null, "feature_set_id": null, "csrf_token": null, "date_joined": "2025-09-12 00:43:17", "mapbox_access_tokens": null, "has_password": null, "username": "Shangkuan", "email": null, "is_active": null, "readonly": null, "is_dash_creator": null, "dash_created_count": null, "is_chart_creator": null, "charts_created_count": null } }, { "creation_time": "2025-09-15T19:05:03.051608Z", "comments": { "results": [], "count": 0 }, "parented": true, "embed_url": "https://chart-studio.plotly.com/~Ehammel28/1.embed", "fid": "Ehammel28:1", "filename": "Plot 1", "filetype": "plot", "img_url": "https://storage.googleapis.com/plotly-prod-images/Ehammel28/1/9_2OFLMK2NAPJDLQYM4WZW3LBM2M7EF2.png", "image_urls": { "default": "https://storage.googleapis.com/plotly-prod-images/Ehammel28/1/2_U9AODPH3ZXW70PZXRL68LKDH793T1H.png", "block-thumb": "https://storage.googleapis.com/plotly-prod-images/Ehammel28/1/8_4L1988QJEY2DZDRSAISRCZVJLMNOW8.png", "list-thumb": "https://storage.googleapis.com/plotly-prod-images/Ehammel28/1/9_2OFLMK2NAPJDLQYM4WZW3LBM2M7EF2.png" }, "api_urls": { "files": "https://api.plotly.com/v2/files/Ehammel28:1", "plots": "https://api.plotly.com/v2/plots/Ehammel28:1", "parent": "https://api.plotly.com/v2/folders/home?user=Ehammel28" }, "owner": "Ehammel28", "parent": -1, "preview": "", "referencers": [], "references": [], "title": "", "views": 0, "web_url": "https://chart-studio.plotly.com/~Ehammel28/1/", "world_readable": true, "date_modified": "2025-09-15T19:05:03.066Z", "stars": { "results": [], "count": 0 }, "collaborators": { "results": [], "count": 0 }, "subfolder_count": null, "refresh_interval": null, "organize_view_url": "https://chart-studio.plotly.com/~Ehammel28/1/", "current_user_permission": "read", "is_theme": null, "is_template": false, "autosize": true, "caption": "", "figure": { "data": [ { "meta": { "columnNames": { "x": "A", "y": "B" } }, "mode": "lines", "type": "scatter", "xsrc": "Ehammel28:0:cec292", "ysrc": "Ehammel28:0:1baa47" }, { "meta": { "columnNames": { "x": "C", "y": "D" } }, "mode": "lines", "type": "scatter", "xsrc": "Ehammel28:0:ed3a1b", "ysrc": "Ehammel28:0:618b5a", "stackgroup": null } ], "frames": [], "layout": { "xaxis": { "type": "linear", "range": [ 0, 15 ], "autorange": true }, "yaxis": { "type": "linear", "range": [ -0.5555555555555556, 10.555555555555555 ], "autorange": true }, "autosize": true, "template": { "data": { "bar": [ { "type": "bar", "marker": { "colorbar": { "ticks": "", "outlinewidth": 0 } } } ], "table": [ { "type": "table", "cells": { "fill": { "color": "#EBF0F8" }, "line": { "color": "white" } }, "header": { "fill": { "color": "#C8D4E3" }, "line": { "color": "white" } } } ], "carpet": [ { "type": "carpet", "aaxis": { "gridcolor": "#C8D4E3", "linecolor": "#C8D4E3", "endlinecolor": "#2a3f5f", "minorgridcolor": "#C8D4E3", "startlinecolor": "#2a3f5f" }, "baxis": { "gridcolor": "#C8D4E3", "linecolor": "#C8D4E3", "endlinecolor": "#2a3f5f", "minorgridcolor": "#C8D4E3", "startlinecolor": "#2a3f5f" } } ], "mesh3d": [ { "type": "mesh3d", "colorbar": { "ticks": "", "outlinewidth": 0 } } ], "contour": [ { "type": "contour", "colorbar": { "ticks": "", "outlinewidth": 0 }, "autocolorscale": true } ], "heatmap": [ { "type": "heatmap", "colorbar": { "ticks": "", "outlinewidth": 0 }, "autocolorscale": true } ], "scatter": [ { "type": "scatter", "marker": { "colorbar": { "ticks": "", "outlinewidth": 0 } } } ], "surface": [ { "type": "surface", "colorbar": { "ticks": "", "outlinewidth": 0 } } ], "heatmapgl": [ { "type": "heatmapgl", "colorbar": { "ticks": "", "outlinewidth": 0 } } ], "histogram": [ { "type": "histogram", "marker": { "colorbar": { "ticks": "", "outlinewidth": 0 } } } ], "parcoords": [ { "line": { "colorbar": { "ticks": "", "outlinewidth": 0 } }, "type": "parcoords" } ], "scatter3d": [ { "type": "scatter3d", "marker": { "colorbar": { "ticks": "", "outlinewidth": 0 } } } ], "scattergl": [ { "type": "scattergl", "marker": { "colorbar": { "ticks": "", "outlinewidth": 0 } } } ], "choropleth": [ { "type": "choropleth", "colorbar": { "ticks": "", "outlinewidth": 0 } } ], "scattergeo": [ { "type": "scattergeo", "marker": { "colorbar": { "ticks": "", "outlinewidth": 0 } } } ], "histogram2d": [ { "type": "histogram2d", "colorbar": { "ticks": "", "outlinewidth": 0 }, "autocolorscale": true } ], "scatterpolar": [ { "type": "scatterpolar", "marker": { "colorbar": { "ticks": "", "outlinewidth": 0 } } } ], "contourcarpet": [ { "type": "contourcarpet", "colorbar": { "ticks": "", "outlinewidth": 0 } } ], "scattercarpet": [ { "type": "scattercarpet", "marker": { "colorbar": { "ticks": "", "outlinewidth": 0 } } } ], "scattermapbox": [ { "type": "scattermapbox", "marker": { "colorbar": { "ticks": "", "outlinewidth": 0 } } } ], "scatterpolargl": [ { "type": "scatterpolargl", "marker": { "colorbar": { "ticks": "", "outlinewidth": 0 } } } ], "scatterternary": [ { "type": "scatterternary", "marker": { "colorbar": { "ticks": "", "outlinewidth": 0 } } } ], "histogram2dcontour": [ { "type": "histogram2dcontour", "colorbar": { "ticks": "", "outlinewidth": 0 }, "autocolorscale": true } ] }, "layout": { "geo": { "bgcolor": "white", "showland": true, "lakecolor": "white", "landcolor": "white", "showlakes": true, "subunitcolor": "#C8D4E3" }, "font": { "color": "#2a3f5f" }, "polar": { "bgcolor": "white", "radialaxis": { "ticks": "", "gridcolor": "#EBF0F8", "linecolor": "#EBF0F8" }, "angularaxis": { "ticks": "", "gridcolor": "#EBF0F8", "linecolor": "#EBF0F8" } }, "scene": { "xaxis": { "ticks": "", "gridcolor": "#DFE8F3", "gridwidth": 2, "linecolor": "#EBF0F8", "zerolinecolor": "#EBF0F8", "showbackground": true, "backgroundcolor": "white" }, "yaxis": { "ticks": "", "gridcolor": "#DFE8F3", "gridwidth": 2, "linecolor": "#EBF0F8", "zerolinecolor": "#EBF0F8", "showbackground": true, "backgroundcolor": "white" }, "zaxis": { "ticks": "", "gridcolor": "#DFE8F3", "gridwidth": 2, "linecolor": "#EBF0F8", "zerolinecolor": "#EBF0F8", "showbackground": true, "backgroundcolor": "white" } }, "title": { "x": 0.05 }, "xaxis": { "ticks": "", "gridcolor": "#EBF0F8", "linecolor": "#EBF0F8", "automargin": true, "zerolinecolor": "#EBF0F8", "zerolinewidth": 2 }, "yaxis": { "ticks": "", "gridcolor": "#EBF0F8", "linecolor": "#EBF0F8", "automargin": true, "zerolinecolor": "#EBF0F8", "zerolinewidth": 2 }, "ternary": { "aaxis": { "ticks": "", "gridcolor": "#DFE8F3", "linecolor": "#A2B1C6" }, "baxis": { "ticks": "", "gridcolor": "#DFE8F3", "linecolor": "#A2B1C6" }, "caxis": { "ticks": "", "gridcolor": "#DFE8F3", "linecolor": "#A2B1C6" }, "bgcolor": "white" }, "colorway": [ "#636efa", "#EF553B", "#00cc96", "#ab63fa", "#19d3f3", "#e763fa", "#fecb52", "#ffa15a", "#ff6692", "#b6e880" ], "hovermode": "closest", "colorscale": { "diverging": [ [ 0, "#8e0152" ], [ 0.1, "#c51b7d" ], [ 0.2, "#de77ae" ], [ 0.3, "#f1b6da" ], [ 0.4, "#fde0ef" ], [ 0.5, "#f7f7f7" ], [ 0.6, "#e6f5d0" ], [ 0.7, "#b8e186" ], [ 0.8, "#7fbc41" ], [ 0.9, "#4d9221" ], [ 1, "#276419" ] ], "sequential": [ [ 0, "#0508b8" ], [ 0.0893854748603352, "#1910d8" ], [ 0.1787709497206704, "#3c19f0" ], [ 0.2681564245810056, "#6b1cfb" ], [ 0.3575418994413408, "#981cfd" ], [ 0.44692737430167595, "#bf1cfd" ], [ 0.5363128491620112, "#dd2bfd" ], [ 0.6256983240223464, "#f246fe" ], [ 0.7150837988826816, "#fc67fd" ], [ 0.8044692737430168, "#fe88fc" ], [ 0.8938547486033519, "#fea5fd" ], [ 0.9832402234636871, "#febefe" ], [ 1, "#fec3fe" ] ], "sequentialminus": [ [ 0, "#0508b8" ], [ 0.0893854748603352, "#1910d8" ], [ 0.1787709497206704, "#3c19f0" ], [ 0.2681564245810056, "#6b1cfb" ], [ 0.3575418994413408, "#981cfd" ], [ 0.44692737430167595, "#bf1cfd" ], [ 0.5363128491620112, "#dd2bfd" ], [ 0.6256983240223464, "#f246fe" ], [ 0.7150837988826816, "#fc67fd" ], [ 0.8044692737430168, "#fe88fc" ], [ 0.8938547486033519, "#fea5fd" ], [ 0.9832402234636871, "#febefe" ], [ 1, "#fec3fe" ] ] }, "plot_bgcolor": "white", "paper_bgcolor": "white", "shapedefaults": { "line": { "width": 0 }, "opacity": 0.4, "fillcolor": "#506784" }, "annotationdefaults": { "arrowhead": 0, "arrowcolor": "#506784", "arrowwidth": 1 } }, "themeRef": "PLOTLY_WHITE" } } }, "height": null, "width": null, "user": { "profile_url": "https://chart-studio.plotly.com/~Ehammel28", "avatar_url": "https://storage.googleapis.com/plotly-prod-profiles/11.jpg", "background_url": "https://storage.googleapis.com/plotly-prod-profiles/bg-1.jpg", "bio": "", "nickname": "", "website": "", "stream_tokens": null, "feature_set_id": null, "csrf_token": null, "date_joined": "2025-09-11 01:32:31", "mapbox_access_tokens": null, "has_password": null, "username": "Ehammel28", "email": null, "is_active": null, "readonly": null, "is_dash_creator": null, "dash_created_count": null, "is_chart_creator": null, "charts_created_count": null } }, { "creation_time": "2025-09-15T19:04:50.855845Z", "comments": { "results": [], "count": 0 }, "parented": true, "embed_url": "https://chart-studio.plotly.com/~charliezhang/1.embed", "fid": "charliezhang:1", "filename": "Plot 1", "filetype": "plot", "img_url": "https://storage.googleapis.com/plotly-prod-images/charliezhang/1/9_UMHTQGB6T1GAI2HGHUZ2Z3UNRMFU4N.png", "image_urls": { "default": "https://storage.googleapis.com/plotly-prod-images/charliezhang/1/2_C3NIGFLILAPNCWUQMDAEY42U5L0JD1.png", "block-thumb": "https://api.plotly.com/v2/files/charliezhang:1/image?image_name=block-thumb", "list-thumb": "https://storage.googleapis.com/plotly-prod-images/charliezhang/1/9_UMHTQGB6T1GAI2HGHUZ2Z3UNRMFU4N.png" }, "api_urls": { "files": "https://api.plotly.com/v2/files/charliezhang:1", "plots": "https://api.plotly.com/v2/plots/charliezhang:1", "parent": "https://api.plotly.com/v2/folders/home?user=charliezhang" }, "owner": "charliezhang", "parent": -1, "preview": "", "referencers": [], "references": [], "title": "", "views": 0, "web_url": "https://chart-studio.plotly.com/~charliezhang/1/", "world_readable": true, "date_modified": "2025-09-15T19:04:50.867Z", "stars": { "results": [], "count": 0 }, "collaborators": { "results": [], "count": 0 }, "subfolder_count": null, "refresh_interval": null, "organize_view_url": "https://chart-studio.plotly.com/~charliezhang/1/", "current_user_permission": "read", "is_theme": null, "is_template": false, "autosize": true, "caption": "", "figure": { "data": [ { "meta": { "columnNames": { "x": "C", "y": "D" } }, "mode": "lines", "type": "scatter", "xsrc": "charliezhang:0:3b5ff3", "ysrc": "charliezhang:0:f4268a" }, { "meta": { "columnNames": { "x": "A", "y": "B" } }, "mode": "lines", "type": "scatter", "xsrc": "charliezhang:0:fe7e93", "ysrc": "charliezhang:0:823a36" } ], "frames": [], "layout": { "title": { "text": "" }, "xaxis": { "type": "linear", "range": [ 0, 16 ], "autorange": true }, "yaxis": { "type": "linear", "range": [ -2.833333333333333, 53.833333333333336 ], "autorange": true }, "autosize": true, "template": { "data": { "bar": [ { "type": "bar", "marker": { "colorbar": { "ticks": "", "outlinewidth": 0 } } } ], "table": [ { "type": "table", "cells": { "fill": { "color": "#EBF0F8" }, "line": { "color": "white" } }, "header": { "fill": { "color": "#C8D4E3" }, "line": { "color": "white" } } } ], "carpet": [ { "type": "carpet", "aaxis": { "gridcolor": "#C8D4E3", "linecolor": "#C8D4E3", "endlinecolor": "#2a3f5f", "minorgridcolor": "#C8D4E3", "startlinecolor": "#2a3f5f" }, "baxis": { "gridcolor": "#C8D4E3", "linecolor": "#C8D4E3", "endlinecolor": "#2a3f5f", "minorgridcolor": "#C8D4E3", "startlinecolor": "#2a3f5f" } } ], "mesh3d": [ { "type": "mesh3d", "colorbar": { "ticks": "", "outlinewidth": 0 } } ], "contour": [ { "type": "contour", "colorbar": { "ticks": "", "outlinewidth": 0 }, "autocolorscale": true } ], "heatmap": [ { "type": "heatmap", "colorbar": { "ticks": "", "outlinewidth": 0 }, "autocolorscale": true } ], "scatter": [ { "type": "scatter", "marker": { "colorbar": { "ticks": "", "outlinewidth": 0 } } } ], "surface": [ { "type": "surface", "colorbar": { "ticks": "", "outlinewidth": 0 } } ], "heatmapgl": [ { "type": "heatmapgl", "colorbar": { "ticks": "", "outlinewidth": 0 } } ], "histogram": [ { "type": "histogram", "marker": { "colorbar": { "ticks": "", "outlinewidth": 0 } } } ], "parcoords": [ { "line": { "colorbar": { "ticks": "", "outlinewidth": 0 } }, "type": "parcoords" } ], "scatter3d": [ { "type": "scatter3d", "marker": { "colorbar": { "ticks": "", "outlinewidth": 0 } } } ], "scattergl": [ { "type": "scattergl", "marker": { "colorbar": { "ticks": "", "outlinewidth": 0 } } } ], "choropleth": [ { "type": "choropleth", "colorbar": { "ticks": "", "outlinewidth": 0 } } ], "scattergeo": [ { "type": "scattergeo", "marker": { "colorbar": { "ticks": "", "outlinewidth": 0 } } } ], "histogram2d": [ { "type": "histogram2d", "colorbar": { "ticks": "", "outlinewidth": 0 }, "autocolorscale": true } ], "scatterpolar": [ { "type": "scatterpolar", "marker": { "colorbar": { "ticks": "", "outlinewidth": 0 } } } ], "contourcarpet": [ { "type": "contourcarpet", "colorbar": { "ticks": "", "outlinewidth": 0 } } ], "scattercarpet": [ { "type": "scattercarpet", "marker": { "colorbar": { "ticks": "", "outlinewidth": 0 } } } ], "scattermapbox": [ { "type": "scattermapbox", "marker": { "colorbar": { "ticks": "", "outlinewidth": 0 } } } ], "scatterpolargl": [ { "type": "scatterpolargl", "marker": { "colorbar": { "ticks": "", "outlinewidth": 0 } } } ], "scatterternary": [ { "type": "scatterternary", "marker": { "colorbar": { "ticks": "", "outlinewidth": 0 } } } ], "histogram2dcontour": [ { "type": "histogram2dcontour", "colorbar": { "ticks": "", "outlinewidth": 0 }, "autocolorscale": true } ] }, "layout": { "geo": { "bgcolor": "white", "showland": true, "lakecolor": "white", "landcolor": "white", "showlakes": true, "subunitcolor": "#C8D4E3" }, "font": { "color": "#2a3f5f" }, "polar": { "bgcolor": "white", "radialaxis": { "ticks": "", "gridcolor": "#EBF0F8", "linecolor": "#EBF0F8" }, "angularaxis": { "ticks": "", "gridcolor": "#EBF0F8", "linecolor": "#EBF0F8" } }, "scene": { "xaxis": { "ticks": "", "gridcolor": "#DFE8F3", "gridwidth": 2, "linecolor": "#EBF0F8", "zerolinecolor": "#EBF0F8", "showbackground": true, "backgroundcolor": "white" }, "yaxis": { "ticks": "", "gridcolor": "#DFE8F3", "gridwidth": 2, "linecolor": "#EBF0F8", "zerolinecolor": "#EBF0F8", "showbackground": true, "backgroundcolor": "white" }, "zaxis": { "ticks": "", "gridcolor": "#DFE8F3", "gridwidth": 2, "linecolor": "#EBF0F8", "zerolinecolor": "#EBF0F8", "showbackground": true, "backgroundcolor": "white" } }, "title": { "x": 0.05 }, "xaxis": { "ticks": "", "gridcolor": "#EBF0F8", "linecolor": "#EBF0F8", "automargin": true, "zerolinecolor": "#EBF0F8", "zerolinewidth": 2 }, "yaxis": { "ticks": "", "gridcolor": "#EBF0F8", "linecolor": "#EBF0F8", "automargin": true, "zerolinecolor": "#EBF0F8", "zerolinewidth": 2 }, "ternary": { "aaxis": { "ticks": "", "gridcolor": "#DFE8F3", "linecolor": "#A2B1C6" }, "baxis": { "ticks": "", "gridcolor": "#DFE8F3", "linecolor": "#A2B1C6" }, "caxis": { "ticks": "", "gridcolor": "#DFE8F3", "linecolor": "#A2B1C6" }, "bgcolor": "white" }, "colorway": [ "#636efa", "#EF553B", "#00cc96", "#ab63fa", "#19d3f3", "#e763fa", "#fecb52", "#ffa15a", "#ff6692", "#b6e880" ], "hovermode": "closest", "colorscale": { "diverging": [ [ 0, "#8e0152" ], [ 0.1, "#c51b7d" ], [ 0.2, "#de77ae" ], [ 0.3, "#f1b6da" ], [ 0.4, "#fde0ef" ], [ 0.5, "#f7f7f7" ], [ 0.6, "#e6f5d0" ], [ 0.7, "#b8e186" ], [ 0.8, "#7fbc41" ], [ 0.9, "#4d9221" ], [ 1, "#276419" ] ], "sequential": [ [ 0, "#0508b8" ], [ 0.0893854748603352, "#1910d8" ], [ 0.1787709497206704, "#3c19f0" ], [ 0.2681564245810056, "#6b1cfb" ], [ 0.3575418994413408, "#981cfd" ], [ 0.44692737430167595, "#bf1cfd" ], [ 0.5363128491620112, "#dd2bfd" ], [ 0.6256983240223464, "#f246fe" ], [ 0.7150837988826816, "#fc67fd" ], [ 0.8044692737430168, "#fe88fc" ], [ 0.8938547486033519, "#fea5fd" ], [ 0.9832402234636871, "#febefe" ], [ 1, "#fec3fe" ] ], "sequentialminus": [ [ 0, "#0508b8" ], [ 0.0893854748603352, "#1910d8" ], [ 0.1787709497206704, "#3c19f0" ], [ 0.2681564245810056, "#6b1cfb" ], [ 0.3575418994413408, "#981cfd" ], [ 0.44692737430167595, "#bf1cfd" ], [ 0.5363128491620112, "#dd2bfd" ], [ 0.6256983240223464, "#f246fe" ], [ 0.7150837988826816, "#fc67fd" ], [ 0.8044692737430168, "#fe88fc" ], [ 0.8938547486033519, "#fea5fd" ], [ 0.9832402234636871, "#febefe" ], [ 1, "#fec3fe" ] ] }, "plot_bgcolor": "white", "paper_bgcolor": "white", "shapedefaults": { "line": { "width": 0 }, "opacity": 0.4, "fillcolor": "#506784" }, "annotationdefaults": { "arrowhead": 0, "arrowcolor": "#506784", "arrowwidth": 1 } }, "themeRef": "PLOTLY_WHITE" } } }, "height": null, "width": null, "user": { "profile_url": "https://chart-studio.plotly.com/~charliezhang", "avatar_url": "https://storage.googleapis.com/plotly-prod-profiles/60.jpg", "background_url": "https://storage.googleapis.com/plotly-prod-profiles/bg-5.jpg", "bio": "", "nickname": "", "website": "", "stream_tokens": null, "feature_set_id": null, "csrf_token": null, "date_joined": "2025-09-10 02:14:31", "mapbox_access_tokens": null, "has_password": null, "username": "charliezhang", "email": null, "is_active": null, "readonly": null, "is_dash_creator": null, "dash_created_count": null, "is_chart_creator": null, "charts_created_count": null } }, { "creation_time": "2025-09-15T19:04:11.077872Z", "comments": { "results": [], "count": 0 }, "parented": true, "embed_url": "https://chart-studio.plotly.com/~Susan_Wang/1.embed", "fid": "Susan_Wang:1", "filename": "Plot 1", "filetype": "plot", "img_url": "https://api.plotly.com/v2/files/Susan_Wang:1/image?image_name=list-thumb", "image_urls": { "default": "https://storage.googleapis.com/plotly-prod-images/Susan_Wang/1/2_LV1KKQCV09B230XM3KC11WDLIKQN2S.png", "block-thumb": "https://storage.googleapis.com/plotly-prod-images/Susan_Wang/1/8_UCWE964LTP06ULTINESI78YBJKKBBC.png", "list-thumb": "https://api.plotly.com/v2/files/Susan_Wang:1/image?image_name=list-thumb" }, "api_urls": { "files": "https://api.plotly.com/v2/files/Susan_Wang:1", "plots": "https://api.plotly.com/v2/plots/Susan_Wang:1", "parent": "https://api.plotly.com/v2/folders/home?user=Susan_Wang" }, "owner": "Susan_Wang", "parent": -1, "preview": "", "referencers": [], "references": [], "title": "", "views": 0, "web_url": "https://chart-studio.plotly.com/~Susan_Wang/1/", "world_readable": true, "date_modified": "2025-09-15T19:04:11.094Z", "stars": { "results": [], "count": 0 }, "collaborators": { "results": [], "count": 0 }, "subfolder_count": null, "refresh_interval": null, "organize_view_url": "https://chart-studio.plotly.com/~Susan_Wang/1/", "current_user_permission": "read", "is_theme": null, "is_template": false, "autosize": true, "caption": "", "figure": { "data": [ { "meta": { "columnNames": { "x": "A", "y": "B" } }, "mode": "lines", "type": "scatter", "xsrc": "Susan_Wang:0:eb779e", "ysrc": "Susan_Wang:0:8e9417" } ], "frames": [], "layout": { "xaxis": { "type": "linear", "range": [ 5, 10 ], "autorange": true }, "yaxis": { "type": "linear", "range": [ 9.444444444444445, 20.555555555555557 ], "autorange": true }, "autosize": true, "template": { "data": { "bar": [ { "type": "bar", "marker": { "colorbar": { "ticks": "", "outlinewidth": 0 } } } ], "table": [ { "type": "table", "cells": { "fill": { "color": "#EBF0F8" }, "line": { "color": "white" } }, "header": { "fill": { "color": "#C8D4E3" }, "line": { "color": "white" } } } ], "carpet": [ { "type": "carpet", "aaxis": { "gridcolor": "#C8D4E3", "linecolor": "#C8D4E3", "endlinecolor": "#2a3f5f", "minorgridcolor": "#C8D4E3", "startlinecolor": "#2a3f5f" }, "baxis": { "gridcolor": "#C8D4E3", "linecolor": "#C8D4E3", "endlinecolor": "#2a3f5f", "minorgridcolor": "#C8D4E3", "startlinecolor": "#2a3f5f" } } ], "mesh3d": [ { "type": "mesh3d", "colorbar": { "ticks": "", "outlinewidth": 0 } } ], "contour": [ { "type": "contour", "colorbar": { "ticks": "", "outlinewidth": 0 }, "autocolorscale": true } ], "heatmap": [ { "type": "heatmap", "colorbar": { "ticks": "", "outlinewidth": 0 }, "autocolorscale": true } ], "scatter": [ { "type": "scatter", "marker": { "colorbar": { "ticks": "", "outlinewidth": 0 } } } ], "surface": [ { "type": "surface", "colorbar": { "ticks": "", "outlinewidth": 0 } } ], "heatmapgl": [ { "type": "heatmapgl", "colorbar": { "ticks": "", "outlinewidth": 0 } } ], "histogram": [ { "type": "histogram", "marker": { "colorbar": { "ticks": "", "outlinewidth": 0 } } } ], "parcoords": [ { "line": { "colorbar": { "ticks": "", "outlinewidth": 0 } }, "type": "parcoords" } ], "scatter3d": [ { "type": "scatter3d", "marker": { "colorbar": { "ticks": "", "outlinewidth": 0 } } } ], "scattergl": [ { "type": "scattergl", "marker": { "colorbar": { "ticks": "", "outlinewidth": 0 } } } ], "choropleth": [ { "type": "choropleth", "colorbar": { "ticks": "", "outlinewidth": 0 } } ], "scattergeo": [ { "type": "scattergeo", "marker": { "colorbar": { "ticks": "", "outlinewidth": 0 } } } ], "histogram2d": [ { "type": "histogram2d", "colorbar": { "ticks": "", "outlinewidth": 0 }, "autocolorscale": true } ], "scatterpolar": [ { "type": "scatterpolar", "marker": { "colorbar": { "ticks": "", "outlinewidth": 0 } } } ], "contourcarpet": [ { "type": "contourcarpet", "colorbar": { "ticks": "", "outlinewidth": 0 } } ], "scattercarpet": [ { "type": "scattercarpet", "marker": { "colorbar": { "ticks": "", "outlinewidth": 0 } } } ], "scattermapbox": [ { "type": "scattermapbox", "marker": { "colorbar": { "ticks": "", "outlinewidth": 0 } } } ], "scatterpolargl": [ { "type": "scatterpolargl", "marker": { "colorbar": { "ticks": "", "outlinewidth": 0 } } } ], "scatterternary": [ { "type": "scatterternary", "marker": { "colorbar": { "ticks": "", "outlinewidth": 0 } } } ], "histogram2dcontour": [ { "type": "histogram2dcontour", "colorbar": { "ticks": "", "outlinewidth": 0 }, "autocolorscale": true } ] }, "layout": { "geo": { "bgcolor": "white", "showland": true, "lakecolor": "white", "landcolor": "white", "showlakes": true, "subunitcolor": "#C8D4E3" }, "font": { "color": "#2a3f5f" }, "polar": { "bgcolor": "white", "radialaxis": { "ticks": "", "gridcolor": "#EBF0F8", "linecolor": "#EBF0F8" }, "angularaxis": { "ticks": "", "gridcolor": "#EBF0F8", "linecolor": "#EBF0F8" } }, "scene": { "xaxis": { "ticks": "", "gridcolor": "#DFE8F3", "gridwidth": 2, "linecolor": "#EBF0F8", "zerolinecolor": "#EBF0F8", "showbackground": true, "backgroundcolor": "white" }, "yaxis": { "ticks": "", "gridcolor": "#DFE8F3", "gridwidth": 2, "linecolor": "#EBF0F8", "zerolinecolor": "#EBF0F8", "showbackground": true, "backgroundcolor": "white" }, "zaxis": { "ticks": "", "gridcolor": "#DFE8F3", "gridwidth": 2, "linecolor": "#EBF0F8", "zerolinecolor": "#EBF0F8", "showbackground": true, "backgroundcolor": "white" } }, "title": { "x": 0.05 }, "xaxis": { "ticks": "", "gridcolor": "#EBF0F8", "linecolor": "#EBF0F8", "automargin": true, "zerolinecolor": "#EBF0F8", "zerolinewidth": 2 }, "yaxis": { "ticks": "", "gridcolor": "#EBF0F8", "linecolor": "#EBF0F8", "automargin": true, "zerolinecolor": "#EBF0F8", "zerolinewidth": 2 }, "ternary": { "aaxis": { "ticks": "", "gridcolor": "#DFE8F3", "linecolor": "#A2B1C6" }, "baxis": { "ticks": "", "gridcolor": "#DFE8F3", "linecolor": "#A2B1C6" }, "caxis": { "ticks": "", "gridcolor": "#DFE8F3", "linecolor": "#A2B1C6" }, "bgcolor": "white" }, "colorway": [ "#636efa", "#EF553B", "#00cc96", "#ab63fa", "#19d3f3", "#e763fa", "#fecb52", "#ffa15a", "#ff6692", "#b6e880" ], "hovermode": "closest", "colorscale": { "diverging": [ [ 0, "#8e0152" ], [ 0.1, "#c51b7d" ], [ 0.2, "#de77ae" ], [ 0.3, "#f1b6da" ], [ 0.4, "#fde0ef" ], [ 0.5, "#f7f7f7" ], [ 0.6, "#e6f5d0" ], [ 0.7, "#b8e186" ], [ 0.8, "#7fbc41" ], [ 0.9, "#4d9221" ], [ 1, "#276419" ] ], "sequential": [ [ 0, "#0508b8" ], [ 0.0893854748603352, "#1910d8" ], [ 0.1787709497206704, "#3c19f0" ], [ 0.2681564245810056, "#6b1cfb" ], [ 0.3575418994413408, "#981cfd" ], [ 0.44692737430167595, "#bf1cfd" ], [ 0.5363128491620112, "#dd2bfd" ], [ 0.6256983240223464, "#f246fe" ], [ 0.7150837988826816, "#fc67fd" ], [ 0.8044692737430168, "#fe88fc" ], [ 0.8938547486033519, "#fea5fd" ], [ 0.9832402234636871, "#febefe" ], [ 1, "#fec3fe" ] ], "sequentialminus": [ [ 0, "#0508b8" ], [ 0.0893854748603352, "#1910d8" ], [ 0.1787709497206704, "#3c19f0" ], [ 0.2681564245810056, "#6b1cfb" ], [ 0.3575418994413408, "#981cfd" ], [ 0.44692737430167595, "#bf1cfd" ], [ 0.5363128491620112, "#dd2bfd" ], [ 0.6256983240223464, "#f246fe" ], [ 0.7150837988826816, "#fc67fd" ], [ 0.8044692737430168, "#fe88fc" ], [ 0.8938547486033519, "#fea5fd" ], [ 0.9832402234636871, "#febefe" ], [ 1, "#fec3fe" ] ] }, "plot_bgcolor": "white", "paper_bgcolor": "white", "shapedefaults": { "line": { "width": 0 }, "opacity": 0.4, "fillcolor": "#506784" }, "annotationdefaults": { "arrowhead": 0, "arrowcolor": "#506784", "arrowwidth": 1 } }, "themeRef": "PLOTLY_WHITE" } } }, "height": null, "width": null, "user": { "profile_url": "https://chart-studio.plotly.com/~Susan_Wang", "avatar_url": "https://storage.googleapis.com/plotly-prod-profiles/41.jpg", "background_url": "https://storage.googleapis.com/plotly-prod-profiles/bg-13.jpg", "bio": "", "nickname": "", "website": "", "stream_tokens": null, "feature_set_id": null, "csrf_token": null, "date_joined": "2025-09-10 22:37:38", "mapbox_access_tokens": null, "has_password": null, "username": "Susan_Wang", "email": null, "is_active": null, "readonly": null, "is_dash_creator": null, "dash_created_count": null, "is_chart_creator": null, "charts_created_count": null } } ] }
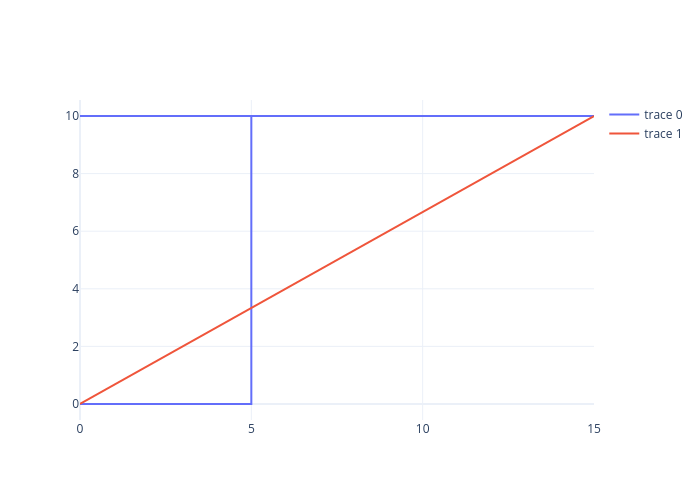
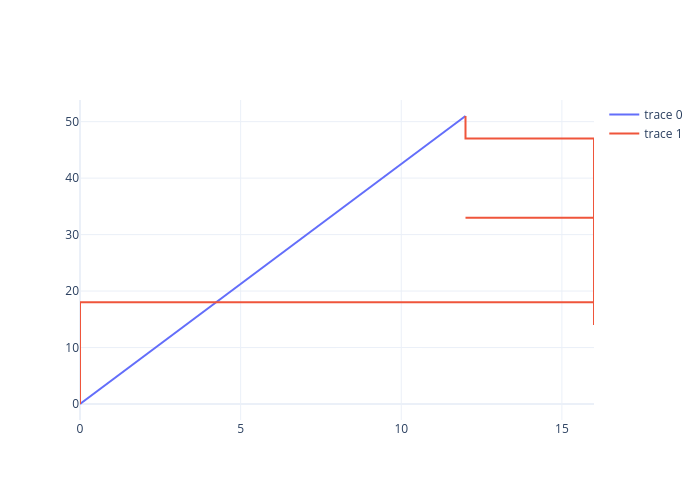