Plots List
Plots
This endpoint handles manipulation of Plotly plot files.
Reference
Authorization
Any user with or without a Plotly account may view public plots. For private plots, see authentication.
Actions
list
Listing all public plots can be done via a GET request to this endpoint.
By default, plots will be listed in order of date created. The order_by
query parameter is accepted at this endpoint. Currently, only ordering by
views is supported. It is possible to filter the plots by quality
with min_quality or max_quality as query parameter.
Example:
// GET https://api.plotly.com/v2/plots/ ---> 200

// GET https://api.plotly.com/v2/plots/?order_by=-views ---> 200

// GET https://api.plotly.com/v2/plots/?min_quality=5 ---> 200

// GET https://api.plotly.com/v2/plots/?max_quality=5 ---> 200
feed
Listing all handpicked feed plots can be done via a GET request to this endpoint. By default, plots will be listed in a random order.
Example:
// GET https://api.plotly.com/v2/plots/feed ---> 200
create
You can create new plot resources here. The only required field is 'figure'. Currently, the figure is restricted to only contain references to grid data. That is, this will fail if raw data arrays are passed in. To create and manipulate underlying grids for plots, see the grids endpoint.
Example:
// This fails because a figure field is required.
// POST https://api.plotly.com/v2/plots ---> 400 Bad Request
{}

// This fails because the figure has raw data
//POST https://api.plotly.com/v2/plots ---> 400 Bad Request
{
    "figure": {"data": [{"y": ['this', 'is', 'raw', 'data']}]}
}

// This succeeds because the figure has src keys, not raw data.
//POST https://api.plotly.com/v2/plots ---> 200 OK
{
    "figure": {"data": [{"ysrc": "sven:88:u8nd62"}]}
}
When creating a grid, you can optionally specify a source_fid to specify where a plot has come from:
- source_fid: the fid of a plot that was copied (and presumably edited) to produce this one
detail
There is a lot of meta information stored about plot files including filename, title, share_url, and content_url to name a few.
This information can only be reached with a GET to this endpoint.
Example:
// GET https://api.plotly.com/v2/plots/iheartgraphs:90
content
The contents of a plot can be downloaded via the content resource. The plot
content contains referenced grid/column data by default. If you wish to
return the raw grid/column data, the inline_data=true query must be included
in the request url. The Content-Type header will be appropriately set for the
response body.
Alternatively, you can set ?map_data=unreadable to append a mapping of
sources to data that belongs to grids which are unreadable for the
requestor. This is useful when you have read access to another users plot,
but that plot contains grid references which you don't have access to.
Examples:
// Returns referenced grid/column data
// GET https://api.plotly.com/v2/plots/iheartgraphs:90/content ---> 200 OK

// Returns full grid/column data
// GET https://api.plotly.com/v2/plots/iheartgraphs:90/content?inline_data=true ---> 200 OK

// Returns full grid/column data when requestor doesn't have permission
// to read the referenced grid.
// GET https://api.plotly.com/v2/plots/iheartgraphs:90/content?map_data=unreadable ---> 200 OK
GET /v2/plots/?cursor=cj0xJnA9MjAyNS0wOS0xNiswNCUzQTM2JTNBMTAuNTk0MDY1JTJCMDAlM0EwMA%3D%3D&format=api
{ "next": "https://api.plotly.com/v2/plots/?cursor=cD0yMDI1LTA5LTE2KzA0JTNBMzYlM0ExMi4zNTgwNzclMkIwMCUzQTAw&format=api", "previous": "https://api.plotly.com/v2/plots/?cursor=cj0xJnA9MjAyNS0wOS0xNiswNCUzQTM4JTNBMTAuNzU1MzkzJTJCMDAlM0EwMA%3D%3D&format=api", "results": [ { "creation_time": "2025-09-16T04:38:10.755393Z", "comments": { "results": [], "count": 0 }, "parented": true, "embed_url": "https://chart-studio.plotly.com/~hackathon_test/90.embed", "fid": "hackathon_test:90", "filename": "infracost-graph-table-1757997484", "filetype": "plot", "img_url": "https://api.plotly.com/v2/files/hackathon_test:90/image?image_name=list-thumb", "image_urls": { "default": "https://storage.googleapis.com/plotly-prod-images/hackathon_test/90/2_LXAGJ2RE3640YS6UFG5VLX4FFPEDTY.png", "block-thumb": "https://api.plotly.com/v2/files/hackathon_test:90/image?image_name=block-thumb", "list-thumb": "https://api.plotly.com/v2/files/hackathon_test:90/image?image_name=list-thumb" }, "api_urls": { "files": "https://api.plotly.com/v2/files/hackathon_test:90", "plots": "https://api.plotly.com/v2/plots/hackathon_test:90", "parent": "https://api.plotly.com/v2/folders/home?user=hackathon_test" }, "owner": "hackathon_test", "parent": -1, "preview": "", "referencers": [], "references": [], "title": "", "views": 0, "web_url": "https://chart-studio.plotly.com/~hackathon_test/90/", "world_readable": true, "date_modified": "2025-09-16T04:38:10.765Z", "stars": { "results": [], "count": 0 }, "collaborators": { "results": [], "count": 0 }, "subfolder_count": null, "refresh_interval": null, "organize_view_url": "https://chart-studio.plotly.com/~hackathon_test/90/", "current_user_permission": "read", "is_theme": null, "is_template": null, "autosize": true, "caption": "", "figure": { "data": [ { "name": "aws_lb.hack_lb", "type": "bar", "xsrc": "hackathon_test:89:c909ff", "ysrc": "hackathon_test:89:abd795", "xaxis": "x", "yaxis": "y", "marker": { "color": "rgb(229, 134, 6)", "pattern": { "shape": "" } }, "showlegend": true, "legendgroup": "aws_lb.hack_lb", "offsetgroup": "aws_lb.hack_lb", "orientation": "v", "textposition": "auto", "hovertemplate": "Resource=%{x}<br>Monthly Cost ($)=%{y}<extra></extra>", "alignmentgroup": "True" }, { "name": "aws_db_instance.hack_db", "type": "bar", "xsrc": "hackathon_test:89:d5427b", "ysrc": "hackathon_test:89:573505", "xaxis": "x", "yaxis": "y", "marker": { "color": "rgb(93, 105, 177)", "pattern": { "shape": "" } }, "showlegend": true, "legendgroup": "aws_db_instance.hack_db", "offsetgroup": "aws_db_instance.hack_db", "orientation": "v", "textposition": "auto", "hovertemplate": "Resource=%{x}<br>Monthly Cost ($)=%{y}<extra></extra>", "alignmentgroup": "True" }, { "name": "aws_instance.hack_vm", "type": "bar", "xsrc": "hackathon_test:89:84cf15", "ysrc": "hackathon_test:89:0277b7", "xaxis": "x", "yaxis": "y", "marker": { "color": "rgb(82, 188, 163)", "pattern": { "shape": "" } }, "showlegend": true, "legendgroup": "aws_instance.hack_vm", "offsetgroup": "aws_instance.hack_vm", "orientation": "v", "textposition": "auto", "hovertemplate": "Resource=%{x}<br>Monthly Cost ($)=%{y}<extra></extra>", "alignmentgroup": "True" }, { "name": "aws_instance.hack_vm2", "type": "bar", "xsrc": "hackathon_test:89:0fa5d2", "ysrc": "hackathon_test:89:8f4734", "xaxis": "x", "yaxis": "y", "marker": { "color": "rgb(153, 201, 69)", "pattern": { "shape": "" } }, "showlegend": true, "legendgroup": "aws_instance.hack_vm2", "offsetgroup": "aws_instance.hack_vm2", "orientation": "v", "textposition": "auto", "hovertemplate": "Resource=%{x}<br>Monthly Cost ($)=%{y}<extra></extra>", "alignmentgroup": "True" }, { "name": "aws_ebs_volume.hack_volume", "type": "bar", "xsrc": "hackathon_test:89:2adc26", "ysrc": "hackathon_test:89:d68097", "xaxis": "x", "yaxis": "y", "marker": { "color": "rgb(204, 97, 176)", "pattern": { "shape": "" } }, "showlegend": true, "legendgroup": "aws_ebs_volume.hack_volume", "offsetgroup": "aws_ebs_volume.hack_volume", "orientation": "v", "textposition": "auto", "hovertemplate": "Resource=%{x}<br>Monthly Cost ($)=%{y}<extra></extra>", "alignmentgroup": "True" }, { "type": "table", "cells": { "fill": { "colorsrc": "hackathon_test:89:6fa000" }, "font": { "size": 11 }, "align": "center", "valuessrc": "hackathon_test:89:95a529" }, "domain": { "x": [ 0.0, 1.0 ], "y": [ 0.0, 0.2976 ] }, "header": { "fill": { "color": "lightgrey" }, "font": { "size": 12, "color": "black" }, "align": "center", "valuessrc": "hackathon_test:89:05b6a6" } } ], "layout": { "title": { "text": "Monthly Infracost Breakdown per Resource" }, "width": 1200, "xaxis": { "anchor": "y", "domain": [ 0.0, 1.0 ] }, "yaxis": { "anchor": "x", "domain": [ 0.3676, 1.0 ] }, "height": 900, "template": { "data": { "table": [ { "type": "table", "cells": { "fill": { "color": "#000038" }, "font": { "color": "#000037" }, "line": { "color": "#000039" } }, "header": { "fill": { "color": "#000040" }, "font": { "color": "#000036" }, "line": { "color": "#000039" } } } ], "icicle": [ { "type": "icicle", "textfont": { "color": "white" } } ], "sankey": [ { "type": "sankey", "textfont": { "color": "#000036" } } ], "contour": [ { "type": "contour", "colorscale": [ [ 0.0, "#000011" ], [ 0.1111111111111111, "#000012" ], [ 0.2222222222222222, "#000013" ], [ 0.3333333333333333, "#000014" ], [ 0.4444444444444444, "#000015" ], [ 0.5555555555555556, "#000016" ], [ 0.6666666666666666, "#000017" ], [ 0.7777777777777778, "#000018" ], [ 0.8888888888888888, "#000019" ], [ 1.0, "#000020" ] ] } ], "heatmap": [ { "type": "heatmap", "colorscale": [ [ 0.0, "#000011" ], [ 0.1111111111111111, "#000012" ], [ 0.2222222222222222, "#000013" ], [ 0.3333333333333333, "#000014" ], [ 0.4444444444444444, "#000015" ], [ 0.5555555555555556, "#000016" ], [ 0.6666666666666666, "#000017" ], [ 0.7777777777777778, "#000018" ], [ 0.8888888888888888, "#000019" ], [ 1.0, "#000020" ] ] } ], "scatter": [ { "type": "scatter", "marker": { "line": { "width": 0 } } } ], "waterfall": [ { "type": "waterfall", "totals": { "marker": { "color": "#000034" } }, "connector": { "line": { "color": "#000036", "width": 2 } }, "decreasing": { "marker": { "color": "#000033" } }, "increasing": { "marker": { "color": "#000032" } } } ], "candlestick": [ { "type": "candlestick", "decreasing": { "line": { "color": "#000033" } }, "increasing": { "line": { "color": "#000032" } } } ], "histogram2d": [ { "type": "histogram2d", "colorscale": [ [ 0.0, "#000011" ], [ 0.1111111111111111, "#000012" ], [ 0.2222222222222222, "#000013" ], [ 0.3333333333333333, "#000014" ], [ 0.4444444444444444, "#000015" ], [ 0.5555555555555556, "#000016" ], [ 0.6666666666666666, "#000017" ], [ 0.7777777777777778, "#000018" ], [ 0.8888888888888888, "#000019" ], [ 1.0, "#000020" ] ] } ], "contourcarpet": [ { "type": "contourcarpet", "colorscale": [ [ 0.0, "#000011" ], [ 0.1111111111111111, "#000012" ], [ 0.2222222222222222, "#000013" ], [ 0.3333333333333333, "#000014" ], [ 0.4444444444444444, "#000015" ], [ 0.5555555555555556, "#000016" ], [ 0.6666666666666666, "#000017" ], [ 0.7777777777777778, "#000018" ], [ 0.8888888888888888, "#000019" ], [ 1.0, "#000020" ] ] } ] }, "layout": { "colorway": [ "#000001", "#000002", "#000003", "#000004", "#000005", "#000006", "#000007", "#000008", "#000009", "#000010" ], "coloraxis": { "colorscale": [ [ 0.0, "#000011" ], [ 0.1111111111111111, "#000012" ], [ 0.2222222222222222, "#000013" ], [ 0.3333333333333333, "#000014" ], [ 0.4444444444444444, "#000015" ], [ 0.5555555555555556, "#000016" ], [ 0.6666666666666666, "#000017" ], [ 0.7777777777777778, "#000018" ], [ 0.8888888888888888, "#000019" ], [ 1.0, "#000020" ] ] }, "colorscale": { "diverging": [ [ 0.0, "#000021" ], [ 0.1, "#000022" ], [ 0.2, "#000023" ], [ 0.3, "#000024" ], [ 0.4, "#000025" ], [ 0.5, "#000026" ], [ 0.6, "#000027" ], [ 0.7, "#000028" ], [ 0.8, "#000029" ], [ 0.9, "#000030" ], [ 1.0, "#000031" ] ], "sequential": [ [ 0.0, "#000011" ], [ 0.1111111111111111, "#000012" ], [ 0.2222222222222222, "#000013" ], [ 0.3333333333333333, "#000014" ], [ 0.4444444444444444, "#000015" ], [ 0.5555555555555556, "#000016" ], [ 0.6666666666666666, "#000017" ], [ 0.7777777777777778, "#000018" ], [ 0.8888888888888888, "#000019" ], [ 1.0, "#000020" ] ], "sequentialminus": [ [ 0.0, "#000011" ], [ 0.1111111111111111, "#000012" ], [ 0.2222222222222222, "#000013" ], [ 0.3333333333333333, "#000014" ], [ 0.4444444444444444, "#000015" ], [ 0.5555555555555556, "#000016" ], [ 0.6666666666666666, "#000017" ], [ 0.7777777777777778, "#000018" ], [ 0.8888888888888888, "#000019" ], [ 1.0, "#000020" ] ] } } }, "plot_bgcolor": "rgba(245,245,245,1)", "paper_bgcolor": "rgba(245,245,245,1)" } }, "height": 900, "width": 1200, "user": { "profile_url": "https://chart-studio.plotly.com/~hackathon_test", "avatar_url": "https://storage.googleapis.com/plotly-prod-profiles/21.jpg", "background_url": "https://storage.googleapis.com/plotly-prod-profiles/bg-7.jpg", "bio": "", "nickname": "", "website": "", "stream_tokens": null, "feature_set_id": null, "csrf_token": null, "date_joined": "2025-09-16 02:59:33", "mapbox_access_tokens": null, "has_password": null, "username": "hackathon_test", "email": null, "is_active": null, "readonly": null, "is_dash_creator": null, "dash_created_count": null, "is_chart_creator": null, "charts_created_count": null } }, { "creation_time": "2025-09-16T04:37:05.630142Z", "comments": { "results": [], "count": 0 }, "parented": true, "embed_url": "https://chart-studio.plotly.com/~hackathon_test/88.embed", "fid": "hackathon_test:88", "filename": "infracost-graph-table-1757997419", "filetype": "plot", "img_url": "https://storage.googleapis.com/plotly-prod-images/hackathon_test/88/9_5V4483HF7P9S85DYVJ2B5Y15FBSBKQ.png", "image_urls": { "default": "https://storage.googleapis.com/plotly-prod-images/hackathon_test/88/2_133IQAP7L480OLBYGDJCGT2G202O3M.png", "block-thumb": "https://storage.googleapis.com/plotly-prod-images/hackathon_test/88/8_9YYQ8EP66RHWYJV75Q3FD88PSSME1C.png", "list-thumb": "https://storage.googleapis.com/plotly-prod-images/hackathon_test/88/9_5V4483HF7P9S85DYVJ2B5Y15FBSBKQ.png" }, "api_urls": { "files": "https://api.plotly.com/v2/files/hackathon_test:88", "plots": "https://api.plotly.com/v2/plots/hackathon_test:88", "parent": "https://api.plotly.com/v2/folders/home?user=hackathon_test" }, "owner": "hackathon_test", "parent": -1, "preview": "", "referencers": [], "references": [], "title": "", "views": 0, "web_url": "https://chart-studio.plotly.com/~hackathon_test/88/", "world_readable": true, "date_modified": "2025-09-16T04:37:05.641Z", "stars": { "results": [], "count": 0 }, "collaborators": { "results": [], "count": 0 }, "subfolder_count": null, "refresh_interval": null, "organize_view_url": "https://chart-studio.plotly.com/~hackathon_test/88/", "current_user_permission": "read", "is_theme": null, "is_template": null, "autosize": true, "caption": "", "figure": { "data": [ { "name": "aws_lb.hack_lb", "type": "bar", "xsrc": "hackathon_test:84:3e1201", "ysrc": "hackathon_test:84:3b73f3", "xaxis": "x", "yaxis": "y", "marker": { "color": "rgb(229, 134, 6)", "pattern": { "shape": "" } }, "showlegend": true, "legendgroup": "aws_lb.hack_lb", "offsetgroup": "aws_lb.hack_lb", "orientation": "v", "textposition": "auto", "hovertemplate": "Resource=%{x}<br>Monthly Cost ($)=%{y}<extra></extra>", "alignmentgroup": "True" }, { "name": "aws_db_instance.hack_db", "type": "bar", "xsrc": "hackathon_test:84:7d2a1b", "ysrc": "hackathon_test:84:4d6465", "xaxis": "x", "yaxis": "y", "marker": { "color": "rgb(93, 105, 177)", "pattern": { "shape": "" } }, "showlegend": true, "legendgroup": "aws_db_instance.hack_db", "offsetgroup": "aws_db_instance.hack_db", "orientation": "v", "textposition": "auto", "hovertemplate": "Resource=%{x}<br>Monthly Cost ($)=%{y}<extra></extra>", "alignmentgroup": "True" }, { "name": "aws_instance.hack_vm", "type": "bar", "xsrc": "hackathon_test:84:7a3d08", "ysrc": "hackathon_test:84:dd0143", "xaxis": "x", "yaxis": "y", "marker": { "color": "rgb(82, 188, 163)", "pattern": { "shape": "" } }, "showlegend": true, "legendgroup": "aws_instance.hack_vm", "offsetgroup": "aws_instance.hack_vm", "orientation": "v", "textposition": "auto", "hovertemplate": "Resource=%{x}<br>Monthly Cost ($)=%{y}<extra></extra>", "alignmentgroup": "True" }, { "name": "aws_instance.hack_vm2", "type": "bar", "xsrc": "hackathon_test:84:b06316", "ysrc": "hackathon_test:84:dea745", "xaxis": "x", "yaxis": "y", "marker": { "color": "rgb(153, 201, 69)", "pattern": { "shape": "" } }, "showlegend": true, "legendgroup": "aws_instance.hack_vm2", "offsetgroup": "aws_instance.hack_vm2", "orientation": "v", "textposition": "auto", "hovertemplate": "Resource=%{x}<br>Monthly Cost ($)=%{y}<extra></extra>", "alignmentgroup": "True" }, { "name": "aws_ebs_volume.hack_volume", "type": "bar", "xsrc": "hackathon_test:84:75dbf3", "ysrc": "hackathon_test:84:997589", "xaxis": "x", "yaxis": "y", "marker": { "color": "rgb(204, 97, 176)", "pattern": { "shape": "" } }, "showlegend": true, "legendgroup": "aws_ebs_volume.hack_volume", "offsetgroup": "aws_ebs_volume.hack_volume", "orientation": "v", "textposition": "auto", "hovertemplate": "Resource=%{x}<br>Monthly Cost ($)=%{y}<extra></extra>", "alignmentgroup": "True" }, { "type": "table", "cells": { "fill": { "colorsrc": "hackathon_test:84:987a1c" }, "font": { "size": 11 }, "align": "center", "valuessrc": "hackathon_test:84:6d2e34" }, "domain": { "x": [ 0.0, 1.0 ], "y": [ 0.0, 0.2976 ] }, "header": { "fill": { "color": "lightgrey" }, "font": { "size": 12, "color": "black" }, "align": "center", "valuessrc": "hackathon_test:84:bf785a" } } ], "layout": { "title": { "text": "Monthly Infracost Breakdown per Resource" }, "width": 1200, "xaxis": { "anchor": "y", "domain": [ 0.0, 1.0 ] }, "yaxis": { "anchor": "x", "domain": [ 0.3676, 1.0 ] }, "height": 900, "template": { "data": { "table": [ { "type": "table", "cells": { "fill": { "color": "#000038" }, "font": { "color": "#000037" }, "line": { "color": "#000039" } }, "header": { "fill": { "color": "#000040" }, "font": { "color": "#000036" }, "line": { "color": "#000039" } } } ], "icicle": [ { "type": "icicle", "textfont": { "color": "white" } } ], "sankey": [ { "type": "sankey", "textfont": { "color": "#000036" } } ], "contour": [ { "type": "contour", "colorscale": [ [ 0.0, "#000011" ], [ 0.1111111111111111, "#000012" ], [ 0.2222222222222222, "#000013" ], [ 0.3333333333333333, "#000014" ], [ 0.4444444444444444, "#000015" ], [ 0.5555555555555556, "#000016" ], [ 0.6666666666666666, "#000017" ], [ 0.7777777777777778, "#000018" ], [ 0.8888888888888888, "#000019" ], [ 1.0, "#000020" ] ] } ], "heatmap": [ { "type": "heatmap", "colorscale": [ [ 0.0, "#000011" ], [ 0.1111111111111111, "#000012" ], [ 0.2222222222222222, "#000013" ], [ 0.3333333333333333, "#000014" ], [ 0.4444444444444444, "#000015" ], [ 0.5555555555555556, "#000016" ], [ 0.6666666666666666, "#000017" ], [ 0.7777777777777778, "#000018" ], [ 0.8888888888888888, "#000019" ], [ 1.0, "#000020" ] ] } ], "scatter": [ { "type": "scatter", "marker": { "line": { "width": 0 } } } ], "waterfall": [ { "type": "waterfall", "totals": { "marker": { "color": "#000034" } }, "connector": { "line": { "color": "#000036", "width": 2 } }, "decreasing": { "marker": { "color": "#000033" } }, "increasing": { "marker": { "color": "#000032" } } } ], "candlestick": [ { "type": "candlestick", "decreasing": { "line": { "color": "#000033" } }, "increasing": { "line": { "color": "#000032" } } } ], "histogram2d": [ { "type": "histogram2d", "colorscale": [ [ 0.0, "#000011" ], [ 0.1111111111111111, "#000012" ], [ 0.2222222222222222, "#000013" ], [ 0.3333333333333333, "#000014" ], [ 0.4444444444444444, "#000015" ], [ 0.5555555555555556, "#000016" ], [ 0.6666666666666666, "#000017" ], [ 0.7777777777777778, "#000018" ], [ 0.8888888888888888, "#000019" ], [ 1.0, "#000020" ] ] } ], "contourcarpet": [ { "type": "contourcarpet", "colorscale": [ [ 0.0, "#000011" ], [ 0.1111111111111111, "#000012" ], [ 0.2222222222222222, "#000013" ], [ 0.3333333333333333, "#000014" ], [ 0.4444444444444444, "#000015" ], [ 0.5555555555555556, "#000016" ], [ 0.6666666666666666, "#000017" ], [ 0.7777777777777778, "#000018" ], [ 0.8888888888888888, "#000019" ], [ 1.0, "#000020" ] ] } ] }, "layout": { "colorway": [ "#000001", "#000002", "#000003", "#000004", "#000005", "#000006", "#000007", "#000008", "#000009", "#000010" ], "coloraxis": { "colorscale": [ [ 0.0, "#000011" ], [ 0.1111111111111111, "#000012" ], [ 0.2222222222222222, "#000013" ], [ 0.3333333333333333, "#000014" ], [ 0.4444444444444444, "#000015" ], [ 0.5555555555555556, "#000016" ], [ 0.6666666666666666, "#000017" ], [ 0.7777777777777778, "#000018" ], [ 0.8888888888888888, "#000019" ], [ 1.0, "#000020" ] ] }, "colorscale": { "diverging": [ [ 0.0, "#000021" ], [ 0.1, "#000022" ], [ 0.2, "#000023" ], [ 0.3, "#000024" ], [ 0.4, "#000025" ], [ 0.5, "#000026" ], [ 0.6, "#000027" ], [ 0.7, "#000028" ], [ 0.8, "#000029" ], [ 0.9, "#000030" ], [ 1.0, "#000031" ] ], "sequential": [ [ 0.0, "#000011" ], [ 0.1111111111111111, "#000012" ], [ 0.2222222222222222, "#000013" ], [ 0.3333333333333333, "#000014" ], [ 0.4444444444444444, "#000015" ], [ 0.5555555555555556, "#000016" ], [ 0.6666666666666666, "#000017" ], [ 0.7777777777777778, "#000018" ], [ 0.8888888888888888, "#000019" ], [ 1.0, "#000020" ] ], "sequentialminus": [ [ 0.0, "#000011" ], [ 0.1111111111111111, "#000012" ], [ 0.2222222222222222, "#000013" ], [ 0.3333333333333333, "#000014" ], [ 0.4444444444444444, "#000015" ], [ 0.5555555555555556, "#000016" ], [ 0.6666666666666666, "#000017" ], [ 0.7777777777777778, "#000018" ], [ 0.8888888888888888, "#000019" ], [ 1.0, "#000020" ] ] } } }, "plot_bgcolor": "rgba(245,245,245,1)", "paper_bgcolor": "rgba(245,245,245,1)" } }, "height": 900, "width": 1200, "user": { "profile_url": "https://chart-studio.plotly.com/~hackathon_test", "avatar_url": "https://storage.googleapis.com/plotly-prod-profiles/21.jpg", "background_url": "https://storage.googleapis.com/plotly-prod-profiles/bg-7.jpg", "bio": "", "nickname": "", "website": "", "stream_tokens": null, "feature_set_id": null, "csrf_token": null, "date_joined": "2025-09-16 02:59:33", "mapbox_access_tokens": null, "has_password": null, "username": "hackathon_test", "email": null, "is_active": null, "readonly": null, "is_dash_creator": null, "dash_created_count": null, "is_chart_creator": null, "charts_created_count": null } }, { "creation_time": "2025-09-16T04:37:04.295027Z", "comments": { "results": [], "count": 0 }, "parented": true, "embed_url": "https://chart-studio.plotly.com/~hackathon_test/87.embed", "fid": "hackathon_test:87", "filename": "infracost-graph-table-1757997417", "filetype": "plot", "img_url": "https://storage.googleapis.com/plotly-prod-images/hackathon_test/87/9_6K7XQ3F3RTS2NYK8PM6TX5AA3GL0DF.png", "image_urls": { "default": "https://storage.googleapis.com/plotly-prod-images/hackathon_test/87/2_1USR358G74J273EWEIOZ4P7C9R49KX.png", "block-thumb": "https://storage.googleapis.com/plotly-prod-images/hackathon_test/87/8_YA4GJSQSCFS24066PNDRMYBIVM05XU.png", "list-thumb": "https://storage.googleapis.com/plotly-prod-images/hackathon_test/87/9_6K7XQ3F3RTS2NYK8PM6TX5AA3GL0DF.png" }, "api_urls": { "files": "https://api.plotly.com/v2/files/hackathon_test:87", "plots": "https://api.plotly.com/v2/plots/hackathon_test:87", "parent": "https://api.plotly.com/v2/folders/home?user=hackathon_test" }, "owner": "hackathon_test", "parent": -1, "preview": "", "referencers": [], "references": [], "title": "", "views": 0, "web_url": "https://chart-studio.plotly.com/~hackathon_test/87/", "world_readable": true, "date_modified": "2025-09-16T04:37:05.393Z", "stars": { "results": [], "count": 0 }, "collaborators": { "results": [], "count": 0 }, "subfolder_count": null, "refresh_interval": null, "organize_view_url": "https://chart-studio.plotly.com/~hackathon_test/87/", "current_user_permission": "read", "is_theme": null, "is_template": null, "autosize": true, "caption": "", "figure": { "data": [ { "name": "aws_lb.hack_lb", "type": "bar", "xsrc": "hackathon_test:83:8b5af1", "ysrc": "hackathon_test:83:33a8be", "xaxis": "x", "yaxis": "y", "marker": { "color": "rgb(229, 134, 6)", "pattern": { "shape": "" } }, "showlegend": true, "legendgroup": "aws_lb.hack_lb", "offsetgroup": "aws_lb.hack_lb", "orientation": "v", "textposition": "auto", "hovertemplate": "Resource=%{x}<br>Monthly Cost ($)=%{y}<extra></extra>", "alignmentgroup": "True" }, { "name": "aws_db_instance.hack_db", "type": "bar", "xsrc": "hackathon_test:83:a4b481", "ysrc": "hackathon_test:83:1af327", "xaxis": "x", "yaxis": "y", "marker": { "color": "rgb(93, 105, 177)", "pattern": { "shape": "" } }, "showlegend": true, "legendgroup": "aws_db_instance.hack_db", "offsetgroup": "aws_db_instance.hack_db", "orientation": "v", "textposition": "auto", "hovertemplate": "Resource=%{x}<br>Monthly Cost ($)=%{y}<extra></extra>", "alignmentgroup": "True" }, { "name": "aws_instance.hack_vm", "type": "bar", "xsrc": "hackathon_test:83:e3ec53", "ysrc": "hackathon_test:83:abeeb9", "xaxis": "x", "yaxis": "y", "marker": { "color": "rgb(82, 188, 163)", "pattern": { "shape": "" } }, "showlegend": true, "legendgroup": "aws_instance.hack_vm", "offsetgroup": "aws_instance.hack_vm", "orientation": "v", "textposition": "auto", "hovertemplate": "Resource=%{x}<br>Monthly Cost ($)=%{y}<extra></extra>", "alignmentgroup": "True" }, { "name": "aws_instance.hack_vm2", "type": "bar", "xsrc": "hackathon_test:83:bfcda8", "ysrc": "hackathon_test:83:4613cb", "xaxis": "x", "yaxis": "y", "marker": { "color": "rgb(153, 201, 69)", "pattern": { "shape": "" } }, "showlegend": true, "legendgroup": "aws_instance.hack_vm2", "offsetgroup": "aws_instance.hack_vm2", "orientation": "v", "textposition": "auto", "hovertemplate": "Resource=%{x}<br>Monthly Cost ($)=%{y}<extra></extra>", "alignmentgroup": "True" }, { "name": "aws_ebs_volume.hack_volume", "type": "bar", "xsrc": "hackathon_test:83:74a4f3", "ysrc": "hackathon_test:83:83a91c", "xaxis": "x", "yaxis": "y", "marker": { "color": "rgb(204, 97, 176)", "pattern": { "shape": "" } }, "showlegend": true, "legendgroup": "aws_ebs_volume.hack_volume", "offsetgroup": "aws_ebs_volume.hack_volume", "orientation": "v", "textposition": "auto", "hovertemplate": "Resource=%{x}<br>Monthly Cost ($)=%{y}<extra></extra>", "alignmentgroup": "True" }, { "type": "table", "cells": { "fill": { "colorsrc": "hackathon_test:83:2c20ab" }, "font": { "size": 11 }, "align": "center", "valuessrc": "hackathon_test:83:fa4aa4" }, "domain": { "x": [ 0.0, 1.0 ], "y": [ 0.0, 0.2976 ] }, "header": { "fill": { "color": "lightgrey" }, "font": { "size": 12, "color": "black" }, "align": "center", "valuessrc": "hackathon_test:83:dcd67a" } } ], "layout": { "title": { "text": "Monthly Infracost Breakdown per Resource" }, "width": 1200, "xaxis": { "anchor": "y", "domain": [ 0.0, 1.0 ] }, "yaxis": { "anchor": "x", "domain": [ 0.3676, 1.0 ] }, "height": 900, "template": { "data": { "table": [ { "type": "table", "cells": { "fill": { "color": "#000038" }, "font": { "color": "#000037" }, "line": { "color": "#000039" } }, "header": { "fill": { "color": "#000040" }, "font": { "color": "#000036" }, "line": { "color": "#000039" } } } ], "icicle": [ { "type": "icicle", "textfont": { "color": "white" } } ], "sankey": [ { "type": "sankey", "textfont": { "color": "#000036" } } ], "contour": [ { "type": "contour", "colorscale": [ [ 0.0, "#000011" ], [ 0.1111111111111111, "#000012" ], [ 0.2222222222222222, "#000013" ], [ 0.3333333333333333, "#000014" ], [ 0.4444444444444444, "#000015" ], [ 0.5555555555555556, "#000016" ], [ 0.6666666666666666, "#000017" ], [ 0.7777777777777778, "#000018" ], [ 0.8888888888888888, "#000019" ], [ 1.0, "#000020" ] ] } ], "heatmap": [ { "type": "heatmap", "colorscale": [ [ 0.0, "#000011" ], [ 0.1111111111111111, "#000012" ], [ 0.2222222222222222, "#000013" ], [ 0.3333333333333333, "#000014" ], [ 0.4444444444444444, "#000015" ], [ 0.5555555555555556, "#000016" ], [ 0.6666666666666666, "#000017" ], [ 0.7777777777777778, "#000018" ], [ 0.8888888888888888, "#000019" ], [ 1.0, "#000020" ] ] } ], "scatter": [ { "type": "scatter", "marker": { "line": { "width": 0 } } } ], "waterfall": [ { "type": "waterfall", "totals": { "marker": { "color": "#000034" } }, "connector": { "line": { "color": "#000036", "width": 2 } }, "decreasing": { "marker": { "color": "#000033" } }, "increasing": { "marker": { "color": "#000032" } } } ], "candlestick": [ { "type": "candlestick", "decreasing": { "line": { "color": "#000033" } }, "increasing": { "line": { "color": "#000032" } } } ], "histogram2d": [ { "type": "histogram2d", "colorscale": [ [ 0.0, "#000011" ], [ 0.1111111111111111, "#000012" ], [ 0.2222222222222222, "#000013" ], [ 0.3333333333333333, "#000014" ], [ 0.4444444444444444, "#000015" ], [ 0.5555555555555556, "#000016" ], [ 0.6666666666666666, "#000017" ], [ 0.7777777777777778, "#000018" ], [ 0.8888888888888888, "#000019" ], [ 1.0, "#000020" ] ] } ], "contourcarpet": [ { "type": "contourcarpet", "colorscale": [ [ 0.0, "#000011" ], [ 0.1111111111111111, "#000012" ], [ 0.2222222222222222, "#000013" ], [ 0.3333333333333333, "#000014" ], [ 0.4444444444444444, "#000015" ], [ 0.5555555555555556, "#000016" ], [ 0.6666666666666666, "#000017" ], [ 0.7777777777777778, "#000018" ], [ 0.8888888888888888, "#000019" ], [ 1.0, "#000020" ] ] } ] }, "layout": { "colorway": [ "#000001", "#000002", "#000003", "#000004", "#000005", "#000006", "#000007", "#000008", "#000009", "#000010" ], "coloraxis": { "colorscale": [ [ 0.0, "#000011" ], [ 0.1111111111111111, "#000012" ], [ 0.2222222222222222, "#000013" ], [ 0.3333333333333333, "#000014" ], [ 0.4444444444444444, "#000015" ], [ 0.5555555555555556, "#000016" ], [ 0.6666666666666666, "#000017" ], [ 0.7777777777777778, "#000018" ], [ 0.8888888888888888, "#000019" ], [ 1.0, "#000020" ] ] }, "colorscale": { "diverging": [ [ 0.0, "#000021" ], [ 0.1, "#000022" ], [ 0.2, "#000023" ], [ 0.3, "#000024" ], [ 0.4, "#000025" ], [ 0.5, "#000026" ], [ 0.6, "#000027" ], [ 0.7, "#000028" ], [ 0.8, "#000029" ], [ 0.9, "#000030" ], [ 1.0, "#000031" ] ], "sequential": [ [ 0.0, "#000011" ], [ 0.1111111111111111, "#000012" ], [ 0.2222222222222222, "#000013" ], [ 0.3333333333333333, "#000014" ], [ 0.4444444444444444, "#000015" ], [ 0.5555555555555556, "#000016" ], [ 0.6666666666666666, "#000017" ], [ 0.7777777777777778, "#000018" ], [ 0.8888888888888888, "#000019" ], [ 1.0, "#000020" ] ], "sequentialminus": [ [ 0.0, "#000011" ], [ 0.1111111111111111, "#000012" ], [ 0.2222222222222222, "#000013" ], [ 0.3333333333333333, "#000014" ], [ 0.4444444444444444, "#000015" ], [ 0.5555555555555556, "#000016" ], [ 0.6666666666666666, "#000017" ], [ 0.7777777777777778, "#000018" ], [ 0.8888888888888888, "#000019" ], [ 1.0, "#000020" ] ] } } }, "plot_bgcolor": "rgba(245,245,245,1)", "paper_bgcolor": "rgba(245,245,245,1)" } }, "height": 900, "width": 1200, "user": { "profile_url": "https://chart-studio.plotly.com/~hackathon_test", "avatar_url": "https://storage.googleapis.com/plotly-prod-profiles/21.jpg", "background_url": "https://storage.googleapis.com/plotly-prod-profiles/bg-7.jpg", "bio": "", "nickname": "", "website": "", "stream_tokens": null, "feature_set_id": null, "csrf_token": null, "date_joined": "2025-09-16 02:59:33", "mapbox_access_tokens": null, "has_password": null, "username": "hackathon_test", "email": null, "is_active": null, "readonly": null, "is_dash_creator": null, "dash_created_count": null, "is_chart_creator": null, "charts_created_count": null } }, { "creation_time": "2025-09-16T04:37:00.183046Z", "comments": { "results": [], "count": 0 }, "parented": true, "embed_url": "https://chart-studio.plotly.com/~hackathon_test/82.embed", "fid": "hackathon_test:82", "filename": "infracost-graph-table-1757997413", "filetype": "plot", "img_url": "https://storage.googleapis.com/plotly-prod-images/hackathon_test/82/9_RELVDMVXG0PY7TSNW0RKE3LCSHQPZS.png", "image_urls": { "default": "https://storage.googleapis.com/plotly-prod-images/hackathon_test/82/2_QLWEDSS4SS7UDY4IQ2HLPPF2U02VWF.png", "block-thumb": "https://api.plotly.com/v2/files/hackathon_test:82/image?image_name=block-thumb", "list-thumb": "https://storage.googleapis.com/plotly-prod-images/hackathon_test/82/9_RELVDMVXG0PY7TSNW0RKE3LCSHQPZS.png" }, "api_urls": { "files": "https://api.plotly.com/v2/files/hackathon_test:82", "plots": "https://api.plotly.com/v2/plots/hackathon_test:82", "parent": "https://api.plotly.com/v2/folders/home?user=hackathon_test" }, "owner": "hackathon_test", "parent": -1, "preview": "", "referencers": [], "references": [], "title": "", "views": 0, "web_url": "https://chart-studio.plotly.com/~hackathon_test/82/", "world_readable": true, "date_modified": "2025-09-16T04:37:00.873Z", "stars": { "results": [], "count": 0 }, "collaborators": { "results": [], "count": 0 }, "subfolder_count": null, "refresh_interval": null, "organize_view_url": "https://chart-studio.plotly.com/~hackathon_test/82/", "current_user_permission": "read", "is_theme": null, "is_template": null, "autosize": true, "caption": "", "figure": { "data": [ { "name": "aws_lb.hack_lb", "type": "bar", "xsrc": "hackathon_test:79:5b5422", "ysrc": "hackathon_test:79:f4bee4", "xaxis": "x", "yaxis": "y", "marker": { "color": "rgb(229, 134, 6)", "pattern": { "shape": "" } }, "showlegend": true, "legendgroup": "aws_lb.hack_lb", "offsetgroup": "aws_lb.hack_lb", "orientation": "v", "textposition": "auto", "hovertemplate": "Resource=%{x}<br>Monthly Cost ($)=%{y}<extra></extra>", "alignmentgroup": "True" }, { "name": "aws_db_instance.hack_db", "type": "bar", "xsrc": "hackathon_test:79:34960e", "ysrc": "hackathon_test:79:728be7", "xaxis": "x", "yaxis": "y", "marker": { "color": "rgb(93, 105, 177)", "pattern": { "shape": "" } }, "showlegend": true, "legendgroup": "aws_db_instance.hack_db", "offsetgroup": "aws_db_instance.hack_db", "orientation": "v", "textposition": "auto", "hovertemplate": "Resource=%{x}<br>Monthly Cost ($)=%{y}<extra></extra>", "alignmentgroup": "True" }, { "name": "aws_instance.hack_vm", "type": "bar", "xsrc": "hackathon_test:79:350716", "ysrc": "hackathon_test:79:acb2f8", "xaxis": "x", "yaxis": "y", "marker": { "color": "rgb(82, 188, 163)", "pattern": { "shape": "" } }, "showlegend": true, "legendgroup": "aws_instance.hack_vm", "offsetgroup": "aws_instance.hack_vm", "orientation": "v", "textposition": "auto", "hovertemplate": "Resource=%{x}<br>Monthly Cost ($)=%{y}<extra></extra>", "alignmentgroup": "True" }, { "name": "aws_instance.hack_vm2", "type": "bar", "xsrc": "hackathon_test:79:8bfbbd", "ysrc": "hackathon_test:79:54cbd0", "xaxis": "x", "yaxis": "y", "marker": { "color": "rgb(153, 201, 69)", "pattern": { "shape": "" } }, "showlegend": true, "legendgroup": "aws_instance.hack_vm2", "offsetgroup": "aws_instance.hack_vm2", "orientation": "v", "textposition": "auto", "hovertemplate": "Resource=%{x}<br>Monthly Cost ($)=%{y}<extra></extra>", "alignmentgroup": "True" }, { "name": "aws_ebs_volume.hack_volume", "type": "bar", "xsrc": "hackathon_test:79:510a2c", "ysrc": "hackathon_test:79:9176df", "xaxis": "x", "yaxis": "y", "marker": { "color": "rgb(204, 97, 176)", "pattern": { "shape": "" } }, "showlegend": true, "legendgroup": "aws_ebs_volume.hack_volume", "offsetgroup": "aws_ebs_volume.hack_volume", "orientation": "v", "textposition": "auto", "hovertemplate": "Resource=%{x}<br>Monthly Cost ($)=%{y}<extra></extra>", "alignmentgroup": "True" }, { "type": "table", "cells": { "fill": { "colorsrc": "hackathon_test:79:9bced0" }, "font": { "size": 11 }, "align": "center", "valuessrc": "hackathon_test:79:b3b0d6" }, "domain": { "x": [ 0.0, 1.0 ], "y": [ 0.0, 0.2976 ] }, "header": { "fill": { "color": "lightgrey" }, "font": { "size": 12, "color": "black" }, "align": "center", "valuessrc": "hackathon_test:79:88d186" } } ], "layout": { "title": { "text": "Monthly Infracost Breakdown per Resource" }, "width": 1200, "xaxis": { "anchor": "y", "domain": [ 0.0, 1.0 ] }, "yaxis": { "anchor": "x", "domain": [ 0.3676, 1.0 ] }, "height": 900, "template": { "data": { "table": [ { "type": "table", "cells": { "fill": { "color": "#000038" }, "font": { "color": "#000037" }, "line": { "color": "#000039" } }, "header": { "fill": { "color": "#000040" }, "font": { "color": "#000036" }, "line": { "color": "#000039" } } } ], "icicle": [ { "type": "icicle", "textfont": { "color": "white" } } ], "sankey": [ { "type": "sankey", "textfont": { "color": "#000036" } } ], "contour": [ { "type": "contour", "colorscale": [ [ 0.0, "#000011" ], [ 0.1111111111111111, "#000012" ], [ 0.2222222222222222, "#000013" ], [ 0.3333333333333333, "#000014" ], [ 0.4444444444444444, "#000015" ], [ 0.5555555555555556, "#000016" ], [ 0.6666666666666666, "#000017" ], [ 0.7777777777777778, "#000018" ], [ 0.8888888888888888, "#000019" ], [ 1.0, "#000020" ] ] } ], "heatmap": [ { "type": "heatmap", "colorscale": [ [ 0.0, "#000011" ], [ 0.1111111111111111, "#000012" ], [ 0.2222222222222222, "#000013" ], [ 0.3333333333333333, "#000014" ], [ 0.4444444444444444, "#000015" ], [ 0.5555555555555556, "#000016" ], [ 0.6666666666666666, "#000017" ], [ 0.7777777777777778, "#000018" ], [ 0.8888888888888888, "#000019" ], [ 1.0, "#000020" ] ] } ], "scatter": [ { "type": "scatter", "marker": { "line": { "width": 0 } } } ], "waterfall": [ { "type": "waterfall", "totals": { "marker": { "color": "#000034" } }, "connector": { "line": { "color": "#000036", "width": 2 } }, "decreasing": { "marker": { "color": "#000033" } }, "increasing": { "marker": { "color": "#000032" } } } ], "candlestick": [ { "type": "candlestick", "decreasing": { "line": { "color": "#000033" } }, "increasing": { "line": { "color": "#000032" } } } ], "histogram2d": [ { "type": "histogram2d", "colorscale": [ [ 0.0, "#000011" ], [ 0.1111111111111111, "#000012" ], [ 0.2222222222222222, "#000013" ], [ 0.3333333333333333, "#000014" ], [ 0.4444444444444444, "#000015" ], [ 0.5555555555555556, "#000016" ], [ 0.6666666666666666, "#000017" ], [ 0.7777777777777778, "#000018" ], [ 0.8888888888888888, "#000019" ], [ 1.0, "#000020" ] ] } ], "contourcarpet": [ { "type": "contourcarpet", "colorscale": [ [ 0.0, "#000011" ], [ 0.1111111111111111, "#000012" ], [ 0.2222222222222222, "#000013" ], [ 0.3333333333333333, "#000014" ], [ 0.4444444444444444, "#000015" ], [ 0.5555555555555556, "#000016" ], [ 0.6666666666666666, "#000017" ], [ 0.7777777777777778, "#000018" ], [ 0.8888888888888888, "#000019" ], [ 1.0, "#000020" ] ] } ] }, "layout": { "colorway": [ "#000001", "#000002", "#000003", "#000004", "#000005", "#000006", "#000007", "#000008", "#000009", "#000010" ], "coloraxis": { "colorscale": [ [ 0.0, "#000011" ], [ 0.1111111111111111, "#000012" ], [ 0.2222222222222222, "#000013" ], [ 0.3333333333333333, "#000014" ], [ 0.4444444444444444, "#000015" ], [ 0.5555555555555556, "#000016" ], [ 0.6666666666666666, "#000017" ], [ 0.7777777777777778, "#000018" ], [ 0.8888888888888888, "#000019" ], [ 1.0, "#000020" ] ] }, "colorscale": { "diverging": [ [ 0.0, "#000021" ], [ 0.1, "#000022" ], [ 0.2, "#000023" ], [ 0.3, "#000024" ], [ 0.4, "#000025" ], [ 0.5, "#000026" ], [ 0.6, "#000027" ], [ 0.7, "#000028" ], [ 0.8, "#000029" ], [ 0.9, "#000030" ], [ 1.0, "#000031" ] ], "sequential": [ [ 0.0, "#000011" ], [ 0.1111111111111111, "#000012" ], [ 0.2222222222222222, "#000013" ], [ 0.3333333333333333, "#000014" ], [ 0.4444444444444444, "#000015" ], [ 0.5555555555555556, "#000016" ], [ 0.6666666666666666, "#000017" ], [ 0.7777777777777778, "#000018" ], [ 0.8888888888888888, "#000019" ], [ 1.0, "#000020" ] ], "sequentialminus": [ [ 0.0, "#000011" ], [ 0.1111111111111111, "#000012" ], [ 0.2222222222222222, "#000013" ], [ 0.3333333333333333, "#000014" ], [ 0.4444444444444444, "#000015" ], [ 0.5555555555555556, "#000016" ], [ 0.6666666666666666, "#000017" ], [ 0.7777777777777778, "#000018" ], [ 0.8888888888888888, "#000019" ], [ 1.0, "#000020" ] ] } } }, "plot_bgcolor": "rgba(245,245,245,1)", "paper_bgcolor": "rgba(245,245,245,1)" } }, "height": 900, "width": 1200, "user": { "profile_url": "https://chart-studio.plotly.com/~hackathon_test", "avatar_url": "https://storage.googleapis.com/plotly-prod-profiles/21.jpg", "background_url": "https://storage.googleapis.com/plotly-prod-profiles/bg-7.jpg", "bio": "", "nickname": "", "website": "", "stream_tokens": null, "feature_set_id": null, "csrf_token": null, "date_joined": "2025-09-16 02:59:33", "mapbox_access_tokens": null, "has_password": null, "username": "hackathon_test", "email": null, "is_active": null, "readonly": null, "is_dash_creator": null, "dash_created_count": null, "is_chart_creator": null, "charts_created_count": null } }, { "creation_time": "2025-09-16T04:36:59.401217Z", "comments": { "results": [], "count": 0 }, "parented": true, "embed_url": "https://chart-studio.plotly.com/~hackathon_test/81.embed", "fid": "hackathon_test:81", "filename": "infracost-graph-table-1757997412", "filetype": "plot", "img_url": "https://storage.googleapis.com/plotly-prod-images/hackathon_test/81/9_F17E5C6KUUXT4SEABU9SGTWDF0VOE4.png", "image_urls": { "default": "https://storage.googleapis.com/plotly-prod-images/hackathon_test/81/2_6NO8UYZUXKUJUPTDQMVD09EQFP39MJ.png", "block-thumb": "https://storage.googleapis.com/plotly-prod-images/hackathon_test/81/8_WX8ARREN0HGH0OBDLH5HX47BGJPHMN.png", "list-thumb": "https://storage.googleapis.com/plotly-prod-images/hackathon_test/81/9_F17E5C6KUUXT4SEABU9SGTWDF0VOE4.png" }, "api_urls": { "files": "https://api.plotly.com/v2/files/hackathon_test:81", "plots": "https://api.plotly.com/v2/plots/hackathon_test:81", "parent": "https://api.plotly.com/v2/folders/home?user=hackathon_test" }, "owner": "hackathon_test", "parent": -1, "preview": "", "referencers": [], "references": [], "title": "", "views": 0, "web_url": "https://chart-studio.plotly.com/~hackathon_test/81/", "world_readable": true, "date_modified": "2025-09-16T04:36:59.413Z", "stars": { "results": [], "count": 0 }, "collaborators": { "results": [], "count": 0 }, "subfolder_count": null, "refresh_interval": null, "organize_view_url": "https://chart-studio.plotly.com/~hackathon_test/81/", "current_user_permission": "read", "is_theme": null, "is_template": null, "autosize": true, "caption": "", "figure": { "data": [ { "name": "aws_lb.hack_lb", "type": "bar", "xsrc": "hackathon_test:78:8d5351", "ysrc": "hackathon_test:78:0e91ac", "xaxis": "x", "yaxis": "y", "marker": { "color": "rgb(229, 134, 6)", "pattern": { "shape": "" } }, "showlegend": true, "legendgroup": "aws_lb.hack_lb", "offsetgroup": "aws_lb.hack_lb", "orientation": "v", "textposition": "auto", "hovertemplate": "Resource=%{x}<br>Monthly Cost ($)=%{y}<extra></extra>", "alignmentgroup": "True" }, { "name": "aws_db_instance.hack_db", "type": "bar", "xsrc": "hackathon_test:78:668849", "ysrc": "hackathon_test:78:e6547a", "xaxis": "x", "yaxis": "y", "marker": { "color": "rgb(93, 105, 177)", "pattern": { "shape": "" } }, "showlegend": true, "legendgroup": "aws_db_instance.hack_db", "offsetgroup": "aws_db_instance.hack_db", "orientation": "v", "textposition": "auto", "hovertemplate": "Resource=%{x}<br>Monthly Cost ($)=%{y}<extra></extra>", "alignmentgroup": "True" }, { "name": "aws_instance.hack_vm", "type": "bar", "xsrc": "hackathon_test:78:7fc9a9", "ysrc": "hackathon_test:78:f22c2d", "xaxis": "x", "yaxis": "y", "marker": { "color": "rgb(82, 188, 163)", "pattern": { "shape": "" } }, "showlegend": true, "legendgroup": "aws_instance.hack_vm", "offsetgroup": "aws_instance.hack_vm", "orientation": "v", "textposition": "auto", "hovertemplate": "Resource=%{x}<br>Monthly Cost ($)=%{y}<extra></extra>", "alignmentgroup": "True" }, { "name": "aws_instance.hack_vm2", "type": "bar", "xsrc": "hackathon_test:78:766a17", "ysrc": "hackathon_test:78:bec17a", "xaxis": "x", "yaxis": "y", "marker": { "color": "rgb(153, 201, 69)", "pattern": { "shape": "" } }, "showlegend": true, "legendgroup": "aws_instance.hack_vm2", "offsetgroup": "aws_instance.hack_vm2", "orientation": "v", "textposition": "auto", "hovertemplate": "Resource=%{x}<br>Monthly Cost ($)=%{y}<extra></extra>", "alignmentgroup": "True" }, { "name": "aws_ebs_volume.hack_volume", "type": "bar", "xsrc": "hackathon_test:78:527c4e", "ysrc": "hackathon_test:78:bf36f0", "xaxis": "x", "yaxis": "y", "marker": { "color": "rgb(204, 97, 176)", "pattern": { "shape": "" } }, "showlegend": true, "legendgroup": "aws_ebs_volume.hack_volume", "offsetgroup": "aws_ebs_volume.hack_volume", "orientation": "v", "textposition": "auto", "hovertemplate": "Resource=%{x}<br>Monthly Cost ($)=%{y}<extra></extra>", "alignmentgroup": "True" }, { "type": "table", "cells": { "fill": { "colorsrc": "hackathon_test:78:9afff7" }, "font": { "size": 11 }, "align": "center", "valuessrc": "hackathon_test:78:043a67" }, "domain": { "x": [ 0.0, 1.0 ], "y": [ 0.0, 0.2976 ] }, "header": { "fill": { "color": "lightgrey" }, "font": { "size": 12, "color": "black" }, "align": "center", "valuessrc": "hackathon_test:78:641310" } } ], "layout": { "title": { "text": "Monthly Infracost Breakdown per Resource" }, "width": 1200, "xaxis": { "anchor": "y", "domain": [ 0.0, 1.0 ] }, "yaxis": { "anchor": "x", "domain": [ 0.3676, 1.0 ] }, "height": 900, "template": { "data": { "table": [ { "type": "table", "cells": { "fill": { "color": "#000038" }, "font": { "color": "#000037" }, "line": { "color": "#000039" } }, "header": { "fill": { "color": "#000040" }, "font": { "color": "#000036" }, "line": { "color": "#000039" } } } ], "icicle": [ { "type": "icicle", "textfont": { "color": "white" } } ], "sankey": [ { "type": "sankey", "textfont": { "color": "#000036" } } ], "contour": [ { "type": "contour", "colorscale": [ [ 0.0, "#000011" ], [ 0.1111111111111111, "#000012" ], [ 0.2222222222222222, "#000013" ], [ 0.3333333333333333, "#000014" ], [ 0.4444444444444444, "#000015" ], [ 0.5555555555555556, "#000016" ], [ 0.6666666666666666, "#000017" ], [ 0.7777777777777778, "#000018" ], [ 0.8888888888888888, "#000019" ], [ 1.0, "#000020" ] ] } ], "heatmap": [ { "type": "heatmap", "colorscale": [ [ 0.0, "#000011" ], [ 0.1111111111111111, "#000012" ], [ 0.2222222222222222, "#000013" ], [ 0.3333333333333333, "#000014" ], [ 0.4444444444444444, "#000015" ], [ 0.5555555555555556, "#000016" ], [ 0.6666666666666666, "#000017" ], [ 0.7777777777777778, "#000018" ], [ 0.8888888888888888, "#000019" ], [ 1.0, "#000020" ] ] } ], "scatter": [ { "type": "scatter", "marker": { "line": { "width": 0 } } } ], "waterfall": [ { "type": "waterfall", "totals": { "marker": { "color": "#000034" } }, "connector": { "line": { "color": "#000036", "width": 2 } }, "decreasing": { "marker": { "color": "#000033" } }, "increasing": { "marker": { "color": "#000032" } } } ], "candlestick": [ { "type": "candlestick", "decreasing": { "line": { "color": "#000033" } }, "increasing": { "line": { "color": "#000032" } } } ], "histogram2d": [ { "type": "histogram2d", "colorscale": [ [ 0.0, "#000011" ], [ 0.1111111111111111, "#000012" ], [ 0.2222222222222222, "#000013" ], [ 0.3333333333333333, "#000014" ], [ 0.4444444444444444, "#000015" ], [ 0.5555555555555556, "#000016" ], [ 0.6666666666666666, "#000017" ], [ 0.7777777777777778, "#000018" ], [ 0.8888888888888888, "#000019" ], [ 1.0, "#000020" ] ] } ], "contourcarpet": [ { "type": "contourcarpet", "colorscale": [ [ 0.0, "#000011" ], [ 0.1111111111111111, "#000012" ], [ 0.2222222222222222, "#000013" ], [ 0.3333333333333333, "#000014" ], [ 0.4444444444444444, "#000015" ], [ 0.5555555555555556, "#000016" ], [ 0.6666666666666666, "#000017" ], [ 0.7777777777777778, "#000018" ], [ 0.8888888888888888, "#000019" ], [ 1.0, "#000020" ] ] } ] }, "layout": { "colorway": [ "#000001", "#000002", "#000003", "#000004", "#000005", "#000006", "#000007", "#000008", "#000009", "#000010" ], "coloraxis": { "colorscale": [ [ 0.0, "#000011" ], [ 0.1111111111111111, "#000012" ], [ 0.2222222222222222, "#000013" ], [ 0.3333333333333333, "#000014" ], [ 0.4444444444444444, "#000015" ], [ 0.5555555555555556, "#000016" ], [ 0.6666666666666666, "#000017" ], [ 0.7777777777777778, "#000018" ], [ 0.8888888888888888, "#000019" ], [ 1.0, "#000020" ] ] }, "colorscale": { "diverging": [ [ 0.0, "#000021" ], [ 0.1, "#000022" ], [ 0.2, "#000023" ], [ 0.3, "#000024" ], [ 0.4, "#000025" ], [ 0.5, "#000026" ], [ 0.6, "#000027" ], [ 0.7, "#000028" ], [ 0.8, "#000029" ], [ 0.9, "#000030" ], [ 1.0, "#000031" ] ], "sequential": [ [ 0.0, "#000011" ], [ 0.1111111111111111, "#000012" ], [ 0.2222222222222222, "#000013" ], [ 0.3333333333333333, "#000014" ], [ 0.4444444444444444, "#000015" ], [ 0.5555555555555556, "#000016" ], [ 0.6666666666666666, "#000017" ], [ 0.7777777777777778, "#000018" ], [ 0.8888888888888888, "#000019" ], [ 1.0, "#000020" ] ], "sequentialminus": [ [ 0.0, "#000011" ], [ 0.1111111111111111, "#000012" ], [ 0.2222222222222222, "#000013" ], [ 0.3333333333333333, "#000014" ], [ 0.4444444444444444, "#000015" ], [ 0.5555555555555556, "#000016" ], [ 0.6666666666666666, "#000017" ], [ 0.7777777777777778, "#000018" ], [ 0.8888888888888888, "#000019" ], [ 1.0, "#000020" ] ] } } }, "plot_bgcolor": "rgba(245,245,245,1)", "paper_bgcolor": "rgba(245,245,245,1)" } }, "height": 900, "width": 1200, "user": { "profile_url": "https://chart-studio.plotly.com/~hackathon_test", "avatar_url": "https://storage.googleapis.com/plotly-prod-profiles/21.jpg", "background_url": "https://storage.googleapis.com/plotly-prod-profiles/bg-7.jpg", "bio": "", "nickname": "", "website": "", "stream_tokens": null, "feature_set_id": null, "csrf_token": null, "date_joined": "2025-09-16 02:59:33", "mapbox_access_tokens": null, "has_password": null, "username": "hackathon_test", "email": null, "is_active": null, "readonly": null, "is_dash_creator": null, "dash_created_count": null, "is_chart_creator": null, "charts_created_count": null } }, { "creation_time": "2025-09-16T04:36:57.679170Z", "comments": { "results": [], "count": 0 }, "parented": true, "embed_url": "https://chart-studio.plotly.com/~hackathon_test/80.embed", "fid": "hackathon_test:80", "filename": "infracost-graph-table-1757997410", "filetype": "plot", "img_url": "https://storage.googleapis.com/plotly-prod-images/hackathon_test/80/9_K0HWQ84SQMYUEIGZUXJ13NA0FVDP4F.png", "image_urls": { "default": "https://storage.googleapis.com/plotly-prod-images/hackathon_test/80/2_KJ5TZUSVWZGQSNCGKM55YCB5TQFL63.png", "block-thumb": "https://storage.googleapis.com/plotly-prod-images/hackathon_test/80/8_IM9UPFDQQB6VPD23DAL7CQD22J8D1W.png", "list-thumb": "https://storage.googleapis.com/plotly-prod-images/hackathon_test/80/9_K0HWQ84SQMYUEIGZUXJ13NA0FVDP4F.png" }, "api_urls": { "files": "https://api.plotly.com/v2/files/hackathon_test:80", "plots": "https://api.plotly.com/v2/plots/hackathon_test:80", "parent": "https://api.plotly.com/v2/folders/home?user=hackathon_test" }, "owner": "hackathon_test", "parent": -1, "preview": "", "referencers": [], "references": [], "title": "", "views": 0, "web_url": "https://chart-studio.plotly.com/~hackathon_test/80/", "world_readable": true, "date_modified": "2025-09-16T04:36:57.691Z", "stars": { "results": [], "count": 0 }, "collaborators": { "results": [], "count": 0 }, "subfolder_count": null, "refresh_interval": null, "organize_view_url": "https://chart-studio.plotly.com/~hackathon_test/80/", "current_user_permission": "read", "is_theme": null, "is_template": null, "autosize": true, "caption": "", "figure": { "data": [ { "name": "aws_lb.hack_lb", "type": "bar", "xsrc": "hackathon_test:77:1b7abc", "ysrc": "hackathon_test:77:b87490", "xaxis": "x", "yaxis": "y", "marker": { "color": "rgb(229, 134, 6)", "pattern": { "shape": "" } }, "showlegend": true, "legendgroup": "aws_lb.hack_lb", "offsetgroup": "aws_lb.hack_lb", "orientation": "v", "textposition": "auto", "hovertemplate": "Resource=%{x}<br>Monthly Cost ($)=%{y}<extra></extra>", "alignmentgroup": "True" }, { "name": "aws_db_instance.hack_db", "type": "bar", "xsrc": "hackathon_test:77:ed59bf", "ysrc": "hackathon_test:77:967f17", "xaxis": "x", "yaxis": "y", "marker": { "color": "rgb(93, 105, 177)", "pattern": { "shape": "" } }, "showlegend": true, "legendgroup": "aws_db_instance.hack_db", "offsetgroup": "aws_db_instance.hack_db", "orientation": "v", "textposition": "auto", "hovertemplate": "Resource=%{x}<br>Monthly Cost ($)=%{y}<extra></extra>", "alignmentgroup": "True" }, { "name": "aws_instance.hack_vm", "type": "bar", "xsrc": "hackathon_test:77:3ba124", "ysrc": "hackathon_test:77:69fd82", "xaxis": "x", "yaxis": "y", "marker": { "color": "rgb(82, 188, 163)", "pattern": { "shape": "" } }, "showlegend": true, "legendgroup": "aws_instance.hack_vm", "offsetgroup": "aws_instance.hack_vm", "orientation": "v", "textposition": "auto", "hovertemplate": "Resource=%{x}<br>Monthly Cost ($)=%{y}<extra></extra>", "alignmentgroup": "True" }, { "name": "aws_instance.hack_vm2", "type": "bar", "xsrc": "hackathon_test:77:60af5d", "ysrc": "hackathon_test:77:2871c8", "xaxis": "x", "yaxis": "y", "marker": { "color": "rgb(153, 201, 69)", "pattern": { "shape": "" } }, "showlegend": true, "legendgroup": "aws_instance.hack_vm2", "offsetgroup": "aws_instance.hack_vm2", "orientation": "v", "textposition": "auto", "hovertemplate": "Resource=%{x}<br>Monthly Cost ($)=%{y}<extra></extra>", "alignmentgroup": "True" }, { "name": "aws_ebs_volume.hack_volume", "type": "bar", "xsrc": "hackathon_test:77:28f4af", "ysrc": "hackathon_test:77:9a8112", "xaxis": "x", "yaxis": "y", "marker": { "color": "rgb(204, 97, 176)", "pattern": { "shape": "" } }, "showlegend": true, "legendgroup": "aws_ebs_volume.hack_volume", "offsetgroup": "aws_ebs_volume.hack_volume", "orientation": "v", "textposition": "auto", "hovertemplate": "Resource=%{x}<br>Monthly Cost ($)=%{y}<extra></extra>", "alignmentgroup": "True" }, { "type": "table", "cells": { "fill": { "colorsrc": "hackathon_test:77:affe62" }, "font": { "size": 11 }, "align": "center", "valuessrc": "hackathon_test:77:a78ef6" }, "domain": { "x": [ 0.0, 1.0 ], "y": [ 0.0, 0.2976 ] }, "header": { "fill": { "color": "lightgrey" }, "font": { "size": 12, "color": "black" }, "align": "center", "valuessrc": "hackathon_test:77:2a4a81" } } ], "layout": { "title": { "text": "Monthly Infracost Breakdown per Resource" }, "width": 1200, "xaxis": { "anchor": "y", "domain": [ 0.0, 1.0 ] }, "yaxis": { "anchor": "x", "domain": [ 0.3676, 1.0 ] }, "height": 900, "template": { "data": { "table": [ { "type": "table", "cells": { "fill": { "color": "#000038" }, "font": { "color": "#000037" }, "line": { "color": "#000039" } }, "header": { "fill": { "color": "#000040" }, "font": { "color": "#000036" }, "line": { "color": "#000039" } } } ], "icicle": [ { "type": "icicle", "textfont": { "color": "white" } } ], "sankey": [ { "type": "sankey", "textfont": { "color": "#000036" } } ], "contour": [ { "type": "contour", "colorscale": [ [ 0.0, "#000011" ], [ 0.1111111111111111, "#000012" ], [ 0.2222222222222222, "#000013" ], [ 0.3333333333333333, "#000014" ], [ 0.4444444444444444, "#000015" ], [ 0.5555555555555556, "#000016" ], [ 0.6666666666666666, "#000017" ], [ 0.7777777777777778, "#000018" ], [ 0.8888888888888888, "#000019" ], [ 1.0, "#000020" ] ] } ], "heatmap": [ { "type": "heatmap", "colorscale": [ [ 0.0, "#000011" ], [ 0.1111111111111111, "#000012" ], [ 0.2222222222222222, "#000013" ], [ 0.3333333333333333, "#000014" ], [ 0.4444444444444444, "#000015" ], [ 0.5555555555555556, "#000016" ], [ 0.6666666666666666, "#000017" ], [ 0.7777777777777778, "#000018" ], [ 0.8888888888888888, "#000019" ], [ 1.0, "#000020" ] ] } ], "scatter": [ { "type": "scatter", "marker": { "line": { "width": 0 } } } ], "waterfall": [ { "type": "waterfall", "totals": { "marker": { "color": "#000034" } }, "connector": { "line": { "color": "#000036", "width": 2 } }, "decreasing": { "marker": { "color": "#000033" } }, "increasing": { "marker": { "color": "#000032" } } } ], "candlestick": [ { "type": "candlestick", "decreasing": { "line": { "color": "#000033" } }, "increasing": { "line": { "color": "#000032" } } } ], "histogram2d": [ { "type": "histogram2d", "colorscale": [ [ 0.0, "#000011" ], [ 0.1111111111111111, "#000012" ], [ 0.2222222222222222, "#000013" ], [ 0.3333333333333333, "#000014" ], [ 0.4444444444444444, "#000015" ], [ 0.5555555555555556, "#000016" ], [ 0.6666666666666666, "#000017" ], [ 0.7777777777777778, "#000018" ], [ 0.8888888888888888, "#000019" ], [ 1.0, "#000020" ] ] } ], "contourcarpet": [ { "type": "contourcarpet", "colorscale": [ [ 0.0, "#000011" ], [ 0.1111111111111111, "#000012" ], [ 0.2222222222222222, "#000013" ], [ 0.3333333333333333, "#000014" ], [ 0.4444444444444444, "#000015" ], [ 0.5555555555555556, "#000016" ], [ 0.6666666666666666, "#000017" ], [ 0.7777777777777778, "#000018" ], [ 0.8888888888888888, "#000019" ], [ 1.0, "#000020" ] ] } ] }, "layout": { "colorway": [ "#000001", "#000002", "#000003", "#000004", "#000005", "#000006", "#000007", "#000008", "#000009", "#000010" ], "coloraxis": { "colorscale": [ [ 0.0, "#000011" ], [ 0.1111111111111111, "#000012" ], [ 0.2222222222222222, "#000013" ], [ 0.3333333333333333, "#000014" ], [ 0.4444444444444444, "#000015" ], [ 0.5555555555555556, "#000016" ], [ 0.6666666666666666, "#000017" ], [ 0.7777777777777778, "#000018" ], [ 0.8888888888888888, "#000019" ], [ 1.0, "#000020" ] ] }, "colorscale": { "diverging": [ [ 0.0, "#000021" ], [ 0.1, "#000022" ], [ 0.2, "#000023" ], [ 0.3, "#000024" ], [ 0.4, "#000025" ], [ 0.5, "#000026" ], [ 0.6, "#000027" ], [ 0.7, "#000028" ], [ 0.8, "#000029" ], [ 0.9, "#000030" ], [ 1.0, "#000031" ] ], "sequential": [ [ 0.0, "#000011" ], [ 0.1111111111111111, "#000012" ], [ 0.2222222222222222, "#000013" ], [ 0.3333333333333333, "#000014" ], [ 0.4444444444444444, "#000015" ], [ 0.5555555555555556, "#000016" ], [ 0.6666666666666666, "#000017" ], [ 0.7777777777777778, "#000018" ], [ 0.8888888888888888, "#000019" ], [ 1.0, "#000020" ] ], "sequentialminus": [ [ 0.0, "#000011" ], [ 0.1111111111111111, "#000012" ], [ 0.2222222222222222, "#000013" ], [ 0.3333333333333333, "#000014" ], [ 0.4444444444444444, "#000015" ], [ 0.5555555555555556, "#000016" ], [ 0.6666666666666666, "#000017" ], [ 0.7777777777777778, "#000018" ], [ 0.8888888888888888, "#000019" ], [ 1.0, "#000020" ] ] } } }, "plot_bgcolor": "rgba(245,245,245,1)", "paper_bgcolor": "rgba(245,245,245,1)" } }, "height": 900, "width": 1200, "user": { "profile_url": "https://chart-studio.plotly.com/~hackathon_test", "avatar_url": "https://storage.googleapis.com/plotly-prod-profiles/21.jpg", "background_url": "https://storage.googleapis.com/plotly-prod-profiles/bg-7.jpg", "bio": "", "nickname": "", "website": "", "stream_tokens": null, "feature_set_id": null, "csrf_token": null, "date_joined": "2025-09-16 02:59:33", "mapbox_access_tokens": null, "has_password": null, "username": "hackathon_test", "email": null, "is_active": null, "readonly": null, "is_dash_creator": null, "dash_created_count": null, "is_chart_creator": null, "charts_created_count": null } }, { "creation_time": "2025-09-16T04:36:20.701224Z", "comments": { "results": [], "count": 0 }, "parented": true, "embed_url": "https://chart-studio.plotly.com/~hackathon_test/76.embed", "fid": "hackathon_test:76", "filename": "infracost-graph-table-1757997374", "filetype": "plot", "img_url": "https://storage.googleapis.com/plotly-prod-images/hackathon_test/76/9_LMFXMZ840HBF0F91PLDK1ZZCL0U532.png", "image_urls": { "default": "https://storage.googleapis.com/plotly-prod-images/hackathon_test/76/2_7VIHUZVY8F2OP8BM54P0F5F2NJ6GS4.png", "block-thumb": "https://api.plotly.com/v2/files/hackathon_test:76/image?image_name=block-thumb", "list-thumb": "https://storage.googleapis.com/plotly-prod-images/hackathon_test/76/9_LMFXMZ840HBF0F91PLDK1ZZCL0U532.png" }, "api_urls": { "files": "https://api.plotly.com/v2/files/hackathon_test:76", "plots": "https://api.plotly.com/v2/plots/hackathon_test:76", "parent": "https://api.plotly.com/v2/folders/home?user=hackathon_test" }, "owner": "hackathon_test", "parent": -1, "preview": "", "referencers": [], "references": [], "title": "", "views": 0, "web_url": "https://chart-studio.plotly.com/~hackathon_test/76/", "world_readable": true, "date_modified": "2025-09-16T04:36:20.712Z", "stars": { "results": [], "count": 0 }, "collaborators": { "results": [], "count": 0 }, "subfolder_count": null, "refresh_interval": null, "organize_view_url": "https://chart-studio.plotly.com/~hackathon_test/76/", "current_user_permission": "read", "is_theme": null, "is_template": null, "autosize": true, "caption": "", "figure": { "data": [ { "name": "aws_lb.hack_lb", "type": "bar", "xsrc": "hackathon_test:73:c1e11c", "ysrc": "hackathon_test:73:94f767", "xaxis": "x", "yaxis": "y", "marker": { "color": "rgb(229, 134, 6)", "pattern": { "shape": "" } }, "showlegend": true, "legendgroup": "aws_lb.hack_lb", "offsetgroup": "aws_lb.hack_lb", "orientation": "v", "textposition": "auto", "hovertemplate": "Resource=%{x}<br>Monthly Cost ($)=%{y}<extra></extra>", "alignmentgroup": "True" }, { "name": "aws_db_instance.hack_db", "type": "bar", "xsrc": "hackathon_test:73:5662d0", "ysrc": "hackathon_test:73:e8af04", "xaxis": "x", "yaxis": "y", "marker": { "color": "rgb(93, 105, 177)", "pattern": { "shape": "" } }, "showlegend": true, "legendgroup": "aws_db_instance.hack_db", "offsetgroup": "aws_db_instance.hack_db", "orientation": "v", "textposition": "auto", "hovertemplate": "Resource=%{x}<br>Monthly Cost ($)=%{y}<extra></extra>", "alignmentgroup": "True" }, { "name": "aws_instance.hack_vm", "type": "bar", "xsrc": "hackathon_test:73:4865a9", "ysrc": "hackathon_test:73:03532c", "xaxis": "x", "yaxis": "y", "marker": { "color": "rgb(82, 188, 163)", "pattern": { "shape": "" } }, "showlegend": true, "legendgroup": "aws_instance.hack_vm", "offsetgroup": "aws_instance.hack_vm", "orientation": "v", "textposition": "auto", "hovertemplate": "Resource=%{x}<br>Monthly Cost ($)=%{y}<extra></extra>", "alignmentgroup": "True" }, { "name": "aws_instance.hack_vm2", "type": "bar", "xsrc": "hackathon_test:73:6b537b", "ysrc": "hackathon_test:73:258a9d", "xaxis": "x", "yaxis": "y", "marker": { "color": "rgb(153, 201, 69)", "pattern": { "shape": "" } }, "showlegend": true, "legendgroup": "aws_instance.hack_vm2", "offsetgroup": "aws_instance.hack_vm2", "orientation": "v", "textposition": "auto", "hovertemplate": "Resource=%{x}<br>Monthly Cost ($)=%{y}<extra></extra>", "alignmentgroup": "True" }, { "name": "aws_ebs_volume.hack_volume", "type": "bar", "xsrc": "hackathon_test:73:05d1e4", "ysrc": "hackathon_test:73:e1a59d", "xaxis": "x", "yaxis": "y", "marker": { "color": "rgb(204, 97, 176)", "pattern": { "shape": "" } }, "showlegend": true, "legendgroup": "aws_ebs_volume.hack_volume", "offsetgroup": "aws_ebs_volume.hack_volume", "orientation": "v", "textposition": "auto", "hovertemplate": "Resource=%{x}<br>Monthly Cost ($)=%{y}<extra></extra>", "alignmentgroup": "True" }, { "type": "table", "cells": { "fill": { "colorsrc": "hackathon_test:73:b0c426" }, "font": { "size": 11 }, "align": "center", "valuessrc": "hackathon_test:73:7de237" }, "domain": { "x": [ 0.0, 1.0 ], "y": [ 0.0, 0.2976 ] }, "header": { "fill": { "color": "lightgrey" }, "font": { "size": 12, "color": "black" }, "align": "center", "valuessrc": "hackathon_test:73:263170" } } ], "layout": { "title": { "text": "Monthly Infracost Breakdown per Resource" }, "width": 1200, "xaxis": { "anchor": "y", "domain": [ 0.0, 1.0 ] }, "yaxis": { "anchor": "x", "domain": [ 0.3676, 1.0 ] }, "height": 900, "template": { "data": { "table": [ { "type": "table", "cells": { "fill": { "color": "#000038" }, "font": { "color": "#000037" }, "line": { "color": "#000039" } }, "header": { "fill": { "color": "#000040" }, "font": { "color": "#000036" }, "line": { "color": "#000039" } } } ], "icicle": [ { "type": "icicle", "textfont": { "color": "white" } } ], "sankey": [ { "type": "sankey", "textfont": { "color": "#000036" } } ], "contour": [ { "type": "contour", "colorscale": [ [ 0.0, "#000011" ], [ 0.1111111111111111, "#000012" ], [ 0.2222222222222222, "#000013" ], [ 0.3333333333333333, "#000014" ], [ 0.4444444444444444, "#000015" ], [ 0.5555555555555556, "#000016" ], [ 0.6666666666666666, "#000017" ], [ 0.7777777777777778, "#000018" ], [ 0.8888888888888888, "#000019" ], [ 1.0, "#000020" ] ] } ], "heatmap": [ { "type": "heatmap", "colorscale": [ [ 0.0, "#000011" ], [ 0.1111111111111111, "#000012" ], [ 0.2222222222222222, "#000013" ], [ 0.3333333333333333, "#000014" ], [ 0.4444444444444444, "#000015" ], [ 0.5555555555555556, "#000016" ], [ 0.6666666666666666, "#000017" ], [ 0.7777777777777778, "#000018" ], [ 0.8888888888888888, "#000019" ], [ 1.0, "#000020" ] ] } ], "scatter": [ { "type": "scatter", "marker": { "line": { "width": 0 } } } ], "waterfall": [ { "type": "waterfall", "totals": { "marker": { "color": "#000034" } }, "connector": { "line": { "color": "#000036", "width": 2 } }, "decreasing": { "marker": { "color": "#000033" } }, "increasing": { "marker": { "color": "#000032" } } } ], "candlestick": [ { "type": "candlestick", "decreasing": { "line": { "color": "#000033" } }, "increasing": { "line": { "color": "#000032" } } } ], "histogram2d": [ { "type": "histogram2d", "colorscale": [ [ 0.0, "#000011" ], [ 0.1111111111111111, "#000012" ], [ 0.2222222222222222, "#000013" ], [ 0.3333333333333333, "#000014" ], [ 0.4444444444444444, "#000015" ], [ 0.5555555555555556, "#000016" ], [ 0.6666666666666666, "#000017" ], [ 0.7777777777777778, "#000018" ], [ 0.8888888888888888, "#000019" ], [ 1.0, "#000020" ] ] } ], "contourcarpet": [ { "type": "contourcarpet", "colorscale": [ [ 0.0, "#000011" ], [ 0.1111111111111111, "#000012" ], [ 0.2222222222222222, "#000013" ], [ 0.3333333333333333, "#000014" ], [ 0.4444444444444444, "#000015" ], [ 0.5555555555555556, "#000016" ], [ 0.6666666666666666, "#000017" ], [ 0.7777777777777778, "#000018" ], [ 0.8888888888888888, "#000019" ], [ 1.0, "#000020" ] ] } ] }, "layout": { "colorway": [ "#000001", "#000002", "#000003", "#000004", "#000005", "#000006", "#000007", "#000008", "#000009", "#000010" ], "coloraxis": { "colorscale": [ [ 0.0, "#000011" ], [ 0.1111111111111111, "#000012" ], [ 0.2222222222222222, "#000013" ], [ 0.3333333333333333, "#000014" ], [ 0.4444444444444444, "#000015" ], [ 0.5555555555555556, "#000016" ], [ 0.6666666666666666, "#000017" ], [ 0.7777777777777778, "#000018" ], [ 0.8888888888888888, "#000019" ], [ 1.0, "#000020" ] ] }, "colorscale": { "diverging": [ [ 0.0, "#000021" ], [ 0.1, "#000022" ], [ 0.2, "#000023" ], [ 0.3, "#000024" ], [ 0.4, "#000025" ], [ 0.5, "#000026" ], [ 0.6, "#000027" ], [ 0.7, "#000028" ], [ 0.8, "#000029" ], [ 0.9, "#000030" ], [ 1.0, "#000031" ] ], "sequential": [ [ 0.0, "#000011" ], [ 0.1111111111111111, "#000012" ], [ 0.2222222222222222, "#000013" ], [ 0.3333333333333333, "#000014" ], [ 0.4444444444444444, "#000015" ], [ 0.5555555555555556, "#000016" ], [ 0.6666666666666666, "#000017" ], [ 0.7777777777777778, "#000018" ], [ 0.8888888888888888, "#000019" ], [ 1.0, "#000020" ] ], "sequentialminus": [ [ 0.0, "#000011" ], [ 0.1111111111111111, "#000012" ], [ 0.2222222222222222, "#000013" ], [ 0.3333333333333333, "#000014" ], [ 0.4444444444444444, "#000015" ], [ 0.5555555555555556, "#000016" ], [ 0.6666666666666666, "#000017" ], [ 0.7777777777777778, "#000018" ], [ 0.8888888888888888, "#000019" ], [ 1.0, "#000020" ] ] } } }, "plot_bgcolor": "rgba(245,245,245,1)", "paper_bgcolor": "rgba(245,245,245,1)" } }, "height": 900, "width": 1200, "user": { "profile_url": "https://chart-studio.plotly.com/~hackathon_test", "avatar_url": "https://storage.googleapis.com/plotly-prod-profiles/21.jpg", "background_url": "https://storage.googleapis.com/plotly-prod-profiles/bg-7.jpg", "bio": "", "nickname": "", "website": "", "stream_tokens": null, "feature_set_id": null, "csrf_token": null, "date_joined": "2025-09-16 02:59:33", "mapbox_access_tokens": null, "has_password": null, "username": "hackathon_test", "email": null, "is_active": null, "readonly": null, "is_dash_creator": null, "dash_created_count": null, "is_chart_creator": null, "charts_created_count": null } }, { "creation_time": "2025-09-16T04:36:18.440681Z", "comments": { "results": [], "count": 0 }, "parented": true, "embed_url": "https://chart-studio.plotly.com/~hackathon_test/75.embed", "fid": "hackathon_test:75", "filename": "infracost-graph-table-1757997372", "filetype": "plot", "img_url": "https://storage.googleapis.com/plotly-prod-images/hackathon_test/75/9_LIFHOQY0PHVUJZ7CDT61K1NVT6BMW1.png", "image_urls": { "default": "https://storage.googleapis.com/plotly-prod-images/hackathon_test/75/2_GCMU4XEGTLGLQ6VR0JTQXSK5KYN4YM.png", "block-thumb": "https://storage.googleapis.com/plotly-prod-images/hackathon_test/75/8_UFNO95C2AWY6WPCDITSY502REVHPT7.png", "list-thumb": "https://storage.googleapis.com/plotly-prod-images/hackathon_test/75/9_LIFHOQY0PHVUJZ7CDT61K1NVT6BMW1.png" }, "api_urls": { "files": "https://api.plotly.com/v2/files/hackathon_test:75", "plots": "https://api.plotly.com/v2/plots/hackathon_test:75", "parent": "https://api.plotly.com/v2/folders/home?user=hackathon_test" }, "owner": "hackathon_test", "parent": -1, "preview": "", "referencers": [], "references": [], "title": "", "views": 0, "web_url": "https://chart-studio.plotly.com/~hackathon_test/75/", "world_readable": true, "date_modified": "2025-09-16T04:36:18.451Z", "stars": { "results": [], "count": 0 }, "collaborators": { "results": [], "count": 0 }, "subfolder_count": null, "refresh_interval": null, "organize_view_url": "https://chart-studio.plotly.com/~hackathon_test/75/", "current_user_permission": "read", "is_theme": null, "is_template": null, "autosize": true, "caption": "", "figure": { "data": [ { "name": "aws_lb.hack_lb", "type": "bar", "xsrc": "hackathon_test:72:ad9b84", "ysrc": "hackathon_test:72:aee903", "xaxis": "x", "yaxis": "y", "marker": { "color": "rgb(229, 134, 6)", "pattern": { "shape": "" } }, "showlegend": true, "legendgroup": "aws_lb.hack_lb", "offsetgroup": "aws_lb.hack_lb", "orientation": "v", "textposition": "auto", "hovertemplate": "Resource=%{x}<br>Monthly Cost ($)=%{y}<extra></extra>", "alignmentgroup": "True" }, { "name": "aws_db_instance.hack_db", "type": "bar", "xsrc": "hackathon_test:72:cf4607", "ysrc": "hackathon_test:72:a42836", "xaxis": "x", "yaxis": "y", "marker": { "color": "rgb(93, 105, 177)", "pattern": { "shape": "" } }, "showlegend": true, "legendgroup": "aws_db_instance.hack_db", "offsetgroup": "aws_db_instance.hack_db", "orientation": "v", "textposition": "auto", "hovertemplate": "Resource=%{x}<br>Monthly Cost ($)=%{y}<extra></extra>", "alignmentgroup": "True" }, { "name": "aws_instance.hack_vm", "type": "bar", "xsrc": "hackathon_test:72:89b807", "ysrc": "hackathon_test:72:0f8b01", "xaxis": "x", "yaxis": "y", "marker": { "color": "rgb(82, 188, 163)", "pattern": { "shape": "" } }, "showlegend": true, "legendgroup": "aws_instance.hack_vm", "offsetgroup": "aws_instance.hack_vm", "orientation": "v", "textposition": "auto", "hovertemplate": "Resource=%{x}<br>Monthly Cost ($)=%{y}<extra></extra>", "alignmentgroup": "True" }, { "name": "aws_instance.hack_vm2", "type": "bar", "xsrc": "hackathon_test:72:832f07", "ysrc": "hackathon_test:72:aacc48", "xaxis": "x", "yaxis": "y", "marker": { "color": "rgb(153, 201, 69)", "pattern": { "shape": "" } }, "showlegend": true, "legendgroup": "aws_instance.hack_vm2", "offsetgroup": "aws_instance.hack_vm2", "orientation": "v", "textposition": "auto", "hovertemplate": "Resource=%{x}<br>Monthly Cost ($)=%{y}<extra></extra>", "alignmentgroup": "True" }, { "name": "aws_ebs_volume.hack_volume", "type": "bar", "xsrc": "hackathon_test:72:02d90d", "ysrc": "hackathon_test:72:aa42c4", "xaxis": "x", "yaxis": "y", "marker": { "color": "rgb(204, 97, 176)", "pattern": { "shape": "" } }, "showlegend": true, "legendgroup": "aws_ebs_volume.hack_volume", "offsetgroup": "aws_ebs_volume.hack_volume", "orientation": "v", "textposition": "auto", "hovertemplate": "Resource=%{x}<br>Monthly Cost ($)=%{y}<extra></extra>", "alignmentgroup": "True" }, { "type": "table", "cells": { "fill": { "colorsrc": "hackathon_test:72:d547ef" }, "font": { "size": 11 }, "align": "center", "valuessrc": "hackathon_test:72:f8d7a8" }, "domain": { "x": [ 0.0, 1.0 ], "y": [ 0.0, 0.2976 ] }, "header": { "fill": { "color": "lightgrey" }, "font": { "size": 12, "color": "black" }, "align": "center", "valuessrc": "hackathon_test:72:e71235" } } ], "layout": { "title": { "text": "Monthly Infracost Breakdown per Resource" }, "width": 1200, "xaxis": { "anchor": "y", "domain": [ 0.0, 1.0 ] }, "yaxis": { "anchor": "x", "domain": [ 0.3676, 1.0 ] }, "height": 900, "template": { "data": { "table": [ { "type": "table", "cells": { "fill": { "color": "#000038" }, "font": { "color": "#000037" }, "line": { "color": "#000039" } }, "header": { "fill": { "color": "#000040" }, "font": { "color": "#000036" }, "line": { "color": "#000039" } } } ], "icicle": [ { "type": "icicle", "textfont": { "color": "white" } } ], "sankey": [ { "type": "sankey", "textfont": { "color": "#000036" } } ], "contour": [ { "type": "contour", "colorscale": [ [ 0.0, "#000011" ], [ 0.1111111111111111, "#000012" ], [ 0.2222222222222222, "#000013" ], [ 0.3333333333333333, "#000014" ], [ 0.4444444444444444, "#000015" ], [ 0.5555555555555556, "#000016" ], [ 0.6666666666666666, "#000017" ], [ 0.7777777777777778, "#000018" ], [ 0.8888888888888888, "#000019" ], [ 1.0, "#000020" ] ] } ], "heatmap": [ { "type": "heatmap", "colorscale": [ [ 0.0, "#000011" ], [ 0.1111111111111111, "#000012" ], [ 0.2222222222222222, "#000013" ], [ 0.3333333333333333, "#000014" ], [ 0.4444444444444444, "#000015" ], [ 0.5555555555555556, "#000016" ], [ 0.6666666666666666, "#000017" ], [ 0.7777777777777778, "#000018" ], [ 0.8888888888888888, "#000019" ], [ 1.0, "#000020" ] ] } ], "scatter": [ { "type": "scatter", "marker": { "line": { "width": 0 } } } ], "waterfall": [ { "type": "waterfall", "totals": { "marker": { "color": "#000034" } }, "connector": { "line": { "color": "#000036", "width": 2 } }, "decreasing": { "marker": { "color": "#000033" } }, "increasing": { "marker": { "color": "#000032" } } } ], "candlestick": [ { "type": "candlestick", "decreasing": { "line": { "color": "#000033" } }, "increasing": { "line": { "color": "#000032" } } } ], "histogram2d": [ { "type": "histogram2d", "colorscale": [ [ 0.0, "#000011" ], [ 0.1111111111111111, "#000012" ], [ 0.2222222222222222, "#000013" ], [ 0.3333333333333333, "#000014" ], [ 0.4444444444444444, "#000015" ], [ 0.5555555555555556, "#000016" ], [ 0.6666666666666666, "#000017" ], [ 0.7777777777777778, "#000018" ], [ 0.8888888888888888, "#000019" ], [ 1.0, "#000020" ] ] } ], "contourcarpet": [ { "type": "contourcarpet", "colorscale": [ [ 0.0, "#000011" ], [ 0.1111111111111111, "#000012" ], [ 0.2222222222222222, "#000013" ], [ 0.3333333333333333, "#000014" ], [ 0.4444444444444444, "#000015" ], [ 0.5555555555555556, "#000016" ], [ 0.6666666666666666, "#000017" ], [ 0.7777777777777778, "#000018" ], [ 0.8888888888888888, "#000019" ], [ 1.0, "#000020" ] ] } ] }, "layout": { "colorway": [ "#000001", "#000002", "#000003", "#000004", "#000005", "#000006", "#000007", "#000008", "#000009", "#000010" ], "coloraxis": { "colorscale": [ [ 0.0, "#000011" ], [ 0.1111111111111111, "#000012" ], [ 0.2222222222222222, "#000013" ], [ 0.3333333333333333, "#000014" ], [ 0.4444444444444444, "#000015" ], [ 0.5555555555555556, "#000016" ], [ 0.6666666666666666, "#000017" ], [ 0.7777777777777778, "#000018" ], [ 0.8888888888888888, "#000019" ], [ 1.0, "#000020" ] ] }, "colorscale": { "diverging": [ [ 0.0, "#000021" ], [ 0.1, "#000022" ], [ 0.2, "#000023" ], [ 0.3, "#000024" ], [ 0.4, "#000025" ], [ 0.5, "#000026" ], [ 0.6, "#000027" ], [ 0.7, "#000028" ], [ 0.8, "#000029" ], [ 0.9, "#000030" ], [ 1.0, "#000031" ] ], "sequential": [ [ 0.0, "#000011" ], [ 0.1111111111111111, "#000012" ], [ 0.2222222222222222, "#000013" ], [ 0.3333333333333333, "#000014" ], [ 0.4444444444444444, "#000015" ], [ 0.5555555555555556, "#000016" ], [ 0.6666666666666666, "#000017" ], [ 0.7777777777777778, "#000018" ], [ 0.8888888888888888, "#000019" ], [ 1.0, "#000020" ] ], "sequentialminus": [ [ 0.0, "#000011" ], [ 0.1111111111111111, "#000012" ], [ 0.2222222222222222, "#000013" ], [ 0.3333333333333333, "#000014" ], [ 0.4444444444444444, "#000015" ], [ 0.5555555555555556, "#000016" ], [ 0.6666666666666666, "#000017" ], [ 0.7777777777777778, "#000018" ], [ 0.8888888888888888, "#000019" ], [ 1.0, "#000020" ] ] } } }, "plot_bgcolor": "rgba(245,245,245,1)", "paper_bgcolor": "rgba(245,245,245,1)" } }, "height": 900, "width": 1200, "user": { "profile_url": "https://chart-studio.plotly.com/~hackathon_test", "avatar_url": "https://storage.googleapis.com/plotly-prod-profiles/21.jpg", "background_url": "https://storage.googleapis.com/plotly-prod-profiles/bg-7.jpg", "bio": "", "nickname": "", "website": "", "stream_tokens": null, "feature_set_id": null, "csrf_token": null, "date_joined": "2025-09-16 02:59:33", "mapbox_access_tokens": null, "has_password": null, "username": "hackathon_test", "email": null, "is_active": null, "readonly": null, "is_dash_creator": null, "dash_created_count": null, "is_chart_creator": null, "charts_created_count": null } }, { "creation_time": "2025-09-16T04:36:17.168438Z", "comments": { "results": [], "count": 0 }, "parented": true, "embed_url": "https://chart-studio.plotly.com/~hackathon_test/74.embed", "fid": "hackathon_test:74", "filename": "infracost-graph-table-1757997370", "filetype": "plot", "img_url": "https://storage.googleapis.com/plotly-prod-images/hackathon_test/74/9_07DUUJO59EI8DDY56K3E1CEUK2LJAQ.png", "image_urls": { "default": "https://storage.googleapis.com/plotly-prod-images/hackathon_test/74/2_4QCQGBG9ZVKVJMDQC8F7VZU8LFZUOY.png", "block-thumb": "https://storage.googleapis.com/plotly-prod-images/hackathon_test/74/8_8QU96Z8DNUDD7BN85WUBXNY4MWYV75.png", "list-thumb": "https://storage.googleapis.com/plotly-prod-images/hackathon_test/74/9_07DUUJO59EI8DDY56K3E1CEUK2LJAQ.png" }, "api_urls": { "files": "https://api.plotly.com/v2/files/hackathon_test:74", "plots": "https://api.plotly.com/v2/plots/hackathon_test:74", "parent": "https://api.plotly.com/v2/folders/home?user=hackathon_test" }, "owner": "hackathon_test", "parent": -1, "preview": "", "referencers": [], "references": [], "title": "", "views": 0, "web_url": "https://chart-studio.plotly.com/~hackathon_test/74/", "world_readable": true, "date_modified": "2025-09-16T04:36:17.178Z", "stars": { "results": [], "count": 0 }, "collaborators": { "results": [], "count": 0 }, "subfolder_count": null, "refresh_interval": null, "organize_view_url": "https://chart-studio.plotly.com/~hackathon_test/74/", "current_user_permission": "read", "is_theme": null, "is_template": null, "autosize": true, "caption": "", "figure": { "data": [ { "name": "aws_lb.hack_lb", "type": "bar", "xsrc": "hackathon_test:71:fc5acb", "ysrc": "hackathon_test:71:0ca7c1", "xaxis": "x", "yaxis": "y", "marker": { "color": "rgb(229, 134, 6)", "pattern": { "shape": "" } }, "showlegend": true, "legendgroup": "aws_lb.hack_lb", "offsetgroup": "aws_lb.hack_lb", "orientation": "v", "textposition": "auto", "hovertemplate": "Resource=%{x}<br>Monthly Cost ($)=%{y}<extra></extra>", "alignmentgroup": "True" }, { "name": "aws_db_instance.hack_db", "type": "bar", "xsrc": "hackathon_test:71:112f9e", "ysrc": "hackathon_test:71:6f289a", "xaxis": "x", "yaxis": "y", "marker": { "color": "rgb(93, 105, 177)", "pattern": { "shape": "" } }, "showlegend": true, "legendgroup": "aws_db_instance.hack_db", "offsetgroup": "aws_db_instance.hack_db", "orientation": "v", "textposition": "auto", "hovertemplate": "Resource=%{x}<br>Monthly Cost ($)=%{y}<extra></extra>", "alignmentgroup": "True" }, { "name": "aws_instance.hack_vm", "type": "bar", "xsrc": "hackathon_test:71:791406", "ysrc": "hackathon_test:71:b978e6", "xaxis": "x", "yaxis": "y", "marker": { "color": "rgb(82, 188, 163)", "pattern": { "shape": "" } }, "showlegend": true, "legendgroup": "aws_instance.hack_vm", "offsetgroup": "aws_instance.hack_vm", "orientation": "v", "textposition": "auto", "hovertemplate": "Resource=%{x}<br>Monthly Cost ($)=%{y}<extra></extra>", "alignmentgroup": "True" }, { "name": "aws_instance.hack_vm2", "type": "bar", "xsrc": "hackathon_test:71:2a8282", "ysrc": "hackathon_test:71:2afd48", "xaxis": "x", "yaxis": "y", "marker": { "color": "rgb(153, 201, 69)", "pattern": { "shape": "" } }, "showlegend": true, "legendgroup": "aws_instance.hack_vm2", "offsetgroup": "aws_instance.hack_vm2", "orientation": "v", "textposition": "auto", "hovertemplate": "Resource=%{x}<br>Monthly Cost ($)=%{y}<extra></extra>", "alignmentgroup": "True" }, { "name": "aws_ebs_volume.hack_volume", "type": "bar", "xsrc": "hackathon_test:71:0d86a9", "ysrc": "hackathon_test:71:d465b7", "xaxis": "x", "yaxis": "y", "marker": { "color": "rgb(204, 97, 176)", "pattern": { "shape": "" } }, "showlegend": true, "legendgroup": "aws_ebs_volume.hack_volume", "offsetgroup": "aws_ebs_volume.hack_volume", "orientation": "v", "textposition": "auto", "hovertemplate": "Resource=%{x}<br>Monthly Cost ($)=%{y}<extra></extra>", "alignmentgroup": "True" }, { "type": "table", "cells": { "fill": { "colorsrc": "hackathon_test:71:08259e" }, "font": { "size": 11 }, "align": "center", "valuessrc": "hackathon_test:71:91d885" }, "domain": { "x": [ 0.0, 1.0 ], "y": [ 0.0, 0.2976 ] }, "header": { "fill": { "color": "lightgrey" }, "font": { "size": 12, "color": "black" }, "align": "center", "valuessrc": "hackathon_test:71:4212a4" } } ], "layout": { "title": { "text": "Monthly Infracost Breakdown per Resource" }, "width": 1200, "xaxis": { "anchor": "y", "domain": [ 0.0, 1.0 ] }, "yaxis": { "anchor": "x", "domain": [ 0.3676, 1.0 ] }, "height": 900, "template": { "data": { "table": [ { "type": "table", "cells": { "fill": { "color": "#000038" }, "font": { "color": "#000037" }, "line": { "color": "#000039" } }, "header": { "fill": { "color": "#000040" }, "font": { "color": "#000036" }, "line": { "color": "#000039" } } } ], "icicle": [ { "type": "icicle", "textfont": { "color": "white" } } ], "sankey": [ { "type": "sankey", "textfont": { "color": "#000036" } } ], "contour": [ { "type": "contour", "colorscale": [ [ 0.0, "#000011" ], [ 0.1111111111111111, "#000012" ], [ 0.2222222222222222, "#000013" ], [ 0.3333333333333333, "#000014" ], [ 0.4444444444444444, "#000015" ], [ 0.5555555555555556, "#000016" ], [ 0.6666666666666666, "#000017" ], [ 0.7777777777777778, "#000018" ], [ 0.8888888888888888, "#000019" ], [ 1.0, "#000020" ] ] } ], "heatmap": [ { "type": "heatmap", "colorscale": [ [ 0.0, "#000011" ], [ 0.1111111111111111, "#000012" ], [ 0.2222222222222222, "#000013" ], [ 0.3333333333333333, "#000014" ], [ 0.4444444444444444, "#000015" ], [ 0.5555555555555556, "#000016" ], [ 0.6666666666666666, "#000017" ], [ 0.7777777777777778, "#000018" ], [ 0.8888888888888888, "#000019" ], [ 1.0, "#000020" ] ] } ], "scatter": [ { "type": "scatter", "marker": { "line": { "width": 0 } } } ], "waterfall": [ { "type": "waterfall", "totals": { "marker": { "color": "#000034" } }, "connector": { "line": { "color": "#000036", "width": 2 } }, "decreasing": { "marker": { "color": "#000033" } }, "increasing": { "marker": { "color": "#000032" } } } ], "candlestick": [ { "type": "candlestick", "decreasing": { "line": { "color": "#000033" } }, "increasing": { "line": { "color": "#000032" } } } ], "histogram2d": [ { "type": "histogram2d", "colorscale": [ [ 0.0, "#000011" ], [ 0.1111111111111111, "#000012" ], [ 0.2222222222222222, "#000013" ], [ 0.3333333333333333, "#000014" ], [ 0.4444444444444444, "#000015" ], [ 0.5555555555555556, "#000016" ], [ 0.6666666666666666, "#000017" ], [ 0.7777777777777778, "#000018" ], [ 0.8888888888888888, "#000019" ], [ 1.0, "#000020" ] ] } ], "contourcarpet": [ { "type": "contourcarpet", "colorscale": [ [ 0.0, "#000011" ], [ 0.1111111111111111, "#000012" ], [ 0.2222222222222222, "#000013" ], [ 0.3333333333333333, "#000014" ], [ 0.4444444444444444, "#000015" ], [ 0.5555555555555556, "#000016" ], [ 0.6666666666666666, "#000017" ], [ 0.7777777777777778, "#000018" ], [ 0.8888888888888888, "#000019" ], [ 1.0, "#000020" ] ] } ] }, "layout": { "colorway": [ "#000001", "#000002", "#000003", "#000004", "#000005", "#000006", "#000007", "#000008", "#000009", "#000010" ], "coloraxis": { "colorscale": [ [ 0.0, "#000011" ], [ 0.1111111111111111, "#000012" ], [ 0.2222222222222222, "#000013" ], [ 0.3333333333333333, "#000014" ], [ 0.4444444444444444, "#000015" ], [ 0.5555555555555556, "#000016" ], [ 0.6666666666666666, "#000017" ], [ 0.7777777777777778, "#000018" ], [ 0.8888888888888888, "#000019" ], [ 1.0, "#000020" ] ] }, "colorscale": { "diverging": [ [ 0.0, "#000021" ], [ 0.1, "#000022" ], [ 0.2, "#000023" ], [ 0.3, "#000024" ], [ 0.4, "#000025" ], [ 0.5, "#000026" ], [ 0.6, "#000027" ], [ 0.7, "#000028" ], [ 0.8, "#000029" ], [ 0.9, "#000030" ], [ 1.0, "#000031" ] ], "sequential": [ [ 0.0, "#000011" ], [ 0.1111111111111111, "#000012" ], [ 0.2222222222222222, "#000013" ], [ 0.3333333333333333, "#000014" ], [ 0.4444444444444444, "#000015" ], [ 0.5555555555555556, "#000016" ], [ 0.6666666666666666, "#000017" ], [ 0.7777777777777778, "#000018" ], [ 0.8888888888888888, "#000019" ], [ 1.0, "#000020" ] ], "sequentialminus": [ [ 0.0, "#000011" ], [ 0.1111111111111111, "#000012" ], [ 0.2222222222222222, "#000013" ], [ 0.3333333333333333, "#000014" ], [ 0.4444444444444444, "#000015" ], [ 0.5555555555555556, "#000016" ], [ 0.6666666666666666, "#000017" ], [ 0.7777777777777778, "#000018" ], [ 0.8888888888888888, "#000019" ], [ 1.0, "#000020" ] ] } } }, "plot_bgcolor": "rgba(245,245,245,1)", "paper_bgcolor": "rgba(245,245,245,1)" } }, "height": 900, "width": 1200, "user": { "profile_url": "https://chart-studio.plotly.com/~hackathon_test", "avatar_url": "https://storage.googleapis.com/plotly-prod-profiles/21.jpg", "background_url": "https://storage.googleapis.com/plotly-prod-profiles/bg-7.jpg", "bio": "", "nickname": "", "website": "", "stream_tokens": null, "feature_set_id": null, "csrf_token": null, "date_joined": "2025-09-16 02:59:33", "mapbox_access_tokens": null, "has_password": null, "username": "hackathon_test", "email": null, "is_active": null, "readonly": null, "is_dash_creator": null, "dash_created_count": null, "is_chart_creator": null, "charts_created_count": null } }, { "creation_time": "2025-09-16T04:36:12.358077Z", "comments": { "results": [], "count": 0 }, "parented": true, "embed_url": "https://chart-studio.plotly.com/~hackathon_test/68.embed", "fid": "hackathon_test:68", "filename": "infracost-graph-table-1757997365", "filetype": "plot", "img_url": "https://storage.googleapis.com/plotly-prod-images/hackathon_test/68/9_BDQHVREBA1PL3K4B1XCJEG5PTM2A5H.png", "image_urls": { "default": "https://storage.googleapis.com/plotly-prod-images/hackathon_test/68/2_T2OEOW7Z92J9SR4JY91TGHQTZ7CHIN.png", "block-thumb": "https://storage.googleapis.com/plotly-prod-images/hackathon_test/68/8_3ZNWWUCH9AZ8F4WGFA6FGD1I9MG6T6.png", "list-thumb": "https://storage.googleapis.com/plotly-prod-images/hackathon_test/68/9_BDQHVREBA1PL3K4B1XCJEG5PTM2A5H.png" }, "api_urls": { "files": "https://api.plotly.com/v2/files/hackathon_test:68", "plots": "https://api.plotly.com/v2/plots/hackathon_test:68", "parent": "https://api.plotly.com/v2/folders/home?user=hackathon_test" }, "owner": "hackathon_test", "parent": -1, "preview": "", "referencers": [], "references": [], "title": "", "views": 0, "web_url": "https://chart-studio.plotly.com/~hackathon_test/68/", "world_readable": true, "date_modified": "2025-09-16T04:36:12.368Z", "stars": { "results": [], "count": 0 }, "collaborators": { "results": [], "count": 0 }, "subfolder_count": null, "refresh_interval": null, "organize_view_url": "https://chart-studio.plotly.com/~hackathon_test/68/", "current_user_permission": "read", "is_theme": null, "is_template": null, "autosize": true, "caption": "", "figure": { "data": [ { "name": "aws_lb.hack_lb", "type": "bar", "xsrc": "hackathon_test:66:d7ef53", "ysrc": "hackathon_test:66:f31036", "xaxis": "x", "yaxis": "y", "marker": { "color": "rgb(229, 134, 6)", "pattern": { "shape": "" } }, "showlegend": true, "legendgroup": "aws_lb.hack_lb", "offsetgroup": "aws_lb.hack_lb", "orientation": "v", "textposition": "auto", "hovertemplate": "Resource=%{x}<br>Monthly Cost ($)=%{y}<extra></extra>", "alignmentgroup": "True" }, { "name": "aws_db_instance.hack_db", "type": "bar", "xsrc": "hackathon_test:66:e66c25", "ysrc": "hackathon_test:66:1e84a9", "xaxis": "x", "yaxis": "y", "marker": { "color": "rgb(93, 105, 177)", "pattern": { "shape": "" } }, "showlegend": true, "legendgroup": "aws_db_instance.hack_db", "offsetgroup": "aws_db_instance.hack_db", "orientation": "v", "textposition": "auto", "hovertemplate": "Resource=%{x}<br>Monthly Cost ($)=%{y}<extra></extra>", "alignmentgroup": "True" }, { "name": "aws_instance.hack_vm", "type": "bar", "xsrc": "hackathon_test:66:80f1fc", "ysrc": "hackathon_test:66:534187", "xaxis": "x", "yaxis": "y", "marker": { "color": "rgb(82, 188, 163)", "pattern": { "shape": "" } }, "showlegend": true, "legendgroup": "aws_instance.hack_vm", "offsetgroup": "aws_instance.hack_vm", "orientation": "v", "textposition": "auto", "hovertemplate": "Resource=%{x}<br>Monthly Cost ($)=%{y}<extra></extra>", "alignmentgroup": "True" }, { "name": "aws_instance.hack_vm2", "type": "bar", "xsrc": "hackathon_test:66:27e767", "ysrc": "hackathon_test:66:c75f31", "xaxis": "x", "yaxis": "y", "marker": { "color": "rgb(153, 201, 69)", "pattern": { "shape": "" } }, "showlegend": true, "legendgroup": "aws_instance.hack_vm2", "offsetgroup": "aws_instance.hack_vm2", "orientation": "v", "textposition": "auto", "hovertemplate": "Resource=%{x}<br>Monthly Cost ($)=%{y}<extra></extra>", "alignmentgroup": "True" }, { "name": "aws_ebs_volume.hack_volume", "type": "bar", "xsrc": "hackathon_test:66:3c1859", "ysrc": "hackathon_test:66:443e20", "xaxis": "x", "yaxis": "y", "marker": { "color": "rgb(204, 97, 176)", "pattern": { "shape": "" } }, "showlegend": true, "legendgroup": "aws_ebs_volume.hack_volume", "offsetgroup": "aws_ebs_volume.hack_volume", "orientation": "v", "textposition": "auto", "hovertemplate": "Resource=%{x}<br>Monthly Cost ($)=%{y}<extra></extra>", "alignmentgroup": "True" }, { "type": "table", "cells": { "fill": { "colorsrc": "hackathon_test:66:fc9ac1" }, "font": { "size": 11 }, "align": "center", "valuessrc": "hackathon_test:66:f8c2e0" }, "domain": { "x": [ 0.0, 1.0 ], "y": [ 0.0, 0.2976 ] }, "header": { "fill": { "color": "lightgrey" }, "font": { "size": 12, "color": "black" }, "align": "center", "valuessrc": "hackathon_test:66:e04811" } } ], "layout": { "title": { "text": "Monthly Infracost Breakdown per Resource" }, "width": 1200, "xaxis": { "anchor": "y", "domain": [ 0.0, 1.0 ] }, "yaxis": { "anchor": "x", "domain": [ 0.3676, 1.0 ] }, "height": 900, "template": { "data": { "table": [ { "type": "table", "cells": { "fill": { "color": "#000038" }, "font": { "color": "#000037" }, "line": { "color": "#000039" } }, "header": { "fill": { "color": "#000040" }, "font": { "color": "#000036" }, "line": { "color": "#000039" } } } ], "icicle": [ { "type": "icicle", "textfont": { "color": "white" } } ], "sankey": [ { "type": "sankey", "textfont": { "color": "#000036" } } ], "contour": [ { "type": "contour", "colorscale": [ [ 0.0, "#000011" ], [ 0.1111111111111111, "#000012" ], [ 0.2222222222222222, "#000013" ], [ 0.3333333333333333, "#000014" ], [ 0.4444444444444444, "#000015" ], [ 0.5555555555555556, "#000016" ], [ 0.6666666666666666, "#000017" ], [ 0.7777777777777778, "#000018" ], [ 0.8888888888888888, "#000019" ], [ 1.0, "#000020" ] ] } ], "heatmap": [ { "type": "heatmap", "colorscale": [ [ 0.0, "#000011" ], [ 0.1111111111111111, "#000012" ], [ 0.2222222222222222, "#000013" ], [ 0.3333333333333333, "#000014" ], [ 0.4444444444444444, "#000015" ], [ 0.5555555555555556, "#000016" ], [ 0.6666666666666666, "#000017" ], [ 0.7777777777777778, "#000018" ], [ 0.8888888888888888, "#000019" ], [ 1.0, "#000020" ] ] } ], "scatter": [ { "type": "scatter", "marker": { "line": { "width": 0 } } } ], "waterfall": [ { "type": "waterfall", "totals": { "marker": { "color": "#000034" } }, "connector": { "line": { "color": "#000036", "width": 2 } }, "decreasing": { "marker": { "color": "#000033" } }, "increasing": { "marker": { "color": "#000032" } } } ], "candlestick": [ { "type": "candlestick", "decreasing": { "line": { "color": "#000033" } }, "increasing": { "line": { "color": "#000032" } } } ], "histogram2d": [ { "type": "histogram2d", "colorscale": [ [ 0.0, "#000011" ], [ 0.1111111111111111, "#000012" ], [ 0.2222222222222222, "#000013" ], [ 0.3333333333333333, "#000014" ], [ 0.4444444444444444, "#000015" ], [ 0.5555555555555556, "#000016" ], [ 0.6666666666666666, "#000017" ], [ 0.7777777777777778, "#000018" ], [ 0.8888888888888888, "#000019" ], [ 1.0, "#000020" ] ] } ], "contourcarpet": [ { "type": "contourcarpet", "colorscale": [ [ 0.0, "#000011" ], [ 0.1111111111111111, "#000012" ], [ 0.2222222222222222, "#000013" ], [ 0.3333333333333333, "#000014" ], [ 0.4444444444444444, "#000015" ], [ 0.5555555555555556, "#000016" ], [ 0.6666666666666666, "#000017" ], [ 0.7777777777777778, "#000018" ], [ 0.8888888888888888, "#000019" ], [ 1.0, "#000020" ] ] } ] }, "layout": { "colorway": [ "#000001", "#000002", "#000003", "#000004", "#000005", "#000006", "#000007", "#000008", "#000009", "#000010" ], "coloraxis": { "colorscale": [ [ 0.0, "#000011" ], [ 0.1111111111111111, "#000012" ], [ 0.2222222222222222, "#000013" ], [ 0.3333333333333333, "#000014" ], [ 0.4444444444444444, "#000015" ], [ 0.5555555555555556, "#000016" ], [ 0.6666666666666666, "#000017" ], [ 0.7777777777777778, "#000018" ], [ 0.8888888888888888, "#000019" ], [ 1.0, "#000020" ] ] }, "colorscale": { "diverging": [ [ 0.0, "#000021" ], [ 0.1, "#000022" ], [ 0.2, "#000023" ], [ 0.3, "#000024" ], [ 0.4, "#000025" ], [ 0.5, "#000026" ], [ 0.6, "#000027" ], [ 0.7, "#000028" ], [ 0.8, "#000029" ], [ 0.9, "#000030" ], [ 1.0, "#000031" ] ], "sequential": [ [ 0.0, "#000011" ], [ 0.1111111111111111, "#000012" ], [ 0.2222222222222222, "#000013" ], [ 0.3333333333333333, "#000014" ], [ 0.4444444444444444, "#000015" ], [ 0.5555555555555556, "#000016" ], [ 0.6666666666666666, "#000017" ], [ 0.7777777777777778, "#000018" ], [ 0.8888888888888888, "#000019" ], [ 1.0, "#000020" ] ], "sequentialminus": [ [ 0.0, "#000011" ], [ 0.1111111111111111, "#000012" ], [ 0.2222222222222222, "#000013" ], [ 0.3333333333333333, "#000014" ], [ 0.4444444444444444, "#000015" ], [ 0.5555555555555556, "#000016" ], [ 0.6666666666666666, "#000017" ], [ 0.7777777777777778, "#000018" ], [ 0.8888888888888888, "#000019" ], [ 1.0, "#000020" ] ] } } }, "plot_bgcolor": "rgba(245,245,245,1)", "paper_bgcolor": "rgba(245,245,245,1)" } }, "height": 900, "width": 1200, "user": { "profile_url": "https://chart-studio.plotly.com/~hackathon_test", "avatar_url": "https://storage.googleapis.com/plotly-prod-profiles/21.jpg", "background_url": "https://storage.googleapis.com/plotly-prod-profiles/bg-7.jpg", "bio": "", "nickname": "", "website": "", "stream_tokens": null, "feature_set_id": null, "csrf_token": null, "date_joined": "2025-09-16 02:59:33", "mapbox_access_tokens": null, "has_password": null, "username": "hackathon_test", "email": null, "is_active": null, "readonly": null, "is_dash_creator": null, "dash_created_count": null, "is_chart_creator": null, "charts_created_count": null } } ] }
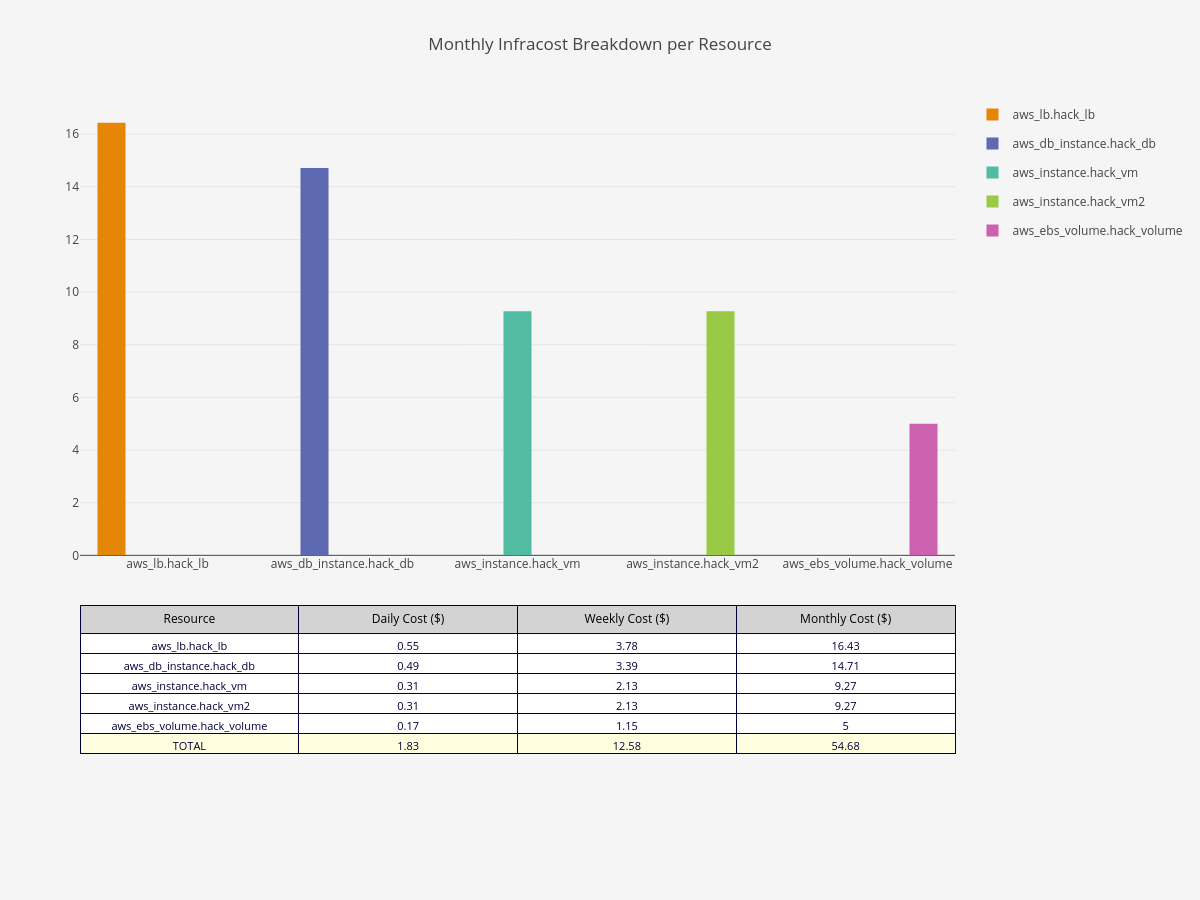