Feed
Plots
This endpoint handles manipulation of Plotly plot files.
Reference
Authorization
Any user with or without a Plotly account may view public plots. For private plots, see authentication.
Actions
list
Listing all public plots can be done via a GET request to this endpoint.
By default, plots will be listed in order of date created. The order_by
query parameter is accepted at this endpoint. Currently, only ordering by
views is supported. It is possible to filter the plots by quality
with min_quality or max_quality as query parameter.
Example:
// GET https://api.plotly.com/v2/plots/ ---> 200

// GET https://api.plotly.com/v2/plots/?order_by=-views ---> 200

// GET https://api.plotly.com/v2/plots/?min_quality=5 ---> 200

// GET https://api.plotly.com/v2/plots/?max_quality=5 ---> 200
feed
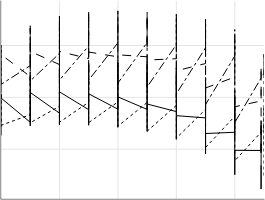
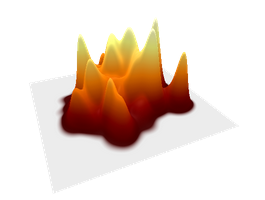
Listing all handpicked feed plots can be done via a GET request to this endpoint. By default, plots will be listed in a random order.
Example:
// GET https://api.plotly.com/v2/plots/feed ---> 200
create
You can create new plot resources here. The only required field is 'figure'. Currently, the figure is restricted to only contain references to grid data. That is, this will fail if raw data arrays are passed in. To create and manipulate underlying grids for plots, see the grids endpoint.
Example:
// This fails because a figure field is required.
// POST https://api.plotly.com/v2/plots ---> 400 Bad Request
{}

// This fails because the figure has raw data
//POST https://api.plotly.com/v2/plots ---> 400 Bad Request
{
    "figure": {"data": [{"y": ['this', 'is', 'raw', 'data']}]}
}

// This succeeds because the figure has src keys, not raw data.
//POST https://api.plotly.com/v2/plots ---> 200 OK
{
    "figure": {"data": [{"ysrc": "sven:88:u8nd62"}]}
}
When creating a grid, you can optionally specify a source_fid to specify where a plot has come from:
- source_fid: the fid of a plot that was copied (and presumably edited) to produce this one
detail
There is a lot of meta information stored about plot files including filename, title, share_url, and content_url to name a few.
This information can only be reached with a GET to this endpoint.
Example:
// GET https://api.plotly.com/v2/plots/iheartgraphs:90
content
The contents of a plot can be downloaded via the content resource. The plot
content contains referenced grid/column data by default. If you wish to
return the raw grid/column data, the inline_data=true query must be included
in the request url. The Content-Type header will be appropriately set for the
response body.
Alternatively, you can set ?map_data=unreadable to append a mapping of
sources to data that belongs to grids which are unreadable for the
requestor. This is useful when you have read access to another users plot,
but that plot contains grid references which you don't have access to.
Examples:
// Returns referenced grid/column data
// GET https://api.plotly.com/v2/plots/iheartgraphs:90/content ---> 200 OK

// Returns full grid/column data
// GET https://api.plotly.com/v2/plots/iheartgraphs:90/content?inline_data=true ---> 200 OK

// Returns full grid/column data when requestor doesn't have permission
// to read the referenced grid.
// GET https://api.plotly.com/v2/plots/iheartgraphs:90/content?map_data=unreadable ---> 200 OK
GET /v2/plots/feed?format=api&order_by=-views
{ "next": "https://api.plotly.com/v2/plots/feed", "previous": "https://api.plotly.com/v2/plots/feed", "results": [ { "creation_time": "2014-08-26T08:44:47.000000Z", "parented": true, "embed_url": "https://chart-studio.plotly.com/~mrlyule/91.embed", "fid": "mrlyule:91", "filename": "Presbycusis Plot", "filetype": "plot", "img_url": "https://storage.googleapis.com/plotly-prod-images/mrlyule%2F91%2F9_USUU16IVVXOGQYJV5PG7N8Q4IS9VO3.png", "image_urls": { "default": "https://storage.googleapis.com/plotly-prod-images/mrlyule%2F91%2F2_S9EYPKEA22CJ3IKPACX1TYXBVXLQ95.png", "block-thumb": "https://storage.googleapis.com/plotly-prod-images/mrlyule%2F91%2F8_RZL51BJ0B27XQN93JCK9Q8TEX9599F.png", "list-thumb": "https://storage.googleapis.com/plotly-prod-images/mrlyule%2F91%2F9_USUU16IVVXOGQYJV5PG7N8Q4IS9VO3.png" }, "api_urls": { "files": "https://api.plotly.com/v2/files/mrlyule:91", "plots": "https://api.plotly.com/v2/plots/mrlyule:91", "parent": "https://api.plotly.com/v2/folders/mrlyule:75" }, "owner": "mrlyule", "parent": 75, "preview": "", "referencers": null, "references": null, "title": "Hearing Loss Due To Presbycusis Over Time", "views": 1360, "web_url": "https://chart-studio.plotly.com/~mrlyule/91/hearing-loss-due-to-presbycusis-over-time/", "world_readable": true, "date_modified": "2015-07-09T16:18:59.658Z", "collaborators": { "results": [], "count": 0 }, "subfolder_count": null, "refresh_interval": null, "organize_view_url": "https://chart-studio.plotly.com/~mrlyule/91/", "current_user_permission": "read", "is_theme": null, "is_template": null, "caption": "", "user": { "profile_url": "https://chart-studio.plotly.com/~mrlyule", "avatar_url": "https://storage.googleapis.com/plotly-prod-profiles/40.jpg", "background_url": "https://storage.googleapis.com/plotly-prod-profiles/bg-14.jpg", "bio": "Acoustics Researcher, Solent Acoustics. ", "nickname": "Lawrence Yule", "website": "http://solentacoustics.wordpress.com/", "stream_tokens": null, "feature_set_id": null, "csrf_token": null, "date_joined": "2013-12-30 13:25:38", "mapbox_access_tokens": null, "has_password": null, "username": "mrlyule", "email": null, "is_active": null, "readonly": null, "is_dash_creator": null, "dash_created_count": null, "is_chart_creator": null, "charts_created_count": null }, "figure": null, "autosize": null, "width": null, "height": null }, { "creation_time": "2014-05-20T01:15:07.000000Z", "parented": true, "embed_url": "https://chart-studio.plotly.com/~RgraphingAPI/1566.embed", "fid": "RgraphingAPI:1566", "filename": "from api (531)", "filetype": "plot", "img_url": "https://storage.googleapis.com/plotly-prod-images/RgraphingAPI%2F1566%2F9_EDZ798TUKISNLIJXXJ2QO0Y9NTRZ8N.png", "image_urls": { "default": "https://storage.googleapis.com/plotly-prod-images/RgraphingAPI%2F1566%2F2_KBC690ZIDKS2FM9E4PP9DKP4Y92ZQ7.png", "block-thumb": "https://storage.googleapis.com/plotly-prod-images/RgraphingAPI%2F1566%2F8_UTZP1SWMD9F2AFTDKEIARMNVTJJQM0.png", "list-thumb": "https://storage.googleapis.com/plotly-prod-images/RgraphingAPI%2F1566%2F9_EDZ798TUKISNLIJXXJ2QO0Y9NTRZ8N.png" }, "api_urls": { "files": "https://api.plotly.com/v2/files/RgraphingAPI:1566", "plots": "https://api.plotly.com/v2/plots/RgraphingAPI:1566", "parent": "https://api.plotly.com/v2/folders/home?user=RgraphingAPI" }, "owner": "RgraphingAPI", "parent": -1, "preview": "", "referencers": null, "references": null, "title": "Annual solar fraction vs Collector slope ", "views": 573, "web_url": "https://chart-studio.plotly.com/~RgraphingAPI/1566/annual-solar-fraction-vs-collector-slope/", "world_readable": true, "date_modified": "2015-06-19T22:33:06.852Z", "collaborators": { "results": [], "count": 0 }, "subfolder_count": null, "refresh_interval": null, "organize_view_url": "https://chart-studio.plotly.com/~RgraphingAPI/1566/", "current_user_permission": "read", "is_theme": null, "is_template": null, "caption": "", "user": { "profile_url": "https://chart-studio.plotly.com/~RgraphingAPI", "avatar_url": "https://storage.googleapis.com/plotly-prod-profiles/79.jpg", "background_url": "https://storage.googleapis.com/plotly-prod-profiles/bg-6.jpg", "bio": "", "nickname": "", "website": "", "stream_tokens": null, "feature_set_id": null, "csrf_token": null, "date_joined": "2014-04-10 04:37:17", "mapbox_access_tokens": null, "has_password": null, "username": "RgraphingAPI", "email": null, "is_active": null, "readonly": null, "is_dash_creator": null, "dash_created_count": null, "is_chart_creator": null, "charts_created_count": null } }, { "creation_time": "2016-03-06T03:43:59.068145Z", "parented": true, "embed_url": "https://chart-studio.plotly.com/~jonah.bernhard/6.embed", "fid": "jonah.bernhard:6", "filename": "trento event 2", "filetype": "plot", "img_url": "https://storage.googleapis.com/plotly-prod-images/jonah.bernhard/6/9_PGFSB8BYRVEJBEMOGR873XVBIISNND.png", "image_urls": { "default": "https://storage.googleapis.com/plotly-prod-images/jonah.bernhard%2F6%2F2_QQQZYVXGT7ZUS7W9JFCBODD4GOPCGJ.png", "block-thumb": "https://storage.googleapis.com/plotly-prod-images/jonah.bernhard%2F6%2F8_BQQO63U2WR9M4WSTXRUF9EQ4F3RLDB.png", "list-thumb": "https://storage.googleapis.com/plotly-prod-images/jonah.bernhard/6/9_PGFSB8BYRVEJBEMOGR873XVBIISNND.png" }, "api_urls": { "files": "https://api.plotly.com/v2/files/jonah.bernhard:6", "plots": "https://api.plotly.com/v2/plots/jonah.bernhard:6", "parent": "https://api.plotly.com/v2/folders/home?user=jonah.bernhard" }, "owner": "jonah.bernhard", "parent": -1, "preview": "", "referencers": null, "references": null, "title": "trento event", "views": 506, "web_url": "https://chart-studio.plotly.com/~jonah.bernhard/6/trento-event/", "world_readable": true, "date_modified": "2016-03-06T03:43:59.149Z", "collaborators": { "results": [], "count": 0 }, "subfolder_count": null, "refresh_interval": null, "organize_view_url": "https://chart-studio.plotly.com/~jonah.bernhard/6/", "current_user_permission": "read", "is_theme": null, "is_template": null, "caption": "", "user": { "profile_url": "https://chart-studio.plotly.com/~jonah.bernhard", "avatar_url": "https://storage.googleapis.com/plotly-prod-profiles/85.jpg", "background_url": "https://storage.googleapis.com/plotly-prod-profiles/bg-14.jpg", "bio": "", "nickname": "", "website": "", "stream_tokens": null, "feature_set_id": null, "csrf_token": null, "date_joined": "2014-02-21 20:55:31", "mapbox_access_tokens": null, "has_password": null, "username": "jonah.bernhard", "email": null, "is_active": null, "readonly": null, "is_dash_creator": null, "dash_created_count": null, "is_chart_creator": null, "charts_created_count": null } }, { "creation_time": "2015-04-02T21:23:33.076004Z", "parented": true, "embed_url": "https://chart-studio.plotly.com/~chelsea_lyn/516.embed", "fid": "chelsea_lyn:516", "filename": "scatterddd", "filetype": "plot", "img_url": "https://storage.googleapis.com/plotly-prod-images/chelsea_lyn%2F516%2F9_0QL5RKXYVANLBOHANG1NVFDM8Y16RG.png", "image_urls": { "default": "https://storage.googleapis.com/plotly-prod-images/chelsea_lyn%2F516%2F2_3K4IXM9V8QVW18UWCMMHWCBYDSQKAK.png", "block-thumb": "https://storage.googleapis.com/plotly-prod-images/chelsea_lyn%2F516%2F8_5ZCFNKSQR6EB56SW06DPBRYO60ODTI.png", "list-thumb": "https://storage.googleapis.com/plotly-prod-images/chelsea_lyn%2F516%2F9_0QL5RKXYVANLBOHANG1NVFDM8Y16RG.png" }, "api_urls": { "files": "https://api.plotly.com/v2/files/chelsea_lyn:516", "plots": "https://api.plotly.com/v2/plots/chelsea_lyn:516", "parent": "https://api.plotly.com/v2/folders/home?user=chelsea_lyn" }, "owner": "chelsea_lyn", "parent": -1, "preview": "", "referencers": null, "references": null, "title": "", "views": 15617, "web_url": "https://chart-studio.plotly.com/~chelsea_lyn/516/", "world_readable": true, "date_modified": "2015-12-19T02:25:46.761Z", "collaborators": { "results": [], "count": 0 }, "subfolder_count": null, "refresh_interval": null, "organize_view_url": "https://chart-studio.plotly.com/~chelsea_lyn/516/", "current_user_permission": "read", "is_theme": null, "is_template": null, "caption": "", "user": { "profile_url": "https://chart-studio.plotly.com/~chelsea_lyn", "avatar_url": "https://storage.googleapis.com/plotly-prod-profiles/S3XINYAKT6PTQGIEIXCFVI8KED3Y4T.jpg", "background_url": "https://storage.googleapis.com/plotly-prod-profiles/bg-7.jpg", "bio": "", "nickname": "Chelsea", "website": "", "stream_tokens": null, "feature_set_id": null, "csrf_token": null, "date_joined": "2015-03-11 14:59:10", "mapbox_access_tokens": null, "has_password": null, "username": "chelsea_lyn", "email": null, "is_active": null, "readonly": null, "is_dash_creator": null, "dash_created_count": null, "is_chart_creator": null, "charts_created_count": null } }, { "creation_time": "2014-05-11T19:56:19.000000Z", "parented": true, "embed_url": "https://chart-studio.plotly.com/~ypatrick/12.embed", "fid": "ypatrick:12", "filename": "MO Monthly Unemployment Claims by Industry (copy)", "filetype": "plot", "img_url": "https://storage.googleapis.com/plotly-prod-images/ypatrick%2F12%2F9_UYADF1CIBE9O8CBHGT65KEDJFDAXOJ.png", "image_urls": { "default": "https://storage.googleapis.com/plotly-prod-images/ypatrick%2F12%2F2_7UZTFR58LO8WIHCGPZ7FAY8GKRKJBW.png", "block-thumb": "https://storage.googleapis.com/plotly-prod-images/ypatrick%2F12%2F8_67NT12QJSW9RVA3XY7TDV6T4VZSR09.png", "list-thumb": "https://storage.googleapis.com/plotly-prod-images/ypatrick%2F12%2F9_UYADF1CIBE9O8CBHGT65KEDJFDAXOJ.png" }, "api_urls": { "files": "https://api.plotly.com/v2/files/ypatrick:12", "plots": "https://api.plotly.com/v2/plots/ypatrick:12", "parent": "https://api.plotly.com/v2/folders/home?user=ypatrick" }, "owner": "ypatrick", "parent": -1, "preview": "", "referencers": null, "references": null, "title": "Monthly Missouri Unemployment Claims by Industry", "views": 834, "web_url": "https://chart-studio.plotly.com/~ypatrick/12/monthly-missouri-unemployment-claims-by-industry/", "world_readable": true, "date_modified": "2015-06-23T01:03:24.920Z", "collaborators": { "results": [], "count": 0 }, "subfolder_count": null, "refresh_interval": null, "organize_view_url": "https://chart-studio.plotly.com/~ypatrick/12/", "current_user_permission": "read", "is_theme": null, "is_template": null, "caption": "", "user": { "profile_url": "https://chart-studio.plotly.com/~ypatrick", "avatar_url": "https://storage.googleapis.com/plotly-prod-profiles/20.jpg", "background_url": "https://storage.googleapis.com/plotly-prod-profiles/bg-2.jpg", "bio": "", "nickname": "", "website": "", "stream_tokens": null, "feature_set_id": null, "csrf_token": null, "date_joined": "2014-02-09 16:30:33", "mapbox_access_tokens": null, "has_password": null, "username": "ypatrick", "email": null, "is_active": null, "readonly": null, "is_dash_creator": null, "dash_created_count": null, "is_chart_creator": null, "charts_created_count": null } }, { "creation_time": "2015-12-28T19:03:06.508659Z", "parented": true, "embed_url": "https://chart-studio.plotly.com/~ah566/121.embed", "fid": "ah566:121", "filename": "d3-world-map", "filetype": "plot", "img_url": "https://storage.googleapis.com/plotly-prod-images/ah566/121/9_2XRMHNYQ2WQ6OEMG9R4QFNR1BJE4KS.png", "image_urls": { "default": "https://storage.googleapis.com/plotly-prod-images/ah566%2F121%2F2_YZYK7UD77ZGL9HRHVLV9FZ0T3A7BQV.png", "block-thumb": "https://storage.googleapis.com/plotly-prod-images/ah566%2F121%2F8_K178F99V1QY4D47R6P0JSYEZMEC98W.png", "list-thumb": "https://storage.googleapis.com/plotly-prod-images/ah566/121/9_2XRMHNYQ2WQ6OEMG9R4QFNR1BJE4KS.png" }, "api_urls": { "files": "https://api.plotly.com/v2/files/ah566:121", "plots": "https://api.plotly.com/v2/plots/ah566:121", "parent": "https://api.plotly.com/v2/folders/home?user=ah566" }, "owner": "ah566", "parent": -1, "preview": "", "referencers": null, "references": null, "title": "T-Test Results", "views": 222, "web_url": "https://chart-studio.plotly.com/~ah566/121/t-test-results/", "world_readable": true, "date_modified": "2015-12-28T19:03:06.737Z", "collaborators": { "results": [], "count": 0 }, "subfolder_count": null, "refresh_interval": null, "organize_view_url": "https://chart-studio.plotly.com/~ah566/121/", "current_user_permission": "read", "is_theme": null, "is_template": null, "caption": "", "user": { "profile_url": "https://chart-studio.plotly.com/~ah566", "avatar_url": "https://storage.googleapis.com/plotly-prod-profiles/54.jpg", "background_url": "https://storage.googleapis.com/plotly-prod-profiles/bg-14.jpg", "bio": "", "nickname": "", "website": "", "stream_tokens": null, "feature_set_id": null, "csrf_token": null, "date_joined": "2015-10-23 18:12:23", "mapbox_access_tokens": null, "has_password": null, "username": "ah566", "email": null, "is_active": null, "readonly": null, "is_dash_creator": null, "dash_created_count": null, "is_chart_creator": null, "charts_created_count": null } }, { "creation_time": "2015-02-16T21:57:44.287131Z", "parented": true, "embed_url": "https://chart-studio.plotly.com/~etpinard/254.embed", "fid": "etpinard:254", "filename": "s5_cyclist-time-progression", "filetype": "plot", "img_url": "https://storage.googleapis.com/plotly-prod-images/etpinard%2F254%2F9_7B1G1IBW0H9CAO7PVG3W40E64RC7OE.png", "image_urls": { "default": "https://storage.googleapis.com/plotly-prod-images/etpinard%2F254%2F2_0RZ4CP7KJ837B6CVQ8MKYZF02VQWPY.png", "block-thumb": "https://storage.googleapis.com/plotly-prod-images/etpinard%2F254%2F8_L90RXSMT41CXGWCPRCGES7RCXT4KR9.png", "list-thumb": "https://storage.googleapis.com/plotly-prod-images/etpinard%2F254%2F9_7B1G1IBW0H9CAO7PVG3W40E64RC7OE.png" }, "api_urls": { "files": "https://api.plotly.com/v2/files/etpinard:254", "plots": "https://api.plotly.com/v2/plots/etpinard:254", "parent": "https://api.plotly.com/v2/folders/home?user=etpinard" }, "owner": "etpinard", "parent": -1, "preview": "", "referencers": null, "references": null, "title": "Fig 5.3: Montral bike traffic daily progression<br>from the most trafficked site to the least in 2013<br>", "views": 49727, "web_url": "https://chart-studio.plotly.com/~etpinard/254/fig-53-montral-bike-traffic-daily-progression-from-the-most-trafficked-site-to-t/", "world_readable": true, "date_modified": "2015-07-10T14:49:31.319Z", "collaborators": { "results": [], "count": 0 }, "subfolder_count": null, "refresh_interval": null, "organize_view_url": "https://chart-studio.plotly.com/~etpinard/254/", "current_user_permission": "read", "is_theme": null, "is_template": null, "caption": "", "user": { "profile_url": "https://chart-studio.plotly.com/~etpinard", "avatar_url": "https://storage.googleapis.com/plotly-prod-profiles/488N3JU5NZ4VLP8UBAE2YFND1MMKQF.jpg", "background_url": "https://storage.googleapis.com/plotly-prod-profiles/bg-7.jpg", "bio": "", "nickname": "etpinard", "website": "", "stream_tokens": null, "feature_set_id": null, "csrf_token": null, "date_joined": "2014-02-10 20:13:15", "mapbox_access_tokens": null, "has_password": null, "username": "etpinard", "email": null, "is_active": null, "readonly": null, "is_dash_creator": null, "dash_created_count": null, "is_chart_creator": null, "charts_created_count": null } }, { "creation_time": "2014-01-18T19:34:19.000000Z", "parented": true, "embed_url": "https://chart-studio.plotly.com/~ttunguz1/2.embed", "fid": "ttunguz1:2", "filename": "from api (2)", "filetype": "plot", "img_url": "https://storage.googleapis.com/plotly-prod-images/ttunguz1%2F2%2F9_KXYB28X9HVLM00LVBEK419D4D2RNA6.png", "image_urls": { "default": "https://storage.googleapis.com/plotly-prod-images/ttunguz1%2F2%2F2_8DTZXKWMTPOJUDDDJ3SQ2PV74YMUE8.png", "block-thumb": "https://storage.googleapis.com/plotly-prod-images/ttunguz1%2F2%2F8_V1YO3RIB7LSZ3R2W65P7I702WU2AYK.png", "list-thumb": "https://storage.googleapis.com/plotly-prod-images/ttunguz1%2F2%2F9_KXYB28X9HVLM00LVBEK419D4D2RNA6.png" }, "api_urls": { "files": "https://api.plotly.com/v2/files/ttunguz1:2", "plots": "https://api.plotly.com/v2/plots/ttunguz1:2", "parent": "https://api.plotly.com/v2/folders/home?user=ttunguz1" }, "owner": "ttunguz1", "parent": -1, "preview": "", "referencers": null, "references": null, "title": "Total Tech Market Cap from 1981 to 2014 in $T", "views": 780, "web_url": "https://chart-studio.plotly.com/~ttunguz1/2/total-tech-market-cap-from-1981-to-2014-in-t/", "world_readable": true, "date_modified": "2015-07-08T01:54:17.918Z", "collaborators": { "results": [], "count": 0 }, "subfolder_count": null, "refresh_interval": null, "organize_view_url": "https://chart-studio.plotly.com/~ttunguz1/2/", "current_user_permission": "read", "is_theme": null, "is_template": null, "caption": "", "user": { "profile_url": "https://chart-studio.plotly.com/~ttunguz1", "avatar_url": "https://storage.googleapis.com/plotly-prod-profiles/6.jpg", "background_url": "https://storage.googleapis.com/plotly-prod-profiles/bg-9.jpg", "bio": "", "nickname": "", "website": "", "stream_tokens": null, "feature_set_id": null, "csrf_token": null, "date_joined": "2013-12-30 19:31:35", "mapbox_access_tokens": null, "has_password": null, "username": "ttunguz1", "email": null, "is_active": null, "readonly": null, "is_dash_creator": null, "dash_created_count": null, "is_chart_creator": null, "charts_created_count": null } }, { "creation_time": "2015-12-08T13:31:27.390580Z", "parented": true, "embed_url": "https://chart-studio.plotly.com/~AndyWoods/15.embed", "fid": "AndyWoods:15", "filename": "Modern Money", "filetype": "plot", "img_url": "https://storage.googleapis.com/plotly-prod-images/AndyWoods%2F15%2F9_QGDDJ0JDM4DCE5K2B5AE518Z35V4LB.png", "image_urls": { "default": "https://storage.googleapis.com/plotly-prod-images/AndyWoods%2F15%2F2_6TLZ834WAQ3R7Z8O4KKFOU75SPI1MA.png", "block-thumb": "https://storage.googleapis.com/plotly-prod-images/AndyWoods%2F15%2F8_XVS9SWMKD0VL5WZWCKLLEZOH9ON0GR.png", "list-thumb": "https://storage.googleapis.com/plotly-prod-images/AndyWoods%2F15%2F9_QGDDJ0JDM4DCE5K2B5AE518Z35V4LB.png" }, "api_urls": { "files": "https://api.plotly.com/v2/files/AndyWoods:15", "plots": "https://api.plotly.com/v2/plots/AndyWoods:15", "parent": "https://api.plotly.com/v2/folders/home?user=AndyWoods" }, "owner": "AndyWoods", "parent": -1, "preview": "", "referencers": null, "references": null, "title": "The Origins of modern coins (excl. British Isles) in York Museums Trust Collection", "views": 205, "web_url": "https://chart-studio.plotly.com/~AndyWoods/15/the-origins-of-modern-coins-excl-british-isles-in-york-museums-trust-collection/", "world_readable": true, "date_modified": "2015-12-08T13:31:27.637Z", "collaborators": { "results": [], "count": 0 }, "subfolder_count": null, "refresh_interval": null, "organize_view_url": "https://chart-studio.plotly.com/~AndyWoods/15/", "current_user_permission": "read", "is_theme": null, "is_template": null, "caption": "", "user": { "profile_url": "https://chart-studio.plotly.com/~AndyWoods", "avatar_url": "https://storage.googleapis.com/plotly-prod-profiles/34.jpg", "background_url": "https://storage.googleapis.com/plotly-prod-profiles/bg-14.jpg", "bio": "", "nickname": "", "website": "", "stream_tokens": null, "feature_set_id": null, "csrf_token": null, "date_joined": "2015-12-08 13:15:19", "mapbox_access_tokens": null, "has_password": null, "username": "AndyWoods", "email": null, "is_active": null, "readonly": null, "is_dash_creator": null, "dash_created_count": null, "is_chart_creator": null, "charts_created_count": null } }, { "creation_time": "2015-04-21T07:15:39.144516Z", "parented": true, "embed_url": "https://chart-studio.plotly.com/~shapiromh/41.embed", "fid": "shapiromh:41", "filename": "nyfit", "filetype": "plot", "img_url": "https://storage.googleapis.com/plotly-prod-images/shapiromh%2F41%2F9_N38W4H8RKGM7RNF830GWTP81ZZTXSU.png", "image_urls": { "default": "https://storage.googleapis.com/plotly-prod-images/shapiromh%2F41%2F2_7XHO73SGDJMC1V9I4A9TYIGAUOKPJP.png", "block-thumb": "https://storage.googleapis.com/plotly-prod-images/shapiromh%2F41%2F8_9LEFGNEZTJ3TSFLUC020Z4SOF7SNHQ.png", "list-thumb": "https://storage.googleapis.com/plotly-prod-images/shapiromh%2F41%2F9_N38W4H8RKGM7RNF830GWTP81ZZTXSU.png" }, "api_urls": { "files": "https://api.plotly.com/v2/files/shapiromh:41", "plots": "https://api.plotly.com/v2/plots/shapiromh:41", "parent": "https://api.plotly.com/v2/folders/home?user=shapiromh" }, "owner": "shapiromh", "parent": -1, "preview": "", "referencers": null, "references": null, "title": "", "views": 480, "web_url": "https://chart-studio.plotly.com/~shapiromh/41/", "world_readable": true, "date_modified": "2015-06-19T18:41:29.750Z", "collaborators": { "results": [], "count": 0 }, "subfolder_count": null, "refresh_interval": null, "organize_view_url": "https://chart-studio.plotly.com/~shapiromh/41/", "current_user_permission": "read", "is_theme": null, "is_template": null, "caption": "", "user": { "profile_url": "https://chart-studio.plotly.com/~shapiromh", "avatar_url": "https://storage.googleapis.com/plotly-prod-profiles/88.jpg", "background_url": "https://storage.googleapis.com/plotly-prod-profiles/bg-9.jpg", "bio": "", "nickname": "", "website": "", "stream_tokens": null, "feature_set_id": null, "csrf_token": null, "date_joined": "2014-10-20 23:35:07", "mapbox_access_tokens": null, "has_password": null, "username": "shapiromh", "email": null, "is_active": null, "readonly": null, "is_dash_creator": null, "dash_created_count": null, "is_chart_creator": null, "charts_created_count": null } } ] }