Plots List
Plots
This endpoint handles manipulation of Plotly plot files.
Reference
Authorization
Any user with or without a Plotly account may view public plots. For private plots, see authentication.
Actions
list
Listing all public plots can be done via a GET request to this endpoint.
By default, plots will be listed in order of date created. The order_by
query parameter is accepted at this endpoint. Currently, only ordering by
views is supported. It is possible to filter the plots by quality
with min_quality or max_quality as query parameter.
Example:
// GET https://api.plotly.com/v2/plots/ ---> 200

// GET https://api.plotly.com/v2/plots/?order_by=-views ---> 200

// GET https://api.plotly.com/v2/plots/?min_quality=5 ---> 200

// GET https://api.plotly.com/v2/plots/?max_quality=5 ---> 200
feed
Listing all handpicked feed plots can be done via a GET request to this endpoint. By default, plots will be listed in a random order.
Example:
// GET https://api.plotly.com/v2/plots/feed ---> 200
create
You can create new plot resources here. The only required field is 'figure'. Currently, the figure is restricted to only contain references to grid data. That is, this will fail if raw data arrays are passed in. To create and manipulate underlying grids for plots, see the grids endpoint.
Example:
// This fails because a figure field is required.
// POST https://api.plotly.com/v2/plots ---> 400 Bad Request
{}

// This fails because the figure has raw data
//POST https://api.plotly.com/v2/plots ---> 400 Bad Request
{
    "figure": {"data": [{"y": ['this', 'is', 'raw', 'data']}]}
}

// This succeeds because the figure has src keys, not raw data.
//POST https://api.plotly.com/v2/plots ---> 200 OK
{
    "figure": {"data": [{"ysrc": "sven:88:u8nd62"}]}
}
When creating a grid, you can optionally specify a source_fid to specify where a plot has come from:
- source_fid: the fid of a plot that was copied (and presumably edited) to produce this one
detail
There is a lot of meta information stored about plot files including filename, title, share_url, and content_url to name a few.
This information can only be reached with a GET to this endpoint.
Example:
// GET https://api.plotly.com/v2/plots/iheartgraphs:90
content
The contents of a plot can be downloaded via the content resource. The plot
content contains referenced grid/column data by default. If you wish to
return the raw grid/column data, the inline_data=true query must be included
in the request url. The Content-Type header will be appropriately set for the
response body.
Alternatively, you can set ?map_data=unreadable to append a mapping of
sources to data that belongs to grids which are unreadable for the
requestor. This is useful when you have read access to another users plot,
but that plot contains grid references which you don't have access to.
Examples:
// Returns referenced grid/column data
// GET https://api.plotly.com/v2/plots/iheartgraphs:90/content ---> 200 OK

// Returns full grid/column data
// GET https://api.plotly.com/v2/plots/iheartgraphs:90/content?inline_data=true ---> 200 OK

// Returns full grid/column data when requestor doesn't have permission
// to read the referenced grid.
// GET https://api.plotly.com/v2/plots/iheartgraphs:90/content?map_data=unreadable ---> 200 OK
GET /v2/plots?cursor=cD0yMDI1LTA5LTE3KzEzJTNBNDElM0EyOC4zMDU1NzAlMkIwMCUzQTAw&format=api
{ "next": "https://api.plotly.com/v2/plots?cursor=cD0yMDI1LTA5LTE3KzExJTNBNTUlM0EwMi40MzI0MDAlMkIwMCUzQTAw&format=api", "previous": "https://api.plotly.com/v2/plots?cursor=cj0xJnA9MjAyNS0wOS0xNysxMyUzQTM3JTNBNDguMzkwNjY4JTJCMDAlM0EwMA%3D%3D&format=api", "results": [ { "creation_time": "2025-09-17T13:37:48.390668Z", "comments": { "results": [], "count": 0 }, "parented": true, "embed_url": "https://chart-studio.plotly.com/~hannah.julius/21.embed", "fid": "hannah.julius:21", "filename": "postings_over_time", "filetype": "plot", "img_url": "https://storage.googleapis.com/plotly-prod-images/hannah.julius/21/9_EOMM7PD12UMPBFPMMA3OD38VXTP28G.png", "image_urls": { "default": "https://api.plotly.com/v2/files/hannah.julius:21/image?image_name=default", "block-thumb": "https://storage.googleapis.com/plotly-prod-images/hannah.julius/21/8_A1KN7Z0S47Q5O0W4QZBVTDGGQAMNQ0.png", "list-thumb": "https://storage.googleapis.com/plotly-prod-images/hannah.julius/21/9_EOMM7PD12UMPBFPMMA3OD38VXTP28G.png" }, "api_urls": { "files": "https://api.plotly.com/v2/files/hannah.julius:21", "plots": "https://api.plotly.com/v2/plots/hannah.julius:21", "parent": "https://api.plotly.com/v2/folders/home?user=hannah.julius" }, "owner": "hannah.julius", "parent": -1, "preview": "", "referencers": [], "references": [], "title": "", "views": 0, "web_url": "https://chart-studio.plotly.com/~hannah.julius/21/", "world_readable": true, "date_modified": "2025-09-17T13:37:48.403Z", "stars": { "results": [], "count": 0 }, "collaborators": { "results": [], "count": 0 }, "subfolder_count": null, "refresh_interval": null, "organize_view_url": "https://chart-studio.plotly.com/~hannah.julius/21/", "current_user_permission": "read", "is_theme": null, "is_template": null, "autosize": true, "caption": "", "figure": { "data": [ { "line": { "dash": "solid", "color": "#636efa" }, "mode": "lines", "name": "adms", "type": "scattergl", "xsrc": "hannah.julius:20:1fecd4", "ysrc": "hannah.julius:20:e21cc8", "xaxis": "x", "yaxis": "y", "marker": { "symbol": "circle" }, "showlegend": true, "legendgroup": "adms", "hovertemplate": "keyword=adms<br>week=%{x}<br>posting_count=%{y}<extra></extra>" }, { "line": { "dash": "solid", "color": "#EF553B" }, "mode": "lines", "name": "advanced distribution management system", "type": "scattergl", "xsrc": "hannah.julius:20:afdf3f", "ysrc": "hannah.julius:20:94507e", "xaxis": "x", "yaxis": "y", "marker": { "symbol": "circle" }, "showlegend": true, "legendgroup": "advanced distribution management system", "hovertemplate": "keyword=advanced distribution management system<br>week=%{x}<br>posting_count=%{y}<extra></extra>" }, { "line": { "dash": "solid", "color": "#00cc96" }, "mode": "lines", "name": "advanced metering infrastructure", "type": "scattergl", "xsrc": "hannah.julius:20:3c936a", "ysrc": "hannah.julius:20:fea3e2", "xaxis": "x", "yaxis": "y", "marker": { "symbol": "circle" }, "showlegend": true, "legendgroup": "advanced metering infrastructure", "hovertemplate": "keyword=advanced metering infrastructure<br>week=%{x}<br>posting_count=%{y}<extra></extra>" }, { "line": { "dash": "solid", "color": "#ab63fa" }, "mode": "lines", "name": "ai", "type": "scattergl", "xsrc": "hannah.julius:20:ed8cda", "ysrc": "hannah.julius:20:995c39", "xaxis": "x", "yaxis": "y", "marker": { "symbol": "circle" }, "showlegend": true, "legendgroup": "ai", "hovertemplate": "keyword=ai<br>week=%{x}<br>posting_count=%{y}<extra></extra>" }, { "line": { "dash": "solid", "color": "#FFA15A" }, "mode": "lines", "name": "ami", "type": "scattergl", "xsrc": "hannah.julius:20:f13271", "ysrc": "hannah.julius:20:efdf41", "xaxis": "x", "yaxis": "y", "marker": { "symbol": "circle" }, "showlegend": true, "legendgroup": "ami", "hovertemplate": "keyword=ami<br>week=%{x}<br>posting_count=%{y}<extra></extra>" }, { "line": { "dash": "solid", "color": "#19d3f3" }, "mode": "lines", "name": "artificial intelligence", "type": "scattergl", "xsrc": "hannah.julius:20:a2caa2", "ysrc": "hannah.julius:20:5cc478", "xaxis": "x", "yaxis": "y", "marker": { "symbol": "circle" }, "showlegend": true, "legendgroup": "artificial intelligence", "hovertemplate": "keyword=artificial intelligence<br>week=%{x}<br>posting_count=%{y}<extra></extra>" }, { "line": { "dash": "solid", "color": "#FF6692" }, "mode": "lines", "name": "cybersecurity", "type": "scattergl", "xsrc": "hannah.julius:20:951ae2", "ysrc": "hannah.julius:20:9d0773", "xaxis": "x", "yaxis": "y", "marker": { "symbol": "circle" }, "showlegend": true, "legendgroup": "cybersecurity", "hovertemplate": "keyword=cybersecurity<br>week=%{x}<br>posting_count=%{y}<extra></extra>" }, { "line": { "dash": "solid", "color": "#B6E880" }, "mode": "lines", "name": "demand response", "type": "scattergl", "xsrc": "hannah.julius:20:f146dd", "ysrc": "hannah.julius:20:c1c85f", "xaxis": "x", "yaxis": "y", "marker": { "symbol": "circle" }, "showlegend": true, "legendgroup": "demand response", "hovertemplate": "keyword=demand response<br>week=%{x}<br>posting_count=%{y}<extra></extra>" }, { "line": { "dash": "solid", "color": "#FF97FF" }, "mode": "lines", "name": "der", "type": "scattergl", "xsrc": "hannah.julius:20:2c19b6", "ysrc": "hannah.julius:20:ea3660", "xaxis": "x", "yaxis": "y", "marker": { "symbol": "circle" }, "showlegend": true, "legendgroup": "der", "hovertemplate": "keyword=der<br>week=%{x}<br>posting_count=%{y}<extra></extra>" }, { "line": { "dash": "solid", "color": "#FECB52" }, "mode": "lines", "name": "digital twin", "type": "scattergl", "xsrc": "hannah.julius:20:f5faf8", "ysrc": "hannah.julius:20:2f1589", "xaxis": "x", "yaxis": "y", "marker": { "symbol": "circle" }, "showlegend": true, "legendgroup": "digital twin", "hovertemplate": "keyword=digital twin<br>week=%{x}<br>posting_count=%{y}<extra></extra>" }, { "line": { "dash": "solid", "color": "#636efa" }, "mode": "lines", "name": "distributed energy resource", "type": "scattergl", "xsrc": "hannah.julius:20:a37a07", "ysrc": "hannah.julius:20:8daa0c", "xaxis": "x", "yaxis": "y", "marker": { "symbol": "circle" }, "showlegend": true, "legendgroup": "distributed energy resource", "hovertemplate": "keyword=distributed energy resource<br>week=%{x}<br>posting_count=%{y}<extra></extra>" }, { "line": { "dash": "solid", "color": "#EF553B" }, "mode": "lines", "name": "electric vehicle", "type": "scattergl", "xsrc": "hannah.julius:20:2f1a9c", "ysrc": "hannah.julius:20:761a71", "xaxis": "x", "yaxis": "y", "marker": { "symbol": "circle" }, "showlegend": true, "legendgroup": "electric vehicle", "hovertemplate": "keyword=electric vehicle<br>week=%{x}<br>posting_count=%{y}<extra></extra>" }, { "line": { "dash": "solid", "color": "#00cc96" }, "mode": "lines", "name": "ev", "type": "scattergl", "xsrc": "hannah.julius:20:89c380", "ysrc": "hannah.julius:20:271c29", "xaxis": "x", "yaxis": "y", "marker": { "symbol": "circle" }, "showlegend": true, "legendgroup": "ev", "hovertemplate": "keyword=ev<br>week=%{x}<br>posting_count=%{y}<extra></extra>" }, { "line": { "dash": "solid", "color": "#ab63fa" }, "mode": "lines", "name": "grid automation", "type": "scattergl", "xsrc": "hannah.julius:20:e7c633", "ysrc": "hannah.julius:20:dcf21d", "xaxis": "x", "yaxis": "y", "marker": { "symbol": "circle" }, "showlegend": true, "legendgroup": "grid automation", "hovertemplate": "keyword=grid automation<br>week=%{x}<br>posting_count=%{y}<extra></extra>" }, { "line": { "dash": "solid", "color": "#FFA15A" }, "mode": "lines", "name": "grid resilience", "type": "scattergl", "xsrc": "hannah.julius:20:1b7212", "ysrc": "hannah.julius:20:fd08cc", "xaxis": "x", "yaxis": "y", "marker": { "symbol": "circle" }, "showlegend": true, "legendgroup": "grid resilience", "hovertemplate": "keyword=grid resilience<br>week=%{x}<br>posting_count=%{y}<extra></extra>" }, { "line": { "dash": "solid", "color": "#19d3f3" }, "mode": "lines", "name": "microgrid", "type": "scattergl", "xsrc": "hannah.julius:20:ec3d3a", "ysrc": "hannah.julius:20:d1d47c", "xaxis": "x", "yaxis": "y", "marker": { "symbol": "circle" }, "showlegend": true, "legendgroup": "microgrid", "hovertemplate": "keyword=microgrid<br>week=%{x}<br>posting_count=%{y}<extra></extra>" }, { "line": { "dash": "solid", "color": "#FF6692" }, "mode": "lines", "name": "predictive maintenance", "type": "scattergl", "xsrc": "hannah.julius:20:39817b", "ysrc": "hannah.julius:20:062ca2", "xaxis": "x", "yaxis": "y", "marker": { "symbol": "circle" }, "showlegend": true, "legendgroup": "predictive maintenance", "hovertemplate": "keyword=predictive maintenance<br>week=%{x}<br>posting_count=%{y}<extra></extra>" }, { "line": { "dash": "solid", "color": "#B6E880" }, "mode": "lines", "name": "real time data", "type": "scattergl", "xsrc": "hannah.julius:20:d672d7", "ysrc": "hannah.julius:20:8a7317", "xaxis": "x", "yaxis": "y", "marker": { "symbol": "circle" }, "showlegend": true, "legendgroup": "real time data", "hovertemplate": "keyword=real time data<br>week=%{x}<br>posting_count=%{y}<extra></extra>" }, { "line": { "dash": "solid", "color": "#FF97FF" }, "mode": "lines", "name": "reliability", "type": "scattergl", "xsrc": "hannah.julius:20:62fa3a", "ysrc": "hannah.julius:20:62c83d", "xaxis": "x", "yaxis": "y", "marker": { "symbol": "circle" }, "showlegend": true, "legendgroup": "reliability", "hovertemplate": "keyword=reliability<br>week=%{x}<br>posting_count=%{y}<extra></extra>" }, { "line": { "dash": "solid", "color": "#FECB52" }, "mode": "lines", "name": "smart grid", "type": "scattergl", "xsrc": "hannah.julius:20:63255a", "ysrc": "hannah.julius:20:7c4615", "xaxis": "x", "yaxis": "y", "marker": { "symbol": "circle" }, "showlegend": true, "legendgroup": "smart grid", "hovertemplate": "keyword=smart grid<br>week=%{x}<br>posting_count=%{y}<extra></extra>" } ], "layout": { "title": { "text": "Postings over time by keyword" }, "xaxis": { "title": { "text": "week" }, "anchor": "y", "domain": [ 0.0, 1.0 ] }, "yaxis": { "title": { "text": "posting_count" }, "anchor": "x", "domain": [ 0.0, 1.0 ] }, "legend": { "title": { "text": "keyword" }, "tracegroupgap": 0 }, "template": { "data": { "bar": [ { "type": "bar", "marker": { "line": { "color": "#E5ECF6", "width": 0.5 }, "pattern": { "size": 10, "fillmode": "overlay", "solidity": 0.2 } }, "error_x": { "color": "#2a3f5f" }, "error_y": { "color": "#2a3f5f" } } ], "pie": [ { "type": "pie", "automargin": true } ], "table": [ { "type": "table", "cells": { "fill": { "color": "#EBF0F8" }, "line": { "color": "white" } }, "header": { "fill": { "color": "#C8D4E3" }, "line": { "color": "white" } } } ], "carpet": [ { "type": "carpet", "aaxis": { "gridcolor": "white", "linecolor": "white", "endlinecolor": "#2a3f5f", "minorgridcolor": "white", "startlinecolor": "#2a3f5f" }, "baxis": { "gridcolor": "white", "linecolor": "white", "endlinecolor": "#2a3f5f", "minorgridcolor": "white", "startlinecolor": "#2a3f5f" } } ], "mesh3d": [ { "type": "mesh3d", "colorbar": { "ticks": "", "outlinewidth": 0 } } ], "contour": [ { "type": "contour", "colorbar": { "ticks": "", "outlinewidth": 0 }, "colorscale": [ [ 0.0, "#0d0887" ], [ 0.1111111111111111, "#46039f" ], [ 0.2222222222222222, "#7201a8" ], [ 0.3333333333333333, "#9c179e" ], [ 0.4444444444444444, "#bd3786" ], [ 0.5555555555555556, "#d8576b" ], [ 0.6666666666666666, "#ed7953" ], [ 0.7777777777777778, "#fb9f3a" ], [ 0.8888888888888888, "#fdca26" ], [ 1.0, "#f0f921" ] ] } ], "heatmap": [ { "type": "heatmap", "colorbar": { "ticks": "", "outlinewidth": 0 }, "colorscale": [ [ 0.0, "#0d0887" ], [ 0.1111111111111111, "#46039f" ], [ 0.2222222222222222, "#7201a8" ], [ 0.3333333333333333, "#9c179e" ], [ 0.4444444444444444, "#bd3786" ], [ 0.5555555555555556, "#d8576b" ], [ 0.6666666666666666, "#ed7953" ], [ 0.7777777777777778, "#fb9f3a" ], [ 0.8888888888888888, "#fdca26" ], [ 1.0, "#f0f921" ] ] } ], "scatter": [ { "type": "scatter", "fillpattern": { "size": 10, "fillmode": "overlay", "solidity": 0.2 } } ], "surface": [ { "type": "surface", "colorbar": { "ticks": "", "outlinewidth": 0 }, "colorscale": [ [ 0.0, "#0d0887" ], [ 0.1111111111111111, "#46039f" ], [ 0.2222222222222222, "#7201a8" ], [ 0.3333333333333333, "#9c179e" ], [ 0.4444444444444444, "#bd3786" ], [ 0.5555555555555556, "#d8576b" ], [ 0.6666666666666666, "#ed7953" ], [ 0.7777777777777778, "#fb9f3a" ], [ 0.8888888888888888, "#fdca26" ], [ 1.0, "#f0f921" ] ] } ], "barpolar": [ { "type": "barpolar", "marker": { "line": { "color": "#E5ECF6", "width": 0.5 }, "pattern": { "size": 10, "fillmode": "overlay", "solidity": 0.2 } } } ], "heatmapgl": [ { "type": "heatmapgl", "colorbar": { "ticks": "", "outlinewidth": 0 }, "colorscale": [ [ 0.0, "#0d0887" ], [ 0.1111111111111111, "#46039f" ], [ 0.2222222222222222, "#7201a8" ], [ 0.3333333333333333, "#9c179e" ], [ 0.4444444444444444, "#bd3786" ], [ 0.5555555555555556, "#d8576b" ], [ 0.6666666666666666, "#ed7953" ], [ 0.7777777777777778, "#fb9f3a" ], [ 0.8888888888888888, "#fdca26" ], [ 1.0, "#f0f921" ] ] } ], "histogram": [ { "type": "histogram", "marker": { "pattern": { "size": 10, "fillmode": "overlay", "solidity": 0.2 } } } ], "parcoords": [ { "line": { "colorbar": { "ticks": "", "outlinewidth": 0 } }, "type": "parcoords" } ], "scatter3d": [ { "line": { "colorbar": { "ticks": "", "outlinewidth": 0 } }, "type": "scatter3d", "marker": { "colorbar": { "ticks": "", "outlinewidth": 0 } } } ], "scattergl": [ { "type": "scattergl", "marker": { "colorbar": { "ticks": "", "outlinewidth": 0 } } } ], "choropleth": [ { "type": "choropleth", "colorbar": { "ticks": "", "outlinewidth": 0 } } ], "scattergeo": [ { "type": "scattergeo", "marker": { "colorbar": { "ticks": "", "outlinewidth": 0 } } } ], "histogram2d": [ { "type": "histogram2d", "colorbar": { "ticks": "", "outlinewidth": 0 }, "colorscale": [ [ 0.0, "#0d0887" ], [ 0.1111111111111111, "#46039f" ], [ 0.2222222222222222, "#7201a8" ], [ 0.3333333333333333, "#9c179e" ], [ 0.4444444444444444, "#bd3786" ], [ 0.5555555555555556, "#d8576b" ], [ 0.6666666666666666, "#ed7953" ], [ 0.7777777777777778, "#fb9f3a" ], [ 0.8888888888888888, "#fdca26" ], [ 1.0, "#f0f921" ] ] } ], "scatterpolar": [ { "type": "scatterpolar", "marker": { "colorbar": { "ticks": "", "outlinewidth": 0 } } } ], "contourcarpet": [ { "type": "contourcarpet", "colorbar": { "ticks": "", "outlinewidth": 0 } } ], "scattercarpet": [ { "type": "scattercarpet", "marker": { "colorbar": { "ticks": "", "outlinewidth": 0 } } } ], "scattermapbox": [ { "type": "scattermapbox", "marker": { "colorbar": { "ticks": "", "outlinewidth": 0 } } } ], "scatterpolargl": [ { "type": "scatterpolargl", "marker": { "colorbar": { "ticks": "", "outlinewidth": 0 } } } ], "scatterternary": [ { "type": "scatterternary", "marker": { "colorbar": { "ticks": "", "outlinewidth": 0 } } } ], "histogram2dcontour": [ { "type": "histogram2dcontour", "colorbar": { "ticks": "", "outlinewidth": 0 }, "colorscale": [ [ 0.0, "#0d0887" ], [ 0.1111111111111111, "#46039f" ], [ 0.2222222222222222, "#7201a8" ], [ 0.3333333333333333, "#9c179e" ], [ 0.4444444444444444, "#bd3786" ], [ 0.5555555555555556, "#d8576b" ], [ 0.6666666666666666, "#ed7953" ], [ 0.7777777777777778, "#fb9f3a" ], [ 0.8888888888888888, "#fdca26" ], [ 1.0, "#f0f921" ] ] } ] }, "layout": { "geo": { "bgcolor": "white", "showland": true, "lakecolor": "white", "landcolor": "#E5ECF6", "showlakes": true, "subunitcolor": "white" }, "font": { "color": "#2a3f5f" }, "polar": { "bgcolor": "#E5ECF6", "radialaxis": { "ticks": "", "gridcolor": "white", "linecolor": "white" }, "angularaxis": { "ticks": "", "gridcolor": "white", "linecolor": "white" } }, "scene": { "xaxis": { "ticks": "", "gridcolor": "white", "gridwidth": 2, "linecolor": "white", "zerolinecolor": "white", "showbackground": true, "backgroundcolor": "#E5ECF6" }, "yaxis": { "ticks": "", "gridcolor": "white", "gridwidth": 2, "linecolor": "white", "zerolinecolor": "white", "showbackground": true, "backgroundcolor": "#E5ECF6" }, "zaxis": { "ticks": "", "gridcolor": "white", "gridwidth": 2, "linecolor": "white", "zerolinecolor": "white", "showbackground": true, "backgroundcolor": "#E5ECF6" } }, "title": { "x": 0.05 }, "xaxis": { "ticks": "", "title": { "standoff": 15 }, "gridcolor": "white", "linecolor": "white", "automargin": true, "zerolinecolor": "white", "zerolinewidth": 2 }, "yaxis": { "ticks": "", "title": { "standoff": 15 }, "gridcolor": "white", "linecolor": "white", "automargin": true, "zerolinecolor": "white", "zerolinewidth": 2 }, "mapbox": { "style": "light" }, "ternary": { "aaxis": { "ticks": "", "gridcolor": "white", "linecolor": "white" }, "baxis": { "ticks": "", "gridcolor": "white", "linecolor": "white" }, "caxis": { "ticks": "", "gridcolor": "white", "linecolor": "white" }, "bgcolor": "#E5ECF6" }, "colorway": [ "#636efa", "#EF553B", "#00cc96", "#ab63fa", "#FFA15A", "#19d3f3", "#FF6692", "#B6E880", "#FF97FF", "#FECB52" ], "coloraxis": { "colorbar": { "ticks": "", "outlinewidth": 0 } }, "hovermode": "closest", "colorscale": { "diverging": [ [ 0, "#8e0152" ], [ 0.1, "#c51b7d" ], [ 0.2, "#de77ae" ], [ 0.3, "#f1b6da" ], [ 0.4, "#fde0ef" ], [ 0.5, "#f7f7f7" ], [ 0.6, "#e6f5d0" ], [ 0.7, "#b8e186" ], [ 0.8, "#7fbc41" ], [ 0.9, "#4d9221" ], [ 1, "#276419" ] ], "sequential": [ [ 0.0, "#0d0887" ], [ 0.1111111111111111, "#46039f" ], [ 0.2222222222222222, "#7201a8" ], [ 0.3333333333333333, "#9c179e" ], [ 0.4444444444444444, "#bd3786" ], [ 0.5555555555555556, "#d8576b" ], [ 0.6666666666666666, "#ed7953" ], [ 0.7777777777777778, "#fb9f3a" ], [ 0.8888888888888888, "#fdca26" ], [ 1.0, "#f0f921" ] ], "sequentialminus": [ [ 0.0, "#0d0887" ], [ 0.1111111111111111, "#46039f" ], [ 0.2222222222222222, "#7201a8" ], [ 0.3333333333333333, "#9c179e" ], [ 0.4444444444444444, "#bd3786" ], [ 0.5555555555555556, "#d8576b" ], [ 0.6666666666666666, "#ed7953" ], [ 0.7777777777777778, "#fb9f3a" ], [ 0.8888888888888888, "#fdca26" ], [ 1.0, "#f0f921" ] ] }, "hoverlabel": { "align": "left" }, "plot_bgcolor": "#E5ECF6", "paper_bgcolor": "white", "shapedefaults": { "line": { "color": "#2a3f5f" } }, "autotypenumbers": "strict", "annotationdefaults": { "arrowhead": 0, "arrowcolor": "#2a3f5f", "arrowwidth": 1 } } } } }, "height": null, "width": null, "user": { "profile_url": "https://chart-studio.plotly.com/~hannah.julius", "avatar_url": "https://storage.googleapis.com/plotly-prod-profiles/6.jpg", "background_url": "https://storage.googleapis.com/plotly-prod-profiles/bg-1.jpg", "bio": "", "nickname": "", "website": "", "stream_tokens": null, "feature_set_id": null, "csrf_token": null, "date_joined": "2025-06-27 17:47:32", "mapbox_access_tokens": null, "has_password": null, "username": "hannah.julius", "email": null, "is_active": null, "readonly": null, "is_dash_creator": null, "dash_created_count": null, "is_chart_creator": null, "charts_created_count": null } }, { "creation_time": "2025-09-17T13:15:08.116491Z", "comments": { "results": [], "count": 0 }, "parented": true, "embed_url": "https://chart-studio.plotly.com/~elena_thebigg/19.embed", "fid": "elena_thebigg:19", "filename": "Konzentrationsleistung 4 Boxen aber wirklich", "filetype": "plot", "img_url": "https://storage.googleapis.com/plotly-prod-images/elena_thebigg/19/9_MHKCN2MW1J046QAG5HXWJJL8H6U5TT.png", "image_urls": { "default": "https://storage.googleapis.com/plotly-prod-images/elena_thebigg/19/2_CH05KQYIJBL3FSA5ILG1HQ3ICMAY66.png", "block-thumb": "https://storage.googleapis.com/plotly-prod-images/elena_thebigg/19/8_WNLACZJEG1OH11BY2AABTSBA2S3BYK.png", "list-thumb": "https://storage.googleapis.com/plotly-prod-images/elena_thebigg/19/9_MHKCN2MW1J046QAG5HXWJJL8H6U5TT.png" }, "api_urls": { "files": "https://api.plotly.com/v2/files/elena_thebigg:19", "plots": "https://api.plotly.com/v2/plots/elena_thebigg:19", "parent": "https://api.plotly.com/v2/folders/home?user=elena_thebigg" }, "owner": "elena_thebigg", "parent": -1, "preview": "", "referencers": [], "references": [], "title": "", "views": 0, "web_url": "https://chart-studio.plotly.com/~elena_thebigg/19/", "world_readable": true, "date_modified": "2025-09-17T13:15:08.127Z", "stars": { "results": [], "count": 0 }, "collaborators": { "results": [], "count": 0 }, "subfolder_count": null, "refresh_interval": null, "organize_view_url": "https://chart-studio.plotly.com/~elena_thebigg/19/", "current_user_permission": "read", "is_theme": null, "is_template": false, "autosize": true, "caption": "", "figure": { "data": [ { "meta": { "columnNames": { "y": "ohne " } }, "mode": "markers", "name": "ohne Musik", "type": "box", "ysrc": "elena_thebigg:18:8c765b", "marker": { "size": 5 }, "boxmean": true, "notched": false, "boxpoints": "all" }, { "meta": { "columnNames": { "y": "original" } }, "name": "originale Geschwindigkeit", "type": "box", "ysrc": "elena_thebigg:18:ce2f8e", "marker": { "size": 5 }, "boxmean": true, "notched": false, "boxpoints": "all" }, { "meta": { "columnNames": { "y": "0.5-fach" } }, "name": "0.5-fache Geschwindigkeit", "type": "box", "ysrc": "elena_thebigg:18:fc91a2", "marker": { "size": 5 }, "boxmean": true, "notched": false, "boxpoints": "all" }, { "meta": { "columnNames": { "y": "1.5-fach" } }, "name": "1.5-fache Geschwindigkeit", "type": "box", "ysrc": "elena_thebigg:18:6caead", "marker": { "size": 5 }, "boxmean": true, "notched": false, "boxpoints": "all" } ], "frames": [], "layout": { "title": { "text": "Konzentrationsleistung" }, "xaxis": { "type": "category", "range": [ -0.5223463687150838, 3.5 ], "title": { "text": "Musik-Typ des Versuches" }, "autorange": true }, "yaxis": { "type": "linear", "range": [ 150.44444444444446, 341.55555555555554 ], "title": { "text": "Konzentrationsleistung [Punkte]" }, "autorange": true }, "autosize": true, "template": { "data": { "bar": [ { "type": "bar", "marker": { "colorbar": { "ticks": "", "outlinewidth": 0 } } } ], "table": [ { "type": "table", "cells": { "fill": { "color": "#EBF0F8" }, "line": { "color": "white" } }, "header": { "fill": { "color": "#C8D4E3" }, "line": { "color": "white" } } } ], "carpet": [ { "type": "carpet", "aaxis": { "gridcolor": "#C8D4E3", "linecolor": "#C8D4E3", "endlinecolor": "#2a3f5f", "minorgridcolor": "#C8D4E3", "startlinecolor": "#2a3f5f" }, "baxis": { "gridcolor": "#C8D4E3", "linecolor": "#C8D4E3", "endlinecolor": "#2a3f5f", "minorgridcolor": "#C8D4E3", "startlinecolor": "#2a3f5f" } } ], "mesh3d": [ { "type": "mesh3d", "colorbar": { "ticks": "", "outlinewidth": 0 } } ], "contour": [ { "type": "contour", "colorbar": { "ticks": "", "outlinewidth": 0 }, "autocolorscale": true } ], "heatmap": [ { "type": "heatmap", "colorbar": { "ticks": "", "outlinewidth": 0 }, "autocolorscale": true } ], "scatter": [ { "type": "scatter", "marker": { "colorbar": { "ticks": "", "outlinewidth": 0 } } } ], "surface": [ { "type": "surface", "colorbar": { "ticks": "", "outlinewidth": 0 } } ], "heatmapgl": [ { "type": "heatmapgl", "colorbar": { "ticks": "", "outlinewidth": 0 } } ], "histogram": [ { "type": "histogram", "marker": { "colorbar": { "ticks": "", "outlinewidth": 0 } } } ], "parcoords": [ { "line": { "colorbar": { "ticks": "", "outlinewidth": 0 } }, "type": "parcoords" } ], "scatter3d": [ { "type": "scatter3d", "marker": { "colorbar": { "ticks": "", "outlinewidth": 0 } } } ], "scattergl": [ { "type": "scattergl", "marker": { "colorbar": { "ticks": "", "outlinewidth": 0 } } } ], "choropleth": [ { "type": "choropleth", "colorbar": { "ticks": "", "outlinewidth": 0 } } ], "scattergeo": [ { "type": "scattergeo", "marker": { "colorbar": { "ticks": "", "outlinewidth": 0 } } } ], "histogram2d": [ { "type": "histogram2d", "colorbar": { "ticks": "", "outlinewidth": 0 }, "autocolorscale": true } ], "scatterpolar": [ { "type": "scatterpolar", "marker": { "colorbar": { "ticks": "", "outlinewidth": 0 } } } ], "contourcarpet": [ { "type": "contourcarpet", "colorbar": { "ticks": "", "outlinewidth": 0 } } ], "scattercarpet": [ { "type": "scattercarpet", "marker": { "colorbar": { "ticks": "", "outlinewidth": 0 } } } ], "scattermapbox": [ { "type": "scattermapbox", "marker": { "colorbar": { "ticks": "", "outlinewidth": 0 } } } ], "scatterpolargl": [ { "type": "scatterpolargl", "marker": { "colorbar": { "ticks": "", "outlinewidth": 0 } } } ], "scatterternary": [ { "type": "scatterternary", "marker": { "colorbar": { "ticks": "", "outlinewidth": 0 } } } ], "histogram2dcontour": [ { "type": "histogram2dcontour", "colorbar": { "ticks": "", "outlinewidth": 0 }, "autocolorscale": true } ] }, "layout": { "geo": { "bgcolor": "white", "showland": true, "lakecolor": "white", "landcolor": "white", "showlakes": true, "subunitcolor": "#C8D4E3" }, "font": { "color": "#2a3f5f" }, "polar": { "bgcolor": "white", "radialaxis": { "ticks": "", "gridcolor": "#EBF0F8", "linecolor": "#EBF0F8" }, "angularaxis": { "ticks": "", "gridcolor": "#EBF0F8", "linecolor": "#EBF0F8" } }, "scene": { "xaxis": { "ticks": "", "gridcolor": "#DFE8F3", "gridwidth": 2, "linecolor": "#EBF0F8", "zerolinecolor": "#EBF0F8", "showbackground": true, "backgroundcolor": "white" }, "yaxis": { "ticks": "", "gridcolor": "#DFE8F3", "gridwidth": 2, "linecolor": "#EBF0F8", "zerolinecolor": "#EBF0F8", "showbackground": true, "backgroundcolor": "white" }, "zaxis": { "ticks": "", "gridcolor": "#DFE8F3", "gridwidth": 2, "linecolor": "#EBF0F8", "zerolinecolor": "#EBF0F8", "showbackground": true, "backgroundcolor": "white" } }, "title": { "x": 0.05 }, "xaxis": { "ticks": "", "gridcolor": "#EBF0F8", "linecolor": "#EBF0F8", "automargin": true, "zerolinecolor": "#EBF0F8", "zerolinewidth": 2 }, "yaxis": { "ticks": "", "gridcolor": "#EBF0F8", "linecolor": "#EBF0F8", "automargin": true, "zerolinecolor": "#EBF0F8", "zerolinewidth": 2 }, "ternary": { "aaxis": { "ticks": "", "gridcolor": "#DFE8F3", "linecolor": "#A2B1C6" }, "baxis": { "ticks": "", "gridcolor": "#DFE8F3", "linecolor": "#A2B1C6" }, "caxis": { "ticks": "", "gridcolor": "#DFE8F3", "linecolor": "#A2B1C6" }, "bgcolor": "white" }, "colorway": [ "#636efa", "#EF553B", "#00cc96", "#ab63fa", "#19d3f3", "#e763fa", "#fecb52", "#ffa15a", "#ff6692", "#b6e880" ], "hovermode": "closest", "colorscale": { "diverging": [ [ 0, "#8e0152" ], [ 0.1, "#c51b7d" ], [ 0.2, "#de77ae" ], [ 0.3, "#f1b6da" ], [ 0.4, "#fde0ef" ], [ 0.5, "#f7f7f7" ], [ 0.6, "#e6f5d0" ], [ 0.7, "#b8e186" ], [ 0.8, "#7fbc41" ], [ 0.9, "#4d9221" ], [ 1, "#276419" ] ], "sequential": [ [ 0, "#0508b8" ], [ 0.0893854748603352, "#1910d8" ], [ 0.1787709497206704, "#3c19f0" ], [ 0.2681564245810056, "#6b1cfb" ], [ 0.3575418994413408, "#981cfd" ], [ 0.44692737430167595, "#bf1cfd" ], [ 0.5363128491620112, "#dd2bfd" ], [ 0.6256983240223464, "#f246fe" ], [ 0.7150837988826816, "#fc67fd" ], [ 0.8044692737430168, "#fe88fc" ], [ 0.8938547486033519, "#fea5fd" ], [ 0.9832402234636871, "#febefe" ], [ 1, "#fec3fe" ] ], "sequentialminus": [ [ 0, "#0508b8" ], [ 0.0893854748603352, "#1910d8" ], [ 0.1787709497206704, "#3c19f0" ], [ 0.2681564245810056, "#6b1cfb" ], [ 0.3575418994413408, "#981cfd" ], [ 0.44692737430167595, "#bf1cfd" ], [ 0.5363128491620112, "#dd2bfd" ], [ 0.6256983240223464, "#f246fe" ], [ 0.7150837988826816, "#fc67fd" ], [ 0.8044692737430168, "#fe88fc" ], [ 0.8938547486033519, "#fea5fd" ], [ 0.9832402234636871, "#febefe" ], [ 1, "#fec3fe" ] ] }, "plot_bgcolor": "white", "paper_bgcolor": "white", "shapedefaults": { "line": { "width": 0 }, "opacity": 0.4, "fillcolor": "#506784" }, "annotationdefaults": { "arrowhead": 0, "arrowcolor": "#506784", "arrowwidth": 1 } }, "themeRef": "PLOTLY_WHITE" } } }, "height": null, "width": null, "user": { "profile_url": "https://chart-studio.plotly.com/~elena_thebigg", "avatar_url": "https://storage.googleapis.com/plotly-prod-profiles/3.jpg", "background_url": "https://storage.googleapis.com/plotly-prod-profiles/bg-4.jpg", "bio": "", "nickname": "", "website": "", "stream_tokens": null, "feature_set_id": null, "csrf_token": null, "date_joined": "2025-09-15 13:20:05", "mapbox_access_tokens": null, "has_password": null, "username": "elena_thebigg", "email": null, "is_active": null, "readonly": null, "is_dash_creator": null, "dash_created_count": null, "is_chart_creator": null, "charts_created_count": null } }, { "creation_time": "2025-09-17T13:11:49.167552Z", "comments": { "results": [], "count": 0 }, "parented": true, "embed_url": "https://chart-studio.plotly.com/~poop123123/1.embed", "fid": "poop123123:1", "filename": "Plot 1", "filetype": "plot", "img_url": "https://storage.googleapis.com/plotly-prod-images/poop123123/1/9_BYLDX03YBRH07YIXKY3BOIAJAWZZWK.png", "image_urls": { "default": "https://api.plotly.com/v2/files/poop123123:1/image?image_name=default", "block-thumb": "https://storage.googleapis.com/plotly-prod-images/poop123123/1/8_JS9TI1CG1TBFTA4M7THU6VMXI0E4MY.png", "list-thumb": "https://storage.googleapis.com/plotly-prod-images/poop123123/1/9_BYLDX03YBRH07YIXKY3BOIAJAWZZWK.png" }, "api_urls": { "files": "https://api.plotly.com/v2/files/poop123123:1", "plots": "https://api.plotly.com/v2/plots/poop123123:1", "parent": "https://api.plotly.com/v2/folders/home?user=poop123123" }, "owner": "poop123123", "parent": -1, "preview": "", "referencers": [], "references": [], "title": "", "views": 0, "web_url": "https://chart-studio.plotly.com/~poop123123/1/", "world_readable": true, "date_modified": "2025-09-17T14:09:52.057Z", "stars": { "results": [], "count": 0 }, "collaborators": { "results": [], "count": 0 }, "subfolder_count": null, "refresh_interval": null, "organize_view_url": "https://chart-studio.plotly.com/~poop123123/1/", "current_user_permission": "read", "is_theme": null, "is_template": false, "autosize": true, "caption": "", "figure": { "data": [ { "meta": { "columnNames": { "x": "data.0.x", "y": "data.0.y" } }, "type": "bar", "xsrc": "poop123123:0:c27803", "ysrc": "poop123123:0:3c0d2b", "marker": { "line": { "color": "rgb(14, 14, 14)", "width": 2.5 }, "color": "rgb(253, 90, 92)" } } ], "frames": [], "layout": { "title": { "font": { "size": 26, "color": "rgb(8, 8, 8)" }, "text": "Graph 2.2: Bar graph of the 8 respondents’ academic uses for their smartphones" }, "xaxis": { "type": "category", "range": [ -0.5, 3.5 ], "title": { "font": { "size": 20, "color": "rgb(9, 9, 9)" }, "text": "Academic Smartphone Usage Purposes" }, "tickfont": { "size": 16 }, "autorange": true }, "yaxis": { "type": "linear", "range": [ 0, 10 ], "title": { "font": { "size": 20, "color": "rgb(0, 0, 0)" }, "text": "Frequency" }, "autorange": false }, "bargap": 0.30000000000000004, "template": { "data": { "bar": [ { "type": "bar", "marker": { "line": { "color": "#E5ECF6", "width": 0.5 } } } ], "table": [ { "type": "table", "cells": { "fill": { "color": "#EBF0F8" }, "line": { "color": "white" } }, "header": { "fill": { "color": "#C8D4E3" }, "line": { "color": "white" } } } ], "carpet": [ { "type": "carpet", "aaxis": { "gridcolor": "white", "linecolor": "white", "endlinecolor": "#2a3f5f", "minorgridcolor": "white", "startlinecolor": "#2a3f5f" }, "baxis": { "gridcolor": "white", "linecolor": "white", "endlinecolor": "#2a3f5f", "minorgridcolor": "white", "startlinecolor": "#2a3f5f" } } ], "mesh3d": [ { "type": "mesh3d", "colorbar": { "ticks": "", "outlinewidth": 0 } } ], "contour": [ { "type": "contour", "colorbar": { "ticks": "", "outlinewidth": 0 }, "colorscale": [ [ 0, "#0d0887" ], [ 0.1111111111111111, "#46039f" ], [ 0.2222222222222222, "#7201a8" ], [ 0.3333333333333333, "#9c179e" ], [ 0.4444444444444444, "#bd3786" ], [ 0.5555555555555556, "#d8576b" ], [ 0.6666666666666666, "#ed7953" ], [ 0.7777777777777778, "#fb9f3a" ], [ 0.8888888888888888, "#fdca26" ], [ 1, "#f0f921" ] ] } ], "heatmap": [ { "type": "heatmap", "colorbar": { "ticks": "", "outlinewidth": 0 }, "colorscale": [ [ 0, "#0d0887" ], [ 0.1111111111111111, "#46039f" ], [ 0.2222222222222222, "#7201a8" ], [ 0.3333333333333333, "#9c179e" ], [ 0.4444444444444444, "#bd3786" ], [ 0.5555555555555556, "#d8576b" ], [ 0.6666666666666666, "#ed7953" ], [ 0.7777777777777778, "#fb9f3a" ], [ 0.8888888888888888, "#fdca26" ], [ 1, "#f0f921" ] ] } ], "scatter": [ { "type": "scatter", "marker": { "colorbar": { "ticks": "", "outlinewidth": 0 } } } ], "surface": [ { "type": "surface", "colorbar": { "ticks": "", "outlinewidth": 0 } } ], "barpolar": [ { "type": "barpolar", "marker": { "line": { "color": "#E5ECF6", "width": 0.5 } } } ], "heatmapgl": [ { "type": "heatmapgl", "colorbar": { "ticks": "", "outlinewidth": 0 } } ], "histogram": [ { "type": "histogram", "marker": { "colorbar": { "ticks": "", "outlinewidth": 0 } } } ], "parcoords": [ { "line": { "colorbar": { "ticks": "", "outlinewidth": 0 } }, "type": "parcoords" } ], "scatter3d": [ { "line": { "colorbar": { "ticks": "", "outlinewidth": 0 } }, "type": "scatter3d", "marker": { "colorbar": { "ticks": "", "outlinewidth": 0 } } } ], "scattergl": [ { "type": "scattergl", "marker": { "colorbar": { "ticks": "", "outlinewidth": 0 } } } ], "choropleth": [ { "type": "choropleth", "colorbar": { "ticks": "", "outlinewidth": 0 } } ], "scattergeo": [ { "type": "scattergeo", "marker": { "colorbar": { "ticks": "", "outlinewidth": 0 } } } ], "histogram2d": [ { "type": "histogram2d", "colorbar": { "ticks": "", "outlinewidth": 0 }, "colorscale": [ [ 0, "#0d0887" ], [ 0.1111111111111111, "#46039f" ], [ 0.2222222222222222, "#7201a8" ], [ 0.3333333333333333, "#9c179e" ], [ 0.4444444444444444, "#bd3786" ], [ 0.5555555555555556, "#d8576b" ], [ 0.6666666666666666, "#ed7953" ], [ 0.7777777777777778, "#fb9f3a" ], [ 0.8888888888888888, "#fdca26" ], [ 1, "#f0f921" ] ] } ], "scatterpolar": [ { "type": "scatterpolar", "marker": { "colorbar": { "ticks": "", "outlinewidth": 0 } } } ], "contourcarpet": [ { "type": "contourcarpet", "colorbar": { "ticks": "", "outlinewidth": 0 } } ], "scattercarpet": [ { "type": "scattercarpet", "marker": { "colorbar": { "ticks": "", "outlinewidth": 0 } } } ], "scattermapbox": [ { "type": "scattermapbox", "marker": { "colorbar": { "ticks": "", "outlinewidth": 0 } } } ], "scatterpolargl": [ { "type": "scatterpolargl", "marker": { "colorbar": { "ticks": "", "outlinewidth": 0 } } } ], "scatterternary": [ { "type": "scatterternary", "marker": { "colorbar": { "ticks": "", "outlinewidth": 0 } } } ], "histogram2dcontour": [ { "type": "histogram2dcontour", "colorbar": { "ticks": "", "outlinewidth": 0 }, "colorscale": [ [ 0, "#0d0887" ], [ 0.1111111111111111, "#46039f" ], [ 0.2222222222222222, "#7201a8" ], [ 0.3333333333333333, "#9c179e" ], [ 0.4444444444444444, "#bd3786" ], [ 0.5555555555555556, "#d8576b" ], [ 0.6666666666666666, "#ed7953" ], [ 0.7777777777777778, "#fb9f3a" ], [ 0.8888888888888888, "#fdca26" ], [ 1, "#f0f921" ] ] } ] }, "layout": { "geo": { "bgcolor": "white", "showland": true, "lakecolor": "white", "landcolor": "#E5ECF6", "showlakes": true, "subunitcolor": "white" }, "font": { "color": "#2a3f5f" }, "polar": { "bgcolor": "#E5ECF6", "radialaxis": { "ticks": "", "gridcolor": "white", "linecolor": "white" }, "angularaxis": { "ticks": "", "gridcolor": "white", "linecolor": "white" } }, "scene": { "xaxis": { "ticks": "", "gridcolor": "white", "gridwidth": 2, "linecolor": "white", "zerolinecolor": "white", "showbackground": true, "backgroundcolor": "#E5ECF6" }, "yaxis": { "ticks": "", "gridcolor": "white", "gridwidth": 2, "linecolor": "white", "zerolinecolor": "white", "showbackground": true, "backgroundcolor": "#E5ECF6" }, "zaxis": { "ticks": "", "gridcolor": "white", "gridwidth": 2, "linecolor": "white", "zerolinecolor": "white", "showbackground": true, "backgroundcolor": "#E5ECF6" } }, "title": { "x": 0.05 }, "xaxis": { "ticks": "", "gridcolor": "white", "linecolor": "white", "automargin": true, "zerolinecolor": "white", "zerolinewidth": 2 }, "yaxis": { "ticks": "", "gridcolor": "white", "linecolor": "white", "automargin": true, "zerolinecolor": "white", "zerolinewidth": 2 }, "mapbox": { "style": "light" }, "ternary": { "aaxis": { "ticks": "", "gridcolor": "white", "linecolor": "white" }, "baxis": { "ticks": "", "gridcolor": "white", "linecolor": "white" }, "caxis": { "ticks": "", "gridcolor": "white", "linecolor": "white" }, "bgcolor": "#E5ECF6" }, "colorway": [ "#636efa", "#EF553B", "#00cc96", "#ab63fa", "#FFA15A", "#19d3f3", "#FF6692", "#B6E880", "#FF97FF", "#FECB52" ], "hovermode": "closest", "colorscale": { "diverging": [ [ 0, "#8e0152" ], [ 0.1, "#c51b7d" ], [ 0.2, "#de77ae" ], [ 0.3, "#f1b6da" ], [ 0.4, "#fde0ef" ], [ 0.5, "#f7f7f7" ], [ 0.6, "#e6f5d0" ], [ 0.7, "#b8e186" ], [ 0.8, "#7fbc41" ], [ 0.9, "#4d9221" ], [ 1, "#276419" ] ], "sequential": [ [ 0, "#0d0887" ], [ 0.1111111111111111, "#46039f" ], [ 0.2222222222222222, "#7201a8" ], [ 0.3333333333333333, "#9c179e" ], [ 0.4444444444444444, "#bd3786" ], [ 0.5555555555555556, "#d8576b" ], [ 0.6666666666666666, "#ed7953" ], [ 0.7777777777777778, "#fb9f3a" ], [ 0.8888888888888888, "#fdca26" ], [ 1, "#f0f921" ] ], "sequentialminus": [ [ 0, "#0d0887" ], [ 0.1111111111111111, "#46039f" ], [ 0.2222222222222222, "#7201a8" ], [ 0.3333333333333333, "#9c179e" ], [ 0.4444444444444444, "#bd3786" ], [ 0.5555555555555556, "#d8576b" ], [ 0.6666666666666666, "#ed7953" ], [ 0.7777777777777778, "#fb9f3a" ], [ 0.8888888888888888, "#fdca26" ], [ 1, "#f0f921" ] ] }, "hoverlabel": { "align": "left" }, "plot_bgcolor": "#E5ECF6", "paper_bgcolor": "white", "shapedefaults": { "line": { "width": 0 }, "opacity": 0.4, "fillcolor": "#506784" }, "annotationdefaults": { "arrowhead": 0, "arrowcolor": "#506784", "arrowwidth": 1 } } }, "bargroupgap": 0.1 } }, "height": null, "width": null, "user": { "profile_url": "https://chart-studio.plotly.com/~poop123123", "avatar_url": "https://storage.googleapis.com/plotly-prod-profiles/78.jpg", "background_url": "https://storage.googleapis.com/plotly-prod-profiles/bg-14.jpg", "bio": "", "nickname": "", "website": "", "stream_tokens": null, "feature_set_id": null, "csrf_token": null, "date_joined": "2025-09-17 04:16:06", "mapbox_access_tokens": null, "has_password": null, "username": "poop123123", "email": null, "is_active": null, "readonly": null, "is_dash_creator": null, "dash_created_count": null, "is_chart_creator": null, "charts_created_count": null } }, { "creation_time": "2025-09-17T13:04:43.087112Z", "comments": { "results": [], "count": 0 }, "parented": true, "embed_url": "https://chart-studio.plotly.com/~elena_thebigg/17.embed", "fid": "elena_thebigg:17", "filename": "Konzentrationsleistung 4 Boxen", "filetype": "plot", "img_url": "https://storage.googleapis.com/plotly-prod-images/elena_thebigg/17/9_ZXPE1DX2JF6M5APGC8FC293FLEUIP8.png", "image_urls": { "default": "https://api.plotly.com/v2/files/elena_thebigg:17/image?image_name=default", "block-thumb": "https://storage.googleapis.com/plotly-prod-images/elena_thebigg/17/8_EXYGW44F1AMQODF342G9SMP2QGOBFK.png", "list-thumb": "https://storage.googleapis.com/plotly-prod-images/elena_thebigg/17/9_ZXPE1DX2JF6M5APGC8FC293FLEUIP8.png" }, "api_urls": { "files": "https://api.plotly.com/v2/files/elena_thebigg:17", "plots": "https://api.plotly.com/v2/plots/elena_thebigg:17", "parent": "https://api.plotly.com/v2/folders/home?user=elena_thebigg" }, "owner": "elena_thebigg", "parent": -1, "preview": "", "referencers": [], "references": [], "title": "", "views": 0, "web_url": "https://chart-studio.plotly.com/~elena_thebigg/17/", "world_readable": true, "date_modified": "2025-09-17T13:04:43.099Z", "stars": { "results": [], "count": 0 }, "collaborators": { "results": [], "count": 0 }, "subfolder_count": null, "refresh_interval": null, "organize_view_url": "https://chart-studio.plotly.com/~elena_thebigg/17/", "current_user_permission": "read", "is_theme": null, "is_template": false, "autosize": true, "caption": "", "figure": { "data": [ { "line": { "color": "rgb(228, 99, 250)" }, "meta": { "columnNames": { "x": "", "y": "1.1", "low": "", "high": "1.1", "open": "", "text": "", "close": "" } }, "mode": "lines", "name": "A 1", "type": "box", "ysrc": "elena_thebigg:13:a8c19e", "width": 0, "marker": { "line": { "width": 0 }, "size": 4, "color": "rgb(213, 99, 250)", "symbol": "circle" }, "boxmean": false, "highsrc": "elena_thebigg:13:a8c19e", "notched": false, "visible": true, "boxpoints": "all", "showlegend": true, "transforms": [ { "meta": { "columnNames": { "groups": "1.1" } }, "type": "aggregate", "enabled": true, "groupssrc": "elena_thebigg:13:a8c19e", "aggregations": [ { "func": "median", "target": "y", "enabled": true } ] } ], "legendgroup": 1, "orientation": "v", "hovertemplate": "", "selectedpoints": [ 0, 5, 2, 4, 3, 1 ] }, { "meta": { "columnNames": { "x": "", "y": "1.2", "text": "" } }, "name": "A 2", "type": "box", "ysrc": "elena_thebigg:13:1c44a8", "width": 0, "marker": { "line": { "width": 0 }, "size": 4, "color": "#ab63fa", "symbol": "circle-open" }, "boxmean": false, "notched": false, "visible": true, "boxpoints": "all", "showlegend": true, "legendgroup": 1, "orientation": "v", "hovertemplate": "", "selectedpoints": [ 1, 0, 4, 3, 2 ] }, { "meta": { "columnNames": { "y": "1.3", "text": "" } }, "name": "A 3", "type": "box", "ysrc": "elena_thebigg:13:04d63c", "width": 0, "marker": { "line": { "width": 0 }, "size": 4, "color": "rgb(104, 37, 242)", "symbol": "circle-open-dot" }, "boxmean": false, "notched": false, "visible": true, "boxpoints": "all", "showlegend": true, "legendgroup": 1, "hovertemplate": "", "selectedpoints": [ 2, 3, 5, 1, 0, 4 ] }, { "line": { "color": "rgb(50, 4, 158)" }, "meta": { "columnNames": { "x": "", "y": "1.4", "text": "" } }, "name": "A 4", "type": "box", "ysrc": "elena_thebigg:13:2c90f3", "width": 0, "marker": { "line": { "width": 0 }, "size": 4, "color": "rgb(71, 6, 158)", "symbol": "x-open" }, "boxmean": false, "notched": false, "boxpoints": "all", "showlegend": true, "legendgroup": 1, "hovertemplate": "", "selectedpoints": [ 1, 0, 3, 4, 2 ] }, { "meta": { "columnNames": { "y": "A", "text": "" } }, "name": "B 1", "type": "box", "ysrc": "elena_thebigg:14:e6a830", "marker": { "size": 4, "symbol": "x-open" }, "boxmean": false, "notched": false, "boxpoints": "all", "showlegend": true, "legendgroup": 2, "hovertemplate": "", "selectedpoints": [ 0, 1, 4, 3, 2 ] }, { "meta": { "columnNames": { "y": "B", "text": "" } }, "name": "B 2", "type": "box", "ysrc": "elena_thebigg:14:54aee9", "marker": { "size": 4, "color": "rgb(99, 188, 250)", "symbol": "circle" }, "boxmean": false, "notched": false, "boxpoints": "all", "showlegend": true, "legendgroup": 2, "hovertemplate": "", "selectedpoints": [ 1, 4, 0, 2, 3 ] }, { "meta": { "columnNames": { "y": "C", "text": "" } }, "name": "B 3", "type": "box", "ysrc": "elena_thebigg:14:b621ce", "marker": { "size": 4, "color": "rgb(64, 152, 242)", "symbol": "circle-open" }, "boxmean": false, "notched": false, "visible": true, "boxpoints": "all", "showlegend": true, "legendgroup": 2, "hovertemplate": "", "selectedpoints": [ 0, 2, 4, 3, 1 ] }, { "meta": { "columnNames": { "y": "D", "text": "" } }, "name": "B 4", "type": "box", "ysrc": "elena_thebigg:14:b66af5", "marker": { "size": 4, "color": "rgb(8, 112, 194)", "symbol": "circle-open-dot" }, "boxmean": false, "notched": false, "boxpoints": "all", "showlegend": true, "legendgroup": 2, "hovertemplate": "", "selectedpoints": [ 1, 0, 2 ] }, { "meta": { "columnNames": { "y": "A", "text": "" } }, "name": "C 1", "type": "box", "ysrc": "elena_thebigg:15:3b2248", "marker": { "size": 4, "color": "rgb(252, 94, 182)", "symbol": "circle-open-dot" }, "boxmean": false, "notched": false, "boxpoints": "all", "showlegend": true, "legendgroup": 3, "hovertemplate": "", "selectedpoints": [ 2, 1, 0, 3 ] }, { "meta": { "columnNames": { "y": "B", "text": "" } }, "name": "C 2", "type": "box", "ysrc": "elena_thebigg:15:2d316c", "marker": { "size": 4, "color": "rgb(250, 46, 146)", "symbol": "x-open" }, "boxmean": false, "notched": false, "boxpoints": "all", "showlegend": true, "legendgroup": 3, "hovertemplate": "", "selectedpoints": [ 1, 0, 3, 4, 2 ] }, { "meta": { "columnNames": { "y": "C", "text": "" } }, "name": "C 3", "type": "box", "ysrc": "elena_thebigg:15:54001d", "marker": { "size": 4, "color": "rgb(217, 28, 133)", "symbol": "circle" }, "boxmean": false, "notched": false, "boxpoints": "all", "showlegend": true, "legendgroup": 3, "hovertemplate": "", "selectedpoints": [ 0, 1, 2, 3, 4 ] }, { "meta": { "columnNames": { "y": "D", "text": "" } }, "name": "C 4", "type": "box", "ysrc": "elena_thebigg:15:c12f4c", "marker": { "size": 4, "color": "rgb(196, 8, 113)", "symbol": "circle-open" }, "boxmean": false, "notched": false, "boxpoints": "all", "showlegend": true, "legendgroup": 3, "hovertemplate": "", "selectedpoints": [ 0, 2, 3, 1 ] }, { "meta": { "columnNames": { "y": "A", "text": "" } }, "name": "D 1", "type": "box", "ysrc": "elena_thebigg:16:f687e0", "marker": { "size": 4, "color": "rgb(64, 171, 80)", "symbol": "circle-open" }, "boxmean": false, "notched": false, "boxpoints": "all", "showlegend": true, "legendgroup": 4, "hovertemplate": "", "selectedpoints": [ 4, 2, 3, 0, 1 ] }, { "meta": { "columnNames": { "y": "B", "text": "" } }, "name": "D 2", "type": "box", "ysrc": "elena_thebigg:16:e7687b", "marker": { "size": 4, "color": "rgb(77, 153, 77)", "symbol": "circle-open-dot" }, "boxmean": false, "notched": false, "boxpoints": "all", "showlegend": true, "legendgroup": 4, "hovertemplate": "", "selectedpoints": [ 2, 1, 0, 3 ] }, { "meta": { "columnNames": { "y": "C", "text": "" } }, "name": "D 3", "type": "box", "ysrc": "elena_thebigg:16:a6a013", "marker": { "size": 4, "color": "rgb(5, 145, 12)", "symbol": "x-open" }, "boxmean": false, "notched": false, "boxpoints": "all", "showlegend": true, "legendgroup": 4, "hovertemplate": "", "selectedpoints": [ 1, 3, 4, 0, 2 ] }, { "meta": { "columnNames": { "y": "D", "text": "" } }, "name": "D 4", "type": "box", "ysrc": "elena_thebigg:16:17ba7c", "marker": { "size": 4, "color": "rgb(8, 74, 23)", "symbol": "circle" }, "boxmean": false, "notched": false, "boxpoints": "all", "showlegend": true, "legendgroup": 4, "hovertemplate": "", "selectedpoints": [ 1, 2, 4, 0, 3 ] } ], "frames": [], "layout": { "title": { "font": { "family": "Arial" }, "text": "Konzentrationsleistung" }, "xaxis": { "side": "bottom", "type": "category", "dtick": 25, "range": [ -0.5558464223385684, 15.5 ], "tick0": 13, "ticks": "", "title": { "text": "Versuch" }, "anchor": "y", "mirror": "ticks", "tickson": "labels", "showgrid": true, "showline": true, "tickfont": { "family": "Arial" }, "tickmode": "auto", "zeroline": false, "autorange": false, "linewidth": 2, "tickangle": "auto", "automargin": true, "showspikes": false, "tickprefix": "", "ticksuffix": "", "rangeslider": { "range": [ -0.5397515527950311, 15.5 ], "yaxis": {}, "visible": false, "autorange": true }, "showticklabels": true }, "yaxis": { "type": "linear", "dtick": 25, "range": [ 150, 350 ], "tick0": 0, "title": { "text": "Konzentrationsleistung [Punkte]" }, "domain": [ 0, 1 ], "mirror": "ticks", "tickson": "labels", "showgrid": true, "showline": true, "tickmode": "linear", "zeroline": false, "autorange": false, "linewidth": 2, "fixedrange": false, "showspikes": false }, "legend": { "x": 1.02, "y": 1, "title": { "text": "<br>" }, "itemsizing": "trace", "traceorder": "grouped", "orientation": "v", "tracegroupgap": 3 }, "boxmode": "overlay", "autosize": true, "colorway": [ "#636efa", "#EF553B", "#00cc96", "#ab63fa", "#19d3f3", "#e763fa", "#fecb52", "#ffa15a", "#ff6692", "#b6e880" ], "dragmode": "select", "template": { "data": { "bar": [ { "type": "bar", "marker": { "colorbar": { "ticks": "", "outlinewidth": 0 } } } ], "table": [ { "type": "table", "cells": { "fill": { "color": "#EBF0F8" }, "line": { "color": "white" } }, "header": { "fill": { "color": "#C8D4E3" }, "line": { "color": "white" } } } ], "carpet": [ { "type": "carpet", "aaxis": { "gridcolor": "#C8D4E3", "linecolor": "#C8D4E3", "endlinecolor": "#2a3f5f", "minorgridcolor": "#C8D4E3", "startlinecolor": "#2a3f5f" }, "baxis": { "gridcolor": "#C8D4E3", "linecolor": "#C8D4E3", "endlinecolor": "#2a3f5f", "minorgridcolor": "#C8D4E3", "startlinecolor": "#2a3f5f" } } ], "mesh3d": [ { "type": "mesh3d", "colorbar": { "ticks": "", "outlinewidth": 0 } } ], "contour": [ { "type": "contour", "colorbar": { "ticks": "", "outlinewidth": 0 }, "autocolorscale": true } ], "heatmap": [ { "type": "heatmap", "colorbar": { "ticks": "", "outlinewidth": 0 }, "autocolorscale": true } ], "scatter": [ { "type": "scatter", "marker": { "colorbar": { "ticks": "", "outlinewidth": 0 } } } ], "surface": [ { "type": "surface", "colorbar": { "ticks": "", "outlinewidth": 0 } } ], "heatmapgl": [ { "type": "heatmapgl", "colorbar": { "ticks": "", "outlinewidth": 0 } } ], "histogram": [ { "type": "histogram", "marker": { "colorbar": { "ticks": "", "outlinewidth": 0 } } } ], "parcoords": [ { "line": { "colorbar": { "ticks": "", "outlinewidth": 0 } }, "type": "parcoords" } ], "scatter3d": [ { "type": "scatter3d", "marker": { "colorbar": { "ticks": "", "outlinewidth": 0 } } } ], "scattergl": [ { "type": "scattergl", "marker": { "colorbar": { "ticks": "", "outlinewidth": 0 } } } ], "choropleth": [ { "type": "choropleth", "colorbar": { "ticks": "", "outlinewidth": 0 } } ], "scattergeo": [ { "type": "scattergeo", "marker": { "colorbar": { "ticks": "", "outlinewidth": 0 } } } ], "histogram2d": [ { "type": "histogram2d", "colorbar": { "ticks": "", "outlinewidth": 0 }, "autocolorscale": true } ], "scatterpolar": [ { "type": "scatterpolar", "marker": { "colorbar": { "ticks": "", "outlinewidth": 0 } } } ], "contourcarpet": [ { "type": "contourcarpet", "colorbar": { "ticks": "", "outlinewidth": 0 } } ], "scattercarpet": [ { "type": "scattercarpet", "marker": { "colorbar": { "ticks": "", "outlinewidth": 0 } } } ], "scattermapbox": [ { "type": "scattermapbox", "marker": { "colorbar": { "ticks": "", "outlinewidth": 0 } } } ], "scatterpolargl": [ { "type": "scatterpolargl", "marker": { "colorbar": { "ticks": "", "outlinewidth": 0 } } } ], "scatterternary": [ { "type": "scatterternary", "marker": { "colorbar": { "ticks": "", "outlinewidth": 0 } } } ], "histogram2dcontour": [ { "type": "histogram2dcontour", "colorbar": { "ticks": "", "outlinewidth": 0 }, "autocolorscale": true } ] }, "layout": { "geo": { "bgcolor": "white", "showland": true, "lakecolor": "white", "landcolor": "white", "showlakes": true, "subunitcolor": "#C8D4E3" }, "font": { "color": "#2a3f5f" }, "polar": { "bgcolor": "white", "radialaxis": { "ticks": "", "gridcolor": "#EBF0F8", "linecolor": "#EBF0F8" }, "angularaxis": { "ticks": "", "gridcolor": "#EBF0F8", "linecolor": "#EBF0F8" } }, "scene": { "xaxis": { "ticks": "", "gridcolor": "#DFE8F3", "gridwidth": 2, "linecolor": "#EBF0F8", "zerolinecolor": "#EBF0F8", "showbackground": true, "backgroundcolor": "white" }, "yaxis": { "ticks": "", "gridcolor": "#DFE8F3", "gridwidth": 2, "linecolor": "#EBF0F8", "zerolinecolor": "#EBF0F8", "showbackground": true, "backgroundcolor": "white" }, "zaxis": { "ticks": "", "gridcolor": "#DFE8F3", "gridwidth": 2, "linecolor": "#EBF0F8", "zerolinecolor": "#EBF0F8", "showbackground": true, "backgroundcolor": "white" } }, "title": { "x": 0.05 }, "xaxis": { "ticks": "", "gridcolor": "#EBF0F8", "linecolor": "#EBF0F8", "automargin": true, "zerolinecolor": "#EBF0F8", "zerolinewidth": 2 }, "yaxis": { "ticks": "", "gridcolor": "#EBF0F8", "linecolor": "#EBF0F8", "automargin": true, "zerolinecolor": "#EBF0F8", "zerolinewidth": 2 }, "ternary": { "aaxis": { "ticks": "", "gridcolor": "#DFE8F3", "linecolor": "#A2B1C6" }, "baxis": { "ticks": "", "gridcolor": "#DFE8F3", "linecolor": "#A2B1C6" }, "caxis": { "ticks": "", "gridcolor": "#DFE8F3", "linecolor": "#A2B1C6" }, "bgcolor": "white" }, "colorway": [ "#636efa", "#EF553B", "#00cc96", "#ab63fa", "#19d3f3", "#e763fa", "#fecb52", "#ffa15a", "#ff6692", "#b6e880" ], "hovermode": "closest", "colorscale": { "diverging": [ [ 0, "#8e0152" ], [ 0.1, "#c51b7d" ], [ 0.2, "#de77ae" ], [ 0.3, "#f1b6da" ], [ 0.4, "#fde0ef" ], [ 0.5, "#f7f7f7" ], [ 0.6, "#e6f5d0" ], [ 0.7, "#b8e186" ], [ 0.8, "#7fbc41" ], [ 0.9, "#4d9221" ], [ 1, "#276419" ] ], "sequential": [ [ 0, "#0508b8" ], [ 0.0893854748603352, "#1910d8" ], [ 0.1787709497206704, "#3c19f0" ], [ 0.2681564245810056, "#6b1cfb" ], [ 0.3575418994413408, "#981cfd" ], [ 0.44692737430167595, "#bf1cfd" ], [ 0.5363128491620112, "#dd2bfd" ], [ 0.6256983240223464, "#f246fe" ], [ 0.7150837988826816, "#fc67fd" ], [ 0.8044692737430168, "#fe88fc" ], [ 0.8938547486033519, "#fea5fd" ], [ 0.9832402234636871, "#febefe" ], [ 1, "#fec3fe" ] ], "sequentialminus": [ [ 0, "#0508b8" ], [ 0.0893854748603352, "#1910d8" ], [ 0.1787709497206704, "#3c19f0" ], [ 0.2681564245810056, "#6b1cfb" ], [ 0.3575418994413408, "#981cfd" ], [ 0.44692737430167595, "#bf1cfd" ], [ 0.5363128491620112, "#dd2bfd" ], [ 0.6256983240223464, "#f246fe" ], [ 0.7150837988826816, "#fc67fd" ], [ 0.8044692737430168, "#fe88fc" ], [ 0.8938547486033519, "#fea5fd" ], [ 0.9832402234636871, "#febefe" ], [ 1, "#fec3fe" ] ] }, "plot_bgcolor": "white", "paper_bgcolor": "white", "shapedefaults": { "line": { "width": 0 }, "opacity": 0.4, "fillcolor": "#506784" }, "annotationdefaults": { "arrowhead": 0, "arrowcolor": "#506784", "arrowwidth": 1 } }, "themeRef": "PLOTLY_WHITE" }, "hovermode": "closest", "colorscale": { "sequential": [ [ 0, "#f7fcf5" ], [ 0.125, "#e5f5e0" ], [ 0.25, "#c7e9c0" ], [ 0.375, "#a1d99b" ], [ 0.5, "#74c476" ], [ 0.625, "#41ab5d" ], [ 0.75, "#238b45" ], [ 0.875, "#006d2c" ], [ 1, "#00441b" ] ] }, "showlegend": true, "annotations": [] } }, "height": null, "width": null, "user": { "profile_url": "https://chart-studio.plotly.com/~elena_thebigg", "avatar_url": "https://storage.googleapis.com/plotly-prod-profiles/3.jpg", "background_url": "https://storage.googleapis.com/plotly-prod-profiles/bg-4.jpg", "bio": "", "nickname": "", "website": "", "stream_tokens": null, "feature_set_id": null, "csrf_token": null, "date_joined": "2025-09-15 13:20:05", "mapbox_access_tokens": null, "has_password": null, "username": "elena_thebigg", "email": null, "is_active": null, "readonly": null, "is_dash_creator": null, "dash_created_count": null, "is_chart_creator": null, "charts_created_count": null } }, { "creation_time": "2025-09-17T12:44:36.971540Z", "comments": { "results": [], "count": 0 }, "parented": true, "embed_url": "https://chart-studio.plotly.com/~dylanGenius/28.embed", "fid": "dylanGenius:28", "filename": "model-coefficient-most-positive-table", "filetype": "plot", "img_url": "https://storage.googleapis.com/plotly-prod-images/dylanGenius/28/9_XIY5EW7XX3E4JBDS9JV190XS1JDCRJ.png", "image_urls": { "default": "https://storage.googleapis.com/plotly-prod-images/dylanGenius/28/2_42OCOPSMKM06W9XGSJ5W89M5CJBWV1.png", "block-thumb": "https://storage.googleapis.com/plotly-prod-images/dylanGenius/28/8_5P8L0V09E5FY23H970CM11SMJMP6NY.png", "list-thumb": "https://storage.googleapis.com/plotly-prod-images/dylanGenius/28/9_XIY5EW7XX3E4JBDS9JV190XS1JDCRJ.png" }, "api_urls": { "files": "https://api.plotly.com/v2/files/dylanGenius:28", "plots": "https://api.plotly.com/v2/plots/dylanGenius:28", "parent": "https://api.plotly.com/v2/folders/home?user=dylanGenius" }, "owner": "dylanGenius", "parent": -1, "preview": "", "referencers": [], "references": [], "title": "", "views": 3, "web_url": "https://chart-studio.plotly.com/~dylanGenius/28/", "world_readable": true, "date_modified": "2025-09-17T12:45:17.146Z", "stars": { "results": [], "count": 0 }, "collaborators": { "results": [], "count": 0 }, "subfolder_count": null, "refresh_interval": null, "organize_view_url": "https://chart-studio.plotly.com/~dylanGenius/28/", "current_user_permission": "read", "is_theme": null, "is_template": null, "autosize": true, "caption": "", "figure": { "data": [ { "name": "Week 1 PICC - Most Positive Coefficients", "type": "table", "cells": { "fill": { "color": "white" }, "font": { "size": 11, "family": "Arial", "weight": "bold" }, "align": "center", "height": 33, "valuessrc": "dylanGenius:29:331985" }, "header": { "fill": { "color": "orange" }, "font": { "size": 14, "color": "black", "family": "Arial" }, "align": "center", "height": 36, "valuessrc": "dylanGenius:29:579df9" }, "visible": true }, { "name": "Week 1 PICC - Most Negative Coefficients", "type": "table", "cells": { "fill": { "color": "white" }, "font": { "size": 11, "family": "Arial", "weight": "bold" }, "align": "center", "height": 33, "valuessrc": "dylanGenius:29:fd867a" }, "header": { "fill": { "color": "orange" }, "font": { "size": 14, "color": "black", "family": "Arial" }, "align": "center", "height": 36, "valuessrc": "dylanGenius:29:2c0f89" }, "visible": false }, { "name": "Week 1 PRGV - Most Positive Coefficients", "type": "table", "cells": { "fill": { "color": "white" }, "font": { "size": 11, "family": "Arial", "weight": "bold" }, "align": "center", "height": 33, "valuessrc": "dylanGenius:29:d4d438" }, "header": { "fill": { "color": "orange" }, "font": { "size": 14, "color": "black", "family": "Arial" }, "align": "center", "height": 36, "valuessrc": "dylanGenius:29:62942d" }, "visible": false }, { "name": "Week 1 PRGV - Most Negative Coefficients", "type": "table", "cells": { "fill": { "color": "white" }, "font": { "size": 11, "family": "Arial", "weight": "bold" }, "align": "center", "height": 33, "valuessrc": "dylanGenius:29:faf3e9" }, "header": { "fill": { "color": "orange" }, "font": { "size": 14, "color": "black", "family": "Arial" }, "align": "center", "height": 36, "valuessrc": "dylanGenius:29:97868c" }, "visible": false }, { "name": "Week 2 PICC - Most Positive Coefficients", "type": "table", "cells": { "fill": { "color": "white" }, "font": { "size": 11, "family": "Arial", "weight": "bold" }, "align": "center", "height": 33, "valuessrc": "dylanGenius:29:b20913" }, "header": { "fill": { "color": "orange" }, "font": { "size": 14, "color": "black", "family": "Arial" }, "align": "center", "height": 36, "valuessrc": "dylanGenius:29:b7159e" }, "visible": false }, { "name": "Week 2 PICC - Most Negative Coefficients", "type": "table", "cells": { "fill": { "color": "white" }, "font": { "size": 11, "family": "Arial", "weight": "bold" }, "align": "center", "height": 33, "valuessrc": "dylanGenius:29:5705df" }, "header": { "fill": { "color": "orange" }, "font": { "size": 14, "color": "black", "family": "Arial" }, "align": "center", "height": 36, "valuessrc": "dylanGenius:29:26cfe5" }, "visible": false }, { "name": "Week 2 PRGV - Most Positive Coefficients", "type": "table", "cells": { "fill": { "color": "white" }, "font": { "size": 11, "family": "Arial", "weight": "bold" }, "align": "center", "height": 33, "valuessrc": "dylanGenius:29:619f03" }, "header": { "fill": { "color": "orange" }, "font": { "size": 14, "color": "black", "family": "Arial" }, "align": "center", "height": 36, "valuessrc": "dylanGenius:29:53bd52" }, "visible": false }, { "name": "Week 2 PRGV - Most Negative Coefficients", "type": "table", "cells": { "fill": { "color": "white" }, "font": { "size": 11, "family": "Arial", "weight": "bold" }, "align": "center", "height": 33, "valuessrc": "dylanGenius:29:8f22eb" }, "header": { "fill": { "color": "orange" }, "font": { "size": 14, "color": "black", "family": "Arial" }, "align": "center", "height": 36, "valuessrc": "dylanGenius:29:9cb08f" }, "visible": false } ], "layout": { "title": { "x": 0.5, "font": { "size": 16 }, "text": "PRGV Group 2 Most/Least Positive model coefficients" }, "height": 600, "margin": { "b": 20, "l": 20, "r": 20, "t": 180 }, "autosize": true, "template": { "data": { "bar": [ { "type": "bar", "marker": { "line": { "color": "#E5ECF6", "width": 0.5 }, "pattern": { "size": 10, "fillmode": "overlay", "solidity": 0.2 } }, "error_x": { "color": "#2a3f5f" }, "error_y": { "color": "#2a3f5f" } } ], "pie": [ { "type": "pie", "automargin": true } ], "table": [ { "type": "table", "cells": { "fill": { "color": "#EBF0F8" }, "line": { "color": "white" } }, "header": { "fill": { "color": "#C8D4E3" }, "line": { "color": "white" } } } ], "carpet": [ { "type": "carpet", "aaxis": { "gridcolor": "white", "linecolor": "white", "endlinecolor": "#2a3f5f", "minorgridcolor": "white", "startlinecolor": "#2a3f5f" }, "baxis": { "gridcolor": "white", "linecolor": "white", "endlinecolor": "#2a3f5f", "minorgridcolor": "white", "startlinecolor": "#2a3f5f" } } ], "mesh3d": [ { "type": "mesh3d", "colorbar": { "ticks": "", "outlinewidth": 0 } } ], "contour": [ { "type": "contour", "colorbar": { "ticks": "", "outlinewidth": 0 }, "colorscale": [ [ 0.0, "#0d0887" ], [ 0.1111111111111111, "#46039f" ], [ 0.2222222222222222, "#7201a8" ], [ 0.3333333333333333, "#9c179e" ], [ 0.4444444444444444, "#bd3786" ], [ 0.5555555555555556, "#d8576b" ], [ 0.6666666666666666, "#ed7953" ], [ 0.7777777777777778, "#fb9f3a" ], [ 0.8888888888888888, "#fdca26" ], [ 1.0, "#f0f921" ] ] } ], "heatmap": [ { "type": "heatmap", "colorbar": { "ticks": "", "outlinewidth": 0 }, "colorscale": [ [ 0.0, "#0d0887" ], [ 0.1111111111111111, "#46039f" ], [ 0.2222222222222222, "#7201a8" ], [ 0.3333333333333333, "#9c179e" ], [ 0.4444444444444444, "#bd3786" ], [ 0.5555555555555556, "#d8576b" ], [ 0.6666666666666666, "#ed7953" ], [ 0.7777777777777778, "#fb9f3a" ], [ 0.8888888888888888, "#fdca26" ], [ 1.0, "#f0f921" ] ] } ], "scatter": [ { "type": "scatter", "fillpattern": { "size": 10, "fillmode": "overlay", "solidity": 0.2 } } ], "surface": [ { "type": "surface", "colorbar": { "ticks": "", "outlinewidth": 0 }, "colorscale": [ [ 0.0, "#0d0887" ], [ 0.1111111111111111, "#46039f" ], [ 0.2222222222222222, "#7201a8" ], [ 0.3333333333333333, "#9c179e" ], [ 0.4444444444444444, "#bd3786" ], [ 0.5555555555555556, "#d8576b" ], [ 0.6666666666666666, "#ed7953" ], [ 0.7777777777777778, "#fb9f3a" ], [ 0.8888888888888888, "#fdca26" ], [ 1.0, "#f0f921" ] ] } ], "barpolar": [ { "type": "barpolar", "marker": { "line": { "color": "#E5ECF6", "width": 0.5 }, "pattern": { "size": 10, "fillmode": "overlay", "solidity": 0.2 } } } ], "heatmapgl": [ { "type": "heatmapgl", "colorbar": { "ticks": "", "outlinewidth": 0 }, "colorscale": [ [ 0.0, "#0d0887" ], [ 0.1111111111111111, "#46039f" ], [ 0.2222222222222222, "#7201a8" ], [ 0.3333333333333333, "#9c179e" ], [ 0.4444444444444444, "#bd3786" ], [ 0.5555555555555556, "#d8576b" ], [ 0.6666666666666666, "#ed7953" ], [ 0.7777777777777778, "#fb9f3a" ], [ 0.8888888888888888, "#fdca26" ], [ 1.0, "#f0f921" ] ] } ], "histogram": [ { "type": "histogram", "marker": { "pattern": { "size": 10, "fillmode": "overlay", "solidity": 0.2 } } } ], "parcoords": [ { "line": { "colorbar": { "ticks": "", "outlinewidth": 0 } }, "type": "parcoords" } ], "scatter3d": [ { "line": { "colorbar": { "ticks": "", "outlinewidth": 0 } }, "type": "scatter3d", "marker": { "colorbar": { "ticks": "", "outlinewidth": 0 } } } ], "scattergl": [ { "type": "scattergl", "marker": { "colorbar": { "ticks": "", "outlinewidth": 0 } } } ], "choropleth": [ { "type": "choropleth", "colorbar": { "ticks": "", "outlinewidth": 0 } } ], "scattergeo": [ { "type": "scattergeo", "marker": { "colorbar": { "ticks": "", "outlinewidth": 0 } } } ], "histogram2d": [ { "type": "histogram2d", "colorbar": { "ticks": "", "outlinewidth": 0 }, "colorscale": [ [ 0.0, "#0d0887" ], [ 0.1111111111111111, "#46039f" ], [ 0.2222222222222222, "#7201a8" ], [ 0.3333333333333333, "#9c179e" ], [ 0.4444444444444444, "#bd3786" ], [ 0.5555555555555556, "#d8576b" ], [ 0.6666666666666666, "#ed7953" ], [ 0.7777777777777778, "#fb9f3a" ], [ 0.8888888888888888, "#fdca26" ], [ 1.0, "#f0f921" ] ] } ], "scatterpolar": [ { "type": "scatterpolar", "marker": { "colorbar": { "ticks": "", "outlinewidth": 0 } } } ], "contourcarpet": [ { "type": "contourcarpet", "colorbar": { "ticks": "", "outlinewidth": 0 } } ], "scattercarpet": [ { "type": "scattercarpet", "marker": { "colorbar": { "ticks": "", "outlinewidth": 0 } } } ], "scattermapbox": [ { "type": "scattermapbox", "marker": { "colorbar": { "ticks": "", "outlinewidth": 0 } } } ], "scatterpolargl": [ { "type": "scatterpolargl", "marker": { "colorbar": { "ticks": "", "outlinewidth": 0 } } } ], "scatterternary": [ { "type": "scatterternary", "marker": { "colorbar": { "ticks": "", "outlinewidth": 0 } } } ], "histogram2dcontour": [ { "type": "histogram2dcontour", "colorbar": { "ticks": "", "outlinewidth": 0 }, "colorscale": [ [ 0.0, "#0d0887" ], [ 0.1111111111111111, "#46039f" ], [ 0.2222222222222222, "#7201a8" ], [ 0.3333333333333333, "#9c179e" ], [ 0.4444444444444444, "#bd3786" ], [ 0.5555555555555556, "#d8576b" ], [ 0.6666666666666666, "#ed7953" ], [ 0.7777777777777778, "#fb9f3a" ], [ 0.8888888888888888, "#fdca26" ], [ 1.0, "#f0f921" ] ] } ] }, "layout": { "geo": { "bgcolor": "white", "showland": true, "lakecolor": "white", "landcolor": "#E5ECF6", "showlakes": true, "subunitcolor": "white" }, "font": { "color": "#2a3f5f" }, "polar": { "bgcolor": "#E5ECF6", "radialaxis": { "ticks": "", "gridcolor": "white", "linecolor": "white" }, "angularaxis": { "ticks": "", "gridcolor": "white", "linecolor": "white" } }, "scene": { "xaxis": { "ticks": "", "gridcolor": "white", "gridwidth": 2, "linecolor": "white", "zerolinecolor": "white", "showbackground": true, "backgroundcolor": "#E5ECF6" }, "yaxis": { "ticks": "", "gridcolor": "white", "gridwidth": 2, "linecolor": "white", "zerolinecolor": "white", "showbackground": true, "backgroundcolor": "#E5ECF6" }, "zaxis": { "ticks": "", "gridcolor": "white", "gridwidth": 2, "linecolor": "white", "zerolinecolor": "white", "showbackground": true, "backgroundcolor": "#E5ECF6" } }, "title": { "x": 0.05 }, "xaxis": { "ticks": "", "title": { "standoff": 15 }, "gridcolor": "white", "linecolor": "white", "automargin": true, "zerolinecolor": "white", "zerolinewidth": 2 }, "yaxis": { "ticks": "", "title": { "standoff": 15 }, "gridcolor": "white", "linecolor": "white", "automargin": true, "zerolinecolor": "white", "zerolinewidth": 2 }, "mapbox": { "style": "light" }, "ternary": { "aaxis": { "ticks": "", "gridcolor": "white", "linecolor": "white" }, "baxis": { "ticks": "", "gridcolor": "white", "linecolor": "white" }, "caxis": { "ticks": "", "gridcolor": "white", "linecolor": "white" }, "bgcolor": "#E5ECF6" }, "colorway": [ "#636efa", "#EF553B", "#00cc96", "#ab63fa", "#FFA15A", "#19d3f3", "#FF6692", "#B6E880", "#FF97FF", "#FECB52" ], "coloraxis": { "colorbar": { "ticks": "", "outlinewidth": 0 } }, "hovermode": "closest", "colorscale": { "diverging": [ [ 0, "#8e0152" ], [ 0.1, "#c51b7d" ], [ 0.2, "#de77ae" ], [ 0.3, "#f1b6da" ], [ 0.4, "#fde0ef" ], [ 0.5, "#f7f7f7" ], [ 0.6, "#e6f5d0" ], [ 0.7, "#b8e186" ], [ 0.8, "#7fbc41" ], [ 0.9, "#4d9221" ], [ 1, "#276419" ] ], "sequential": [ [ 0.0, "#0d0887" ], [ 0.1111111111111111, "#46039f" ], [ 0.2222222222222222, "#7201a8" ], [ 0.3333333333333333, "#9c179e" ], [ 0.4444444444444444, "#bd3786" ], [ 0.5555555555555556, "#d8576b" ], [ 0.6666666666666666, "#ed7953" ], [ 0.7777777777777778, "#fb9f3a" ], [ 0.8888888888888888, "#fdca26" ], [ 1.0, "#f0f921" ] ], "sequentialminus": [ [ 0.0, "#0d0887" ], [ 0.1111111111111111, "#46039f" ], [ 0.2222222222222222, "#7201a8" ], [ 0.3333333333333333, "#9c179e" ], [ 0.4444444444444444, "#bd3786" ], [ 0.5555555555555556, "#d8576b" ], [ 0.6666666666666666, "#ed7953" ], [ 0.7777777777777778, "#fb9f3a" ], [ 0.8888888888888888, "#fdca26" ], [ 1.0, "#f0f921" ] ] }, "hoverlabel": { "align": "left" }, "plot_bgcolor": "#E5ECF6", "paper_bgcolor": "white", "shapedefaults": { "line": { "color": "#2a3f5f" } }, "autotypenumbers": "strict", "annotationdefaults": { "arrowhead": 0, "arrowcolor": "#2a3f5f", "arrowwidth": 1 } } }, "annotations": [ { "x": 0.01, "y": 1.18, "font": { "size": 12, "color": "black" }, "text": "<b>Select View:</b>", "xref": "paper", "yref": "paper", "showarrow": false } ], "updatemenus": [ { "x": 0.01, "y": 1.15, "pad": { "r": 10, "t": 10 }, "font": { "size": 11 }, "type": "dropdown", "bgcolor": "rgba(255,255,255,0.9)", "buttons": [ { "args": [ { "visible": [ true, false, false, false, false, false, false, false ] } ], "label": "Week 1 PICC - Most Positive Coefficients", "method": "update" }, { "args": [ { "visible": [ false, true, false, false, false, false, false, false ] } ], "label": "Week 1 PICC - Most Negative Coefficients", "method": "update" }, { "args": [ { "visible": [ false, false, true, false, false, false, false, false ] } ], "label": "Week 1 PRGV - Most Positive Coefficients", "method": "update" }, { "args": [ { "visible": [ false, false, false, true, false, false, false, false ] } ], "label": "Week 1 PRGV - Most Negative Coefficients", "method": "update" }, { "args": [ { "visible": [ false, false, false, false, true, false, false, false ] } ], "label": "Week 2 PICC - Most Positive Coefficients", "method": "update" }, { "args": [ { "visible": [ false, false, false, false, false, true, false, false ] } ], "label": "Week 2 PICC - Most Negative Coefficients", "method": "update" }, { "args": [ { "visible": [ false, false, false, false, false, false, true, false ] } ], "label": "Week 2 PRGV - Most Positive Coefficients", "method": "update" }, { "args": [ { "visible": [ false, false, false, false, false, false, false, true ] } ], "label": "Week 2 PRGV - Most Negative Coefficients", "method": "update" } ], "xanchor": "left", "yanchor": "top", "direction": "down", "showactive": true, "bordercolor": "rgba(0,0,0,0.3)", "borderwidth": 1 } ] } }, "height": 600, "width": null, "user": { "profile_url": "https://chart-studio.plotly.com/~dylanGenius", "avatar_url": "https://storage.googleapis.com/plotly-prod-profiles/83.jpg", "background_url": "https://storage.googleapis.com/plotly-prod-profiles/bg-14.jpg", "bio": "", "nickname": "", "website": "", "stream_tokens": null, "feature_set_id": null, "csrf_token": null, "date_joined": "2025-08-27 11:43:34", "mapbox_access_tokens": null, "has_password": null, "username": "dylanGenius", "email": null, "is_active": null, "readonly": null, "is_dash_creator": null, "dash_created_count": null, "is_chart_creator": null, "charts_created_count": null } }, { "creation_time": "2025-09-17T12:43:11.326065Z", "comments": { "results": [], "count": 0 }, "parented": true, "embed_url": "https://chart-studio.plotly.com/~PlotlyWCY/1.embed", "fid": "PlotlyWCY:1", "filename": "Plot 1", "filetype": "plot", "img_url": "https://storage.googleapis.com/plotly-prod-images/PlotlyWCY/1/9_5RFBWVZWCSSZOT7DJY2TO6FLN6FUDR.png", "image_urls": { "default": "https://storage.googleapis.com/plotly-prod-images/PlotlyWCY/1/2_I1GCKK6E7D09POSZL8GP2E7AK9MS9S.png", "block-thumb": "https://storage.googleapis.com/plotly-prod-images/PlotlyWCY/1/8_984CX9A5B5HDXVJ5ZNTGRUHUYXTS02.png", "list-thumb": "https://storage.googleapis.com/plotly-prod-images/PlotlyWCY/1/9_5RFBWVZWCSSZOT7DJY2TO6FLN6FUDR.png" }, "api_urls": { "files": "https://api.plotly.com/v2/files/PlotlyWCY:1", "plots": "https://api.plotly.com/v2/plots/PlotlyWCY:1", "parent": "https://api.plotly.com/v2/folders/home?user=PlotlyWCY" }, "owner": "PlotlyWCY", "parent": -1, "preview": "", "referencers": [], "references": [], "title": "", "views": 0, "web_url": "https://chart-studio.plotly.com/~PlotlyWCY/1/", "world_readable": true, "date_modified": "2025-09-17T12:43:11.337Z", "stars": { "results": [], "count": 0 }, "collaborators": { "results": [], "count": 0 }, "subfolder_count": null, "refresh_interval": null, "organize_view_url": "https://chart-studio.plotly.com/~PlotlyWCY/1/", "current_user_permission": "read", "is_theme": null, "is_template": false, "autosize": true, "caption": "", "figure": { "data": [ { "meta": { "columnNames": { "x": "0.0076068738", "y": "2.4294813", "z": "1.6361966", "text": "Eclipsing" } }, "mode": "markers+text", "type": "scatter3d", "xsrc": "PlotlyWCY:0:715544", "ysrc": "PlotlyWCY:0:bd2efb", "zsrc": "PlotlyWCY:0:e6079f", "marker": { "size": 1 }, "textsrc": "PlotlyWCY:0:21e002" } ], "frames": [], "layout": { "font": { "size": 11 }, "scene": { "camera": { "up": { "x": 0, "y": 0, "z": 1 }, "eye": { "x": -0.6050056272971597, "y": -1.0292410115354205, "z": 0.8508290501451353 }, "center": { "x": 0.19287701519552977, "y": 0.03037140860490208, "z": -0.08072326537885634 }, "projection": { "type": "perspective" } }, "aspectmode": "auto", "aspectratio": { "x": 1.1925544707752238, "y": 0.9113226638594949, "z": 0.9201308759781236 } }, "xaxis": { "range": [ -1, 6 ], "autorange": true }, "yaxis": { "range": [ -1, 4 ], "autorange": true }, "autosize": true, "template": { "data": { "bar": [ { "type": "bar", "marker": { "colorbar": { "ticks": "", "outlinewidth": 0 } } } ], "table": [ { "type": "table", "cells": { "fill": { "color": "#EBF0F8" }, "line": { "color": "white" } }, "header": { "fill": { "color": "#C8D4E3" }, "line": { "color": "white" } } } ], "carpet": [ { "type": "carpet", "aaxis": { "gridcolor": "#C8D4E3", "linecolor": "#C8D4E3", "endlinecolor": "#2a3f5f", "minorgridcolor": "#C8D4E3", "startlinecolor": "#2a3f5f" }, "baxis": { "gridcolor": "#C8D4E3", "linecolor": "#C8D4E3", "endlinecolor": "#2a3f5f", "minorgridcolor": "#C8D4E3", "startlinecolor": "#2a3f5f" } } ], "mesh3d": [ { "type": "mesh3d", "colorbar": { "ticks": "", "outlinewidth": 0 } } ], "contour": [ { "type": "contour", "colorbar": { "ticks": "", "outlinewidth": 0 }, "autocolorscale": true } ], "heatmap": [ { "type": "heatmap", "colorbar": { "ticks": "", "outlinewidth": 0 }, "autocolorscale": true } ], "scatter": [ { "type": "scatter", "marker": { "colorbar": { "ticks": "", "outlinewidth": 0 } } } ], "surface": [ { "type": "surface", "colorbar": { "ticks": "", "outlinewidth": 0 } } ], "heatmapgl": [ { "type": "heatmapgl", "colorbar": { "ticks": "", "outlinewidth": 0 } } ], "histogram": [ { "type": "histogram", "marker": { "colorbar": { "ticks": "", "outlinewidth": 0 } } } ], "parcoords": [ { "line": { "colorbar": { "ticks": "", "outlinewidth": 0 } }, "type": "parcoords" } ], "scatter3d": [ { "type": "scatter3d", "marker": { "colorbar": { "ticks": "", "outlinewidth": 0 } } } ], "scattergl": [ { "type": "scattergl", "marker": { "colorbar": { "ticks": "", "outlinewidth": 0 } } } ], "choropleth": [ { "type": "choropleth", "colorbar": { "ticks": "", "outlinewidth": 0 } } ], "scattergeo": [ { "type": "scattergeo", "marker": { "colorbar": { "ticks": "", "outlinewidth": 0 } } } ], "histogram2d": [ { "type": "histogram2d", "colorbar": { "ticks": "", "outlinewidth": 0 }, "autocolorscale": true } ], "scatterpolar": [ { "type": "scatterpolar", "marker": { "colorbar": { "ticks": "", "outlinewidth": 0 } } } ], "contourcarpet": [ { "type": "contourcarpet", "colorbar": { "ticks": "", "outlinewidth": 0 } } ], "scattercarpet": [ { "type": "scattercarpet", "marker": { "colorbar": { "ticks": "", "outlinewidth": 0 } } } ], "scattermapbox": [ { "type": "scattermapbox", "marker": { "colorbar": { "ticks": "", "outlinewidth": 0 } } } ], "scatterpolargl": [ { "type": "scatterpolargl", "marker": { "colorbar": { "ticks": "", "outlinewidth": 0 } } } ], "scatterternary": [ { "type": "scatterternary", "marker": { "colorbar": { "ticks": "", "outlinewidth": 0 } } } ], "histogram2dcontour": [ { "type": "histogram2dcontour", "colorbar": { "ticks": "", "outlinewidth": 0 }, "autocolorscale": true } ] }, "layout": { "geo": { "bgcolor": "white", "showland": true, "lakecolor": "white", "landcolor": "white", "showlakes": true, "subunitcolor": "#C8D4E3" }, "font": { "color": "#2a3f5f" }, "polar": { "bgcolor": "white", "radialaxis": { "ticks": "", "gridcolor": "#EBF0F8", "linecolor": "#EBF0F8" }, "angularaxis": { "ticks": "", "gridcolor": "#EBF0F8", "linecolor": "#EBF0F8" } }, "scene": { "xaxis": { "ticks": "", "gridcolor": "#DFE8F3", "gridwidth": 2, "linecolor": "#EBF0F8", "zerolinecolor": "#EBF0F8", "showbackground": true, "backgroundcolor": "white" }, "yaxis": { "ticks": "", "gridcolor": "#DFE8F3", "gridwidth": 2, "linecolor": "#EBF0F8", "zerolinecolor": "#EBF0F8", "showbackground": true, "backgroundcolor": "white" }, "zaxis": { "ticks": "", "gridcolor": "#DFE8F3", "gridwidth": 2, "linecolor": "#EBF0F8", "zerolinecolor": "#EBF0F8", "showbackground": true, "backgroundcolor": "white" } }, "title": { "x": 0.05 }, "xaxis": { "ticks": "", "gridcolor": "#EBF0F8", "linecolor": "#EBF0F8", "automargin": true, "zerolinecolor": "#EBF0F8", "zerolinewidth": 2 }, "yaxis": { "ticks": "", "gridcolor": "#EBF0F8", "linecolor": "#EBF0F8", "automargin": true, "zerolinecolor": "#EBF0F8", "zerolinewidth": 2 }, "ternary": { "aaxis": { "ticks": "", "gridcolor": "#DFE8F3", "linecolor": "#A2B1C6" }, "baxis": { "ticks": "", "gridcolor": "#DFE8F3", "linecolor": "#A2B1C6" }, "caxis": { "ticks": "", "gridcolor": "#DFE8F3", "linecolor": "#A2B1C6" }, "bgcolor": "white" }, "colorway": [ "#636efa", "#EF553B", "#00cc96", "#ab63fa", "#19d3f3", "#e763fa", "#fecb52", "#ffa15a", "#ff6692", "#b6e880" ], "hovermode": "closest", "colorscale": { "diverging": [ [ 0, "#8e0152" ], [ 0.1, "#c51b7d" ], [ 0.2, "#de77ae" ], [ 0.3, "#f1b6da" ], [ 0.4, "#fde0ef" ], [ 0.5, "#f7f7f7" ], [ 0.6, "#e6f5d0" ], [ 0.7, "#b8e186" ], [ 0.8, "#7fbc41" ], [ 0.9, "#4d9221" ], [ 1, "#276419" ] ], "sequential": [ [ 0, "#0508b8" ], [ 0.0893854748603352, "#1910d8" ], [ 0.1787709497206704, "#3c19f0" ], [ 0.2681564245810056, "#6b1cfb" ], [ 0.3575418994413408, "#981cfd" ], [ 0.44692737430167595, "#bf1cfd" ], [ 0.5363128491620112, "#dd2bfd" ], [ 0.6256983240223464, "#f246fe" ], [ 0.7150837988826816, "#fc67fd" ], [ 0.8044692737430168, "#fe88fc" ], [ 0.8938547486033519, "#fea5fd" ], [ 0.9832402234636871, "#febefe" ], [ 1, "#fec3fe" ] ], "sequentialminus": [ [ 0, "#0508b8" ], [ 0.0893854748603352, "#1910d8" ], [ 0.1787709497206704, "#3c19f0" ], [ 0.2681564245810056, "#6b1cfb" ], [ 0.3575418994413408, "#981cfd" ], [ 0.44692737430167595, "#bf1cfd" ], [ 0.5363128491620112, "#dd2bfd" ], [ 0.6256983240223464, "#f246fe" ], [ 0.7150837988826816, "#fc67fd" ], [ 0.8044692737430168, "#fe88fc" ], [ 0.8938547486033519, "#fea5fd" ], [ 0.9832402234636871, "#febefe" ], [ 1, "#fec3fe" ] ] }, "plot_bgcolor": "white", "paper_bgcolor": "white", "shapedefaults": { "line": { "width": 0 }, "opacity": 0.4, "fillcolor": "#506784" }, "annotationdefaults": { "arrowhead": 0, "arrowcolor": "#506784", "arrowwidth": 1 } }, "themeRef": "PLOTLY_WHITE" } } }, "height": null, "width": null, "user": { "profile_url": "https://chart-studio.plotly.com/~PlotlyWCY", "avatar_url": "https://storage.googleapis.com/plotly-prod-profiles/75.jpg", "background_url": "https://storage.googleapis.com/plotly-prod-profiles/bg-14.jpg", "bio": "", "nickname": "", "website": "", "stream_tokens": null, "feature_set_id": null, "csrf_token": null, "date_joined": "2025-09-17 12:39:10", "mapbox_access_tokens": null, "has_password": null, "username": "PlotlyWCY", "email": null, "is_active": null, "readonly": null, "is_dash_creator": null, "dash_created_count": null, "is_chart_creator": null, "charts_created_count": null } }, { "creation_time": "2025-09-17T12:06:55.323204Z", "comments": { "results": [], "count": 0 }, "parented": true, "embed_url": "https://chart-studio.plotly.com/~rajg9545/4.embed", "fid": "rajg9545:4", "filename": "Plot 4", "filetype": "plot", "img_url": "https://storage.googleapis.com/plotly-prod-images/rajg9545/4/9_WYXQ8L7QH1JUAW67V1PZELUV5LWE87.png", "image_urls": { "default": "https://storage.googleapis.com/plotly-prod-images/rajg9545/4/2_2VAKZKMDE1QE4RK8CNMX2X78H63EN5.png", "block-thumb": "https://storage.googleapis.com/plotly-prod-images/rajg9545/4/8_ONS894YRDAJ0BA776GSSZMC6NQ4FXV.png", "list-thumb": "https://storage.googleapis.com/plotly-prod-images/rajg9545/4/9_WYXQ8L7QH1JUAW67V1PZELUV5LWE87.png" }, "api_urls": { "files": "https://api.plotly.com/v2/files/rajg9545:4", "plots": "https://api.plotly.com/v2/plots/rajg9545:4", "parent": "https://api.plotly.com/v2/folders/home?user=rajg9545" }, "owner": "rajg9545", "parent": -1, "preview": "", "referencers": [], "references": [], "title": "", "views": 0, "web_url": "https://chart-studio.plotly.com/~rajg9545/4/", "world_readable": true, "date_modified": "2025-09-17T12:06:55.337Z", "stars": { "results": [], "count": 0 }, "collaborators": { "results": [], "count": 0 }, "subfolder_count": null, "refresh_interval": null, "organize_view_url": "https://chart-studio.plotly.com/~rajg9545/4/", "current_user_permission": "read", "is_theme": null, "is_template": false, "autosize": true, "caption": "", "figure": { "data": [ { "meta": { "columnNames": { "x": "Trace 0, x", "y": "Trace 0, y" } }, "mode": "lines+markers", "type": "scatter", "xsrc": "rajg9545:3:2fd887", "ysrc": "rajg9545:3:1b87ce" }, { "meta": { "columnNames": { "x": "Trace 1, x", "y": "Trace 1, y" } }, "mode": "lines+markers", "type": "scatter", "xsrc": "rajg9545:3:7238db", "ysrc": "rajg9545:3:83095b" }, { "meta": { "columnNames": { "x": "Trace 2, x", "y": "Trace 2, y" } }, "mode": "lines+markers", "type": "scatter", "xsrc": "rajg9545:3:745dad", "ysrc": "rajg9545:3:469f6e" }, { "meta": { "columnNames": { "x": "Trace 3, x", "y": "Trace 3, y" } }, "mode": "lines+markers", "type": "scatter", "xsrc": "rajg9545:3:4cdeab", "ysrc": "rajg9545:3:c70e78" }, { "meta": { "columnNames": { "x": "Trace 4, x", "y": "Trace 4, y" } }, "mode": "lines+markers", "type": "scatter", "xsrc": "rajg9545:3:8f1b62", "ysrc": "rajg9545:3:d97793" }, { "meta": { "columnNames": { "x": "Trace 5, x", "y": "Trace 5, y" } }, "mode": "lines+markers", "type": "scatter", "xsrc": "rajg9545:3:fc4ff9", "ysrc": "rajg9545:3:f238d2" }, { "meta": { "columnNames": { "x": "Trace 6, x", "y": "Trace 6, y" } }, "mode": "lines+markers", "type": "scatter", "xsrc": "rajg9545:3:95548e", "ysrc": "rajg9545:3:8793e5" }, { "meta": { "columnNames": { "x": "Trace 7, x", "y": "Trace 7, y" } }, "mode": "lines+markers", "type": "scatter", "xsrc": "rajg9545:3:001193", "ysrc": "rajg9545:3:c039d8" } ], "frames": [], "layout": { "xaxis": { "type": "linear", "range": [ 0.16025580088386576, 5.969703261552139 ], "autorange": true }, "yaxis": { "type": "linear", "range": [ -4.658328457557943, 217.55165155809522 ], "autorange": true }, "autosize": true } }, "height": null, "width": null, "user": { "profile_url": "https://chart-studio.plotly.com/~rajg9545", "avatar_url": "https://storage.googleapis.com/plotly-prod-profiles/84.jpg", "background_url": "https://storage.googleapis.com/plotly-prod-profiles/bg-7.jpg", "bio": "", "nickname": "", "website": "", "stream_tokens": null, "feature_set_id": null, "csrf_token": null, "date_joined": "2025-09-17 10:50:02", "mapbox_access_tokens": null, "has_password": null, "username": "rajg9545", "email": null, "is_active": null, "readonly": null, "is_dash_creator": null, "dash_created_count": null, "is_chart_creator": null, "charts_created_count": null } }, { "creation_time": "2025-09-17T12:04:15.123399Z", "comments": { "results": [], "count": 0 }, "parented": true, "embed_url": "https://chart-studio.plotly.com/~chima-99/1.embed", "fid": "chima-99:1", "filename": "Plot 1", "filetype": "plot", "img_url": "https://storage.googleapis.com/plotly-prod-images/chima-99/1/9_N32KS36KAN4C0GQCMHY6CY8H8JCVGC.png", "image_urls": { "default": "https://storage.googleapis.com/plotly-prod-images/chima-99/1/2_JDR81YVJK6YHG2KPFA6WJJASL4PSKX.png", "block-thumb": "https://storage.googleapis.com/plotly-prod-images/chima-99/1/8_5LRD37H43LJU4KE74G7PPN42NC4G32.png", "list-thumb": "https://storage.googleapis.com/plotly-prod-images/chima-99/1/9_N32KS36KAN4C0GQCMHY6CY8H8JCVGC.png" }, "api_urls": { "files": "https://api.plotly.com/v2/files/chima-99:1", "plots": "https://api.plotly.com/v2/plots/chima-99:1", "parent": "https://api.plotly.com/v2/folders/home?user=chima-99" }, "owner": "chima-99", "parent": -1, "preview": "", "referencers": [], "references": [], "title": "", "views": 0, "web_url": "https://chart-studio.plotly.com/~chima-99/1/", "world_readable": true, "date_modified": "2025-09-17T12:04:15.135Z", "stars": { "results": [], "count": 0 }, "collaborators": { "results": [], "count": 0 }, "subfolder_count": null, "refresh_interval": null, "organize_view_url": "https://chart-studio.plotly.com/~chima-99/1/", "current_user_permission": "read", "is_theme": null, "is_template": false, "autosize": true, "caption": "", "figure": { "data": [ { "meta": { "columnNames": { "x": "Zaman (saat)", "y": "tampon pH= 6,4" } }, "mode": "markers", "name": "tampon pH = 6,4", "type": "bar", "xsrc": "chima-99:0:5125da", "ysrc": "chima-99:0:21de7e", "orientation": "v" }, { "meta": { "columnNames": { "x": "Zaman (saat)", "y": "tampon pH = 6,4 + %10 FBS" } }, "name": "tampon pH = 6,4 + %10 FBS", "type": "bar", "xsrc": "chima-99:0:5125da", "ysrc": "chima-99:0:35f7b8", "orientation": "v" }, { "meta": { "columnNames": { "x": "Zaman (saat)", "y": "tampon pH = 6,4 + %50 FBS" } }, "name": "tampon pH = 6,4 + %50 FBS", "type": "bar", "xsrc": "chima-99:0:5125da", "ysrc": "chima-99:0:08b96a", "orientation": "v" } ], "frames": [], "layout": { "title": { "text": "FC-2 Farklı fızyolojik ortamlarda partikül boyutu ortalaması" }, "xaxis": { "type": "linear", "range": [ 0.5, 24.5 ], "title": { "text": "Zaman (saat)" }, "autorange": true }, "yaxis": { "range": [ 0, 313894.7368421053 ], "title": { "text": "partikül boyutu (nm)" }, "autorange": true }, "autosize": true, "template": { "data": { "bar": [ { "type": "bar", "marker": { "colorbar": { "ticks": "", "outlinewidth": 0 } } } ], "table": [ { "type": "table", "cells": { "fill": { "color": "#EBF0F8" }, "line": { "color": "white" } }, "header": { "fill": { "color": "#C8D4E3" }, "line": { "color": "white" } } } ], "carpet": [ { "type": "carpet", "aaxis": { "gridcolor": "#C8D4E3", "linecolor": "#C8D4E3", "endlinecolor": "#2a3f5f", "minorgridcolor": "#C8D4E3", "startlinecolor": "#2a3f5f" }, "baxis": { "gridcolor": "#C8D4E3", "linecolor": "#C8D4E3", "endlinecolor": "#2a3f5f", "minorgridcolor": "#C8D4E3", "startlinecolor": "#2a3f5f" } } ], "mesh3d": [ { "type": "mesh3d", "colorbar": { "ticks": "", "outlinewidth": 0 } } ], "contour": [ { "type": "contour", "colorbar": { "ticks": "", "outlinewidth": 0 }, "autocolorscale": true } ], "heatmap": [ { "type": "heatmap", "colorbar": { "ticks": "", "outlinewidth": 0 }, "autocolorscale": true } ], "scatter": [ { "type": "scatter", "marker": { "colorbar": { "ticks": "", "outlinewidth": 0 } } } ], "surface": [ { "type": "surface", "colorbar": { "ticks": "", "outlinewidth": 0 } } ], "heatmapgl": [ { "type": "heatmapgl", "colorbar": { "ticks": "", "outlinewidth": 0 } } ], "histogram": [ { "type": "histogram", "marker": { "colorbar": { "ticks": "", "outlinewidth": 0 } } } ], "parcoords": [ { "line": { "colorbar": { "ticks": "", "outlinewidth": 0 } }, "type": "parcoords" } ], "scatter3d": [ { "type": "scatter3d", "marker": { "colorbar": { "ticks": "", "outlinewidth": 0 } } } ], "scattergl": [ { "type": "scattergl", "marker": { "colorbar": { "ticks": "", "outlinewidth": 0 } } } ], "choropleth": [ { "type": "choropleth", "colorbar": { "ticks": "", "outlinewidth": 0 } } ], "scattergeo": [ { "type": "scattergeo", "marker": { "colorbar": { "ticks": "", "outlinewidth": 0 } } } ], "histogram2d": [ { "type": "histogram2d", "colorbar": { "ticks": "", "outlinewidth": 0 }, "autocolorscale": true } ], "scatterpolar": [ { "type": "scatterpolar", "marker": { "colorbar": { "ticks": "", "outlinewidth": 0 } } } ], "contourcarpet": [ { "type": "contourcarpet", "colorbar": { "ticks": "", "outlinewidth": 0 } } ], "scattercarpet": [ { "type": "scattercarpet", "marker": { "colorbar": { "ticks": "", "outlinewidth": 0 } } } ], "scattermapbox": [ { "type": "scattermapbox", "marker": { "colorbar": { "ticks": "", "outlinewidth": 0 } } } ], "scatterpolargl": [ { "type": "scatterpolargl", "marker": { "colorbar": { "ticks": "", "outlinewidth": 0 } } } ], "scatterternary": [ { "type": "scatterternary", "marker": { "colorbar": { "ticks": "", "outlinewidth": 0 } } } ], "histogram2dcontour": [ { "type": "histogram2dcontour", "colorbar": { "ticks": "", "outlinewidth": 0 }, "autocolorscale": true } ] }, "layout": { "geo": { "bgcolor": "white", "showland": true, "lakecolor": "white", "landcolor": "white", "showlakes": true, "subunitcolor": "#C8D4E3" }, "font": { "color": "#2a3f5f" }, "polar": { "bgcolor": "white", "radialaxis": { "ticks": "", "gridcolor": "#EBF0F8", "linecolor": "#EBF0F8" }, "angularaxis": { "ticks": "", "gridcolor": "#EBF0F8", "linecolor": "#EBF0F8" } }, "scene": { "xaxis": { "ticks": "", "gridcolor": "#DFE8F3", "gridwidth": 2, "linecolor": "#EBF0F8", "zerolinecolor": "#EBF0F8", "showbackground": true, "backgroundcolor": "white" }, "yaxis": { "ticks": "", "gridcolor": "#DFE8F3", "gridwidth": 2, "linecolor": "#EBF0F8", "zerolinecolor": "#EBF0F8", "showbackground": true, "backgroundcolor": "white" }, "zaxis": { "ticks": "", "gridcolor": "#DFE8F3", "gridwidth": 2, "linecolor": "#EBF0F8", "zerolinecolor": "#EBF0F8", "showbackground": true, "backgroundcolor": "white" } }, "title": { "x": 0.05 }, "xaxis": { "ticks": "", "gridcolor": "#EBF0F8", "linecolor": "#EBF0F8", "automargin": true, "zerolinecolor": "#EBF0F8", "zerolinewidth": 2 }, "yaxis": { "ticks": "", "gridcolor": "#EBF0F8", "linecolor": "#EBF0F8", "automargin": true, "zerolinecolor": "#EBF0F8", "zerolinewidth": 2 }, "ternary": { "aaxis": { "ticks": "", "gridcolor": "#DFE8F3", "linecolor": "#A2B1C6" }, "baxis": { "ticks": "", "gridcolor": "#DFE8F3", "linecolor": "#A2B1C6" }, "caxis": { "ticks": "", "gridcolor": "#DFE8F3", "linecolor": "#A2B1C6" }, "bgcolor": "white" }, "colorway": [ "#636efa", "#EF553B", "#00cc96", "#ab63fa", "#19d3f3", "#e763fa", "#fecb52", "#ffa15a", "#ff6692", "#b6e880" ], "hovermode": "closest", "colorscale": { "diverging": [ [ 0, "#8e0152" ], [ 0.1, "#c51b7d" ], [ 0.2, "#de77ae" ], [ 0.3, "#f1b6da" ], [ 0.4, "#fde0ef" ], [ 0.5, "#f7f7f7" ], [ 0.6, "#e6f5d0" ], [ 0.7, "#b8e186" ], [ 0.8, "#7fbc41" ], [ 0.9, "#4d9221" ], [ 1, "#276419" ] ], "sequential": [ [ 0, "#0508b8" ], [ 0.0893854748603352, "#1910d8" ], [ 0.1787709497206704, "#3c19f0" ], [ 0.2681564245810056, "#6b1cfb" ], [ 0.3575418994413408, "#981cfd" ], [ 0.44692737430167595, "#bf1cfd" ], [ 0.5363128491620112, "#dd2bfd" ], [ 0.6256983240223464, "#f246fe" ], [ 0.7150837988826816, "#fc67fd" ], [ 0.8044692737430168, "#fe88fc" ], [ 0.8938547486033519, "#fea5fd" ], [ 0.9832402234636871, "#febefe" ], [ 1, "#fec3fe" ] ], "sequentialminus": [ [ 0, "#0508b8" ], [ 0.0893854748603352, "#1910d8" ], [ 0.1787709497206704, "#3c19f0" ], [ 0.2681564245810056, "#6b1cfb" ], [ 0.3575418994413408, "#981cfd" ], [ 0.44692737430167595, "#bf1cfd" ], [ 0.5363128491620112, "#dd2bfd" ], [ 0.6256983240223464, "#f246fe" ], [ 0.7150837988826816, "#fc67fd" ], [ 0.8044692737430168, "#fe88fc" ], [ 0.8938547486033519, "#fea5fd" ], [ 0.9832402234636871, "#febefe" ], [ 1, "#fec3fe" ] ] }, "plot_bgcolor": "white", "paper_bgcolor": "white", "shapedefaults": { "line": { "width": 0 }, "opacity": 0.4, "fillcolor": "#506784" }, "annotationdefaults": { "arrowhead": 0, "arrowcolor": "#506784", "arrowwidth": 1 } }, "themeRef": "PLOTLY_WHITE" } } }, "height": null, "width": null, "user": { "profile_url": "https://chart-studio.plotly.com/~chima-99", "avatar_url": "https://storage.googleapis.com/plotly-prod-profiles/51.jpg", "background_url": "https://storage.googleapis.com/plotly-prod-profiles/bg-3.jpg", "bio": "", "nickname": "", "website": "", "stream_tokens": null, "feature_set_id": null, "csrf_token": null, "date_joined": "2025-09-08 12:53:08", "mapbox_access_tokens": null, "has_password": null, "username": "chima-99", "email": null, "is_active": null, "readonly": null, "is_dash_creator": null, "dash_created_count": null, "is_chart_creator": null, "charts_created_count": null } }, { "creation_time": "2025-09-17T12:02:45.240350Z", "comments": { "results": [], "count": 0 }, "parented": true, "embed_url": "https://chart-studio.plotly.com/~JYCar/5.embed", "fid": "JYCar:5", "filename": "Zonqor 3", "filetype": "plot", "img_url": "https://api.plotly.com/v2/files/JYCar:5/image?image_name=list-thumb", "image_urls": { "default": "https://storage.googleapis.com/plotly-prod-images/JYCar/5/2_TDW86CBEQV0AN17OOQGIMDXJV7EXDY.png", "block-thumb": "https://storage.googleapis.com/plotly-prod-images/JYCar/5/8_5B2DXT1F9DDKKBIEAW79SIXCQ4X7W7.png", "list-thumb": "https://api.plotly.com/v2/files/JYCar:5/image?image_name=list-thumb" }, "api_urls": { "files": "https://api.plotly.com/v2/files/JYCar:5", "plots": "https://api.plotly.com/v2/plots/JYCar:5", "parent": "https://api.plotly.com/v2/folders/home?user=JYCar" }, "owner": "JYCar", "parent": -1, "preview": "", "referencers": [], "references": [], "title": "", "views": 0, "web_url": "https://chart-studio.plotly.com/~JYCar/5/", "world_readable": true, "date_modified": "2025-09-17T12:02:45.250Z", "stars": { "results": [], "count": 0 }, "collaborators": { "results": [], "count": 0 }, "subfolder_count": null, "refresh_interval": null, "organize_view_url": "https://chart-studio.plotly.com/~JYCar/5/", "current_user_permission": "read", "is_theme": null, "is_template": false, "autosize": true, "caption": "", "figure": { "data": [ { "line": { "width": 1 }, "meta": { "columnNames": { "x": "DateTime", "y": "Zonqor Inlet" } }, "mode": "lines", "name": "Inlet FL03", "type": "scatter", "xsrc": "JYCar:4:59eda2", "ysrc": "JYCar:4:c88f81", "visible": true }, { "meta": { "columnNames": { "x": "DateTime", "y": "Zonqor Level" } }, "mode": "lines", "name": "Zonqor Level", "type": "scatter", "xsrc": "JYCar:4:59eda2", "ysrc": "JYCar:4:a60570", "yaxis": "y2", "stackgroup": null } ], "frames": [], "layout": { "xaxis": { "type": "category", "range": [ 0, 4920 ], "nticks": 24, "showline": true, "autorange": true, "gridcolor": "rgb(221, 221, 221)", "linecolor": "rgb(221, 221, 221)", "linewidth": 4 }, "yaxis": { "side": "left", "type": "linear", "range": [ -7.15781446111111, 135.9984747611111 ], "ticks": "inside", "title": { "text": "Flow /m3/hr<br>" }, "nticks": 10, "showline": true, "autorange": true, "gridcolor": "rgb(221, 221, 221)", "linecolor": "rgb(221, 221, 221)", "linewidth": 3, "zerolinecolor": "rgb(221, 221, 221)", "zerolinewidth": 3, "showticklabels": true }, "legend": { "x": 0.9093586217413433, "y": 1.0611353711790392 }, "yaxis2": { "side": "right", "type": "linear", "range": [ 1.5421922111666666, 2.846263847833333 ], "title": { "font": { "color": "rgb(252, 34, 7)" }, "text": "Level /m" }, "showline": true, "zeroline": false, "autorange": false, "gridcolor": "rgb(252, 195, 199)", "gridwidth": 1, "linecolor": "rgb(245, 195, 195)", "linewidth": 2, "overlaying": "y" }, "autosize": true, "template": { "data": { "bar": [ { "type": "bar", "marker": { "colorbar": { "ticks": "", "outlinewidth": 0 } } } ], "table": [ { "type": "table", "cells": { "fill": { "color": "#EBF0F8" }, "line": { "color": "white" } }, "header": { "fill": { "color": "#C8D4E3" }, "line": { "color": "white" } } } ], "carpet": [ { "type": "carpet", "aaxis": { "gridcolor": "#C8D4E3", "linecolor": "#C8D4E3", "endlinecolor": "#2a3f5f", "minorgridcolor": "#C8D4E3", "startlinecolor": "#2a3f5f" }, "baxis": { "gridcolor": "#C8D4E3", "linecolor": "#C8D4E3", "endlinecolor": "#2a3f5f", "minorgridcolor": "#C8D4E3", "startlinecolor": "#2a3f5f" } } ], "mesh3d": [ { "type": "mesh3d", "colorbar": { "ticks": "", "outlinewidth": 0 } } ], "contour": [ { "type": "contour", "colorbar": { "ticks": "", "outlinewidth": 0 }, "autocolorscale": true } ], "heatmap": [ { "type": "heatmap", "colorbar": { "ticks": "", "outlinewidth": 0 }, "autocolorscale": true } ], "scatter": [ { "type": "scatter", "marker": { "colorbar": { "ticks": "", "outlinewidth": 0 } } } ], "surface": [ { "type": "surface", "colorbar": { "ticks": "", "outlinewidth": 0 } } ], "heatmapgl": [ { "type": "heatmapgl", "colorbar": { "ticks": "", "outlinewidth": 0 } } ], "histogram": [ { "type": "histogram", "marker": { "colorbar": { "ticks": "", "outlinewidth": 0 } } } ], "parcoords": [ { "line": { "colorbar": { "ticks": "", "outlinewidth": 0 } }, "type": "parcoords" } ], "scatter3d": [ { "type": "scatter3d", "marker": { "colorbar": { "ticks": "", "outlinewidth": 0 } } } ], "scattergl": [ { "type": "scattergl", "marker": { "colorbar": { "ticks": "", "outlinewidth": 0 } } } ], "choropleth": [ { "type": "choropleth", "colorbar": { "ticks": "", "outlinewidth": 0 } } ], "scattergeo": [ { "type": "scattergeo", "marker": { "colorbar": { "ticks": "", "outlinewidth": 0 } } } ], "histogram2d": [ { "type": "histogram2d", "colorbar": { "ticks": "", "outlinewidth": 0 }, "autocolorscale": true } ], "scatterpolar": [ { "type": "scatterpolar", "marker": { "colorbar": { "ticks": "", "outlinewidth": 0 } } } ], "contourcarpet": [ { "type": "contourcarpet", "colorbar": { "ticks": "", "outlinewidth": 0 } } ], "scattercarpet": [ { "type": "scattercarpet", "marker": { "colorbar": { "ticks": "", "outlinewidth": 0 } } } ], "scattermapbox": [ { "type": "scattermapbox", "marker": { "colorbar": { "ticks": "", "outlinewidth": 0 } } } ], "scatterpolargl": [ { "type": "scatterpolargl", "marker": { "colorbar": { "ticks": "", "outlinewidth": 0 } } } ], "scatterternary": [ { "type": "scatterternary", "marker": { "colorbar": { "ticks": "", "outlinewidth": 0 } } } ], "histogram2dcontour": [ { "type": "histogram2dcontour", "colorbar": { "ticks": "", "outlinewidth": 0 }, "autocolorscale": true } ] }, "layout": { "geo": { "bgcolor": "white", "showland": true, "lakecolor": "white", "landcolor": "white", "showlakes": true, "subunitcolor": "#C8D4E3" }, "font": { "color": "#2a3f5f" }, "polar": { "bgcolor": "white", "radialaxis": { "ticks": "", "gridcolor": "#EBF0F8", "linecolor": "#EBF0F8" }, "angularaxis": { "ticks": "", "gridcolor": "#EBF0F8", "linecolor": "#EBF0F8" } }, "scene": { "xaxis": { "ticks": "", "gridcolor": "#DFE8F3", "gridwidth": 2, "linecolor": "#EBF0F8", "zerolinecolor": "#EBF0F8", "showbackground": true, "backgroundcolor": "white" }, "yaxis": { "ticks": "", "gridcolor": "#DFE8F3", "gridwidth": 2, "linecolor": "#EBF0F8", "zerolinecolor": "#EBF0F8", "showbackground": true, "backgroundcolor": "white" }, "zaxis": { "ticks": "", "gridcolor": "#DFE8F3", "gridwidth": 2, "linecolor": "#EBF0F8", "zerolinecolor": "#EBF0F8", "showbackground": true, "backgroundcolor": "white" } }, "title": { "x": 0.05 }, "xaxis": { "ticks": "", "gridcolor": "#EBF0F8", "linecolor": "#EBF0F8", "automargin": true, "zerolinecolor": "#EBF0F8", "zerolinewidth": 2 }, "yaxis": { "ticks": "", "gridcolor": "#EBF0F8", "linecolor": "#EBF0F8", "automargin": true, "zerolinecolor": "#EBF0F8", "zerolinewidth": 2 }, "ternary": { "aaxis": { "ticks": "", "gridcolor": "#DFE8F3", "linecolor": "#A2B1C6" }, "baxis": { "ticks": "", "gridcolor": "#DFE8F3", "linecolor": "#A2B1C6" }, "caxis": { "ticks": "", "gridcolor": "#DFE8F3", "linecolor": "#A2B1C6" }, "bgcolor": "white" }, "colorway": [ "#636efa", "#EF553B", "#00cc96", "#ab63fa", "#19d3f3", "#e763fa", "#fecb52", "#ffa15a", "#ff6692", "#b6e880" ], "hovermode": "closest", "colorscale": { "diverging": [ [ 0, "#8e0152" ], [ 0.1, "#c51b7d" ], [ 0.2, "#de77ae" ], [ 0.3, "#f1b6da" ], [ 0.4, "#fde0ef" ], [ 0.5, "#f7f7f7" ], [ 0.6, "#e6f5d0" ], [ 0.7, "#b8e186" ], [ 0.8, "#7fbc41" ], [ 0.9, "#4d9221" ], [ 1, "#276419" ] ], "sequential": [ [ 0, "#0508b8" ], [ 0.0893854748603352, "#1910d8" ], [ 0.1787709497206704, "#3c19f0" ], [ 0.2681564245810056, "#6b1cfb" ], [ 0.3575418994413408, "#981cfd" ], [ 0.44692737430167595, "#bf1cfd" ], [ 0.5363128491620112, "#dd2bfd" ], [ 0.6256983240223464, "#f246fe" ], [ 0.7150837988826816, "#fc67fd" ], [ 0.8044692737430168, "#fe88fc" ], [ 0.8938547486033519, "#fea5fd" ], [ 0.9832402234636871, "#febefe" ], [ 1, "#fec3fe" ] ], "sequentialminus": [ [ 0, "#0508b8" ], [ 0.0893854748603352, "#1910d8" ], [ 0.1787709497206704, "#3c19f0" ], [ 0.2681564245810056, "#6b1cfb" ], [ 0.3575418994413408, "#981cfd" ], [ 0.44692737430167595, "#bf1cfd" ], [ 0.5363128491620112, "#dd2bfd" ], [ 0.6256983240223464, "#f246fe" ], [ 0.7150837988826816, "#fc67fd" ], [ 0.8044692737430168, "#fe88fc" ], [ 0.8938547486033519, "#fea5fd" ], [ 0.9832402234636871, "#febefe" ], [ 1, "#fec3fe" ] ] }, "plot_bgcolor": "white", "paper_bgcolor": "white", "shapedefaults": { "line": { "width": 0 }, "opacity": 0.4, "fillcolor": "#506784" }, "annotationdefaults": { "arrowhead": 0, "arrowcolor": "#506784", "arrowwidth": 1 } }, "themeRef": "PLOTLY_WHITE" }, "plot_bgcolor": "rgb(238, 238, 238)", "paper_bgcolor": "rgb(238, 238, 238)" } }, "height": null, "width": null, "user": { "profile_url": "https://chart-studio.plotly.com/~JYCar", "avatar_url": "https://storage.googleapis.com/plotly-prod-profiles/56.jpg", "background_url": "https://storage.googleapis.com/plotly-prod-profiles/bg-3.jpg", "bio": "", "nickname": "", "website": "", "stream_tokens": null, "feature_set_id": null, "csrf_token": null, "date_joined": "2025-09-16 16:57:39", "mapbox_access_tokens": null, "has_password": null, "username": "JYCar", "email": null, "is_active": null, "readonly": null, "is_dash_creator": null, "dash_created_count": null, "is_chart_creator": null, "charts_created_count": null } }, { "creation_time": "2025-09-17T11:55:02.432400Z", "comments": { "results": [], "count": 0 }, "parented": true, "embed_url": "https://chart-studio.plotly.com/~JYCar/3.embed", "fid": "JYCar:3", "filename": "Plot 3", "filetype": "plot", "img_url": "https://storage.googleapis.com/plotly-prod-images/JYCar/3/9_N53H78VQQO46N51R4TOW3LY8UYL7KC.png", "image_urls": { "default": "https://storage.googleapis.com/plotly-prod-images/JYCar/3/2_KFIRME4AE8LL2N9HXJZOCU83I50L5V.png", "block-thumb": "https://storage.googleapis.com/plotly-prod-images/JYCar/3/8_YVFJJTT6KK168XXZPUI69OW81SMIV8.png", "list-thumb": "https://storage.googleapis.com/plotly-prod-images/JYCar/3/9_N53H78VQQO46N51R4TOW3LY8UYL7KC.png" }, "api_urls": { "files": "https://api.plotly.com/v2/files/JYCar:3", "plots": "https://api.plotly.com/v2/plots/JYCar:3", "parent": "https://api.plotly.com/v2/folders/home?user=JYCar" }, "owner": "JYCar", "parent": -1, "preview": "", "referencers": [], "references": [], "title": "", "views": 0, "web_url": "https://chart-studio.plotly.com/~JYCar/3/", "world_readable": true, "date_modified": "2025-09-17T11:55:02.442Z", "stars": { "results": [], "count": 0 }, "collaborators": { "results": [], "count": 0 }, "subfolder_count": null, "refresh_interval": null, "organize_view_url": "https://chart-studio.plotly.com/~JYCar/3/", "current_user_permission": "read", "is_theme": null, "is_template": false, "autosize": true, "caption": "", "figure": { "data": [ { "line": { "width": 1 }, "meta": { "columnNames": { "x": "DateTime", "y": "Zonqor Inlet" } }, "mode": "lines", "name": "Inlet FL03", "type": "scatter", "xsrc": "JYCar:2:736d72", "ysrc": "JYCar:2:810c68", "visible": true }, { "meta": { "columnNames": { "x": "DateTime", "y": "Zonqor Level" } }, "mode": "lines", "name": "Zonqor Level", "type": "scatter", "xsrc": "JYCar:2:736d72", "ysrc": "JYCar:2:5fba4f", "yaxis": "y2", "stackgroup": null } ], "frames": [], "layout": { "xaxis": { "type": "category", "range": [ 0, 4920 ], "nticks": 24, "showline": true, "autorange": true, "gridcolor": "rgb(221, 221, 221)", "linecolor": "rgb(221, 221, 221)", "linewidth": 4 }, "yaxis": { "side": "left", "type": "linear", "range": [ -7.15781446111111, 135.9984747611111 ], "ticks": "inside", "title": { "text": "Flow /m3/hr<br>" }, "nticks": 10, "showline": true, "autorange": true, "gridcolor": "rgb(221, 221, 221)", "linecolor": "rgb(221, 221, 221)", "linewidth": 3, "zerolinecolor": "rgb(221, 221, 221)", "zerolinewidth": 3, "showticklabels": true }, "legend": { "x": 0.9093586217413433, "y": 1.0611353711790392 }, "yaxis2": { "side": "right", "type": "linear", "range": [ 1.5421922111666666, 2.846263847833333 ], "title": { "font": { "color": "rgb(252, 34, 7)" }, "text": "Level /m" }, "showline": true, "zeroline": false, "autorange": false, "gridcolor": "rgb(252, 195, 199)", "gridwidth": 1, "linecolor": "rgb(245, 195, 195)", "linewidth": 2, "overlaying": "y" }, "autosize": true, "template": { "data": { "bar": [ { "type": "bar", "marker": { "colorbar": { "ticks": "", "outlinewidth": 0 } } } ], "table": [ { "type": "table", "cells": { "fill": { "color": "#EBF0F8" }, "line": { "color": "white" } }, "header": { "fill": { "color": "#C8D4E3" }, "line": { "color": "white" } } } ], "carpet": [ { "type": "carpet", "aaxis": { "gridcolor": "#C8D4E3", "linecolor": "#C8D4E3", "endlinecolor": "#2a3f5f", "minorgridcolor": "#C8D4E3", "startlinecolor": "#2a3f5f" }, "baxis": { "gridcolor": "#C8D4E3", "linecolor": "#C8D4E3", "endlinecolor": "#2a3f5f", "minorgridcolor": "#C8D4E3", "startlinecolor": "#2a3f5f" } } ], "mesh3d": [ { "type": "mesh3d", "colorbar": { "ticks": "", "outlinewidth": 0 } } ], "contour": [ { "type": "contour", "colorbar": { "ticks": "", "outlinewidth": 0 }, "autocolorscale": true } ], "heatmap": [ { "type": "heatmap", "colorbar": { "ticks": "", "outlinewidth": 0 }, "autocolorscale": true } ], "scatter": [ { "type": "scatter", "marker": { "colorbar": { "ticks": "", "outlinewidth": 0 } } } ], "surface": [ { "type": "surface", "colorbar": { "ticks": "", "outlinewidth": 0 } } ], "heatmapgl": [ { "type": "heatmapgl", "colorbar": { "ticks": "", "outlinewidth": 0 } } ], "histogram": [ { "type": "histogram", "marker": { "colorbar": { "ticks": "", "outlinewidth": 0 } } } ], "parcoords": [ { "line": { "colorbar": { "ticks": "", "outlinewidth": 0 } }, "type": "parcoords" } ], "scatter3d": [ { "type": "scatter3d", "marker": { "colorbar": { "ticks": "", "outlinewidth": 0 } } } ], "scattergl": [ { "type": "scattergl", "marker": { "colorbar": { "ticks": "", "outlinewidth": 0 } } } ], "choropleth": [ { "type": "choropleth", "colorbar": { "ticks": "", "outlinewidth": 0 } } ], "scattergeo": [ { "type": "scattergeo", "marker": { "colorbar": { "ticks": "", "outlinewidth": 0 } } } ], "histogram2d": [ { "type": "histogram2d", "colorbar": { "ticks": "", "outlinewidth": 0 }, "autocolorscale": true } ], "scatterpolar": [ { "type": "scatterpolar", "marker": { "colorbar": { "ticks": "", "outlinewidth": 0 } } } ], "contourcarpet": [ { "type": "contourcarpet", "colorbar": { "ticks": "", "outlinewidth": 0 } } ], "scattercarpet": [ { "type": "scattercarpet", "marker": { "colorbar": { "ticks": "", "outlinewidth": 0 } } } ], "scattermapbox": [ { "type": "scattermapbox", "marker": { "colorbar": { "ticks": "", "outlinewidth": 0 } } } ], "scatterpolargl": [ { "type": "scatterpolargl", "marker": { "colorbar": { "ticks": "", "outlinewidth": 0 } } } ], "scatterternary": [ { "type": "scatterternary", "marker": { "colorbar": { "ticks": "", "outlinewidth": 0 } } } ], "histogram2dcontour": [ { "type": "histogram2dcontour", "colorbar": { "ticks": "", "outlinewidth": 0 }, "autocolorscale": true } ] }, "layout": { "geo": { "bgcolor": "white", "showland": true, "lakecolor": "white", "landcolor": "white", "showlakes": true, "subunitcolor": "#C8D4E3" }, "font": { "color": "#2a3f5f" }, "polar": { "bgcolor": "white", "radialaxis": { "ticks": "", "gridcolor": "#EBF0F8", "linecolor": "#EBF0F8" }, "angularaxis": { "ticks": "", "gridcolor": "#EBF0F8", "linecolor": "#EBF0F8" } }, "scene": { "xaxis": { "ticks": "", "gridcolor": "#DFE8F3", "gridwidth": 2, "linecolor": "#EBF0F8", "zerolinecolor": "#EBF0F8", "showbackground": true, "backgroundcolor": "white" }, "yaxis": { "ticks": "", "gridcolor": "#DFE8F3", "gridwidth": 2, "linecolor": "#EBF0F8", "zerolinecolor": "#EBF0F8", "showbackground": true, "backgroundcolor": "white" }, "zaxis": { "ticks": "", "gridcolor": "#DFE8F3", "gridwidth": 2, "linecolor": "#EBF0F8", "zerolinecolor": "#EBF0F8", "showbackground": true, "backgroundcolor": "white" } }, "title": { "x": 0.05 }, "xaxis": { "ticks": "", "gridcolor": "#EBF0F8", "linecolor": "#EBF0F8", "automargin": true, "zerolinecolor": "#EBF0F8", "zerolinewidth": 2 }, "yaxis": { "ticks": "", "gridcolor": "#EBF0F8", "linecolor": "#EBF0F8", "automargin": true, "zerolinecolor": "#EBF0F8", "zerolinewidth": 2 }, "ternary": { "aaxis": { "ticks": "", "gridcolor": "#DFE8F3", "linecolor": "#A2B1C6" }, "baxis": { "ticks": "", "gridcolor": "#DFE8F3", "linecolor": "#A2B1C6" }, "caxis": { "ticks": "", "gridcolor": "#DFE8F3", "linecolor": "#A2B1C6" }, "bgcolor": "white" }, "colorway": [ "#636efa", "#EF553B", "#00cc96", "#ab63fa", "#19d3f3", "#e763fa", "#fecb52", "#ffa15a", "#ff6692", "#b6e880" ], "hovermode": "closest", "colorscale": { "diverging": [ [ 0, "#8e0152" ], [ 0.1, "#c51b7d" ], [ 0.2, "#de77ae" ], [ 0.3, "#f1b6da" ], [ 0.4, "#fde0ef" ], [ 0.5, "#f7f7f7" ], [ 0.6, "#e6f5d0" ], [ 0.7, "#b8e186" ], [ 0.8, "#7fbc41" ], [ 0.9, "#4d9221" ], [ 1, "#276419" ] ], "sequential": [ [ 0, "#0508b8" ], [ 0.0893854748603352, "#1910d8" ], [ 0.1787709497206704, "#3c19f0" ], [ 0.2681564245810056, "#6b1cfb" ], [ 0.3575418994413408, "#981cfd" ], [ 0.44692737430167595, "#bf1cfd" ], [ 0.5363128491620112, "#dd2bfd" ], [ 0.6256983240223464, "#f246fe" ], [ 0.7150837988826816, "#fc67fd" ], [ 0.8044692737430168, "#fe88fc" ], [ 0.8938547486033519, "#fea5fd" ], [ 0.9832402234636871, "#febefe" ], [ 1, "#fec3fe" ] ], "sequentialminus": [ [ 0, "#0508b8" ], [ 0.0893854748603352, "#1910d8" ], [ 0.1787709497206704, "#3c19f0" ], [ 0.2681564245810056, "#6b1cfb" ], [ 0.3575418994413408, "#981cfd" ], [ 0.44692737430167595, "#bf1cfd" ], [ 0.5363128491620112, "#dd2bfd" ], [ 0.6256983240223464, "#f246fe" ], [ 0.7150837988826816, "#fc67fd" ], [ 0.8044692737430168, "#fe88fc" ], [ 0.8938547486033519, "#fea5fd" ], [ 0.9832402234636871, "#febefe" ], [ 1, "#fec3fe" ] ] }, "plot_bgcolor": "white", "paper_bgcolor": "white", "shapedefaults": { "line": { "width": 0 }, "opacity": 0.4, "fillcolor": "#506784" }, "annotationdefaults": { "arrowhead": 0, "arrowcolor": "#506784", "arrowwidth": 1 } }, "themeRef": "PLOTLY_WHITE" }, "plot_bgcolor": "rgb(238, 238, 238)", "paper_bgcolor": "rgb(238, 238, 238)" } }, "height": null, "width": null, "user": { "profile_url": "https://chart-studio.plotly.com/~JYCar", "avatar_url": "https://storage.googleapis.com/plotly-prod-profiles/56.jpg", "background_url": "https://storage.googleapis.com/plotly-prod-profiles/bg-3.jpg", "bio": "", "nickname": "", "website": "", "stream_tokens": null, "feature_set_id": null, "csrf_token": null, "date_joined": "2025-09-16 16:57:39", "mapbox_access_tokens": null, "has_password": null, "username": "JYCar", "email": null, "is_active": null, "readonly": null, "is_dash_creator": null, "dash_created_count": null, "is_chart_creator": null, "charts_created_count": null } } ] }
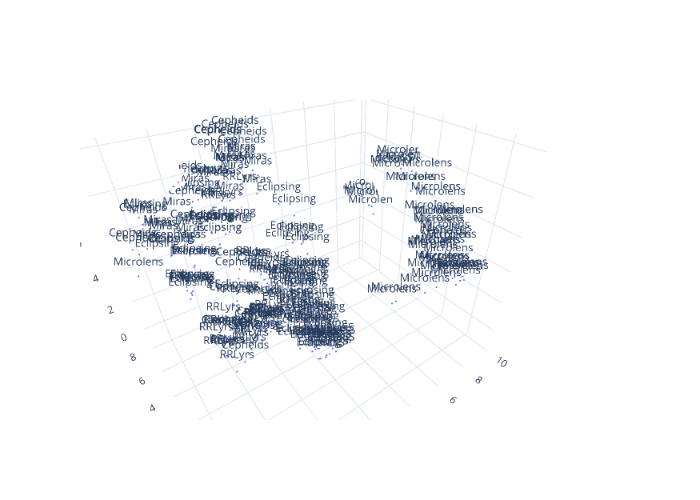