Plots List
Plots
This endpoint handles manipulation of Plotly plot files.
Reference
Authorization
Any user with or without a Plotly account may view public plots. For private plots, see authentication.
Actions
list
Listing all public plots can be done via a GET request to this endpoint.
By default, plots will be listed in order of date created. The order_by
query parameter is accepted at this endpoint. Currently, only ordering by
views is supported. It is possible to filter the plots by quality
with min_quality or max_quality as query parameter.
Example:
// GET https://api.plotly.com/v2/plots/ ---> 200

// GET https://api.plotly.com/v2/plots/?order_by=-views ---> 200

// GET https://api.plotly.com/v2/plots/?min_quality=5 ---> 200

// GET https://api.plotly.com/v2/plots/?max_quality=5 ---> 200
feed
Listing all handpicked feed plots can be done via a GET request to this endpoint. By default, plots will be listed in a random order.
Example:
// GET https://api.plotly.com/v2/plots/feed ---> 200
create
You can create new plot resources here. The only required field is 'figure'. Currently, the figure is restricted to only contain references to grid data. That is, this will fail if raw data arrays are passed in. To create and manipulate underlying grids for plots, see the grids endpoint.
Example:
// This fails because a figure field is required.
// POST https://api.plotly.com/v2/plots ---> 400 Bad Request
{}

// This fails because the figure has raw data
//POST https://api.plotly.com/v2/plots ---> 400 Bad Request
{
    "figure": {"data": [{"y": ['this', 'is', 'raw', 'data']}]}
}

// This succeeds because the figure has src keys, not raw data.
//POST https://api.plotly.com/v2/plots ---> 200 OK
{
    "figure": {"data": [{"ysrc": "sven:88:u8nd62"}]}
}
When creating a grid, you can optionally specify a source_fid to specify where a plot has come from:
- source_fid: the fid of a plot that was copied (and presumably edited) to produce this one
detail
There is a lot of meta information stored about plot files including filename, title, share_url, and content_url to name a few.
This information can only be reached with a GET to this endpoint.
Example:
// GET https://api.plotly.com/v2/plots/iheartgraphs:90
content
The contents of a plot can be downloaded via the content resource. The plot
content contains referenced grid/column data by default. If you wish to
return the raw grid/column data, the inline_data=true query must be included
in the request url. The Content-Type header will be appropriately set for the
response body.
Alternatively, you can set ?map_data=unreadable to append a mapping of
sources to data that belongs to grids which are unreadable for the
requestor. This is useful when you have read access to another users plot,
but that plot contains grid references which you don't have access to.
Examples:
// Returns referenced grid/column data
// GET https://api.plotly.com/v2/plots/iheartgraphs:90/content ---> 200 OK

// Returns full grid/column data
// GET https://api.plotly.com/v2/plots/iheartgraphs:90/content?inline_data=true ---> 200 OK

// Returns full grid/column data when requestor doesn't have permission
// to read the referenced grid.
// GET https://api.plotly.com/v2/plots/iheartgraphs:90/content?map_data=unreadable ---> 200 OK
GET /v2/plots?cursor=cD0yMDI0LTA0LTE2KzE2JTNBNDElM0ExOC43NTEwODglMkIwMCUzQTAw&format=api
{ "next": "https://api.plotly.com/v2/plots?cursor=cD0yMDI0LTA0LTE2KzE1JTNBNTclM0EwNS42OTQ5NjglMkIwMCUzQTAw&format=api", "previous": "https://api.plotly.com/v2/plots?cursor=cj0xJnA9MjAyNC0wNC0xNisxNiUzQTQxJTNBMTQuOTE2NTA3JTJCMDAlM0EwMA%3D%3D&format=api", "results": [ { "creation_time": "2024-04-16T16:41:14.916507Z", "comments": { "results": [], "count": 0 }, "parented": true, "embed_url": "https://chart-studio.plotly.com/~seminkim/17.embed", "fid": "seminkim:17", "filename": "zero=0.1,seed=4", "filetype": "plot", "img_url": "https://storage.googleapis.com/plotly-prod-images/seminkim/17/9_GPCQLFI4XPCO2RJFAE4TYGHW0365DW.png", "image_urls": { "default": "https://storage.googleapis.com/plotly-prod-images/seminkim/17/2_L8ZC3W6GAK27ENAASU1Y0X91LWD8RJ.png", "block-thumb": "https://storage.googleapis.com/plotly-prod-images/seminkim/17/8_S1PQBXZ4VIEX0R2HXV9J4IR7DQTBI5.png", "list-thumb": "https://storage.googleapis.com/plotly-prod-images/seminkim/17/9_GPCQLFI4XPCO2RJFAE4TYGHW0365DW.png" }, "api_urls": { "files": "https://api.plotly.com/v2/files/seminkim:17", "plots": "https://api.plotly.com/v2/plots/seminkim:17", "parent": "https://api.plotly.com/v2/folders/home?user=seminkim" }, "owner": "seminkim", "parent": -1, "preview": "", "referencers": [], "references": [], "title": "", "views": 1, "web_url": "https://chart-studio.plotly.com/~seminkim/17/", "world_readable": true, "date_modified": "2024-04-16T16:41:14.927Z", "stars": { "results": [], "count": 0 }, "collaborators": { "results": [], "count": 0 }, "subfolder_count": null, "refresh_interval": null, "organize_view_url": "https://chart-studio.plotly.com/~seminkim/17/", "current_user_permission": "read", "is_theme": null, "is_template": null, "autosize": true, "caption": "", "figure": { "data": [ { "mode": "markers", "type": "scatter3d", "xsrc": "seminkim:16:b0619f", "ysrc": "seminkim:16:ef72b4", "zsrc": "seminkim:16:afa5ad", "marker": { "size": 5, "opacity": 0.5, "colorsrc": "seminkim:16:a95508" } } ], "layout": { "scene": { "aspectmode": "data" }, "width": 800, "height": 600, "template": { "data": { "bar": [ { "type": "bar", "marker": { "line": { "color": "#E5ECF6", "width": 0.5 }, "pattern": { "size": 10, "fillmode": "overlay", "solidity": 0.2 } }, "error_x": { "color": "#2a3f5f" }, "error_y": { "color": "#2a3f5f" } } ], "pie": [ { "type": "pie", "automargin": true } ], "table": [ { "type": "table", "cells": { "fill": { "color": "#EBF0F8" }, "line": { "color": "white" } }, "header": { "fill": { "color": "#C8D4E3" }, "line": { "color": "white" } } } ], "carpet": [ { "type": "carpet", "aaxis": { "gridcolor": "white", "linecolor": "white", "endlinecolor": "#2a3f5f", "minorgridcolor": "white", "startlinecolor": "#2a3f5f" }, "baxis": { "gridcolor": "white", "linecolor": "white", "endlinecolor": "#2a3f5f", "minorgridcolor": "white", "startlinecolor": "#2a3f5f" } } ], "mesh3d": [ { "type": "mesh3d", "colorbar": { "ticks": "", "outlinewidth": 0 } } ], "contour": [ { "type": "contour", "colorbar": { "ticks": "", "outlinewidth": 0 }, "colorscale": [ [ 0.0, "#0d0887" ], [ 0.1111111111111111, "#46039f" ], [ 0.2222222222222222, "#7201a8" ], [ 0.3333333333333333, "#9c179e" ], [ 0.4444444444444444, "#bd3786" ], [ 0.5555555555555556, "#d8576b" ], [ 0.6666666666666666, "#ed7953" ], [ 0.7777777777777778, "#fb9f3a" ], [ 0.8888888888888888, "#fdca26" ], [ 1.0, "#f0f921" ] ] } ], "heatmap": [ { "type": "heatmap", "colorbar": { "ticks": "", "outlinewidth": 0 }, "colorscale": [ [ 0.0, "#0d0887" ], [ 0.1111111111111111, "#46039f" ], [ 0.2222222222222222, "#7201a8" ], [ 0.3333333333333333, "#9c179e" ], [ 0.4444444444444444, "#bd3786" ], [ 0.5555555555555556, "#d8576b" ], [ 0.6666666666666666, "#ed7953" ], [ 0.7777777777777778, "#fb9f3a" ], [ 0.8888888888888888, "#fdca26" ], [ 1.0, "#f0f921" ] ] } ], "scatter": [ { "type": "scatter", "fillpattern": { "size": 10, "fillmode": "overlay", "solidity": 0.2 } } ], "surface": [ { "type": "surface", "colorbar": { "ticks": "", "outlinewidth": 0 }, "colorscale": [ [ 0.0, "#0d0887" ], [ 0.1111111111111111, "#46039f" ], [ 0.2222222222222222, "#7201a8" ], [ 0.3333333333333333, "#9c179e" ], [ 0.4444444444444444, "#bd3786" ], [ 0.5555555555555556, "#d8576b" ], [ 0.6666666666666666, "#ed7953" ], [ 0.7777777777777778, "#fb9f3a" ], [ 0.8888888888888888, "#fdca26" ], [ 1.0, "#f0f921" ] ] } ], "barpolar": [ { "type": "barpolar", "marker": { "line": { "color": "#E5ECF6", "width": 0.5 }, "pattern": { "size": 10, "fillmode": "overlay", "solidity": 0.2 } } } ], "heatmapgl": [ { "type": "heatmapgl", "colorbar": { "ticks": "", "outlinewidth": 0 }, "colorscale": [ [ 0.0, "#0d0887" ], [ 0.1111111111111111, "#46039f" ], [ 0.2222222222222222, "#7201a8" ], [ 0.3333333333333333, "#9c179e" ], [ 0.4444444444444444, "#bd3786" ], [ 0.5555555555555556, "#d8576b" ], [ 0.6666666666666666, "#ed7953" ], [ 0.7777777777777778, "#fb9f3a" ], [ 0.8888888888888888, "#fdca26" ], [ 1.0, "#f0f921" ] ] } ], "histogram": [ { "type": "histogram", "marker": { "pattern": { "size": 10, "fillmode": "overlay", "solidity": 0.2 } } } ], "parcoords": [ { "line": { "colorbar": { "ticks": "", "outlinewidth": 0 } }, "type": "parcoords" } ], "scatter3d": [ { "line": { "colorbar": { "ticks": "", "outlinewidth": 0 } }, "type": "scatter3d", "marker": { "colorbar": { "ticks": "", "outlinewidth": 0 } } } ], "scattergl": [ { "type": "scattergl", "marker": { "colorbar": { "ticks": "", "outlinewidth": 0 } } } ], "choropleth": [ { "type": "choropleth", "colorbar": { "ticks": "", "outlinewidth": 0 } } ], "scattergeo": [ { "type": "scattergeo", "marker": { "colorbar": { "ticks": "", "outlinewidth": 0 } } } ], "histogram2d": [ { "type": "histogram2d", "colorbar": { "ticks": "", "outlinewidth": 0 }, "colorscale": [ [ 0.0, "#0d0887" ], [ 0.1111111111111111, "#46039f" ], [ 0.2222222222222222, "#7201a8" ], [ 0.3333333333333333, "#9c179e" ], [ 0.4444444444444444, "#bd3786" ], [ 0.5555555555555556, "#d8576b" ], [ 0.6666666666666666, "#ed7953" ], [ 0.7777777777777778, "#fb9f3a" ], [ 0.8888888888888888, "#fdca26" ], [ 1.0, "#f0f921" ] ] } ], "scatterpolar": [ { "type": "scatterpolar", "marker": { "colorbar": { "ticks": "", "outlinewidth": 0 } } } ], "contourcarpet": [ { "type": "contourcarpet", "colorbar": { "ticks": "", "outlinewidth": 0 } } ], "scattercarpet": [ { "type": "scattercarpet", "marker": { "colorbar": { "ticks": "", "outlinewidth": 0 } } } ], "scattermapbox": [ { "type": "scattermapbox", "marker": { "colorbar": { "ticks": "", "outlinewidth": 0 } } } ], "scatterpolargl": [ { "type": "scatterpolargl", "marker": { "colorbar": { "ticks": "", "outlinewidth": 0 } } } ], "scatterternary": [ { "type": "scatterternary", "marker": { "colorbar": { "ticks": "", "outlinewidth": 0 } } } ], "histogram2dcontour": [ { "type": "histogram2dcontour", "colorbar": { "ticks": "", "outlinewidth": 0 }, "colorscale": [ [ 0.0, "#0d0887" ], [ 0.1111111111111111, "#46039f" ], [ 0.2222222222222222, "#7201a8" ], [ 0.3333333333333333, "#9c179e" ], [ 0.4444444444444444, "#bd3786" ], [ 0.5555555555555556, "#d8576b" ], [ 0.6666666666666666, "#ed7953" ], [ 0.7777777777777778, "#fb9f3a" ], [ 0.8888888888888888, "#fdca26" ], [ 1.0, "#f0f921" ] ] } ] }, "layout": { "geo": { "bgcolor": "white", "showland": true, "lakecolor": "white", "landcolor": "#E5ECF6", "showlakes": true, "subunitcolor": "white" }, "font": { "color": "#2a3f5f" }, "polar": { "bgcolor": "#E5ECF6", "radialaxis": { "ticks": "", "gridcolor": "white", "linecolor": "white" }, "angularaxis": { "ticks": "", "gridcolor": "white", "linecolor": "white" } }, "scene": { "xaxis": { "ticks": "", "gridcolor": "white", "gridwidth": 2, "linecolor": "white", "zerolinecolor": "white", "showbackground": true, "backgroundcolor": "#E5ECF6" }, "yaxis": { "ticks": "", "gridcolor": "white", "gridwidth": 2, "linecolor": "white", "zerolinecolor": "white", "showbackground": true, "backgroundcolor": "#E5ECF6" }, "zaxis": { "ticks": "", "gridcolor": "white", "gridwidth": 2, "linecolor": "white", "zerolinecolor": "white", "showbackground": true, "backgroundcolor": "#E5ECF6" } }, "title": { "x": 0.05 }, "xaxis": { "ticks": "", "title": { "standoff": 15 }, "gridcolor": "white", "linecolor": "white", "automargin": true, "zerolinecolor": "white", "zerolinewidth": 2 }, "yaxis": { "ticks": "", "title": { "standoff": 15 }, "gridcolor": "white", "linecolor": "white", "automargin": true, "zerolinecolor": "white", "zerolinewidth": 2 }, "mapbox": { "style": "light" }, "ternary": { "aaxis": { "ticks": "", "gridcolor": "white", "linecolor": "white" }, "baxis": { "ticks": "", "gridcolor": "white", "linecolor": "white" }, "caxis": { "ticks": "", "gridcolor": "white", "linecolor": "white" }, "bgcolor": "#E5ECF6" }, "colorway": [ "#636efa", "#EF553B", "#00cc96", "#ab63fa", "#FFA15A", "#19d3f3", "#FF6692", "#B6E880", "#FF97FF", "#FECB52" ], "coloraxis": { "colorbar": { "ticks": "", "outlinewidth": 0 } }, "hovermode": "closest", "colorscale": { "diverging": [ [ 0, "#8e0152" ], [ 0.1, "#c51b7d" ], [ 0.2, "#de77ae" ], [ 0.3, "#f1b6da" ], [ 0.4, "#fde0ef" ], [ 0.5, "#f7f7f7" ], [ 0.6, "#e6f5d0" ], [ 0.7, "#b8e186" ], [ 0.8, "#7fbc41" ], [ 0.9, "#4d9221" ], [ 1, "#276419" ] ], "sequential": [ [ 0.0, "#0d0887" ], [ 0.1111111111111111, "#46039f" ], [ 0.2222222222222222, "#7201a8" ], [ 0.3333333333333333, "#9c179e" ], [ 0.4444444444444444, "#bd3786" ], [ 0.5555555555555556, "#d8576b" ], [ 0.6666666666666666, "#ed7953" ], [ 0.7777777777777778, "#fb9f3a" ], [ 0.8888888888888888, "#fdca26" ], [ 1.0, "#f0f921" ] ], "sequentialminus": [ [ 0.0, "#0d0887" ], [ 0.1111111111111111, "#46039f" ], [ 0.2222222222222222, "#7201a8" ], [ 0.3333333333333333, "#9c179e" ], [ 0.4444444444444444, "#bd3786" ], [ 0.5555555555555556, "#d8576b" ], [ 0.6666666666666666, "#ed7953" ], [ 0.7777777777777778, "#fb9f3a" ], [ 0.8888888888888888, "#fdca26" ], [ 1.0, "#f0f921" ] ] }, "hoverlabel": { "align": "left" }, "plot_bgcolor": "#E5ECF6", "paper_bgcolor": "white", "shapedefaults": { "line": { "color": "#2a3f5f" } }, "autotypenumbers": "strict", "annotationdefaults": { "arrowhead": 0, "arrowcolor": "#2a3f5f", "arrowwidth": 1 } } } } }, "height": 600, "width": 800, "user": { "profile_url": "https://chart-studio.plotly.com/~seminkim", "avatar_url": "https://storage.googleapis.com/plotly-prod-profiles/57.jpg", "background_url": "https://storage.googleapis.com/plotly-prod-profiles/bg-7.jpg", "bio": "", "nickname": "", "website": "", "stream_tokens": null, "feature_set_id": null, "csrf_token": null, "date_joined": "2024-04-16 16:28:54", "mapbox_access_tokens": null, "has_password": null, "username": "seminkim", "email": null, "is_active": null, "readonly": null, "is_dash_creator": null, "dash_created_count": null, "is_chart_creator": null, "charts_created_count": null } }, { "creation_time": "2024-04-16T16:41:11.123166Z", "comments": { "results": [], "count": 0 }, "parented": true, "embed_url": "https://chart-studio.plotly.com/~seminkim/15.embed", "fid": "seminkim:15", "filename": "zero=0.1,seed=3", "filetype": "plot", "img_url": "https://storage.googleapis.com/plotly-prod-images/seminkim/15/9_P3R9KO44MQPZTKMI59ID279ZNVXARG.png", "image_urls": { "default": "https://storage.googleapis.com/plotly-prod-images/seminkim/15/2_Q7UUVF64Y5UWNR0RH1WEZ2V83KFQTL.png", "block-thumb": "https://storage.googleapis.com/plotly-prod-images/seminkim/15/8_X2HWMSG49A3Y7SKOCH6IBSZO2TPUF5.png", "list-thumb": "https://storage.googleapis.com/plotly-prod-images/seminkim/15/9_P3R9KO44MQPZTKMI59ID279ZNVXARG.png" }, "api_urls": { "files": "https://api.plotly.com/v2/files/seminkim:15", "plots": "https://api.plotly.com/v2/plots/seminkim:15", "parent": "https://api.plotly.com/v2/folders/home?user=seminkim" }, "owner": "seminkim", "parent": -1, "preview": "", "referencers": [], "references": [], "title": "", "views": 1, "web_url": "https://chart-studio.plotly.com/~seminkim/15/", "world_readable": true, "date_modified": "2024-04-16T16:41:11.132Z", "stars": { "results": [], "count": 0 }, "collaborators": { "results": [], "count": 0 }, "subfolder_count": null, "refresh_interval": null, "organize_view_url": "https://chart-studio.plotly.com/~seminkim/15/", "current_user_permission": "read", "is_theme": null, "is_template": null, "autosize": true, "caption": "", "figure": { "data": [ { "mode": "markers", "type": "scatter3d", "xsrc": "seminkim:14:b97956", "ysrc": "seminkim:14:86f45a", "zsrc": "seminkim:14:73bd99", "marker": { "size": 5, "opacity": 0.5, "colorsrc": "seminkim:14:a0b577" } } ], "layout": { "scene": { "aspectmode": "data" }, "width": 800, "height": 600, "template": { "data": { "bar": [ { "type": "bar", "marker": { "line": { "color": "#E5ECF6", "width": 0.5 }, "pattern": { "size": 10, "fillmode": "overlay", "solidity": 0.2 } }, "error_x": { "color": "#2a3f5f" }, "error_y": { "color": "#2a3f5f" } } ], "pie": [ { "type": "pie", "automargin": true } ], "table": [ { "type": "table", "cells": { "fill": { "color": "#EBF0F8" }, "line": { "color": "white" } }, "header": { "fill": { "color": "#C8D4E3" }, "line": { "color": "white" } } } ], "carpet": [ { "type": "carpet", "aaxis": { "gridcolor": "white", "linecolor": "white", "endlinecolor": "#2a3f5f", "minorgridcolor": "white", "startlinecolor": "#2a3f5f" }, "baxis": { "gridcolor": "white", "linecolor": "white", "endlinecolor": "#2a3f5f", "minorgridcolor": "white", "startlinecolor": "#2a3f5f" } } ], "mesh3d": [ { "type": "mesh3d", "colorbar": { "ticks": "", "outlinewidth": 0 } } ], "contour": [ { "type": "contour", "colorbar": { "ticks": "", "outlinewidth": 0 }, "colorscale": [ [ 0.0, "#0d0887" ], [ 0.1111111111111111, "#46039f" ], [ 0.2222222222222222, "#7201a8" ], [ 0.3333333333333333, "#9c179e" ], [ 0.4444444444444444, "#bd3786" ], [ 0.5555555555555556, "#d8576b" ], [ 0.6666666666666666, "#ed7953" ], [ 0.7777777777777778, "#fb9f3a" ], [ 0.8888888888888888, "#fdca26" ], [ 1.0, "#f0f921" ] ] } ], "heatmap": [ { "type": "heatmap", "colorbar": { "ticks": "", "outlinewidth": 0 }, "colorscale": [ [ 0.0, "#0d0887" ], [ 0.1111111111111111, "#46039f" ], [ 0.2222222222222222, "#7201a8" ], [ 0.3333333333333333, "#9c179e" ], [ 0.4444444444444444, "#bd3786" ], [ 0.5555555555555556, "#d8576b" ], [ 0.6666666666666666, "#ed7953" ], [ 0.7777777777777778, "#fb9f3a" ], [ 0.8888888888888888, "#fdca26" ], [ 1.0, "#f0f921" ] ] } ], "scatter": [ { "type": "scatter", "fillpattern": { "size": 10, "fillmode": "overlay", "solidity": 0.2 } } ], "surface": [ { "type": "surface", "colorbar": { "ticks": "", "outlinewidth": 0 }, "colorscale": [ [ 0.0, "#0d0887" ], [ 0.1111111111111111, "#46039f" ], [ 0.2222222222222222, "#7201a8" ], [ 0.3333333333333333, "#9c179e" ], [ 0.4444444444444444, "#bd3786" ], [ 0.5555555555555556, "#d8576b" ], [ 0.6666666666666666, "#ed7953" ], [ 0.7777777777777778, "#fb9f3a" ], [ 0.8888888888888888, "#fdca26" ], [ 1.0, "#f0f921" ] ] } ], "barpolar": [ { "type": "barpolar", "marker": { "line": { "color": "#E5ECF6", "width": 0.5 }, "pattern": { "size": 10, "fillmode": "overlay", "solidity": 0.2 } } } ], "heatmapgl": [ { "type": "heatmapgl", "colorbar": { "ticks": "", "outlinewidth": 0 }, "colorscale": [ [ 0.0, "#0d0887" ], [ 0.1111111111111111, "#46039f" ], [ 0.2222222222222222, "#7201a8" ], [ 0.3333333333333333, "#9c179e" ], [ 0.4444444444444444, "#bd3786" ], [ 0.5555555555555556, "#d8576b" ], [ 0.6666666666666666, "#ed7953" ], [ 0.7777777777777778, "#fb9f3a" ], [ 0.8888888888888888, "#fdca26" ], [ 1.0, "#f0f921" ] ] } ], "histogram": [ { "type": "histogram", "marker": { "pattern": { "size": 10, "fillmode": "overlay", "solidity": 0.2 } } } ], "parcoords": [ { "line": { "colorbar": { "ticks": "", "outlinewidth": 0 } }, "type": "parcoords" } ], "scatter3d": [ { "line": { "colorbar": { "ticks": "", "outlinewidth": 0 } }, "type": "scatter3d", "marker": { "colorbar": { "ticks": "", "outlinewidth": 0 } } } ], "scattergl": [ { "type": "scattergl", "marker": { "colorbar": { "ticks": "", "outlinewidth": 0 } } } ], "choropleth": [ { "type": "choropleth", "colorbar": { "ticks": "", "outlinewidth": 0 } } ], "scattergeo": [ { "type": "scattergeo", "marker": { "colorbar": { "ticks": "", "outlinewidth": 0 } } } ], "histogram2d": [ { "type": "histogram2d", "colorbar": { "ticks": "", "outlinewidth": 0 }, "colorscale": [ [ 0.0, "#0d0887" ], [ 0.1111111111111111, "#46039f" ], [ 0.2222222222222222, "#7201a8" ], [ 0.3333333333333333, "#9c179e" ], [ 0.4444444444444444, "#bd3786" ], [ 0.5555555555555556, "#d8576b" ], [ 0.6666666666666666, "#ed7953" ], [ 0.7777777777777778, "#fb9f3a" ], [ 0.8888888888888888, "#fdca26" ], [ 1.0, "#f0f921" ] ] } ], "scatterpolar": [ { "type": "scatterpolar", "marker": { "colorbar": { "ticks": "", "outlinewidth": 0 } } } ], "contourcarpet": [ { "type": "contourcarpet", "colorbar": { "ticks": "", "outlinewidth": 0 } } ], "scattercarpet": [ { "type": "scattercarpet", "marker": { "colorbar": { "ticks": "", "outlinewidth": 0 } } } ], "scattermapbox": [ { "type": "scattermapbox", "marker": { "colorbar": { "ticks": "", "outlinewidth": 0 } } } ], "scatterpolargl": [ { "type": "scatterpolargl", "marker": { "colorbar": { "ticks": "", "outlinewidth": 0 } } } ], "scatterternary": [ { "type": "scatterternary", "marker": { "colorbar": { "ticks": "", "outlinewidth": 0 } } } ], "histogram2dcontour": [ { "type": "histogram2dcontour", "colorbar": { "ticks": "", "outlinewidth": 0 }, "colorscale": [ [ 0.0, "#0d0887" ], [ 0.1111111111111111, "#46039f" ], [ 0.2222222222222222, "#7201a8" ], [ 0.3333333333333333, "#9c179e" ], [ 0.4444444444444444, "#bd3786" ], [ 0.5555555555555556, "#d8576b" ], [ 0.6666666666666666, "#ed7953" ], [ 0.7777777777777778, "#fb9f3a" ], [ 0.8888888888888888, "#fdca26" ], [ 1.0, "#f0f921" ] ] } ] }, "layout": { "geo": { "bgcolor": "white", "showland": true, "lakecolor": "white", "landcolor": "#E5ECF6", "showlakes": true, "subunitcolor": "white" }, "font": { "color": "#2a3f5f" }, "polar": { "bgcolor": "#E5ECF6", "radialaxis": { "ticks": "", "gridcolor": "white", "linecolor": "white" }, "angularaxis": { "ticks": "", "gridcolor": "white", "linecolor": "white" } }, "scene": { "xaxis": { "ticks": "", "gridcolor": "white", "gridwidth": 2, "linecolor": "white", "zerolinecolor": "white", "showbackground": true, "backgroundcolor": "#E5ECF6" }, "yaxis": { "ticks": "", "gridcolor": "white", "gridwidth": 2, "linecolor": "white", "zerolinecolor": "white", "showbackground": true, "backgroundcolor": "#E5ECF6" }, "zaxis": { "ticks": "", "gridcolor": "white", "gridwidth": 2, "linecolor": "white", "zerolinecolor": "white", "showbackground": true, "backgroundcolor": "#E5ECF6" } }, "title": { "x": 0.05 }, "xaxis": { "ticks": "", "title": { "standoff": 15 }, "gridcolor": "white", "linecolor": "white", "automargin": true, "zerolinecolor": "white", "zerolinewidth": 2 }, "yaxis": { "ticks": "", "title": { "standoff": 15 }, "gridcolor": "white", "linecolor": "white", "automargin": true, "zerolinecolor": "white", "zerolinewidth": 2 }, "mapbox": { "style": "light" }, "ternary": { "aaxis": { "ticks": "", "gridcolor": "white", "linecolor": "white" }, "baxis": { "ticks": "", "gridcolor": "white", "linecolor": "white" }, "caxis": { "ticks": "", "gridcolor": "white", "linecolor": "white" }, "bgcolor": "#E5ECF6" }, "colorway": [ "#636efa", "#EF553B", "#00cc96", "#ab63fa", "#FFA15A", "#19d3f3", "#FF6692", "#B6E880", "#FF97FF", "#FECB52" ], "coloraxis": { "colorbar": { "ticks": "", "outlinewidth": 0 } }, "hovermode": "closest", "colorscale": { "diverging": [ [ 0, "#8e0152" ], [ 0.1, "#c51b7d" ], [ 0.2, "#de77ae" ], [ 0.3, "#f1b6da" ], [ 0.4, "#fde0ef" ], [ 0.5, "#f7f7f7" ], [ 0.6, "#e6f5d0" ], [ 0.7, "#b8e186" ], [ 0.8, "#7fbc41" ], [ 0.9, "#4d9221" ], [ 1, "#276419" ] ], "sequential": [ [ 0.0, "#0d0887" ], [ 0.1111111111111111, "#46039f" ], [ 0.2222222222222222, "#7201a8" ], [ 0.3333333333333333, "#9c179e" ], [ 0.4444444444444444, "#bd3786" ], [ 0.5555555555555556, "#d8576b" ], [ 0.6666666666666666, "#ed7953" ], [ 0.7777777777777778, "#fb9f3a" ], [ 0.8888888888888888, "#fdca26" ], [ 1.0, "#f0f921" ] ], "sequentialminus": [ [ 0.0, "#0d0887" ], [ 0.1111111111111111, "#46039f" ], [ 0.2222222222222222, "#7201a8" ], [ 0.3333333333333333, "#9c179e" ], [ 0.4444444444444444, "#bd3786" ], [ 0.5555555555555556, "#d8576b" ], [ 0.6666666666666666, "#ed7953" ], [ 0.7777777777777778, "#fb9f3a" ], [ 0.8888888888888888, "#fdca26" ], [ 1.0, "#f0f921" ] ] }, "hoverlabel": { "align": "left" }, "plot_bgcolor": "#E5ECF6", "paper_bgcolor": "white", "shapedefaults": { "line": { "color": "#2a3f5f" } }, "autotypenumbers": "strict", "annotationdefaults": { "arrowhead": 0, "arrowcolor": "#2a3f5f", "arrowwidth": 1 } } } } }, "height": 600, "width": 800, "user": { "profile_url": "https://chart-studio.plotly.com/~seminkim", "avatar_url": "https://storage.googleapis.com/plotly-prod-profiles/57.jpg", "background_url": "https://storage.googleapis.com/plotly-prod-profiles/bg-7.jpg", "bio": "", "nickname": "", "website": "", "stream_tokens": null, "feature_set_id": null, "csrf_token": null, "date_joined": "2024-04-16 16:28:54", "mapbox_access_tokens": null, "has_password": null, "username": "seminkim", "email": null, "is_active": null, "readonly": null, "is_dash_creator": null, "dash_created_count": null, "is_chart_creator": null, "charts_created_count": null } }, { "creation_time": "2024-04-16T16:41:03.828601Z", "comments": { "results": [], "count": 0 }, "parented": true, "embed_url": "https://chart-studio.plotly.com/~seminkim/13.embed", "fid": "seminkim:13", "filename": "zero=0.1,seed=2", "filetype": "plot", "img_url": "https://storage.googleapis.com/plotly-prod-images/seminkim/13/9_69NVIKO9FL6N3LQYHASMJ9FJUPN21T.png", "image_urls": { "default": "https://storage.googleapis.com/plotly-prod-images/seminkim/13/2_8J4K22IVG53ID23O6DQPXM1CW7YATX.png", "block-thumb": "https://storage.googleapis.com/plotly-prod-images/seminkim/13/8_I7N4SFB53XD7UYUBQL05PLRG28WI3G.png", "list-thumb": "https://storage.googleapis.com/plotly-prod-images/seminkim/13/9_69NVIKO9FL6N3LQYHASMJ9FJUPN21T.png" }, "api_urls": { "files": "https://api.plotly.com/v2/files/seminkim:13", "plots": "https://api.plotly.com/v2/plots/seminkim:13", "parent": "https://api.plotly.com/v2/folders/home?user=seminkim" }, "owner": "seminkim", "parent": -1, "preview": "", "referencers": [], "references": [], "title": "", "views": 1, "web_url": "https://chart-studio.plotly.com/~seminkim/13/", "world_readable": true, "date_modified": "2024-04-16T16:41:03.837Z", "stars": { "results": [], "count": 0 }, "collaborators": { "results": [], "count": 0 }, "subfolder_count": null, "refresh_interval": null, "organize_view_url": "https://chart-studio.plotly.com/~seminkim/13/", "current_user_permission": "read", "is_theme": null, "is_template": null, "autosize": true, "caption": "", "figure": { "data": [ { "mode": "markers", "type": "scatter3d", "xsrc": "seminkim:12:ae2bf9", "ysrc": "seminkim:12:fac2e0", "zsrc": "seminkim:12:ce4340", "marker": { "size": 5, "opacity": 0.5, "colorsrc": "seminkim:12:636b32" } } ], "layout": { "scene": { "aspectmode": "data" }, "width": 800, "height": 600, "template": { "data": { "bar": [ { "type": "bar", "marker": { "line": { "color": "#E5ECF6", "width": 0.5 }, "pattern": { "size": 10, "fillmode": "overlay", "solidity": 0.2 } }, "error_x": { "color": "#2a3f5f" }, "error_y": { "color": "#2a3f5f" } } ], "pie": [ { "type": "pie", "automargin": true } ], "table": [ { "type": "table", "cells": { "fill": { "color": "#EBF0F8" }, "line": { "color": "white" } }, "header": { "fill": { "color": "#C8D4E3" }, "line": { "color": "white" } } } ], "carpet": [ { "type": "carpet", "aaxis": { "gridcolor": "white", "linecolor": "white", "endlinecolor": "#2a3f5f", "minorgridcolor": "white", "startlinecolor": "#2a3f5f" }, "baxis": { "gridcolor": "white", "linecolor": "white", "endlinecolor": "#2a3f5f", "minorgridcolor": "white", "startlinecolor": "#2a3f5f" } } ], "mesh3d": [ { "type": "mesh3d", "colorbar": { "ticks": "", "outlinewidth": 0 } } ], "contour": [ { "type": "contour", "colorbar": { "ticks": "", "outlinewidth": 0 }, "colorscale": [ [ 0.0, "#0d0887" ], [ 0.1111111111111111, "#46039f" ], [ 0.2222222222222222, "#7201a8" ], [ 0.3333333333333333, "#9c179e" ], [ 0.4444444444444444, "#bd3786" ], [ 0.5555555555555556, "#d8576b" ], [ 0.6666666666666666, "#ed7953" ], [ 0.7777777777777778, "#fb9f3a" ], [ 0.8888888888888888, "#fdca26" ], [ 1.0, "#f0f921" ] ] } ], "heatmap": [ { "type": "heatmap", "colorbar": { "ticks": "", "outlinewidth": 0 }, "colorscale": [ [ 0.0, "#0d0887" ], [ 0.1111111111111111, "#46039f" ], [ 0.2222222222222222, "#7201a8" ], [ 0.3333333333333333, "#9c179e" ], [ 0.4444444444444444, "#bd3786" ], [ 0.5555555555555556, "#d8576b" ], [ 0.6666666666666666, "#ed7953" ], [ 0.7777777777777778, "#fb9f3a" ], [ 0.8888888888888888, "#fdca26" ], [ 1.0, "#f0f921" ] ] } ], "scatter": [ { "type": "scatter", "fillpattern": { "size": 10, "fillmode": "overlay", "solidity": 0.2 } } ], "surface": [ { "type": "surface", "colorbar": { "ticks": "", "outlinewidth": 0 }, "colorscale": [ [ 0.0, "#0d0887" ], [ 0.1111111111111111, "#46039f" ], [ 0.2222222222222222, "#7201a8" ], [ 0.3333333333333333, "#9c179e" ], [ 0.4444444444444444, "#bd3786" ], [ 0.5555555555555556, "#d8576b" ], [ 0.6666666666666666, "#ed7953" ], [ 0.7777777777777778, "#fb9f3a" ], [ 0.8888888888888888, "#fdca26" ], [ 1.0, "#f0f921" ] ] } ], "barpolar": [ { "type": "barpolar", "marker": { "line": { "color": "#E5ECF6", "width": 0.5 }, "pattern": { "size": 10, "fillmode": "overlay", "solidity": 0.2 } } } ], "heatmapgl": [ { "type": "heatmapgl", "colorbar": { "ticks": "", "outlinewidth": 0 }, "colorscale": [ [ 0.0, "#0d0887" ], [ 0.1111111111111111, "#46039f" ], [ 0.2222222222222222, "#7201a8" ], [ 0.3333333333333333, "#9c179e" ], [ 0.4444444444444444, "#bd3786" ], [ 0.5555555555555556, "#d8576b" ], [ 0.6666666666666666, "#ed7953" ], [ 0.7777777777777778, "#fb9f3a" ], [ 0.8888888888888888, "#fdca26" ], [ 1.0, "#f0f921" ] ] } ], "histogram": [ { "type": "histogram", "marker": { "pattern": { "size": 10, "fillmode": "overlay", "solidity": 0.2 } } } ], "parcoords": [ { "line": { "colorbar": { "ticks": "", "outlinewidth": 0 } }, "type": "parcoords" } ], "scatter3d": [ { "line": { "colorbar": { "ticks": "", "outlinewidth": 0 } }, "type": "scatter3d", "marker": { "colorbar": { "ticks": "", "outlinewidth": 0 } } } ], "scattergl": [ { "type": "scattergl", "marker": { "colorbar": { "ticks": "", "outlinewidth": 0 } } } ], "choropleth": [ { "type": "choropleth", "colorbar": { "ticks": "", "outlinewidth": 0 } } ], "scattergeo": [ { "type": "scattergeo", "marker": { "colorbar": { "ticks": "", "outlinewidth": 0 } } } ], "histogram2d": [ { "type": "histogram2d", "colorbar": { "ticks": "", "outlinewidth": 0 }, "colorscale": [ [ 0.0, "#0d0887" ], [ 0.1111111111111111, "#46039f" ], [ 0.2222222222222222, "#7201a8" ], [ 0.3333333333333333, "#9c179e" ], [ 0.4444444444444444, "#bd3786" ], [ 0.5555555555555556, "#d8576b" ], [ 0.6666666666666666, "#ed7953" ], [ 0.7777777777777778, "#fb9f3a" ], [ 0.8888888888888888, "#fdca26" ], [ 1.0, "#f0f921" ] ] } ], "scatterpolar": [ { "type": "scatterpolar", "marker": { "colorbar": { "ticks": "", "outlinewidth": 0 } } } ], "contourcarpet": [ { "type": "contourcarpet", "colorbar": { "ticks": "", "outlinewidth": 0 } } ], "scattercarpet": [ { "type": "scattercarpet", "marker": { "colorbar": { "ticks": "", "outlinewidth": 0 } } } ], "scattermapbox": [ { "type": "scattermapbox", "marker": { "colorbar": { "ticks": "", "outlinewidth": 0 } } } ], "scatterpolargl": [ { "type": "scatterpolargl", "marker": { "colorbar": { "ticks": "", "outlinewidth": 0 } } } ], "scatterternary": [ { "type": "scatterternary", "marker": { "colorbar": { "ticks": "", "outlinewidth": 0 } } } ], "histogram2dcontour": [ { "type": "histogram2dcontour", "colorbar": { "ticks": "", "outlinewidth": 0 }, "colorscale": [ [ 0.0, "#0d0887" ], [ 0.1111111111111111, "#46039f" ], [ 0.2222222222222222, "#7201a8" ], [ 0.3333333333333333, "#9c179e" ], [ 0.4444444444444444, "#bd3786" ], [ 0.5555555555555556, "#d8576b" ], [ 0.6666666666666666, "#ed7953" ], [ 0.7777777777777778, "#fb9f3a" ], [ 0.8888888888888888, "#fdca26" ], [ 1.0, "#f0f921" ] ] } ] }, "layout": { "geo": { "bgcolor": "white", "showland": true, "lakecolor": "white", "landcolor": "#E5ECF6", "showlakes": true, "subunitcolor": "white" }, "font": { "color": "#2a3f5f" }, "polar": { "bgcolor": "#E5ECF6", "radialaxis": { "ticks": "", "gridcolor": "white", "linecolor": "white" }, "angularaxis": { "ticks": "", "gridcolor": "white", "linecolor": "white" } }, "scene": { "xaxis": { "ticks": "", "gridcolor": "white", "gridwidth": 2, "linecolor": "white", "zerolinecolor": "white", "showbackground": true, "backgroundcolor": "#E5ECF6" }, "yaxis": { "ticks": "", "gridcolor": "white", "gridwidth": 2, "linecolor": "white", "zerolinecolor": "white", "showbackground": true, "backgroundcolor": "#E5ECF6" }, "zaxis": { "ticks": "", "gridcolor": "white", "gridwidth": 2, "linecolor": "white", "zerolinecolor": "white", "showbackground": true, "backgroundcolor": "#E5ECF6" } }, "title": { "x": 0.05 }, "xaxis": { "ticks": "", "title": { "standoff": 15 }, "gridcolor": "white", "linecolor": "white", "automargin": true, "zerolinecolor": "white", "zerolinewidth": 2 }, "yaxis": { "ticks": "", "title": { "standoff": 15 }, "gridcolor": "white", "linecolor": "white", "automargin": true, "zerolinecolor": "white", "zerolinewidth": 2 }, "mapbox": { "style": "light" }, "ternary": { "aaxis": { "ticks": "", "gridcolor": "white", "linecolor": "white" }, "baxis": { "ticks": "", "gridcolor": "white", "linecolor": "white" }, "caxis": { "ticks": "", "gridcolor": "white", "linecolor": "white" }, "bgcolor": "#E5ECF6" }, "colorway": [ "#636efa", "#EF553B", "#00cc96", "#ab63fa", "#FFA15A", "#19d3f3", "#FF6692", "#B6E880", "#FF97FF", "#FECB52" ], "coloraxis": { "colorbar": { "ticks": "", "outlinewidth": 0 } }, "hovermode": "closest", "colorscale": { "diverging": [ [ 0, "#8e0152" ], [ 0.1, "#c51b7d" ], [ 0.2, "#de77ae" ], [ 0.3, "#f1b6da" ], [ 0.4, "#fde0ef" ], [ 0.5, "#f7f7f7" ], [ 0.6, "#e6f5d0" ], [ 0.7, "#b8e186" ], [ 0.8, "#7fbc41" ], [ 0.9, "#4d9221" ], [ 1, "#276419" ] ], "sequential": [ [ 0.0, "#0d0887" ], [ 0.1111111111111111, "#46039f" ], [ 0.2222222222222222, "#7201a8" ], [ 0.3333333333333333, "#9c179e" ], [ 0.4444444444444444, "#bd3786" ], [ 0.5555555555555556, "#d8576b" ], [ 0.6666666666666666, "#ed7953" ], [ 0.7777777777777778, "#fb9f3a" ], [ 0.8888888888888888, "#fdca26" ], [ 1.0, "#f0f921" ] ], "sequentialminus": [ [ 0.0, "#0d0887" ], [ 0.1111111111111111, "#46039f" ], [ 0.2222222222222222, "#7201a8" ], [ 0.3333333333333333, "#9c179e" ], [ 0.4444444444444444, "#bd3786" ], [ 0.5555555555555556, "#d8576b" ], [ 0.6666666666666666, "#ed7953" ], [ 0.7777777777777778, "#fb9f3a" ], [ 0.8888888888888888, "#fdca26" ], [ 1.0, "#f0f921" ] ] }, "hoverlabel": { "align": "left" }, "plot_bgcolor": "#E5ECF6", "paper_bgcolor": "white", "shapedefaults": { "line": { "color": "#2a3f5f" } }, "autotypenumbers": "strict", "annotationdefaults": { "arrowhead": 0, "arrowcolor": "#2a3f5f", "arrowwidth": 1 } } } } }, "height": 600, "width": 800, "user": { "profile_url": "https://chart-studio.plotly.com/~seminkim", "avatar_url": "https://storage.googleapis.com/plotly-prod-profiles/57.jpg", "background_url": "https://storage.googleapis.com/plotly-prod-profiles/bg-7.jpg", "bio": "", "nickname": "", "website": "", "stream_tokens": null, "feature_set_id": null, "csrf_token": null, "date_joined": "2024-04-16 16:28:54", "mapbox_access_tokens": null, "has_password": null, "username": "seminkim", "email": null, "is_active": null, "readonly": null, "is_dash_creator": null, "dash_created_count": null, "is_chart_creator": null, "charts_created_count": null } }, { "creation_time": "2024-04-16T16:41:00.063389Z", "comments": { "results": [], "count": 0 }, "parented": true, "embed_url": "https://chart-studio.plotly.com/~seminkim/11.embed", "fid": "seminkim:11", "filename": "zero=0.1,seed=1", "filetype": "plot", "img_url": "https://storage.googleapis.com/plotly-prod-images/seminkim/11/9_AL5N9SSLUFB1P0K24MUFN6Y95K825H.png", "image_urls": { "default": "https://storage.googleapis.com/plotly-prod-images/seminkim/11/2_E3VMUFM8V920U5OBARK286S3VB41IV.png", "block-thumb": "https://storage.googleapis.com/plotly-prod-images/seminkim/11/8_VB2MLIEIWZADT5KKXI2791V2XGBIDZ.png", "list-thumb": "https://storage.googleapis.com/plotly-prod-images/seminkim/11/9_AL5N9SSLUFB1P0K24MUFN6Y95K825H.png" }, "api_urls": { "files": "https://api.plotly.com/v2/files/seminkim:11", "plots": "https://api.plotly.com/v2/plots/seminkim:11", "parent": "https://api.plotly.com/v2/folders/home?user=seminkim" }, "owner": "seminkim", "parent": -1, "preview": "", "referencers": [], "references": [], "title": "", "views": 1, "web_url": "https://chart-studio.plotly.com/~seminkim/11/", "world_readable": true, "date_modified": "2024-04-16T16:41:00.075Z", "stars": { "results": [], "count": 0 }, "collaborators": { "results": [], "count": 0 }, "subfolder_count": null, "refresh_interval": null, "organize_view_url": "https://chart-studio.plotly.com/~seminkim/11/", "current_user_permission": "read", "is_theme": null, "is_template": null, "autosize": true, "caption": "", "figure": { "data": [ { "mode": "markers", "type": "scatter3d", "xsrc": "seminkim:10:ef3071", "ysrc": "seminkim:10:e6ff87", "zsrc": "seminkim:10:a038a5", "marker": { "size": 5, "opacity": 0.5, "colorsrc": "seminkim:10:268216" } } ], "layout": { "scene": { "aspectmode": "data" }, "width": 800, "height": 600, "template": { "data": { "bar": [ { "type": "bar", "marker": { "line": { "color": "#E5ECF6", "width": 0.5 }, "pattern": { "size": 10, "fillmode": "overlay", "solidity": 0.2 } }, "error_x": { "color": "#2a3f5f" }, "error_y": { "color": "#2a3f5f" } } ], "pie": [ { "type": "pie", "automargin": true } ], "table": [ { "type": "table", "cells": { "fill": { "color": "#EBF0F8" }, "line": { "color": "white" } }, "header": { "fill": { "color": "#C8D4E3" }, "line": { "color": "white" } } } ], "carpet": [ { "type": "carpet", "aaxis": { "gridcolor": "white", "linecolor": "white", "endlinecolor": "#2a3f5f", "minorgridcolor": "white", "startlinecolor": "#2a3f5f" }, "baxis": { "gridcolor": "white", "linecolor": "white", "endlinecolor": "#2a3f5f", "minorgridcolor": "white", "startlinecolor": "#2a3f5f" } } ], "mesh3d": [ { "type": "mesh3d", "colorbar": { "ticks": "", "outlinewidth": 0 } } ], "contour": [ { "type": "contour", "colorbar": { "ticks": "", "outlinewidth": 0 }, "colorscale": [ [ 0.0, "#0d0887" ], [ 0.1111111111111111, "#46039f" ], [ 0.2222222222222222, "#7201a8" ], [ 0.3333333333333333, "#9c179e" ], [ 0.4444444444444444, "#bd3786" ], [ 0.5555555555555556, "#d8576b" ], [ 0.6666666666666666, "#ed7953" ], [ 0.7777777777777778, "#fb9f3a" ], [ 0.8888888888888888, "#fdca26" ], [ 1.0, "#f0f921" ] ] } ], "heatmap": [ { "type": "heatmap", "colorbar": { "ticks": "", "outlinewidth": 0 }, "colorscale": [ [ 0.0, "#0d0887" ], [ 0.1111111111111111, "#46039f" ], [ 0.2222222222222222, "#7201a8" ], [ 0.3333333333333333, "#9c179e" ], [ 0.4444444444444444, "#bd3786" ], [ 0.5555555555555556, "#d8576b" ], [ 0.6666666666666666, "#ed7953" ], [ 0.7777777777777778, "#fb9f3a" ], [ 0.8888888888888888, "#fdca26" ], [ 1.0, "#f0f921" ] ] } ], "scatter": [ { "type": "scatter", "fillpattern": { "size": 10, "fillmode": "overlay", "solidity": 0.2 } } ], "surface": [ { "type": "surface", "colorbar": { "ticks": "", "outlinewidth": 0 }, "colorscale": [ [ 0.0, "#0d0887" ], [ 0.1111111111111111, "#46039f" ], [ 0.2222222222222222, "#7201a8" ], [ 0.3333333333333333, "#9c179e" ], [ 0.4444444444444444, "#bd3786" ], [ 0.5555555555555556, "#d8576b" ], [ 0.6666666666666666, "#ed7953" ], [ 0.7777777777777778, "#fb9f3a" ], [ 0.8888888888888888, "#fdca26" ], [ 1.0, "#f0f921" ] ] } ], "barpolar": [ { "type": "barpolar", "marker": { "line": { "color": "#E5ECF6", "width": 0.5 }, "pattern": { "size": 10, "fillmode": "overlay", "solidity": 0.2 } } } ], "heatmapgl": [ { "type": "heatmapgl", "colorbar": { "ticks": "", "outlinewidth": 0 }, "colorscale": [ [ 0.0, "#0d0887" ], [ 0.1111111111111111, "#46039f" ], [ 0.2222222222222222, "#7201a8" ], [ 0.3333333333333333, "#9c179e" ], [ 0.4444444444444444, "#bd3786" ], [ 0.5555555555555556, "#d8576b" ], [ 0.6666666666666666, "#ed7953" ], [ 0.7777777777777778, "#fb9f3a" ], [ 0.8888888888888888, "#fdca26" ], [ 1.0, "#f0f921" ] ] } ], "histogram": [ { "type": "histogram", "marker": { "pattern": { "size": 10, "fillmode": "overlay", "solidity": 0.2 } } } ], "parcoords": [ { "line": { "colorbar": { "ticks": "", "outlinewidth": 0 } }, "type": "parcoords" } ], "scatter3d": [ { "line": { "colorbar": { "ticks": "", "outlinewidth": 0 } }, "type": "scatter3d", "marker": { "colorbar": { "ticks": "", "outlinewidth": 0 } } } ], "scattergl": [ { "type": "scattergl", "marker": { "colorbar": { "ticks": "", "outlinewidth": 0 } } } ], "choropleth": [ { "type": "choropleth", "colorbar": { "ticks": "", "outlinewidth": 0 } } ], "scattergeo": [ { "type": "scattergeo", "marker": { "colorbar": { "ticks": "", "outlinewidth": 0 } } } ], "histogram2d": [ { "type": "histogram2d", "colorbar": { "ticks": "", "outlinewidth": 0 }, "colorscale": [ [ 0.0, "#0d0887" ], [ 0.1111111111111111, "#46039f" ], [ 0.2222222222222222, "#7201a8" ], [ 0.3333333333333333, "#9c179e" ], [ 0.4444444444444444, "#bd3786" ], [ 0.5555555555555556, "#d8576b" ], [ 0.6666666666666666, "#ed7953" ], [ 0.7777777777777778, "#fb9f3a" ], [ 0.8888888888888888, "#fdca26" ], [ 1.0, "#f0f921" ] ] } ], "scatterpolar": [ { "type": "scatterpolar", "marker": { "colorbar": { "ticks": "", "outlinewidth": 0 } } } ], "contourcarpet": [ { "type": "contourcarpet", "colorbar": { "ticks": "", "outlinewidth": 0 } } ], "scattercarpet": [ { "type": "scattercarpet", "marker": { "colorbar": { "ticks": "", "outlinewidth": 0 } } } ], "scattermapbox": [ { "type": "scattermapbox", "marker": { "colorbar": { "ticks": "", "outlinewidth": 0 } } } ], "scatterpolargl": [ { "type": "scatterpolargl", "marker": { "colorbar": { "ticks": "", "outlinewidth": 0 } } } ], "scatterternary": [ { "type": "scatterternary", "marker": { "colorbar": { "ticks": "", "outlinewidth": 0 } } } ], "histogram2dcontour": [ { "type": "histogram2dcontour", "colorbar": { "ticks": "", "outlinewidth": 0 }, "colorscale": [ [ 0.0, "#0d0887" ], [ 0.1111111111111111, "#46039f" ], [ 0.2222222222222222, "#7201a8" ], [ 0.3333333333333333, "#9c179e" ], [ 0.4444444444444444, "#bd3786" ], [ 0.5555555555555556, "#d8576b" ], [ 0.6666666666666666, "#ed7953" ], [ 0.7777777777777778, "#fb9f3a" ], [ 0.8888888888888888, "#fdca26" ], [ 1.0, "#f0f921" ] ] } ] }, "layout": { "geo": { "bgcolor": "white", "showland": true, "lakecolor": "white", "landcolor": "#E5ECF6", "showlakes": true, "subunitcolor": "white" }, "font": { "color": "#2a3f5f" }, "polar": { "bgcolor": "#E5ECF6", "radialaxis": { "ticks": "", "gridcolor": "white", "linecolor": "white" }, "angularaxis": { "ticks": "", "gridcolor": "white", "linecolor": "white" } }, "scene": { "xaxis": { "ticks": "", "gridcolor": "white", "gridwidth": 2, "linecolor": "white", "zerolinecolor": "white", "showbackground": true, "backgroundcolor": "#E5ECF6" }, "yaxis": { "ticks": "", "gridcolor": "white", "gridwidth": 2, "linecolor": "white", "zerolinecolor": "white", "showbackground": true, "backgroundcolor": "#E5ECF6" }, "zaxis": { "ticks": "", "gridcolor": "white", "gridwidth": 2, "linecolor": "white", "zerolinecolor": "white", "showbackground": true, "backgroundcolor": "#E5ECF6" } }, "title": { "x": 0.05 }, "xaxis": { "ticks": "", "title": { "standoff": 15 }, "gridcolor": "white", "linecolor": "white", "automargin": true, "zerolinecolor": "white", "zerolinewidth": 2 }, "yaxis": { "ticks": "", "title": { "standoff": 15 }, "gridcolor": "white", "linecolor": "white", "automargin": true, "zerolinecolor": "white", "zerolinewidth": 2 }, "mapbox": { "style": "light" }, "ternary": { "aaxis": { "ticks": "", "gridcolor": "white", "linecolor": "white" }, "baxis": { "ticks": "", "gridcolor": "white", "linecolor": "white" }, "caxis": { "ticks": "", "gridcolor": "white", "linecolor": "white" }, "bgcolor": "#E5ECF6" }, "colorway": [ "#636efa", "#EF553B", "#00cc96", "#ab63fa", "#FFA15A", "#19d3f3", "#FF6692", "#B6E880", "#FF97FF", "#FECB52" ], "coloraxis": { "colorbar": { "ticks": "", "outlinewidth": 0 } }, "hovermode": "closest", "colorscale": { "diverging": [ [ 0, "#8e0152" ], [ 0.1, "#c51b7d" ], [ 0.2, "#de77ae" ], [ 0.3, "#f1b6da" ], [ 0.4, "#fde0ef" ], [ 0.5, "#f7f7f7" ], [ 0.6, "#e6f5d0" ], [ 0.7, "#b8e186" ], [ 0.8, "#7fbc41" ], [ 0.9, "#4d9221" ], [ 1, "#276419" ] ], "sequential": [ [ 0.0, "#0d0887" ], [ 0.1111111111111111, "#46039f" ], [ 0.2222222222222222, "#7201a8" ], [ 0.3333333333333333, "#9c179e" ], [ 0.4444444444444444, "#bd3786" ], [ 0.5555555555555556, "#d8576b" ], [ 0.6666666666666666, "#ed7953" ], [ 0.7777777777777778, "#fb9f3a" ], [ 0.8888888888888888, "#fdca26" ], [ 1.0, "#f0f921" ] ], "sequentialminus": [ [ 0.0, "#0d0887" ], [ 0.1111111111111111, "#46039f" ], [ 0.2222222222222222, "#7201a8" ], [ 0.3333333333333333, "#9c179e" ], [ 0.4444444444444444, "#bd3786" ], [ 0.5555555555555556, "#d8576b" ], [ 0.6666666666666666, "#ed7953" ], [ 0.7777777777777778, "#fb9f3a" ], [ 0.8888888888888888, "#fdca26" ], [ 1.0, "#f0f921" ] ] }, "hoverlabel": { "align": "left" }, "plot_bgcolor": "#E5ECF6", "paper_bgcolor": "white", "shapedefaults": { "line": { "color": "#2a3f5f" } }, "autotypenumbers": "strict", "annotationdefaults": { "arrowhead": 0, "arrowcolor": "#2a3f5f", "arrowwidth": 1 } } } } }, "height": 600, "width": 800, "user": { "profile_url": "https://chart-studio.plotly.com/~seminkim", "avatar_url": "https://storage.googleapis.com/plotly-prod-profiles/57.jpg", "background_url": "https://storage.googleapis.com/plotly-prod-profiles/bg-7.jpg", "bio": "", "nickname": "", "website": "", "stream_tokens": null, "feature_set_id": null, "csrf_token": null, "date_joined": "2024-04-16 16:28:54", "mapbox_access_tokens": null, "has_password": null, "username": "seminkim", "email": null, "is_active": null, "readonly": null, "is_dash_creator": null, "dash_created_count": null, "is_chart_creator": null, "charts_created_count": null } }, { "creation_time": "2024-04-16T16:19:48.582772Z", "comments": { "results": [], "count": 0 }, "parented": true, "embed_url": "https://chart-studio.plotly.com/~556928/54.embed", "fid": "556928:54", "filename": "Plot 54", "filetype": "plot", "img_url": "https://api.plotly.com/v2/files/556928:54/image?image_name=list-thumb", "image_urls": { "default": "https://api.plotly.com/v2/files/556928:54/image?image_name=default", "block-thumb": "https://storage.googleapis.com/plotly-prod-images/556928/54/8_8OBC80U7MLKA8CW4PZRYIQA8345AWV.png", "list-thumb": "https://api.plotly.com/v2/files/556928:54/image?image_name=list-thumb" }, "api_urls": { "files": "https://api.plotly.com/v2/files/556928:54", "plots": "https://api.plotly.com/v2/plots/556928:54", "parent": "https://api.plotly.com/v2/folders/home?user=556928" }, "owner": "556928", "parent": -1, "preview": "", "referencers": [], "references": [], "title": "", "views": 2, "web_url": "https://chart-studio.plotly.com/~556928/54/", "world_readable": true, "date_modified": "2024-05-06T21:39:35.077Z", "stars": { "results": [], "count": 0 }, "collaborators": { "results": [], "count": 0 }, "subfolder_count": null, "refresh_interval": null, "organize_view_url": "https://chart-studio.plotly.com/~556928/54/", "current_user_permission": "read", "is_theme": null, "is_template": false, "autosize": true, "caption": "", "figure": { "data": [ { "meta": { "columnNames": { "x": "A", "y": "B", "text": "D", "error_y": { "array": "D" } } }, "mode": "markers", "type": "bar", "xsrc": "556928:53:d0a845", "ysrc": "556928:53:ead93d", "error_x": { "type": "percent", "color": "#444", "value": 10, "width": 4, "visible": true, "symmetric": false, "thickness": 2 }, "error_y": { "meta": { "columnNames": { "array": "D" } }, "type": "data", "color": "#444", "value": 10, "width": 4, "visible": true, "arraysrc": "556928:53:10f8d4", "symmetric": true, "thickness": 2, "valueminus": 10 }, "textsrc": "556928:53:10f8d4", "orientation": "v" } ], "frames": [], "layout": { "title": { "text": "" }, "xaxis": { "type": "category", "range": [ -0.5, 2.5 ], "title": { "text": "Type of Potato" }, "autorange": true }, "yaxis": { "type": "linear", "range": [ -1.093888888888889, 7.3838888888888885 ], "title": { "text": "Average Osmolarity (M)" }, "autorange": true }, "autosize": true, "template": { "data": { "bar": [ { "type": "bar", "marker": { "colorbar": { "ticks": "", "outlinewidth": 0 } } } ], "table": [ { "type": "table", "cells": { "fill": { "color": "#EBF0F8" }, "line": { "color": "white" } }, "header": { "fill": { "color": "#C8D4E3" }, "line": { "color": "white" } } } ], "carpet": [ { "type": "carpet", "aaxis": { "gridcolor": "#C8D4E3", "linecolor": "#C8D4E3", "endlinecolor": "#2a3f5f", "minorgridcolor": "#C8D4E3", "startlinecolor": "#2a3f5f" }, "baxis": { "gridcolor": "#C8D4E3", "linecolor": "#C8D4E3", "endlinecolor": "#2a3f5f", "minorgridcolor": "#C8D4E3", "startlinecolor": "#2a3f5f" } } ], "mesh3d": [ { "type": "mesh3d", "colorbar": { "ticks": "", "outlinewidth": 0 } } ], "contour": [ { "type": "contour", "colorbar": { "ticks": "", "outlinewidth": 0 }, "autocolorscale": true } ], "heatmap": [ { "type": "heatmap", "colorbar": { "ticks": "", "outlinewidth": 0 }, "autocolorscale": true } ], "scatter": [ { "type": "scatter", "marker": { "colorbar": { "ticks": "", "outlinewidth": 0 } } } ], "surface": [ { "type": "surface", "colorbar": { "ticks": "", "outlinewidth": 0 } } ], "heatmapgl": [ { "type": "heatmapgl", "colorbar": { "ticks": "", "outlinewidth": 0 } } ], "histogram": [ { "type": "histogram", "marker": { "colorbar": { "ticks": "", "outlinewidth": 0 } } } ], "parcoords": [ { "line": { "colorbar": { "ticks": "", "outlinewidth": 0 } }, "type": "parcoords" } ], "scatter3d": [ { "type": "scatter3d", "marker": { "colorbar": { "ticks": "", "outlinewidth": 0 } } } ], "scattergl": [ { "type": "scattergl", "marker": { "colorbar": { "ticks": "", "outlinewidth": 0 } } } ], "choropleth": [ { "type": "choropleth", "colorbar": { "ticks": "", "outlinewidth": 0 } } ], "scattergeo": [ { "type": "scattergeo", "marker": { "colorbar": { "ticks": "", "outlinewidth": 0 } } } ], "histogram2d": [ { "type": "histogram2d", "colorbar": { "ticks": "", "outlinewidth": 0 }, "autocolorscale": true } ], "scatterpolar": [ { "type": "scatterpolar", "marker": { "colorbar": { "ticks": "", "outlinewidth": 0 } } } ], "contourcarpet": [ { "type": "contourcarpet", "colorbar": { "ticks": "", "outlinewidth": 0 } } ], "scattercarpet": [ { "type": "scattercarpet", "marker": { "colorbar": { "ticks": "", "outlinewidth": 0 } } } ], "scattermapbox": [ { "type": "scattermapbox", "marker": { "colorbar": { "ticks": "", "outlinewidth": 0 } } } ], "scatterpolargl": [ { "type": "scatterpolargl", "marker": { "colorbar": { "ticks": "", "outlinewidth": 0 } } } ], "scatterternary": [ { "type": "scatterternary", "marker": { "colorbar": { "ticks": "", "outlinewidth": 0 } } } ], "histogram2dcontour": [ { "type": "histogram2dcontour", "colorbar": { "ticks": "", "outlinewidth": 0 }, "autocolorscale": true } ] }, "layout": { "geo": { "bgcolor": "white", "showland": true, "lakecolor": "white", "landcolor": "white", "showlakes": true, "subunitcolor": "#C8D4E3" }, "font": { "color": "#2a3f5f" }, "polar": { "bgcolor": "white", "radialaxis": { "ticks": "", "gridcolor": "#EBF0F8", "linecolor": "#EBF0F8" }, "angularaxis": { "ticks": "", "gridcolor": "#EBF0F8", "linecolor": "#EBF0F8" } }, "scene": { "xaxis": { "ticks": "", "gridcolor": "#DFE8F3", "gridwidth": 2, "linecolor": "#EBF0F8", "zerolinecolor": "#EBF0F8", "showbackground": true, "backgroundcolor": "white" }, "yaxis": { "ticks": "", "gridcolor": "#DFE8F3", "gridwidth": 2, "linecolor": "#EBF0F8", "zerolinecolor": "#EBF0F8", "showbackground": true, "backgroundcolor": "white" }, "zaxis": { "ticks": "", "gridcolor": "#DFE8F3", "gridwidth": 2, "linecolor": "#EBF0F8", "zerolinecolor": "#EBF0F8", "showbackground": true, "backgroundcolor": "white" } }, "title": { "x": 0.05 }, "xaxis": { "ticks": "", "gridcolor": "#EBF0F8", "linecolor": "#EBF0F8", "automargin": true, "zerolinecolor": "#EBF0F8", "zerolinewidth": 2 }, "yaxis": { "ticks": "", "gridcolor": "#EBF0F8", "linecolor": "#EBF0F8", "automargin": true, "zerolinecolor": "#EBF0F8", "zerolinewidth": 2 }, "ternary": { "aaxis": { "ticks": "", "gridcolor": "#DFE8F3", "linecolor": "#A2B1C6" }, "baxis": { "ticks": "", "gridcolor": "#DFE8F3", "linecolor": "#A2B1C6" }, "caxis": { "ticks": "", "gridcolor": "#DFE8F3", "linecolor": "#A2B1C6" }, "bgcolor": "white" }, "colorway": [ "#636efa", "#EF553B", "#00cc96", "#ab63fa", "#19d3f3", "#e763fa", "#fecb52", "#ffa15a", "#ff6692", "#b6e880" ], "hovermode": "closest", "colorscale": { "diverging": [ [ 0, "#8e0152" ], [ 0.1, "#c51b7d" ], [ 0.2, "#de77ae" ], [ 0.3, "#f1b6da" ], [ 0.4, "#fde0ef" ], [ 0.5, "#f7f7f7" ], [ 0.6, "#e6f5d0" ], [ 0.7, "#b8e186" ], [ 0.8, "#7fbc41" ], [ 0.9, "#4d9221" ], [ 1, "#276419" ] ], "sequential": [ [ 0, "#0508b8" ], [ 0.0893854748603352, "#1910d8" ], [ 0.1787709497206704, "#3c19f0" ], [ 0.2681564245810056, "#6b1cfb" ], [ 0.3575418994413408, "#981cfd" ], [ 0.44692737430167595, "#bf1cfd" ], [ 0.5363128491620112, "#dd2bfd" ], [ 0.6256983240223464, "#f246fe" ], [ 0.7150837988826816, "#fc67fd" ], [ 0.8044692737430168, "#fe88fc" ], [ 0.8938547486033519, "#fea5fd" ], [ 0.9832402234636871, "#febefe" ], [ 1, "#fec3fe" ] ], "sequentialminus": [ [ 0, "#0508b8" ], [ 0.0893854748603352, "#1910d8" ], [ 0.1787709497206704, "#3c19f0" ], [ 0.2681564245810056, "#6b1cfb" ], [ 0.3575418994413408, "#981cfd" ], [ 0.44692737430167595, "#bf1cfd" ], [ 0.5363128491620112, "#dd2bfd" ], [ 0.6256983240223464, "#f246fe" ], [ 0.7150837988826816, "#fc67fd" ], [ 0.8044692737430168, "#fe88fc" ], [ 0.8938547486033519, "#fea5fd" ], [ 0.9832402234636871, "#febefe" ], [ 1, "#fec3fe" ] ] }, "plot_bgcolor": "white", "paper_bgcolor": "white", "shapedefaults": { "line": { "width": 0 }, "opacity": 0.4, "fillcolor": "#506784" }, "annotationdefaults": { "arrowhead": 0, "arrowcolor": "#506784", "arrowwidth": 1 } }, "themeRef": "PLOTLY_WHITE" } } }, "height": null, "width": null, "user": { "profile_url": "https://chart-studio.plotly.com/~556928", "avatar_url": "https://storage.googleapis.com/plotly-prod-profiles/96.jpg", "background_url": "https://storage.googleapis.com/plotly-prod-profiles/bg-10.jpg", "bio": "", "nickname": "", "website": "", "stream_tokens": null, "feature_set_id": null, "csrf_token": null, "date_joined": "2021-10-08 18:43:21", "mapbox_access_tokens": null, "has_password": null, "username": "556928", "email": null, "is_active": null, "readonly": null, "is_dash_creator": null, "dash_created_count": null, "is_chart_creator": null, "charts_created_count": null } }, { "creation_time": "2024-04-16T16:16:21.143234Z", "comments": { "results": [], "count": 0 }, "parented": true, "embed_url": "https://chart-studio.plotly.com/~Adhil2201/2.embed", "fid": "Adhil2201:2", "filename": "Plot 2", "filetype": "plot", "img_url": "https://storage.googleapis.com/plotly-prod-images/Adhil2201/2/9_EWI19ZMOF3SD7C990XF3QNJXN0MCH6.png", "image_urls": { "default": "https://storage.googleapis.com/plotly-prod-images/Adhil2201/2/2_MZ77SSEYWOLOIK0OYV9TA8KQSJYP5D.png", "block-thumb": "https://storage.googleapis.com/plotly-prod-images/Adhil2201/2/8_VESNROX9KW5EQORSJ586IK1WWKYQ96.png", "list-thumb": "https://storage.googleapis.com/plotly-prod-images/Adhil2201/2/9_EWI19ZMOF3SD7C990XF3QNJXN0MCH6.png" }, "api_urls": { "files": "https://api.plotly.com/v2/files/Adhil2201:2", "plots": "https://api.plotly.com/v2/plots/Adhil2201:2", "parent": "https://api.plotly.com/v2/folders/home?user=Adhil2201" }, "owner": "Adhil2201", "parent": -1, "preview": "", "referencers": [], "references": [], "title": "", "views": 2, "web_url": "https://chart-studio.plotly.com/~Adhil2201/2/", "world_readable": true, "date_modified": "2024-04-16T16:17:41.524Z", "stars": { "results": [], "count": 0 }, "collaborators": { "results": [], "count": 0 }, "subfolder_count": null, "refresh_interval": null, "organize_view_url": "https://chart-studio.plotly.com/~Adhil2201/2/", "current_user_permission": "read", "is_theme": null, "is_template": false, "autosize": true, "caption": "", "figure": { "data": [ { "meta": { "columnNames": { "x": "Avg per project", "y": "A" } }, "type": "bar", "xsrc": "Adhil2201:0:171386", "ysrc": "Adhil2201:1:97d13d", "xaxis": "x", "yaxis": "y", "orientation": "v" } ], "frames": [], "layout": { "title": { "text": "Project reads by the length of the project's title" }, "xaxis": { "type": "linear", "range": [ 12.36164529, 22.55041489 ], "title": { "text": "Project title length by characters" }, "autorange": true }, "yaxis": { "type": "linear", "range": [ 0, 23.704940905263157 ], "title": { "text": "Average number of project reads" }, "autorange": true }, "bargap": 0.38, "autosize": true, "template": { "data": { "bar": [ { "type": "bar", "marker": { "colorbar": { "ticks": "", "outlinewidth": 0 } } } ], "table": [ { "type": "table", "cells": { "fill": { "color": "#EBF0F8" }, "line": { "color": "white" } }, "header": { "fill": { "color": "#C8D4E3" }, "line": { "color": "white" } } } ], "carpet": [ { "type": "carpet", "aaxis": { "gridcolor": "#C8D4E3", "linecolor": "#C8D4E3", "endlinecolor": "#2a3f5f", "minorgridcolor": "#C8D4E3", "startlinecolor": "#2a3f5f" }, "baxis": { "gridcolor": "#C8D4E3", "linecolor": "#C8D4E3", "endlinecolor": "#2a3f5f", "minorgridcolor": "#C8D4E3", "startlinecolor": "#2a3f5f" } } ], "mesh3d": [ { "type": "mesh3d", "colorbar": { "ticks": "", "outlinewidth": 0 } } ], "contour": [ { "type": "contour", "colorbar": { "ticks": "", "outlinewidth": 0 }, "autocolorscale": true } ], "heatmap": [ { "type": "heatmap", "colorbar": { "ticks": "", "outlinewidth": 0 }, "autocolorscale": true } ], "scatter": [ { "type": "scatter", "marker": { "colorbar": { "ticks": "", "outlinewidth": 0 } } } ], "surface": [ { "type": "surface", "colorbar": { "ticks": "", "outlinewidth": 0 } } ], "heatmapgl": [ { "type": "heatmapgl", "colorbar": { "ticks": "", "outlinewidth": 0 } } ], "histogram": [ { "type": "histogram", "marker": { "colorbar": { "ticks": "", "outlinewidth": 0 } } } ], "parcoords": [ { "line": { "colorbar": { "ticks": "", "outlinewidth": 0 } }, "type": "parcoords" } ], "scatter3d": [ { "type": "scatter3d", "marker": { "colorbar": { "ticks": "", "outlinewidth": 0 } } } ], "scattergl": [ { "type": "scattergl", "marker": { "colorbar": { "ticks": "", "outlinewidth": 0 } } } ], "choropleth": [ { "type": "choropleth", "colorbar": { "ticks": "", "outlinewidth": 0 } } ], "scattergeo": [ { "type": "scattergeo", "marker": { "colorbar": { "ticks": "", "outlinewidth": 0 } } } ], "histogram2d": [ { "type": "histogram2d", "colorbar": { "ticks": "", "outlinewidth": 0 }, "autocolorscale": true } ], "scatterpolar": [ { "type": "scatterpolar", "marker": { "colorbar": { "ticks": "", "outlinewidth": 0 } } } ], "contourcarpet": [ { "type": "contourcarpet", "colorbar": { "ticks": "", "outlinewidth": 0 } } ], "scattercarpet": [ { "type": "scattercarpet", "marker": { "colorbar": { "ticks": "", "outlinewidth": 0 } } } ], "scattermapbox": [ { "type": "scattermapbox", "marker": { "colorbar": { "ticks": "", "outlinewidth": 0 } } } ], "scatterpolargl": [ { "type": "scatterpolargl", "marker": { "colorbar": { "ticks": "", "outlinewidth": 0 } } } ], "scatterternary": [ { "type": "scatterternary", "marker": { "colorbar": { "ticks": "", "outlinewidth": 0 } } } ], "histogram2dcontour": [ { "type": "histogram2dcontour", "colorbar": { "ticks": "", "outlinewidth": 0 }, "autocolorscale": true } ] }, "layout": { "geo": { "bgcolor": "white", "showland": true, "lakecolor": "white", "landcolor": "white", "showlakes": true, "subunitcolor": "#C8D4E3" }, "font": { "color": "#2a3f5f" }, "polar": { "bgcolor": "white", "radialaxis": { "ticks": "", "gridcolor": "#EBF0F8", "linecolor": "#EBF0F8" }, "angularaxis": { "ticks": "", "gridcolor": "#EBF0F8", "linecolor": "#EBF0F8" } }, "scene": { "xaxis": { "ticks": "", "gridcolor": "#DFE8F3", "gridwidth": 2, "linecolor": "#EBF0F8", "zerolinecolor": "#EBF0F8", "showbackground": true, "backgroundcolor": "white" }, "yaxis": { "ticks": "", "gridcolor": "#DFE8F3", "gridwidth": 2, "linecolor": "#EBF0F8", "zerolinecolor": "#EBF0F8", "showbackground": true, "backgroundcolor": "white" }, "zaxis": { "ticks": "", "gridcolor": "#DFE8F3", "gridwidth": 2, "linecolor": "#EBF0F8", "zerolinecolor": "#EBF0F8", "showbackground": true, "backgroundcolor": "white" } }, "title": { "x": 0.05 }, "xaxis": { "ticks": "", "gridcolor": "#EBF0F8", "linecolor": "#EBF0F8", "automargin": true, "zerolinecolor": "#EBF0F8", "zerolinewidth": 2 }, "yaxis": { "ticks": "", "gridcolor": "#EBF0F8", "linecolor": "#EBF0F8", "automargin": true, "zerolinecolor": "#EBF0F8", "zerolinewidth": 2 }, "ternary": { "aaxis": { "ticks": "", "gridcolor": "#DFE8F3", "linecolor": "#A2B1C6" }, "baxis": { "ticks": "", "gridcolor": "#DFE8F3", "linecolor": "#A2B1C6" }, "caxis": { "ticks": "", "gridcolor": "#DFE8F3", "linecolor": "#A2B1C6" }, "bgcolor": "white" }, "colorway": [ "#636efa", "#EF553B", "#00cc96", "#ab63fa", "#19d3f3", "#e763fa", "#fecb52", "#ffa15a", "#ff6692", "#b6e880" ], "hovermode": "closest", "colorscale": { "diverging": [ [ 0, "#8e0152" ], [ 0.1, "#c51b7d" ], [ 0.2, "#de77ae" ], [ 0.3, "#f1b6da" ], [ 0.4, "#fde0ef" ], [ 0.5, "#f7f7f7" ], [ 0.6, "#e6f5d0" ], [ 0.7, "#b8e186" ], [ 0.8, "#7fbc41" ], [ 0.9, "#4d9221" ], [ 1, "#276419" ] ], "sequential": [ [ 0, "#0508b8" ], [ 0.0893854748603352, "#1910d8" ], [ 0.1787709497206704, "#3c19f0" ], [ 0.2681564245810056, "#6b1cfb" ], [ 0.3575418994413408, "#981cfd" ], [ 0.44692737430167595, "#bf1cfd" ], [ 0.5363128491620112, "#dd2bfd" ], [ 0.6256983240223464, "#f246fe" ], [ 0.7150837988826816, "#fc67fd" ], [ 0.8044692737430168, "#fe88fc" ], [ 0.8938547486033519, "#fea5fd" ], [ 0.9832402234636871, "#febefe" ], [ 1, "#fec3fe" ] ], "sequentialminus": [ [ 0, "#0508b8" ], [ 0.0893854748603352, "#1910d8" ], [ 0.1787709497206704, "#3c19f0" ], [ 0.2681564245810056, "#6b1cfb" ], [ 0.3575418994413408, "#981cfd" ], [ 0.44692737430167595, "#bf1cfd" ], [ 0.5363128491620112, "#dd2bfd" ], [ 0.6256983240223464, "#f246fe" ], [ 0.7150837988826816, "#fc67fd" ], [ 0.8044692737430168, "#fe88fc" ], [ 0.8938547486033519, "#fea5fd" ], [ 0.9832402234636871, "#febefe" ], [ 1, "#fec3fe" ] ] }, "plot_bgcolor": "white", "paper_bgcolor": "white", "shapedefaults": { "line": { "width": 0 }, "opacity": 0.4, "fillcolor": "#506784" }, "annotationdefaults": { "arrowhead": 0, "arrowcolor": "#506784", "arrowwidth": 1 } }, "themeRef": "PLOTLY_WHITE" }, "hovermode": "closest" } }, "height": null, "width": null, "user": { "profile_url": "https://chart-studio.plotly.com/~Adhil2201", "avatar_url": "https://storage.googleapis.com/plotly-prod-profiles/98.jpg", "background_url": "https://storage.googleapis.com/plotly-prod-profiles/bg-0.jpg", "bio": "", "nickname": "", "website": "", "stream_tokens": null, "feature_set_id": null, "csrf_token": null, "date_joined": "2024-04-16 16:15:57", "mapbox_access_tokens": null, "has_password": null, "username": "Adhil2201", "email": null, "is_active": null, "readonly": null, "is_dash_creator": null, "dash_created_count": null, "is_chart_creator": null, "charts_created_count": null } }, { "creation_time": "2024-04-16T16:10:55.855707Z", "comments": { "results": [], "count": 0 }, "parented": true, "embed_url": "https://chart-studio.plotly.com/~pattharamon.d/5.embed", "fid": "pattharamon.d:5", "filename": "Plot 5", "filetype": "plot", "img_url": "https://storage.googleapis.com/plotly-prod-images/pattharamon.d/5/9_MHNUS4EP196GPPWNIRE19FQZCPUZKJ.png", "image_urls": { "default": "https://storage.googleapis.com/plotly-prod-images/pattharamon.d/5/2_RYXFQ5XWF2PE6TOY1BZU7OVKQUKN3R.png", "block-thumb": "https://storage.googleapis.com/plotly-prod-images/pattharamon.d/5/8_HPY2NWFE04RMLHUTO38OUZXKA2M81T.png", "list-thumb": "https://storage.googleapis.com/plotly-prod-images/pattharamon.d/5/9_MHNUS4EP196GPPWNIRE19FQZCPUZKJ.png" }, "api_urls": { "files": "https://api.plotly.com/v2/files/pattharamon.d:5", "plots": "https://api.plotly.com/v2/plots/pattharamon.d:5", "parent": "https://api.plotly.com/v2/folders/home?user=pattharamon.d" }, "owner": "pattharamon.d", "parent": -1, "preview": "", "referencers": [], "references": [], "title": "", "views": 1, "web_url": "https://chart-studio.plotly.com/~pattharamon.d/5/", "world_readable": true, "date_modified": "2024-04-16T16:10:55.865Z", "stars": { "results": [], "count": 0 }, "collaborators": { "results": [], "count": 0 }, "subfolder_count": null, "refresh_interval": null, "organize_view_url": "https://chart-studio.plotly.com/~pattharamon.d/5/", "current_user_permission": "read", "is_theme": null, "is_template": false, "autosize": true, "caption": "", "figure": { "data": [ { "meta": { "columnNames": { "z": "A - B - C - D - E" } }, "mode": "markers", "type": "surface", "zsrc": "pattharamon.d:4:fa4fcb,b462a4,d7fdea,5fa196,6ab6a6" } ], "frames": [], "layout": { "scene": { "camera": { "up": { "x": 0, "y": 0, "z": 1 }, "eye": { "x": 3.5503721734659877, "y": 3.7833732821527484, "z": 0.6616140128521849 }, "center": { "x": 0, "y": 0, "z": 0 }, "projection": { "type": "perspective" } }, "aspectmode": "auto", "aspectratio": { "x": 1, "y": 1, "z": 1 } }, "title": { "text": "Relative Frequency" }, "xaxis": { "range": [ -1, 6 ], "autorange": true }, "yaxis": { "range": [ -1, 4 ], "autorange": true }, "autosize": true, "template": { "data": { "bar": [ { "type": "bar", "marker": { "colorbar": { "ticks": "", "outlinewidth": 0 } } } ], "table": [ { "type": "table", "cells": { "fill": { "color": "#EBF0F8" }, "line": { "color": "white" } }, "header": { "fill": { "color": "#C8D4E3" }, "line": { "color": "white" } } } ], "carpet": [ { "type": "carpet", "aaxis": { "gridcolor": "#C8D4E3", "linecolor": "#C8D4E3", "endlinecolor": "#2a3f5f", "minorgridcolor": "#C8D4E3", "startlinecolor": "#2a3f5f" }, "baxis": { "gridcolor": "#C8D4E3", "linecolor": "#C8D4E3", "endlinecolor": "#2a3f5f", "minorgridcolor": "#C8D4E3", "startlinecolor": "#2a3f5f" } } ], "mesh3d": [ { "type": "mesh3d", "colorbar": { "ticks": "", "outlinewidth": 0 } } ], "contour": [ { "type": "contour", "colorbar": { "ticks": "", "outlinewidth": 0 }, "autocolorscale": true } ], "heatmap": [ { "type": "heatmap", "colorbar": { "ticks": "", "outlinewidth": 0 }, "autocolorscale": true } ], "scatter": [ { "type": "scatter", "marker": { "colorbar": { "ticks": "", "outlinewidth": 0 } } } ], "surface": [ { "type": "surface", "colorbar": { "ticks": "", "outlinewidth": 0 } } ], "heatmapgl": [ { "type": "heatmapgl", "colorbar": { "ticks": "", "outlinewidth": 0 } } ], "histogram": [ { "type": "histogram", "marker": { "colorbar": { "ticks": "", "outlinewidth": 0 } } } ], "parcoords": [ { "line": { "colorbar": { "ticks": "", "outlinewidth": 0 } }, "type": "parcoords" } ], "scatter3d": [ { "type": "scatter3d", "marker": { "colorbar": { "ticks": "", "outlinewidth": 0 } } } ], "scattergl": [ { "type": "scattergl", "marker": { "colorbar": { "ticks": "", "outlinewidth": 0 } } } ], "choropleth": [ { "type": "choropleth", "colorbar": { "ticks": "", "outlinewidth": 0 } } ], "scattergeo": [ { "type": "scattergeo", "marker": { "colorbar": { "ticks": "", "outlinewidth": 0 } } } ], "histogram2d": [ { "type": "histogram2d", "colorbar": { "ticks": "", "outlinewidth": 0 }, "autocolorscale": true } ], "scatterpolar": [ { "type": "scatterpolar", "marker": { "colorbar": { "ticks": "", "outlinewidth": 0 } } } ], "contourcarpet": [ { "type": "contourcarpet", "colorbar": { "ticks": "", "outlinewidth": 0 } } ], "scattercarpet": [ { "type": "scattercarpet", "marker": { "colorbar": { "ticks": "", "outlinewidth": 0 } } } ], "scattermapbox": [ { "type": "scattermapbox", "marker": { "colorbar": { "ticks": "", "outlinewidth": 0 } } } ], "scatterpolargl": [ { "type": "scatterpolargl", "marker": { "colorbar": { "ticks": "", "outlinewidth": 0 } } } ], "scatterternary": [ { "type": "scatterternary", "marker": { "colorbar": { "ticks": "", "outlinewidth": 0 } } } ], "histogram2dcontour": [ { "type": "histogram2dcontour", "colorbar": { "ticks": "", "outlinewidth": 0 }, "autocolorscale": true } ] }, "layout": { "geo": { "bgcolor": "white", "showland": true, "lakecolor": "white", "landcolor": "white", "showlakes": true, "subunitcolor": "#C8D4E3" }, "font": { "color": "#2a3f5f" }, "polar": { "bgcolor": "white", "radialaxis": { "ticks": "", "gridcolor": "#EBF0F8", "linecolor": "#EBF0F8" }, "angularaxis": { "ticks": "", "gridcolor": "#EBF0F8", "linecolor": "#EBF0F8" } }, "scene": { "xaxis": { "ticks": "", "gridcolor": "#DFE8F3", "gridwidth": 2, "linecolor": "#EBF0F8", "zerolinecolor": "#EBF0F8", "showbackground": true, "backgroundcolor": "white" }, "yaxis": { "ticks": "", "gridcolor": "#DFE8F3", "gridwidth": 2, "linecolor": "#EBF0F8", "zerolinecolor": "#EBF0F8", "showbackground": true, "backgroundcolor": "white" }, "zaxis": { "ticks": "", "gridcolor": "#DFE8F3", "gridwidth": 2, "linecolor": "#EBF0F8", "zerolinecolor": "#EBF0F8", "showbackground": true, "backgroundcolor": "white" } }, "title": { "x": 0.05 }, "xaxis": { "ticks": "", "gridcolor": "#EBF0F8", "linecolor": "#EBF0F8", "automargin": true, "zerolinecolor": "#EBF0F8", "zerolinewidth": 2 }, "yaxis": { "ticks": "", "gridcolor": "#EBF0F8", "linecolor": "#EBF0F8", "automargin": true, "zerolinecolor": "#EBF0F8", "zerolinewidth": 2 }, "ternary": { "aaxis": { "ticks": "", "gridcolor": "#DFE8F3", "linecolor": "#A2B1C6" }, "baxis": { "ticks": "", "gridcolor": "#DFE8F3", "linecolor": "#A2B1C6" }, "caxis": { "ticks": "", "gridcolor": "#DFE8F3", "linecolor": "#A2B1C6" }, "bgcolor": "white" }, "colorway": [ "#636efa", "#EF553B", "#00cc96", "#ab63fa", "#19d3f3", "#e763fa", "#fecb52", "#ffa15a", "#ff6692", "#b6e880" ], "hovermode": "closest", "colorscale": { "diverging": [ [ 0, "#8e0152" ], [ 0.1, "#c51b7d" ], [ 0.2, "#de77ae" ], [ 0.3, "#f1b6da" ], [ 0.4, "#fde0ef" ], [ 0.5, "#f7f7f7" ], [ 0.6, "#e6f5d0" ], [ 0.7, "#b8e186" ], [ 0.8, "#7fbc41" ], [ 0.9, "#4d9221" ], [ 1, "#276419" ] ], "sequential": [ [ 0, "#0508b8" ], [ 0.0893854748603352, "#1910d8" ], [ 0.1787709497206704, "#3c19f0" ], [ 0.2681564245810056, "#6b1cfb" ], [ 0.3575418994413408, "#981cfd" ], [ 0.44692737430167595, "#bf1cfd" ], [ 0.5363128491620112, "#dd2bfd" ], [ 0.6256983240223464, "#f246fe" ], [ 0.7150837988826816, "#fc67fd" ], [ 0.8044692737430168, "#fe88fc" ], [ 0.8938547486033519, "#fea5fd" ], [ 0.9832402234636871, "#febefe" ], [ 1, "#fec3fe" ] ], "sequentialminus": [ [ 0, "#0508b8" ], [ 0.0893854748603352, "#1910d8" ], [ 0.1787709497206704, "#3c19f0" ], [ 0.2681564245810056, "#6b1cfb" ], [ 0.3575418994413408, "#981cfd" ], [ 0.44692737430167595, "#bf1cfd" ], [ 0.5363128491620112, "#dd2bfd" ], [ 0.6256983240223464, "#f246fe" ], [ 0.7150837988826816, "#fc67fd" ], [ 0.8044692737430168, "#fe88fc" ], [ 0.8938547486033519, "#fea5fd" ], [ 0.9832402234636871, "#febefe" ], [ 1, "#fec3fe" ] ] }, "plot_bgcolor": "white", "paper_bgcolor": "white", "shapedefaults": { "line": { "width": 0 }, "opacity": 0.4, "fillcolor": "#506784" }, "annotationdefaults": { "arrowhead": 0, "arrowcolor": "#506784", "arrowwidth": 1 } }, "themeRef": "PLOTLY_WHITE" } } }, "height": null, "width": null, "user": { "profile_url": "https://chart-studio.plotly.com/~pattharamon.d", "avatar_url": "https://storage.googleapis.com/plotly-prod-profiles/38.jpg", "background_url": "https://storage.googleapis.com/plotly-prod-profiles/bg-0.jpg", "bio": "", "nickname": "", "website": "", "stream_tokens": null, "feature_set_id": null, "csrf_token": null, "date_joined": "2024-04-15 20:32:30", "mapbox_access_tokens": null, "has_password": null, "username": "pattharamon.d", "email": null, "is_active": null, "readonly": null, "is_dash_creator": null, "dash_created_count": null, "is_chart_creator": null, "charts_created_count": null } }, { "creation_time": "2024-04-16T16:02:01.426321Z", "comments": { "results": [], "count": 0 }, "parented": true, "embed_url": "https://chart-studio.plotly.com/~andreiciocoiu/26.embed", "fid": "andreiciocoiu:26", "filename": "sentiment-SOL", "filetype": "plot", "img_url": "https://storage.googleapis.com/plotly-prod-images/andreiciocoiu/26/9_OODSM8RGBM0HSNTLSSF0NRDCJEVM14.png", "image_urls": { "default": "https://storage.googleapis.com/plotly-prod-images/andreiciocoiu/26/2_02M82I0Q4FZBZMYYWP31BZ4K9WNDWG.png", "block-thumb": "https://storage.googleapis.com/plotly-prod-images/andreiciocoiu/26/8_KZHERFAI8TNXVFHL5PB3IGLYF9O00T.png", "list-thumb": "https://storage.googleapis.com/plotly-prod-images/andreiciocoiu/26/9_OODSM8RGBM0HSNTLSSF0NRDCJEVM14.png" }, "api_urls": { "files": "https://api.plotly.com/v2/files/andreiciocoiu:26", "plots": "https://api.plotly.com/v2/plots/andreiciocoiu:26", "parent": "https://api.plotly.com/v2/folders/home?user=andreiciocoiu" }, "owner": "andreiciocoiu", "parent": -1, "preview": "", "referencers": [], "references": [], "title": "SOL Sentiment Analysis", "views": 10, "web_url": "https://chart-studio.plotly.com/~andreiciocoiu/26/sol-sentiment-analysis/", "world_readable": true, "date_modified": "2024-04-16T16:02:56.545Z", "stars": { "results": [], "count": 0 }, "collaborators": { "results": [], "count": 0 }, "subfolder_count": null, "refresh_interval": null, "organize_view_url": "https://chart-studio.plotly.com/~andreiciocoiu/26/", "current_user_permission": "read", "is_theme": null, "is_template": null, "autosize": true, "caption": "", "figure": { "data": [ { "type": "pie", "marker": { "colors": [ "green", "gray", "red" ] }, "labelssrc": "andreiciocoiu:27:2edd11", "valuessrc": "andreiciocoiu:27:583c57" } ], "layout": { "title": "SOL Sentiment Analysis", "width": 500, "height": 400 } }, "height": 400, "width": 500, "user": { "profile_url": "https://chart-studio.plotly.com/~andreiciocoiu", "avatar_url": "https://storage.googleapis.com/plotly-prod-profiles/66.jpg", "background_url": "https://storage.googleapis.com/plotly-prod-profiles/bg-5.jpg", "bio": "", "nickname": "", "website": "", "stream_tokens": null, "feature_set_id": null, "csrf_token": null, "date_joined": "2024-04-03 21:49:19", "mapbox_access_tokens": null, "has_password": null, "username": "andreiciocoiu", "email": null, "is_active": null, "readonly": null, "is_dash_creator": null, "dash_created_count": null, "is_chart_creator": null, "charts_created_count": null } }, { "creation_time": "2024-04-16T15:58:26.336024Z", "comments": { "results": [], "count": 0 }, "parented": true, "embed_url": "https://chart-studio.plotly.com/~Marshall_s/13.embed", "fid": "Marshall_s:13", "filename": "Plot 13", "filetype": "plot", "img_url": "https://storage.googleapis.com/plotly-prod-images/Marshall_s/13/9_T42XDUBBHHQFNBUOVN518QSORAAMDO.png", "image_urls": { "default": "https://storage.googleapis.com/plotly-prod-images/Marshall_s/13/2_X3C3CKEMWA499V0JJ1NFBVJNYD836O.png", "block-thumb": "https://storage.googleapis.com/plotly-prod-images/Marshall_s/13/8_NNTPJESFBB5FZUUL0GS5N99YKDNLIP.png", "list-thumb": "https://storage.googleapis.com/plotly-prod-images/Marshall_s/13/9_T42XDUBBHHQFNBUOVN518QSORAAMDO.png" }, "api_urls": { "files": "https://api.plotly.com/v2/files/Marshall_s:13", "plots": "https://api.plotly.com/v2/plots/Marshall_s:13", "parent": "https://api.plotly.com/v2/folders/home?user=Marshall_s" }, "owner": "Marshall_s", "parent": -1, "preview": "", "referencers": [], "references": [], "title": "", "views": 1, "web_url": "https://chart-studio.plotly.com/~Marshall_s/13/", "world_readable": true, "date_modified": "2024-04-16T15:58:26.350Z", "stars": { "results": [], "count": 0 }, "collaborators": { "results": [], "count": 0 }, "subfolder_count": null, "refresh_interval": null, "organize_view_url": "https://chart-studio.plotly.com/~Marshall_s/13/", "current_user_permission": "read", "is_theme": null, "is_template": false, "autosize": true, "caption": "", "figure": { "data": [ { "uid": "c59f3b", "meta": { "columnNames": { "x": "trial 1 time", "y": "trial 1o2 gas" } }, "mode": "markers", "name": "trial 1", "type": "scatter", "xsrc": "Marshall_s:12:da0b41", "ysrc": "Marshall_s:12:c2a0af" }, { "uid": "fe21d6", "meta": { "columnNames": { "x": "trial 2 time S", "y": "trial 2 o2 gas" } }, "mode": "markers", "name": "trial 2", "type": "scatter", "xsrc": "Marshall_s:12:45432a", "ysrc": "Marshall_s:12:9843c1", "stackgroup": null }, { "uid": "d1355b", "meta": { "columnNames": { "x": "trial 3 time S", "y": "trial 3 o2 gas" } }, "mode": "markers", "name": "trial 3", "type": "scatter", "xsrc": "Marshall_s:12:5209dc", "ysrc": "Marshall_s:12:ef9e4a", "stackgroup": null }, { "uid": "562655", "name": "Fit of trial 1 ", "transforms": [ { "rms": "", "type": "fit", "inputUid": "c59f3b", "regressor": "x", "parameters": [ { "hold": false, "name": "m", "error": 7.922978700818476e-05, "value": 0.0036842095979611905 }, { "hold": false, "name": "b", "error": 0.008290782995924433, "value": 4.395861117399709 } ], "regressand": "y", "correlation": "", "fitfunction": "m*x + b", "inputxrange": [], "outputxrange": [], "interpolation": 50 } ] }, { "uid": "fd8c48", "name": "Fit of trial 2", "transforms": [ { "rms": "", "type": "fit", "inputUid": "fe21d6", "regressor": "x", "parameters": [ { "hold": false, "name": "m", "error": 0.00011565663625356182, "value": 0.003761204525983827 }, { "hold": false, "name": "b", "error": 0.012102570376946354, "value": 4.391723408877672 } ], "regressand": "y", "correlation": "", "fitfunction": "m*x + b", "inputxrange": [], "outputxrange": [], "interpolation": 50 } ] }, { "uid": "197a75", "transforms": [ { "rms": "", "type": "fit", "inputUid": "d1355b", "regressor": "x", "parameters": [ { "hold": false, "name": "m", "error": 0.00032029639668124327, "value": 0.004726882748032143 }, { "hold": false, "name": "b", "error": 0.03351653487325734, "value": 4.4866188277852155 } ], "regressand": "y", "correlation": "", "fitfunction": "m*x + b", "inputxrange": [], "outputxrange": [], "interpolation": 50 } ] } ], "frames": [], "layout": { "title": { "text": "02 gas created by the reaction of enzyme suspension &h2o2" }, "xaxis": { "type": "linear", "range": [ -11.494321578003584, 191.4943215780036 ], "autorange": true }, "yaxis": { "type": "linear", "range": [ 4.21788969310255, 5.396382355553551 ], "autorange": true }, "bargap": 0.38, "autosize": true, "hovermode": "closest" } }, "height": null, "width": null, "user": { "profile_url": "https://chart-studio.plotly.com/~Marshall_s", "avatar_url": "https://storage.googleapis.com/plotly-prod-profiles/66.jpg", "background_url": "https://storage.googleapis.com/plotly-prod-profiles/bg-4.jpg", "bio": "", "nickname": "", "website": "", "stream_tokens": null, "feature_set_id": null, "csrf_token": null, "date_joined": "2021-10-08 18:45:22", "mapbox_access_tokens": null, "has_password": null, "username": "Marshall_s", "email": null, "is_active": null, "readonly": null, "is_dash_creator": null, "dash_created_count": null, "is_chart_creator": null, "charts_created_count": null } }, { "creation_time": "2024-04-16T15:57:05.694968Z", "comments": { "results": [], "count": 0 }, "parented": true, "embed_url": "https://chart-studio.plotly.com/~jsteph202/5.embed", "fid": "jsteph202:5", "filename": "Plot 5", "filetype": "plot", "img_url": "https://storage.googleapis.com/plotly-prod-images/jsteph202/5/9_HTKKL91WHCMOVGOXISIXND637V9NAK.png", "image_urls": { "default": "https://storage.googleapis.com/plotly-prod-images/jsteph202/5/2_1H02WHSXDOMH0CZ803BL1PHA594A45.png", "block-thumb": "https://storage.googleapis.com/plotly-prod-images/jsteph202/5/8_RG1L6BX2AL7N2PIPAN1O53ME9ML0B3.png", "list-thumb": "https://storage.googleapis.com/plotly-prod-images/jsteph202/5/9_HTKKL91WHCMOVGOXISIXND637V9NAK.png" }, "api_urls": { "files": "https://api.plotly.com/v2/files/jsteph202:5", "plots": "https://api.plotly.com/v2/plots/jsteph202:5", "parent": "https://api.plotly.com/v2/folders/home?user=jsteph202" }, "owner": "jsteph202", "parent": -1, "preview": "", "referencers": [], "references": [], "title": "", "views": 1, "web_url": "https://chart-studio.plotly.com/~jsteph202/5/", "world_readable": true, "date_modified": "2024-04-16T16:02:41.854Z", "stars": { "results": [], "count": 0 }, "collaborators": { "results": [], "count": 0 }, "subfolder_count": null, "refresh_interval": null, "organize_view_url": "https://chart-studio.plotly.com/~jsteph202/5/", "current_user_permission": "read", "is_theme": null, "is_template": false, "autosize": true, "caption": "", "figure": { "data": [ { "meta": { "columnNames": { "x": "A", "y": "B" } }, "mode": "markers", "name": "", "type": "scatter", "xsrc": "jsteph202:4:45b1a7", "ysrc": "jsteph202:4:ece6a8", "visible": "legendonly", "stackgroup": null }, { "meta": { "columnNames": { "x": "A", "y": "B" } }, "mode": "lines", "type": "scatter", "xsrc": "jsteph202:6:446e61", "ysrc": "jsteph202:6:e15ac0" } ], "frames": [], "layout": { "title": { "text": "Moisture Values by date" }, "xaxis": { "type": "date", "range": [ "2024-04-08", "2024-04-16" ], "title": { "text": "Date" }, "autorange": true }, "yaxis": { "type": "linear", "range": [ 71.55888888888889, 75.18111111111111 ], "title": { "text": "Moisture Values" }, "autorange": true }, "bargap": 0.38, "autosize": true, "hovermode": "closest" } }, "height": null, "width": null, "user": { "profile_url": "https://chart-studio.plotly.com/~jsteph202", "avatar_url": "https://storage.googleapis.com/plotly-prod-profiles/73.jpg", "background_url": "https://storage.googleapis.com/plotly-prod-profiles/bg-12.jpg", "bio": "", "nickname": "", "website": "", "stream_tokens": null, "feature_set_id": null, "csrf_token": null, "date_joined": "2024-04-11 19:22:07", "mapbox_access_tokens": null, "has_password": null, "username": "jsteph202", "email": null, "is_active": null, "readonly": null, "is_dash_creator": null, "dash_created_count": null, "is_chart_creator": null, "charts_created_count": null } } ] }
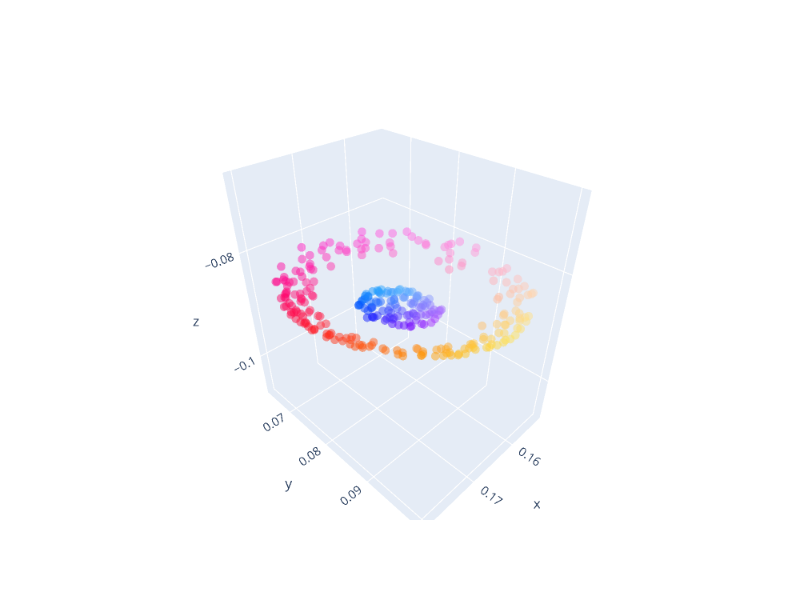
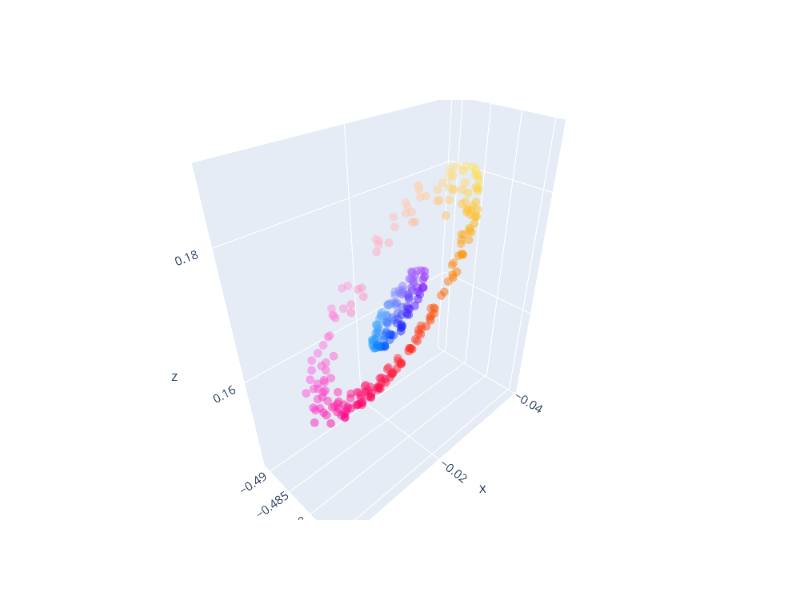
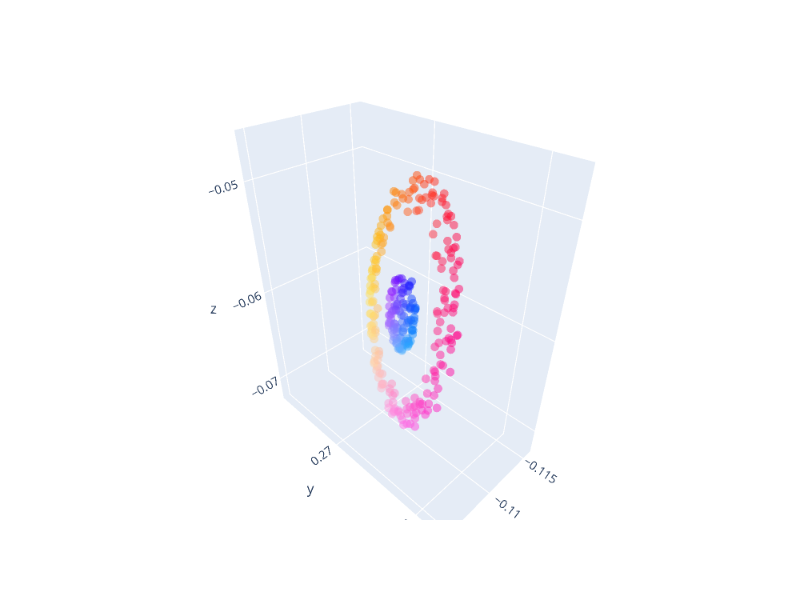
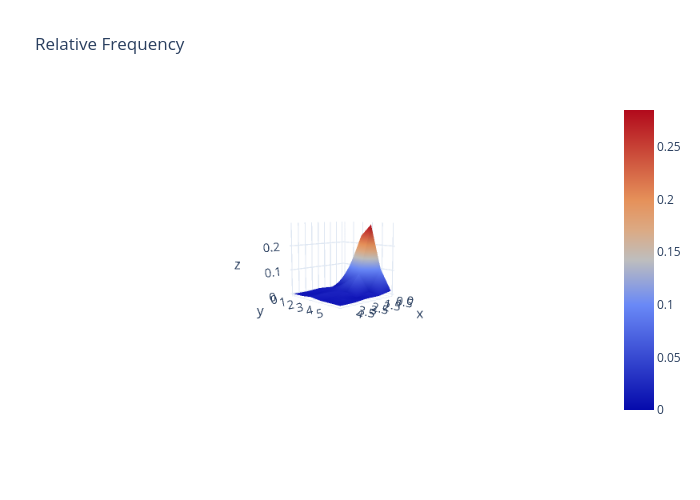