Plots List
Plots
This endpoint handles manipulation of Plotly plot files.
Reference
Authorization
Any user with or without a Plotly account may view public plots. For private plots, see authentication.
Actions
list
Listing all public plots can be done via a GET request to this endpoint.
By default, plots will be listed in order of date created. The order_by
query parameter is accepted at this endpoint. Currently, only ordering by
views is supported. It is possible to filter the plots by quality
with min_quality or max_quality as query parameter.
Example:
// GET https://api.plotly.com/v2/plots/ ---> 200

// GET https://api.plotly.com/v2/plots/?order_by=-views ---> 200

// GET https://api.plotly.com/v2/plots/?min_quality=5 ---> 200

// GET https://api.plotly.com/v2/plots/?max_quality=5 ---> 200
feed
Listing all handpicked feed plots can be done via a GET request to this endpoint. By default, plots will be listed in a random order.
Example:
// GET https://api.plotly.com/v2/plots/feed ---> 200
create
You can create new plot resources here. The only required field is 'figure'. Currently, the figure is restricted to only contain references to grid data. That is, this will fail if raw data arrays are passed in. To create and manipulate underlying grids for plots, see the grids endpoint.
Example:
// This fails because a figure field is required.
// POST https://api.plotly.com/v2/plots ---> 400 Bad Request
{}

// This fails because the figure has raw data
//POST https://api.plotly.com/v2/plots ---> 400 Bad Request
{
    "figure": {"data": [{"y": ['this', 'is', 'raw', 'data']}]}
}

// This succeeds because the figure has src keys, not raw data.
//POST https://api.plotly.com/v2/plots ---> 200 OK
{
    "figure": {"data": [{"ysrc": "sven:88:u8nd62"}]}
}
When creating a grid, you can optionally specify a source_fid to specify where a plot has come from:
- source_fid: the fid of a plot that was copied (and presumably edited) to produce this one
detail
There is a lot of meta information stored about plot files including filename, title, share_url, and content_url to name a few.
This information can only be reached with a GET to this endpoint.
Example:
// GET https://api.plotly.com/v2/plots/iheartgraphs:90
content
The contents of a plot can be downloaded via the content resource. The plot
content contains referenced grid/column data by default. If you wish to
return the raw grid/column data, the inline_data=true query must be included
in the request url. The Content-Type header will be appropriately set for the
response body.
Alternatively, you can set ?map_data=unreadable to append a mapping of
sources to data that belongs to grids which are unreadable for the
requestor. This is useful when you have read access to another users plot,
but that plot contains grid references which you don't have access to.
Examples:
// Returns referenced grid/column data
// GET https://api.plotly.com/v2/plots/iheartgraphs:90/content ---> 200 OK

// Returns full grid/column data
// GET https://api.plotly.com/v2/plots/iheartgraphs:90/content?inline_data=true ---> 200 OK

// Returns full grid/column data when requestor doesn't have permission
// to read the referenced grid.
// GET https://api.plotly.com/v2/plots/iheartgraphs:90/content?map_data=unreadable ---> 200 OK
GET /v2/plots?cursor=cD0yMDI0LTA0LTE2KzE5JTNBNDAlM0E1OC40OTc3NjYlMkIwMCUzQTAw&format=api
{ "next": "https://api.plotly.com/v2/plots?cursor=cD0yMDI0LTA0LTE2KzE4JTNBNTMlM0ExNy44NDY2MjQlMkIwMCUzQTAw&format=api", "previous": "https://api.plotly.com/v2/plots?cursor=cj0xJnA9MjAyNC0wNC0xNisxOSUzQTMyJTNBNDEuODgwNzc5JTJCMDAlM0EwMA%3D%3D&format=api", "results": [ { "creation_time": "2024-04-16T19:32:41.880779Z", "comments": { "results": [], "count": 0 }, "parented": true, "embed_url": "https://chart-studio.plotly.com/~simon.verstraete/12.embed", "fid": "simon.verstraete:12", "filename": "Plot 11 copy", "filetype": "plot", "img_url": "https://storage.googleapis.com/plotly-prod-images/simon.verstraete/12/9_G1NMF07YNEIDS6D7CAVDFDQ3OZGAVE.png", "image_urls": { "default": "https://storage.googleapis.com/plotly-prod-images/simon.verstraete/12/2_61DAKA6EL23UV3RL0J6KQ5LXVYHNYZ.png", "block-thumb": "https://storage.googleapis.com/plotly-prod-images/simon.verstraete/12/8_7CIM19UGIYL73EAF7PR8JQFGNZQBTK.png", "list-thumb": "https://storage.googleapis.com/plotly-prod-images/simon.verstraete/12/9_G1NMF07YNEIDS6D7CAVDFDQ3OZGAVE.png" }, "api_urls": { "files": "https://api.plotly.com/v2/files/simon.verstraete:12", "plots": "https://api.plotly.com/v2/plots/simon.verstraete:12", "parent": "https://api.plotly.com/v2/folders/home?user=simon.verstraete" }, "owner": "simon.verstraete", "parent": -1, "preview": "", "referencers": [], "references": [], "title": "", "views": 2, "web_url": "https://chart-studio.plotly.com/~simon.verstraete/12/", "world_readable": true, "date_modified": "2024-04-16T19:32:41.896Z", "stars": { "results": [], "count": 0 }, "collaborators": { "results": [], "count": 0 }, "subfolder_count": null, "refresh_interval": null, "organize_view_url": "https://chart-studio.plotly.com/~simon.verstraete/12/", "current_user_permission": "read", "is_theme": null, "is_template": false, "autosize": true, "caption": "", "figure": { "data": [ { "meta": { "columnNames": { "x": "time", "y": "SS3 powder bed [C]" } }, "mode": "markers", "name": "SS3 powder bed", "type": "scatter", "xsrc": "simon.verstraete:10:a8974e", "ysrc": "simon.verstraete:10:b532e4", "visible": true }, { "meta": { "columnNames": { "x": "time", "y": "SS3 H20C80 [C]" } }, "mode": "markers", "name": "SS3 H20C80", "type": "scatter", "xsrc": "simon.verstraete:10:a8974e", "ysrc": "simon.verstraete:10:cb67b2", "visible": true, "stackgroup": null }, { "meta": { "columnNames": { "x": "time", "y": "SS3 H40C60 [C]" } }, "mode": "markers", "name": "SS3 H40C60", "type": "scatter", "xsrc": "simon.verstraete:10:a8974e", "ysrc": "simon.verstraete:10:4402a6", "visible": "legendonly", "stackgroup": null }, { "meta": { "columnNames": { "x": "time", "y": "SS3 H60C40 [C]" } }, "mode": "markers", "name": "SS3 H60C40", "type": "scatter", "xsrc": "simon.verstraete:10:a8974e", "ysrc": "simon.verstraete:10:17b192", "visible": "legendonly", "stackgroup": null }, { "meta": { "columnNames": { "x": "time", "y": "SS3 H80C20 [C]" } }, "mode": "markers", "name": "SS3 H80C20", "type": "scatter", "xsrc": "simon.verstraete:10:a8974e", "ysrc": "simon.verstraete:10:7bb84d", "visible": "legendonly", "stackgroup": null }, { "meta": { "columnNames": { "x": "time", "y": "SS3 H100 [C]" } }, "mode": "markers", "name": "SS3 H100C0", "type": "scatter", "xsrc": "simon.verstraete:10:a8974e", "ysrc": "simon.verstraete:10:9542a4", "visible": true, "stackgroup": null }, { "meta": { "columnNames": { "x": "time", "y": "SS3 Core 20% [C]" } }, "mode": "markers", "name": "SS3 Core 20", "type": "scatter", "xsrc": "simon.verstraete:10:a8974e", "ysrc": "simon.verstraete:10:961910", "visible": "legendonly", "stackgroup": null }, { "meta": { "columnNames": { "x": "time", "y": "SS3 Core 40% [C]" } }, "mode": "markers", "name": "SS3 Core 40", "type": "scatter", "xsrc": "simon.verstraete:10:a8974e", "ysrc": "simon.verstraete:10:2120f1", "visible": "legendonly", "stackgroup": null }, { "meta": { "columnNames": { "x": "time", "y": "SS3 Core 60% [C]" } }, "mode": "markers", "name": "SS3 Core 60", "type": "scatter", "xsrc": "simon.verstraete:10:a8974e", "ysrc": "simon.verstraete:10:ae1128", "visible": "legendonly", "stackgroup": null }, { "meta": { "columnNames": { "x": "time", "y": "SS3 Core 80% [C]" } }, "mode": "markers", "name": "SS3 Core 80", "type": "scatter", "xsrc": "simon.verstraete:10:a8974e", "ysrc": "simon.verstraete:10:0c4e16", "visible": true, "stackgroup": null }, { "meta": { "columnNames": { "x": "time", "y": "SS3 Hull 100% [C]" } }, "mode": "markers", "name": "SS3 Hull 100", "type": "scatter", "xsrc": "simon.verstraete:10:a8974e", "ysrc": "simon.verstraete:10:59e8fd", "visible": true, "stackgroup": null }, { "meta": { "columnNames": { "x": "time", "y": "SS4 powder bed [C]" } }, "mode": "markers", "name": "SS4 powder ", "type": "scatter", "xsrc": "simon.verstraete:10:a8974e", "ysrc": "simon.verstraete:10:f2c9c1", "visible": "legendonly", "stackgroup": null }, { "meta": { "columnNames": { "x": "time", "y": "SS4 H20C80 [C]" } }, "mode": "markers", "name": "SS4 H20C80", "type": "scatter", "xsrc": "simon.verstraete:10:a8974e", "ysrc": "simon.verstraete:10:91ba35", "visible": "legendonly", "stackgroup": null }, { "meta": { "columnNames": { "x": "time", "y": "SS4 H40C60 [C]" } }, "mode": "markers", "name": "SS4 H40C60", "type": "scatter", "xsrc": "simon.verstraete:10:a8974e", "ysrc": "simon.verstraete:10:207e42", "visible": "legendonly", "stackgroup": null }, { "meta": { "columnNames": { "x": "time", "y": "SS4 H60C40 [C]" } }, "mode": "markers", "name": "SS4 H60C40", "type": "scatter", "xsrc": "simon.verstraete:10:a8974e", "ysrc": "simon.verstraete:10:d2298a", "visible": "legendonly", "stackgroup": null }, { "meta": { "columnNames": { "x": "time", "y": "SS4 H80C20 [C]" } }, "mode": "markers", "name": "SS4 H80C20", "type": "scatter", "xsrc": "simon.verstraete:10:a8974e", "ysrc": "simon.verstraete:10:2f3efb", "visible": "legendonly", "stackgroup": null }, { "meta": { "columnNames": { "x": "time", "y": "SS4 H100 [C]" } }, "mode": "markers", "name": "SS4 H100C0", "type": "scatter", "xsrc": "simon.verstraete:10:a8974e", "ysrc": "simon.verstraete:10:91661f", "visible": "legendonly", "stackgroup": null }, { "meta": { "columnNames": { "x": "time", "y": "SS4 Core 20% [C]" } }, "mode": "markers", "name": "SS4 Core 20", "type": "scatter", "xsrc": "simon.verstraete:10:a8974e", "ysrc": "simon.verstraete:10:057675", "visible": "legendonly", "stackgroup": null }, { "meta": { "columnNames": { "x": "time", "y": "SS4 Core 40% [C]" } }, "mode": "markers", "name": "SS4 Core 40", "type": "scatter", "xsrc": "simon.verstraete:10:a8974e", "ysrc": "simon.verstraete:10:8a1d92", "visible": "legendonly", "stackgroup": null }, { "meta": { "columnNames": { "x": "time", "y": "SS3 Core 60% [C]" } }, "mode": "markers", "name": "SS4 Core 60", "type": "scatter", "xsrc": "simon.verstraete:10:a8974e", "ysrc": "simon.verstraete:10:ae1128", "visible": "legendonly", "stackgroup": null }, { "meta": { "columnNames": { "x": "time", "y": "SS4 Core 80% [C]" } }, "mode": "markers", "name": "SS4 Core 80", "type": "scatter", "xsrc": "simon.verstraete:10:a8974e", "ysrc": "simon.verstraete:10:135385", "visible": "legendonly", "stackgroup": null }, { "meta": { "columnNames": { "x": "time", "y": "SS4 Hull 100% [C]" } }, "mode": "markers", "name": "SS4 Hull 100", "type": "scatter", "xsrc": "simon.verstraete:10:a8974e", "ysrc": "simon.verstraete:10:71bdc8", "visible": "legendonly", "stackgroup": null } ], "frames": [], "layout": { "title": { "x": 0.5, "text": "Average Temperature per area" }, "xaxis": { "type": "linear", "range": [ 461.1627132352941, 476.7446985294118 ], "title": { "text": "Click to enter X axis title" }, "domain": [ 0, 1 ], "autorange": false, "showspikes": false }, "yaxis": { "type": "linear", "range": [ 118.82122818785052, 231.71053654519923 ], "domain": [ 0, 1 ], "autorange": false, "showspikes": false }, "legend": { "x": 0.13442211055276382, "y": 0.020833333333333332, "orientation": "h" }, "autosize": true, "dragmode": "zoom", "template": { "data": { "bar": [ { "type": "bar", "marker": { "colorbar": { "ticks": "", "outlinewidth": 0 } } } ], "table": [ { "type": "table", "cells": { "fill": { "color": "#EBF0F8" }, "line": { "color": "white" } }, "header": { "fill": { "color": "#C8D4E3" }, "line": { "color": "white" } } } ], "carpet": [ { "type": "carpet", "aaxis": { "gridcolor": "#C8D4E3", "linecolor": "#C8D4E3", "endlinecolor": "#2a3f5f", "minorgridcolor": "#C8D4E3", "startlinecolor": "#2a3f5f" }, "baxis": { "gridcolor": "#C8D4E3", "linecolor": "#C8D4E3", "endlinecolor": "#2a3f5f", "minorgridcolor": "#C8D4E3", "startlinecolor": "#2a3f5f" } } ], "mesh3d": [ { "type": "mesh3d", "colorbar": { "ticks": "", "outlinewidth": 0 } } ], "contour": [ { "type": "contour", "colorbar": { "ticks": "", "outlinewidth": 0 }, "autocolorscale": true } ], "heatmap": [ { "type": "heatmap", "colorbar": { "ticks": "", "outlinewidth": 0 }, "autocolorscale": true } ], "scatter": [ { "type": "scatter", "marker": { "colorbar": { "ticks": "", "outlinewidth": 0 } } } ], "surface": [ { "type": "surface", "colorbar": { "ticks": "", "outlinewidth": 0 } } ], "heatmapgl": [ { "type": "heatmapgl", "colorbar": { "ticks": "", "outlinewidth": 0 } } ], "histogram": [ { "type": "histogram", "marker": { "colorbar": { "ticks": "", "outlinewidth": 0 } } } ], "parcoords": [ { "line": { "colorbar": { "ticks": "", "outlinewidth": 0 } }, "type": "parcoords" } ], "scatter3d": [ { "type": "scatter3d", "marker": { "colorbar": { "ticks": "", "outlinewidth": 0 } } } ], "scattergl": [ { "type": "scattergl", "marker": { "colorbar": { "ticks": "", "outlinewidth": 0 } } } ], "choropleth": [ { "type": "choropleth", "colorbar": { "ticks": "", "outlinewidth": 0 } } ], "scattergeo": [ { "type": "scattergeo", "marker": { "colorbar": { "ticks": "", "outlinewidth": 0 } } } ], "histogram2d": [ { "type": "histogram2d", "colorbar": { "ticks": "", "outlinewidth": 0 }, "autocolorscale": true } ], "scatterpolar": [ { "type": "scatterpolar", "marker": { "colorbar": { "ticks": "", "outlinewidth": 0 } } } ], "contourcarpet": [ { "type": "contourcarpet", "colorbar": { "ticks": "", "outlinewidth": 0 } } ], "scattercarpet": [ { "type": "scattercarpet", "marker": { "colorbar": { "ticks": "", "outlinewidth": 0 } } } ], "scattermapbox": [ { "type": "scattermapbox", "marker": { "colorbar": { "ticks": "", "outlinewidth": 0 } } } ], "scatterpolargl": [ { "type": "scatterpolargl", "marker": { "colorbar": { "ticks": "", "outlinewidth": 0 } } } ], "scatterternary": [ { "type": "scatterternary", "marker": { "colorbar": { "ticks": "", "outlinewidth": 0 } } } ], "histogram2dcontour": [ { "type": "histogram2dcontour", "colorbar": { "ticks": "", "outlinewidth": 0 }, "autocolorscale": true } ] }, "layout": { "geo": { "bgcolor": "white", "showland": true, "lakecolor": "white", "landcolor": "white", "showlakes": true, "subunitcolor": "#C8D4E3" }, "font": { "color": "#2a3f5f" }, "polar": { "bgcolor": "white", "radialaxis": { "ticks": "", "gridcolor": "#EBF0F8", "linecolor": "#EBF0F8" }, "angularaxis": { "ticks": "", "gridcolor": "#EBF0F8", "linecolor": "#EBF0F8" } }, "scene": { "xaxis": { "ticks": "", "gridcolor": "#DFE8F3", "gridwidth": 2, "linecolor": "#EBF0F8", "zerolinecolor": "#EBF0F8", "showbackground": true, "backgroundcolor": "white" }, "yaxis": { "ticks": "", "gridcolor": "#DFE8F3", "gridwidth": 2, "linecolor": "#EBF0F8", "zerolinecolor": "#EBF0F8", "showbackground": true, "backgroundcolor": "white" }, "zaxis": { "ticks": "", "gridcolor": "#DFE8F3", "gridwidth": 2, "linecolor": "#EBF0F8", "zerolinecolor": "#EBF0F8", "showbackground": true, "backgroundcolor": "white" } }, "title": { "x": 0.05 }, "xaxis": { "ticks": "", "gridcolor": "#EBF0F8", "linecolor": "#EBF0F8", "automargin": true, "zerolinecolor": "#EBF0F8", "zerolinewidth": 2 }, "yaxis": { "ticks": "", "gridcolor": "#EBF0F8", "linecolor": "#EBF0F8", "automargin": true, "zerolinecolor": "#EBF0F8", "zerolinewidth": 2 }, "ternary": { "aaxis": { "ticks": "", "gridcolor": "#DFE8F3", "linecolor": "#A2B1C6" }, "baxis": { "ticks": "", "gridcolor": "#DFE8F3", "linecolor": "#A2B1C6" }, "caxis": { "ticks": "", "gridcolor": "#DFE8F3", "linecolor": "#A2B1C6" }, "bgcolor": "white" }, "colorway": [ "#636efa", "#EF553B", "#00cc96", "#ab63fa", "#19d3f3", "#e763fa", "#fecb52", "#ffa15a", "#ff6692", "#b6e880" ], "hovermode": "closest", "colorscale": { "diverging": [ [ 0, "#8e0152" ], [ 0.1, "#c51b7d" ], [ 0.2, "#de77ae" ], [ 0.3, "#f1b6da" ], [ 0.4, "#fde0ef" ], [ 0.5, "#f7f7f7" ], [ 0.6, "#e6f5d0" ], [ 0.7, "#b8e186" ], [ 0.8, "#7fbc41" ], [ 0.9, "#4d9221" ], [ 1, "#276419" ] ], "sequential": [ [ 0, "#0508b8" ], [ 0.0893854748603352, "#1910d8" ], [ 0.1787709497206704, "#3c19f0" ], [ 0.2681564245810056, "#6b1cfb" ], [ 0.3575418994413408, "#981cfd" ], [ 0.44692737430167595, "#bf1cfd" ], [ 0.5363128491620112, "#dd2bfd" ], [ 0.6256983240223464, "#f246fe" ], [ 0.7150837988826816, "#fc67fd" ], [ 0.8044692737430168, "#fe88fc" ], [ 0.8938547486033519, "#fea5fd" ], [ 0.9832402234636871, "#febefe" ], [ 1, "#fec3fe" ] ], "sequentialminus": [ [ 0, "#0508b8" ], [ 0.0893854748603352, "#1910d8" ], [ 0.1787709497206704, "#3c19f0" ], [ 0.2681564245810056, "#6b1cfb" ], [ 0.3575418994413408, "#981cfd" ], [ 0.44692737430167595, "#bf1cfd" ], [ 0.5363128491620112, "#dd2bfd" ], [ 0.6256983240223464, "#f246fe" ], [ 0.7150837988826816, "#fc67fd" ], [ 0.8044692737430168, "#fe88fc" ], [ 0.8938547486033519, "#fea5fd" ], [ 0.9832402234636871, "#febefe" ], [ 1, "#fec3fe" ] ] }, "plot_bgcolor": "white", "paper_bgcolor": "white", "shapedefaults": { "line": { "width": 0 }, "opacity": 0.4, "fillcolor": "#506784" }, "annotationdefaults": { "arrowhead": 0, "arrowcolor": "#506784", "arrowwidth": 1 } }, "themeRef": "PLOTLY_WHITE" }, "hovermode": "x" } }, "height": null, "width": null, "user": { "profile_url": "https://chart-studio.plotly.com/~simon.verstraete", "avatar_url": "https://storage.googleapis.com/plotly-prod-profiles/98.jpg", "background_url": "https://storage.googleapis.com/plotly-prod-profiles/bg-14.jpg", "bio": "", "nickname": "", "website": "", "stream_tokens": null, "feature_set_id": null, "csrf_token": null, "date_joined": "2024-03-31 22:00:20", "mapbox_access_tokens": null, "has_password": null, "username": "simon.verstraete", "email": null, "is_active": null, "readonly": null, "is_dash_creator": null, "dash_created_count": null, "is_chart_creator": null, "charts_created_count": null } }, { "creation_time": "2024-04-16T19:30:53.488346Z", "comments": { "results": [], "count": 0 }, "parented": true, "embed_url": "https://chart-studio.plotly.com/~blobby123/3.embed", "fid": "blobby123:3", "filename": "600kHz dis", "filetype": "plot", "img_url": "https://storage.googleapis.com/plotly-prod-images/blobby123/3/9_395K1ZFQ0XJ01OQJRF4P5MSOPG77NY.png", "image_urls": { "default": "https://storage.googleapis.com/plotly-prod-images/blobby123/3/2_H08S3LC34331QKE1QVTDDXK9XP2Z08.png", "block-thumb": "https://storage.googleapis.com/plotly-prod-images/blobby123/3/8_X7D4ZACNJ9U926OBTSG0E0Q9CYYG69.png", "list-thumb": "https://storage.googleapis.com/plotly-prod-images/blobby123/3/9_395K1ZFQ0XJ01OQJRF4P5MSOPG77NY.png" }, "api_urls": { "files": "https://api.plotly.com/v2/files/blobby123:3", "plots": "https://api.plotly.com/v2/plots/blobby123:3", "parent": "https://api.plotly.com/v2/folders/home?user=blobby123" }, "owner": "blobby123", "parent": -1, "preview": "", "referencers": [], "references": [], "title": "", "views": 1, "web_url": "https://chart-studio.plotly.com/~blobby123/3/", "world_readable": true, "date_modified": "2024-04-16T19:30:53.499Z", "stars": { "results": [], "count": 0 }, "collaborators": { "results": [], "count": 0 }, "subfolder_count": null, "refresh_interval": null, "organize_view_url": "https://chart-studio.plotly.com/~blobby123/3/", "current_user_permission": "read", "is_theme": null, "is_template": false, "autosize": true, "caption": "", "figure": { "data": [ { "uid": "2b9b93", "meta": { "columnNames": { "x": "A", "y": "B" } }, "mode": "markers", "type": "scatter", "xsrc": "blobby123:2:9106c7", "ysrc": "blobby123:2:c347a1", "marker": { "color": "rgb(88, 89, 93)", "symbol": "x-thin-open" } }, { "uid": "7dd4ba", "line": { "color": "rgb(13, 52, 203)", "width": 2 }, "opacity": 1, "transforms": [ { "rms": 19.091467386873553, "type": "fit", "xmid": 599.9999999999989, "ymid": 16.666666666904348, "inputUid": "2b9b93", "regressor": "x", "parameters": [ { "hold": false, "name": "m", "error": 1.0000000000010874, "value": -134.00000000000904 }, { "hold": false, "name": "b", "error": 595.0098038414598, "value": 80400.00000000537 } ], "regressand": "y", "correlation": 0.99961047467493, "fitfunction": "m*x + b", "inputxrange": [ 590, 600 ], "outputxrange": [ 580, 620 ], "interpolation": 50 } ] }, { "uid": "f933b7", "opacity": 0.35, "transforms": [ { "type": "moving-average", "inputUid": "2b9b93", "windowlength": 1 } ] } ], "frames": [], "layout": { "title": { "text": "600 kHz Foster-Seeley Discriminator Frequency Response" }, "xaxis": { "type": "linear", "dtick": 10, "range": [ 566.1300708306503, 633.8699291693497 ], "title": { "text": "Frequency (kHz)" }, "nticks": 0, "showline": true, "tickmode": "linear", "autorange": true, "gridwidth": 1, "showspikes": true, "rangeslider": { "range": [ 566.1971830985915, 633.8028169014085 ], "yaxis": {}, "visible": false, "autorange": true }, "spikethickness": 1 }, "yaxis": { "type": "linear", "dtick": 500, "range": [ -1500, 2600 ], "title": { "text": "Voltage (mV)" }, "tickmode": "linear", "autorange": false, "spikethickness": 1 }, "shapes": [ { "x0": 584.6142949130714, "x1": 602.6142949130715, "y0": -320.1489001691065, "y1": -318.9396503101107, "line": { "dash": "dot", "color": "rgb(20, 19, 19)", "width": 1 }, "type": "line", "xref": "x", "opacity": 1, "visible": true, "fillcolor": "rgb(25, 22, 22)" }, { "x0": 585, "x1": 585, "y0": 1800, "y1": -320, "line": { "dash": "dot", "color": "rgb(0, 0, 0)", "width": 1 }, "type": "line", "opacity": 0.76, "fillcolor": "rgb(0, 0, 0)" } ], "autosize": true, "template": { "data": { "bar": [ { "type": "bar", "marker": { "colorbar": { "ticks": "", "outlinewidth": 0 } } } ], "table": [ { "type": "table", "cells": { "fill": { "color": "#EBF0F8" }, "line": { "color": "white" } }, "header": { "fill": { "color": "#C8D4E3" }, "line": { "color": "white" } } } ], "carpet": [ { "type": "carpet", "aaxis": { "gridcolor": "#C8D4E3", "linecolor": "#C8D4E3", "endlinecolor": "#2a3f5f", "minorgridcolor": "#C8D4E3", "startlinecolor": "#2a3f5f" }, "baxis": { "gridcolor": "#C8D4E3", "linecolor": "#C8D4E3", "endlinecolor": "#2a3f5f", "minorgridcolor": "#C8D4E3", "startlinecolor": "#2a3f5f" } } ], "mesh3d": [ { "type": "mesh3d", "colorbar": { "ticks": "", "outlinewidth": 0 } } ], "contour": [ { "type": "contour", "colorbar": { "ticks": "", "outlinewidth": 0 }, "autocolorscale": true } ], "heatmap": [ { "type": "heatmap", "colorbar": { "ticks": "", "outlinewidth": 0 }, "autocolorscale": true } ], "scatter": [ { "type": "scatter", "marker": { "colorbar": { "ticks": "", "outlinewidth": 0 } } } ], "surface": [ { "type": "surface", "colorbar": { "ticks": "", "outlinewidth": 0 } } ], "heatmapgl": [ { "type": "heatmapgl", "colorbar": { "ticks": "", "outlinewidth": 0 } } ], "histogram": [ { "type": "histogram", "marker": { "colorbar": { "ticks": "", "outlinewidth": 0 } } } ], "parcoords": [ { "line": { "colorbar": { "ticks": "", "outlinewidth": 0 } }, "type": "parcoords" } ], "scatter3d": [ { "type": "scatter3d", "marker": { "colorbar": { "ticks": "", "outlinewidth": 0 } } } ], "scattergl": [ { "type": "scattergl", "marker": { "colorbar": { "ticks": "", "outlinewidth": 0 } } } ], "choropleth": [ { "type": "choropleth", "colorbar": { "ticks": "", "outlinewidth": 0 } } ], "scattergeo": [ { "type": "scattergeo", "marker": { "colorbar": { "ticks": "", "outlinewidth": 0 } } } ], "histogram2d": [ { "type": "histogram2d", "colorbar": { "ticks": "", "outlinewidth": 0 }, "autocolorscale": true } ], "scatterpolar": [ { "type": "scatterpolar", "marker": { "colorbar": { "ticks": "", "outlinewidth": 0 } } } ], "contourcarpet": [ { "type": "contourcarpet", "colorbar": { "ticks": "", "outlinewidth": 0 } } ], "scattercarpet": [ { "type": "scattercarpet", "marker": { "colorbar": { "ticks": "", "outlinewidth": 0 } } } ], "scattermapbox": [ { "type": "scattermapbox", "marker": { "colorbar": { "ticks": "", "outlinewidth": 0 } } } ], "scatterpolargl": [ { "type": "scatterpolargl", "marker": { "colorbar": { "ticks": "", "outlinewidth": 0 } } } ], "scatterternary": [ { "type": "scatterternary", "marker": { "colorbar": { "ticks": "", "outlinewidth": 0 } } } ], "histogram2dcontour": [ { "type": "histogram2dcontour", "colorbar": { "ticks": "", "outlinewidth": 0 }, "autocolorscale": true } ] }, "layout": { "geo": { "bgcolor": "white", "showland": true, "lakecolor": "white", "landcolor": "white", "showlakes": true, "subunitcolor": "#C8D4E3" }, "font": { "color": "#2a3f5f" }, "polar": { "bgcolor": "white", "radialaxis": { "ticks": "", "gridcolor": "#EBF0F8", "linecolor": "#EBF0F8" }, "angularaxis": { "ticks": "", "gridcolor": "#EBF0F8", "linecolor": "#EBF0F8" } }, "scene": { "xaxis": { "ticks": "", "gridcolor": "#DFE8F3", "gridwidth": 2, "linecolor": "#EBF0F8", "zerolinecolor": "#EBF0F8", "showbackground": true, "backgroundcolor": "white" }, "yaxis": { "ticks": "", "gridcolor": "#DFE8F3", "gridwidth": 2, "linecolor": "#EBF0F8", "zerolinecolor": "#EBF0F8", "showbackground": true, "backgroundcolor": "white" }, "zaxis": { "ticks": "", "gridcolor": "#DFE8F3", "gridwidth": 2, "linecolor": "#EBF0F8", "zerolinecolor": "#EBF0F8", "showbackground": true, "backgroundcolor": "white" } }, "title": { "x": 0.05 }, "xaxis": { "ticks": "", "gridcolor": "#EBF0F8", "linecolor": "#EBF0F8", "automargin": true, "zerolinecolor": "#EBF0F8", "zerolinewidth": 2 }, "yaxis": { "ticks": "", "gridcolor": "#EBF0F8", "linecolor": "#EBF0F8", "automargin": true, "zerolinecolor": "#EBF0F8", "zerolinewidth": 2 }, "ternary": { "aaxis": { "ticks": "", "gridcolor": "#DFE8F3", "linecolor": "#A2B1C6" }, "baxis": { "ticks": "", "gridcolor": "#DFE8F3", "linecolor": "#A2B1C6" }, "caxis": { "ticks": "", "gridcolor": "#DFE8F3", "linecolor": "#A2B1C6" }, "bgcolor": "white" }, "colorway": [ "#636efa", "#EF553B", "#00cc96", "#ab63fa", "#19d3f3", "#e763fa", "#fecb52", "#ffa15a", "#ff6692", "#b6e880" ], "hovermode": "closest", "colorscale": { "diverging": [ [ 0, "#8e0152" ], [ 0.1, "#c51b7d" ], [ 0.2, "#de77ae" ], [ 0.3, "#f1b6da" ], [ 0.4, "#fde0ef" ], [ 0.5, "#f7f7f7" ], [ 0.6, "#e6f5d0" ], [ 0.7, "#b8e186" ], [ 0.8, "#7fbc41" ], [ 0.9, "#4d9221" ], [ 1, "#276419" ] ], "sequential": [ [ 0, "#0508b8" ], [ 0.0893854748603352, "#1910d8" ], [ 0.1787709497206704, "#3c19f0" ], [ 0.2681564245810056, "#6b1cfb" ], [ 0.3575418994413408, "#981cfd" ], [ 0.44692737430167595, "#bf1cfd" ], [ 0.5363128491620112, "#dd2bfd" ], [ 0.6256983240223464, "#f246fe" ], [ 0.7150837988826816, "#fc67fd" ], [ 0.8044692737430168, "#fe88fc" ], [ 0.8938547486033519, "#fea5fd" ], [ 0.9832402234636871, "#febefe" ], [ 1, "#fec3fe" ] ], "sequentialminus": [ [ 0, "#0508b8" ], [ 0.0893854748603352, "#1910d8" ], [ 0.1787709497206704, "#3c19f0" ], [ 0.2681564245810056, "#6b1cfb" ], [ 0.3575418994413408, "#981cfd" ], [ 0.44692737430167595, "#bf1cfd" ], [ 0.5363128491620112, "#dd2bfd" ], [ 0.6256983240223464, "#f246fe" ], [ 0.7150837988826816, "#fc67fd" ], [ 0.8044692737430168, "#fe88fc" ], [ 0.8938547486033519, "#fea5fd" ], [ 0.9832402234636871, "#febefe" ], [ 1, "#fec3fe" ] ] }, "plot_bgcolor": "white", "paper_bgcolor": "white", "shapedefaults": { "line": { "width": 0 }, "opacity": 0.4, "fillcolor": "#506784" }, "annotationdefaults": { "arrowhead": 0, "arrowcolor": "#506784", "arrowwidth": 1 } }, "themeRef": "PLOTLY_WHITE" }, "annotations": [ { "x": 595.1062459755312, "y": 779.4416243654822, "ax": 69, "ay": -39, "font": { "size": 11 }, "text": "Gradient = 135mV/kHz", "arrowhead": 1, "arrowcolor": "rgb(179, 12, 247)", "arrowwidth": 2 }, { "x": 592.6889890534449, "y": -456.4771573604062, "ax": -1, "ay": 28, "font": { "size": 11 }, "text": "Linear Region", "arrowhead": 1 } ] } }, "height": null, "width": null, "user": { "profile_url": "https://chart-studio.plotly.com/~blobby123", "avatar_url": "https://storage.googleapis.com/plotly-prod-profiles/44.jpg", "background_url": "https://storage.googleapis.com/plotly-prod-profiles/bg-1.jpg", "bio": "", "nickname": "", "website": "", "stream_tokens": null, "feature_set_id": null, "csrf_token": null, "date_joined": "2024-03-20 21:33:30", "mapbox_access_tokens": null, "has_password": null, "username": "blobby123", "email": null, "is_active": null, "readonly": null, "is_dash_creator": null, "dash_created_count": null, "is_chart_creator": null, "charts_created_count": null } }, { "creation_time": "2024-04-16T19:13:03.395396Z", "comments": { "results": [], "count": 0 }, "parented": true, "embed_url": "https://chart-studio.plotly.com/~CorrinFlajole/1.embed", "fid": "CorrinFlajole:1", "filename": "FMEA RPN", "filetype": "plot", "img_url": "https://storage.googleapis.com/plotly-prod-images/CorrinFlajole/1/9_5RE2GU3OEYFKP1IYJFS0E1EFDA05KD.png", "image_urls": { "default": "https://storage.googleapis.com/plotly-prod-images/CorrinFlajole/1/2_VP3DN4PE5ZXEJ1R318ZTYZNV6PHQ27.png", "block-thumb": "https://storage.googleapis.com/plotly-prod-images/CorrinFlajole/1/8_DW9LVJT4CXPVBU9ZVQKIAGTRK5YMOW.png", "list-thumb": "https://storage.googleapis.com/plotly-prod-images/CorrinFlajole/1/9_5RE2GU3OEYFKP1IYJFS0E1EFDA05KD.png" }, "api_urls": { "files": "https://api.plotly.com/v2/files/CorrinFlajole:1", "plots": "https://api.plotly.com/v2/plots/CorrinFlajole:1", "parent": "https://api.plotly.com/v2/folders/home?user=CorrinFlajole" }, "owner": "CorrinFlajole", "parent": -1, "preview": "", "referencers": [], "references": [], "title": "", "views": 1, "web_url": "https://chart-studio.plotly.com/~CorrinFlajole/1/", "world_readable": true, "date_modified": "2024-04-16T19:13:03.428Z", "stars": { "results": [], "count": 0 }, "collaborators": { "results": [], "count": 0 }, "subfolder_count": null, "refresh_interval": null, "organize_view_url": "https://chart-studio.plotly.com/~CorrinFlajole/1/", "current_user_permission": "read", "is_theme": null, "is_template": false, "autosize": true, "caption": "", "figure": { "data": [ { "line": { "color": "black", "width": 3 }, "meta": { "columnNames": { "x": "x", "y": "y", "z": "z" } }, "mode": "markers", "type": "scatter3d", "xsrc": "CorrinFlajole:0:6a1073", "ysrc": "CorrinFlajole:0:bf713b", "zsrc": "CorrinFlajole:0:883730", "marker": { "cmax": 12.566370614359172, "cmin": 0, "meta": { "columnNames": { "color": "z" } }, "size": 6, "cauto": true, "colorsrc": "CorrinFlajole:0:883730", "showscale": true, "colorscale": [ [ 0, "#2a3f5f" ], [ 0.2, "#A2B1C6" ], [ 0.4, "#0D76BF" ], [ 0.6, "#00cc96" ], [ 0.8, "#e6915a" ], [ 1, "#EF553B" ] ], "reversescale": false, "autocolorscale": false } } ], "frames": [], "layout": { "scene": { "xaxis": { "type": "linear", "dtick": 0.5, "range": [ -1.062371495440084, 1.0624961059224267 ], "tick0": 0, "title": { "font": { "family": "Times New Roman" }, "text": "X" }, "nticks": 0, "showgrid": true, "showline": false, "tickmode": "auto", "zeroline": false, "autorange": true, "rangemode": "normal", "showbackground": false }, "yaxis": { "type": "linear", "dtick": 0.5, "range": [ -1.062466899825041, 1.062466899825041 ], "tick0": 0, "title": { "font": { "family": "Times New Roman" }, "text": "Y" }, "nticks": 0, "showgrid": true, "tickmode": "auto", "zeroline": false, "autorange": true, "rangemode": "normal" }, "zaxis": { "type": "linear", "dtick": 2, "range": [ -0.39269908169872414, 12.959069696057897 ], "tick0": 0, "title": { "font": { "family": "Arial" }, "text": "Z" }, "nticks": 0, "showgrid": true, "tickmode": "auto", "zeroline": false, "autorange": true, "rangemode": "normal" }, "camera": { "up": { "x": 0.0017045320568406734, "y": 0.0004945057705001982, "z": 0.9999984250160148 }, "eye": { "x": -1.8685055335311473, "y": 0.927629491186675, "z": 0.7197847352352821 }, "center": { "x": -0.06730366801455645, "y": 0.003160699639236597, "z": -0.07369645044279083 }, "projection": { "type": "perspective" } }, "dragmode": "zoom", "aspectmode": "auto", "aspectratio": { "x": 1.0000000000000002, "y": 1.0000000000000002, "z": 1.0000000000000002 } }, "title": { "text": "Risk Priority Number" }, "margin": { "t": 100 }, "autosize": true, "dragmode": "zoom", "showlegend": false } }, "height": null, "width": null, "user": { "profile_url": "https://chart-studio.plotly.com/~CorrinFlajole", "avatar_url": "https://storage.googleapis.com/plotly-prod-profiles/45.jpg", "background_url": "https://storage.googleapis.com/plotly-prod-profiles/bg-6.jpg", "bio": "", "nickname": "", "website": "", "stream_tokens": null, "feature_set_id": null, "csrf_token": null, "date_joined": "2024-04-16 19:00:14", "mapbox_access_tokens": null, "has_password": null, "username": "CorrinFlajole", "email": null, "is_active": null, "readonly": null, "is_dash_creator": null, "dash_created_count": null, "is_chart_creator": null, "charts_created_count": null } }, { "creation_time": "2024-04-16T19:11:47.728591Z", "comments": { "results": [], "count": 0 }, "parented": true, "embed_url": "https://chart-studio.plotly.com/~utnosmas/13.embed", "fid": "utnosmas:13", "filename": "NYU_new_renter", "filetype": "plot", "img_url": "https://storage.googleapis.com/plotly-prod-images/utnosmas/13/9_RUKO7IB33R7O3FSKCVGWWBLZXNMZ8P.png", "image_urls": { "default": "https://storage.googleapis.com/plotly-prod-images/utnosmas/13/2_UTIPYS26LJULGSFJDNR5A945HV0HI9.png", "block-thumb": "https://storage.googleapis.com/plotly-prod-images/utnosmas/13/8_CGZZZP2PB0IEYZXUBCQ6NMDAN4UMBQ.png", "list-thumb": "https://storage.googleapis.com/plotly-prod-images/utnosmas/13/9_RUKO7IB33R7O3FSKCVGWWBLZXNMZ8P.png" }, "api_urls": { "files": "https://api.plotly.com/v2/files/utnosmas:13", "plots": "https://api.plotly.com/v2/plots/utnosmas:13", "parent": "https://api.plotly.com/v2/folders/home?user=utnosmas" }, "owner": "utnosmas", "parent": -1, "preview": "", "referencers": [], "references": [], "title": "", "views": 746, "web_url": "https://chart-studio.plotly.com/~utnosmas/13/", "world_readable": true, "date_modified": "2024-04-21T01:11:30.072Z", "stars": { "results": [], "count": 0 }, "collaborators": { "results": [], "count": 0 }, "subfolder_count": null, "refresh_interval": null, "organize_view_url": "https://chart-studio.plotly.com/~utnosmas/13/", "current_user_permission": "read", "is_theme": null, "is_template": false, "autosize": true, "caption": "", "figure": { "data": [ { "line": { "dash": "solid", "color": "rgba(109,109,109,1)", "width": 3.7795275590551185 }, "meta": { "columnNames": { "x": "data.1.x-d7b813d94124", "y": "data.1.y-d7b81c43acaa", "text": "data.1.text-d7b81efcdb65" } }, "mode": "lines", "name": "Control", "type": "scatter", "xsrc": "utnosmas:12:ccd91a", "ysrc": "utnosmas:12:5c8065", "frame": null, "xaxis": "x", "yaxis": "y", "hoveron": "points", "textsrc": "utnosmas:12:a0e9bb", "hoverinfo": "text", "showlegend": true, "legendgroup": "Control" }, { "line": { "dash": "solid", "color": "rgba(137,0,225,1)", "width": 3.7795275590551185 }, "meta": { "columnNames": { "x": "data.2.x-d7b86aa7d3c7", "y": "data.2.y-d7b83040e485", "text": "data.2.text-d7b8745af082" } }, "mode": "lines", "name": "NYU", "type": "scatter", "xsrc": "utnosmas:12:be5c97", "ysrc": "utnosmas:12:edfcd7", "frame": null, "xaxis": "x", "yaxis": "y", "hoveron": "points", "textsrc": "utnosmas:12:9c7e7b", "hoverinfo": "text", "showlegend": true, "legendgroup": "NYU" }, { "fill": "toself", "line": { "dash": "solid", "color": "transparent", "width": 3.7795275590551185 }, "meta": { "columnNames": { "x": "data.3.x-d7b87e64227b", "y": "data.3.y-d7b86013fa10", "text": "data.3.text-d7b83f8661b7" } }, "mode": "lines", "name": "Control", "type": "scatter", "xsrc": "utnosmas:12:d09841", "ysrc": "utnosmas:12:44bc4f", "frame": null, "xaxis": "x", "yaxis": "y", "hoveron": "points", "textsrc": "utnosmas:12:edeaa2", "fillcolor": "rgba(153,153,153,0.4)", "hoverinfo": "x+y", "showlegend": false, "legendgroup": "Control" }, { "fill": "toself", "line": { "dash": "solid", "color": "transparent", "width": 3.7795275590551185 }, "meta": { "columnNames": { "x": "data.4.x-d7b8f7955f6", "y": "data.4.y-d7b866fa9169", "text": "data.4.text-d7b84c60b950" } }, "mode": "lines", "name": "NYU", "type": "scatter", "xsrc": "utnosmas:12:db1f5a", "ysrc": "utnosmas:12:6744d1", "frame": null, "xaxis": "x", "yaxis": "y", "hoveron": "points", "textsrc": "utnosmas:12:074167", "fillcolor": "rgba(153,153,153,0.4)", "hoverinfo": "x+y", "showlegend": false, "legendgroup": "NYU" } ], "frames": [], "layout": { "font": { "size": 19.925280199252807, "color": "rgba(0, 0, 0, 1)", "family": "" }, "title": { "x": 0, "font": { "size": 23.910336239103366, "color": "rgba(0, 0, 0, 1)", "family": "" }, "text": "Percentage of New Renters", "xref": "paper" }, "xaxis": { "type": "linear", "range": [ 2017.8, 2022.2 ], "ticks": "outside", "title": { "font": { "size": 19.925280199252807, "color": "rgba(0, 0, 0, 1)", "family": "" }, "text": "Year" }, "anchor": "y", "domain": [ 0, 1 ], "nticks": null, "ticklen": 4.981320049813202, "showgrid": true, "showline": false, "tickfont": { "size": 15.940224159402243, "color": "rgba(77,77,77,1)", "family": "" }, "tickmode": "array", "ticktext": [ "2018", "2019", "2020", "2021", "2022" ], "tickvals": [ 2018, 2019, 2020, 2021, 2022 ], "zeroline": false, "autorange": false, "gridcolor": "rgba(255,255,255,1)", "gridwidth": 0.9056945545114912, "linecolor": null, "linewidth": 0, "tickangle": 0, "tickcolor": "rgba(51,51,51,1)", "tickwidth": 0.9056945545114912, "automargin": true, "hoverformat": ".2f", "categoryarray": [ "2018", "2019", "2020", "2021", "2022" ], "categoryorder": "array", "showticklabels": true }, "yaxis": { "type": "linear", "range": [ -0.75, 15.75 ], "ticks": "outside", "title": { "font": { "size": 19.925280199252807, "color": "rgba(0, 0, 0, 1)", "family": "" }, "text": "Percentage of New Renters" }, "anchor": "x", "domain": [ 0, 1 ], "nticks": null, "ticklen": 4.981320049813202, "showgrid": true, "showline": false, "tickfont": { "size": 15.940224159402248, "color": "rgba(77,77,77,1)", "family": "" }, "tickmode": "array", "ticktext": [ "0", "5", "10", "15" ], "tickvals": [ 0, 5, 10, 15 ], "zeroline": false, "autorange": false, "gridcolor": "rgba(255,255,255,1)", "gridwidth": 0.9056945545114912, "linecolor": null, "linewidth": 0, "tickangle": 0, "tickcolor": "rgba(51,51,51,1)", "tickwidth": 0.9056945545114912, "automargin": true, "hoverformat": ".2f", "categoryarray": [ "0", "5", "10", "15" ], "categoryorder": "array", "showticklabels": true }, "legend": { "font": { "size": 15.940224159402243, "color": "rgba(0, 0, 0, 1)", "family": "" }, "title": { "font": { "size": 19.925280199252807, "color": "rgba(0, 0, 0, 1)", "family": "" }, "text": "Treatment" }, "bgcolor": "rgba(255,255,255,1)", "bordercolor": "transparent", "borderwidth": 2.5769506084466722 }, "margin": { "b": 51.33286407854604, "l": 50.80946450809466, "r": 9.962640099626404, "t": 50.39637590918116 }, "shapes": [ { "x0": 0, "x1": 1, "y0": 0, "y1": 1, "line": { "color": null, "width": 0, "linetype": [] }, "type": "rect", "xref": "paper", "yref": "paper", "fillcolor": null } ], "barmode": "relative", "hovermode": "closest", "showlegend": true, "plot_bgcolor": "rgba(235,235,235,1)", "paper_bgcolor": "rgba(255,255,255,1)" } }, "height": null, "width": null, "user": { "profile_url": "https://chart-studio.plotly.com/~utnosmas", "avatar_url": "https://storage.googleapis.com/plotly-prod-profiles/97.jpg", "background_url": "https://storage.googleapis.com/plotly-prod-profiles/bg-14.jpg", "bio": "", "nickname": "", "website": "", "stream_tokens": null, "feature_set_id": null, "csrf_token": null, "date_joined": "2024-04-15 23:27:41", "mapbox_access_tokens": null, "has_password": null, "username": "utnosmas", "email": null, "is_active": null, "readonly": null, "is_dash_creator": null, "dash_created_count": null, "is_chart_creator": null, "charts_created_count": null } }, { "creation_time": "2024-04-16T19:07:18.971294Z", "comments": { "results": [], "count": 0 }, "parented": true, "embed_url": "https://chart-studio.plotly.com/~marantrod/39.embed", "fid": "marantrod:39", "filename": "Plot 39", "filetype": "plot", "img_url": "https://storage.googleapis.com/plotly-prod-images/marantrod/39/9_U1QSQH47TG9UCYFSVIV8JDSQUZS196.png", "image_urls": { "default": "https://storage.googleapis.com/plotly-prod-images/marantrod/39/2_9QPSP8PXBWU19FGKY4CV7P9TGFIYRL.png", "block-thumb": "https://storage.googleapis.com/plotly-prod-images/marantrod/39/8_4KRXHO5U1XVNG09NH64Q8OPPLHM2GN.png", "list-thumb": "https://storage.googleapis.com/plotly-prod-images/marantrod/39/9_U1QSQH47TG9UCYFSVIV8JDSQUZS196.png" }, "api_urls": { "files": "https://api.plotly.com/v2/files/marantrod:39", "plots": "https://api.plotly.com/v2/plots/marantrod:39", "parent": "https://api.plotly.com/v2/folders/home?user=marantrod" }, "owner": "marantrod", "parent": -1, "preview": "", "referencers": [], "references": [], "title": "", "views": 1, "web_url": "https://chart-studio.plotly.com/~marantrod/39/", "world_readable": true, "date_modified": "2024-04-16T19:07:18.981Z", "stars": { "results": [], "count": 0 }, "collaborators": { "results": [], "count": 0 }, "subfolder_count": null, "refresh_interval": null, "organize_view_url": "https://chart-studio.plotly.com/~marantrod/39/", "current_user_permission": "read", "is_theme": null, "is_template": false, "autosize": true, "caption": "", "figure": { "data": [ { "meta": { "columnNames": { "x": "Árticulo", "y": "1" } }, "mode": "markers", "name": "IA", "type": "bar", "xsrc": "marantrod:38:f220d9", "ysrc": "marantrod:38:73f5e2", "visible": true, "showlegend": true, "orientation": "v" }, { "meta": { "columnNames": { "x": "Árticulo", "y": "2" } }, "name": "Sensores y percepción computacional ", "type": "bar", "xsrc": "marantrod:38:f220d9", "ysrc": "marantrod:38:c119ac", "visible": true, "orientation": "v" }, { "meta": { "columnNames": { "x": "Árticulo", "y": "3" } }, "name": "HCI", "type": "bar", "xsrc": "marantrod:38:f220d9", "ysrc": "marantrod:38:98a213", "visible": true, "orientation": "v" }, { "meta": { "columnNames": { "x": "Árticulo", "y": "4" } }, "name": "IoT y dispositivos portátiles ", "type": "bar", "xsrc": "marantrod:38:f220d9", "ysrc": "marantrod:38:c5b94e", "visible": true, "orientation": "v" }, { "meta": { "columnNames": { "x": "Árticulo", "y": "5" } }, "name": "Procesamiento de señales y visión por computadora", "type": "bar", "xsrc": "marantrod:38:f220d9", "ysrc": "marantrod:38:947f7e", "visible": true, "orientation": "v" }, { "meta": { "columnNames": { "x": "Árticulo", "y": "6" } }, "name": "Aplicaciones móviles y plataformas interactivas", "type": "bar", "xsrc": "marantrod:38:f220d9", "ysrc": "marantrod:38:c20a1d", "visible": true, "orientation": "v" } ], "frames": [], "layout": { "xaxis": { "type": "category", "range": [ -0.5, 30.5 ], "autorange": false }, "yaxis": { "type": "linear", "range": [ -0.13637332196888982, 8.284679309610057 ], "autorange": false }, "legend": { "x": 0.7417433231983849, "y": 0.9696356275303644, "valign": "top" }, "barmode": "relative", "barnorm": "", "autosize": true, "dragmode": "pan", "template": { "data": { "bar": [ { "type": "bar", "marker": { "colorbar": { "ticks": "", "outlinewidth": 0 } } } ], "table": [ { "type": "table", "cells": { "fill": { "color": "#EBF0F8" }, "line": { "color": "white" } }, "header": { "fill": { "color": "#C8D4E3" }, "line": { "color": "white" } } } ], "carpet": [ { "type": "carpet", "aaxis": { "gridcolor": "#C8D4E3", "linecolor": "#C8D4E3", "endlinecolor": "#2a3f5f", "minorgridcolor": "#C8D4E3", "startlinecolor": "#2a3f5f" }, "baxis": { "gridcolor": "#C8D4E3", "linecolor": "#C8D4E3", "endlinecolor": "#2a3f5f", "minorgridcolor": "#C8D4E3", "startlinecolor": "#2a3f5f" } } ], "mesh3d": [ { "type": "mesh3d", "colorbar": { "ticks": "", "outlinewidth": 0 } } ], "contour": [ { "type": "contour", "colorbar": { "ticks": "", "outlinewidth": 0 }, "autocolorscale": true } ], "heatmap": [ { "type": "heatmap", "colorbar": { "ticks": "", "outlinewidth": 0 }, "autocolorscale": true } ], "scatter": [ { "type": "scatter", "marker": { "colorbar": { "ticks": "", "outlinewidth": 0 } } } ], "surface": [ { "type": "surface", "colorbar": { "ticks": "", "outlinewidth": 0 } } ], "heatmapgl": [ { "type": "heatmapgl", "colorbar": { "ticks": "", "outlinewidth": 0 } } ], "histogram": [ { "type": "histogram", "marker": { "colorbar": { "ticks": "", "outlinewidth": 0 } } } ], "parcoords": [ { "line": { "colorbar": { "ticks": "", "outlinewidth": 0 } }, "type": "parcoords" } ], "scatter3d": [ { "type": "scatter3d", "marker": { "colorbar": { "ticks": "", "outlinewidth": 0 } } } ], "scattergl": [ { "type": "scattergl", "marker": { "colorbar": { "ticks": "", "outlinewidth": 0 } } } ], "choropleth": [ { "type": "choropleth", "colorbar": { "ticks": "", "outlinewidth": 0 } } ], "scattergeo": [ { "type": "scattergeo", "marker": { "colorbar": { "ticks": "", "outlinewidth": 0 } } } ], "histogram2d": [ { "type": "histogram2d", "colorbar": { "ticks": "", "outlinewidth": 0 }, "autocolorscale": true } ], "scatterpolar": [ { "type": "scatterpolar", "marker": { "colorbar": { "ticks": "", "outlinewidth": 0 } } } ], "contourcarpet": [ { "type": "contourcarpet", "colorbar": { "ticks": "", "outlinewidth": 0 } } ], "scattercarpet": [ { "type": "scattercarpet", "marker": { "colorbar": { "ticks": "", "outlinewidth": 0 } } } ], "scattermapbox": [ { "type": "scattermapbox", "marker": { "colorbar": { "ticks": "", "outlinewidth": 0 } } } ], "scatterpolargl": [ { "type": "scatterpolargl", "marker": { "colorbar": { "ticks": "", "outlinewidth": 0 } } } ], "scatterternary": [ { "type": "scatterternary", "marker": { "colorbar": { "ticks": "", "outlinewidth": 0 } } } ], "histogram2dcontour": [ { "type": "histogram2dcontour", "colorbar": { "ticks": "", "outlinewidth": 0 }, "autocolorscale": true } ] }, "layout": { "geo": { "bgcolor": "white", "showland": true, "lakecolor": "white", "landcolor": "white", "showlakes": true, "subunitcolor": "#C8D4E3" }, "font": { "color": "#2a3f5f" }, "polar": { "bgcolor": "white", "radialaxis": { "ticks": "", "gridcolor": "#EBF0F8", "linecolor": "#EBF0F8" }, "angularaxis": { "ticks": "", "gridcolor": "#EBF0F8", "linecolor": "#EBF0F8" } }, "scene": { "xaxis": { "ticks": "", "gridcolor": "#DFE8F3", "gridwidth": 2, "linecolor": "#EBF0F8", "zerolinecolor": "#EBF0F8", "showbackground": true, "backgroundcolor": "white" }, "yaxis": { "ticks": "", "gridcolor": "#DFE8F3", "gridwidth": 2, "linecolor": "#EBF0F8", "zerolinecolor": "#EBF0F8", "showbackground": true, "backgroundcolor": "white" }, "zaxis": { "ticks": "", "gridcolor": "#DFE8F3", "gridwidth": 2, "linecolor": "#EBF0F8", "zerolinecolor": "#EBF0F8", "showbackground": true, "backgroundcolor": "white" } }, "title": { "x": 0.05 }, "xaxis": { "ticks": "", "gridcolor": "#EBF0F8", "linecolor": "#EBF0F8", "automargin": true, "zerolinecolor": "#EBF0F8", "zerolinewidth": 2 }, "yaxis": { "ticks": "", "gridcolor": "#EBF0F8", "linecolor": "#EBF0F8", "automargin": true, "zerolinecolor": "#EBF0F8", "zerolinewidth": 2 }, "ternary": { "aaxis": { "ticks": "", "gridcolor": "#DFE8F3", "linecolor": "#A2B1C6" }, "baxis": { "ticks": "", "gridcolor": "#DFE8F3", "linecolor": "#A2B1C6" }, "caxis": { "ticks": "", "gridcolor": "#DFE8F3", "linecolor": "#A2B1C6" }, "bgcolor": "white" }, "colorway": [ "#636efa", "#EF553B", "#00cc96", "#ab63fa", "#19d3f3", "#e763fa", "#fecb52", "#ffa15a", "#ff6692", "#b6e880" ], "hovermode": "closest", "colorscale": { "diverging": [ [ 0, "#8e0152" ], [ 0.1, "#c51b7d" ], [ 0.2, "#de77ae" ], [ 0.3, "#f1b6da" ], [ 0.4, "#fde0ef" ], [ 0.5, "#f7f7f7" ], [ 0.6, "#e6f5d0" ], [ 0.7, "#b8e186" ], [ 0.8, "#7fbc41" ], [ 0.9, "#4d9221" ], [ 1, "#276419" ] ], "sequential": [ [ 0, "#0508b8" ], [ 0.0893854748603352, "#1910d8" ], [ 0.1787709497206704, "#3c19f0" ], [ 0.2681564245810056, "#6b1cfb" ], [ 0.3575418994413408, "#981cfd" ], [ 0.44692737430167595, "#bf1cfd" ], [ 0.5363128491620112, "#dd2bfd" ], [ 0.6256983240223464, "#f246fe" ], [ 0.7150837988826816, "#fc67fd" ], [ 0.8044692737430168, "#fe88fc" ], [ 0.8938547486033519, "#fea5fd" ], [ 0.9832402234636871, "#febefe" ], [ 1, "#fec3fe" ] ], "sequentialminus": [ [ 0, "#0508b8" ], [ 0.0893854748603352, "#1910d8" ], [ 0.1787709497206704, "#3c19f0" ], [ 0.2681564245810056, "#6b1cfb" ], [ 0.3575418994413408, "#981cfd" ], [ 0.44692737430167595, "#bf1cfd" ], [ 0.5363128491620112, "#dd2bfd" ], [ 0.6256983240223464, "#f246fe" ], [ 0.7150837988826816, "#fc67fd" ], [ 0.8044692737430168, "#fe88fc" ], [ 0.8938547486033519, "#fea5fd" ], [ 0.9832402234636871, "#febefe" ], [ 1, "#fec3fe" ] ] }, "plot_bgcolor": "white", "paper_bgcolor": "white", "shapedefaults": { "line": { "width": 0 }, "opacity": 0.4, "fillcolor": "#506784" }, "annotationdefaults": { "arrowhead": 0, "arrowcolor": "#506784", "arrowwidth": 1 } }, "themeRef": "PLOTLY_WHITE" }, "hovermode": "closest" } }, "height": null, "width": null, "user": { "profile_url": "https://chart-studio.plotly.com/~marantrod", "avatar_url": "https://storage.googleapis.com/plotly-prod-profiles/95.jpg", "background_url": "https://storage.googleapis.com/plotly-prod-profiles/bg-12.jpg", "bio": "", "nickname": "", "website": "", "stream_tokens": null, "feature_set_id": null, "csrf_token": null, "date_joined": "2024-04-12 18:21:44", "mapbox_access_tokens": null, "has_password": null, "username": "marantrod", "email": null, "is_active": null, "readonly": null, "is_dash_creator": null, "dash_created_count": null, "is_chart_creator": null, "charts_created_count": null } }, { "creation_time": "2024-04-16T19:04:16.511939Z", "comments": { "results": [], "count": 0 }, "parented": true, "embed_url": "https://chart-studio.plotly.com/~rschap/217.embed", "fid": "rschap:217", "filename": "MOF 3.2 Flr Spec", "filetype": "plot", "img_url": "https://storage.googleapis.com/plotly-prod-images/rschap/217/9_DIZ3NOOWSGE51E0YESFC9ONLCU6WGF.png", "image_urls": { "default": "https://storage.googleapis.com/plotly-prod-images/rschap/217/2_KTA7NLO9TWSM0NBV7KBERTIRNJRKZX.png", "block-thumb": "https://storage.googleapis.com/plotly-prod-images/rschap/217/8_UKKJBNC5U66YR6PO1E4ZR0VYLRGVHP.png", "list-thumb": "https://storage.googleapis.com/plotly-prod-images/rschap/217/9_DIZ3NOOWSGE51E0YESFC9ONLCU6WGF.png" }, "api_urls": { "files": "https://api.plotly.com/v2/files/rschap:217", "plots": "https://api.plotly.com/v2/plots/rschap:217", "parent": "https://api.plotly.com/v2/folders/home?user=rschap" }, "owner": "rschap", "parent": -1, "preview": "", "referencers": [], "references": [], "title": "", "views": 1, "web_url": "https://chart-studio.plotly.com/~rschap/217/", "world_readable": true, "date_modified": "2024-05-08T17:58:21.356Z", "stars": { "results": [], "count": 0 }, "collaborators": { "results": [], "count": 0 }, "subfolder_count": null, "refresh_interval": null, "organize_view_url": "https://chart-studio.plotly.com/~rschap/217/", "current_user_permission": "read", "is_theme": null, "is_template": false, "autosize": true, "caption": "", "figure": { "data": [ { "meta": { "columnNames": { "x": "FLMS14896_1:101", "y": "B" } }, "mode": "lines", "name": "MOF 3.2", "type": "scatter", "xsrc": "rschap:216:e41015", "ysrc": "rschap:216:8c2849" } ], "frames": [], "layout": { "title": { "text": "Fluorescence Spectrum MOF 3.2" }, "xaxis": { "type": "linear", "range": [ 430, 600 ], "title": { "text": "Wavelength (nm)" }, "autorange": false }, "yaxis": { "type": "linear", "range": [ -3681.196666666667, 30000 ], "title": { "text": "Intensity" }, "autorange": false }, "autosize": true, "template": { "data": { "bar": [ { "type": "bar", "marker": { "colorbar": { "ticks": "", "outlinewidth": 0 } } } ], "table": [ { "type": "table", "cells": { "fill": { "color": "#EBF0F8" }, "line": { "color": "white" } }, "header": { "fill": { "color": "#C8D4E3" }, "line": { "color": "white" } } } ], "carpet": [ { "type": "carpet", "aaxis": { "gridcolor": "#C8D4E3", "linecolor": "#C8D4E3", "endlinecolor": "#2a3f5f", "minorgridcolor": "#C8D4E3", "startlinecolor": "#2a3f5f" }, "baxis": { "gridcolor": "#C8D4E3", "linecolor": "#C8D4E3", "endlinecolor": "#2a3f5f", "minorgridcolor": "#C8D4E3", "startlinecolor": "#2a3f5f" } } ], "mesh3d": [ { "type": "mesh3d", "colorbar": { "ticks": "", "outlinewidth": 0 } } ], "contour": [ { "type": "contour", "colorbar": { "ticks": "", "outlinewidth": 0 }, "autocolorscale": true } ], "heatmap": [ { "type": "heatmap", "colorbar": { "ticks": "", "outlinewidth": 0 }, "autocolorscale": true } ], "scatter": [ { "type": "scatter", "marker": { "colorbar": { "ticks": "", "outlinewidth": 0 } } } ], "surface": [ { "type": "surface", "colorbar": { "ticks": "", "outlinewidth": 0 } } ], "heatmapgl": [ { "type": "heatmapgl", "colorbar": { "ticks": "", "outlinewidth": 0 } } ], "histogram": [ { "type": "histogram", "marker": { "colorbar": { "ticks": "", "outlinewidth": 0 } } } ], "parcoords": [ { "line": { "colorbar": { "ticks": "", "outlinewidth": 0 } }, "type": "parcoords" } ], "scatter3d": [ { "type": "scatter3d", "marker": { "colorbar": { "ticks": "", "outlinewidth": 0 } } } ], "scattergl": [ { "type": "scattergl", "marker": { "colorbar": { "ticks": "", "outlinewidth": 0 } } } ], "choropleth": [ { "type": "choropleth", "colorbar": { "ticks": "", "outlinewidth": 0 } } ], "scattergeo": [ { "type": "scattergeo", "marker": { "colorbar": { "ticks": "", "outlinewidth": 0 } } } ], "histogram2d": [ { "type": "histogram2d", "colorbar": { "ticks": "", "outlinewidth": 0 }, "autocolorscale": true } ], "scatterpolar": [ { "type": "scatterpolar", "marker": { "colorbar": { "ticks": "", "outlinewidth": 0 } } } ], "contourcarpet": [ { "type": "contourcarpet", "colorbar": { "ticks": "", "outlinewidth": 0 } } ], "scattercarpet": [ { "type": "scattercarpet", "marker": { "colorbar": { "ticks": "", "outlinewidth": 0 } } } ], "scattermapbox": [ { "type": "scattermapbox", "marker": { "colorbar": { "ticks": "", "outlinewidth": 0 } } } ], "scatterpolargl": [ { "type": "scatterpolargl", "marker": { "colorbar": { "ticks": "", "outlinewidth": 0 } } } ], "scatterternary": [ { "type": "scatterternary", "marker": { "colorbar": { "ticks": "", "outlinewidth": 0 } } } ], "histogram2dcontour": [ { "type": "histogram2dcontour", "colorbar": { "ticks": "", "outlinewidth": 0 }, "autocolorscale": true } ] }, "layout": { "geo": { "bgcolor": "white", "showland": true, "lakecolor": "white", "landcolor": "white", "showlakes": true, "subunitcolor": "#C8D4E3" }, "font": { "color": "#2a3f5f" }, "polar": { "bgcolor": "white", "radialaxis": { "ticks": "", "gridcolor": "#EBF0F8", "linecolor": "#EBF0F8" }, "angularaxis": { "ticks": "", "gridcolor": "#EBF0F8", "linecolor": "#EBF0F8" } }, "scene": { "xaxis": { "ticks": "", "gridcolor": "#DFE8F3", "gridwidth": 2, "linecolor": "#EBF0F8", "zerolinecolor": "#EBF0F8", "showbackground": true, "backgroundcolor": "white" }, "yaxis": { "ticks": "", "gridcolor": "#DFE8F3", "gridwidth": 2, "linecolor": "#EBF0F8", "zerolinecolor": "#EBF0F8", "showbackground": true, "backgroundcolor": "white" }, "zaxis": { "ticks": "", "gridcolor": "#DFE8F3", "gridwidth": 2, "linecolor": "#EBF0F8", "zerolinecolor": "#EBF0F8", "showbackground": true, "backgroundcolor": "white" } }, "title": { "x": 0.05 }, "xaxis": { "ticks": "", "gridcolor": "#EBF0F8", "linecolor": "#EBF0F8", "automargin": true, "zerolinecolor": "#EBF0F8", "zerolinewidth": 2 }, "yaxis": { "ticks": "", "gridcolor": "#EBF0F8", "linecolor": "#EBF0F8", "automargin": true, "zerolinecolor": "#EBF0F8", "zerolinewidth": 2 }, "ternary": { "aaxis": { "ticks": "", "gridcolor": "#DFE8F3", "linecolor": "#A2B1C6" }, "baxis": { "ticks": "", "gridcolor": "#DFE8F3", "linecolor": "#A2B1C6" }, "caxis": { "ticks": "", "gridcolor": "#DFE8F3", "linecolor": "#A2B1C6" }, "bgcolor": "white" }, "colorway": [ "#636efa", "#EF553B", "#00cc96", "#ab63fa", "#19d3f3", "#e763fa", "#fecb52", "#ffa15a", "#ff6692", "#b6e880" ], "hovermode": "closest", "colorscale": { "diverging": [ [ 0, "#8e0152" ], [ 0.1, "#c51b7d" ], [ 0.2, "#de77ae" ], [ 0.3, "#f1b6da" ], [ 0.4, "#fde0ef" ], [ 0.5, "#f7f7f7" ], [ 0.6, "#e6f5d0" ], [ 0.7, "#b8e186" ], [ 0.8, "#7fbc41" ], [ 0.9, "#4d9221" ], [ 1, "#276419" ] ], "sequential": [ [ 0, "#0508b8" ], [ 0.0893854748603352, "#1910d8" ], [ 0.1787709497206704, "#3c19f0" ], [ 0.2681564245810056, "#6b1cfb" ], [ 0.3575418994413408, "#981cfd" ], [ 0.44692737430167595, "#bf1cfd" ], [ 0.5363128491620112, "#dd2bfd" ], [ 0.6256983240223464, "#f246fe" ], [ 0.7150837988826816, "#fc67fd" ], [ 0.8044692737430168, "#fe88fc" ], [ 0.8938547486033519, "#fea5fd" ], [ 0.9832402234636871, "#febefe" ], [ 1, "#fec3fe" ] ], "sequentialminus": [ [ 0, "#0508b8" ], [ 0.0893854748603352, "#1910d8" ], [ 0.1787709497206704, "#3c19f0" ], [ 0.2681564245810056, "#6b1cfb" ], [ 0.3575418994413408, "#981cfd" ], [ 0.44692737430167595, "#bf1cfd" ], [ 0.5363128491620112, "#dd2bfd" ], [ 0.6256983240223464, "#f246fe" ], [ 0.7150837988826816, "#fc67fd" ], [ 0.8044692737430168, "#fe88fc" ], [ 0.8938547486033519, "#fea5fd" ], [ 0.9832402234636871, "#febefe" ], [ 1, "#fec3fe" ] ] }, "plot_bgcolor": "white", "paper_bgcolor": "white", "shapedefaults": { "line": { "width": 0 }, "opacity": 0.4, "fillcolor": "#506784" }, "annotationdefaults": { "arrowhead": 0, "arrowcolor": "#506784", "arrowwidth": 1 } }, "themeRef": "PLOTLY_WHITE" } } }, "height": null, "width": null, "user": { "profile_url": "https://chart-studio.plotly.com/~rschap", "avatar_url": "https://storage.googleapis.com/plotly-prod-profiles/1.jpg", "background_url": "https://storage.googleapis.com/plotly-prod-profiles/bg-0.jpg", "bio": "", "nickname": "", "website": "", "stream_tokens": null, "feature_set_id": null, "csrf_token": null, "date_joined": "2021-09-30 16:39:55", "mapbox_access_tokens": null, "has_password": null, "username": "rschap", "email": null, "is_active": null, "readonly": null, "is_dash_creator": null, "dash_created_count": null, "is_chart_creator": null, "charts_created_count": null } }, { "creation_time": "2024-04-16T19:02:20.189902Z", "comments": { "results": [], "count": 0 }, "parented": true, "embed_url": "https://chart-studio.plotly.com/~rschap/215.embed", "fid": "rschap:215", "filename": "MOF 2.2 Flr Spec", "filetype": "plot", "img_url": "https://storage.googleapis.com/plotly-prod-images/rschap/215/9_6WDETL7SXF62SW7PCBU0U1W5RY793Q.png", "image_urls": { "default": "https://storage.googleapis.com/plotly-prod-images/rschap/215/2_YJ4Q701FYSGEK92BT21SMBPG4H82GU.png", "block-thumb": "https://storage.googleapis.com/plotly-prod-images/rschap/215/8_9PC9961O48IM302TSXZRH8DJWP1OGC.png", "list-thumb": "https://storage.googleapis.com/plotly-prod-images/rschap/215/9_6WDETL7SXF62SW7PCBU0U1W5RY793Q.png" }, "api_urls": { "files": "https://api.plotly.com/v2/files/rschap:215", "plots": "https://api.plotly.com/v2/plots/rschap:215", "parent": "https://api.plotly.com/v2/folders/home?user=rschap" }, "owner": "rschap", "parent": -1, "preview": "", "referencers": [], "references": [], "title": "", "views": 1, "web_url": "https://chart-studio.plotly.com/~rschap/215/", "world_readable": true, "date_modified": "2024-04-16T19:02:20.199Z", "stars": { "results": [], "count": 0 }, "collaborators": { "results": [], "count": 0 }, "subfolder_count": null, "refresh_interval": null, "organize_view_url": "https://chart-studio.plotly.com/~rschap/215/", "current_user_permission": "read", "is_theme": null, "is_template": false, "autosize": true, "caption": "", "figure": { "data": [ { "meta": { "columnNames": { "x": "FLMS14896_1:101", "y": "B" } }, "mode": "lines", "type": "scatter", "xsrc": "rschap:214:4ba589", "ysrc": "rschap:214:18870d" } ], "frames": [], "layout": { "title": { "text": "Fluorescence Spectrum MOF 2.2" }, "xaxis": { "type": "linear", "range": [ 430, 600 ], "title": { "text": "Wavelength (nm)" }, "autorange": false }, "yaxis": { "type": "linear", "range": [ -3665.0022222222224, 50000 ], "title": { "text": "Intensity" }, "autorange": false }, "autosize": true, "template": { "data": { "bar": [ { "type": "bar", "marker": { "colorbar": { "ticks": "", "outlinewidth": 0 } } } ], "table": [ { "type": "table", "cells": { "fill": { "color": "#EBF0F8" }, "line": { "color": "white" } }, "header": { "fill": { "color": "#C8D4E3" }, "line": { "color": "white" } } } ], "carpet": [ { "type": "carpet", "aaxis": { "gridcolor": "#C8D4E3", "linecolor": "#C8D4E3", "endlinecolor": "#2a3f5f", "minorgridcolor": "#C8D4E3", "startlinecolor": "#2a3f5f" }, "baxis": { "gridcolor": "#C8D4E3", "linecolor": "#C8D4E3", "endlinecolor": "#2a3f5f", "minorgridcolor": "#C8D4E3", "startlinecolor": "#2a3f5f" } } ], "mesh3d": [ { "type": "mesh3d", "colorbar": { "ticks": "", "outlinewidth": 0 } } ], "contour": [ { "type": "contour", "colorbar": { "ticks": "", "outlinewidth": 0 }, "autocolorscale": true } ], "heatmap": [ { "type": "heatmap", "colorbar": { "ticks": "", "outlinewidth": 0 }, "autocolorscale": true } ], "scatter": [ { "type": "scatter", "marker": { "colorbar": { "ticks": "", "outlinewidth": 0 } } } ], "surface": [ { "type": "surface", "colorbar": { "ticks": "", "outlinewidth": 0 } } ], "heatmapgl": [ { "type": "heatmapgl", "colorbar": { "ticks": "", "outlinewidth": 0 } } ], "histogram": [ { "type": "histogram", "marker": { "colorbar": { "ticks": "", "outlinewidth": 0 } } } ], "parcoords": [ { "line": { "colorbar": { "ticks": "", "outlinewidth": 0 } }, "type": "parcoords" } ], "scatter3d": [ { "type": "scatter3d", "marker": { "colorbar": { "ticks": "", "outlinewidth": 0 } } } ], "scattergl": [ { "type": "scattergl", "marker": { "colorbar": { "ticks": "", "outlinewidth": 0 } } } ], "choropleth": [ { "type": "choropleth", "colorbar": { "ticks": "", "outlinewidth": 0 } } ], "scattergeo": [ { "type": "scattergeo", "marker": { "colorbar": { "ticks": "", "outlinewidth": 0 } } } ], "histogram2d": [ { "type": "histogram2d", "colorbar": { "ticks": "", "outlinewidth": 0 }, "autocolorscale": true } ], "scatterpolar": [ { "type": "scatterpolar", "marker": { "colorbar": { "ticks": "", "outlinewidth": 0 } } } ], "contourcarpet": [ { "type": "contourcarpet", "colorbar": { "ticks": "", "outlinewidth": 0 } } ], "scattercarpet": [ { "type": "scattercarpet", "marker": { "colorbar": { "ticks": "", "outlinewidth": 0 } } } ], "scattermapbox": [ { "type": "scattermapbox", "marker": { "colorbar": { "ticks": "", "outlinewidth": 0 } } } ], "scatterpolargl": [ { "type": "scatterpolargl", "marker": { "colorbar": { "ticks": "", "outlinewidth": 0 } } } ], "scatterternary": [ { "type": "scatterternary", "marker": { "colorbar": { "ticks": "", "outlinewidth": 0 } } } ], "histogram2dcontour": [ { "type": "histogram2dcontour", "colorbar": { "ticks": "", "outlinewidth": 0 }, "autocolorscale": true } ] }, "layout": { "geo": { "bgcolor": "white", "showland": true, "lakecolor": "white", "landcolor": "white", "showlakes": true, "subunitcolor": "#C8D4E3" }, "font": { "color": "#2a3f5f" }, "polar": { "bgcolor": "white", "radialaxis": { "ticks": "", "gridcolor": "#EBF0F8", "linecolor": "#EBF0F8" }, "angularaxis": { "ticks": "", "gridcolor": "#EBF0F8", "linecolor": "#EBF0F8" } }, "scene": { "xaxis": { "ticks": "", "gridcolor": "#DFE8F3", "gridwidth": 2, "linecolor": "#EBF0F8", "zerolinecolor": "#EBF0F8", "showbackground": true, "backgroundcolor": "white" }, "yaxis": { "ticks": "", "gridcolor": "#DFE8F3", "gridwidth": 2, "linecolor": "#EBF0F8", "zerolinecolor": "#EBF0F8", "showbackground": true, "backgroundcolor": "white" }, "zaxis": { "ticks": "", "gridcolor": "#DFE8F3", "gridwidth": 2, "linecolor": "#EBF0F8", "zerolinecolor": "#EBF0F8", "showbackground": true, "backgroundcolor": "white" } }, "title": { "x": 0.05 }, "xaxis": { "ticks": "", "gridcolor": "#EBF0F8", "linecolor": "#EBF0F8", "automargin": true, "zerolinecolor": "#EBF0F8", "zerolinewidth": 2 }, "yaxis": { "ticks": "", "gridcolor": "#EBF0F8", "linecolor": "#EBF0F8", "automargin": true, "zerolinecolor": "#EBF0F8", "zerolinewidth": 2 }, "ternary": { "aaxis": { "ticks": "", "gridcolor": "#DFE8F3", "linecolor": "#A2B1C6" }, "baxis": { "ticks": "", "gridcolor": "#DFE8F3", "linecolor": "#A2B1C6" }, "caxis": { "ticks": "", "gridcolor": "#DFE8F3", "linecolor": "#A2B1C6" }, "bgcolor": "white" }, "colorway": [ "#636efa", "#EF553B", "#00cc96", "#ab63fa", "#19d3f3", "#e763fa", "#fecb52", "#ffa15a", "#ff6692", "#b6e880" ], "hovermode": "closest", "colorscale": { "diverging": [ [ 0, "#8e0152" ], [ 0.1, "#c51b7d" ], [ 0.2, "#de77ae" ], [ 0.3, "#f1b6da" ], [ 0.4, "#fde0ef" ], [ 0.5, "#f7f7f7" ], [ 0.6, "#e6f5d0" ], [ 0.7, "#b8e186" ], [ 0.8, "#7fbc41" ], [ 0.9, "#4d9221" ], [ 1, "#276419" ] ], "sequential": [ [ 0, "#0508b8" ], [ 0.0893854748603352, "#1910d8" ], [ 0.1787709497206704, "#3c19f0" ], [ 0.2681564245810056, "#6b1cfb" ], [ 0.3575418994413408, "#981cfd" ], [ 0.44692737430167595, "#bf1cfd" ], [ 0.5363128491620112, "#dd2bfd" ], [ 0.6256983240223464, "#f246fe" ], [ 0.7150837988826816, "#fc67fd" ], [ 0.8044692737430168, "#fe88fc" ], [ 0.8938547486033519, "#fea5fd" ], [ 0.9832402234636871, "#febefe" ], [ 1, "#fec3fe" ] ], "sequentialminus": [ [ 0, "#0508b8" ], [ 0.0893854748603352, "#1910d8" ], [ 0.1787709497206704, "#3c19f0" ], [ 0.2681564245810056, "#6b1cfb" ], [ 0.3575418994413408, "#981cfd" ], [ 0.44692737430167595, "#bf1cfd" ], [ 0.5363128491620112, "#dd2bfd" ], [ 0.6256983240223464, "#f246fe" ], [ 0.7150837988826816, "#fc67fd" ], [ 0.8044692737430168, "#fe88fc" ], [ 0.8938547486033519, "#fea5fd" ], [ 0.9832402234636871, "#febefe" ], [ 1, "#fec3fe" ] ] }, "plot_bgcolor": "white", "paper_bgcolor": "white", "shapedefaults": { "line": { "width": 0 }, "opacity": 0.4, "fillcolor": "#506784" }, "annotationdefaults": { "arrowhead": 0, "arrowcolor": "#506784", "arrowwidth": 1 } }, "themeRef": "PLOTLY_WHITE" } } }, "height": null, "width": null, "user": { "profile_url": "https://chart-studio.plotly.com/~rschap", "avatar_url": "https://storage.googleapis.com/plotly-prod-profiles/1.jpg", "background_url": "https://storage.googleapis.com/plotly-prod-profiles/bg-0.jpg", "bio": "", "nickname": "", "website": "", "stream_tokens": null, "feature_set_id": null, "csrf_token": null, "date_joined": "2021-09-30 16:39:55", "mapbox_access_tokens": null, "has_password": null, "username": "rschap", "email": null, "is_active": null, "readonly": null, "is_dash_creator": null, "dash_created_count": null, "is_chart_creator": null, "charts_created_count": null } }, { "creation_time": "2024-04-16T19:00:23.299839Z", "comments": { "results": [], "count": 0 }, "parented": true, "embed_url": "https://chart-studio.plotly.com/~rschap/213.embed", "fid": "rschap:213", "filename": "MOF 1.2 Flr Spec", "filetype": "plot", "img_url": "https://storage.googleapis.com/plotly-prod-images/rschap/213/9_V15D6FRZIR7P62R5G0GZ9BYLCBRQNJ.png", "image_urls": { "default": "https://storage.googleapis.com/plotly-prod-images/rschap/213/2_0S52859A6OUJYD2TS2A5CTNX2JVTNM.png", "block-thumb": "https://storage.googleapis.com/plotly-prod-images/rschap/213/8_N6944DLF72PX2CB8R6QUDF0G3QOM2R.png", "list-thumb": "https://storage.googleapis.com/plotly-prod-images/rschap/213/9_V15D6FRZIR7P62R5G0GZ9BYLCBRQNJ.png" }, "api_urls": { "files": "https://api.plotly.com/v2/files/rschap:213", "plots": "https://api.plotly.com/v2/plots/rschap:213", "parent": "https://api.plotly.com/v2/folders/home?user=rschap" }, "owner": "rschap", "parent": -1, "preview": "", "referencers": [], "references": [], "title": "", "views": 1, "web_url": "https://chart-studio.plotly.com/~rschap/213/", "world_readable": true, "date_modified": "2024-04-16T19:00:23.312Z", "stars": { "results": [], "count": 0 }, "collaborators": { "results": [], "count": 0 }, "subfolder_count": null, "refresh_interval": null, "organize_view_url": "https://chart-studio.plotly.com/~rschap/213/", "current_user_permission": "read", "is_theme": null, "is_template": false, "autosize": true, "caption": "", "figure": { "data": [ { "meta": { "columnNames": { "x": "FLMS14896_1:101", "y": "B" } }, "mode": "lines", "name": "MOF 1.2", "type": "scatter", "xsrc": "rschap:212:805899", "ysrc": "rschap:212:937084" } ], "frames": [], "layout": { "title": { "text": "Fluorescence Spectrum MOF 1.2" }, "xaxis": { "type": "linear", "range": [ 430, 600 ], "title": { "text": "Wavelength (nm)" }, "autorange": false }, "yaxis": { "type": "linear", "range": [ -3639.390555555556, 30000 ], "title": { "text": "Intensity" }, "autorange": false }, "autosize": true, "template": { "data": { "bar": [ { "type": "bar", "marker": { "colorbar": { "ticks": "", "outlinewidth": 0 } } } ], "table": [ { "type": "table", "cells": { "fill": { "color": "#EBF0F8" }, "line": { "color": "white" } }, "header": { "fill": { "color": "#C8D4E3" }, "line": { "color": "white" } } } ], "carpet": [ { "type": "carpet", "aaxis": { "gridcolor": "#C8D4E3", "linecolor": "#C8D4E3", "endlinecolor": "#2a3f5f", "minorgridcolor": "#C8D4E3", "startlinecolor": "#2a3f5f" }, "baxis": { "gridcolor": "#C8D4E3", "linecolor": "#C8D4E3", "endlinecolor": "#2a3f5f", "minorgridcolor": "#C8D4E3", "startlinecolor": "#2a3f5f" } } ], "mesh3d": [ { "type": "mesh3d", "colorbar": { "ticks": "", "outlinewidth": 0 } } ], "contour": [ { "type": "contour", "colorbar": { "ticks": "", "outlinewidth": 0 }, "autocolorscale": true } ], "heatmap": [ { "type": "heatmap", "colorbar": { "ticks": "", "outlinewidth": 0 }, "autocolorscale": true } ], "scatter": [ { "type": "scatter", "marker": { "colorbar": { "ticks": "", "outlinewidth": 0 } } } ], "surface": [ { "type": "surface", "colorbar": { "ticks": "", "outlinewidth": 0 } } ], "heatmapgl": [ { "type": "heatmapgl", "colorbar": { "ticks": "", "outlinewidth": 0 } } ], "histogram": [ { "type": "histogram", "marker": { "colorbar": { "ticks": "", "outlinewidth": 0 } } } ], "parcoords": [ { "line": { "colorbar": { "ticks": "", "outlinewidth": 0 } }, "type": "parcoords" } ], "scatter3d": [ { "type": "scatter3d", "marker": { "colorbar": { "ticks": "", "outlinewidth": 0 } } } ], "scattergl": [ { "type": "scattergl", "marker": { "colorbar": { "ticks": "", "outlinewidth": 0 } } } ], "choropleth": [ { "type": "choropleth", "colorbar": { "ticks": "", "outlinewidth": 0 } } ], "scattergeo": [ { "type": "scattergeo", "marker": { "colorbar": { "ticks": "", "outlinewidth": 0 } } } ], "histogram2d": [ { "type": "histogram2d", "colorbar": { "ticks": "", "outlinewidth": 0 }, "autocolorscale": true } ], "scatterpolar": [ { "type": "scatterpolar", "marker": { "colorbar": { "ticks": "", "outlinewidth": 0 } } } ], "contourcarpet": [ { "type": "contourcarpet", "colorbar": { "ticks": "", "outlinewidth": 0 } } ], "scattercarpet": [ { "type": "scattercarpet", "marker": { "colorbar": { "ticks": "", "outlinewidth": 0 } } } ], "scattermapbox": [ { "type": "scattermapbox", "marker": { "colorbar": { "ticks": "", "outlinewidth": 0 } } } ], "scatterpolargl": [ { "type": "scatterpolargl", "marker": { "colorbar": { "ticks": "", "outlinewidth": 0 } } } ], "scatterternary": [ { "type": "scatterternary", "marker": { "colorbar": { "ticks": "", "outlinewidth": 0 } } } ], "histogram2dcontour": [ { "type": "histogram2dcontour", "colorbar": { "ticks": "", "outlinewidth": 0 }, "autocolorscale": true } ] }, "layout": { "geo": { "bgcolor": "white", "showland": true, "lakecolor": "white", "landcolor": "white", "showlakes": true, "subunitcolor": "#C8D4E3" }, "font": { "color": "#2a3f5f" }, "polar": { "bgcolor": "white", "radialaxis": { "ticks": "", "gridcolor": "#EBF0F8", "linecolor": "#EBF0F8" }, "angularaxis": { "ticks": "", "gridcolor": "#EBF0F8", "linecolor": "#EBF0F8" } }, "scene": { "xaxis": { "ticks": "", "gridcolor": "#DFE8F3", "gridwidth": 2, "linecolor": "#EBF0F8", "zerolinecolor": "#EBF0F8", "showbackground": true, "backgroundcolor": "white" }, "yaxis": { "ticks": "", "gridcolor": "#DFE8F3", "gridwidth": 2, "linecolor": "#EBF0F8", "zerolinecolor": "#EBF0F8", "showbackground": true, "backgroundcolor": "white" }, "zaxis": { "ticks": "", "gridcolor": "#DFE8F3", "gridwidth": 2, "linecolor": "#EBF0F8", "zerolinecolor": "#EBF0F8", "showbackground": true, "backgroundcolor": "white" } }, "title": { "x": 0.05 }, "xaxis": { "ticks": "", "gridcolor": "#EBF0F8", "linecolor": "#EBF0F8", "automargin": true, "zerolinecolor": "#EBF0F8", "zerolinewidth": 2 }, "yaxis": { "ticks": "", "gridcolor": "#EBF0F8", "linecolor": "#EBF0F8", "automargin": true, "zerolinecolor": "#EBF0F8", "zerolinewidth": 2 }, "ternary": { "aaxis": { "ticks": "", "gridcolor": "#DFE8F3", "linecolor": "#A2B1C6" }, "baxis": { "ticks": "", "gridcolor": "#DFE8F3", "linecolor": "#A2B1C6" }, "caxis": { "ticks": "", "gridcolor": "#DFE8F3", "linecolor": "#A2B1C6" }, "bgcolor": "white" }, "colorway": [ "#636efa", "#EF553B", "#00cc96", "#ab63fa", "#19d3f3", "#e763fa", "#fecb52", "#ffa15a", "#ff6692", "#b6e880" ], "hovermode": "closest", "colorscale": { "diverging": [ [ 0, "#8e0152" ], [ 0.1, "#c51b7d" ], [ 0.2, "#de77ae" ], [ 0.3, "#f1b6da" ], [ 0.4, "#fde0ef" ], [ 0.5, "#f7f7f7" ], [ 0.6, "#e6f5d0" ], [ 0.7, "#b8e186" ], [ 0.8, "#7fbc41" ], [ 0.9, "#4d9221" ], [ 1, "#276419" ] ], "sequential": [ [ 0, "#0508b8" ], [ 0.0893854748603352, "#1910d8" ], [ 0.1787709497206704, "#3c19f0" ], [ 0.2681564245810056, "#6b1cfb" ], [ 0.3575418994413408, "#981cfd" ], [ 0.44692737430167595, "#bf1cfd" ], [ 0.5363128491620112, "#dd2bfd" ], [ 0.6256983240223464, "#f246fe" ], [ 0.7150837988826816, "#fc67fd" ], [ 0.8044692737430168, "#fe88fc" ], [ 0.8938547486033519, "#fea5fd" ], [ 0.9832402234636871, "#febefe" ], [ 1, "#fec3fe" ] ], "sequentialminus": [ [ 0, "#0508b8" ], [ 0.0893854748603352, "#1910d8" ], [ 0.1787709497206704, "#3c19f0" ], [ 0.2681564245810056, "#6b1cfb" ], [ 0.3575418994413408, "#981cfd" ], [ 0.44692737430167595, "#bf1cfd" ], [ 0.5363128491620112, "#dd2bfd" ], [ 0.6256983240223464, "#f246fe" ], [ 0.7150837988826816, "#fc67fd" ], [ 0.8044692737430168, "#fe88fc" ], [ 0.8938547486033519, "#fea5fd" ], [ 0.9832402234636871, "#febefe" ], [ 1, "#fec3fe" ] ] }, "plot_bgcolor": "white", "paper_bgcolor": "white", "shapedefaults": { "line": { "width": 0 }, "opacity": 0.4, "fillcolor": "#506784" }, "annotationdefaults": { "arrowhead": 0, "arrowcolor": "#506784", "arrowwidth": 1 } }, "themeRef": "PLOTLY_WHITE" } } }, "height": null, "width": null, "user": { "profile_url": "https://chart-studio.plotly.com/~rschap", "avatar_url": "https://storage.googleapis.com/plotly-prod-profiles/1.jpg", "background_url": "https://storage.googleapis.com/plotly-prod-profiles/bg-0.jpg", "bio": "", "nickname": "", "website": "", "stream_tokens": null, "feature_set_id": null, "csrf_token": null, "date_joined": "2021-09-30 16:39:55", "mapbox_access_tokens": null, "has_password": null, "username": "rschap", "email": null, "is_active": null, "readonly": null, "is_dash_creator": null, "dash_created_count": null, "is_chart_creator": null, "charts_created_count": null } }, { "creation_time": "2024-04-16T18:55:47.018016Z", "comments": { "results": [], "count": 0 }, "parented": true, "embed_url": "https://chart-studio.plotly.com/~rschap/211.embed", "fid": "rschap:211", "filename": "RS 3 Flr Spec", "filetype": "plot", "img_url": "https://storage.googleapis.com/plotly-prod-images/rschap/211/9_ZZHOEP8TQABUZZE3IGXXP31T3UW5KM.png", "image_urls": { "default": "https://storage.googleapis.com/plotly-prod-images/rschap/211/2_0MWL8R9841Y0D0EBUZ9MANOAV4P42Y.png", "block-thumb": "https://storage.googleapis.com/plotly-prod-images/rschap/211/8_NIHJGFDVMACHIPG6XTM7W5Y0VPCQJG.png", "list-thumb": "https://storage.googleapis.com/plotly-prod-images/rschap/211/9_ZZHOEP8TQABUZZE3IGXXP31T3UW5KM.png" }, "api_urls": { "files": "https://api.plotly.com/v2/files/rschap:211", "plots": "https://api.plotly.com/v2/plots/rschap:211", "parent": "https://api.plotly.com/v2/folders/home?user=rschap" }, "owner": "rschap", "parent": -1, "preview": "", "referencers": [], "references": [], "title": "", "views": 1, "web_url": "https://chart-studio.plotly.com/~rschap/211/", "world_readable": true, "date_modified": "2024-04-16T18:55:47.029Z", "stars": { "results": [], "count": 0 }, "collaborators": { "results": [], "count": 0 }, "subfolder_count": null, "refresh_interval": null, "organize_view_url": "https://chart-studio.plotly.com/~rschap/211/", "current_user_permission": "read", "is_theme": null, "is_template": false, "autosize": true, "caption": "", "figure": { "data": [ { "meta": { "columnNames": { "x": "FLMS14896_1:101", "y": "B" } }, "mode": "lines", "name": "RS 3", "type": "scatter", "xsrc": "rschap:210:b4a03e", "ysrc": "rschap:210:3a9afd" } ], "frames": [], "layout": { "title": { "text": "Fluorescence Spectrum RS 3" }, "xaxis": { "type": "linear", "range": [ 430, 600 ], "title": { "text": "Wavelength (nm)" }, "autorange": false }, "yaxis": { "type": "linear", "range": [ -3667.7188888888895, 15000 ], "title": { "text": "Intensity" }, "autorange": false }, "autosize": true, "template": { "data": { "bar": [ { "type": "bar", "marker": { "colorbar": { "ticks": "", "outlinewidth": 0 } } } ], "table": [ { "type": "table", "cells": { "fill": { "color": "#EBF0F8" }, "line": { "color": "white" } }, "header": { "fill": { "color": "#C8D4E3" }, "line": { "color": "white" } } } ], "carpet": [ { "type": "carpet", "aaxis": { "gridcolor": "#C8D4E3", "linecolor": "#C8D4E3", "endlinecolor": "#2a3f5f", "minorgridcolor": "#C8D4E3", "startlinecolor": "#2a3f5f" }, "baxis": { "gridcolor": "#C8D4E3", "linecolor": "#C8D4E3", "endlinecolor": "#2a3f5f", "minorgridcolor": "#C8D4E3", "startlinecolor": "#2a3f5f" } } ], "mesh3d": [ { "type": "mesh3d", "colorbar": { "ticks": "", "outlinewidth": 0 } } ], "contour": [ { "type": "contour", "colorbar": { "ticks": "", "outlinewidth": 0 }, "autocolorscale": true } ], "heatmap": [ { "type": "heatmap", "colorbar": { "ticks": "", "outlinewidth": 0 }, "autocolorscale": true } ], "scatter": [ { "type": "scatter", "marker": { "colorbar": { "ticks": "", "outlinewidth": 0 } } } ], "surface": [ { "type": "surface", "colorbar": { "ticks": "", "outlinewidth": 0 } } ], "heatmapgl": [ { "type": "heatmapgl", "colorbar": { "ticks": "", "outlinewidth": 0 } } ], "histogram": [ { "type": "histogram", "marker": { "colorbar": { "ticks": "", "outlinewidth": 0 } } } ], "parcoords": [ { "line": { "colorbar": { "ticks": "", "outlinewidth": 0 } }, "type": "parcoords" } ], "scatter3d": [ { "type": "scatter3d", "marker": { "colorbar": { "ticks": "", "outlinewidth": 0 } } } ], "scattergl": [ { "type": "scattergl", "marker": { "colorbar": { "ticks": "", "outlinewidth": 0 } } } ], "choropleth": [ { "type": "choropleth", "colorbar": { "ticks": "", "outlinewidth": 0 } } ], "scattergeo": [ { "type": "scattergeo", "marker": { "colorbar": { "ticks": "", "outlinewidth": 0 } } } ], "histogram2d": [ { "type": "histogram2d", "colorbar": { "ticks": "", "outlinewidth": 0 }, "autocolorscale": true } ], "scatterpolar": [ { "type": "scatterpolar", "marker": { "colorbar": { "ticks": "", "outlinewidth": 0 } } } ], "contourcarpet": [ { "type": "contourcarpet", "colorbar": { "ticks": "", "outlinewidth": 0 } } ], "scattercarpet": [ { "type": "scattercarpet", "marker": { "colorbar": { "ticks": "", "outlinewidth": 0 } } } ], "scattermapbox": [ { "type": "scattermapbox", "marker": { "colorbar": { "ticks": "", "outlinewidth": 0 } } } ], "scatterpolargl": [ { "type": "scatterpolargl", "marker": { "colorbar": { "ticks": "", "outlinewidth": 0 } } } ], "scatterternary": [ { "type": "scatterternary", "marker": { "colorbar": { "ticks": "", "outlinewidth": 0 } } } ], "histogram2dcontour": [ { "type": "histogram2dcontour", "colorbar": { "ticks": "", "outlinewidth": 0 }, "autocolorscale": true } ] }, "layout": { "geo": { "bgcolor": "white", "showland": true, "lakecolor": "white", "landcolor": "white", "showlakes": true, "subunitcolor": "#C8D4E3" }, "font": { "color": "#2a3f5f" }, "polar": { "bgcolor": "white", "radialaxis": { "ticks": "", "gridcolor": "#EBF0F8", "linecolor": "#EBF0F8" }, "angularaxis": { "ticks": "", "gridcolor": "#EBF0F8", "linecolor": "#EBF0F8" } }, "scene": { "xaxis": { "ticks": "", "gridcolor": "#DFE8F3", "gridwidth": 2, "linecolor": "#EBF0F8", "zerolinecolor": "#EBF0F8", "showbackground": true, "backgroundcolor": "white" }, "yaxis": { "ticks": "", "gridcolor": "#DFE8F3", "gridwidth": 2, "linecolor": "#EBF0F8", "zerolinecolor": "#EBF0F8", "showbackground": true, "backgroundcolor": "white" }, "zaxis": { "ticks": "", "gridcolor": "#DFE8F3", "gridwidth": 2, "linecolor": "#EBF0F8", "zerolinecolor": "#EBF0F8", "showbackground": true, "backgroundcolor": "white" } }, "title": { "x": 0.05 }, "xaxis": { "ticks": "", "gridcolor": "#EBF0F8", "linecolor": "#EBF0F8", "automargin": true, "zerolinecolor": "#EBF0F8", "zerolinewidth": 2 }, "yaxis": { "ticks": "", "gridcolor": "#EBF0F8", "linecolor": "#EBF0F8", "automargin": true, "zerolinecolor": "#EBF0F8", "zerolinewidth": 2 }, "ternary": { "aaxis": { "ticks": "", "gridcolor": "#DFE8F3", "linecolor": "#A2B1C6" }, "baxis": { "ticks": "", "gridcolor": "#DFE8F3", "linecolor": "#A2B1C6" }, "caxis": { "ticks": "", "gridcolor": "#DFE8F3", "linecolor": "#A2B1C6" }, "bgcolor": "white" }, "colorway": [ "#636efa", "#EF553B", "#00cc96", "#ab63fa", "#19d3f3", "#e763fa", "#fecb52", "#ffa15a", "#ff6692", "#b6e880" ], "hovermode": "closest", "colorscale": { "diverging": [ [ 0, "#8e0152" ], [ 0.1, "#c51b7d" ], [ 0.2, "#de77ae" ], [ 0.3, "#f1b6da" ], [ 0.4, "#fde0ef" ], [ 0.5, "#f7f7f7" ], [ 0.6, "#e6f5d0" ], [ 0.7, "#b8e186" ], [ 0.8, "#7fbc41" ], [ 0.9, "#4d9221" ], [ 1, "#276419" ] ], "sequential": [ [ 0, "#0508b8" ], [ 0.0893854748603352, "#1910d8" ], [ 0.1787709497206704, "#3c19f0" ], [ 0.2681564245810056, "#6b1cfb" ], [ 0.3575418994413408, "#981cfd" ], [ 0.44692737430167595, "#bf1cfd" ], [ 0.5363128491620112, "#dd2bfd" ], [ 0.6256983240223464, "#f246fe" ], [ 0.7150837988826816, "#fc67fd" ], [ 0.8044692737430168, "#fe88fc" ], [ 0.8938547486033519, "#fea5fd" ], [ 0.9832402234636871, "#febefe" ], [ 1, "#fec3fe" ] ], "sequentialminus": [ [ 0, "#0508b8" ], [ 0.0893854748603352, "#1910d8" ], [ 0.1787709497206704, "#3c19f0" ], [ 0.2681564245810056, "#6b1cfb" ], [ 0.3575418994413408, "#981cfd" ], [ 0.44692737430167595, "#bf1cfd" ], [ 0.5363128491620112, "#dd2bfd" ], [ 0.6256983240223464, "#f246fe" ], [ 0.7150837988826816, "#fc67fd" ], [ 0.8044692737430168, "#fe88fc" ], [ 0.8938547486033519, "#fea5fd" ], [ 0.9832402234636871, "#febefe" ], [ 1, "#fec3fe" ] ] }, "plot_bgcolor": "white", "paper_bgcolor": "white", "shapedefaults": { "line": { "width": 0 }, "opacity": 0.4, "fillcolor": "#506784" }, "annotationdefaults": { "arrowhead": 0, "arrowcolor": "#506784", "arrowwidth": 1 } }, "themeRef": "PLOTLY_WHITE" } } }, "height": null, "width": null, "user": { "profile_url": "https://chart-studio.plotly.com/~rschap", "avatar_url": "https://storage.googleapis.com/plotly-prod-profiles/1.jpg", "background_url": "https://storage.googleapis.com/plotly-prod-profiles/bg-0.jpg", "bio": "", "nickname": "", "website": "", "stream_tokens": null, "feature_set_id": null, "csrf_token": null, "date_joined": "2021-09-30 16:39:55", "mapbox_access_tokens": null, "has_password": null, "username": "rschap", "email": null, "is_active": null, "readonly": null, "is_dash_creator": null, "dash_created_count": null, "is_chart_creator": null, "charts_created_count": null } }, { "creation_time": "2024-04-16T18:53:17.846624Z", "comments": { "results": [], "count": 0 }, "parented": true, "embed_url": "https://chart-studio.plotly.com/~rschap/209.embed", "fid": "rschap:209", "filename": "RS 2 Flr Spec", "filetype": "plot", "img_url": "https://storage.googleapis.com/plotly-prod-images/rschap/209/9_DXZYDMEAHXIYG13HHXDD0UQF2BJF9B.png", "image_urls": { "default": "https://storage.googleapis.com/plotly-prod-images/rschap/209/2_KM654KHQT3UTFINPVZITNFGP8WGGB7.png", "block-thumb": "https://storage.googleapis.com/plotly-prod-images/rschap/209/8_R92Q3NIA9ZXULMDH4SOVQ5SZPPNJ9B.png", "list-thumb": "https://storage.googleapis.com/plotly-prod-images/rschap/209/9_DXZYDMEAHXIYG13HHXDD0UQF2BJF9B.png" }, "api_urls": { "files": "https://api.plotly.com/v2/files/rschap:209", "plots": "https://api.plotly.com/v2/plots/rschap:209", "parent": "https://api.plotly.com/v2/folders/home?user=rschap" }, "owner": "rschap", "parent": -1, "preview": "", "referencers": [], "references": [], "title": "", "views": 1, "web_url": "https://chart-studio.plotly.com/~rschap/209/", "world_readable": true, "date_modified": "2024-04-16T18:53:17.858Z", "stars": { "results": [], "count": 0 }, "collaborators": { "results": [], "count": 0 }, "subfolder_count": null, "refresh_interval": null, "organize_view_url": "https://chart-studio.plotly.com/~rschap/209/", "current_user_permission": "read", "is_theme": null, "is_template": false, "autosize": true, "caption": "", "figure": { "data": [ { "meta": { "columnNames": { "x": "FLMS14896_1:101", "y": "B" } }, "mode": "lines", "name": "RS 2", "type": "scatter", "xsrc": "rschap:208:4c6c31", "ysrc": "rschap:208:8d8363" } ], "frames": [], "layout": { "title": { "text": "Fluorescence Spectrum RS 2" }, "xaxis": { "type": "linear", "range": [ 430, 600 ], "title": { "text": "Wavelength (nm)" }, "autorange": false }, "yaxis": { "type": "linear", "range": [ -3925.6850000000004, 15000 ], "title": { "text": "Intensity" }, "autorange": false }, "autosize": true, "template": { "data": { "bar": [ { "type": "bar", "marker": { "colorbar": { "ticks": "", "outlinewidth": 0 } } } ], "table": [ { "type": "table", "cells": { "fill": { "color": "#EBF0F8" }, "line": { "color": "white" } }, "header": { "fill": { "color": "#C8D4E3" }, "line": { "color": "white" } } } ], "carpet": [ { "type": "carpet", "aaxis": { "gridcolor": "#C8D4E3", "linecolor": "#C8D4E3", "endlinecolor": "#2a3f5f", "minorgridcolor": "#C8D4E3", "startlinecolor": "#2a3f5f" }, "baxis": { "gridcolor": "#C8D4E3", "linecolor": "#C8D4E3", "endlinecolor": "#2a3f5f", "minorgridcolor": "#C8D4E3", "startlinecolor": "#2a3f5f" } } ], "mesh3d": [ { "type": "mesh3d", "colorbar": { "ticks": "", "outlinewidth": 0 } } ], "contour": [ { "type": "contour", "colorbar": { "ticks": "", "outlinewidth": 0 }, "autocolorscale": true } ], "heatmap": [ { "type": "heatmap", "colorbar": { "ticks": "", "outlinewidth": 0 }, "autocolorscale": true } ], "scatter": [ { "type": "scatter", "marker": { "colorbar": { "ticks": "", "outlinewidth": 0 } } } ], "surface": [ { "type": "surface", "colorbar": { "ticks": "", "outlinewidth": 0 } } ], "heatmapgl": [ { "type": "heatmapgl", "colorbar": { "ticks": "", "outlinewidth": 0 } } ], "histogram": [ { "type": "histogram", "marker": { "colorbar": { "ticks": "", "outlinewidth": 0 } } } ], "parcoords": [ { "line": { "colorbar": { "ticks": "", "outlinewidth": 0 } }, "type": "parcoords" } ], "scatter3d": [ { "type": "scatter3d", "marker": { "colorbar": { "ticks": "", "outlinewidth": 0 } } } ], "scattergl": [ { "type": "scattergl", "marker": { "colorbar": { "ticks": "", "outlinewidth": 0 } } } ], "choropleth": [ { "type": "choropleth", "colorbar": { "ticks": "", "outlinewidth": 0 } } ], "scattergeo": [ { "type": "scattergeo", "marker": { "colorbar": { "ticks": "", "outlinewidth": 0 } } } ], "histogram2d": [ { "type": "histogram2d", "colorbar": { "ticks": "", "outlinewidth": 0 }, "autocolorscale": true } ], "scatterpolar": [ { "type": "scatterpolar", "marker": { "colorbar": { "ticks": "", "outlinewidth": 0 } } } ], "contourcarpet": [ { "type": "contourcarpet", "colorbar": { "ticks": "", "outlinewidth": 0 } } ], "scattercarpet": [ { "type": "scattercarpet", "marker": { "colorbar": { "ticks": "", "outlinewidth": 0 } } } ], "scattermapbox": [ { "type": "scattermapbox", "marker": { "colorbar": { "ticks": "", "outlinewidth": 0 } } } ], "scatterpolargl": [ { "type": "scatterpolargl", "marker": { "colorbar": { "ticks": "", "outlinewidth": 0 } } } ], "scatterternary": [ { "type": "scatterternary", "marker": { "colorbar": { "ticks": "", "outlinewidth": 0 } } } ], "histogram2dcontour": [ { "type": "histogram2dcontour", "colorbar": { "ticks": "", "outlinewidth": 0 }, "autocolorscale": true } ] }, "layout": { "geo": { "bgcolor": "white", "showland": true, "lakecolor": "white", "landcolor": "white", "showlakes": true, "subunitcolor": "#C8D4E3" }, "font": { "color": "#2a3f5f" }, "polar": { "bgcolor": "white", "radialaxis": { "ticks": "", "gridcolor": "#EBF0F8", "linecolor": "#EBF0F8" }, "angularaxis": { "ticks": "", "gridcolor": "#EBF0F8", "linecolor": "#EBF0F8" } }, "scene": { "xaxis": { "ticks": "", "gridcolor": "#DFE8F3", "gridwidth": 2, "linecolor": "#EBF0F8", "zerolinecolor": "#EBF0F8", "showbackground": true, "backgroundcolor": "white" }, "yaxis": { "ticks": "", "gridcolor": "#DFE8F3", "gridwidth": 2, "linecolor": "#EBF0F8", "zerolinecolor": "#EBF0F8", "showbackground": true, "backgroundcolor": "white" }, "zaxis": { "ticks": "", "gridcolor": "#DFE8F3", "gridwidth": 2, "linecolor": "#EBF0F8", "zerolinecolor": "#EBF0F8", "showbackground": true, "backgroundcolor": "white" } }, "title": { "x": 0.05 }, "xaxis": { "ticks": "", "gridcolor": "#EBF0F8", "linecolor": "#EBF0F8", "automargin": true, "zerolinecolor": "#EBF0F8", "zerolinewidth": 2 }, "yaxis": { "ticks": "", "gridcolor": "#EBF0F8", "linecolor": "#EBF0F8", "automargin": true, "zerolinecolor": "#EBF0F8", "zerolinewidth": 2 }, "ternary": { "aaxis": { "ticks": "", "gridcolor": "#DFE8F3", "linecolor": "#A2B1C6" }, "baxis": { "ticks": "", "gridcolor": "#DFE8F3", "linecolor": "#A2B1C6" }, "caxis": { "ticks": "", "gridcolor": "#DFE8F3", "linecolor": "#A2B1C6" }, "bgcolor": "white" }, "colorway": [ "#636efa", "#EF553B", "#00cc96", "#ab63fa", "#19d3f3", "#e763fa", "#fecb52", "#ffa15a", "#ff6692", "#b6e880" ], "hovermode": "closest", "colorscale": { "diverging": [ [ 0, "#8e0152" ], [ 0.1, "#c51b7d" ], [ 0.2, "#de77ae" ], [ 0.3, "#f1b6da" ], [ 0.4, "#fde0ef" ], [ 0.5, "#f7f7f7" ], [ 0.6, "#e6f5d0" ], [ 0.7, "#b8e186" ], [ 0.8, "#7fbc41" ], [ 0.9, "#4d9221" ], [ 1, "#276419" ] ], "sequential": [ [ 0, "#0508b8" ], [ 0.0893854748603352, "#1910d8" ], [ 0.1787709497206704, "#3c19f0" ], [ 0.2681564245810056, "#6b1cfb" ], [ 0.3575418994413408, "#981cfd" ], [ 0.44692737430167595, "#bf1cfd" ], [ 0.5363128491620112, "#dd2bfd" ], [ 0.6256983240223464, "#f246fe" ], [ 0.7150837988826816, "#fc67fd" ], [ 0.8044692737430168, "#fe88fc" ], [ 0.8938547486033519, "#fea5fd" ], [ 0.9832402234636871, "#febefe" ], [ 1, "#fec3fe" ] ], "sequentialminus": [ [ 0, "#0508b8" ], [ 0.0893854748603352, "#1910d8" ], [ 0.1787709497206704, "#3c19f0" ], [ 0.2681564245810056, "#6b1cfb" ], [ 0.3575418994413408, "#981cfd" ], [ 0.44692737430167595, "#bf1cfd" ], [ 0.5363128491620112, "#dd2bfd" ], [ 0.6256983240223464, "#f246fe" ], [ 0.7150837988826816, "#fc67fd" ], [ 0.8044692737430168, "#fe88fc" ], [ 0.8938547486033519, "#fea5fd" ], [ 0.9832402234636871, "#febefe" ], [ 1, "#fec3fe" ] ] }, "plot_bgcolor": "white", "paper_bgcolor": "white", "shapedefaults": { "line": { "width": 0 }, "opacity": 0.4, "fillcolor": "#506784" }, "annotationdefaults": { "arrowhead": 0, "arrowcolor": "#506784", "arrowwidth": 1 } }, "themeRef": "PLOTLY_WHITE" } } }, "height": null, "width": null, "user": { "profile_url": "https://chart-studio.plotly.com/~rschap", "avatar_url": "https://storage.googleapis.com/plotly-prod-profiles/1.jpg", "background_url": "https://storage.googleapis.com/plotly-prod-profiles/bg-0.jpg", "bio": "", "nickname": "", "website": "", "stream_tokens": null, "feature_set_id": null, "csrf_token": null, "date_joined": "2021-09-30 16:39:55", "mapbox_access_tokens": null, "has_password": null, "username": "rschap", "email": null, "is_active": null, "readonly": null, "is_dash_creator": null, "dash_created_count": null, "is_chart_creator": null, "charts_created_count": null } } ] }
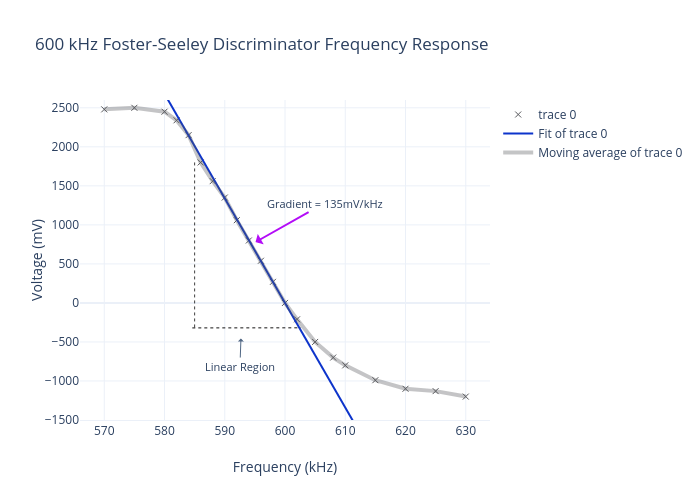