Plots


Jump to API response

This endpoint handles manipulation of Plotly plot files.

Reference

Authorization


Any user with or without a Plotly account may view public plots. For private plots, see authentication.

Actions


list

Listing all public plots can be done via a GET request to this endpoint. By default, plots will be listed in order of date created. The order_by query parameter is accepted at this endpoint. Currently, only ordering by views is supported. It is possible to filter the plots by quality with min_quality or max_quality as query parameter.

Example:

// GET https://api.plotly.com/v2/plots/ ---> 200

// GET https://api.plotly.com/v2/plots/?order_by=-views ---> 200

// GET https://api.plotly.com/v2/plots/?min_quality=5 ---> 200

// GET https://api.plotly.com/v2/plots/?max_quality=5 ---> 200

feed

Listing all handpicked feed plots can be done via a GET request to this endpoint. By default, plots will be listed in a random order.

Example:

// GET https://api.plotly.com/v2/plots/feed ---> 200

create

You can create new plot resources here. The only required field is 'figure'. Currently, the figure is restricted to only contain references to grid data. That is, this will fail if raw data arrays are passed in. To create and manipulate underlying grids for plots, see the grids endpoint.

Example:

// This fails because a figure field is required.
// POST https://api.plotly.com/v2/plots ---> 400 Bad Request
{}

// This fails because the figure has raw data
//POST https://api.plotly.com/v2/plots ---> 400 Bad Request
{
    "figure": {"data": [{"y": ['this', 'is', 'raw', 'data']}]}
}

// This succeeds because the figure has src keys, not raw data.
//POST https://api.plotly.com/v2/plots ---> 200 OK
{
    "figure": {"data": [{"ysrc": "sven:88:u8nd62"}]}
}

When creating a grid, you can optionally specify a source_fid to specify where a plot has come from:

  • source_fid: the fid of a plot that was copied (and presumably edited) to produce this one

detail

There is a lot of meta information stored about plot files including filename, title, share_url, and content_url to name a few.

This information can only be reached with a GET to this endpoint.

Example:

// GET https://api.plotly.com/v2/plots/iheartgraphs:90

content

The contents of a plot can be downloaded via the content resource. The plot content contains referenced grid/column data by default. If you wish to return the raw grid/column data, the inline_data=true query must be included in the request url. The Content-Type header will be appropriately set for the response body.

Alternatively, you can set ?map_data=unreadable to append a mapping of sources to data that belongs to grids which are unreadable for the requestor. This is useful when you have read access to another users plot, but that plot contains grid references which you don't have access to.

Examples:

// Returns referenced grid/column data
// GET https://api.plotly.com/v2/plots/iheartgraphs:90/content ---> 200 OK

// Returns full grid/column data
// GET https://api.plotly.com/v2/plots/iheartgraphs:90/content?inline_data=true ---> 200 OK

// Returns full grid/column data when requestor doesn't have permission
// to read the referenced grid.
// GET https://api.plotly.com/v2/plots/iheartgraphs:90/content?map_data=unreadable ---> 200 OK

GET /v2/plots?cursor=cD0yMDI0LTA0LTE2KzEzJTNBNDUlM0ExNi4wMzE1MTUlMkIwMCUzQTAw&format=api
HTTP 200 OK
Allow: GET, POST, HEAD, OPTIONS
Content-Type: application/json
Vary: Accept

{
    "next": "https://api.plotly.com/v2/plots?cursor=cD0yMDI0LTA0LTE2KzEzJTNBMTIlM0EwNS42OTAyNTYlMkIwMCUzQTAw&format=api",
    "previous": "https://api.plotly.com/v2/plots?cursor=cj0xJnA9MjAyNC0wNC0xNisxMyUzQTQxJTNBNDkuODIxNjU5JTJCMDAlM0EwMA%3D%3D&format=api",
    "results": [
        {
            "creation_time": "2024-04-16T13:41:49.821659Z",
            "comments": {
                "results": [],
                "count": 0
            },
            "parented": true,
            "embed_url": "https://chart-studio.plotly.com/~TWZ/1.embed",
            "fid": "TWZ:1",
            "filename": "Plot 1",
            "filetype": "plot",
            "img_url": "https://storage.googleapis.com/plotly-prod-images/TWZ/1/9_5PZ7CYUCW4FNDQMSX32J1FW76UJ1KD.png",
            "image_urls": {
                "default": "https://storage.googleapis.com/plotly-prod-images/TWZ/1/2_7NF0RW6DHJJNM05DTQYFY5WW4630VB.png",
                "block-thumb": "https://storage.googleapis.com/plotly-prod-images/TWZ/1/8_UOLRHVJO8KZAM1XXPMI6BHRGB8WLON.png",
                "list-thumb": "https://storage.googleapis.com/plotly-prod-images/TWZ/1/9_5PZ7CYUCW4FNDQMSX32J1FW76UJ1KD.png"
            },
            "api_urls": {
                "files": "https://api.plotly.com/v2/files/TWZ:1",
                "plots": "https://api.plotly.com/v2/plots/TWZ:1",
                "parent": "https://api.plotly.com/v2/folders/home?user=TWZ"
            },
            "owner": "TWZ",
            "parent": -1,
            "preview": "",
            "referencers": [],
            "references": [],
            "title": "",
            "views": 1,
            "web_url": "https://chart-studio.plotly.com/~TWZ/1/",
            "world_readable": true,
            "date_modified": "2024-04-16T13:42:02.137Z",
            "stars": {
                "results": [],
                "count": 0
            },
            "collaborators": {
                "results": [],
                "count": 0
            },
            "subfolder_count": null,
            "refresh_interval": null,
            "organize_view_url": "https://chart-studio.plotly.com/~TWZ/1/",
            "current_user_permission": "read",
            "is_theme": null,
            "is_template": false,
            "autosize": true,
            "caption": "",
            "figure": {
                "data": [
                    {
                        "meta": {
                            "columnNames": {
                                "x": "Tumor, x; Normal, x",
                                "y": "Normal, y"
                            }
                        },
                        "mode": "markers",
                        "name": "Normal",
                        "type": "bar",
                        "xsrc": "TWZ:0:3d527e",
                        "ysrc": "TWZ:0:f22ee0",
                        "yaxis": "y",
                        "orientation": "v"
                    },
                    {
                        "meta": {
                            "columnNames": {
                                "x": "Tumor, x; Normal, x",
                                "y": "Tumor, y"
                            }
                        },
                        "name": "Tumor",
                        "type": "bar",
                        "xsrc": "TWZ:0:3d527e",
                        "ysrc": "TWZ:0:33a655",
                        "visible": true,
                        "orientation": "v"
                    }
                ],
                "frames": [],
                "layout": {
                    "xaxis": {
                        "type": "category",
                        "range": [
                            -0.5,
                            31.5
                        ],
                        "title": {
                            "text": "The gene expression profile across all tumor samples and paired normal tissues.(Bar plot)"
                        },
                        "autorange": true
                    },
                    "yaxis": {
                        "type": "linear",
                        "range": [
                            0,
                            825.4210526315791
                        ],
                        "title": {
                            "text": "Expression - TPM"
                        },
                        "autorange": true
                    },
                    "autosize": true,
                    "template": {
                        "data": {
                            "bar": [
                                {
                                    "type": "bar",
                                    "marker": {
                                        "colorbar": {
                                            "ticks": "",
                                            "outlinewidth": 0
                                        }
                                    }
                                }
                            ],
                            "table": [
                                {
                                    "type": "table",
                                    "cells": {
                                        "fill": {
                                            "color": "#EBF0F8"
                                        },
                                        "line": {
                                            "color": "white"
                                        }
                                    },
                                    "header": {
                                        "fill": {
                                            "color": "#C8D4E3"
                                        },
                                        "line": {
                                            "color": "white"
                                        }
                                    }
                                }
                            ],
                            "carpet": [
                                {
                                    "type": "carpet",
                                    "aaxis": {
                                        "gridcolor": "#C8D4E3",
                                        "linecolor": "#C8D4E3",
                                        "endlinecolor": "#2a3f5f",
                                        "minorgridcolor": "#C8D4E3",
                                        "startlinecolor": "#2a3f5f"
                                    },
                                    "baxis": {
                                        "gridcolor": "#C8D4E3",
                                        "linecolor": "#C8D4E3",
                                        "endlinecolor": "#2a3f5f",
                                        "minorgridcolor": "#C8D4E3",
                                        "startlinecolor": "#2a3f5f"
                                    }
                                }
                            ],
                            "mesh3d": [
                                {
                                    "type": "mesh3d",
                                    "colorbar": {
                                        "ticks": "",
                                        "outlinewidth": 0
                                    }
                                }
                            ],
                            "contour": [
                                {
                                    "type": "contour",
                                    "colorbar": {
                                        "ticks": "",
                                        "outlinewidth": 0
                                    },
                                    "autocolorscale": true
                                }
                            ],
                            "heatmap": [
                                {
                                    "type": "heatmap",
                                    "colorbar": {
                                        "ticks": "",
                                        "outlinewidth": 0
                                    },
                                    "autocolorscale": true
                                }
                            ],
                            "scatter": [
                                {
                                    "type": "scatter",
                                    "marker": {
                                        "colorbar": {
                                            "ticks": "",
                                            "outlinewidth": 0
                                        }
                                    }
                                }
                            ],
                            "surface": [
                                {
                                    "type": "surface",
                                    "colorbar": {
                                        "ticks": "",
                                        "outlinewidth": 0
                                    }
                                }
                            ],
                            "heatmapgl": [
                                {
                                    "type": "heatmapgl",
                                    "colorbar": {
                                        "ticks": "",
                                        "outlinewidth": 0
                                    }
                                }
                            ],
                            "histogram": [
                                {
                                    "type": "histogram",
                                    "marker": {
                                        "colorbar": {
                                            "ticks": "",
                                            "outlinewidth": 0
                                        }
                                    }
                                }
                            ],
                            "parcoords": [
                                {
                                    "line": {
                                        "colorbar": {
                                            "ticks": "",
                                            "outlinewidth": 0
                                        }
                                    },
                                    "type": "parcoords"
                                }
                            ],
                            "scatter3d": [
                                {
                                    "type": "scatter3d",
                                    "marker": {
                                        "colorbar": {
                                            "ticks": "",
                                            "outlinewidth": 0
                                        }
                                    }
                                }
                            ],
                            "scattergl": [
                                {
                                    "type": "scattergl",
                                    "marker": {
                                        "colorbar": {
                                            "ticks": "",
                                            "outlinewidth": 0
                                        }
                                    }
                                }
                            ],
                            "choropleth": [
                                {
                                    "type": "choropleth",
                                    "colorbar": {
                                        "ticks": "",
                                        "outlinewidth": 0
                                    }
                                }
                            ],
                            "scattergeo": [
                                {
                                    "type": "scattergeo",
                                    "marker": {
                                        "colorbar": {
                                            "ticks": "",
                                            "outlinewidth": 0
                                        }
                                    }
                                }
                            ],
                            "histogram2d": [
                                {
                                    "type": "histogram2d",
                                    "colorbar": {
                                        "ticks": "",
                                        "outlinewidth": 0
                                    },
                                    "autocolorscale": true
                                }
                            ],
                            "scatterpolar": [
                                {
                                    "type": "scatterpolar",
                                    "marker": {
                                        "colorbar": {
                                            "ticks": "",
                                            "outlinewidth": 0
                                        }
                                    }
                                }
                            ],
                            "contourcarpet": [
                                {
                                    "type": "contourcarpet",
                                    "colorbar": {
                                        "ticks": "",
                                        "outlinewidth": 0
                                    }
                                }
                            ],
                            "scattercarpet": [
                                {
                                    "type": "scattercarpet",
                                    "marker": {
                                        "colorbar": {
                                            "ticks": "",
                                            "outlinewidth": 0
                                        }
                                    }
                                }
                            ],
                            "scattermapbox": [
                                {
                                    "type": "scattermapbox",
                                    "marker": {
                                        "colorbar": {
                                            "ticks": "",
                                            "outlinewidth": 0
                                        }
                                    }
                                }
                            ],
                            "scatterpolargl": [
                                {
                                    "type": "scatterpolargl",
                                    "marker": {
                                        "colorbar": {
                                            "ticks": "",
                                            "outlinewidth": 0
                                        }
                                    }
                                }
                            ],
                            "scatterternary": [
                                {
                                    "type": "scatterternary",
                                    "marker": {
                                        "colorbar": {
                                            "ticks": "",
                                            "outlinewidth": 0
                                        }
                                    }
                                }
                            ],
                            "histogram2dcontour": [
                                {
                                    "type": "histogram2dcontour",
                                    "colorbar": {
                                        "ticks": "",
                                        "outlinewidth": 0
                                    },
                                    "autocolorscale": true
                                }
                            ]
                        },
                        "layout": {
                            "geo": {
                                "bgcolor": "white",
                                "showland": true,
                                "lakecolor": "white",
                                "landcolor": "white",
                                "showlakes": true,
                                "subunitcolor": "#C8D4E3"
                            },
                            "font": {
                                "color": "#2a3f5f"
                            },
                            "polar": {
                                "bgcolor": "white",
                                "radialaxis": {
                                    "ticks": "",
                                    "gridcolor": "#EBF0F8",
                                    "linecolor": "#EBF0F8"
                                },
                                "angularaxis": {
                                    "ticks": "",
                                    "gridcolor": "#EBF0F8",
                                    "linecolor": "#EBF0F8"
                                }
                            },
                            "scene": {
                                "xaxis": {
                                    "ticks": "",
                                    "gridcolor": "#DFE8F3",
                                    "gridwidth": 2,
                                    "linecolor": "#EBF0F8",
                                    "zerolinecolor": "#EBF0F8",
                                    "showbackground": true,
                                    "backgroundcolor": "white"
                                },
                                "yaxis": {
                                    "ticks": "",
                                    "gridcolor": "#DFE8F3",
                                    "gridwidth": 2,
                                    "linecolor": "#EBF0F8",
                                    "zerolinecolor": "#EBF0F8",
                                    "showbackground": true,
                                    "backgroundcolor": "white"
                                },
                                "zaxis": {
                                    "ticks": "",
                                    "gridcolor": "#DFE8F3",
                                    "gridwidth": 2,
                                    "linecolor": "#EBF0F8",
                                    "zerolinecolor": "#EBF0F8",
                                    "showbackground": true,
                                    "backgroundcolor": "white"
                                }
                            },
                            "title": {
                                "x": 0.05
                            },
                            "xaxis": {
                                "ticks": "",
                                "gridcolor": "#EBF0F8",
                                "linecolor": "#EBF0F8",
                                "automargin": true,
                                "zerolinecolor": "#EBF0F8",
                                "zerolinewidth": 2
                            },
                            "yaxis": {
                                "ticks": "",
                                "gridcolor": "#EBF0F8",
                                "linecolor": "#EBF0F8",
                                "automargin": true,
                                "zerolinecolor": "#EBF0F8",
                                "zerolinewidth": 2
                            },
                            "ternary": {
                                "aaxis": {
                                    "ticks": "",
                                    "gridcolor": "#DFE8F3",
                                    "linecolor": "#A2B1C6"
                                },
                                "baxis": {
                                    "ticks": "",
                                    "gridcolor": "#DFE8F3",
                                    "linecolor": "#A2B1C6"
                                },
                                "caxis": {
                                    "ticks": "",
                                    "gridcolor": "#DFE8F3",
                                    "linecolor": "#A2B1C6"
                                },
                                "bgcolor": "white"
                            },
                            "colorway": [
                                "#636efa",
                                "#EF553B",
                                "#00cc96",
                                "#ab63fa",
                                "#19d3f3",
                                "#e763fa",
                                "#fecb52",
                                "#ffa15a",
                                "#ff6692",
                                "#b6e880"
                            ],
                            "hovermode": "closest",
                            "colorscale": {
                                "diverging": [
                                    [
                                        0,
                                        "#8e0152"
                                    ],
                                    [
                                        0.1,
                                        "#c51b7d"
                                    ],
                                    [
                                        0.2,
                                        "#de77ae"
                                    ],
                                    [
                                        0.3,
                                        "#f1b6da"
                                    ],
                                    [
                                        0.4,
                                        "#fde0ef"
                                    ],
                                    [
                                        0.5,
                                        "#f7f7f7"
                                    ],
                                    [
                                        0.6,
                                        "#e6f5d0"
                                    ],
                                    [
                                        0.7,
                                        "#b8e186"
                                    ],
                                    [
                                        0.8,
                                        "#7fbc41"
                                    ],
                                    [
                                        0.9,
                                        "#4d9221"
                                    ],
                                    [
                                        1,
                                        "#276419"
                                    ]
                                ],
                                "sequential": [
                                    [
                                        0,
                                        "#0508b8"
                                    ],
                                    [
                                        0.0893854748603352,
                                        "#1910d8"
                                    ],
                                    [
                                        0.1787709497206704,
                                        "#3c19f0"
                                    ],
                                    [
                                        0.2681564245810056,
                                        "#6b1cfb"
                                    ],
                                    [
                                        0.3575418994413408,
                                        "#981cfd"
                                    ],
                                    [
                                        0.44692737430167595,
                                        "#bf1cfd"
                                    ],
                                    [
                                        0.5363128491620112,
                                        "#dd2bfd"
                                    ],
                                    [
                                        0.6256983240223464,
                                        "#f246fe"
                                    ],
                                    [
                                        0.7150837988826816,
                                        "#fc67fd"
                                    ],
                                    [
                                        0.8044692737430168,
                                        "#fe88fc"
                                    ],
                                    [
                                        0.8938547486033519,
                                        "#fea5fd"
                                    ],
                                    [
                                        0.9832402234636871,
                                        "#febefe"
                                    ],
                                    [
                                        1,
                                        "#fec3fe"
                                    ]
                                ],
                                "sequentialminus": [
                                    [
                                        0,
                                        "#0508b8"
                                    ],
                                    [
                                        0.0893854748603352,
                                        "#1910d8"
                                    ],
                                    [
                                        0.1787709497206704,
                                        "#3c19f0"
                                    ],
                                    [
                                        0.2681564245810056,
                                        "#6b1cfb"
                                    ],
                                    [
                                        0.3575418994413408,
                                        "#981cfd"
                                    ],
                                    [
                                        0.44692737430167595,
                                        "#bf1cfd"
                                    ],
                                    [
                                        0.5363128491620112,
                                        "#dd2bfd"
                                    ],
                                    [
                                        0.6256983240223464,
                                        "#f246fe"
                                    ],
                                    [
                                        0.7150837988826816,
                                        "#fc67fd"
                                    ],
                                    [
                                        0.8044692737430168,
                                        "#fe88fc"
                                    ],
                                    [
                                        0.8938547486033519,
                                        "#fea5fd"
                                    ],
                                    [
                                        0.9832402234636871,
                                        "#febefe"
                                    ],
                                    [
                                        1,
                                        "#fec3fe"
                                    ]
                                ]
                            },
                            "plot_bgcolor": "white",
                            "paper_bgcolor": "white",
                            "shapedefaults": {
                                "line": {
                                    "width": 0
                                },
                                "opacity": 0.4,
                                "fillcolor": "#506784"
                            },
                            "annotationdefaults": {
                                "arrowhead": 0,
                                "arrowcolor": "#506784",
                                "arrowwidth": 1
                            }
                        },
                        "themeRef": "PLOTLY_WHITE"
                    }
                }
            },
            "height": null,
            "width": null,
            "user": {
                "profile_url": "https://chart-studio.plotly.com/~TWZ",
                "avatar_url": "https://storage.googleapis.com/plotly-prod-profiles/70.jpg",
                "background_url": "https://storage.googleapis.com/plotly-prod-profiles/bg-4.jpg",
                "bio": "",
                "nickname": "",
                "website": "",
                "stream_tokens": null,
                "feature_set_id": null,
                "csrf_token": null,
                "date_joined": "2024-04-16 13:30:36",
                "mapbox_access_tokens": null,
                "has_password": null,
                "username": "TWZ",
                "email": null,
                "is_active": null,
                "readonly": null,
                "is_dash_creator": null,
                "dash_created_count": null,
                "is_chart_creator": null,
                "charts_created_count": null
            }
        },
        {
            "creation_time": "2024-04-16T13:40:47.797375Z",
            "comments": {
                "results": [],
                "count": 0
            },
            "parented": true,
            "embed_url": "https://chart-studio.plotly.com/~peter.capcara/103.embed",
            "fid": "peter.capcara:103",
            "filename": "Plot 103",
            "filetype": "plot",
            "img_url": "https://storage.googleapis.com/plotly-prod-images/peter.capcara/103/9_TWEM9PYOFBR9AL1JFXGDU1RRWENVRP.png",
            "image_urls": {
                "default": "https://storage.googleapis.com/plotly-prod-images/peter.capcara/103/2_1LP84BY3Z9IZ36D80P6YR9UDIVI5XE.png",
                "block-thumb": "https://storage.googleapis.com/plotly-prod-images/peter.capcara/103/8_OLDOH8ZBHAY0M2ETK1822KOD2QPU5G.png",
                "list-thumb": "https://storage.googleapis.com/plotly-prod-images/peter.capcara/103/9_TWEM9PYOFBR9AL1JFXGDU1RRWENVRP.png"
            },
            "api_urls": {
                "files": "https://api.plotly.com/v2/files/peter.capcara:103",
                "plots": "https://api.plotly.com/v2/plots/peter.capcara:103",
                "parent": "https://api.plotly.com/v2/folders/home?user=peter.capcara"
            },
            "owner": "peter.capcara",
            "parent": -1,
            "preview": "",
            "referencers": [],
            "references": [],
            "title": "",
            "views": 2,
            "web_url": "https://chart-studio.plotly.com/~peter.capcara/103/",
            "world_readable": true,
            "date_modified": "2024-04-16T13:40:47.808Z",
            "stars": {
                "results": [],
                "count": 0
            },
            "collaborators": {
                "results": [],
                "count": 0
            },
            "subfolder_count": null,
            "refresh_interval": null,
            "organize_view_url": "https://chart-studio.plotly.com/~peter.capcara/103/",
            "current_user_permission": "read",
            "is_theme": null,
            "is_template": null,
            "autosize": true,
            "caption": "",
            "figure": {
                "data": [
                    {
                        "uid": "a1a8b8",
                        "asrc": "peter.capcara:102:a78e40",
                        "bsrc": "peter.capcara:102:978433",
                        "csrc": "peter.capcara:102:b732ee",
                        "fill": "toself",
                        "line": {
                            "color": "#444"
                        },
                        "mode": "lines",
                        "name": "PD",
                        "text": "PD",
                        "type": "scatterternary",
                        "subplot": "ternary",
                        "fillcolor": "#8dd3c7"
                    },
                    {
                        "uid": "c72344",
                        "asrc": "peter.capcara:102:0f3d2b",
                        "bsrc": "peter.capcara:102:23f23d",
                        "csrc": "peter.capcara:102:0f4883",
                        "fill": "toself",
                        "line": {
                            "color": "#444"
                        },
                        "mode": "lines",
                        "name": "D1",
                        "text": "D1",
                        "type": "scatterternary",
                        "subplot": "ternary",
                        "fillcolor": "#ffffb3"
                    },
                    {
                        "uid": "3eab74",
                        "asrc": "peter.capcara:102:d4559c",
                        "bsrc": "peter.capcara:102:4abaf8",
                        "csrc": "peter.capcara:102:bfef0f",
                        "fill": "toself",
                        "line": {
                            "color": "#444"
                        },
                        "mode": "lines",
                        "name": "D2",
                        "text": "D2",
                        "type": "scatterternary",
                        "subplot": "ternary",
                        "fillcolor": "#bebada"
                    },
                    {
                        "uid": "b9dc9f",
                        "asrc": "peter.capcara:102:1f1df4",
                        "bsrc": "peter.capcara:102:49bde1",
                        "csrc": "peter.capcara:102:73de85",
                        "fill": "toself",
                        "line": {
                            "color": "#444"
                        },
                        "mode": "lines",
                        "name": "DT",
                        "text": "DT",
                        "type": "scatterternary",
                        "subplot": "ternary",
                        "fillcolor": "#fb8072"
                    },
                    {
                        "uid": "381ad2",
                        "asrc": "peter.capcara:102:a964a1",
                        "bsrc": "peter.capcara:102:a2da40",
                        "csrc": "peter.capcara:102:4ac923",
                        "fill": "toself",
                        "line": {
                            "color": "#444"
                        },
                        "mode": "lines",
                        "name": "T1",
                        "text": "T1",
                        "type": "scatterternary",
                        "subplot": "ternary",
                        "fillcolor": "#80b1d3"
                    },
                    {
                        "uid": "8cc163",
                        "asrc": "peter.capcara:102:064aa3",
                        "bsrc": "peter.capcara:102:bd5483",
                        "csrc": "peter.capcara:102:824323",
                        "fill": "toself",
                        "line": {
                            "color": "#444"
                        },
                        "mode": "lines",
                        "name": "T2",
                        "text": "T2",
                        "type": "scatterternary",
                        "subplot": "ternary",
                        "fillcolor": "#fdb462"
                    },
                    {
                        "uid": "6f33dc",
                        "asrc": "peter.capcara:102:e5a7a4",
                        "bsrc": "peter.capcara:102:c41e5b",
                        "csrc": "peter.capcara:102:398506",
                        "fill": "toself",
                        "line": {
                            "color": "#444"
                        },
                        "mode": "lines",
                        "name": "T3",
                        "text": "T3",
                        "type": "scatterternary",
                        "opacity": 0.5,
                        "subplot": "ternary",
                        "fillcolor": "#b3de69"
                    },
                    {
                        "asrc": "peter.capcara:102:09723f",
                        "bsrc": "peter.capcara:102:132f1a",
                        "csrc": "peter.capcara:102:0346a2",
                        "mode": "markers",
                        "name": "3264.0",
                        "type": "scatterternary",
                        "marker": {
                            "size": 10,
                            "color": "blue",
                            "symbol": "diamond"
                        },
                        "subplot": "ternary"
                    },
                    {
                        "asrc": "peter.capcara:102:7edb6c",
                        "bsrc": "peter.capcara:102:ed489c",
                        "csrc": "peter.capcara:102:71e017",
                        "mode": "markers",
                        "name": "38.0",
                        "type": "scatterternary",
                        "marker": {
                            "size": 10,
                            "color": "blue",
                            "symbol": "diamond"
                        },
                        "subplot": "ternary"
                    },
                    {
                        "asrc": "peter.capcara:102:e1108f",
                        "bsrc": "peter.capcara:102:320b72",
                        "csrc": "peter.capcara:102:b87fdf",
                        "mode": "markers",
                        "name": "37.0",
                        "type": "scatterternary",
                        "marker": {
                            "size": 10,
                            "color": "blue",
                            "symbol": "diamond"
                        },
                        "subplot": "ternary"
                    },
                    {
                        "asrc": "peter.capcara:102:1e6263",
                        "bsrc": "peter.capcara:102:426265",
                        "csrc": "peter.capcara:102:404264",
                        "mode": "markers",
                        "name": "36.0",
                        "type": "scatterternary",
                        "marker": {
                            "size": 10,
                            "color": "blue",
                            "symbol": "diamond"
                        },
                        "subplot": "ternary"
                    },
                    {
                        "asrc": "peter.capcara:102:4c4d5b",
                        "bsrc": "peter.capcara:102:cfb2e5",
                        "csrc": "peter.capcara:102:f65191",
                        "mode": "markers",
                        "name": "35.0",
                        "type": "scatterternary",
                        "marker": {
                            "size": 10,
                            "color": "blue",
                            "symbol": "diamond"
                        },
                        "subplot": "ternary"
                    },
                    {
                        "asrc": "peter.capcara:102:a6668d",
                        "bsrc": "peter.capcara:102:83f6f2",
                        "csrc": "peter.capcara:102:292dd5",
                        "mode": "markers",
                        "name": "34.0",
                        "type": "scatterternary",
                        "marker": {
                            "size": 10,
                            "color": "blue",
                            "symbol": "diamond"
                        },
                        "subplot": "ternary"
                    },
                    {
                        "asrc": "peter.capcara:102:fc47ed",
                        "bsrc": "peter.capcara:102:1574d9",
                        "csrc": "peter.capcara:102:934da5",
                        "mode": "markers",
                        "name": "33.0",
                        "type": "scatterternary",
                        "marker": {
                            "size": 10,
                            "color": "blue",
                            "symbol": "diamond"
                        },
                        "subplot": "ternary"
                    },
                    {
                        "asrc": "peter.capcara:102:4d073f",
                        "bsrc": "peter.capcara:102:c34bd8",
                        "csrc": "peter.capcara:102:75aa03",
                        "mode": "markers",
                        "name": "32.0",
                        "type": "scatterternary",
                        "marker": {
                            "size": 10,
                            "color": "blue",
                            "symbol": "diamond"
                        },
                        "subplot": "ternary"
                    },
                    {
                        "asrc": "peter.capcara:102:d4c30b",
                        "bsrc": "peter.capcara:102:251979",
                        "csrc": "peter.capcara:102:dbb44f",
                        "mode": "markers",
                        "name": "31.0",
                        "type": "scatterternary",
                        "marker": {
                            "size": 10,
                            "color": "blue",
                            "symbol": "diamond"
                        },
                        "subplot": "ternary"
                    },
                    {
                        "type": "table",
                        "cells": {
                            "fill": {
                                "color": "lavender"
                            },
                            "align": "left",
                            "valuessrc": "peter.capcara:102:1654da"
                        },
                        "domain": {
                            "x": [
                                0.0,
                                1.0
                            ],
                            "y": [
                                0.0,
                                0.255
                            ]
                        },
                        "header": {
                            "fill": {
                                "color": "paleturquoise"
                            },
                            "align": "left",
                            "valuessrc": "peter.capcara:102:ce42fb"
                        },
                        "columnwidthsrc": "peter.capcara:102:4477ec"
                    }
                ],
                "layout": {
                    "title": {
                        "text": "Duval Triangle for DGA Interpretation"
                    },
                    "height": 1000,
                    "ternary": {
                        "sum": 100,
                        "aaxis": {
                            "min": 0.01,
                            "ticks": "outside",
                            "title": {
                                "text": "CH4(Methane)"
                            },
                            "linewidth": 2,
                            "ticksuffix": "%"
                        },
                        "baxis": {
                            "min": 0.01,
                            "ticks": "outside",
                            "title": {
                                "text": "C2H2(Acetylene)"
                            },
                            "linewidth": 2,
                            "ticksuffix": "%"
                        },
                        "caxis": {
                            "min": 0.01,
                            "ticks": "outside",
                            "title": {
                                "text": "C2H4(Ethylene)"
                            },
                            "linewidth": 2,
                            "ticksuffix": "%"
                        },
                        "domain": {
                            "x": [
                                0.0,
                                1.0
                            ],
                            "y": [
                                0.405,
                                1.0
                            ]
                        }
                    },
                    "autosize": true,
                    "template": {
                        "data": {
                            "bar": [
                                {
                                    "type": "bar",
                                    "marker": {
                                        "line": {
                                            "color": "#E5ECF6",
                                            "width": 0.5
                                        },
                                        "pattern": {
                                            "size": 10,
                                            "fillmode": "overlay",
                                            "solidity": 0.2
                                        }
                                    },
                                    "error_x": {
                                        "color": "#2a3f5f"
                                    },
                                    "error_y": {
                                        "color": "#2a3f5f"
                                    }
                                }
                            ],
                            "pie": [
                                {
                                    "type": "pie",
                                    "automargin": true
                                }
                            ],
                            "table": [
                                {
                                    "type": "table",
                                    "cells": {
                                        "fill": {
                                            "color": "#EBF0F8"
                                        },
                                        "line": {
                                            "color": "white"
                                        }
                                    },
                                    "header": {
                                        "fill": {
                                            "color": "#C8D4E3"
                                        },
                                        "line": {
                                            "color": "white"
                                        }
                                    }
                                }
                            ],
                            "carpet": [
                                {
                                    "type": "carpet",
                                    "aaxis": {
                                        "gridcolor": "white",
                                        "linecolor": "white",
                                        "endlinecolor": "#2a3f5f",
                                        "minorgridcolor": "white",
                                        "startlinecolor": "#2a3f5f"
                                    },
                                    "baxis": {
                                        "gridcolor": "white",
                                        "linecolor": "white",
                                        "endlinecolor": "#2a3f5f",
                                        "minorgridcolor": "white",
                                        "startlinecolor": "#2a3f5f"
                                    }
                                }
                            ],
                            "mesh3d": [
                                {
                                    "type": "mesh3d",
                                    "colorbar": {
                                        "ticks": "",
                                        "outlinewidth": 0
                                    }
                                }
                            ],
                            "contour": [
                                {
                                    "type": "contour",
                                    "colorbar": {
                                        "ticks": "",
                                        "outlinewidth": 0
                                    },
                                    "colorscale": [
                                        [
                                            0.0,
                                            "#0d0887"
                                        ],
                                        [
                                            0.1111111111111111,
                                            "#46039f"
                                        ],
                                        [
                                            0.2222222222222222,
                                            "#7201a8"
                                        ],
                                        [
                                            0.3333333333333333,
                                            "#9c179e"
                                        ],
                                        [
                                            0.4444444444444444,
                                            "#bd3786"
                                        ],
                                        [
                                            0.5555555555555556,
                                            "#d8576b"
                                        ],
                                        [
                                            0.6666666666666666,
                                            "#ed7953"
                                        ],
                                        [
                                            0.7777777777777778,
                                            "#fb9f3a"
                                        ],
                                        [
                                            0.8888888888888888,
                                            "#fdca26"
                                        ],
                                        [
                                            1.0,
                                            "#f0f921"
                                        ]
                                    ]
                                }
                            ],
                            "heatmap": [
                                {
                                    "type": "heatmap",
                                    "colorbar": {
                                        "ticks": "",
                                        "outlinewidth": 0
                                    },
                                    "colorscale": [
                                        [
                                            0.0,
                                            "#0d0887"
                                        ],
                                        [
                                            0.1111111111111111,
                                            "#46039f"
                                        ],
                                        [
                                            0.2222222222222222,
                                            "#7201a8"
                                        ],
                                        [
                                            0.3333333333333333,
                                            "#9c179e"
                                        ],
                                        [
                                            0.4444444444444444,
                                            "#bd3786"
                                        ],
                                        [
                                            0.5555555555555556,
                                            "#d8576b"
                                        ],
                                        [
                                            0.6666666666666666,
                                            "#ed7953"
                                        ],
                                        [
                                            0.7777777777777778,
                                            "#fb9f3a"
                                        ],
                                        [
                                            0.8888888888888888,
                                            "#fdca26"
                                        ],
                                        [
                                            1.0,
                                            "#f0f921"
                                        ]
                                    ]
                                }
                            ],
                            "scatter": [
                                {
                                    "type": "scatter",
                                    "fillpattern": {
                                        "size": 10,
                                        "fillmode": "overlay",
                                        "solidity": 0.2
                                    }
                                }
                            ],
                            "surface": [
                                {
                                    "type": "surface",
                                    "colorbar": {
                                        "ticks": "",
                                        "outlinewidth": 0
                                    },
                                    "colorscale": [
                                        [
                                            0.0,
                                            "#0d0887"
                                        ],
                                        [
                                            0.1111111111111111,
                                            "#46039f"
                                        ],
                                        [
                                            0.2222222222222222,
                                            "#7201a8"
                                        ],
                                        [
                                            0.3333333333333333,
                                            "#9c179e"
                                        ],
                                        [
                                            0.4444444444444444,
                                            "#bd3786"
                                        ],
                                        [
                                            0.5555555555555556,
                                            "#d8576b"
                                        ],
                                        [
                                            0.6666666666666666,
                                            "#ed7953"
                                        ],
                                        [
                                            0.7777777777777778,
                                            "#fb9f3a"
                                        ],
                                        [
                                            0.8888888888888888,
                                            "#fdca26"
                                        ],
                                        [
                                            1.0,
                                            "#f0f921"
                                        ]
                                    ]
                                }
                            ],
                            "barpolar": [
                                {
                                    "type": "barpolar",
                                    "marker": {
                                        "line": {
                                            "color": "#E5ECF6",
                                            "width": 0.5
                                        },
                                        "pattern": {
                                            "size": 10,
                                            "fillmode": "overlay",
                                            "solidity": 0.2
                                        }
                                    }
                                }
                            ],
                            "heatmapgl": [
                                {
                                    "type": "heatmapgl",
                                    "colorbar": {
                                        "ticks": "",
                                        "outlinewidth": 0
                                    },
                                    "colorscale": [
                                        [
                                            0.0,
                                            "#0d0887"
                                        ],
                                        [
                                            0.1111111111111111,
                                            "#46039f"
                                        ],
                                        [
                                            0.2222222222222222,
                                            "#7201a8"
                                        ],
                                        [
                                            0.3333333333333333,
                                            "#9c179e"
                                        ],
                                        [
                                            0.4444444444444444,
                                            "#bd3786"
                                        ],
                                        [
                                            0.5555555555555556,
                                            "#d8576b"
                                        ],
                                        [
                                            0.6666666666666666,
                                            "#ed7953"
                                        ],
                                        [
                                            0.7777777777777778,
                                            "#fb9f3a"
                                        ],
                                        [
                                            0.8888888888888888,
                                            "#fdca26"
                                        ],
                                        [
                                            1.0,
                                            "#f0f921"
                                        ]
                                    ]
                                }
                            ],
                            "histogram": [
                                {
                                    "type": "histogram",
                                    "marker": {
                                        "pattern": {
                                            "size": 10,
                                            "fillmode": "overlay",
                                            "solidity": 0.2
                                        }
                                    }
                                }
                            ],
                            "parcoords": [
                                {
                                    "line": {
                                        "colorbar": {
                                            "ticks": "",
                                            "outlinewidth": 0
                                        }
                                    },
                                    "type": "parcoords"
                                }
                            ],
                            "scatter3d": [
                                {
                                    "line": {
                                        "colorbar": {
                                            "ticks": "",
                                            "outlinewidth": 0
                                        }
                                    },
                                    "type": "scatter3d",
                                    "marker": {
                                        "colorbar": {
                                            "ticks": "",
                                            "outlinewidth": 0
                                        }
                                    }
                                }
                            ],
                            "scattergl": [
                                {
                                    "type": "scattergl",
                                    "marker": {
                                        "colorbar": {
                                            "ticks": "",
                                            "outlinewidth": 0
                                        }
                                    }
                                }
                            ],
                            "choropleth": [
                                {
                                    "type": "choropleth",
                                    "colorbar": {
                                        "ticks": "",
                                        "outlinewidth": 0
                                    }
                                }
                            ],
                            "scattergeo": [
                                {
                                    "type": "scattergeo",
                                    "marker": {
                                        "colorbar": {
                                            "ticks": "",
                                            "outlinewidth": 0
                                        }
                                    }
                                }
                            ],
                            "histogram2d": [
                                {
                                    "type": "histogram2d",
                                    "colorbar": {
                                        "ticks": "",
                                        "outlinewidth": 0
                                    },
                                    "colorscale": [
                                        [
                                            0.0,
                                            "#0d0887"
                                        ],
                                        [
                                            0.1111111111111111,
                                            "#46039f"
                                        ],
                                        [
                                            0.2222222222222222,
                                            "#7201a8"
                                        ],
                                        [
                                            0.3333333333333333,
                                            "#9c179e"
                                        ],
                                        [
                                            0.4444444444444444,
                                            "#bd3786"
                                        ],
                                        [
                                            0.5555555555555556,
                                            "#d8576b"
                                        ],
                                        [
                                            0.6666666666666666,
                                            "#ed7953"
                                        ],
                                        [
                                            0.7777777777777778,
                                            "#fb9f3a"
                                        ],
                                        [
                                            0.8888888888888888,
                                            "#fdca26"
                                        ],
                                        [
                                            1.0,
                                            "#f0f921"
                                        ]
                                    ]
                                }
                            ],
                            "scatterpolar": [
                                {
                                    "type": "scatterpolar",
                                    "marker": {
                                        "colorbar": {
                                            "ticks": "",
                                            "outlinewidth": 0
                                        }
                                    }
                                }
                            ],
                            "contourcarpet": [
                                {
                                    "type": "contourcarpet",
                                    "colorbar": {
                                        "ticks": "",
                                        "outlinewidth": 0
                                    }
                                }
                            ],
                            "scattercarpet": [
                                {
                                    "type": "scattercarpet",
                                    "marker": {
                                        "colorbar": {
                                            "ticks": "",
                                            "outlinewidth": 0
                                        }
                                    }
                                }
                            ],
                            "scattermapbox": [
                                {
                                    "type": "scattermapbox",
                                    "marker": {
                                        "colorbar": {
                                            "ticks": "",
                                            "outlinewidth": 0
                                        }
                                    }
                                }
                            ],
                            "scatterpolargl": [
                                {
                                    "type": "scatterpolargl",
                                    "marker": {
                                        "colorbar": {
                                            "ticks": "",
                                            "outlinewidth": 0
                                        }
                                    }
                                }
                            ],
                            "scatterternary": [
                                {
                                    "type": "scatterternary",
                                    "marker": {
                                        "colorbar": {
                                            "ticks": "",
                                            "outlinewidth": 0
                                        }
                                    }
                                }
                            ],
                            "histogram2dcontour": [
                                {
                                    "type": "histogram2dcontour",
                                    "colorbar": {
                                        "ticks": "",
                                        "outlinewidth": 0
                                    },
                                    "colorscale": [
                                        [
                                            0.0,
                                            "#0d0887"
                                        ],
                                        [
                                            0.1111111111111111,
                                            "#46039f"
                                        ],
                                        [
                                            0.2222222222222222,
                                            "#7201a8"
                                        ],
                                        [
                                            0.3333333333333333,
                                            "#9c179e"
                                        ],
                                        [
                                            0.4444444444444444,
                                            "#bd3786"
                                        ],
                                        [
                                            0.5555555555555556,
                                            "#d8576b"
                                        ],
                                        [
                                            0.6666666666666666,
                                            "#ed7953"
                                        ],
                                        [
                                            0.7777777777777778,
                                            "#fb9f3a"
                                        ],
                                        [
                                            0.8888888888888888,
                                            "#fdca26"
                                        ],
                                        [
                                            1.0,
                                            "#f0f921"
                                        ]
                                    ]
                                }
                            ]
                        },
                        "layout": {
                            "geo": {
                                "bgcolor": "white",
                                "showland": true,
                                "lakecolor": "white",
                                "landcolor": "#E5ECF6",
                                "showlakes": true,
                                "subunitcolor": "white"
                            },
                            "font": {
                                "color": "#2a3f5f"
                            },
                            "polar": {
                                "bgcolor": "#E5ECF6",
                                "radialaxis": {
                                    "ticks": "",
                                    "gridcolor": "white",
                                    "linecolor": "white"
                                },
                                "angularaxis": {
                                    "ticks": "",
                                    "gridcolor": "white",
                                    "linecolor": "white"
                                }
                            },
                            "scene": {
                                "xaxis": {
                                    "ticks": "",
                                    "gridcolor": "white",
                                    "gridwidth": 2,
                                    "linecolor": "white",
                                    "zerolinecolor": "white",
                                    "showbackground": true,
                                    "backgroundcolor": "#E5ECF6"
                                },
                                "yaxis": {
                                    "ticks": "",
                                    "gridcolor": "white",
                                    "gridwidth": 2,
                                    "linecolor": "white",
                                    "zerolinecolor": "white",
                                    "showbackground": true,
                                    "backgroundcolor": "#E5ECF6"
                                },
                                "zaxis": {
                                    "ticks": "",
                                    "gridcolor": "white",
                                    "gridwidth": 2,
                                    "linecolor": "white",
                                    "zerolinecolor": "white",
                                    "showbackground": true,
                                    "backgroundcolor": "#E5ECF6"
                                }
                            },
                            "title": {
                                "x": 0.05
                            },
                            "xaxis": {
                                "ticks": "",
                                "title": {
                                    "standoff": 15
                                },
                                "gridcolor": "white",
                                "linecolor": "white",
                                "automargin": true,
                                "zerolinecolor": "white",
                                "zerolinewidth": 2
                            },
                            "yaxis": {
                                "ticks": "",
                                "title": {
                                    "standoff": 15
                                },
                                "gridcolor": "white",
                                "linecolor": "white",
                                "automargin": true,
                                "zerolinecolor": "white",
                                "zerolinewidth": 2
                            },
                            "mapbox": {
                                "style": "light"
                            },
                            "ternary": {
                                "aaxis": {
                                    "ticks": "",
                                    "gridcolor": "white",
                                    "linecolor": "white"
                                },
                                "baxis": {
                                    "ticks": "",
                                    "gridcolor": "white",
                                    "linecolor": "white"
                                },
                                "caxis": {
                                    "ticks": "",
                                    "gridcolor": "white",
                                    "linecolor": "white"
                                },
                                "bgcolor": "#E5ECF6"
                            },
                            "colorway": [
                                "#636efa",
                                "#EF553B",
                                "#00cc96",
                                "#ab63fa",
                                "#FFA15A",
                                "#19d3f3",
                                "#FF6692",
                                "#B6E880",
                                "#FF97FF",
                                "#FECB52"
                            ],
                            "coloraxis": {
                                "colorbar": {
                                    "ticks": "",
                                    "outlinewidth": 0
                                }
                            },
                            "hovermode": "closest",
                            "colorscale": {
                                "diverging": [
                                    [
                                        0,
                                        "#8e0152"
                                    ],
                                    [
                                        0.1,
                                        "#c51b7d"
                                    ],
                                    [
                                        0.2,
                                        "#de77ae"
                                    ],
                                    [
                                        0.3,
                                        "#f1b6da"
                                    ],
                                    [
                                        0.4,
                                        "#fde0ef"
                                    ],
                                    [
                                        0.5,
                                        "#f7f7f7"
                                    ],
                                    [
                                        0.6,
                                        "#e6f5d0"
                                    ],
                                    [
                                        0.7,
                                        "#b8e186"
                                    ],
                                    [
                                        0.8,
                                        "#7fbc41"
                                    ],
                                    [
                                        0.9,
                                        "#4d9221"
                                    ],
                                    [
                                        1,
                                        "#276419"
                                    ]
                                ],
                                "sequential": [
                                    [
                                        0.0,
                                        "#0d0887"
                                    ],
                                    [
                                        0.1111111111111111,
                                        "#46039f"
                                    ],
                                    [
                                        0.2222222222222222,
                                        "#7201a8"
                                    ],
                                    [
                                        0.3333333333333333,
                                        "#9c179e"
                                    ],
                                    [
                                        0.4444444444444444,
                                        "#bd3786"
                                    ],
                                    [
                                        0.5555555555555556,
                                        "#d8576b"
                                    ],
                                    [
                                        0.6666666666666666,
                                        "#ed7953"
                                    ],
                                    [
                                        0.7777777777777778,
                                        "#fb9f3a"
                                    ],
                                    [
                                        0.8888888888888888,
                                        "#fdca26"
                                    ],
                                    [
                                        1.0,
                                        "#f0f921"
                                    ]
                                ],
                                "sequentialminus": [
                                    [
                                        0.0,
                                        "#0d0887"
                                    ],
                                    [
                                        0.1111111111111111,
                                        "#46039f"
                                    ],
                                    [
                                        0.2222222222222222,
                                        "#7201a8"
                                    ],
                                    [
                                        0.3333333333333333,
                                        "#9c179e"
                                    ],
                                    [
                                        0.4444444444444444,
                                        "#bd3786"
                                    ],
                                    [
                                        0.5555555555555556,
                                        "#d8576b"
                                    ],
                                    [
                                        0.6666666666666666,
                                        "#ed7953"
                                    ],
                                    [
                                        0.7777777777777778,
                                        "#fb9f3a"
                                    ],
                                    [
                                        0.8888888888888888,
                                        "#fdca26"
                                    ],
                                    [
                                        1.0,
                                        "#f0f921"
                                    ]
                                ]
                            },
                            "hoverlabel": {
                                "align": "left"
                            },
                            "plot_bgcolor": "#E5ECF6",
                            "paper_bgcolor": "white",
                            "shapedefaults": {
                                "line": {
                                    "color": "#2a3f5f"
                                }
                            },
                            "autotypenumbers": "strict",
                            "annotationdefaults": {
                                "arrowhead": 0,
                                "arrowcolor": "#2a3f5f",
                                "arrowwidth": 1
                            }
                        }
                    },
                    "showlegend": true
                }
            },
            "height": 1000,
            "width": null,
            "user": {
                "profile_url": "https://chart-studio.plotly.com/~peter.capcara",
                "avatar_url": "https://storage.googleapis.com/plotly-prod-profiles/41.jpg",
                "background_url": "https://storage.googleapis.com/plotly-prod-profiles/bg-0.jpg",
                "bio": "",
                "nickname": "",
                "website": "",
                "stream_tokens": null,
                "feature_set_id": null,
                "csrf_token": null,
                "date_joined": "2024-04-08 08:11:51",
                "mapbox_access_tokens": null,
                "has_password": null,
                "username": "peter.capcara",
                "email": null,
                "is_active": null,
                "readonly": null,
                "is_dash_creator": null,
                "dash_created_count": null,
                "is_chart_creator": null,
                "charts_created_count": null
            }
        },
        {
            "creation_time": "2024-04-16T13:39:55.999484Z",
            "comments": {
                "results": [],
                "count": 0
            },
            "parented": true,
            "embed_url": "https://chart-studio.plotly.com/~fredstat/164.embed",
            "fid": "fredstat:164",
            "filename": "Plot 164",
            "filetype": "plot",
            "img_url": "https://storage.googleapis.com/plotly-prod-images/fredstat/164/9_JNCOGLEAYRD3EZRYXYG7114YMR0LM0.png",
            "image_urls": {
                "default": "https://storage.googleapis.com/plotly-prod-images/fredstat/164/2_MJS1IOQNY2A2D9EBIDBUYBBRXQJEC3.png",
                "block-thumb": "https://storage.googleapis.com/plotly-prod-images/fredstat/164/8_Q0O5S1PS708WMSHQN6EO04P0S4X08O.png",
                "list-thumb": "https://storage.googleapis.com/plotly-prod-images/fredstat/164/9_JNCOGLEAYRD3EZRYXYG7114YMR0LM0.png"
            },
            "api_urls": {
                "files": "https://api.plotly.com/v2/files/fredstat:164",
                "plots": "https://api.plotly.com/v2/plots/fredstat:164",
                "parent": "https://api.plotly.com/v2/folders/home?user=fredstat"
            },
            "owner": "fredstat",
            "parent": -1,
            "preview": "",
            "referencers": [],
            "references": [],
            "title": "",
            "views": 3,
            "web_url": "https://chart-studio.plotly.com/~fredstat/164/",
            "world_readable": true,
            "date_modified": "2024-04-16T20:28:46.446Z",
            "stars": {
                "results": [],
                "count": 0
            },
            "collaborators": {
                "results": [],
                "count": 0
            },
            "subfolder_count": null,
            "refresh_interval": null,
            "organize_view_url": "https://chart-studio.plotly.com/~fredstat/164/",
            "current_user_permission": "read",
            "is_theme": null,
            "is_template": false,
            "autosize": true,
            "caption": "",
            "figure": {
                "data": [
                    {
                        "meta": {
                            "columnNames": {
                                "x": "B",
                                "text": "B",
                                "textposition": "A"
                            }
                        },
                        "mode": "markers",
                        "type": "bar",
                        "xsrc": "fredstat:163:68af54",
                        "textsrc": "fredstat:163:68af54",
                        "textangle": -90,
                        "orientation": "h",
                        "textposition": "auto",
                        "texttemplate": "",
                        "constraintext": "none"
                    },
                    {
                        "meta": {
                            "columnNames": {
                                "x": "E",
                                "y": "F"
                            }
                        },
                        "mode": "markers+lines",
                        "type": "scatter",
                        "xsrc": "fredstat:163:59d5fd",
                        "ysrc": "fredstat:163:67df24",
                        "xaxis": "x",
                        "yaxis": "y2",
                        "orientation": "h"
                    }
                ],
                "frames": [],
                "layout": {
                    "xaxis": {
                        "type": "linear",
                        "range": [
                            0,
                            14.79100308717597
                        ],
                        "anchor": "free",
                        "domain": [
                            0,
                            1
                        ],
                        "autorange": true
                    },
                    "yaxis": {
                        "range": [
                            -0.5,
                            0.5
                        ],
                        "anchor": "free",
                        "domain": [
                            0.625,
                            1
                        ],
                        "autorange": true
                    },
                    "shapes": [
                        {
                            "x0": 0,
                            "x1": 1,
                            "y0": 7,
                            "y1": 11,
                            "line": {
                                "color": "#444444",
                                "width": 1
                            },
                            "xref": "paper",
                            "yref": "y2",
                            "opacity": 0.3,
                            "fillcolor": "#7f7f7f"
                        }
                    ],
                    "yaxis2": {
                        "side": "left",
                        "type": "linear",
                        "range": [
                            6.989976193459467,
                            11.290189199348452
                        ],
                        "anchor": "free",
                        "domain": [
                            0,
                            0.5
                        ],
                        "autorange": true,
                        "overlaying": false
                    },
                    "autosize": true,
                    "template": {
                        "data": {
                            "bar": [
                                {
                                    "type": "bar",
                                    "marker": {
                                        "colorbar": {
                                            "ticks": "",
                                            "outlinewidth": 0
                                        }
                                    }
                                }
                            ],
                            "table": [
                                {
                                    "type": "table",
                                    "cells": {
                                        "fill": {
                                            "color": "#EBF0F8"
                                        },
                                        "line": {
                                            "color": "white"
                                        }
                                    },
                                    "header": {
                                        "fill": {
                                            "color": "#C8D4E3"
                                        },
                                        "line": {
                                            "color": "white"
                                        }
                                    }
                                }
                            ],
                            "carpet": [
                                {
                                    "type": "carpet",
                                    "aaxis": {
                                        "gridcolor": "#C8D4E3",
                                        "linecolor": "#C8D4E3",
                                        "endlinecolor": "#2a3f5f",
                                        "minorgridcolor": "#C8D4E3",
                                        "startlinecolor": "#2a3f5f"
                                    },
                                    "baxis": {
                                        "gridcolor": "#C8D4E3",
                                        "linecolor": "#C8D4E3",
                                        "endlinecolor": "#2a3f5f",
                                        "minorgridcolor": "#C8D4E3",
                                        "startlinecolor": "#2a3f5f"
                                    }
                                }
                            ],
                            "mesh3d": [
                                {
                                    "type": "mesh3d",
                                    "colorbar": {
                                        "ticks": "",
                                        "outlinewidth": 0
                                    }
                                }
                            ],
                            "contour": [
                                {
                                    "type": "contour",
                                    "colorbar": {
                                        "ticks": "",
                                        "outlinewidth": 0
                                    },
                                    "autocolorscale": true
                                }
                            ],
                            "heatmap": [
                                {
                                    "type": "heatmap",
                                    "colorbar": {
                                        "ticks": "",
                                        "outlinewidth": 0
                                    },
                                    "autocolorscale": true
                                }
                            ],
                            "scatter": [
                                {
                                    "type": "scatter",
                                    "marker": {
                                        "colorbar": {
                                            "ticks": "",
                                            "outlinewidth": 0
                                        }
                                    }
                                }
                            ],
                            "surface": [
                                {
                                    "type": "surface",
                                    "colorbar": {
                                        "ticks": "",
                                        "outlinewidth": 0
                                    }
                                }
                            ],
                            "heatmapgl": [
                                {
                                    "type": "heatmapgl",
                                    "colorbar": {
                                        "ticks": "",
                                        "outlinewidth": 0
                                    }
                                }
                            ],
                            "histogram": [
                                {
                                    "type": "histogram",
                                    "marker": {
                                        "colorbar": {
                                            "ticks": "",
                                            "outlinewidth": 0
                                        }
                                    }
                                }
                            ],
                            "parcoords": [
                                {
                                    "line": {
                                        "colorbar": {
                                            "ticks": "",
                                            "outlinewidth": 0
                                        }
                                    },
                                    "type": "parcoords"
                                }
                            ],
                            "scatter3d": [
                                {
                                    "type": "scatter3d",
                                    "marker": {
                                        "colorbar": {
                                            "ticks": "",
                                            "outlinewidth": 0
                                        }
                                    }
                                }
                            ],
                            "scattergl": [
                                {
                                    "type": "scattergl",
                                    "marker": {
                                        "colorbar": {
                                            "ticks": "",
                                            "outlinewidth": 0
                                        }
                                    }
                                }
                            ],
                            "choropleth": [
                                {
                                    "type": "choropleth",
                                    "colorbar": {
                                        "ticks": "",
                                        "outlinewidth": 0
                                    }
                                }
                            ],
                            "scattergeo": [
                                {
                                    "type": "scattergeo",
                                    "marker": {
                                        "colorbar": {
                                            "ticks": "",
                                            "outlinewidth": 0
                                        }
                                    }
                                }
                            ],
                            "histogram2d": [
                                {
                                    "type": "histogram2d",
                                    "colorbar": {
                                        "ticks": "",
                                        "outlinewidth": 0
                                    },
                                    "autocolorscale": true
                                }
                            ],
                            "scatterpolar": [
                                {
                                    "type": "scatterpolar",
                                    "marker": {
                                        "colorbar": {
                                            "ticks": "",
                                            "outlinewidth": 0
                                        }
                                    }
                                }
                            ],
                            "contourcarpet": [
                                {
                                    "type": "contourcarpet",
                                    "colorbar": {
                                        "ticks": "",
                                        "outlinewidth": 0
                                    }
                                }
                            ],
                            "scattercarpet": [
                                {
                                    "type": "scattercarpet",
                                    "marker": {
                                        "colorbar": {
                                            "ticks": "",
                                            "outlinewidth": 0
                                        }
                                    }
                                }
                            ],
                            "scattermapbox": [
                                {
                                    "type": "scattermapbox",
                                    "marker": {
                                        "colorbar": {
                                            "ticks": "",
                                            "outlinewidth": 0
                                        }
                                    }
                                }
                            ],
                            "scatterpolargl": [
                                {
                                    "type": "scatterpolargl",
                                    "marker": {
                                        "colorbar": {
                                            "ticks": "",
                                            "outlinewidth": 0
                                        }
                                    }
                                }
                            ],
                            "scatterternary": [
                                {
                                    "type": "scatterternary",
                                    "marker": {
                                        "colorbar": {
                                            "ticks": "",
                                            "outlinewidth": 0
                                        }
                                    }
                                }
                            ],
                            "histogram2dcontour": [
                                {
                                    "type": "histogram2dcontour",
                                    "colorbar": {
                                        "ticks": "",
                                        "outlinewidth": 0
                                    },
                                    "autocolorscale": true
                                }
                            ]
                        },
                        "layout": {
                            "geo": {
                                "bgcolor": "white",
                                "showland": true,
                                "lakecolor": "white",
                                "landcolor": "white",
                                "showlakes": true,
                                "subunitcolor": "#C8D4E3"
                            },
                            "font": {
                                "color": "#2a3f5f"
                            },
                            "polar": {
                                "bgcolor": "white",
                                "radialaxis": {
                                    "ticks": "",
                                    "gridcolor": "#EBF0F8",
                                    "linecolor": "#EBF0F8"
                                },
                                "angularaxis": {
                                    "ticks": "",
                                    "gridcolor": "#EBF0F8",
                                    "linecolor": "#EBF0F8"
                                }
                            },
                            "scene": {
                                "xaxis": {
                                    "ticks": "",
                                    "gridcolor": "#DFE8F3",
                                    "gridwidth": 2,
                                    "linecolor": "#EBF0F8",
                                    "zerolinecolor": "#EBF0F8",
                                    "showbackground": true,
                                    "backgroundcolor": "white"
                                },
                                "yaxis": {
                                    "ticks": "",
                                    "gridcolor": "#DFE8F3",
                                    "gridwidth": 2,
                                    "linecolor": "#EBF0F8",
                                    "zerolinecolor": "#EBF0F8",
                                    "showbackground": true,
                                    "backgroundcolor": "white"
                                },
                                "zaxis": {
                                    "ticks": "",
                                    "gridcolor": "#DFE8F3",
                                    "gridwidth": 2,
                                    "linecolor": "#EBF0F8",
                                    "zerolinecolor": "#EBF0F8",
                                    "showbackground": true,
                                    "backgroundcolor": "white"
                                }
                            },
                            "title": {
                                "x": 0.05
                            },
                            "xaxis": {
                                "ticks": "",
                                "gridcolor": "#EBF0F8",
                                "linecolor": "#EBF0F8",
                                "automargin": true,
                                "zerolinecolor": "#EBF0F8",
                                "zerolinewidth": 2
                            },
                            "yaxis": {
                                "ticks": "",
                                "gridcolor": "#EBF0F8",
                                "linecolor": "#EBF0F8",
                                "automargin": true,
                                "zerolinecolor": "#EBF0F8",
                                "zerolinewidth": 2
                            },
                            "ternary": {
                                "aaxis": {
                                    "ticks": "",
                                    "gridcolor": "#DFE8F3",
                                    "linecolor": "#A2B1C6"
                                },
                                "baxis": {
                                    "ticks": "",
                                    "gridcolor": "#DFE8F3",
                                    "linecolor": "#A2B1C6"
                                },
                                "caxis": {
                                    "ticks": "",
                                    "gridcolor": "#DFE8F3",
                                    "linecolor": "#A2B1C6"
                                },
                                "bgcolor": "white"
                            },
                            "colorway": [
                                "#636efa",
                                "#EF553B",
                                "#00cc96",
                                "#ab63fa",
                                "#19d3f3",
                                "#e763fa",
                                "#fecb52",
                                "#ffa15a",
                                "#ff6692",
                                "#b6e880"
                            ],
                            "hovermode": "closest",
                            "colorscale": {
                                "diverging": [
                                    [
                                        0,
                                        "#8e0152"
                                    ],
                                    [
                                        0.1,
                                        "#c51b7d"
                                    ],
                                    [
                                        0.2,
                                        "#de77ae"
                                    ],
                                    [
                                        0.3,
                                        "#f1b6da"
                                    ],
                                    [
                                        0.4,
                                        "#fde0ef"
                                    ],
                                    [
                                        0.5,
                                        "#f7f7f7"
                                    ],
                                    [
                                        0.6,
                                        "#e6f5d0"
                                    ],
                                    [
                                        0.7,
                                        "#b8e186"
                                    ],
                                    [
                                        0.8,
                                        "#7fbc41"
                                    ],
                                    [
                                        0.9,
                                        "#4d9221"
                                    ],
                                    [
                                        1,
                                        "#276419"
                                    ]
                                ],
                                "sequential": [
                                    [
                                        0,
                                        "#0508b8"
                                    ],
                                    [
                                        0.0893854748603352,
                                        "#1910d8"
                                    ],
                                    [
                                        0.1787709497206704,
                                        "#3c19f0"
                                    ],
                                    [
                                        0.2681564245810056,
                                        "#6b1cfb"
                                    ],
                                    [
                                        0.3575418994413408,
                                        "#981cfd"
                                    ],
                                    [
                                        0.44692737430167595,
                                        "#bf1cfd"
                                    ],
                                    [
                                        0.5363128491620112,
                                        "#dd2bfd"
                                    ],
                                    [
                                        0.6256983240223464,
                                        "#f246fe"
                                    ],
                                    [
                                        0.7150837988826816,
                                        "#fc67fd"
                                    ],
                                    [
                                        0.8044692737430168,
                                        "#fe88fc"
                                    ],
                                    [
                                        0.8938547486033519,
                                        "#fea5fd"
                                    ],
                                    [
                                        0.9832402234636871,
                                        "#febefe"
                                    ],
                                    [
                                        1,
                                        "#fec3fe"
                                    ]
                                ],
                                "sequentialminus": [
                                    [
                                        0,
                                        "#0508b8"
                                    ],
                                    [
                                        0.0893854748603352,
                                        "#1910d8"
                                    ],
                                    [
                                        0.1787709497206704,
                                        "#3c19f0"
                                    ],
                                    [
                                        0.2681564245810056,
                                        "#6b1cfb"
                                    ],
                                    [
                                        0.3575418994413408,
                                        "#981cfd"
                                    ],
                                    [
                                        0.44692737430167595,
                                        "#bf1cfd"
                                    ],
                                    [
                                        0.5363128491620112,
                                        "#dd2bfd"
                                    ],
                                    [
                                        0.6256983240223464,
                                        "#f246fe"
                                    ],
                                    [
                                        0.7150837988826816,
                                        "#fc67fd"
                                    ],
                                    [
                                        0.8044692737430168,
                                        "#fe88fc"
                                    ],
                                    [
                                        0.8938547486033519,
                                        "#fea5fd"
                                    ],
                                    [
                                        0.9832402234636871,
                                        "#febefe"
                                    ],
                                    [
                                        1,
                                        "#fec3fe"
                                    ]
                                ]
                            },
                            "plot_bgcolor": "white",
                            "paper_bgcolor": "white",
                            "shapedefaults": {
                                "line": {
                                    "width": 0
                                },
                                "opacity": 0.4,
                                "fillcolor": "#506784"
                            },
                            "annotationdefaults": {
                                "arrowhead": 0,
                                "arrowcolor": "#506784",
                                "arrowwidth": 1
                            }
                        },
                        "themeRef": "PLOTLY_WHITE"
                    },
                    "annotations": [
                        {
                            "x": 0,
                            "y": 8.15,
                            "font": {
                                "size": 15,
                                "color": "rgb(142, 71, 89)"
                            },
                            "text": "WBC",
                            "xref": "paper",
                            "yref": "y2",
                            "align": "center",
                            "xanchor": "right",
                            "yanchor": "bottom",
                            "textangle": -90,
                            "arrowcolor": "rgb(70, 95, 126)",
                            "arrowwidth": 0.1
                        }
                    ],
                    "plot_bgcolor": "rgb(255, 255, 255)",
                    "paper_bgcolor": "rgb(255, 255, 255)"
                }
            },
            "height": null,
            "width": null,
            "user": {
                "profile_url": "https://chart-studio.plotly.com/~fredstat",
                "avatar_url": "https://storage.googleapis.com/plotly-prod-profiles/40.jpg",
                "background_url": "https://storage.googleapis.com/plotly-prod-profiles/bg-6.jpg",
                "bio": "",
                "nickname": "",
                "website": "",
                "stream_tokens": null,
                "feature_set_id": null,
                "csrf_token": null,
                "date_joined": "2021-05-16 16:21:01",
                "mapbox_access_tokens": null,
                "has_password": null,
                "username": "fredstat",
                "email": null,
                "is_active": null,
                "readonly": null,
                "is_dash_creator": null,
                "dash_created_count": null,
                "is_chart_creator": null,
                "charts_created_count": null
            }
        },
        {
            "creation_time": "2024-04-16T13:32:06.872426Z",
            "comments": {
                "results": [],
                "count": 0
            },
            "parented": true,
            "embed_url": "https://chart-studio.plotly.com/~henrytran360/9.embed",
            "fid": "henrytran360:9",
            "filename": "Age in Road Accidents",
            "filetype": "plot",
            "img_url": "https://storage.googleapis.com/plotly-prod-images/henrytran360/9/9_8JGBW2FI2D9LDYDQUOOHDK755ING14.png",
            "image_urls": {
                "default": "https://storage.googleapis.com/plotly-prod-images/henrytran360/9/2_D7AO7VSKOXC4YR9UD3WREGBP27HB4K.png",
                "block-thumb": "https://storage.googleapis.com/plotly-prod-images/henrytran360/9/8_Y6BI9LW9HGIZ7Q262MPL0M2YWVEHYV.png",
                "list-thumb": "https://storage.googleapis.com/plotly-prod-images/henrytran360/9/9_8JGBW2FI2D9LDYDQUOOHDK755ING14.png"
            },
            "api_urls": {
                "files": "https://api.plotly.com/v2/files/henrytran360:9",
                "plots": "https://api.plotly.com/v2/plots/henrytran360:9",
                "parent": "https://api.plotly.com/v2/folders/home?user=henrytran360"
            },
            "owner": "henrytran360",
            "parent": -1,
            "preview": "",
            "referencers": [],
            "references": [],
            "title": "",
            "views": 5,
            "web_url": "https://chart-studio.plotly.com/~henrytran360/9/",
            "world_readable": true,
            "date_modified": "2024-04-16T13:32:15.354Z",
            "stars": {
                "results": [],
                "count": 0
            },
            "collaborators": {
                "results": [],
                "count": 0
            },
            "subfolder_count": null,
            "refresh_interval": null,
            "organize_view_url": "https://chart-studio.plotly.com/~henrytran360/9/",
            "current_user_permission": "read",
            "is_theme": null,
            "is_template": null,
            "autosize": true,
            "caption": "",
            "figure": {
                "data": [
                    {
                        "line": {
                            "dash": "solid",
                            "color": "rgba(248,118,109,1)",
                            "width": 3.7795275590551185
                        },
                        "mode": "lines",
                        "name": "Motor-vehicle",
                        "type": "scatter",
                        "xsrc": "henrytran360:8:c5911f",
                        "ysrc": "henrytran360:8:c4d727",
                        "frame": null,
                        "xaxis": "x",
                        "yaxis": "y",
                        "hoveron": "points",
                        "textsrc": "henrytran360:8:69eeaf",
                        "hoverinfo": "text",
                        "showlegend": true,
                        "legendgroup": "Motor-vehicle"
                    }
                ],
                "layout": {
                    "font": {
                        "size": 14.611872146118724,
                        "color": "rgba(0,0,0,1)",
                        "family": ""
                    },
                    "title": {
                        "x": 0,
                        "font": {
                            "size": 17.534246575342465,
                            "color": "rgba(0,0,0,1)",
                            "family": ""
                        },
                        "text": "Motor Vehicle Deaths (1999 - 2019)",
                        "xref": "paper"
                    },
                    "xaxis": {
                        "type": "linear",
                        "range": [
                            -4.95,
                            103.95
                        ],
                        "ticks": "",
                        "title": {
                            "font": {
                                "size": 14.611872146118724,
                                "color": "rgba(0,0,0,1)",
                                "family": ""
                            },
                            "text": "Age"
                        },
                        "anchor": "y",
                        "domain": [
                            0,
                            1
                        ],
                        "nticks": null,
                        "ticklen": 3.652968036529681,
                        "showgrid": true,
                        "showline": false,
                        "tickfont": {
                            "size": 11.68949771689498,
                            "color": "rgba(77,77,77,1)",
                            "family": ""
                        },
                        "tickmode": "array",
                        "ticktext": [
                            "0",
                            "25",
                            "50",
                            "75",
                            "100"
                        ],
                        "tickvals": [
                            0,
                            25,
                            50,
                            75,
                            100
                        ],
                        "zeroline": false,
                        "autorange": false,
                        "gridcolor": "rgba(235,235,235,1)",
                        "gridwidth": 0.66417600664176,
                        "linecolor": null,
                        "linewidth": 0,
                        "tickangle": 0,
                        "tickcolor": null,
                        "tickwidth": 0,
                        "automargin": true,
                        "hoverformat": ".2f",
                        "categoryarray": [
                            "0",
                            "25",
                            "50",
                            "75",
                            "100"
                        ],
                        "categoryorder": "array",
                        "showticklabels": true
                    },
                    "yaxis": {
                        "type": "linear",
                        "range": [
                            -1045.4,
                            23779.4
                        ],
                        "ticks": "",
                        "title": {
                            "font": {
                                "size": 14.611872146118724,
                                "color": "rgba(0,0,0,1)",
                                "family": ""
                            },
                            "text": "Total Deaths"
                        },
                        "anchor": "x",
                        "domain": [
                            0,
                            1
                        ],
                        "nticks": null,
                        "ticklen": 3.652968036529681,
                        "showgrid": true,
                        "showline": false,
                        "tickfont": {
                            "size": 11.68949771689498,
                            "color": "rgba(77,77,77,1)",
                            "family": ""
                        },
                        "tickmode": "array",
                        "ticktext": [
                            "0",
                            "5000",
                            "10000",
                            "15000",
                            "20000"
                        ],
                        "tickvals": [
                            0,
                            5000,
                            10000,
                            15000.000000000002,
                            20000
                        ],
                        "zeroline": false,
                        "autorange": false,
                        "gridcolor": "rgba(235,235,235,1)",
                        "gridwidth": 0.66417600664176,
                        "linecolor": null,
                        "linewidth": 0,
                        "tickangle": 0,
                        "tickcolor": null,
                        "tickwidth": 0,
                        "automargin": true,
                        "hoverformat": ".2f",
                        "categoryarray": [
                            "0",
                            "5000",
                            "10000",
                            "15000",
                            "20000"
                        ],
                        "categoryorder": "array",
                        "showticklabels": true
                    },
                    "legend": {
                        "font": {
                            "size": 11.68949771689498,
                            "color": "rgba(0,0,0,1)",
                            "family": ""
                        },
                        "bgcolor": null,
                        "bordercolor": null,
                        "borderwidth": 0
                    },
                    "margin": {
                        "b": 42.640997161545116,
                        "l": 54.79452054794521,
                        "r": 7.305936073059362,
                        "t": 46.2209058373442
                    },
                    "shapes": [
                        {
                            "x0": 0,
                            "x1": 1,
                            "y0": 0,
                            "y1": 1,
                            "line": {
                                "color": null,
                                "width": 0,
                                "linetype": []
                            },
                            "type": "rect",
                            "xref": "paper",
                            "yref": "paper",
                            "fillcolor": null
                        }
                    ],
                    "barmode": "relative",
                    "hovermode": "closest",
                    "showlegend": false
                }
            },
            "height": null,
            "width": null,
            "user": {
                "profile_url": "https://chart-studio.plotly.com/~henrytran360",
                "avatar_url": "https://storage.googleapis.com/plotly-prod-profiles/86.jpg",
                "background_url": "https://storage.googleapis.com/plotly-prod-profiles/bg-0.jpg",
                "bio": "",
                "nickname": "",
                "website": "",
                "stream_tokens": null,
                "feature_set_id": null,
                "csrf_token": null,
                "date_joined": "2024-04-15 01:06:50",
                "mapbox_access_tokens": null,
                "has_password": null,
                "username": "henrytran360",
                "email": null,
                "is_active": null,
                "readonly": null,
                "is_dash_creator": null,
                "dash_created_count": null,
                "is_chart_creator": null,
                "charts_created_count": null
            }
        },
        {
            "creation_time": "2024-04-16T13:30:05.699986Z",
            "comments": {
                "results": [],
                "count": 0
            },
            "parented": true,
            "embed_url": "https://chart-studio.plotly.com/~peter.capcara/101.embed",
            "fid": "peter.capcara:101",
            "filename": "Plot 101",
            "filetype": "plot",
            "img_url": "https://storage.googleapis.com/plotly-prod-images/peter.capcara/101/9_BNC4BJAD7GSBK63NUMGGUS3E40Z3XE.png",
            "image_urls": {
                "default": "https://storage.googleapis.com/plotly-prod-images/peter.capcara/101/2_CQPRYBRFBIAGJ6GFDR5G0UNU3SW7IL.png",
                "block-thumb": "https://storage.googleapis.com/plotly-prod-images/peter.capcara/101/8_HTEGVS9MLINCNF2NZLZ5DOAA59VXSF.png",
                "list-thumb": "https://storage.googleapis.com/plotly-prod-images/peter.capcara/101/9_BNC4BJAD7GSBK63NUMGGUS3E40Z3XE.png"
            },
            "api_urls": {
                "files": "https://api.plotly.com/v2/files/peter.capcara:101",
                "plots": "https://api.plotly.com/v2/plots/peter.capcara:101",
                "parent": "https://api.plotly.com/v2/folders/home?user=peter.capcara"
            },
            "owner": "peter.capcara",
            "parent": -1,
            "preview": "",
            "referencers": [],
            "references": [],
            "title": "",
            "views": 3,
            "web_url": "https://chart-studio.plotly.com/~peter.capcara/101/",
            "world_readable": true,
            "date_modified": "2024-04-16T13:30:05.714Z",
            "stars": {
                "results": [],
                "count": 0
            },
            "collaborators": {
                "results": [],
                "count": 0
            },
            "subfolder_count": null,
            "refresh_interval": null,
            "organize_view_url": "https://chart-studio.plotly.com/~peter.capcara/101/",
            "current_user_permission": "read",
            "is_theme": null,
            "is_template": null,
            "autosize": true,
            "caption": "",
            "figure": {
                "data": [
                    {
                        "uid": "a1a8b8",
                        "asrc": "peter.capcara:100:dfb88d",
                        "bsrc": "peter.capcara:100:fa987b",
                        "csrc": "peter.capcara:100:24d3d2",
                        "fill": "toself",
                        "line": {
                            "color": "#444"
                        },
                        "mode": "lines",
                        "name": "PD",
                        "text": "PD",
                        "type": "scatterternary",
                        "subplot": "ternary",
                        "fillcolor": "#8dd3c7"
                    },
                    {
                        "uid": "c72344",
                        "asrc": "peter.capcara:100:18784e",
                        "bsrc": "peter.capcara:100:d227b6",
                        "csrc": "peter.capcara:100:335e87",
                        "fill": "toself",
                        "line": {
                            "color": "#444"
                        },
                        "mode": "lines",
                        "name": "D1",
                        "text": "D1",
                        "type": "scatterternary",
                        "subplot": "ternary",
                        "fillcolor": "#ffffb3"
                    },
                    {
                        "uid": "3eab74",
                        "asrc": "peter.capcara:100:2d961c",
                        "bsrc": "peter.capcara:100:b8a006",
                        "csrc": "peter.capcara:100:8c3eb0",
                        "fill": "toself",
                        "line": {
                            "color": "#444"
                        },
                        "mode": "lines",
                        "name": "D2",
                        "text": "D2",
                        "type": "scatterternary",
                        "subplot": "ternary",
                        "fillcolor": "#bebada"
                    },
                    {
                        "uid": "b9dc9f",
                        "asrc": "peter.capcara:100:e2e5eb",
                        "bsrc": "peter.capcara:100:a5a86e",
                        "csrc": "peter.capcara:100:8fbd10",
                        "fill": "toself",
                        "line": {
                            "color": "#444"
                        },
                        "mode": "lines",
                        "name": "DT",
                        "text": "DT",
                        "type": "scatterternary",
                        "subplot": "ternary",
                        "fillcolor": "#fb8072"
                    },
                    {
                        "uid": "381ad2",
                        "asrc": "peter.capcara:100:a1f29a",
                        "bsrc": "peter.capcara:100:4094ff",
                        "csrc": "peter.capcara:100:684a79",
                        "fill": "toself",
                        "line": {
                            "color": "#444"
                        },
                        "mode": "lines",
                        "name": "T1",
                        "text": "T1",
                        "type": "scatterternary",
                        "subplot": "ternary",
                        "fillcolor": "#80b1d3"
                    },
                    {
                        "uid": "8cc163",
                        "asrc": "peter.capcara:100:6b09f6",
                        "bsrc": "peter.capcara:100:b68aed",
                        "csrc": "peter.capcara:100:175b61",
                        "fill": "toself",
                        "line": {
                            "color": "#444"
                        },
                        "mode": "lines",
                        "name": "T2",
                        "text": "T2",
                        "type": "scatterternary",
                        "subplot": "ternary",
                        "fillcolor": "#fdb462"
                    },
                    {
                        "uid": "6f33dc",
                        "asrc": "peter.capcara:100:97f469",
                        "bsrc": "peter.capcara:100:97d1ba",
                        "csrc": "peter.capcara:100:5ba07a",
                        "fill": "toself",
                        "line": {
                            "color": "#444"
                        },
                        "mode": "lines",
                        "name": "T3",
                        "text": "T3",
                        "type": "scatterternary",
                        "opacity": 0.5,
                        "subplot": "ternary",
                        "fillcolor": "#b3de69"
                    },
                    {
                        "asrc": "peter.capcara:100:7ddf3a",
                        "bsrc": "peter.capcara:100:72a9be",
                        "csrc": "peter.capcara:100:ef1bec",
                        "mode": "markers",
                        "name": "3264.0",
                        "type": "scatterternary",
                        "marker": {
                            "size": 10,
                            "color": "blue",
                            "symbol": "diamond"
                        },
                        "subplot": "ternary"
                    },
                    {
                        "asrc": "peter.capcara:100:2c3758",
                        "bsrc": "peter.capcara:100:0080f7",
                        "csrc": "peter.capcara:100:634eb1",
                        "mode": "markers",
                        "name": "38.0",
                        "type": "scatterternary",
                        "marker": {
                            "size": 10,
                            "color": "blue",
                            "symbol": "diamond"
                        },
                        "subplot": "ternary"
                    },
                    {
                        "asrc": "peter.capcara:100:a23645",
                        "bsrc": "peter.capcara:100:04cde0",
                        "csrc": "peter.capcara:100:3481e7",
                        "mode": "markers",
                        "name": "37.0",
                        "type": "scatterternary",
                        "marker": {
                            "size": 10,
                            "color": "blue",
                            "symbol": "diamond"
                        },
                        "subplot": "ternary"
                    },
                    {
                        "asrc": "peter.capcara:100:2538ba",
                        "bsrc": "peter.capcara:100:1c0a3a",
                        "csrc": "peter.capcara:100:794108",
                        "mode": "markers",
                        "name": "36.0",
                        "type": "scatterternary",
                        "marker": {
                            "size": 10,
                            "color": "blue",
                            "symbol": "diamond"
                        },
                        "subplot": "ternary"
                    },
                    {
                        "asrc": "peter.capcara:100:3ec7b0",
                        "bsrc": "peter.capcara:100:cd8ad2",
                        "csrc": "peter.capcara:100:56797f",
                        "mode": "markers",
                        "name": "35.0",
                        "type": "scatterternary",
                        "marker": {
                            "size": 10,
                            "color": "blue",
                            "symbol": "diamond"
                        },
                        "subplot": "ternary"
                    },
                    {
                        "asrc": "peter.capcara:100:b95ffc",
                        "bsrc": "peter.capcara:100:e9d324",
                        "csrc": "peter.capcara:100:129b4f",
                        "mode": "markers",
                        "name": "34.0",
                        "type": "scatterternary",
                        "marker": {
                            "size": 10,
                            "color": "blue",
                            "symbol": "diamond"
                        },
                        "subplot": "ternary"
                    },
                    {
                        "asrc": "peter.capcara:100:54467a",
                        "bsrc": "peter.capcara:100:64219c",
                        "csrc": "peter.capcara:100:17a8bc",
                        "mode": "markers",
                        "name": "33.0",
                        "type": "scatterternary",
                        "marker": {
                            "size": 10,
                            "color": "blue",
                            "symbol": "diamond"
                        },
                        "subplot": "ternary"
                    },
                    {
                        "asrc": "peter.capcara:100:6d192f",
                        "bsrc": "peter.capcara:100:9839f5",
                        "csrc": "peter.capcara:100:ce7466",
                        "mode": "markers",
                        "name": "32.0",
                        "type": "scatterternary",
                        "marker": {
                            "size": 10,
                            "color": "blue",
                            "symbol": "diamond"
                        },
                        "subplot": "ternary"
                    },
                    {
                        "asrc": "peter.capcara:100:112bff",
                        "bsrc": "peter.capcara:100:9aeab7",
                        "csrc": "peter.capcara:100:dcc20c",
                        "mode": "markers",
                        "name": "31.0",
                        "type": "scatterternary",
                        "marker": {
                            "size": 10,
                            "color": "blue",
                            "symbol": "diamond"
                        },
                        "subplot": "ternary"
                    },
                    {
                        "type": "table",
                        "cells": {
                            "fill": {
                                "color": "lavender"
                            },
                            "align": "left",
                            "valuessrc": "peter.capcara:100:378b83"
                        },
                        "domain": {
                            "x": [
                                0.0,
                                1.0
                            ],
                            "y": [
                                0.0,
                                0.255
                            ]
                        },
                        "header": {
                            "fill": {
                                "color": "paleturquoise"
                            },
                            "align": "left",
                            "valuessrc": "peter.capcara:100:94a178"
                        },
                        "columnwidthsrc": "peter.capcara:100:7d11af"
                    }
                ],
                "layout": {
                    "title": {
                        "text": "Duval Triangle for DGA Interpretation"
                    },
                    "height": 1000,
                    "ternary": {
                        "sum": 100,
                        "aaxis": {
                            "min": 0.01,
                            "ticks": "outside",
                            "title": {
                                "text": "CH4(Methane)"
                            },
                            "linewidth": 2,
                            "ticksuffix": "%"
                        },
                        "baxis": {
                            "min": 0.01,
                            "ticks": "outside",
                            "title": {
                                "text": "C2H2(Acetylene)"
                            },
                            "linewidth": 2,
                            "ticksuffix": "%"
                        },
                        "caxis": {
                            "min": 0.01,
                            "ticks": "outside",
                            "title": {
                                "text": "C2H4(Ethylene)"
                            },
                            "linewidth": 2,
                            "ticksuffix": "%"
                        },
                        "domain": {
                            "x": [
                                0.0,
                                1.0
                            ],
                            "y": [
                                0.405,
                                1.0
                            ]
                        }
                    },
                    "autosize": true,
                    "template": {
                        "data": {
                            "bar": [
                                {
                                    "type": "bar",
                                    "marker": {
                                        "line": {
                                            "color": "#E5ECF6",
                                            "width": 0.5
                                        },
                                        "pattern": {
                                            "size": 10,
                                            "fillmode": "overlay",
                                            "solidity": 0.2
                                        }
                                    },
                                    "error_x": {
                                        "color": "#2a3f5f"
                                    },
                                    "error_y": {
                                        "color": "#2a3f5f"
                                    }
                                }
                            ],
                            "pie": [
                                {
                                    "type": "pie",
                                    "automargin": true
                                }
                            ],
                            "table": [
                                {
                                    "type": "table",
                                    "cells": {
                                        "fill": {
                                            "color": "#EBF0F8"
                                        },
                                        "line": {
                                            "color": "white"
                                        }
                                    },
                                    "header": {
                                        "fill": {
                                            "color": "#C8D4E3"
                                        },
                                        "line": {
                                            "color": "white"
                                        }
                                    }
                                }
                            ],
                            "carpet": [
                                {
                                    "type": "carpet",
                                    "aaxis": {
                                        "gridcolor": "white",
                                        "linecolor": "white",
                                        "endlinecolor": "#2a3f5f",
                                        "minorgridcolor": "white",
                                        "startlinecolor": "#2a3f5f"
                                    },
                                    "baxis": {
                                        "gridcolor": "white",
                                        "linecolor": "white",
                                        "endlinecolor": "#2a3f5f",
                                        "minorgridcolor": "white",
                                        "startlinecolor": "#2a3f5f"
                                    }
                                }
                            ],
                            "mesh3d": [
                                {
                                    "type": "mesh3d",
                                    "colorbar": {
                                        "ticks": "",
                                        "outlinewidth": 0
                                    }
                                }
                            ],
                            "contour": [
                                {
                                    "type": "contour",
                                    "colorbar": {
                                        "ticks": "",
                                        "outlinewidth": 0
                                    },
                                    "colorscale": [
                                        [
                                            0.0,
                                            "#0d0887"
                                        ],
                                        [
                                            0.1111111111111111,
                                            "#46039f"
                                        ],
                                        [
                                            0.2222222222222222,
                                            "#7201a8"
                                        ],
                                        [
                                            0.3333333333333333,
                                            "#9c179e"
                                        ],
                                        [
                                            0.4444444444444444,
                                            "#bd3786"
                                        ],
                                        [
                                            0.5555555555555556,
                                            "#d8576b"
                                        ],
                                        [
                                            0.6666666666666666,
                                            "#ed7953"
                                        ],
                                        [
                                            0.7777777777777778,
                                            "#fb9f3a"
                                        ],
                                        [
                                            0.8888888888888888,
                                            "#fdca26"
                                        ],
                                        [
                                            1.0,
                                            "#f0f921"
                                        ]
                                    ]
                                }
                            ],
                            "heatmap": [
                                {
                                    "type": "heatmap",
                                    "colorbar": {
                                        "ticks": "",
                                        "outlinewidth": 0
                                    },
                                    "colorscale": [
                                        [
                                            0.0,
                                            "#0d0887"
                                        ],
                                        [
                                            0.1111111111111111,
                                            "#46039f"
                                        ],
                                        [
                                            0.2222222222222222,
                                            "#7201a8"
                                        ],
                                        [
                                            0.3333333333333333,
                                            "#9c179e"
                                        ],
                                        [
                                            0.4444444444444444,
                                            "#bd3786"
                                        ],
                                        [
                                            0.5555555555555556,
                                            "#d8576b"
                                        ],
                                        [
                                            0.6666666666666666,
                                            "#ed7953"
                                        ],
                                        [
                                            0.7777777777777778,
                                            "#fb9f3a"
                                        ],
                                        [
                                            0.8888888888888888,
                                            "#fdca26"
                                        ],
                                        [
                                            1.0,
                                            "#f0f921"
                                        ]
                                    ]
                                }
                            ],
                            "scatter": [
                                {
                                    "type": "scatter",
                                    "fillpattern": {
                                        "size": 10,
                                        "fillmode": "overlay",
                                        "solidity": 0.2
                                    }
                                }
                            ],
                            "surface": [
                                {
                                    "type": "surface",
                                    "colorbar": {
                                        "ticks": "",
                                        "outlinewidth": 0
                                    },
                                    "colorscale": [
                                        [
                                            0.0,
                                            "#0d0887"
                                        ],
                                        [
                                            0.1111111111111111,
                                            "#46039f"
                                        ],
                                        [
                                            0.2222222222222222,
                                            "#7201a8"
                                        ],
                                        [
                                            0.3333333333333333,
                                            "#9c179e"
                                        ],
                                        [
                                            0.4444444444444444,
                                            "#bd3786"
                                        ],
                                        [
                                            0.5555555555555556,
                                            "#d8576b"
                                        ],
                                        [
                                            0.6666666666666666,
                                            "#ed7953"
                                        ],
                                        [
                                            0.7777777777777778,
                                            "#fb9f3a"
                                        ],
                                        [
                                            0.8888888888888888,
                                            "#fdca26"
                                        ],
                                        [
                                            1.0,
                                            "#f0f921"
                                        ]
                                    ]
                                }
                            ],
                            "barpolar": [
                                {
                                    "type": "barpolar",
                                    "marker": {
                                        "line": {
                                            "color": "#E5ECF6",
                                            "width": 0.5
                                        },
                                        "pattern": {
                                            "size": 10,
                                            "fillmode": "overlay",
                                            "solidity": 0.2
                                        }
                                    }
                                }
                            ],
                            "heatmapgl": [
                                {
                                    "type": "heatmapgl",
                                    "colorbar": {
                                        "ticks": "",
                                        "outlinewidth": 0
                                    },
                                    "colorscale": [
                                        [
                                            0.0,
                                            "#0d0887"
                                        ],
                                        [
                                            0.1111111111111111,
                                            "#46039f"
                                        ],
                                        [
                                            0.2222222222222222,
                                            "#7201a8"
                                        ],
                                        [
                                            0.3333333333333333,
                                            "#9c179e"
                                        ],
                                        [
                                            0.4444444444444444,
                                            "#bd3786"
                                        ],
                                        [
                                            0.5555555555555556,
                                            "#d8576b"
                                        ],
                                        [
                                            0.6666666666666666,
                                            "#ed7953"
                                        ],
                                        [
                                            0.7777777777777778,
                                            "#fb9f3a"
                                        ],
                                        [
                                            0.8888888888888888,
                                            "#fdca26"
                                        ],
                                        [
                                            1.0,
                                            "#f0f921"
                                        ]
                                    ]
                                }
                            ],
                            "histogram": [
                                {
                                    "type": "histogram",
                                    "marker": {
                                        "pattern": {
                                            "size": 10,
                                            "fillmode": "overlay",
                                            "solidity": 0.2
                                        }
                                    }
                                }
                            ],
                            "parcoords": [
                                {
                                    "line": {
                                        "colorbar": {
                                            "ticks": "",
                                            "outlinewidth": 0
                                        }
                                    },
                                    "type": "parcoords"
                                }
                            ],
                            "scatter3d": [
                                {
                                    "line": {
                                        "colorbar": {
                                            "ticks": "",
                                            "outlinewidth": 0
                                        }
                                    },
                                    "type": "scatter3d",
                                    "marker": {
                                        "colorbar": {
                                            "ticks": "",
                                            "outlinewidth": 0
                                        }
                                    }
                                }
                            ],
                            "scattergl": [
                                {
                                    "type": "scattergl",
                                    "marker": {
                                        "colorbar": {
                                            "ticks": "",
                                            "outlinewidth": 0
                                        }
                                    }
                                }
                            ],
                            "choropleth": [
                                {
                                    "type": "choropleth",
                                    "colorbar": {
                                        "ticks": "",
                                        "outlinewidth": 0
                                    }
                                }
                            ],
                            "scattergeo": [
                                {
                                    "type": "scattergeo",
                                    "marker": {
                                        "colorbar": {
                                            "ticks": "",
                                            "outlinewidth": 0
                                        }
                                    }
                                }
                            ],
                            "histogram2d": [
                                {
                                    "type": "histogram2d",
                                    "colorbar": {
                                        "ticks": "",
                                        "outlinewidth": 0
                                    },
                                    "colorscale": [
                                        [
                                            0.0,
                                            "#0d0887"
                                        ],
                                        [
                                            0.1111111111111111,
                                            "#46039f"
                                        ],
                                        [
                                            0.2222222222222222,
                                            "#7201a8"
                                        ],
                                        [
                                            0.3333333333333333,
                                            "#9c179e"
                                        ],
                                        [
                                            0.4444444444444444,
                                            "#bd3786"
                                        ],
                                        [
                                            0.5555555555555556,
                                            "#d8576b"
                                        ],
                                        [
                                            0.6666666666666666,
                                            "#ed7953"
                                        ],
                                        [
                                            0.7777777777777778,
                                            "#fb9f3a"
                                        ],
                                        [
                                            0.8888888888888888,
                                            "#fdca26"
                                        ],
                                        [
                                            1.0,
                                            "#f0f921"
                                        ]
                                    ]
                                }
                            ],
                            "scatterpolar": [
                                {
                                    "type": "scatterpolar",
                                    "marker": {
                                        "colorbar": {
                                            "ticks": "",
                                            "outlinewidth": 0
                                        }
                                    }
                                }
                            ],
                            "contourcarpet": [
                                {
                                    "type": "contourcarpet",
                                    "colorbar": {
                                        "ticks": "",
                                        "outlinewidth": 0
                                    }
                                }
                            ],
                            "scattercarpet": [
                                {
                                    "type": "scattercarpet",
                                    "marker": {
                                        "colorbar": {
                                            "ticks": "",
                                            "outlinewidth": 0
                                        }
                                    }
                                }
                            ],
                            "scattermapbox": [
                                {
                                    "type": "scattermapbox",
                                    "marker": {
                                        "colorbar": {
                                            "ticks": "",
                                            "outlinewidth": 0
                                        }
                                    }
                                }
                            ],
                            "scatterpolargl": [
                                {
                                    "type": "scatterpolargl",
                                    "marker": {
                                        "colorbar": {
                                            "ticks": "",
                                            "outlinewidth": 0
                                        }
                                    }
                                }
                            ],
                            "scatterternary": [
                                {
                                    "type": "scatterternary",
                                    "marker": {
                                        "colorbar": {
                                            "ticks": "",
                                            "outlinewidth": 0
                                        }
                                    }
                                }
                            ],
                            "histogram2dcontour": [
                                {
                                    "type": "histogram2dcontour",
                                    "colorbar": {
                                        "ticks": "",
                                        "outlinewidth": 0
                                    },
                                    "colorscale": [
                                        [
                                            0.0,
                                            "#0d0887"
                                        ],
                                        [
                                            0.1111111111111111,
                                            "#46039f"
                                        ],
                                        [
                                            0.2222222222222222,
                                            "#7201a8"
                                        ],
                                        [
                                            0.3333333333333333,
                                            "#9c179e"
                                        ],
                                        [
                                            0.4444444444444444,
                                            "#bd3786"
                                        ],
                                        [
                                            0.5555555555555556,
                                            "#d8576b"
                                        ],
                                        [
                                            0.6666666666666666,
                                            "#ed7953"
                                        ],
                                        [
                                            0.7777777777777778,
                                            "#fb9f3a"
                                        ],
                                        [
                                            0.8888888888888888,
                                            "#fdca26"
                                        ],
                                        [
                                            1.0,
                                            "#f0f921"
                                        ]
                                    ]
                                }
                            ]
                        },
                        "layout": {
                            "geo": {
                                "bgcolor": "white",
                                "showland": true,
                                "lakecolor": "white",
                                "landcolor": "#E5ECF6",
                                "showlakes": true,
                                "subunitcolor": "white"
                            },
                            "font": {
                                "color": "#2a3f5f"
                            },
                            "polar": {
                                "bgcolor": "#E5ECF6",
                                "radialaxis": {
                                    "ticks": "",
                                    "gridcolor": "white",
                                    "linecolor": "white"
                                },
                                "angularaxis": {
                                    "ticks": "",
                                    "gridcolor": "white",
                                    "linecolor": "white"
                                }
                            },
                            "scene": {
                                "xaxis": {
                                    "ticks": "",
                                    "gridcolor": "white",
                                    "gridwidth": 2,
                                    "linecolor": "white",
                                    "zerolinecolor": "white",
                                    "showbackground": true,
                                    "backgroundcolor": "#E5ECF6"
                                },
                                "yaxis": {
                                    "ticks": "",
                                    "gridcolor": "white",
                                    "gridwidth": 2,
                                    "linecolor": "white",
                                    "zerolinecolor": "white",
                                    "showbackground": true,
                                    "backgroundcolor": "#E5ECF6"
                                },
                                "zaxis": {
                                    "ticks": "",
                                    "gridcolor": "white",
                                    "gridwidth": 2,
                                    "linecolor": "white",
                                    "zerolinecolor": "white",
                                    "showbackground": true,
                                    "backgroundcolor": "#E5ECF6"
                                }
                            },
                            "title": {
                                "x": 0.05
                            },
                            "xaxis": {
                                "ticks": "",
                                "title": {
                                    "standoff": 15
                                },
                                "gridcolor": "white",
                                "linecolor": "white",
                                "automargin": true,
                                "zerolinecolor": "white",
                                "zerolinewidth": 2
                            },
                            "yaxis": {
                                "ticks": "",
                                "title": {
                                    "standoff": 15
                                },
                                "gridcolor": "white",
                                "linecolor": "white",
                                "automargin": true,
                                "zerolinecolor": "white",
                                "zerolinewidth": 2
                            },
                            "mapbox": {
                                "style": "light"
                            },
                            "ternary": {
                                "aaxis": {
                                    "ticks": "",
                                    "gridcolor": "white",
                                    "linecolor": "white"
                                },
                                "baxis": {
                                    "ticks": "",
                                    "gridcolor": "white",
                                    "linecolor": "white"
                                },
                                "caxis": {
                                    "ticks": "",
                                    "gridcolor": "white",
                                    "linecolor": "white"
                                },
                                "bgcolor": "#E5ECF6"
                            },
                            "colorway": [
                                "#636efa",
                                "#EF553B",
                                "#00cc96",
                                "#ab63fa",
                                "#FFA15A",
                                "#19d3f3",
                                "#FF6692",
                                "#B6E880",
                                "#FF97FF",
                                "#FECB52"
                            ],
                            "coloraxis": {
                                "colorbar": {
                                    "ticks": "",
                                    "outlinewidth": 0
                                }
                            },
                            "hovermode": "closest",
                            "colorscale": {
                                "diverging": [
                                    [
                                        0,
                                        "#8e0152"
                                    ],
                                    [
                                        0.1,
                                        "#c51b7d"
                                    ],
                                    [
                                        0.2,
                                        "#de77ae"
                                    ],
                                    [
                                        0.3,
                                        "#f1b6da"
                                    ],
                                    [
                                        0.4,
                                        "#fde0ef"
                                    ],
                                    [
                                        0.5,
                                        "#f7f7f7"
                                    ],
                                    [
                                        0.6,
                                        "#e6f5d0"
                                    ],
                                    [
                                        0.7,
                                        "#b8e186"
                                    ],
                                    [
                                        0.8,
                                        "#7fbc41"
                                    ],
                                    [
                                        0.9,
                                        "#4d9221"
                                    ],
                                    [
                                        1,
                                        "#276419"
                                    ]
                                ],
                                "sequential": [
                                    [
                                        0.0,
                                        "#0d0887"
                                    ],
                                    [
                                        0.1111111111111111,
                                        "#46039f"
                                    ],
                                    [
                                        0.2222222222222222,
                                        "#7201a8"
                                    ],
                                    [
                                        0.3333333333333333,
                                        "#9c179e"
                                    ],
                                    [
                                        0.4444444444444444,
                                        "#bd3786"
                                    ],
                                    [
                                        0.5555555555555556,
                                        "#d8576b"
                                    ],
                                    [
                                        0.6666666666666666,
                                        "#ed7953"
                                    ],
                                    [
                                        0.7777777777777778,
                                        "#fb9f3a"
                                    ],
                                    [
                                        0.8888888888888888,
                                        "#fdca26"
                                    ],
                                    [
                                        1.0,
                                        "#f0f921"
                                    ]
                                ],
                                "sequentialminus": [
                                    [
                                        0.0,
                                        "#0d0887"
                                    ],
                                    [
                                        0.1111111111111111,
                                        "#46039f"
                                    ],
                                    [
                                        0.2222222222222222,
                                        "#7201a8"
                                    ],
                                    [
                                        0.3333333333333333,
                                        "#9c179e"
                                    ],
                                    [
                                        0.4444444444444444,
                                        "#bd3786"
                                    ],
                                    [
                                        0.5555555555555556,
                                        "#d8576b"
                                    ],
                                    [
                                        0.6666666666666666,
                                        "#ed7953"
                                    ],
                                    [
                                        0.7777777777777778,
                                        "#fb9f3a"
                                    ],
                                    [
                                        0.8888888888888888,
                                        "#fdca26"
                                    ],
                                    [
                                        1.0,
                                        "#f0f921"
                                    ]
                                ]
                            },
                            "hoverlabel": {
                                "align": "left"
                            },
                            "plot_bgcolor": "#E5ECF6",
                            "paper_bgcolor": "white",
                            "shapedefaults": {
                                "line": {
                                    "color": "#2a3f5f"
                                }
                            },
                            "autotypenumbers": "strict",
                            "annotationdefaults": {
                                "arrowhead": 0,
                                "arrowcolor": "#2a3f5f",
                                "arrowwidth": 1
                            }
                        }
                    },
                    "showlegend": true
                }
            },
            "height": 1000,
            "width": null,
            "user": {
                "profile_url": "https://chart-studio.plotly.com/~peter.capcara",
                "avatar_url": "https://storage.googleapis.com/plotly-prod-profiles/41.jpg",
                "background_url": "https://storage.googleapis.com/plotly-prod-profiles/bg-0.jpg",
                "bio": "",
                "nickname": "",
                "website": "",
                "stream_tokens": null,
                "feature_set_id": null,
                "csrf_token": null,
                "date_joined": "2024-04-08 08:11:51",
                "mapbox_access_tokens": null,
                "has_password": null,
                "username": "peter.capcara",
                "email": null,
                "is_active": null,
                "readonly": null,
                "is_dash_creator": null,
                "dash_created_count": null,
                "is_chart_creator": null,
                "charts_created_count": null
            }
        },
        {
            "creation_time": "2024-04-16T13:28:57.350228Z",
            "comments": {
                "results": [],
                "count": 0
            },
            "parented": true,
            "embed_url": "https://chart-studio.plotly.com/~anas97/9.embed",
            "fid": "anas97:9",
            "filename": "TopP",
            "filetype": "plot",
            "img_url": "https://storage.googleapis.com/plotly-prod-images/anas97/9/9_FENEO8QB618AR5IYBO3EM0WEIY4VCH.png",
            "image_urls": {
                "default": "https://storage.googleapis.com/plotly-prod-images/anas97/9/2_0PRGYX5Q0HPDLGLQEZ2CP6AI0CBXIQ.png",
                "block-thumb": "https://storage.googleapis.com/plotly-prod-images/anas97/9/8_QWWKBG998FUUVPDKTMVPWRFWMBBG5T.png",
                "list-thumb": "https://storage.googleapis.com/plotly-prod-images/anas97/9/9_FENEO8QB618AR5IYBO3EM0WEIY4VCH.png"
            },
            "api_urls": {
                "files": "https://api.plotly.com/v2/files/anas97:9",
                "plots": "https://api.plotly.com/v2/plots/anas97:9",
                "parent": "https://api.plotly.com/v2/folders/home?user=anas97"
            },
            "owner": "anas97",
            "parent": -1,
            "preview": "",
            "referencers": [],
            "references": [],
            "title": "",
            "views": 1,
            "web_url": "https://chart-studio.plotly.com/~anas97/9/",
            "world_readable": true,
            "date_modified": "2024-04-16T13:28:57.360Z",
            "stars": {
                "results": [],
                "count": 0
            },
            "collaborators": {
                "results": [],
                "count": 0
            },
            "subfolder_count": null,
            "refresh_interval": null,
            "organize_view_url": "https://chart-studio.plotly.com/~anas97/9/",
            "current_user_permission": "read",
            "is_theme": null,
            "is_template": false,
            "autosize": true,
            "caption": "",
            "figure": {
                "data": [
                    {
                        "uid": "723fe8",
                        "line": {
                            "shape": "linear"
                        },
                        "meta": {
                            "columnNames": {
                                "x": "title length",
                                "y": "Avg per project"
                            }
                        },
                        "mode": "lines",
                        "name": "Ratio metrics",
                        "type": "scatter",
                        "xsrc": "anas97:8:8bee13",
                        "ysrc": "anas97:8:fc10cb",
                        "marker": {
                            "color": "rgb(255, 127, 14)",
                            "sizeref": 0.028149617325,
                            "sizemode": "area"
                        }
                    },
                    {
                        "line": {
                            "color": "rgb(14, 169, 255)",
                            "shape": "linear"
                        },
                        "meta": {
                            "columnNames": {
                                "x": "title length",
                                "y": "C"
                            }
                        },
                        "mode": "lines",
                        "name": "Syntax verification",
                        "type": "scatter",
                        "xsrc": "anas97:8:8bee13",
                        "ysrc": "anas97:8:e92aca",
                        "stackgroup": null
                    },
                    {
                        "fill": "none",
                        "line": {
                            "shape": "spline",
                            "smoothing": 0
                        },
                        "meta": {
                            "columnNames": {
                                "x": "title length",
                                "y": "D"
                            }
                        },
                        "mode": "lines",
                        "name": "Manual reading",
                        "type": "scatter",
                        "xsrc": "anas97:8:8bee13",
                        "ysrc": "anas97:8:0897db",
                        "stackgroup": null,
                        "connectgaps": false
                    }
                ],
                "frames": [],
                "layout": {
                    "title": {
                        "text": "Success Rate by Top_p Value for 10 Generated Test Cases Description"
                    },
                    "xaxis": {
                        "type": "linear",
                        "range": [
                            0,
                            1
                        ],
                        "title": {
                            "text": "Top_p Value"
                        },
                        "nticks": 11,
                        "autorange": true,
                        "showspikes": false,
                        "rangeslider": {
                            "range": [
                                0.2,
                                2
                            ],
                            "yaxis": {},
                            "visible": false,
                            "autorange": true
                        }
                    },
                    "yaxis": {
                        "type": "linear",
                        "range": [
                            68.33333333333333,
                            101.66666666666667
                        ],
                        "title": {
                            "text": "Success Rate (%)"
                        },
                        "autorange": true
                    },
                    "bargap": 0.38,
                    "autosize": true,
                    "hovermode": "closest",
                    "showlegend": true
                }
            },
            "height": null,
            "width": null,
            "user": {
                "profile_url": "https://chart-studio.plotly.com/~anas97",
                "avatar_url": "https://storage.googleapis.com/plotly-prod-profiles/78.jpg",
                "background_url": "https://storage.googleapis.com/plotly-prod-profiles/bg-8.jpg",
                "bio": "",
                "nickname": "",
                "website": "",
                "stream_tokens": null,
                "feature_set_id": null,
                "csrf_token": null,
                "date_joined": "2024-04-15 09:03:49",
                "mapbox_access_tokens": null,
                "has_password": null,
                "username": "anas97",
                "email": null,
                "is_active": null,
                "readonly": null,
                "is_dash_creator": null,
                "dash_created_count": null,
                "is_chart_creator": null,
                "charts_created_count": null
            }
        },
        {
            "creation_time": "2024-04-16T13:23:46.513547Z",
            "comments": {
                "results": [],
                "count": 0
            },
            "parented": true,
            "embed_url": "https://chart-studio.plotly.com/~peter.capcara/99.embed",
            "fid": "peter.capcara:99",
            "filename": "Plot 99",
            "filetype": "plot",
            "img_url": "https://storage.googleapis.com/plotly-prod-images/peter.capcara/99/9_MDHHGG54ZMGQIY0TEU6HRZ5YLSSNPY.png",
            "image_urls": {
                "default": "https://storage.googleapis.com/plotly-prod-images/peter.capcara/99/2_6JPLCUUFW4C97VUCTZ7FPSH6HR53JN.png",
                "block-thumb": "https://storage.googleapis.com/plotly-prod-images/peter.capcara/99/8_9LB8YFCEX85MZAV3Z9M325471PSHI9.png",
                "list-thumb": "https://storage.googleapis.com/plotly-prod-images/peter.capcara/99/9_MDHHGG54ZMGQIY0TEU6HRZ5YLSSNPY.png"
            },
            "api_urls": {
                "files": "https://api.plotly.com/v2/files/peter.capcara:99",
                "plots": "https://api.plotly.com/v2/plots/peter.capcara:99",
                "parent": "https://api.plotly.com/v2/folders/home?user=peter.capcara"
            },
            "owner": "peter.capcara",
            "parent": -1,
            "preview": "",
            "referencers": [],
            "references": [],
            "title": "",
            "views": 2,
            "web_url": "https://chart-studio.plotly.com/~peter.capcara/99/",
            "world_readable": true,
            "date_modified": "2024-04-16T13:23:46.524Z",
            "stars": {
                "results": [],
                "count": 0
            },
            "collaborators": {
                "results": [],
                "count": 0
            },
            "subfolder_count": null,
            "refresh_interval": null,
            "organize_view_url": "https://chart-studio.plotly.com/~peter.capcara/99/",
            "current_user_permission": "read",
            "is_theme": null,
            "is_template": null,
            "autosize": true,
            "caption": "",
            "figure": {
                "data": [
                    {
                        "uid": "a1a8b8",
                        "asrc": "peter.capcara:98:30e11a",
                        "bsrc": "peter.capcara:98:743cca",
                        "csrc": "peter.capcara:98:b95979",
                        "fill": "toself",
                        "line": {
                            "color": "#444"
                        },
                        "mode": "lines",
                        "name": "PD",
                        "text": "PD",
                        "type": "scatterternary",
                        "subplot": "ternary",
                        "fillcolor": "#8dd3c7"
                    },
                    {
                        "uid": "c72344",
                        "asrc": "peter.capcara:98:7508c4",
                        "bsrc": "peter.capcara:98:7015ee",
                        "csrc": "peter.capcara:98:69d3f7",
                        "fill": "toself",
                        "line": {
                            "color": "#444"
                        },
                        "mode": "lines",
                        "name": "D1",
                        "text": "D1",
                        "type": "scatterternary",
                        "subplot": "ternary",
                        "fillcolor": "#ffffb3"
                    },
                    {
                        "uid": "3eab74",
                        "asrc": "peter.capcara:98:718ef7",
                        "bsrc": "peter.capcara:98:0c7755",
                        "csrc": "peter.capcara:98:4bca7b",
                        "fill": "toself",
                        "line": {
                            "color": "#444"
                        },
                        "mode": "lines",
                        "name": "D2",
                        "text": "D2",
                        "type": "scatterternary",
                        "subplot": "ternary",
                        "fillcolor": "#bebada"
                    },
                    {
                        "uid": "b9dc9f",
                        "asrc": "peter.capcara:98:2c2958",
                        "bsrc": "peter.capcara:98:b5f252",
                        "csrc": "peter.capcara:98:8ec44f",
                        "fill": "toself",
                        "line": {
                            "color": "#444"
                        },
                        "mode": "lines",
                        "name": "DT",
                        "text": "DT",
                        "type": "scatterternary",
                        "subplot": "ternary",
                        "fillcolor": "#fb8072"
                    },
                    {
                        "uid": "381ad2",
                        "asrc": "peter.capcara:98:68438c",
                        "bsrc": "peter.capcara:98:ece879",
                        "csrc": "peter.capcara:98:2bb758",
                        "fill": "toself",
                        "line": {
                            "color": "#444"
                        },
                        "mode": "lines",
                        "name": "T1",
                        "text": "T1",
                        "type": "scatterternary",
                        "subplot": "ternary",
                        "fillcolor": "#80b1d3"
                    },
                    {
                        "uid": "8cc163",
                        "asrc": "peter.capcara:98:a1e6d8",
                        "bsrc": "peter.capcara:98:1190c1",
                        "csrc": "peter.capcara:98:bd85ab",
                        "fill": "toself",
                        "line": {
                            "color": "#444"
                        },
                        "mode": "lines",
                        "name": "T2",
                        "text": "T2",
                        "type": "scatterternary",
                        "subplot": "ternary",
                        "fillcolor": "#fdb462"
                    },
                    {
                        "uid": "6f33dc",
                        "asrc": "peter.capcara:98:43c358",
                        "bsrc": "peter.capcara:98:9b3b76",
                        "csrc": "peter.capcara:98:b4e3f4",
                        "fill": "toself",
                        "line": {
                            "color": "#444"
                        },
                        "mode": "lines",
                        "name": "T3",
                        "text": "T3",
                        "type": "scatterternary",
                        "opacity": 0.5,
                        "subplot": "ternary",
                        "fillcolor": "#b3de69"
                    },
                    {
                        "asrc": "peter.capcara:98:1e40ac",
                        "bsrc": "peter.capcara:98:0cf1c8",
                        "csrc": "peter.capcara:98:b3ef53",
                        "mode": "markers",
                        "name": "BOSA_T401",
                        "type": "scatterternary",
                        "marker": {
                            "size": 10,
                            "color": "blue",
                            "symbol": "diamond"
                        },
                        "subplot": "ternary"
                    },
                    {
                        "asrc": "peter.capcara:98:918fdc",
                        "bsrc": "peter.capcara:98:c2956f",
                        "csrc": "peter.capcara:98:8a7abc",
                        "mode": "markers",
                        "name": "BOSA_T402",
                        "type": "scatterternary",
                        "marker": {
                            "size": 10,
                            "color": "blue",
                            "symbol": "diamond"
                        },
                        "subplot": "ternary"
                    },
                    {
                        "asrc": "peter.capcara:98:0b9f93",
                        "bsrc": "peter.capcara:98:8a8eed",
                        "csrc": "peter.capcara:98:e70f68",
                        "mode": "markers",
                        "name": "SUCA_T402",
                        "type": "scatterternary",
                        "marker": {
                            "size": 10,
                            "color": "blue",
                            "symbol": "diamond"
                        },
                        "subplot": "ternary"
                    },
                    {
                        "asrc": "peter.capcara:98:27d3ad",
                        "bsrc": "peter.capcara:98:a022c4",
                        "csrc": "peter.capcara:98:60d998",
                        "mode": "markers",
                        "name": "VDUR_T401",
                        "type": "scatterternary",
                        "marker": {
                            "size": 10,
                            "color": "blue",
                            "symbol": "diamond"
                        },
                        "subplot": "ternary"
                    },
                    {
                        "asrc": "peter.capcara:98:ffe0ef",
                        "bsrc": "peter.capcara:98:03681e",
                        "csrc": "peter.capcara:98:c83205",
                        "mode": "markers",
                        "name": "LEME_T402",
                        "type": "scatterternary",
                        "marker": {
                            "size": 10,
                            "color": "blue",
                            "symbol": "diamond"
                        },
                        "subplot": "ternary"
                    },
                    {
                        "asrc": "peter.capcara:98:62f7f4",
                        "bsrc": "peter.capcara:98:965d61",
                        "csrc": "peter.capcara:98:f7b4cc",
                        "mode": "markers",
                        "name": "LEME_T401",
                        "type": "scatterternary",
                        "marker": {
                            "size": 10,
                            "color": "blue",
                            "symbol": "diamond"
                        },
                        "subplot": "ternary"
                    },
                    {
                        "asrc": "peter.capcara:98:46ebad",
                        "bsrc": "peter.capcara:98:c70acd",
                        "csrc": "peter.capcara:98:5544ba",
                        "mode": "markers",
                        "name": "PBIS_T402",
                        "type": "scatterternary",
                        "marker": {
                            "size": 10,
                            "color": "blue",
                            "symbol": "diamond"
                        },
                        "subplot": "ternary"
                    },
                    {
                        "asrc": "peter.capcara:98:90d0a6",
                        "bsrc": "peter.capcara:98:17ce80",
                        "csrc": "peter.capcara:98:bb9a75",
                        "mode": "markers",
                        "name": "PBIS_T401",
                        "type": "scatterternary",
                        "marker": {
                            "size": 10,
                            "color": "blue",
                            "symbol": "diamond"
                        },
                        "subplot": "ternary"
                    },
                    {
                        "asrc": "peter.capcara:98:fd489b",
                        "bsrc": "peter.capcara:98:d730b3",
                        "csrc": "peter.capcara:98:3220f6",
                        "mode": "markers",
                        "name": "VKAP_T402",
                        "type": "scatterternary",
                        "marker": {
                            "size": 10,
                            "color": "blue",
                            "symbol": "diamond"
                        },
                        "subplot": "ternary"
                    },
                    {
                        "asrc": "peter.capcara:98:3dfe81",
                        "bsrc": "peter.capcara:98:6a3a3d",
                        "csrc": "peter.capcara:98:0dd221",
                        "mode": "markers",
                        "name": "VKAP_T401",
                        "type": "scatterternary",
                        "marker": {
                            "size": 10,
                            "color": "blue",
                            "symbol": "diamond"
                        },
                        "subplot": "ternary"
                    },
                    {
                        "asrc": "peter.capcara:98:856e69",
                        "bsrc": "peter.capcara:98:ff2cae",
                        "csrc": "peter.capcara:98:e86d98",
                        "mode": "markers",
                        "name": "VARI_T401",
                        "type": "scatterternary",
                        "marker": {
                            "size": 10,
                            "color": "blue",
                            "symbol": "diamond"
                        },
                        "subplot": "ternary"
                    },
                    {
                        "type": "table",
                        "cells": {
                            "fill": {
                                "color": "lavender"
                            },
                            "align": "left",
                            "valuessrc": "peter.capcara:98:288c69"
                        },
                        "domain": {
                            "x": [
                                0.0,
                                1.0
                            ],
                            "y": [
                                0.0,
                                0.255
                            ]
                        },
                        "header": {
                            "fill": {
                                "color": "paleturquoise"
                            },
                            "align": "left",
                            "valuessrc": "peter.capcara:98:c98b15"
                        },
                        "columnwidthsrc": "peter.capcara:98:a7ab52"
                    }
                ],
                "layout": {
                    "title": {
                        "text": "Duval Triangle for DGA Interpretation"
                    },
                    "height": 1000,
                    "ternary": {
                        "sum": 100,
                        "aaxis": {
                            "min": 0.01,
                            "ticks": "outside",
                            "title": {
                                "text": "CH4(Methane)"
                            },
                            "linewidth": 2,
                            "ticksuffix": "%"
                        },
                        "baxis": {
                            "min": 0.01,
                            "ticks": "outside",
                            "title": {
                                "text": "C2H2(Acetylene)"
                            },
                            "linewidth": 2,
                            "ticksuffix": "%"
                        },
                        "caxis": {
                            "min": 0.01,
                            "ticks": "outside",
                            "title": {
                                "text": "C2H4(Ethylene)"
                            },
                            "linewidth": 2,
                            "ticksuffix": "%"
                        },
                        "domain": {
                            "x": [
                                0.0,
                                1.0
                            ],
                            "y": [
                                0.405,
                                1.0
                            ]
                        }
                    },
                    "autosize": true,
                    "template": {
                        "data": {
                            "bar": [
                                {
                                    "type": "bar",
                                    "marker": {
                                        "line": {
                                            "color": "#E5ECF6",
                                            "width": 0.5
                                        },
                                        "pattern": {
                                            "size": 10,
                                            "fillmode": "overlay",
                                            "solidity": 0.2
                                        }
                                    },
                                    "error_x": {
                                        "color": "#2a3f5f"
                                    },
                                    "error_y": {
                                        "color": "#2a3f5f"
                                    }
                                }
                            ],
                            "pie": [
                                {
                                    "type": "pie",
                                    "automargin": true
                                }
                            ],
                            "table": [
                                {
                                    "type": "table",
                                    "cells": {
                                        "fill": {
                                            "color": "#EBF0F8"
                                        },
                                        "line": {
                                            "color": "white"
                                        }
                                    },
                                    "header": {
                                        "fill": {
                                            "color": "#C8D4E3"
                                        },
                                        "line": {
                                            "color": "white"
                                        }
                                    }
                                }
                            ],
                            "carpet": [
                                {
                                    "type": "carpet",
                                    "aaxis": {
                                        "gridcolor": "white",
                                        "linecolor": "white",
                                        "endlinecolor": "#2a3f5f",
                                        "minorgridcolor": "white",
                                        "startlinecolor": "#2a3f5f"
                                    },
                                    "baxis": {
                                        "gridcolor": "white",
                                        "linecolor": "white",
                                        "endlinecolor": "#2a3f5f",
                                        "minorgridcolor": "white",
                                        "startlinecolor": "#2a3f5f"
                                    }
                                }
                            ],
                            "mesh3d": [
                                {
                                    "type": "mesh3d",
                                    "colorbar": {
                                        "ticks": "",
                                        "outlinewidth": 0
                                    }
                                }
                            ],
                            "contour": [
                                {
                                    "type": "contour",
                                    "colorbar": {
                                        "ticks": "",
                                        "outlinewidth": 0
                                    },
                                    "colorscale": [
                                        [
                                            0.0,
                                            "#0d0887"
                                        ],
                                        [
                                            0.1111111111111111,
                                            "#46039f"
                                        ],
                                        [
                                            0.2222222222222222,
                                            "#7201a8"
                                        ],
                                        [
                                            0.3333333333333333,
                                            "#9c179e"
                                        ],
                                        [
                                            0.4444444444444444,
                                            "#bd3786"
                                        ],
                                        [
                                            0.5555555555555556,
                                            "#d8576b"
                                        ],
                                        [
                                            0.6666666666666666,
                                            "#ed7953"
                                        ],
                                        [
                                            0.7777777777777778,
                                            "#fb9f3a"
                                        ],
                                        [
                                            0.8888888888888888,
                                            "#fdca26"
                                        ],
                                        [
                                            1.0,
                                            "#f0f921"
                                        ]
                                    ]
                                }
                            ],
                            "heatmap": [
                                {
                                    "type": "heatmap",
                                    "colorbar": {
                                        "ticks": "",
                                        "outlinewidth": 0
                                    },
                                    "colorscale": [
                                        [
                                            0.0,
                                            "#0d0887"
                                        ],
                                        [
                                            0.1111111111111111,
                                            "#46039f"
                                        ],
                                        [
                                            0.2222222222222222,
                                            "#7201a8"
                                        ],
                                        [
                                            0.3333333333333333,
                                            "#9c179e"
                                        ],
                                        [
                                            0.4444444444444444,
                                            "#bd3786"
                                        ],
                                        [
                                            0.5555555555555556,
                                            "#d8576b"
                                        ],
                                        [
                                            0.6666666666666666,
                                            "#ed7953"
                                        ],
                                        [
                                            0.7777777777777778,
                                            "#fb9f3a"
                                        ],
                                        [
                                            0.8888888888888888,
                                            "#fdca26"
                                        ],
                                        [
                                            1.0,
                                            "#f0f921"
                                        ]
                                    ]
                                }
                            ],
                            "scatter": [
                                {
                                    "type": "scatter",
                                    "fillpattern": {
                                        "size": 10,
                                        "fillmode": "overlay",
                                        "solidity": 0.2
                                    }
                                }
                            ],
                            "surface": [
                                {
                                    "type": "surface",
                                    "colorbar": {
                                        "ticks": "",
                                        "outlinewidth": 0
                                    },
                                    "colorscale": [
                                        [
                                            0.0,
                                            "#0d0887"
                                        ],
                                        [
                                            0.1111111111111111,
                                            "#46039f"
                                        ],
                                        [
                                            0.2222222222222222,
                                            "#7201a8"
                                        ],
                                        [
                                            0.3333333333333333,
                                            "#9c179e"
                                        ],
                                        [
                                            0.4444444444444444,
                                            "#bd3786"
                                        ],
                                        [
                                            0.5555555555555556,
                                            "#d8576b"
                                        ],
                                        [
                                            0.6666666666666666,
                                            "#ed7953"
                                        ],
                                        [
                                            0.7777777777777778,
                                            "#fb9f3a"
                                        ],
                                        [
                                            0.8888888888888888,
                                            "#fdca26"
                                        ],
                                        [
                                            1.0,
                                            "#f0f921"
                                        ]
                                    ]
                                }
                            ],
                            "barpolar": [
                                {
                                    "type": "barpolar",
                                    "marker": {
                                        "line": {
                                            "color": "#E5ECF6",
                                            "width": 0.5
                                        },
                                        "pattern": {
                                            "size": 10,
                                            "fillmode": "overlay",
                                            "solidity": 0.2
                                        }
                                    }
                                }
                            ],
                            "heatmapgl": [
                                {
                                    "type": "heatmapgl",
                                    "colorbar": {
                                        "ticks": "",
                                        "outlinewidth": 0
                                    },
                                    "colorscale": [
                                        [
                                            0.0,
                                            "#0d0887"
                                        ],
                                        [
                                            0.1111111111111111,
                                            "#46039f"
                                        ],
                                        [
                                            0.2222222222222222,
                                            "#7201a8"
                                        ],
                                        [
                                            0.3333333333333333,
                                            "#9c179e"
                                        ],
                                        [
                                            0.4444444444444444,
                                            "#bd3786"
                                        ],
                                        [
                                            0.5555555555555556,
                                            "#d8576b"
                                        ],
                                        [
                                            0.6666666666666666,
                                            "#ed7953"
                                        ],
                                        [
                                            0.7777777777777778,
                                            "#fb9f3a"
                                        ],
                                        [
                                            0.8888888888888888,
                                            "#fdca26"
                                        ],
                                        [
                                            1.0,
                                            "#f0f921"
                                        ]
                                    ]
                                }
                            ],
                            "histogram": [
                                {
                                    "type": "histogram",
                                    "marker": {
                                        "pattern": {
                                            "size": 10,
                                            "fillmode": "overlay",
                                            "solidity": 0.2
                                        }
                                    }
                                }
                            ],
                            "parcoords": [
                                {
                                    "line": {
                                        "colorbar": {
                                            "ticks": "",
                                            "outlinewidth": 0
                                        }
                                    },
                                    "type": "parcoords"
                                }
                            ],
                            "scatter3d": [
                                {
                                    "line": {
                                        "colorbar": {
                                            "ticks": "",
                                            "outlinewidth": 0
                                        }
                                    },
                                    "type": "scatter3d",
                                    "marker": {
                                        "colorbar": {
                                            "ticks": "",
                                            "outlinewidth": 0
                                        }
                                    }
                                }
                            ],
                            "scattergl": [
                                {
                                    "type": "scattergl",
                                    "marker": {
                                        "colorbar": {
                                            "ticks": "",
                                            "outlinewidth": 0
                                        }
                                    }
                                }
                            ],
                            "choropleth": [
                                {
                                    "type": "choropleth",
                                    "colorbar": {
                                        "ticks": "",
                                        "outlinewidth": 0
                                    }
                                }
                            ],
                            "scattergeo": [
                                {
                                    "type": "scattergeo",
                                    "marker": {
                                        "colorbar": {
                                            "ticks": "",
                                            "outlinewidth": 0
                                        }
                                    }
                                }
                            ],
                            "histogram2d": [
                                {
                                    "type": "histogram2d",
                                    "colorbar": {
                                        "ticks": "",
                                        "outlinewidth": 0
                                    },
                                    "colorscale": [
                                        [
                                            0.0,
                                            "#0d0887"
                                        ],
                                        [
                                            0.1111111111111111,
                                            "#46039f"
                                        ],
                                        [
                                            0.2222222222222222,
                                            "#7201a8"
                                        ],
                                        [
                                            0.3333333333333333,
                                            "#9c179e"
                                        ],
                                        [
                                            0.4444444444444444,
                                            "#bd3786"
                                        ],
                                        [
                                            0.5555555555555556,
                                            "#d8576b"
                                        ],
                                        [
                                            0.6666666666666666,
                                            "#ed7953"
                                        ],
                                        [
                                            0.7777777777777778,
                                            "#fb9f3a"
                                        ],
                                        [
                                            0.8888888888888888,
                                            "#fdca26"
                                        ],
                                        [
                                            1.0,
                                            "#f0f921"
                                        ]
                                    ]
                                }
                            ],
                            "scatterpolar": [
                                {
                                    "type": "scatterpolar",
                                    "marker": {
                                        "colorbar": {
                                            "ticks": "",
                                            "outlinewidth": 0
                                        }
                                    }
                                }
                            ],
                            "contourcarpet": [
                                {
                                    "type": "contourcarpet",
                                    "colorbar": {
                                        "ticks": "",
                                        "outlinewidth": 0
                                    }
                                }
                            ],
                            "scattercarpet": [
                                {
                                    "type": "scattercarpet",
                                    "marker": {
                                        "colorbar": {
                                            "ticks": "",
                                            "outlinewidth": 0
                                        }
                                    }
                                }
                            ],
                            "scattermapbox": [
                                {
                                    "type": "scattermapbox",
                                    "marker": {
                                        "colorbar": {
                                            "ticks": "",
                                            "outlinewidth": 0
                                        }
                                    }
                                }
                            ],
                            "scatterpolargl": [
                                {
                                    "type": "scatterpolargl",
                                    "marker": {
                                        "colorbar": {
                                            "ticks": "",
                                            "outlinewidth": 0
                                        }
                                    }
                                }
                            ],
                            "scatterternary": [
                                {
                                    "type": "scatterternary",
                                    "marker": {
                                        "colorbar": {
                                            "ticks": "",
                                            "outlinewidth": 0
                                        }
                                    }
                                }
                            ],
                            "histogram2dcontour": [
                                {
                                    "type": "histogram2dcontour",
                                    "colorbar": {
                                        "ticks": "",
                                        "outlinewidth": 0
                                    },
                                    "colorscale": [
                                        [
                                            0.0,
                                            "#0d0887"
                                        ],
                                        [
                                            0.1111111111111111,
                                            "#46039f"
                                        ],
                                        [
                                            0.2222222222222222,
                                            "#7201a8"
                                        ],
                                        [
                                            0.3333333333333333,
                                            "#9c179e"
                                        ],
                                        [
                                            0.4444444444444444,
                                            "#bd3786"
                                        ],
                                        [
                                            0.5555555555555556,
                                            "#d8576b"
                                        ],
                                        [
                                            0.6666666666666666,
                                            "#ed7953"
                                        ],
                                        [
                                            0.7777777777777778,
                                            "#fb9f3a"
                                        ],
                                        [
                                            0.8888888888888888,
                                            "#fdca26"
                                        ],
                                        [
                                            1.0,
                                            "#f0f921"
                                        ]
                                    ]
                                }
                            ]
                        },
                        "layout": {
                            "geo": {
                                "bgcolor": "white",
                                "showland": true,
                                "lakecolor": "white",
                                "landcolor": "#E5ECF6",
                                "showlakes": true,
                                "subunitcolor": "white"
                            },
                            "font": {
                                "color": "#2a3f5f"
                            },
                            "polar": {
                                "bgcolor": "#E5ECF6",
                                "radialaxis": {
                                    "ticks": "",
                                    "gridcolor": "white",
                                    "linecolor": "white"
                                },
                                "angularaxis": {
                                    "ticks": "",
                                    "gridcolor": "white",
                                    "linecolor": "white"
                                }
                            },
                            "scene": {
                                "xaxis": {
                                    "ticks": "",
                                    "gridcolor": "white",
                                    "gridwidth": 2,
                                    "linecolor": "white",
                                    "zerolinecolor": "white",
                                    "showbackground": true,
                                    "backgroundcolor": "#E5ECF6"
                                },
                                "yaxis": {
                                    "ticks": "",
                                    "gridcolor": "white",
                                    "gridwidth": 2,
                                    "linecolor": "white",
                                    "zerolinecolor": "white",
                                    "showbackground": true,
                                    "backgroundcolor": "#E5ECF6"
                                },
                                "zaxis": {
                                    "ticks": "",
                                    "gridcolor": "white",
                                    "gridwidth": 2,
                                    "linecolor": "white",
                                    "zerolinecolor": "white",
                                    "showbackground": true,
                                    "backgroundcolor": "#E5ECF6"
                                }
                            },
                            "title": {
                                "x": 0.05
                            },
                            "xaxis": {
                                "ticks": "",
                                "title": {
                                    "standoff": 15
                                },
                                "gridcolor": "white",
                                "linecolor": "white",
                                "automargin": true,
                                "zerolinecolor": "white",
                                "zerolinewidth": 2
                            },
                            "yaxis": {
                                "ticks": "",
                                "title": {
                                    "standoff": 15
                                },
                                "gridcolor": "white",
                                "linecolor": "white",
                                "automargin": true,
                                "zerolinecolor": "white",
                                "zerolinewidth": 2
                            },
                            "mapbox": {
                                "style": "light"
                            },
                            "ternary": {
                                "aaxis": {
                                    "ticks": "",
                                    "gridcolor": "white",
                                    "linecolor": "white"
                                },
                                "baxis": {
                                    "ticks": "",
                                    "gridcolor": "white",
                                    "linecolor": "white"
                                },
                                "caxis": {
                                    "ticks": "",
                                    "gridcolor": "white",
                                    "linecolor": "white"
                                },
                                "bgcolor": "#E5ECF6"
                            },
                            "colorway": [
                                "#636efa",
                                "#EF553B",
                                "#00cc96",
                                "#ab63fa",
                                "#FFA15A",
                                "#19d3f3",
                                "#FF6692",
                                "#B6E880",
                                "#FF97FF",
                                "#FECB52"
                            ],
                            "coloraxis": {
                                "colorbar": {
                                    "ticks": "",
                                    "outlinewidth": 0
                                }
                            },
                            "hovermode": "closest",
                            "colorscale": {
                                "diverging": [
                                    [
                                        0,
                                        "#8e0152"
                                    ],
                                    [
                                        0.1,
                                        "#c51b7d"
                                    ],
                                    [
                                        0.2,
                                        "#de77ae"
                                    ],
                                    [
                                        0.3,
                                        "#f1b6da"
                                    ],
                                    [
                                        0.4,
                                        "#fde0ef"
                                    ],
                                    [
                                        0.5,
                                        "#f7f7f7"
                                    ],
                                    [
                                        0.6,
                                        "#e6f5d0"
                                    ],
                                    [
                                        0.7,
                                        "#b8e186"
                                    ],
                                    [
                                        0.8,
                                        "#7fbc41"
                                    ],
                                    [
                                        0.9,
                                        "#4d9221"
                                    ],
                                    [
                                        1,
                                        "#276419"
                                    ]
                                ],
                                "sequential": [
                                    [
                                        0.0,
                                        "#0d0887"
                                    ],
                                    [
                                        0.1111111111111111,
                                        "#46039f"
                                    ],
                                    [
                                        0.2222222222222222,
                                        "#7201a8"
                                    ],
                                    [
                                        0.3333333333333333,
                                        "#9c179e"
                                    ],
                                    [
                                        0.4444444444444444,
                                        "#bd3786"
                                    ],
                                    [
                                        0.5555555555555556,
                                        "#d8576b"
                                    ],
                                    [
                                        0.6666666666666666,
                                        "#ed7953"
                                    ],
                                    [
                                        0.7777777777777778,
                                        "#fb9f3a"
                                    ],
                                    [
                                        0.8888888888888888,
                                        "#fdca26"
                                    ],
                                    [
                                        1.0,
                                        "#f0f921"
                                    ]
                                ],
                                "sequentialminus": [
                                    [
                                        0.0,
                                        "#0d0887"
                                    ],
                                    [
                                        0.1111111111111111,
                                        "#46039f"
                                    ],
                                    [
                                        0.2222222222222222,
                                        "#7201a8"
                                    ],
                                    [
                                        0.3333333333333333,
                                        "#9c179e"
                                    ],
                                    [
                                        0.4444444444444444,
                                        "#bd3786"
                                    ],
                                    [
                                        0.5555555555555556,
                                        "#d8576b"
                                    ],
                                    [
                                        0.6666666666666666,
                                        "#ed7953"
                                    ],
                                    [
                                        0.7777777777777778,
                                        "#fb9f3a"
                                    ],
                                    [
                                        0.8888888888888888,
                                        "#fdca26"
                                    ],
                                    [
                                        1.0,
                                        "#f0f921"
                                    ]
                                ]
                            },
                            "hoverlabel": {
                                "align": "left"
                            },
                            "plot_bgcolor": "#E5ECF6",
                            "paper_bgcolor": "white",
                            "shapedefaults": {
                                "line": {
                                    "color": "#2a3f5f"
                                }
                            },
                            "autotypenumbers": "strict",
                            "annotationdefaults": {
                                "arrowhead": 0,
                                "arrowcolor": "#2a3f5f",
                                "arrowwidth": 1
                            }
                        }
                    },
                    "showlegend": true
                }
            },
            "height": 1000,
            "width": null,
            "user": {
                "profile_url": "https://chart-studio.plotly.com/~peter.capcara",
                "avatar_url": "https://storage.googleapis.com/plotly-prod-profiles/41.jpg",
                "background_url": "https://storage.googleapis.com/plotly-prod-profiles/bg-0.jpg",
                "bio": "",
                "nickname": "",
                "website": "",
                "stream_tokens": null,
                "feature_set_id": null,
                "csrf_token": null,
                "date_joined": "2024-04-08 08:11:51",
                "mapbox_access_tokens": null,
                "has_password": null,
                "username": "peter.capcara",
                "email": null,
                "is_active": null,
                "readonly": null,
                "is_dash_creator": null,
                "dash_created_count": null,
                "is_chart_creator": null,
                "charts_created_count": null
            }
        },
        {
            "creation_time": "2024-04-16T13:21:35.112966Z",
            "comments": {
                "results": [],
                "count": 0
            },
            "parented": true,
            "embed_url": "https://chart-studio.plotly.com/~peter.capcara/97.embed",
            "fid": "peter.capcara:97",
            "filename": "Plot 97",
            "filetype": "plot",
            "img_url": "https://storage.googleapis.com/plotly-prod-images/peter.capcara/97/9_FU8LSVRHZN6WZS1HNU2BUG5WPBC3O1.png",
            "image_urls": {
                "default": "https://storage.googleapis.com/plotly-prod-images/peter.capcara/97/2_FBS2HXWXOCDW323M0ARYFDRX55D76D.png",
                "block-thumb": "https://storage.googleapis.com/plotly-prod-images/peter.capcara/97/8_0ZXPNFCOEJL8YFR7FRQS8OVL42LK1L.png",
                "list-thumb": "https://storage.googleapis.com/plotly-prod-images/peter.capcara/97/9_FU8LSVRHZN6WZS1HNU2BUG5WPBC3O1.png"
            },
            "api_urls": {
                "files": "https://api.plotly.com/v2/files/peter.capcara:97",
                "plots": "https://api.plotly.com/v2/plots/peter.capcara:97",
                "parent": "https://api.plotly.com/v2/folders/home?user=peter.capcara"
            },
            "owner": "peter.capcara",
            "parent": -1,
            "preview": "",
            "referencers": [],
            "references": [],
            "title": "",
            "views": 4,
            "web_url": "https://chart-studio.plotly.com/~peter.capcara/97/",
            "world_readable": true,
            "date_modified": "2024-04-16T13:21:35.127Z",
            "stars": {
                "results": [],
                "count": 0
            },
            "collaborators": {
                "results": [],
                "count": 0
            },
            "subfolder_count": null,
            "refresh_interval": null,
            "organize_view_url": "https://chart-studio.plotly.com/~peter.capcara/97/",
            "current_user_permission": "read",
            "is_theme": null,
            "is_template": null,
            "autosize": true,
            "caption": "",
            "figure": {
                "data": [
                    {
                        "uid": "a1a8b8",
                        "asrc": "peter.capcara:96:785526",
                        "bsrc": "peter.capcara:96:3426ae",
                        "csrc": "peter.capcara:96:fca040",
                        "fill": "toself",
                        "line": {
                            "color": "#444"
                        },
                        "mode": "lines",
                        "name": "PD",
                        "text": "PD",
                        "type": "scatterternary",
                        "subplot": "ternary",
                        "fillcolor": "#8dd3c7"
                    },
                    {
                        "uid": "c72344",
                        "asrc": "peter.capcara:96:d39443",
                        "bsrc": "peter.capcara:96:807e66",
                        "csrc": "peter.capcara:96:8253ac",
                        "fill": "toself",
                        "line": {
                            "color": "#444"
                        },
                        "mode": "lines",
                        "name": "D1",
                        "text": "D1",
                        "type": "scatterternary",
                        "subplot": "ternary",
                        "fillcolor": "#ffffb3"
                    },
                    {
                        "uid": "3eab74",
                        "asrc": "peter.capcara:96:1eb333",
                        "bsrc": "peter.capcara:96:c01d85",
                        "csrc": "peter.capcara:96:55a13b",
                        "fill": "toself",
                        "line": {
                            "color": "#444"
                        },
                        "mode": "lines",
                        "name": "D2",
                        "text": "D2",
                        "type": "scatterternary",
                        "subplot": "ternary",
                        "fillcolor": "#bebada"
                    },
                    {
                        "uid": "b9dc9f",
                        "asrc": "peter.capcara:96:e4a35f",
                        "bsrc": "peter.capcara:96:95abd1",
                        "csrc": "peter.capcara:96:2be142",
                        "fill": "toself",
                        "line": {
                            "color": "#444"
                        },
                        "mode": "lines",
                        "name": "DT",
                        "text": "DT",
                        "type": "scatterternary",
                        "subplot": "ternary",
                        "fillcolor": "#fb8072"
                    },
                    {
                        "uid": "381ad2",
                        "asrc": "peter.capcara:96:c81c47",
                        "bsrc": "peter.capcara:96:fc39a9",
                        "csrc": "peter.capcara:96:388bd6",
                        "fill": "toself",
                        "line": {
                            "color": "#444"
                        },
                        "mode": "lines",
                        "name": "T1",
                        "text": "T1",
                        "type": "scatterternary",
                        "subplot": "ternary",
                        "fillcolor": "#80b1d3"
                    },
                    {
                        "uid": "8cc163",
                        "asrc": "peter.capcara:96:86644a",
                        "bsrc": "peter.capcara:96:2fce5f",
                        "csrc": "peter.capcara:96:f5b0f8",
                        "fill": "toself",
                        "line": {
                            "color": "#444"
                        },
                        "mode": "lines",
                        "name": "T2",
                        "text": "T2",
                        "type": "scatterternary",
                        "subplot": "ternary",
                        "fillcolor": "#fdb462"
                    },
                    {
                        "uid": "6f33dc",
                        "asrc": "peter.capcara:96:e0b6df",
                        "bsrc": "peter.capcara:96:8f1ee5",
                        "csrc": "peter.capcara:96:7e4158",
                        "fill": "toself",
                        "line": {
                            "color": "#444"
                        },
                        "mode": "lines",
                        "name": "T3",
                        "text": "T3",
                        "type": "scatterternary",
                        "opacity": 0.5,
                        "subplot": "ternary",
                        "fillcolor": "#b3de69"
                    },
                    {
                        "asrc": "peter.capcara:96:8d718f",
                        "bsrc": "peter.capcara:96:6654c7",
                        "csrc": "peter.capcara:96:3bee80",
                        "mode": "markers",
                        "name": "BOSA_T401",
                        "type": "scatterternary",
                        "marker": {
                            "size": 10,
                            "color": "blue",
                            "symbol": "diamond"
                        },
                        "subplot": "ternary"
                    },
                    {
                        "asrc": "peter.capcara:96:138747",
                        "bsrc": "peter.capcara:96:0b4e00",
                        "csrc": "peter.capcara:96:4c732c",
                        "mode": "markers",
                        "name": "BOSA_T402",
                        "type": "scatterternary",
                        "marker": {
                            "size": 10,
                            "color": "blue",
                            "symbol": "diamond"
                        },
                        "subplot": "ternary"
                    },
                    {
                        "asrc": "peter.capcara:96:a2bfa9",
                        "bsrc": "peter.capcara:96:d7d640",
                        "csrc": "peter.capcara:96:e64d01",
                        "mode": "markers",
                        "name": "SUCA_T402",
                        "type": "scatterternary",
                        "marker": {
                            "size": 10,
                            "color": "blue",
                            "symbol": "diamond"
                        },
                        "subplot": "ternary"
                    },
                    {
                        "asrc": "peter.capcara:96:e7facf",
                        "bsrc": "peter.capcara:96:a3fcda",
                        "csrc": "peter.capcara:96:f0780a",
                        "mode": "markers",
                        "name": "VDUR_T401",
                        "type": "scatterternary",
                        "marker": {
                            "size": 10,
                            "color": "blue",
                            "symbol": "diamond"
                        },
                        "subplot": "ternary"
                    },
                    {
                        "asrc": "peter.capcara:96:edf0a6",
                        "bsrc": "peter.capcara:96:7830d6",
                        "csrc": "peter.capcara:96:00cb46",
                        "mode": "markers",
                        "name": "LEME_T402",
                        "type": "scatterternary",
                        "marker": {
                            "size": 10,
                            "color": "blue",
                            "symbol": "diamond"
                        },
                        "subplot": "ternary"
                    },
                    {
                        "asrc": "peter.capcara:96:f279c7",
                        "bsrc": "peter.capcara:96:79360e",
                        "csrc": "peter.capcara:96:2559d6",
                        "mode": "markers",
                        "name": "LEME_T401",
                        "type": "scatterternary",
                        "marker": {
                            "size": 10,
                            "color": "blue",
                            "symbol": "diamond"
                        },
                        "subplot": "ternary"
                    },
                    {
                        "asrc": "peter.capcara:96:0ca173",
                        "bsrc": "peter.capcara:96:bbd3d4",
                        "csrc": "peter.capcara:96:1f21b0",
                        "mode": "markers",
                        "name": "PBIS_T402",
                        "type": "scatterternary",
                        "marker": {
                            "size": 10,
                            "color": "blue",
                            "symbol": "diamond"
                        },
                        "subplot": "ternary"
                    },
                    {
                        "asrc": "peter.capcara:96:28c496",
                        "bsrc": "peter.capcara:96:fc615b",
                        "csrc": "peter.capcara:96:21523a",
                        "mode": "markers",
                        "name": "PBIS_T401",
                        "type": "scatterternary",
                        "marker": {
                            "size": 10,
                            "color": "blue",
                            "symbol": "diamond"
                        },
                        "subplot": "ternary"
                    },
                    {
                        "asrc": "peter.capcara:96:5ec0ad",
                        "bsrc": "peter.capcara:96:1ad195",
                        "csrc": "peter.capcara:96:ddc616",
                        "mode": "markers",
                        "name": "VKAP_T402",
                        "type": "scatterternary",
                        "marker": {
                            "size": 10,
                            "color": "blue",
                            "symbol": "diamond"
                        },
                        "subplot": "ternary"
                    },
                    {
                        "asrc": "peter.capcara:96:69d29e",
                        "bsrc": "peter.capcara:96:92e963",
                        "csrc": "peter.capcara:96:b2a91c",
                        "mode": "markers",
                        "name": "VKAP_T401",
                        "type": "scatterternary",
                        "marker": {
                            "size": 10,
                            "color": "blue",
                            "symbol": "diamond"
                        },
                        "subplot": "ternary"
                    },
                    {
                        "type": "table",
                        "cells": {
                            "fill": {
                                "color": "lavender"
                            },
                            "align": "left",
                            "valuessrc": "peter.capcara:96:9cafed"
                        },
                        "domain": {
                            "x": [
                                0.0,
                                1.0
                            ],
                            "y": [
                                0.0,
                                0.255
                            ]
                        },
                        "header": {
                            "fill": {
                                "color": "paleturquoise"
                            },
                            "align": "left",
                            "valuessrc": "peter.capcara:96:9901bc"
                        },
                        "columnwidthsrc": "peter.capcara:96:ea5806"
                    }
                ],
                "layout": {
                    "title": {
                        "text": "Duval Triangle for DGA Interpretation"
                    },
                    "height": 1000,
                    "ternary": {
                        "sum": 100,
                        "aaxis": {
                            "min": 0.01,
                            "ticks": "outside",
                            "title": {
                                "text": "CH4(Methane)"
                            },
                            "linewidth": 2,
                            "ticksuffix": "%"
                        },
                        "baxis": {
                            "min": 0.01,
                            "ticks": "outside",
                            "title": {
                                "text": "C2H2(Acetylene)"
                            },
                            "linewidth": 2,
                            "ticksuffix": "%"
                        },
                        "caxis": {
                            "min": 0.01,
                            "ticks": "outside",
                            "title": {
                                "text": "C2H4(Ethylene)"
                            },
                            "linewidth": 2,
                            "ticksuffix": "%"
                        },
                        "domain": {
                            "x": [
                                0.0,
                                1.0
                            ],
                            "y": [
                                0.405,
                                1.0
                            ]
                        }
                    },
                    "autosize": true,
                    "template": {
                        "data": {
                            "bar": [
                                {
                                    "type": "bar",
                                    "marker": {
                                        "line": {
                                            "color": "#E5ECF6",
                                            "width": 0.5
                                        },
                                        "pattern": {
                                            "size": 10,
                                            "fillmode": "overlay",
                                            "solidity": 0.2
                                        }
                                    },
                                    "error_x": {
                                        "color": "#2a3f5f"
                                    },
                                    "error_y": {
                                        "color": "#2a3f5f"
                                    }
                                }
                            ],
                            "pie": [
                                {
                                    "type": "pie",
                                    "automargin": true
                                }
                            ],
                            "table": [
                                {
                                    "type": "table",
                                    "cells": {
                                        "fill": {
                                            "color": "#EBF0F8"
                                        },
                                        "line": {
                                            "color": "white"
                                        }
                                    },
                                    "header": {
                                        "fill": {
                                            "color": "#C8D4E3"
                                        },
                                        "line": {
                                            "color": "white"
                                        }
                                    }
                                }
                            ],
                            "carpet": [
                                {
                                    "type": "carpet",
                                    "aaxis": {
                                        "gridcolor": "white",
                                        "linecolor": "white",
                                        "endlinecolor": "#2a3f5f",
                                        "minorgridcolor": "white",
                                        "startlinecolor": "#2a3f5f"
                                    },
                                    "baxis": {
                                        "gridcolor": "white",
                                        "linecolor": "white",
                                        "endlinecolor": "#2a3f5f",
                                        "minorgridcolor": "white",
                                        "startlinecolor": "#2a3f5f"
                                    }
                                }
                            ],
                            "mesh3d": [
                                {
                                    "type": "mesh3d",
                                    "colorbar": {
                                        "ticks": "",
                                        "outlinewidth": 0
                                    }
                                }
                            ],
                            "contour": [
                                {
                                    "type": "contour",
                                    "colorbar": {
                                        "ticks": "",
                                        "outlinewidth": 0
                                    },
                                    "colorscale": [
                                        [
                                            0.0,
                                            "#0d0887"
                                        ],
                                        [
                                            0.1111111111111111,
                                            "#46039f"
                                        ],
                                        [
                                            0.2222222222222222,
                                            "#7201a8"
                                        ],
                                        [
                                            0.3333333333333333,
                                            "#9c179e"
                                        ],
                                        [
                                            0.4444444444444444,
                                            "#bd3786"
                                        ],
                                        [
                                            0.5555555555555556,
                                            "#d8576b"
                                        ],
                                        [
                                            0.6666666666666666,
                                            "#ed7953"
                                        ],
                                        [
                                            0.7777777777777778,
                                            "#fb9f3a"
                                        ],
                                        [
                                            0.8888888888888888,
                                            "#fdca26"
                                        ],
                                        [
                                            1.0,
                                            "#f0f921"
                                        ]
                                    ]
                                }
                            ],
                            "heatmap": [
                                {
                                    "type": "heatmap",
                                    "colorbar": {
                                        "ticks": "",
                                        "outlinewidth": 0
                                    },
                                    "colorscale": [
                                        [
                                            0.0,
                                            "#0d0887"
                                        ],
                                        [
                                            0.1111111111111111,
                                            "#46039f"
                                        ],
                                        [
                                            0.2222222222222222,
                                            "#7201a8"
                                        ],
                                        [
                                            0.3333333333333333,
                                            "#9c179e"
                                        ],
                                        [
                                            0.4444444444444444,
                                            "#bd3786"
                                        ],
                                        [
                                            0.5555555555555556,
                                            "#d8576b"
                                        ],
                                        [
                                            0.6666666666666666,
                                            "#ed7953"
                                        ],
                                        [
                                            0.7777777777777778,
                                            "#fb9f3a"
                                        ],
                                        [
                                            0.8888888888888888,
                                            "#fdca26"
                                        ],
                                        [
                                            1.0,
                                            "#f0f921"
                                        ]
                                    ]
                                }
                            ],
                            "scatter": [
                                {
                                    "type": "scatter",
                                    "fillpattern": {
                                        "size": 10,
                                        "fillmode": "overlay",
                                        "solidity": 0.2
                                    }
                                }
                            ],
                            "surface": [
                                {
                                    "type": "surface",
                                    "colorbar": {
                                        "ticks": "",
                                        "outlinewidth": 0
                                    },
                                    "colorscale": [
                                        [
                                            0.0,
                                            "#0d0887"
                                        ],
                                        [
                                            0.1111111111111111,
                                            "#46039f"
                                        ],
                                        [
                                            0.2222222222222222,
                                            "#7201a8"
                                        ],
                                        [
                                            0.3333333333333333,
                                            "#9c179e"
                                        ],
                                        [
                                            0.4444444444444444,
                                            "#bd3786"
                                        ],
                                        [
                                            0.5555555555555556,
                                            "#d8576b"
                                        ],
                                        [
                                            0.6666666666666666,
                                            "#ed7953"
                                        ],
                                        [
                                            0.7777777777777778,
                                            "#fb9f3a"
                                        ],
                                        [
                                            0.8888888888888888,
                                            "#fdca26"
                                        ],
                                        [
                                            1.0,
                                            "#f0f921"
                                        ]
                                    ]
                                }
                            ],
                            "barpolar": [
                                {
                                    "type": "barpolar",
                                    "marker": {
                                        "line": {
                                            "color": "#E5ECF6",
                                            "width": 0.5
                                        },
                                        "pattern": {
                                            "size": 10,
                                            "fillmode": "overlay",
                                            "solidity": 0.2
                                        }
                                    }
                                }
                            ],
                            "heatmapgl": [
                                {
                                    "type": "heatmapgl",
                                    "colorbar": {
                                        "ticks": "",
                                        "outlinewidth": 0
                                    },
                                    "colorscale": [
                                        [
                                            0.0,
                                            "#0d0887"
                                        ],
                                        [
                                            0.1111111111111111,
                                            "#46039f"
                                        ],
                                        [
                                            0.2222222222222222,
                                            "#7201a8"
                                        ],
                                        [
                                            0.3333333333333333,
                                            "#9c179e"
                                        ],
                                        [
                                            0.4444444444444444,
                                            "#bd3786"
                                        ],
                                        [
                                            0.5555555555555556,
                                            "#d8576b"
                                        ],
                                        [
                                            0.6666666666666666,
                                            "#ed7953"
                                        ],
                                        [
                                            0.7777777777777778,
                                            "#fb9f3a"
                                        ],
                                        [
                                            0.8888888888888888,
                                            "#fdca26"
                                        ],
                                        [
                                            1.0,
                                            "#f0f921"
                                        ]
                                    ]
                                }
                            ],
                            "histogram": [
                                {
                                    "type": "histogram",
                                    "marker": {
                                        "pattern": {
                                            "size": 10,
                                            "fillmode": "overlay",
                                            "solidity": 0.2
                                        }
                                    }
                                }
                            ],
                            "parcoords": [
                                {
                                    "line": {
                                        "colorbar": {
                                            "ticks": "",
                                            "outlinewidth": 0
                                        }
                                    },
                                    "type": "parcoords"
                                }
                            ],
                            "scatter3d": [
                                {
                                    "line": {
                                        "colorbar": {
                                            "ticks": "",
                                            "outlinewidth": 0
                                        }
                                    },
                                    "type": "scatter3d",
                                    "marker": {
                                        "colorbar": {
                                            "ticks": "",
                                            "outlinewidth": 0
                                        }
                                    }
                                }
                            ],
                            "scattergl": [
                                {
                                    "type": "scattergl",
                                    "marker": {
                                        "colorbar": {
                                            "ticks": "",
                                            "outlinewidth": 0
                                        }
                                    }
                                }
                            ],
                            "choropleth": [
                                {
                                    "type": "choropleth",
                                    "colorbar": {
                                        "ticks": "",
                                        "outlinewidth": 0
                                    }
                                }
                            ],
                            "scattergeo": [
                                {
                                    "type": "scattergeo",
                                    "marker": {
                                        "colorbar": {
                                            "ticks": "",
                                            "outlinewidth": 0
                                        }
                                    }
                                }
                            ],
                            "histogram2d": [
                                {
                                    "type": "histogram2d",
                                    "colorbar": {
                                        "ticks": "",
                                        "outlinewidth": 0
                                    },
                                    "colorscale": [
                                        [
                                            0.0,
                                            "#0d0887"
                                        ],
                                        [
                                            0.1111111111111111,
                                            "#46039f"
                                        ],
                                        [
                                            0.2222222222222222,
                                            "#7201a8"
                                        ],
                                        [
                                            0.3333333333333333,
                                            "#9c179e"
                                        ],
                                        [
                                            0.4444444444444444,
                                            "#bd3786"
                                        ],
                                        [
                                            0.5555555555555556,
                                            "#d8576b"
                                        ],
                                        [
                                            0.6666666666666666,
                                            "#ed7953"
                                        ],
                                        [
                                            0.7777777777777778,
                                            "#fb9f3a"
                                        ],
                                        [
                                            0.8888888888888888,
                                            "#fdca26"
                                        ],
                                        [
                                            1.0,
                                            "#f0f921"
                                        ]
                                    ]
                                }
                            ],
                            "scatterpolar": [
                                {
                                    "type": "scatterpolar",
                                    "marker": {
                                        "colorbar": {
                                            "ticks": "",
                                            "outlinewidth": 0
                                        }
                                    }
                                }
                            ],
                            "contourcarpet": [
                                {
                                    "type": "contourcarpet",
                                    "colorbar": {
                                        "ticks": "",
                                        "outlinewidth": 0
                                    }
                                }
                            ],
                            "scattercarpet": [
                                {
                                    "type": "scattercarpet",
                                    "marker": {
                                        "colorbar": {
                                            "ticks": "",
                                            "outlinewidth": 0
                                        }
                                    }
                                }
                            ],
                            "scattermapbox": [
                                {
                                    "type": "scattermapbox",
                                    "marker": {
                                        "colorbar": {
                                            "ticks": "",
                                            "outlinewidth": 0
                                        }
                                    }
                                }
                            ],
                            "scatterpolargl": [
                                {
                                    "type": "scatterpolargl",
                                    "marker": {
                                        "colorbar": {
                                            "ticks": "",
                                            "outlinewidth": 0
                                        }
                                    }
                                }
                            ],
                            "scatterternary": [
                                {
                                    "type": "scatterternary",
                                    "marker": {
                                        "colorbar": {
                                            "ticks": "",
                                            "outlinewidth": 0
                                        }
                                    }
                                }
                            ],
                            "histogram2dcontour": [
                                {
                                    "type": "histogram2dcontour",
                                    "colorbar": {
                                        "ticks": "",
                                        "outlinewidth": 0
                                    },
                                    "colorscale": [
                                        [
                                            0.0,
                                            "#0d0887"
                                        ],
                                        [
                                            0.1111111111111111,
                                            "#46039f"
                                        ],
                                        [
                                            0.2222222222222222,
                                            "#7201a8"
                                        ],
                                        [
                                            0.3333333333333333,
                                            "#9c179e"
                                        ],
                                        [
                                            0.4444444444444444,
                                            "#bd3786"
                                        ],
                                        [
                                            0.5555555555555556,
                                            "#d8576b"
                                        ],
                                        [
                                            0.6666666666666666,
                                            "#ed7953"
                                        ],
                                        [
                                            0.7777777777777778,
                                            "#fb9f3a"
                                        ],
                                        [
                                            0.8888888888888888,
                                            "#fdca26"
                                        ],
                                        [
                                            1.0,
                                            "#f0f921"
                                        ]
                                    ]
                                }
                            ]
                        },
                        "layout": {
                            "geo": {
                                "bgcolor": "white",
                                "showland": true,
                                "lakecolor": "white",
                                "landcolor": "#E5ECF6",
                                "showlakes": true,
                                "subunitcolor": "white"
                            },
                            "font": {
                                "color": "#2a3f5f"
                            },
                            "polar": {
                                "bgcolor": "#E5ECF6",
                                "radialaxis": {
                                    "ticks": "",
                                    "gridcolor": "white",
                                    "linecolor": "white"
                                },
                                "angularaxis": {
                                    "ticks": "",
                                    "gridcolor": "white",
                                    "linecolor": "white"
                                }
                            },
                            "scene": {
                                "xaxis": {
                                    "ticks": "",
                                    "gridcolor": "white",
                                    "gridwidth": 2,
                                    "linecolor": "white",
                                    "zerolinecolor": "white",
                                    "showbackground": true,
                                    "backgroundcolor": "#E5ECF6"
                                },
                                "yaxis": {
                                    "ticks": "",
                                    "gridcolor": "white",
                                    "gridwidth": 2,
                                    "linecolor": "white",
                                    "zerolinecolor": "white",
                                    "showbackground": true,
                                    "backgroundcolor": "#E5ECF6"
                                },
                                "zaxis": {
                                    "ticks": "",
                                    "gridcolor": "white",
                                    "gridwidth": 2,
                                    "linecolor": "white",
                                    "zerolinecolor": "white",
                                    "showbackground": true,
                                    "backgroundcolor": "#E5ECF6"
                                }
                            },
                            "title": {
                                "x": 0.05
                            },
                            "xaxis": {
                                "ticks": "",
                                "title": {
                                    "standoff": 15
                                },
                                "gridcolor": "white",
                                "linecolor": "white",
                                "automargin": true,
                                "zerolinecolor": "white",
                                "zerolinewidth": 2
                            },
                            "yaxis": {
                                "ticks": "",
                                "title": {
                                    "standoff": 15
                                },
                                "gridcolor": "white",
                                "linecolor": "white",
                                "automargin": true,
                                "zerolinecolor": "white",
                                "zerolinewidth": 2
                            },
                            "mapbox": {
                                "style": "light"
                            },
                            "ternary": {
                                "aaxis": {
                                    "ticks": "",
                                    "gridcolor": "white",
                                    "linecolor": "white"
                                },
                                "baxis": {
                                    "ticks": "",
                                    "gridcolor": "white",
                                    "linecolor": "white"
                                },
                                "caxis": {
                                    "ticks": "",
                                    "gridcolor": "white",
                                    "linecolor": "white"
                                },
                                "bgcolor": "#E5ECF6"
                            },
                            "colorway": [
                                "#636efa",
                                "#EF553B",
                                "#00cc96",
                                "#ab63fa",
                                "#FFA15A",
                                "#19d3f3",
                                "#FF6692",
                                "#B6E880",
                                "#FF97FF",
                                "#FECB52"
                            ],
                            "coloraxis": {
                                "colorbar": {
                                    "ticks": "",
                                    "outlinewidth": 0
                                }
                            },
                            "hovermode": "closest",
                            "colorscale": {
                                "diverging": [
                                    [
                                        0,
                                        "#8e0152"
                                    ],
                                    [
                                        0.1,
                                        "#c51b7d"
                                    ],
                                    [
                                        0.2,
                                        "#de77ae"
                                    ],
                                    [
                                        0.3,
                                        "#f1b6da"
                                    ],
                                    [
                                        0.4,
                                        "#fde0ef"
                                    ],
                                    [
                                        0.5,
                                        "#f7f7f7"
                                    ],
                                    [
                                        0.6,
                                        "#e6f5d0"
                                    ],
                                    [
                                        0.7,
                                        "#b8e186"
                                    ],
                                    [
                                        0.8,
                                        "#7fbc41"
                                    ],
                                    [
                                        0.9,
                                        "#4d9221"
                                    ],
                                    [
                                        1,
                                        "#276419"
                                    ]
                                ],
                                "sequential": [
                                    [
                                        0.0,
                                        "#0d0887"
                                    ],
                                    [
                                        0.1111111111111111,
                                        "#46039f"
                                    ],
                                    [
                                        0.2222222222222222,
                                        "#7201a8"
                                    ],
                                    [
                                        0.3333333333333333,
                                        "#9c179e"
                                    ],
                                    [
                                        0.4444444444444444,
                                        "#bd3786"
                                    ],
                                    [
                                        0.5555555555555556,
                                        "#d8576b"
                                    ],
                                    [
                                        0.6666666666666666,
                                        "#ed7953"
                                    ],
                                    [
                                        0.7777777777777778,
                                        "#fb9f3a"
                                    ],
                                    [
                                        0.8888888888888888,
                                        "#fdca26"
                                    ],
                                    [
                                        1.0,
                                        "#f0f921"
                                    ]
                                ],
                                "sequentialminus": [
                                    [
                                        0.0,
                                        "#0d0887"
                                    ],
                                    [
                                        0.1111111111111111,
                                        "#46039f"
                                    ],
                                    [
                                        0.2222222222222222,
                                        "#7201a8"
                                    ],
                                    [
                                        0.3333333333333333,
                                        "#9c179e"
                                    ],
                                    [
                                        0.4444444444444444,
                                        "#bd3786"
                                    ],
                                    [
                                        0.5555555555555556,
                                        "#d8576b"
                                    ],
                                    [
                                        0.6666666666666666,
                                        "#ed7953"
                                    ],
                                    [
                                        0.7777777777777778,
                                        "#fb9f3a"
                                    ],
                                    [
                                        0.8888888888888888,
                                        "#fdca26"
                                    ],
                                    [
                                        1.0,
                                        "#f0f921"
                                    ]
                                ]
                            },
                            "hoverlabel": {
                                "align": "left"
                            },
                            "plot_bgcolor": "#E5ECF6",
                            "paper_bgcolor": "white",
                            "shapedefaults": {
                                "line": {
                                    "color": "#2a3f5f"
                                }
                            },
                            "autotypenumbers": "strict",
                            "annotationdefaults": {
                                "arrowhead": 0,
                                "arrowcolor": "#2a3f5f",
                                "arrowwidth": 1
                            }
                        }
                    },
                    "showlegend": true
                }
            },
            "height": 1000,
            "width": null,
            "user": {
                "profile_url": "https://chart-studio.plotly.com/~peter.capcara",
                "avatar_url": "https://storage.googleapis.com/plotly-prod-profiles/41.jpg",
                "background_url": "https://storage.googleapis.com/plotly-prod-profiles/bg-0.jpg",
                "bio": "",
                "nickname": "",
                "website": "",
                "stream_tokens": null,
                "feature_set_id": null,
                "csrf_token": null,
                "date_joined": "2024-04-08 08:11:51",
                "mapbox_access_tokens": null,
                "has_password": null,
                "username": "peter.capcara",
                "email": null,
                "is_active": null,
                "readonly": null,
                "is_dash_creator": null,
                "dash_created_count": null,
                "is_chart_creator": null,
                "charts_created_count": null
            }
        },
        {
            "creation_time": "2024-04-16T13:19:25.942778Z",
            "comments": {
                "results": [],
                "count": 0
            },
            "parented": true,
            "embed_url": "https://chart-studio.plotly.com/~civilmatrix/4.embed",
            "fid": "civilmatrix:4",
            "filename": "Plot 4",
            "filetype": "plot",
            "img_url": "https://storage.googleapis.com/plotly-prod-images/civilmatrix/4/9_E3QT57P627DDTTTJ616J11LE4O7XL1.png",
            "image_urls": {
                "default": "https://storage.googleapis.com/plotly-prod-images/civilmatrix/4/2_RSTQ2R3FE83A14EHVC73PRGFC17Z64.png",
                "block-thumb": "https://storage.googleapis.com/plotly-prod-images/civilmatrix/4/8_MLSU9RY2F84IY5GYCXXQDNBCYJWNT9.png",
                "list-thumb": "https://storage.googleapis.com/plotly-prod-images/civilmatrix/4/9_E3QT57P627DDTTTJ616J11LE4O7XL1.png"
            },
            "api_urls": {
                "files": "https://api.plotly.com/v2/files/civilmatrix:4",
                "plots": "https://api.plotly.com/v2/plots/civilmatrix:4",
                "parent": "https://api.plotly.com/v2/folders/home?user=civilmatrix"
            },
            "owner": "civilmatrix",
            "parent": -1,
            "preview": "",
            "referencers": [],
            "references": [],
            "title": "",
            "views": 1,
            "web_url": "https://chart-studio.plotly.com/~civilmatrix/4/",
            "world_readable": true,
            "date_modified": "2024-04-16T13:19:25.954Z",
            "stars": {
                "results": [],
                "count": 0
            },
            "collaborators": {
                "results": [],
                "count": 0
            },
            "subfolder_count": null,
            "refresh_interval": null,
            "organize_view_url": "https://chart-studio.plotly.com/~civilmatrix/4/",
            "current_user_permission": "read",
            "is_theme": null,
            "is_template": false,
            "autosize": true,
            "caption": "",
            "figure": {
                "data": [
                    {
                        "uid": "0da186",
                        "meta": {
                            "columnNames": {
                                "x": "Year",
                                "y": "Growth "
                            }
                        },
                        "mode": "lines",
                        "type": "scatter",
                        "xsrc": "civilmatrix:2:9131a5",
                        "ysrc": "civilmatrix:2:d4ee67"
                    },
                    {
                        "uid": "632e51",
                        "meta": {
                            "columnNames": {
                                "x": "Year",
                                "y": "Growth "
                            }
                        },
                        "mode": "lines",
                        "type": "scatter",
                        "xsrc": "civilmatrix:3:f52f6e",
                        "ysrc": "civilmatrix:3:2c87ac",
                        "stackgroup": null
                    }
                ],
                "frames": [],
                "layout": {
                    "title": {
                        "text": "Click to enter Plot title"
                    },
                    "xaxis": {
                        "type": "linear",
                        "range": [
                            2019,
                            2023
                        ],
                        "autorange": true
                    },
                    "yaxis": {
                        "type": "linear",
                        "range": [
                            0.9555555555555555,
                            5.844444444444444
                        ],
                        "autorange": true
                    },
                    "autosize": true,
                    "template": {
                        "data": {
                            "bar": [
                                {
                                    "type": "bar",
                                    "marker": {
                                        "colorbar": {
                                            "ticks": "",
                                            "outlinewidth": 0
                                        }
                                    }
                                }
                            ],
                            "table": [
                                {
                                    "type": "table",
                                    "cells": {
                                        "fill": {
                                            "color": "#EBF0F8"
                                        },
                                        "line": {
                                            "color": "white"
                                        }
                                    },
                                    "header": {
                                        "fill": {
                                            "color": "#C8D4E3"
                                        },
                                        "line": {
                                            "color": "white"
                                        }
                                    }
                                }
                            ],
                            "carpet": [
                                {
                                    "type": "carpet",
                                    "aaxis": {
                                        "gridcolor": "#C8D4E3",
                                        "linecolor": "#C8D4E3",
                                        "endlinecolor": "#2a3f5f",
                                        "minorgridcolor": "#C8D4E3",
                                        "startlinecolor": "#2a3f5f"
                                    },
                                    "baxis": {
                                        "gridcolor": "#C8D4E3",
                                        "linecolor": "#C8D4E3",
                                        "endlinecolor": "#2a3f5f",
                                        "minorgridcolor": "#C8D4E3",
                                        "startlinecolor": "#2a3f5f"
                                    }
                                }
                            ],
                            "mesh3d": [
                                {
                                    "type": "mesh3d",
                                    "colorbar": {
                                        "ticks": "",
                                        "outlinewidth": 0
                                    }
                                }
                            ],
                            "contour": [
                                {
                                    "type": "contour",
                                    "colorbar": {
                                        "ticks": "",
                                        "outlinewidth": 0
                                    },
                                    "autocolorscale": true
                                }
                            ],
                            "heatmap": [
                                {
                                    "type": "heatmap",
                                    "colorbar": {
                                        "ticks": "",
                                        "outlinewidth": 0
                                    },
                                    "autocolorscale": true
                                }
                            ],
                            "scatter": [
                                {
                                    "type": "scatter",
                                    "marker": {
                                        "colorbar": {
                                            "ticks": "",
                                            "outlinewidth": 0
                                        }
                                    }
                                }
                            ],
                            "surface": [
                                {
                                    "type": "surface",
                                    "colorbar": {
                                        "ticks": "",
                                        "outlinewidth": 0
                                    }
                                }
                            ],
                            "heatmapgl": [
                                {
                                    "type": "heatmapgl",
                                    "colorbar": {
                                        "ticks": "",
                                        "outlinewidth": 0
                                    }
                                }
                            ],
                            "histogram": [
                                {
                                    "type": "histogram",
                                    "marker": {
                                        "colorbar": {
                                            "ticks": "",
                                            "outlinewidth": 0
                                        }
                                    }
                                }
                            ],
                            "parcoords": [
                                {
                                    "line": {
                                        "colorbar": {
                                            "ticks": "",
                                            "outlinewidth": 0
                                        }
                                    },
                                    "type": "parcoords"
                                }
                            ],
                            "scatter3d": [
                                {
                                    "type": "scatter3d",
                                    "marker": {
                                        "colorbar": {
                                            "ticks": "",
                                            "outlinewidth": 0
                                        }
                                    }
                                }
                            ],
                            "scattergl": [
                                {
                                    "type": "scattergl",
                                    "marker": {
                                        "colorbar": {
                                            "ticks": "",
                                            "outlinewidth": 0
                                        }
                                    }
                                }
                            ],
                            "choropleth": [
                                {
                                    "type": "choropleth",
                                    "colorbar": {
                                        "ticks": "",
                                        "outlinewidth": 0
                                    }
                                }
                            ],
                            "scattergeo": [
                                {
                                    "type": "scattergeo",
                                    "marker": {
                                        "colorbar": {
                                            "ticks": "",
                                            "outlinewidth": 0
                                        }
                                    }
                                }
                            ],
                            "histogram2d": [
                                {
                                    "type": "histogram2d",
                                    "colorbar": {
                                        "ticks": "",
                                        "outlinewidth": 0
                                    },
                                    "autocolorscale": true
                                }
                            ],
                            "scatterpolar": [
                                {
                                    "type": "scatterpolar",
                                    "marker": {
                                        "colorbar": {
                                            "ticks": "",
                                            "outlinewidth": 0
                                        }
                                    }
                                }
                            ],
                            "contourcarpet": [
                                {
                                    "type": "contourcarpet",
                                    "colorbar": {
                                        "ticks": "",
                                        "outlinewidth": 0
                                    }
                                }
                            ],
                            "scattercarpet": [
                                {
                                    "type": "scattercarpet",
                                    "marker": {
                                        "colorbar": {
                                            "ticks": "",
                                            "outlinewidth": 0
                                        }
                                    }
                                }
                            ],
                            "scattermapbox": [
                                {
                                    "type": "scattermapbox",
                                    "marker": {
                                        "colorbar": {
                                            "ticks": "",
                                            "outlinewidth": 0
                                        }
                                    }
                                }
                            ],
                            "scatterpolargl": [
                                {
                                    "type": "scatterpolargl",
                                    "marker": {
                                        "colorbar": {
                                            "ticks": "",
                                            "outlinewidth": 0
                                        }
                                    }
                                }
                            ],
                            "scatterternary": [
                                {
                                    "type": "scatterternary",
                                    "marker": {
                                        "colorbar": {
                                            "ticks": "",
                                            "outlinewidth": 0
                                        }
                                    }
                                }
                            ],
                            "histogram2dcontour": [
                                {
                                    "type": "histogram2dcontour",
                                    "colorbar": {
                                        "ticks": "",
                                        "outlinewidth": 0
                                    },
                                    "autocolorscale": true
                                }
                            ]
                        },
                        "layout": {
                            "geo": {
                                "bgcolor": "white",
                                "showland": true,
                                "lakecolor": "white",
                                "landcolor": "white",
                                "showlakes": true,
                                "subunitcolor": "#C8D4E3"
                            },
                            "font": {
                                "color": "#2a3f5f"
                            },
                            "polar": {
                                "bgcolor": "white",
                                "radialaxis": {
                                    "ticks": "",
                                    "gridcolor": "#EBF0F8",
                                    "linecolor": "#EBF0F8"
                                },
                                "angularaxis": {
                                    "ticks": "",
                                    "gridcolor": "#EBF0F8",
                                    "linecolor": "#EBF0F8"
                                }
                            },
                            "scene": {
                                "xaxis": {
                                    "ticks": "",
                                    "gridcolor": "#DFE8F3",
                                    "gridwidth": 2,
                                    "linecolor": "#EBF0F8",
                                    "zerolinecolor": "#EBF0F8",
                                    "showbackground": true,
                                    "backgroundcolor": "white"
                                },
                                "yaxis": {
                                    "ticks": "",
                                    "gridcolor": "#DFE8F3",
                                    "gridwidth": 2,
                                    "linecolor": "#EBF0F8",
                                    "zerolinecolor": "#EBF0F8",
                                    "showbackground": true,
                                    "backgroundcolor": "white"
                                },
                                "zaxis": {
                                    "ticks": "",
                                    "gridcolor": "#DFE8F3",
                                    "gridwidth": 2,
                                    "linecolor": "#EBF0F8",
                                    "zerolinecolor": "#EBF0F8",
                                    "showbackground": true,
                                    "backgroundcolor": "white"
                                }
                            },
                            "title": {
                                "x": 0.05
                            },
                            "xaxis": {
                                "ticks": "",
                                "gridcolor": "#EBF0F8",
                                "linecolor": "#EBF0F8",
                                "automargin": true,
                                "zerolinecolor": "#EBF0F8",
                                "zerolinewidth": 2
                            },
                            "yaxis": {
                                "ticks": "",
                                "gridcolor": "#EBF0F8",
                                "linecolor": "#EBF0F8",
                                "automargin": true,
                                "zerolinecolor": "#EBF0F8",
                                "zerolinewidth": 2
                            },
                            "ternary": {
                                "aaxis": {
                                    "ticks": "",
                                    "gridcolor": "#DFE8F3",
                                    "linecolor": "#A2B1C6"
                                },
                                "baxis": {
                                    "ticks": "",
                                    "gridcolor": "#DFE8F3",
                                    "linecolor": "#A2B1C6"
                                },
                                "caxis": {
                                    "ticks": "",
                                    "gridcolor": "#DFE8F3",
                                    "linecolor": "#A2B1C6"
                                },
                                "bgcolor": "white"
                            },
                            "colorway": [
                                "#636efa",
                                "#EF553B",
                                "#00cc96",
                                "#ab63fa",
                                "#19d3f3",
                                "#e763fa",
                                "#fecb52",
                                "#ffa15a",
                                "#ff6692",
                                "#b6e880"
                            ],
                            "hovermode": "closest",
                            "colorscale": {
                                "diverging": [
                                    [
                                        0,
                                        "#8e0152"
                                    ],
                                    [
                                        0.1,
                                        "#c51b7d"
                                    ],
                                    [
                                        0.2,
                                        "#de77ae"
                                    ],
                                    [
                                        0.3,
                                        "#f1b6da"
                                    ],
                                    [
                                        0.4,
                                        "#fde0ef"
                                    ],
                                    [
                                        0.5,
                                        "#f7f7f7"
                                    ],
                                    [
                                        0.6,
                                        "#e6f5d0"
                                    ],
                                    [
                                        0.7,
                                        "#b8e186"
                                    ],
                                    [
                                        0.8,
                                        "#7fbc41"
                                    ],
                                    [
                                        0.9,
                                        "#4d9221"
                                    ],
                                    [
                                        1,
                                        "#276419"
                                    ]
                                ],
                                "sequential": [
                                    [
                                        0,
                                        "#0508b8"
                                    ],
                                    [
                                        0.0893854748603352,
                                        "#1910d8"
                                    ],
                                    [
                                        0.1787709497206704,
                                        "#3c19f0"
                                    ],
                                    [
                                        0.2681564245810056,
                                        "#6b1cfb"
                                    ],
                                    [
                                        0.3575418994413408,
                                        "#981cfd"
                                    ],
                                    [
                                        0.44692737430167595,
                                        "#bf1cfd"
                                    ],
                                    [
                                        0.5363128491620112,
                                        "#dd2bfd"
                                    ],
                                    [
                                        0.6256983240223464,
                                        "#f246fe"
                                    ],
                                    [
                                        0.7150837988826816,
                                        "#fc67fd"
                                    ],
                                    [
                                        0.8044692737430168,
                                        "#fe88fc"
                                    ],
                                    [
                                        0.8938547486033519,
                                        "#fea5fd"
                                    ],
                                    [
                                        0.9832402234636871,
                                        "#febefe"
                                    ],
                                    [
                                        1,
                                        "#fec3fe"
                                    ]
                                ],
                                "sequentialminus": [
                                    [
                                        0,
                                        "#0508b8"
                                    ],
                                    [
                                        0.0893854748603352,
                                        "#1910d8"
                                    ],
                                    [
                                        0.1787709497206704,
                                        "#3c19f0"
                                    ],
                                    [
                                        0.2681564245810056,
                                        "#6b1cfb"
                                    ],
                                    [
                                        0.3575418994413408,
                                        "#981cfd"
                                    ],
                                    [
                                        0.44692737430167595,
                                        "#bf1cfd"
                                    ],
                                    [
                                        0.5363128491620112,
                                        "#dd2bfd"
                                    ],
                                    [
                                        0.6256983240223464,
                                        "#f246fe"
                                    ],
                                    [
                                        0.7150837988826816,
                                        "#fc67fd"
                                    ],
                                    [
                                        0.8044692737430168,
                                        "#fe88fc"
                                    ],
                                    [
                                        0.8938547486033519,
                                        "#fea5fd"
                                    ],
                                    [
                                        0.9832402234636871,
                                        "#febefe"
                                    ],
                                    [
                                        1,
                                        "#fec3fe"
                                    ]
                                ]
                            },
                            "plot_bgcolor": "white",
                            "paper_bgcolor": "white",
                            "shapedefaults": {
                                "line": {
                                    "width": 0
                                },
                                "opacity": 0.4,
                                "fillcolor": "#506784"
                            },
                            "annotationdefaults": {
                                "arrowhead": 0,
                                "arrowcolor": "#506784",
                                "arrowwidth": 1
                            }
                        },
                        "themeRef": "PLOTLY_WHITE"
                    }
                }
            },
            "height": null,
            "width": null,
            "user": {
                "profile_url": "https://chart-studio.plotly.com/~civilmatrix",
                "avatar_url": "https://storage.googleapis.com/plotly-prod-profiles/85.jpg",
                "background_url": "https://storage.googleapis.com/plotly-prod-profiles/bg-14.jpg",
                "bio": "",
                "nickname": "",
                "website": "",
                "stream_tokens": null,
                "feature_set_id": null,
                "csrf_token": null,
                "date_joined": "2018-01-26 12:28:19",
                "mapbox_access_tokens": null,
                "has_password": null,
                "username": "civilmatrix",
                "email": null,
                "is_active": null,
                "readonly": null,
                "is_dash_creator": null,
                "dash_created_count": null,
                "is_chart_creator": null,
                "charts_created_count": null
            }
        },
        {
            "creation_time": "2024-04-16T13:12:05.690256Z",
            "comments": {
                "results": [],
                "count": 0
            },
            "parented": true,
            "embed_url": "https://chart-studio.plotly.com/~mwellerRWTH/13.embed",
            "fid": "mwellerRWTH:13",
            "filename": "xNodesMetadataStat",
            "filetype": "plot",
            "img_url": "https://storage.googleapis.com/plotly-prod-images/mwellerRWTH/13/9_FQJ7T8NLK2MPOQMSTD6PMA1IKLVJXT.png",
            "image_urls": {
                "default": "https://storage.googleapis.com/plotly-prod-images/mwellerRWTH/13/2_K0ZBF84LE0E7S5XWHZB8L1TSFWIAB1.png",
                "block-thumb": "https://storage.googleapis.com/plotly-prod-images/mwellerRWTH/13/8_F8LN5RVGZT1ZJU0T009Z1L4UUAZKOS.png",
                "list-thumb": "https://storage.googleapis.com/plotly-prod-images/mwellerRWTH/13/9_FQJ7T8NLK2MPOQMSTD6PMA1IKLVJXT.png"
            },
            "api_urls": {
                "files": "https://api.plotly.com/v2/files/mwellerRWTH:13",
                "plots": "https://api.plotly.com/v2/plots/mwellerRWTH:13",
                "parent": "https://api.plotly.com/v2/folders/home?user=mwellerRWTH"
            },
            "owner": "mwellerRWTH",
            "parent": -1,
            "preview": "",
            "referencers": [],
            "references": [],
            "title": "",
            "views": 1,
            "web_url": "https://chart-studio.plotly.com/~mwellerRWTH/13/",
            "world_readable": true,
            "date_modified": "2024-04-16T13:23:05.350Z",
            "stars": {
                "results": [],
                "count": 0
            },
            "collaborators": {
                "results": [],
                "count": 0
            },
            "subfolder_count": null,
            "refresh_interval": null,
            "organize_view_url": "https://chart-studio.plotly.com/~mwellerRWTH/13/",
            "current_user_permission": "read",
            "is_theme": null,
            "is_template": false,
            "autosize": true,
            "caption": "",
            "figure": {
                "data": [
                    {
                        "uid": "b673b4",
                        "meta": {
                            "columnNames": {
                                "x": "cores",
                                "y": "mdEasyStat"
                            }
                        },
                        "mode": "markers",
                        "name": "Easy Stat",
                        "type": "scatter",
                        "xsrc": "mwellerRWTH:12:ea13a3",
                        "ysrc": "mwellerRWTH:12:7b3fba",
                        "yaxis": "y",
                        "visible": true,
                        "stackgroup": null
                    },
                    {
                        "meta": {
                            "columnNames": {
                                "x": "cores",
                                "y": "mdHardStat"
                            }
                        },
                        "mode": "markers",
                        "name": "Hard Stat",
                        "type": "scatter",
                        "xsrc": "mwellerRWTH:12:ea13a3",
                        "ysrc": "mwellerRWTH:12:dbb76d",
                        "yaxis": "y",
                        "visible": true,
                        "stackgroup": null,
                        "transforms": [
                            {
                                "meta": {
                                    "columnNames": {
                                        "target": "mdHardStat"
                                    }
                                },
                                "type": "filter",
                                "value": [
                                    "8",
                                    ""
                                ],
                                "operation": ")(",
                                "targetsrc": "mwellerRWTH:12:dbb76d"
                            }
                        ]
                    }
                ],
                "frames": [],
                "layout": {
                    "title": {
                        "text": "1000 I/O Operations per second based on Number of Hosts in MDtest Stat"
                    },
                    "xaxis": {
                        "side": "bottom",
                        "type": "linear",
                        "range": [
                            -10.586397058823529,
                            203.58639705882354
                        ],
                        "title": {
                            "text": "Number of Hosts"
                        },
                        "autorange": true
                    },
                    "yaxis": {
                        "type": "linear",
                        "range": [
                            -0.449144422700587,
                            7.730599422700587
                        ],
                        "title": {
                            "text": "kIOPS"
                        },
                        "autorange": true
                    },
                    "legend": {
                        "x": 0.5736914443071666,
                        "y": 1.2234957020057307
                    },
                    "shapes": [],
                    "autosize": true,
                    "dragmode": "select",
                    "template": {
                        "data": {
                            "bar": [
                                {
                                    "type": "bar",
                                    "marker": {
                                        "colorbar": {
                                            "ticks": "",
                                            "outlinewidth": 0
                                        }
                                    }
                                }
                            ],
                            "table": [
                                {
                                    "type": "table",
                                    "cells": {
                                        "fill": {
                                            "color": "#EBF0F8"
                                        },
                                        "line": {
                                            "color": "white"
                                        }
                                    },
                                    "header": {
                                        "fill": {
                                            "color": "#C8D4E3"
                                        },
                                        "line": {
                                            "color": "white"
                                        }
                                    }
                                }
                            ],
                            "carpet": [
                                {
                                    "type": "carpet",
                                    "aaxis": {
                                        "gridcolor": "#C8D4E3",
                                        "linecolor": "#C8D4E3",
                                        "endlinecolor": "#2a3f5f",
                                        "minorgridcolor": "#C8D4E3",
                                        "startlinecolor": "#2a3f5f"
                                    },
                                    "baxis": {
                                        "gridcolor": "#C8D4E3",
                                        "linecolor": "#C8D4E3",
                                        "endlinecolor": "#2a3f5f",
                                        "minorgridcolor": "#C8D4E3",
                                        "startlinecolor": "#2a3f5f"
                                    }
                                }
                            ],
                            "mesh3d": [
                                {
                                    "type": "mesh3d",
                                    "colorbar": {
                                        "ticks": "",
                                        "outlinewidth": 0
                                    }
                                }
                            ],
                            "contour": [
                                {
                                    "type": "contour",
                                    "colorbar": {
                                        "ticks": "",
                                        "outlinewidth": 0
                                    },
                                    "autocolorscale": true
                                }
                            ],
                            "heatmap": [
                                {
                                    "type": "heatmap",
                                    "colorbar": {
                                        "ticks": "",
                                        "outlinewidth": 0
                                    },
                                    "autocolorscale": true
                                }
                            ],
                            "scatter": [
                                {
                                    "type": "scatter",
                                    "marker": {
                                        "colorbar": {
                                            "ticks": "",
                                            "outlinewidth": 0
                                        }
                                    }
                                }
                            ],
                            "surface": [
                                {
                                    "type": "surface",
                                    "colorbar": {
                                        "ticks": "",
                                        "outlinewidth": 0
                                    }
                                }
                            ],
                            "heatmapgl": [
                                {
                                    "type": "heatmapgl",
                                    "colorbar": {
                                        "ticks": "",
                                        "outlinewidth": 0
                                    }
                                }
                            ],
                            "histogram": [
                                {
                                    "type": "histogram",
                                    "marker": {
                                        "colorbar": {
                                            "ticks": "",
                                            "outlinewidth": 0
                                        }
                                    }
                                }
                            ],
                            "parcoords": [
                                {
                                    "line": {
                                        "colorbar": {
                                            "ticks": "",
                                            "outlinewidth": 0
                                        }
                                    },
                                    "type": "parcoords"
                                }
                            ],
                            "scatter3d": [
                                {
                                    "type": "scatter3d",
                                    "marker": {
                                        "colorbar": {
                                            "ticks": "",
                                            "outlinewidth": 0
                                        }
                                    }
                                }
                            ],
                            "scattergl": [
                                {
                                    "type": "scattergl",
                                    "marker": {
                                        "colorbar": {
                                            "ticks": "",
                                            "outlinewidth": 0
                                        }
                                    }
                                }
                            ],
                            "choropleth": [
                                {
                                    "type": "choropleth",
                                    "colorbar": {
                                        "ticks": "",
                                        "outlinewidth": 0
                                    }
                                }
                            ],
                            "scattergeo": [
                                {
                                    "type": "scattergeo",
                                    "marker": {
                                        "colorbar": {
                                            "ticks": "",
                                            "outlinewidth": 0
                                        }
                                    }
                                }
                            ],
                            "histogram2d": [
                                {
                                    "type": "histogram2d",
                                    "colorbar": {
                                        "ticks": "",
                                        "outlinewidth": 0
                                    },
                                    "autocolorscale": true
                                }
                            ],
                            "scatterpolar": [
                                {
                                    "type": "scatterpolar",
                                    "marker": {
                                        "colorbar": {
                                            "ticks": "",
                                            "outlinewidth": 0
                                        }
                                    }
                                }
                            ],
                            "contourcarpet": [
                                {
                                    "type": "contourcarpet",
                                    "colorbar": {
                                        "ticks": "",
                                        "outlinewidth": 0
                                    }
                                }
                            ],
                            "scattercarpet": [
                                {
                                    "type": "scattercarpet",
                                    "marker": {
                                        "colorbar": {
                                            "ticks": "",
                                            "outlinewidth": 0
                                        }
                                    }
                                }
                            ],
                            "scattermapbox": [
                                {
                                    "type": "scattermapbox",
                                    "marker": {
                                        "colorbar": {
                                            "ticks": "",
                                            "outlinewidth": 0
                                        }
                                    }
                                }
                            ],
                            "scatterpolargl": [
                                {
                                    "type": "scatterpolargl",
                                    "marker": {
                                        "colorbar": {
                                            "ticks": "",
                                            "outlinewidth": 0
                                        }
                                    }
                                }
                            ],
                            "scatterternary": [
                                {
                                    "type": "scatterternary",
                                    "marker": {
                                        "colorbar": {
                                            "ticks": "",
                                            "outlinewidth": 0
                                        }
                                    }
                                }
                            ],
                            "histogram2dcontour": [
                                {
                                    "type": "histogram2dcontour",
                                    "colorbar": {
                                        "ticks": "",
                                        "outlinewidth": 0
                                    },
                                    "autocolorscale": true
                                }
                            ]
                        },
                        "layout": {
                            "geo": {
                                "bgcolor": "white",
                                "showland": true,
                                "lakecolor": "white",
                                "landcolor": "white",
                                "showlakes": true,
                                "subunitcolor": "#C8D4E3"
                            },
                            "font": {
                                "color": "#2a3f5f"
                            },
                            "polar": {
                                "bgcolor": "white",
                                "radialaxis": {
                                    "ticks": "",
                                    "gridcolor": "#EBF0F8",
                                    "linecolor": "#EBF0F8"
                                },
                                "angularaxis": {
                                    "ticks": "",
                                    "gridcolor": "#EBF0F8",
                                    "linecolor": "#EBF0F8"
                                }
                            },
                            "scene": {
                                "xaxis": {
                                    "ticks": "",
                                    "gridcolor": "#DFE8F3",
                                    "gridwidth": 2,
                                    "linecolor": "#EBF0F8",
                                    "zerolinecolor": "#EBF0F8",
                                    "showbackground": true,
                                    "backgroundcolor": "white"
                                },
                                "yaxis": {
                                    "ticks": "",
                                    "gridcolor": "#DFE8F3",
                                    "gridwidth": 2,
                                    "linecolor": "#EBF0F8",
                                    "zerolinecolor": "#EBF0F8",
                                    "showbackground": true,
                                    "backgroundcolor": "white"
                                },
                                "zaxis": {
                                    "ticks": "",
                                    "gridcolor": "#DFE8F3",
                                    "gridwidth": 2,
                                    "linecolor": "#EBF0F8",
                                    "zerolinecolor": "#EBF0F8",
                                    "showbackground": true,
                                    "backgroundcolor": "white"
                                }
                            },
                            "title": {
                                "x": 0.05
                            },
                            "xaxis": {
                                "ticks": "",
                                "gridcolor": "#EBF0F8",
                                "linecolor": "#EBF0F8",
                                "automargin": true,
                                "zerolinecolor": "#EBF0F8",
                                "zerolinewidth": 2
                            },
                            "yaxis": {
                                "ticks": "",
                                "gridcolor": "#EBF0F8",
                                "linecolor": "#EBF0F8",
                                "automargin": true,
                                "zerolinecolor": "#EBF0F8",
                                "zerolinewidth": 2
                            },
                            "ternary": {
                                "aaxis": {
                                    "ticks": "",
                                    "gridcolor": "#DFE8F3",
                                    "linecolor": "#A2B1C6"
                                },
                                "baxis": {
                                    "ticks": "",
                                    "gridcolor": "#DFE8F3",
                                    "linecolor": "#A2B1C6"
                                },
                                "caxis": {
                                    "ticks": "",
                                    "gridcolor": "#DFE8F3",
                                    "linecolor": "#A2B1C6"
                                },
                                "bgcolor": "white"
                            },
                            "colorway": [
                                "#636efa",
                                "#EF553B",
                                "#00cc96",
                                "#ab63fa",
                                "#19d3f3",
                                "#e763fa",
                                "#fecb52",
                                "#ffa15a",
                                "#ff6692",
                                "#b6e880"
                            ],
                            "hovermode": "closest",
                            "colorscale": {
                                "diverging": [
                                    [
                                        0,
                                        "#8e0152"
                                    ],
                                    [
                                        0.1,
                                        "#c51b7d"
                                    ],
                                    [
                                        0.2,
                                        "#de77ae"
                                    ],
                                    [
                                        0.3,
                                        "#f1b6da"
                                    ],
                                    [
                                        0.4,
                                        "#fde0ef"
                                    ],
                                    [
                                        0.5,
                                        "#f7f7f7"
                                    ],
                                    [
                                        0.6,
                                        "#e6f5d0"
                                    ],
                                    [
                                        0.7,
                                        "#b8e186"
                                    ],
                                    [
                                        0.8,
                                        "#7fbc41"
                                    ],
                                    [
                                        0.9,
                                        "#4d9221"
                                    ],
                                    [
                                        1,
                                        "#276419"
                                    ]
                                ],
                                "sequential": [
                                    [
                                        0,
                                        "#0508b8"
                                    ],
                                    [
                                        0.0893854748603352,
                                        "#1910d8"
                                    ],
                                    [
                                        0.1787709497206704,
                                        "#3c19f0"
                                    ],
                                    [
                                        0.2681564245810056,
                                        "#6b1cfb"
                                    ],
                                    [
                                        0.3575418994413408,
                                        "#981cfd"
                                    ],
                                    [
                                        0.44692737430167595,
                                        "#bf1cfd"
                                    ],
                                    [
                                        0.5363128491620112,
                                        "#dd2bfd"
                                    ],
                                    [
                                        0.6256983240223464,
                                        "#f246fe"
                                    ],
                                    [
                                        0.7150837988826816,
                                        "#fc67fd"
                                    ],
                                    [
                                        0.8044692737430168,
                                        "#fe88fc"
                                    ],
                                    [
                                        0.8938547486033519,
                                        "#fea5fd"
                                    ],
                                    [
                                        0.9832402234636871,
                                        "#febefe"
                                    ],
                                    [
                                        1,
                                        "#fec3fe"
                                    ]
                                ],
                                "sequentialminus": [
                                    [
                                        0,
                                        "#0508b8"
                                    ],
                                    [
                                        0.0893854748603352,
                                        "#1910d8"
                                    ],
                                    [
                                        0.1787709497206704,
                                        "#3c19f0"
                                    ],
                                    [
                                        0.2681564245810056,
                                        "#6b1cfb"
                                    ],
                                    [
                                        0.3575418994413408,
                                        "#981cfd"
                                    ],
                                    [
                                        0.44692737430167595,
                                        "#bf1cfd"
                                    ],
                                    [
                                        0.5363128491620112,
                                        "#dd2bfd"
                                    ],
                                    [
                                        0.6256983240223464,
                                        "#f246fe"
                                    ],
                                    [
                                        0.7150837988826816,
                                        "#fc67fd"
                                    ],
                                    [
                                        0.8044692737430168,
                                        "#fe88fc"
                                    ],
                                    [
                                        0.8938547486033519,
                                        "#fea5fd"
                                    ],
                                    [
                                        0.9832402234636871,
                                        "#febefe"
                                    ],
                                    [
                                        1,
                                        "#fec3fe"
                                    ]
                                ]
                            },
                            "plot_bgcolor": "white",
                            "paper_bgcolor": "white",
                            "shapedefaults": {
                                "line": {
                                    "width": 0
                                },
                                "opacity": 0.4,
                                "fillcolor": "#506784"
                            },
                            "annotationdefaults": {
                                "arrowhead": 0,
                                "arrowcolor": "#506784",
                                "arrowwidth": 1
                            }
                        },
                        "themeRef": "PLOTLY_WHITE"
                    },
                    "annotations": []
                }
            },
            "height": null,
            "width": null,
            "user": {
                "profile_url": "https://chart-studio.plotly.com/~mwellerRWTH",
                "avatar_url": "https://storage.googleapis.com/plotly-prod-profiles/80.jpg",
                "background_url": "https://storage.googleapis.com/plotly-prod-profiles/bg-0.jpg",
                "bio": "",
                "nickname": "",
                "website": "",
                "stream_tokens": null,
                "feature_set_id": null,
                "csrf_token": null,
                "date_joined": "2024-04-15 13:43:46",
                "mapbox_access_tokens": null,
                "has_password": null,
                "username": "mwellerRWTH",
                "email": null,
                "is_active": null,
                "readonly": null,
                "is_dash_creator": null,
                "dash_created_count": null,
                "is_chart_creator": null,
                "charts_created_count": null
            }
        }
    ]
}
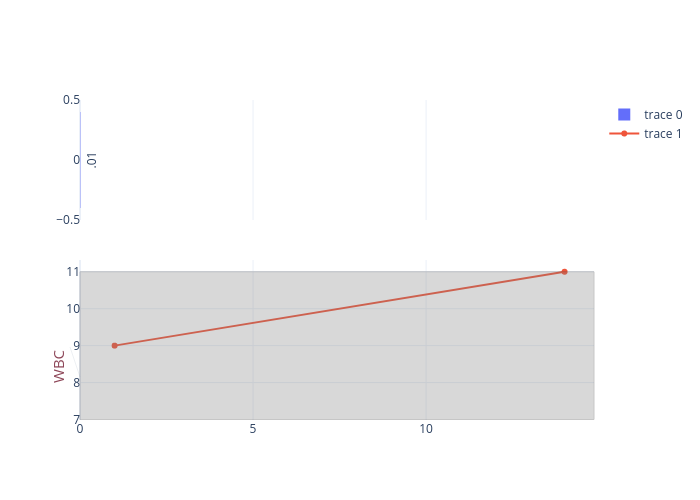
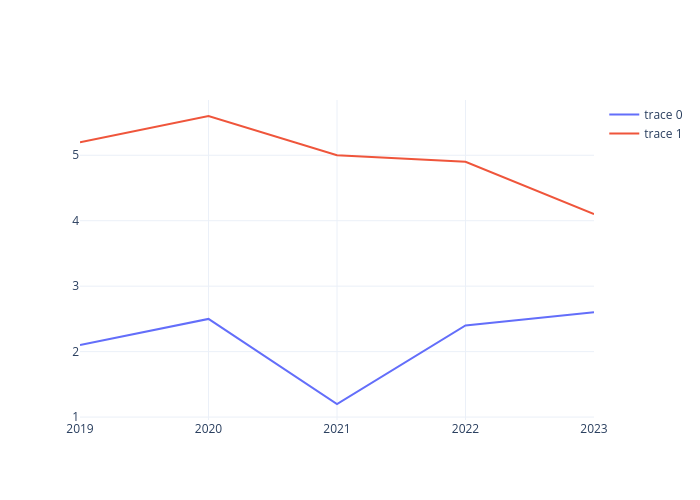
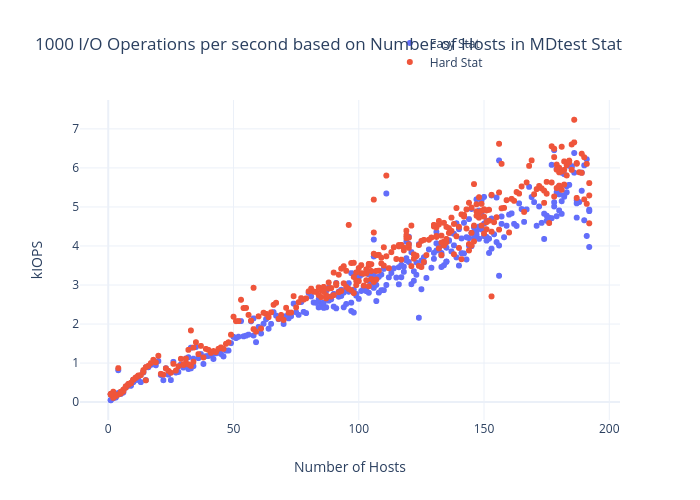