Plots List
Plots
This endpoint handles manipulation of Plotly plot files.
Reference
Authorization
Any user with or without a Plotly account may view public plots. For private plots, see authentication.
Actions
list
Listing all public plots can be done via a GET request to this endpoint.
By default, plots will be listed in order of date created. The order_by
query parameter is accepted at this endpoint. Currently, only ordering by
views is supported. It is possible to filter the plots by quality
with min_quality or max_quality as query parameter.
Example:
// GET https://api.plotly.com/v2/plots/ ---> 200

// GET https://api.plotly.com/v2/plots/?order_by=-views ---> 200

// GET https://api.plotly.com/v2/plots/?min_quality=5 ---> 200

// GET https://api.plotly.com/v2/plots/?max_quality=5 ---> 200
feed
Listing all handpicked feed plots can be done via a GET request to this endpoint. By default, plots will be listed in a random order.
Example:
// GET https://api.plotly.com/v2/plots/feed ---> 200
create
You can create new plot resources here. The only required field is 'figure'. Currently, the figure is restricted to only contain references to grid data. That is, this will fail if raw data arrays are passed in. To create and manipulate underlying grids for plots, see the grids endpoint.
Example:
// This fails because a figure field is required.
// POST https://api.plotly.com/v2/plots ---> 400 Bad Request
{}

// This fails because the figure has raw data
//POST https://api.plotly.com/v2/plots ---> 400 Bad Request
{
    "figure": {"data": [{"y": ['this', 'is', 'raw', 'data']}]}
}

// This succeeds because the figure has src keys, not raw data.
//POST https://api.plotly.com/v2/plots ---> 200 OK
{
    "figure": {"data": [{"ysrc": "sven:88:u8nd62"}]}
}
When creating a grid, you can optionally specify a source_fid to specify where a plot has come from:
- source_fid: the fid of a plot that was copied (and presumably edited) to produce this one
detail
There is a lot of meta information stored about plot files including filename, title, share_url, and content_url to name a few.
This information can only be reached with a GET to this endpoint.
Example:
// GET https://api.plotly.com/v2/plots/iheartgraphs:90
content
The contents of a plot can be downloaded via the content resource. The plot
content contains referenced grid/column data by default. If you wish to
return the raw grid/column data, the inline_data=true query must be included
in the request url. The Content-Type header will be appropriately set for the
response body.
Alternatively, you can set ?map_data=unreadable to append a mapping of
sources to data that belongs to grids which are unreadable for the
requestor. This is useful when you have read access to another users plot,
but that plot contains grid references which you don't have access to.
Examples:
// Returns referenced grid/column data
// GET https://api.plotly.com/v2/plots/iheartgraphs:90/content ---> 200 OK

// Returns full grid/column data
// GET https://api.plotly.com/v2/plots/iheartgraphs:90/content?inline_data=true ---> 200 OK

// Returns full grid/column data when requestor doesn't have permission
// to read the referenced grid.
// GET https://api.plotly.com/v2/plots/iheartgraphs:90/content?map_data=unreadable ---> 200 OK
GET /v2/plots?cursor=cD0yMDI0LTA0LTIxKzE5JTNBMzElM0E0Mi42NjgwNDklMkIwMCUzQTAw&format=api
{ "next": "https://api.plotly.com/v2/plots?cursor=cD0yMDI0LTA0LTIxKzE3JTNBMTMlM0EzMC44NDE4NjMlMkIwMCUzQTAw&format=api", "previous": "https://api.plotly.com/v2/plots?cursor=cj0xJnA9MjAyNC0wNC0yMSsxOCUzQTU4JTNBMzEuNjk2ODQ4JTJCMDAlM0EwMA%3D%3D&format=api", "results": [ { "creation_time": "2024-04-21T18:58:31.696848Z", "comments": { "results": [], "count": 0 }, "parented": true, "embed_url": "https://chart-studio.plotly.com/~Tb1504/1.embed", "fid": "Tb1504:1", "filename": "Plot 1", "filetype": "plot", "img_url": "https://storage.googleapis.com/plotly-prod-images/Tb1504/1/9_XHBQ2HBMP4Q6R4BQLOKSY28DG1V6UO.png", "image_urls": { "default": "https://storage.googleapis.com/plotly-prod-images/Tb1504/1/2_QK8HVJAUCTKZJQPWLVC89AWT3C7M0T.png", "block-thumb": "https://storage.googleapis.com/plotly-prod-images/Tb1504/1/8_COE4N8DCJNQGIT1JJIJJM794ZKMFSL.png", "list-thumb": "https://storage.googleapis.com/plotly-prod-images/Tb1504/1/9_XHBQ2HBMP4Q6R4BQLOKSY28DG1V6UO.png" }, "api_urls": { "files": "https://api.plotly.com/v2/files/Tb1504:1", "plots": "https://api.plotly.com/v2/plots/Tb1504:1", "parent": "https://api.plotly.com/v2/folders/home?user=Tb1504" }, "owner": "Tb1504", "parent": -1, "preview": "", "referencers": [], "references": [], "title": "", "views": 1, "web_url": "https://chart-studio.plotly.com/~Tb1504/1/", "world_readable": true, "date_modified": "2024-04-21T18:58:31.707Z", "stars": { "results": [], "count": 0 }, "collaborators": { "results": [], "count": 0 }, "subfolder_count": null, "refresh_interval": null, "organize_view_url": "https://chart-studio.plotly.com/~Tb1504/1/", "current_user_permission": "read", "is_theme": null, "is_template": false, "autosize": true, "caption": "", "figure": { "data": [ { "meta": { "columnNames": { "x": "A", "y": "B" } }, "mode": "markers", "type": "scatter", "xsrc": "Tb1504:0:f30778", "ysrc": "Tb1504:0:3d90cb" } ], "frames": [], "layout": { "title": { "text": " HCI and NaOH (strong acid v weak acid base) " }, "xaxis": { "type": "linear", "range": [ -2.2320293398533004, 38.032029339853295 ], "title": { "text": "Volume of NaOH (cm3) " }, "autorange": true }, "yaxis": { "type": "linear", "range": [ 0.37154664484451705, 12.758453355155483 ], "title": { "text": "pH" }, "autorange": true }, "autosize": true, "template": { "data": { "bar": [ { "type": "bar", "marker": { "colorbar": { "ticks": "", "outlinewidth": 0 } } } ], "table": [ { "type": "table", "cells": { "fill": { "color": "#EBF0F8" }, "line": { "color": "white" } }, "header": { "fill": { "color": "#C8D4E3" }, "line": { "color": "white" } } } ], "carpet": [ { "type": "carpet", "aaxis": { "gridcolor": "#C8D4E3", "linecolor": "#C8D4E3", "endlinecolor": "#2a3f5f", "minorgridcolor": "#C8D4E3", "startlinecolor": "#2a3f5f" }, "baxis": { "gridcolor": "#C8D4E3", "linecolor": "#C8D4E3", "endlinecolor": "#2a3f5f", "minorgridcolor": "#C8D4E3", "startlinecolor": "#2a3f5f" } } ], "mesh3d": [ { "type": "mesh3d", "colorbar": { "ticks": "", "outlinewidth": 0 } } ], "contour": [ { "type": "contour", "colorbar": { "ticks": "", "outlinewidth": 0 }, "autocolorscale": true } ], "heatmap": [ { "type": "heatmap", "colorbar": { "ticks": "", "outlinewidth": 0 }, "autocolorscale": true } ], "scatter": [ { "type": "scatter", "marker": { "colorbar": { "ticks": "", "outlinewidth": 0 } } } ], "surface": [ { "type": "surface", "colorbar": { "ticks": "", "outlinewidth": 0 } } ], "heatmapgl": [ { "type": "heatmapgl", "colorbar": { "ticks": "", "outlinewidth": 0 } } ], "histogram": [ { "type": "histogram", "marker": { "colorbar": { "ticks": "", "outlinewidth": 0 } } } ], "parcoords": [ { "line": { "colorbar": { "ticks": "", "outlinewidth": 0 } }, "type": "parcoords" } ], "scatter3d": [ { "type": "scatter3d", "marker": { "colorbar": { "ticks": "", "outlinewidth": 0 } } } ], "scattergl": [ { "type": "scattergl", "marker": { "colorbar": { "ticks": "", "outlinewidth": 0 } } } ], "choropleth": [ { "type": "choropleth", "colorbar": { "ticks": "", "outlinewidth": 0 } } ], "scattergeo": [ { "type": "scattergeo", "marker": { "colorbar": { "ticks": "", "outlinewidth": 0 } } } ], "histogram2d": [ { "type": "histogram2d", "colorbar": { "ticks": "", "outlinewidth": 0 }, "autocolorscale": true } ], "scatterpolar": [ { "type": "scatterpolar", "marker": { "colorbar": { "ticks": "", "outlinewidth": 0 } } } ], "contourcarpet": [ { "type": "contourcarpet", "colorbar": { "ticks": "", "outlinewidth": 0 } } ], "scattercarpet": [ { "type": "scattercarpet", "marker": { "colorbar": { "ticks": "", "outlinewidth": 0 } } } ], "scattermapbox": [ { "type": "scattermapbox", "marker": { "colorbar": { "ticks": "", "outlinewidth": 0 } } } ], "scatterpolargl": [ { "type": "scatterpolargl", "marker": { "colorbar": { "ticks": "", "outlinewidth": 0 } } } ], "scatterternary": [ { "type": "scatterternary", "marker": { "colorbar": { "ticks": "", "outlinewidth": 0 } } } ], "histogram2dcontour": [ { "type": "histogram2dcontour", "colorbar": { "ticks": "", "outlinewidth": 0 }, "autocolorscale": true } ] }, "layout": { "geo": { "bgcolor": "white", "showland": true, "lakecolor": "white", "landcolor": "white", "showlakes": true, "subunitcolor": "#C8D4E3" }, "font": { "color": "#2a3f5f" }, "polar": { "bgcolor": "white", "radialaxis": { "ticks": "", "gridcolor": "#EBF0F8", "linecolor": "#EBF0F8" }, "angularaxis": { "ticks": "", "gridcolor": "#EBF0F8", "linecolor": "#EBF0F8" } }, "scene": { "xaxis": { "ticks": "", "gridcolor": "#DFE8F3", "gridwidth": 2, "linecolor": "#EBF0F8", "zerolinecolor": "#EBF0F8", "showbackground": true, "backgroundcolor": "white" }, "yaxis": { "ticks": "", "gridcolor": "#DFE8F3", "gridwidth": 2, "linecolor": "#EBF0F8", "zerolinecolor": "#EBF0F8", "showbackground": true, "backgroundcolor": "white" }, "zaxis": { "ticks": "", "gridcolor": "#DFE8F3", "gridwidth": 2, "linecolor": "#EBF0F8", "zerolinecolor": "#EBF0F8", "showbackground": true, "backgroundcolor": "white" } }, "title": { "x": 0.05 }, "xaxis": { "ticks": "", "gridcolor": "#EBF0F8", "linecolor": "#EBF0F8", "automargin": true, "zerolinecolor": "#EBF0F8", "zerolinewidth": 2 }, "yaxis": { "ticks": "", "gridcolor": "#EBF0F8", "linecolor": "#EBF0F8", "automargin": true, "zerolinecolor": "#EBF0F8", "zerolinewidth": 2 }, "ternary": { "aaxis": { "ticks": "", "gridcolor": "#DFE8F3", "linecolor": "#A2B1C6" }, "baxis": { "ticks": "", "gridcolor": "#DFE8F3", "linecolor": "#A2B1C6" }, "caxis": { "ticks": "", "gridcolor": "#DFE8F3", "linecolor": "#A2B1C6" }, "bgcolor": "white" }, "colorway": [ "#636efa", "#EF553B", "#00cc96", "#ab63fa", "#19d3f3", "#e763fa", "#fecb52", "#ffa15a", "#ff6692", "#b6e880" ], "hovermode": "closest", "colorscale": { "diverging": [ [ 0, "#8e0152" ], [ 0.1, "#c51b7d" ], [ 0.2, "#de77ae" ], [ 0.3, "#f1b6da" ], [ 0.4, "#fde0ef" ], [ 0.5, "#f7f7f7" ], [ 0.6, "#e6f5d0" ], [ 0.7, "#b8e186" ], [ 0.8, "#7fbc41" ], [ 0.9, "#4d9221" ], [ 1, "#276419" ] ], "sequential": [ [ 0, "#0508b8" ], [ 0.0893854748603352, "#1910d8" ], [ 0.1787709497206704, "#3c19f0" ], [ 0.2681564245810056, "#6b1cfb" ], [ 0.3575418994413408, "#981cfd" ], [ 0.44692737430167595, "#bf1cfd" ], [ 0.5363128491620112, "#dd2bfd" ], [ 0.6256983240223464, "#f246fe" ], [ 0.7150837988826816, "#fc67fd" ], [ 0.8044692737430168, "#fe88fc" ], [ 0.8938547486033519, "#fea5fd" ], [ 0.9832402234636871, "#febefe" ], [ 1, "#fec3fe" ] ], "sequentialminus": [ [ 0, "#0508b8" ], [ 0.0893854748603352, "#1910d8" ], [ 0.1787709497206704, "#3c19f0" ], [ 0.2681564245810056, "#6b1cfb" ], [ 0.3575418994413408, "#981cfd" ], [ 0.44692737430167595, "#bf1cfd" ], [ 0.5363128491620112, "#dd2bfd" ], [ 0.6256983240223464, "#f246fe" ], [ 0.7150837988826816, "#fc67fd" ], [ 0.8044692737430168, "#fe88fc" ], [ 0.8938547486033519, "#fea5fd" ], [ 0.9832402234636871, "#febefe" ], [ 1, "#fec3fe" ] ] }, "plot_bgcolor": "white", "paper_bgcolor": "white", "shapedefaults": { "line": { "width": 0 }, "opacity": 0.4, "fillcolor": "#506784" }, "annotationdefaults": { "arrowhead": 0, "arrowcolor": "#506784", "arrowwidth": 1 } }, "themeRef": "PLOTLY_WHITE" } } }, "height": null, "width": null, "user": { "profile_url": "https://chart-studio.plotly.com/~Tb1504", "avatar_url": "https://storage.googleapis.com/plotly-prod-profiles/50.jpg", "background_url": "https://storage.googleapis.com/plotly-prod-profiles/bg-13.jpg", "bio": "", "nickname": "", "website": "", "stream_tokens": null, "feature_set_id": null, "csrf_token": null, "date_joined": "2024-04-21 18:57:40", "mapbox_access_tokens": null, "has_password": null, "username": "Tb1504", "email": null, "is_active": null, "readonly": null, "is_dash_creator": null, "dash_created_count": null, "is_chart_creator": null, "charts_created_count": null } }, { "creation_time": "2024-04-21T18:13:21.791269Z", "comments": { "results": [], "count": 0 }, "parented": true, "embed_url": "https://chart-studio.plotly.com/~Kristiana.keisa/3.embed", "fid": "Kristiana.keisa:3", "filename": "Satelītu novietojums 2", "filetype": "plot", "img_url": "https://storage.googleapis.com/plotly-prod-images/Kristiana.keisa/3/9_IPS7LB3ZZ5DWYE9E6AMTSGM37RXBI1.png", "image_urls": { "default": "https://storage.googleapis.com/plotly-prod-images/Kristiana.keisa/3/2_HLK0YX8ICQXXP76JOPVJ13C1BLYZ5O.png", "block-thumb": "https://storage.googleapis.com/plotly-prod-images/Kristiana.keisa/3/8_FMRWVVJ5FGC7GF5IKIWLO16Z92ON5N.png", "list-thumb": "https://storage.googleapis.com/plotly-prod-images/Kristiana.keisa/3/9_IPS7LB3ZZ5DWYE9E6AMTSGM37RXBI1.png" }, "api_urls": { "files": "https://api.plotly.com/v2/files/Kristiana.keisa:3", "plots": "https://api.plotly.com/v2/plots/Kristiana.keisa:3", "parent": "https://api.plotly.com/v2/folders/home?user=Kristiana.keisa" }, "owner": "Kristiana.keisa", "parent": -1, "preview": "", "referencers": [], "references": [], "title": "", "views": 1, "web_url": "https://chart-studio.plotly.com/~Kristiana.keisa/3/", "world_readable": true, "date_modified": "2024-04-21T18:13:21.803Z", "stars": { "results": [], "count": 0 }, "collaborators": { "results": [], "count": 0 }, "subfolder_count": null, "refresh_interval": null, "organize_view_url": "https://chart-studio.plotly.com/~Kristiana.keisa/3/", "current_user_permission": "read", "is_theme": null, "is_template": false, "autosize": true, "caption": "", "figure": { "data": [ { "meta": { "columnNames": { "r": "B", "text": "A", "theta": "C", "marker": { "color": "E" } } }, "mode": "markers+text", "rsrc": "Kristiana.keisa:2:dee7a8", "type": "scatterpolar", "marker": { "meta": { "columnNames": { "color": "E" } }, "size": 10, "symbol": "y-down-open", "colorsrc": "Kristiana.keisa:2:336c91" }, "textsrc": "Kristiana.keisa:2:e8b731", "thetasrc": "Kristiana.keisa:2:d152f5", "textposition": "top right" } ], "frames": [], "layout": { "polar": { "radialaxis": { "type": "linear", "range": [ 90, 0 ], "autorange": false }, "angularaxis": { "type": "linear", "range": [ 90, 0 ], "autorange": false, "direction": "clockwise" } }, "title": { "text": "Satelītu novietojums virs LU DAC. K.Keiša" }, "xaxis": { "range": [ -1, 6 ], "autorange": true }, "yaxis": { "range": [ -1, 4 ], "autorange": true }, "autosize": true, "template": { "data": { "bar": [ { "type": "bar", "marker": { "colorbar": { "ticks": "outside", "ticklen": 8, "tickcolor": "rgb(36,36,36)", "tickwidth": 2, "outlinewidth": 0 } } } ], "table": [ { "type": "table", "cells": { "fill": { "color": "rgb(231,231,240)" }, "line": { "color": "white" } }, "header": { "fill": { "color": "rgb(183,183,191)" }, "line": { "color": "white" } } } ], "carpet": [ { "type": "carpet", "aaxis": { "gridcolor": "white", "linecolor": "white", "endlinecolor": "rgb(36,36,36)", "minorgridcolor": "white", "startlinecolor": "rgb(36,36,36)" }, "baxis": { "gridcolor": "white", "linecolor": "white", "endlinecolor": "rgb(36,36,36)", "minorgridcolor": "white", "startlinecolor": "rgb(36,36,36)" } } ], "mesh3d": [ { "type": "mesh3d", "colorbar": { "ticks": "outside", "ticklen": 8, "tickcolor": "rgb(36,36,36)", "tickwidth": 2, "outlinewidth": 0 } } ], "contour": [ { "type": "contour", "colorbar": { "ticks": "outside", "ticklen": 8, "tickcolor": "rgb(36,36,36)", "tickwidth": 2, "outlinewidth": 0 }, "autocolorscale": true } ], "heatmap": [ { "type": "heatmap", "colorbar": { "ticks": "outside", "ticklen": 8, "tickcolor": "rgb(36,36,36)", "tickwidth": 2, "outlinewidth": 0 }, "autocolorscale": true } ], "scatter": [ { "type": "scatter", "marker": { "colorbar": { "ticks": "outside", "ticklen": 8, "tickcolor": "rgb(36,36,36)", "tickwidth": 2, "outlinewidth": 0 } } } ], "surface": [ { "type": "surface", "colorbar": { "ticks": "outside", "ticklen": 8, "tickcolor": "rgb(36,36,36)", "tickwidth": 2, "outlinewidth": 0 } } ], "heatmapgl": [ { "type": "heatmapgl", "colorbar": { "ticks": "outside", "ticklen": 8, "tickcolor": "rgb(36,36,36)", "tickwidth": 2, "outlinewidth": 0 } } ], "histogram": [ { "type": "histogram", "marker": { "colorbar": { "ticks": "outside", "ticklen": 8, "tickcolor": "rgb(36,36,36)", "tickwidth": 2, "outlinewidth": 0 } } } ], "parcoords": [ { "line": { "colorbar": { "ticks": "outside", "ticklen": 8, "tickcolor": "rgb(36,36,36)", "tickwidth": 2, "outlinewidth": 0 } }, "type": "parcoords" } ], "scatter3d": [ { "type": "scatter3d", "marker": { "colorbar": { "ticks": "outside", "ticklen": 8, "tickcolor": "rgb(36,36,36)", "tickwidth": 2, "outlinewidth": 0 } } } ], "scattergl": [ { "type": "scattergl", "marker": { "colorbar": { "ticks": "outside", "ticklen": 8, "tickcolor": "rgb(36,36,36)", "tickwidth": 2, "outlinewidth": 0 } } } ], "choropleth": [ { "type": "choropleth", "colorbar": { "ticks": "outside", "ticklen": 8, "tickcolor": "rgb(36,36,36)", "tickwidth": 2, "outlinewidth": 0 } } ], "scattergeo": [ { "type": "scattergeo", "marker": { "colorbar": { "ticks": "outside", "ticklen": 8, "tickcolor": "rgb(36,36,36)", "tickwidth": 2, "outlinewidth": 0 } } } ], "histogram2d": [ { "type": "histogram2d", "colorbar": { "ticks": "outside", "ticklen": 8, "tickcolor": "rgb(36,36,36)", "tickwidth": 2, "outlinewidth": 0 }, "autocolorscale": true } ], "scatterpolar": [ { "type": "scatterpolar", "marker": { "colorbar": { "ticks": "outside", "ticklen": 8, "tickcolor": "rgb(36,36,36)", "tickwidth": 2, "outlinewidth": 0 } } } ], "contourcarpet": [ { "type": "contourcarpet", "colorbar": { "ticks": "outside", "ticklen": 8, "tickcolor": "rgb(36,36,36)", "tickwidth": 2, "outlinewidth": 0 } } ], "scattercarpet": [ { "type": "scattercarpet", "marker": { "colorbar": { "ticks": "outside", "ticklen": 8, "tickcolor": "rgb(36,36,36)", "tickwidth": 2, "outlinewidth": 0 } } } ], "scattermapbox": [ { "type": "scattermapbox", "marker": { "colorbar": { "ticks": "outside", "ticklen": 8, "tickcolor": "rgb(36,36,36)", "tickwidth": 2, "outlinewidth": 0 } } } ], "scatterpolargl": [ { "type": "scatterpolargl", "marker": { "colorbar": { "ticks": "outside", "ticklen": 8, "tickcolor": "rgb(36,36,36)", "tickwidth": 2, "outlinewidth": 0 } } } ], "scatterternary": [ { "type": "scatterternary", "marker": { "colorbar": { "ticks": "outside", "ticklen": 8, "tickcolor": "rgb(36,36,36)", "tickwidth": 2, "outlinewidth": 0 } } } ], "histogram2dcontour": [ { "type": "histogram2dcontour", "colorbar": { "ticks": "outside", "ticklen": 8, "tickcolor": "rgb(36,36,36)", "tickwidth": 2, "outlinewidth": 0 }, "autocolorscale": true } ] }, "layout": { "geo": { "bgcolor": "white", "showland": true, "lakecolor": "white", "landcolor": "rgb(234,234,242)", "showlakes": true, "subunitcolor": "white" }, "font": { "color": "rgb(36,36,36)" }, "polar": { "bgcolor": "rgb(234,234,242)", "radialaxis": { "ticks": "", "showgrid": true, "gridcolor": "white", "linecolor": "white" }, "angularaxis": { "ticks": "", "showgrid": true, "gridcolor": "white", "linecolor": "white" } }, "scene": { "xaxis": { "ticks": "", "showgrid": true, "gridcolor": "white", "gridwidth": 2, "linecolor": "white", "zerolinecolor": "white", "showbackground": true, "backgroundcolor": "rgb(234,234,242)" }, "yaxis": { "ticks": "", "showgrid": true, "gridcolor": "white", "gridwidth": 2, "linecolor": "white", "zerolinecolor": "white", "showbackground": true, "backgroundcolor": "rgb(234,234,242)" }, "zaxis": { "ticks": "", "showgrid": true, "gridcolor": "white", "gridwidth": 2, "linecolor": "white", "zerolinecolor": "white", "showbackground": true, "backgroundcolor": "rgb(234,234,242)" } }, "xaxis": { "ticks": "", "showgrid": true, "gridcolor": "white", "linecolor": "white", "automargin": true, "zerolinecolor": "white" }, "yaxis": { "ticks": "", "showgrid": true, "gridcolor": "white", "linecolor": "white", "automargin": true, "zerolinecolor": "white" }, "ternary": { "aaxis": { "ticks": "", "showgrid": true, "gridcolor": "white", "linecolor": "white" }, "baxis": { "ticks": "", "showgrid": true, "gridcolor": "white", "linecolor": "white" }, "caxis": { "ticks": "", "showgrid": true, "gridcolor": "white", "linecolor": "white" }, "bgcolor": "rgb(234,234,242)" }, "colorway": [ "rgb(76,114,176)", "rgb(221,132,82)", "rgb(85,168,104)", "rgb(196,78,82)", "rgb(129,114,179)", "rgb(147,120,96)", "rgb(218,139,195)", "rgb(140,140,140)", "rgb(204,185,116)", "rgb(100,181,205)" ], "hovermode": "closest", "colorscale": { "diverging": [ [ 0, "#67001f" ], [ 0.1, "#b2182b" ], [ 0.2, "#d6604d" ], [ 0.3, "#f4a582" ], [ 0.4, "#fddbc7" ], [ 0.5, "#f7f7f7" ], [ 0.6, "#d1e5f0" ], [ 0.7, "#92c5de" ], [ 0.8, "#4393c3" ], [ 0.9, "#2166ac" ], [ 1, "#053061" ] ], "sequential": [ [ 0, "rgb(2,4,25)" ], [ 0.06274509803921569, "rgb(24,15,41)" ], [ 0.12549019607843137, "rgb(47,23,57)" ], [ 0.18823529411764706, "rgb(71,28,72)" ], [ 0.25098039215686274, "rgb(97,30,82)" ], [ 0.3137254901960784, "rgb(123,30,89)" ], [ 0.3764705882352941, "rgb(150,27,91)" ], [ 0.4392156862745098, "rgb(177,22,88)" ], [ 0.5019607843137255, "rgb(203,26,79)" ], [ 0.5647058823529412, "rgb(223,47,67)" ], [ 0.6274509803921569, "rgb(236,76,61)" ], [ 0.6901960784313725, "rgb(242,107,73)" ], [ 0.7529411764705882, "rgb(244,135,95)" ], [ 0.8156862745098039, "rgb(245,162,122)" ], [ 0.8784313725490196, "rgb(246,188,153)" ], [ 0.9411764705882353, "rgb(247,212,187)" ], [ 1, "rgb(250,234,220)" ] ], "sequentialminus": [ [ 0, "rgb(2,4,25)" ], [ 0.06274509803921569, "rgb(24,15,41)" ], [ 0.12549019607843137, "rgb(47,23,57)" ], [ 0.18823529411764706, "rgb(71,28,72)" ], [ 0.25098039215686274, "rgb(97,30,82)" ], [ 0.3137254901960784, "rgb(123,30,89)" ], [ 0.3764705882352941, "rgb(150,27,91)" ], [ 0.4392156862745098, "rgb(177,22,88)" ], [ 0.5019607843137255, "rgb(203,26,79)" ], [ 0.5647058823529412, "rgb(223,47,67)" ], [ 0.6274509803921569, "rgb(236,76,61)" ], [ 0.6901960784313725, "rgb(242,107,73)" ], [ 0.7529411764705882, "rgb(244,135,95)" ], [ 0.8156862745098039, "rgb(245,162,122)" ], [ 0.8784313725490196, "rgb(246,188,153)" ], [ 0.9411764705882353, "rgb(247,212,187)" ], [ 1, "rgb(250,234,220)" ] ] }, "plot_bgcolor": "rgb(234,234,242)", "paper_bgcolor": "white", "shapedefaults": { "line": { "width": 0 }, "opacity": 0.5, "fillcolor": "rgb(67,103,167)" }, "annotationdefaults": { "arrowcolor": "rgb(67,103,167)" } }, "themeRef": "SEABORN" } } }, "height": null, "width": null, "user": { "profile_url": "https://chart-studio.plotly.com/~Kristiana.keisa", "avatar_url": "https://storage.googleapis.com/plotly-prod-profiles/84.jpg", "background_url": "https://storage.googleapis.com/plotly-prod-profiles/bg-14.jpg", "bio": "", "nickname": "", "website": "", "stream_tokens": null, "feature_set_id": null, "csrf_token": null, "date_joined": "2024-04-21 17:32:55", "mapbox_access_tokens": null, "has_password": null, "username": "Kristiana.keisa", "email": null, "is_active": null, "readonly": null, "is_dash_creator": null, "dash_created_count": null, "is_chart_creator": null, "charts_created_count": null } }, { "creation_time": "2024-04-21T18:10:46.201728Z", "comments": { "results": [], "count": 0 }, "parented": true, "embed_url": "https://chart-studio.plotly.com/~janshayeva/1.embed", "fid": "janshayeva:1", "filename": "gro", "filetype": "plot", "img_url": "https://storage.googleapis.com/plotly-prod-images/janshayeva/1/9_2FC1IMSKK2NK6G1LD3U80N6Z50ALJE.png", "image_urls": { "default": "https://storage.googleapis.com/plotly-prod-images/janshayeva/1/2_XZJ20XPOE7G1GMNWCB9HUH51EDEI62.png", "block-thumb": "https://storage.googleapis.com/plotly-prod-images/janshayeva/1/8_3Y8XN4M3QDZY9B6VVICJCCO2HHIKTQ.png", "list-thumb": "https://storage.googleapis.com/plotly-prod-images/janshayeva/1/9_2FC1IMSKK2NK6G1LD3U80N6Z50ALJE.png" }, "api_urls": { "files": "https://api.plotly.com/v2/files/janshayeva:1", "plots": "https://api.plotly.com/v2/plots/janshayeva:1", "parent": "https://api.plotly.com/v2/folders/home?user=janshayeva" }, "owner": "janshayeva", "parent": -1, "preview": "", "referencers": [], "references": [], "title": "", "views": 1, "web_url": "https://chart-studio.plotly.com/~janshayeva/1/", "world_readable": true, "date_modified": "2024-04-21T18:10:46.213Z", "stars": { "results": [], "count": 0 }, "collaborators": { "results": [], "count": 0 }, "subfolder_count": null, "refresh_interval": null, "organize_view_url": "https://chart-studio.plotly.com/~janshayeva/1/", "current_user_permission": "read", "is_theme": null, "is_template": null, "autosize": true, "caption": "", "figure": { "data": [ { "name": "female", "type": "histogram", "xsrc": "janshayeva:0:ab2fd8", "xaxis": "x", "yaxis": "y", "marker": { "color": "violet", "pattern": { "shape": "" } }, "bingroup": "x", "showlegend": true, "legendgroup": "female", "offsetgroup": "female", "orientation": "v", "hovertemplate": "gender=female<br>average score=%{x}<br>count=%{y}<extra></extra>", "alignmentgroup": "True" }, { "line": { "color": "rgba(255,255,255,0)" }, "name": "female", "type": "box", "xsrc": "janshayeva:0:706f81", "xaxis": "x2", "yaxis": "y2", "jitter": 0, "marker": { "color": "violet", "symbol": "line-ns-open" }, "hoveron": "points", "boxpoints": "all", "fillcolor": "rgba(255,255,255,0)", "showlegend": false, "legendgroup": "female", "offsetgroup": "female", "hovertemplate": "gender=female<br>average score=%{x}<extra></extra>", "alignmentgroup": "True" }, { "name": "male", "type": "histogram", "xsrc": "janshayeva:0:964aaa", "xaxis": "x", "yaxis": "y", "marker": { "color": "yellow", "pattern": { "shape": "" } }, "bingroup": "x", "showlegend": true, "legendgroup": "male", "offsetgroup": "male", "orientation": "v", "hovertemplate": "gender=male<br>average score=%{x}<br>count=%{y}<extra></extra>", "alignmentgroup": "True" }, { "line": { "color": "rgba(255,255,255,0)" }, "name": "male", "type": "box", "xsrc": "janshayeva:0:838f0d", "xaxis": "x2", "yaxis": "y2", "jitter": 0, "marker": { "color": "yellow", "symbol": "line-ns-open" }, "hoveron": "points", "boxpoints": "all", "fillcolor": "rgba(255,255,255,0)", "showlegend": false, "legendgroup": "male", "offsetgroup": "male", "hovertemplate": "gender=male<br>average score=%{x}<extra></extra>", "alignmentgroup": "True" } ], "layout": { "xaxis": { "title": { "text": "average score" }, "anchor": "y", "domain": [ 0.0, 1.0 ] }, "yaxis": { "title": { "text": "count" }, "anchor": "x", "domain": [ 0.0, 0.7326 ] }, "legend": { "title": { "text": "gender" }, "tracegroupgap": 0 }, "margin": { "t": 60 }, "xaxis2": { "anchor": "y2", "domain": [ 0.0, 1.0 ], "matches": "x", "showgrid": true, "showticklabels": false }, "yaxis2": { "ticks": "", "anchor": "x2", "domain": [ 0.7426, 1.0 ], "matches": "y2", "showgrid": false, "showline": false, "showticklabels": false }, "barmode": "group", "template": { "data": { "bar": [ { "type": "bar", "marker": { "line": { "color": "#E5ECF6", "width": 0.5 }, "pattern": { "size": 10, "fillmode": "overlay", "solidity": 0.2 } }, "error_x": { "color": "#2a3f5f" }, "error_y": { "color": "#2a3f5f" } } ], "pie": [ { "type": "pie", "automargin": true } ], "table": [ { "type": "table", "cells": { "fill": { "color": "#EBF0F8" }, "line": { "color": "white" } }, "header": { "fill": { "color": "#C8D4E3" }, "line": { "color": "white" } } } ], "carpet": [ { "type": "carpet", "aaxis": { "gridcolor": "white", "linecolor": "white", "endlinecolor": "#2a3f5f", "minorgridcolor": "white", "startlinecolor": "#2a3f5f" }, "baxis": { "gridcolor": "white", "linecolor": "white", "endlinecolor": "#2a3f5f", "minorgridcolor": "white", "startlinecolor": "#2a3f5f" } } ], "mesh3d": [ { "type": "mesh3d", "colorbar": { "ticks": "", "outlinewidth": 0 } } ], "contour": [ { "type": "contour", "colorbar": { "ticks": "", "outlinewidth": 0 }, "colorscale": [ [ 0.0, "#0d0887" ], [ 0.1111111111111111, "#46039f" ], [ 0.2222222222222222, "#7201a8" ], [ 0.3333333333333333, "#9c179e" ], [ 0.4444444444444444, "#bd3786" ], [ 0.5555555555555556, "#d8576b" ], [ 0.6666666666666666, "#ed7953" ], [ 0.7777777777777778, "#fb9f3a" ], [ 0.8888888888888888, "#fdca26" ], [ 1.0, "#f0f921" ] ] } ], "heatmap": [ { "type": "heatmap", "colorbar": { "ticks": "", "outlinewidth": 0 }, "colorscale": [ [ 0.0, "#0d0887" ], [ 0.1111111111111111, "#46039f" ], [ 0.2222222222222222, "#7201a8" ], [ 0.3333333333333333, "#9c179e" ], [ 0.4444444444444444, "#bd3786" ], [ 0.5555555555555556, "#d8576b" ], [ 0.6666666666666666, "#ed7953" ], [ 0.7777777777777778, "#fb9f3a" ], [ 0.8888888888888888, "#fdca26" ], [ 1.0, "#f0f921" ] ] } ], "scatter": [ { "type": "scatter", "fillpattern": { "size": 10, "fillmode": "overlay", "solidity": 0.2 } } ], "surface": [ { "type": "surface", "colorbar": { "ticks": "", "outlinewidth": 0 }, "colorscale": [ [ 0.0, "#0d0887" ], [ 0.1111111111111111, "#46039f" ], [ 0.2222222222222222, "#7201a8" ], [ 0.3333333333333333, "#9c179e" ], [ 0.4444444444444444, "#bd3786" ], [ 0.5555555555555556, "#d8576b" ], [ 0.6666666666666666, "#ed7953" ], [ 0.7777777777777778, "#fb9f3a" ], [ 0.8888888888888888, "#fdca26" ], [ 1.0, "#f0f921" ] ] } ], "barpolar": [ { "type": "barpolar", "marker": { "line": { "color": "#E5ECF6", "width": 0.5 }, "pattern": { "size": 10, "fillmode": "overlay", "solidity": 0.2 } } } ], "heatmapgl": [ { "type": "heatmapgl", "colorbar": { "ticks": "", "outlinewidth": 0 }, "colorscale": [ [ 0.0, "#0d0887" ], [ 0.1111111111111111, "#46039f" ], [ 0.2222222222222222, "#7201a8" ], [ 0.3333333333333333, "#9c179e" ], [ 0.4444444444444444, "#bd3786" ], [ 0.5555555555555556, "#d8576b" ], [ 0.6666666666666666, "#ed7953" ], [ 0.7777777777777778, "#fb9f3a" ], [ 0.8888888888888888, "#fdca26" ], [ 1.0, "#f0f921" ] ] } ], "histogram": [ { "type": "histogram", "marker": { "pattern": { "size": 10, "fillmode": "overlay", "solidity": 0.2 } } } ], "parcoords": [ { "line": { "colorbar": { "ticks": "", "outlinewidth": 0 } }, "type": "parcoords" } ], "scatter3d": [ { "line": { "colorbar": { "ticks": "", "outlinewidth": 0 } }, "type": "scatter3d", "marker": { "colorbar": { "ticks": "", "outlinewidth": 0 } } } ], "scattergl": [ { "type": "scattergl", "marker": { "colorbar": { "ticks": "", "outlinewidth": 0 } } } ], "choropleth": [ { "type": "choropleth", "colorbar": { "ticks": "", "outlinewidth": 0 } } ], "scattergeo": [ { "type": "scattergeo", "marker": { "colorbar": { "ticks": "", "outlinewidth": 0 } } } ], "histogram2d": [ { "type": "histogram2d", "colorbar": { "ticks": "", "outlinewidth": 0 }, "colorscale": [ [ 0.0, "#0d0887" ], [ 0.1111111111111111, "#46039f" ], [ 0.2222222222222222, "#7201a8" ], [ 0.3333333333333333, "#9c179e" ], [ 0.4444444444444444, "#bd3786" ], [ 0.5555555555555556, "#d8576b" ], [ 0.6666666666666666, "#ed7953" ], [ 0.7777777777777778, "#fb9f3a" ], [ 0.8888888888888888, "#fdca26" ], [ 1.0, "#f0f921" ] ] } ], "scatterpolar": [ { "type": "scatterpolar", "marker": { "colorbar": { "ticks": "", "outlinewidth": 0 } } } ], "contourcarpet": [ { "type": "contourcarpet", "colorbar": { "ticks": "", "outlinewidth": 0 } } ], "scattercarpet": [ { "type": "scattercarpet", "marker": { "colorbar": { "ticks": "", "outlinewidth": 0 } } } ], "scattermapbox": [ { "type": "scattermapbox", "marker": { "colorbar": { "ticks": "", "outlinewidth": 0 } } } ], "scatterpolargl": [ { "type": "scatterpolargl", "marker": { "colorbar": { "ticks": "", "outlinewidth": 0 } } } ], "scatterternary": [ { "type": "scatterternary", "marker": { "colorbar": { "ticks": "", "outlinewidth": 0 } } } ], "histogram2dcontour": [ { "type": "histogram2dcontour", "colorbar": { "ticks": "", "outlinewidth": 0 }, "colorscale": [ [ 0.0, "#0d0887" ], [ 0.1111111111111111, "#46039f" ], [ 0.2222222222222222, "#7201a8" ], [ 0.3333333333333333, "#9c179e" ], [ 0.4444444444444444, "#bd3786" ], [ 0.5555555555555556, "#d8576b" ], [ 0.6666666666666666, "#ed7953" ], [ 0.7777777777777778, "#fb9f3a" ], [ 0.8888888888888888, "#fdca26" ], [ 1.0, "#f0f921" ] ] } ] }, "layout": { "geo": { "bgcolor": "white", "showland": true, "lakecolor": "white", "landcolor": "#E5ECF6", "showlakes": true, "subunitcolor": "white" }, "font": { "color": "#2a3f5f" }, "polar": { "bgcolor": "#E5ECF6", "radialaxis": { "ticks": "", "gridcolor": "white", "linecolor": "white" }, "angularaxis": { "ticks": "", "gridcolor": "white", "linecolor": "white" } }, "scene": { "xaxis": { "ticks": "", "gridcolor": "white", "gridwidth": 2, "linecolor": "white", "zerolinecolor": "white", "showbackground": true, "backgroundcolor": "#E5ECF6" }, "yaxis": { "ticks": "", "gridcolor": "white", "gridwidth": 2, "linecolor": "white", "zerolinecolor": "white", "showbackground": true, "backgroundcolor": "#E5ECF6" }, "zaxis": { "ticks": "", "gridcolor": "white", "gridwidth": 2, "linecolor": "white", "zerolinecolor": "white", "showbackground": true, "backgroundcolor": "#E5ECF6" } }, "title": { "x": 0.05 }, "xaxis": { "ticks": "", "title": { "standoff": 15 }, "gridcolor": "white", "linecolor": "white", "automargin": true, "zerolinecolor": "white", "zerolinewidth": 2 }, "yaxis": { "ticks": "", "title": { "standoff": 15 }, "gridcolor": "white", "linecolor": "white", "automargin": true, "zerolinecolor": "white", "zerolinewidth": 2 }, "mapbox": { "style": "light" }, "ternary": { "aaxis": { "ticks": "", "gridcolor": "white", "linecolor": "white" }, "baxis": { "ticks": "", "gridcolor": "white", "linecolor": "white" }, "caxis": { "ticks": "", "gridcolor": "white", "linecolor": "white" }, "bgcolor": "#E5ECF6" }, "colorway": [ "#636efa", "#EF553B", "#00cc96", "#ab63fa", "#FFA15A", "#19d3f3", "#FF6692", "#B6E880", "#FF97FF", "#FECB52" ], "coloraxis": { "colorbar": { "ticks": "", "outlinewidth": 0 } }, "hovermode": "closest", "colorscale": { "diverging": [ [ 0, "#8e0152" ], [ 0.1, "#c51b7d" ], [ 0.2, "#de77ae" ], [ 0.3, "#f1b6da" ], [ 0.4, "#fde0ef" ], [ 0.5, "#f7f7f7" ], [ 0.6, "#e6f5d0" ], [ 0.7, "#b8e186" ], [ 0.8, "#7fbc41" ], [ 0.9, "#4d9221" ], [ 1, "#276419" ] ], "sequential": [ [ 0.0, "#0d0887" ], [ 0.1111111111111111, "#46039f" ], [ 0.2222222222222222, "#7201a8" ], [ 0.3333333333333333, "#9c179e" ], [ 0.4444444444444444, "#bd3786" ], [ 0.5555555555555556, "#d8576b" ], [ 0.6666666666666666, "#ed7953" ], [ 0.7777777777777778, "#fb9f3a" ], [ 0.8888888888888888, "#fdca26" ], [ 1.0, "#f0f921" ] ], "sequentialminus": [ [ 0.0, "#0d0887" ], [ 0.1111111111111111, "#46039f" ], [ 0.2222222222222222, "#7201a8" ], [ 0.3333333333333333, "#9c179e" ], [ 0.4444444444444444, "#bd3786" ], [ 0.5555555555555556, "#d8576b" ], [ 0.6666666666666666, "#ed7953" ], [ 0.7777777777777778, "#fb9f3a" ], [ 0.8888888888888888, "#fdca26" ], [ 1.0, "#f0f921" ] ] }, "hoverlabel": { "align": "left" }, "plot_bgcolor": "#E5ECF6", "paper_bgcolor": "white", "shapedefaults": { "line": { "color": "#2a3f5f" } }, "autotypenumbers": "strict", "annotationdefaults": { "arrowhead": 0, "arrowcolor": "#2a3f5f", "arrowwidth": 1 } } } } }, "height": null, "width": null, "user": { "profile_url": "https://chart-studio.plotly.com/~janshayeva", "avatar_url": "https://storage.googleapis.com/plotly-prod-profiles/18.jpg", "background_url": "https://storage.googleapis.com/plotly-prod-profiles/bg-2.jpg", "bio": "", "nickname": "", "website": "", "stream_tokens": null, "feature_set_id": null, "csrf_token": null, "date_joined": "2024-04-21 18:07:36", "mapbox_access_tokens": null, "has_password": null, "username": "janshayeva", "email": null, "is_active": null, "readonly": null, "is_dash_creator": null, "dash_created_count": null, "is_chart_creator": null, "charts_created_count": null } }, { "creation_time": "2024-04-21T18:01:18.486957Z", "comments": { "results": [], "count": 0 }, "parented": true, "embed_url": "https://chart-studio.plotly.com/~Kristiana.keisa/1.embed", "fid": "Kristiana.keisa:1", "filename": "Satelītu grafiks", "filetype": "plot", "img_url": "https://storage.googleapis.com/plotly-prod-images/Kristiana.keisa/1/9_PCE3KUC0VD9XBAFQDSRC4FH6K0GJ7W.png", "image_urls": { "default": "https://storage.googleapis.com/plotly-prod-images/Kristiana.keisa/1/2_U3207EBOOUBMLT1X3JYL5NB6FWPG59.png", "block-thumb": "https://storage.googleapis.com/plotly-prod-images/Kristiana.keisa/1/8_FLXDYP2ZTWS1VZBEYMC53WDBETKVCE.png", "list-thumb": "https://storage.googleapis.com/plotly-prod-images/Kristiana.keisa/1/9_PCE3KUC0VD9XBAFQDSRC4FH6K0GJ7W.png" }, "api_urls": { "files": "https://api.plotly.com/v2/files/Kristiana.keisa:1", "plots": "https://api.plotly.com/v2/plots/Kristiana.keisa:1", "parent": "https://api.plotly.com/v2/folders/home?user=Kristiana.keisa" }, "owner": "Kristiana.keisa", "parent": -1, "preview": "", "referencers": [], "references": [], "title": "", "views": 1, "web_url": "https://chart-studio.plotly.com/~Kristiana.keisa/1/", "world_readable": true, "date_modified": "2024-04-21T18:01:18.496Z", "stars": { "results": [], "count": 0 }, "collaborators": { "results": [], "count": 0 }, "subfolder_count": null, "refresh_interval": null, "organize_view_url": "https://chart-studio.plotly.com/~Kristiana.keisa/1/", "current_user_permission": "read", "is_theme": null, "is_template": false, "autosize": true, "caption": "", "figure": { "data": [ { "meta": { "columnNames": { "r": "B", "text": "A", "theta": "C", "marker": { "color": "E" } } }, "mode": "markers+text", "rsrc": "Kristiana.keisa:0:181586", "type": "scatterpolar", "marker": { "meta": { "columnNames": { "color": "E" } }, "size": 12, "symbol": "y-up-open", "colorsrc": "Kristiana.keisa:0:c02d12" }, "textsrc": "Kristiana.keisa:0:994131", "thetasrc": "Kristiana.keisa:0:f9291d", "textposition": "top left" } ], "frames": [], "layout": { "polar": { "radialaxis": { "type": "linear", "range": [ 90, 0 ], "autorange": false }, "angularaxis": { "type": "linear", "range": [ 90, 0 ], "rotation": 90.45402839697238, "autorange": false, "direction": "clockwise" } }, "title": { "text": "Satelītu izkārtojums virs LU DAC teritorijas. Kristiāna Keiša" }, "xaxis": { "range": [ -1, 6 ], "autorange": true }, "yaxis": { "range": [ -1, 4 ], "autorange": true }, "autosize": true, "template": { "data": { "bar": [ { "type": "bar", "marker": { "colorbar": { "ticks": "outside", "ticklen": 8, "tickcolor": "rgb(36,36,36)", "tickwidth": 2, "outlinewidth": 0 } } } ], "table": [ { "type": "table", "cells": { "fill": { "color": "rgb(231,231,240)" }, "line": { "color": "white" } }, "header": { "fill": { "color": "rgb(183,183,191)" }, "line": { "color": "white" } } } ], "carpet": [ { "type": "carpet", "aaxis": { "gridcolor": "white", "linecolor": "white", "endlinecolor": "rgb(36,36,36)", "minorgridcolor": "white", "startlinecolor": "rgb(36,36,36)" }, "baxis": { "gridcolor": "white", "linecolor": "white", "endlinecolor": "rgb(36,36,36)", "minorgridcolor": "white", "startlinecolor": "rgb(36,36,36)" } } ], "mesh3d": [ { "type": "mesh3d", "colorbar": { "ticks": "outside", "ticklen": 8, "tickcolor": "rgb(36,36,36)", "tickwidth": 2, "outlinewidth": 0 } } ], "contour": [ { "type": "contour", "colorbar": { "ticks": "outside", "ticklen": 8, "tickcolor": "rgb(36,36,36)", "tickwidth": 2, "outlinewidth": 0 }, "autocolorscale": true } ], "heatmap": [ { "type": "heatmap", "colorbar": { "ticks": "outside", "ticklen": 8, "tickcolor": "rgb(36,36,36)", "tickwidth": 2, "outlinewidth": 0 }, "autocolorscale": true } ], "scatter": [ { "type": "scatter", "marker": { "colorbar": { "ticks": "outside", "ticklen": 8, "tickcolor": "rgb(36,36,36)", "tickwidth": 2, "outlinewidth": 0 } } } ], "surface": [ { "type": "surface", "colorbar": { "ticks": "outside", "ticklen": 8, "tickcolor": "rgb(36,36,36)", "tickwidth": 2, "outlinewidth": 0 } } ], "heatmapgl": [ { "type": "heatmapgl", "colorbar": { "ticks": "outside", "ticklen": 8, "tickcolor": "rgb(36,36,36)", "tickwidth": 2, "outlinewidth": 0 } } ], "histogram": [ { "type": "histogram", "marker": { "colorbar": { "ticks": "outside", "ticklen": 8, "tickcolor": "rgb(36,36,36)", "tickwidth": 2, "outlinewidth": 0 } } } ], "parcoords": [ { "line": { "colorbar": { "ticks": "outside", "ticklen": 8, "tickcolor": "rgb(36,36,36)", "tickwidth": 2, "outlinewidth": 0 } }, "type": "parcoords" } ], "scatter3d": [ { "type": "scatter3d", "marker": { "colorbar": { "ticks": "outside", "ticklen": 8, "tickcolor": "rgb(36,36,36)", "tickwidth": 2, "outlinewidth": 0 } } } ], "scattergl": [ { "type": "scattergl", "marker": { "colorbar": { "ticks": "outside", "ticklen": 8, "tickcolor": "rgb(36,36,36)", "tickwidth": 2, "outlinewidth": 0 } } } ], "choropleth": [ { "type": "choropleth", "colorbar": { "ticks": "outside", "ticklen": 8, "tickcolor": "rgb(36,36,36)", "tickwidth": 2, "outlinewidth": 0 } } ], "scattergeo": [ { "type": "scattergeo", "marker": { "colorbar": { "ticks": "outside", "ticklen": 8, "tickcolor": "rgb(36,36,36)", "tickwidth": 2, "outlinewidth": 0 } } } ], "histogram2d": [ { "type": "histogram2d", "colorbar": { "ticks": "outside", "ticklen": 8, "tickcolor": "rgb(36,36,36)", "tickwidth": 2, "outlinewidth": 0 }, "autocolorscale": true } ], "scatterpolar": [ { "type": "scatterpolar", "marker": { "colorbar": { "ticks": "outside", "ticklen": 8, "tickcolor": "rgb(36,36,36)", "tickwidth": 2, "outlinewidth": 0 } } } ], "contourcarpet": [ { "type": "contourcarpet", "colorbar": { "ticks": "outside", "ticklen": 8, "tickcolor": "rgb(36,36,36)", "tickwidth": 2, "outlinewidth": 0 } } ], "scattercarpet": [ { "type": "scattercarpet", "marker": { "colorbar": { "ticks": "outside", "ticklen": 8, "tickcolor": "rgb(36,36,36)", "tickwidth": 2, "outlinewidth": 0 } } } ], "scattermapbox": [ { "type": "scattermapbox", "marker": { "colorbar": { "ticks": "outside", "ticklen": 8, "tickcolor": "rgb(36,36,36)", "tickwidth": 2, "outlinewidth": 0 } } } ], "scatterpolargl": [ { "type": "scatterpolargl", "marker": { "colorbar": { "ticks": "outside", "ticklen": 8, "tickcolor": "rgb(36,36,36)", "tickwidth": 2, "outlinewidth": 0 } } } ], "scatterternary": [ { "type": "scatterternary", "marker": { "colorbar": { "ticks": "outside", "ticklen": 8, "tickcolor": "rgb(36,36,36)", "tickwidth": 2, "outlinewidth": 0 } } } ], "histogram2dcontour": [ { "type": "histogram2dcontour", "colorbar": { "ticks": "outside", "ticklen": 8, "tickcolor": "rgb(36,36,36)", "tickwidth": 2, "outlinewidth": 0 }, "autocolorscale": true } ] }, "layout": { "geo": { "bgcolor": "white", "showland": true, "lakecolor": "white", "landcolor": "rgb(234,234,242)", "showlakes": true, "subunitcolor": "white" }, "font": { "color": "rgb(36,36,36)" }, "polar": { "bgcolor": "rgb(234,234,242)", "radialaxis": { "ticks": "", "showgrid": true, "gridcolor": "white", "linecolor": "white" }, "angularaxis": { "ticks": "", "showgrid": true, "gridcolor": "white", "linecolor": "white" } }, "scene": { "xaxis": { "ticks": "", "showgrid": true, "gridcolor": "white", "gridwidth": 2, "linecolor": "white", "zerolinecolor": "white", "showbackground": true, "backgroundcolor": "rgb(234,234,242)" }, "yaxis": { "ticks": "", "showgrid": true, "gridcolor": "white", "gridwidth": 2, "linecolor": "white", "zerolinecolor": "white", "showbackground": true, "backgroundcolor": "rgb(234,234,242)" }, "zaxis": { "ticks": "", "showgrid": true, "gridcolor": "white", "gridwidth": 2, "linecolor": "white", "zerolinecolor": "white", "showbackground": true, "backgroundcolor": "rgb(234,234,242)" } }, "xaxis": { "ticks": "", "showgrid": true, "gridcolor": "white", "linecolor": "white", "automargin": true, "zerolinecolor": "white" }, "yaxis": { "ticks": "", "showgrid": true, "gridcolor": "white", "linecolor": "white", "automargin": true, "zerolinecolor": "white" }, "ternary": { "aaxis": { "ticks": "", "showgrid": true, "gridcolor": "white", "linecolor": "white" }, "baxis": { "ticks": "", "showgrid": true, "gridcolor": "white", "linecolor": "white" }, "caxis": { "ticks": "", "showgrid": true, "gridcolor": "white", "linecolor": "white" }, "bgcolor": "rgb(234,234,242)" }, "colorway": [ "rgb(76,114,176)", "rgb(221,132,82)", "rgb(85,168,104)", "rgb(196,78,82)", "rgb(129,114,179)", "rgb(147,120,96)", "rgb(218,139,195)", "rgb(140,140,140)", "rgb(204,185,116)", "rgb(100,181,205)" ], "hovermode": "closest", "colorscale": { "diverging": [ [ 0, "#67001f" ], [ 0.1, "#b2182b" ], [ 0.2, "#d6604d" ], [ 0.3, "#f4a582" ], [ 0.4, "#fddbc7" ], [ 0.5, "#f7f7f7" ], [ 0.6, "#d1e5f0" ], [ 0.7, "#92c5de" ], [ 0.8, "#4393c3" ], [ 0.9, "#2166ac" ], [ 1, "#053061" ] ], "sequential": [ [ 0, "rgb(2,4,25)" ], [ 0.06274509803921569, "rgb(24,15,41)" ], [ 0.12549019607843137, "rgb(47,23,57)" ], [ 0.18823529411764706, "rgb(71,28,72)" ], [ 0.25098039215686274, "rgb(97,30,82)" ], [ 0.3137254901960784, "rgb(123,30,89)" ], [ 0.3764705882352941, "rgb(150,27,91)" ], [ 0.4392156862745098, "rgb(177,22,88)" ], [ 0.5019607843137255, "rgb(203,26,79)" ], [ 0.5647058823529412, "rgb(223,47,67)" ], [ 0.6274509803921569, "rgb(236,76,61)" ], [ 0.6901960784313725, "rgb(242,107,73)" ], [ 0.7529411764705882, "rgb(244,135,95)" ], [ 0.8156862745098039, "rgb(245,162,122)" ], [ 0.8784313725490196, "rgb(246,188,153)" ], [ 0.9411764705882353, "rgb(247,212,187)" ], [ 1, "rgb(250,234,220)" ] ], "sequentialminus": [ [ 0, "rgb(2,4,25)" ], [ 0.06274509803921569, "rgb(24,15,41)" ], [ 0.12549019607843137, "rgb(47,23,57)" ], [ 0.18823529411764706, "rgb(71,28,72)" ], [ 0.25098039215686274, "rgb(97,30,82)" ], [ 0.3137254901960784, "rgb(123,30,89)" ], [ 0.3764705882352941, "rgb(150,27,91)" ], [ 0.4392156862745098, "rgb(177,22,88)" ], [ 0.5019607843137255, "rgb(203,26,79)" ], [ 0.5647058823529412, "rgb(223,47,67)" ], [ 0.6274509803921569, "rgb(236,76,61)" ], [ 0.6901960784313725, "rgb(242,107,73)" ], [ 0.7529411764705882, "rgb(244,135,95)" ], [ 0.8156862745098039, "rgb(245,162,122)" ], [ 0.8784313725490196, "rgb(246,188,153)" ], [ 0.9411764705882353, "rgb(247,212,187)" ], [ 1, "rgb(250,234,220)" ] ] }, "plot_bgcolor": "rgb(234,234,242)", "paper_bgcolor": "white", "shapedefaults": { "line": { "width": 0 }, "opacity": 0.5, "fillcolor": "rgb(67,103,167)" }, "annotationdefaults": { "arrowcolor": "rgb(67,103,167)" } }, "themeRef": "SEABORN" } } }, "height": null, "width": null, "user": { "profile_url": "https://chart-studio.plotly.com/~Kristiana.keisa", "avatar_url": "https://storage.googleapis.com/plotly-prod-profiles/84.jpg", "background_url": "https://storage.googleapis.com/plotly-prod-profiles/bg-14.jpg", "bio": "", "nickname": "", "website": "", "stream_tokens": null, "feature_set_id": null, "csrf_token": null, "date_joined": "2024-04-21 17:32:55", "mapbox_access_tokens": null, "has_password": null, "username": "Kristiana.keisa", "email": null, "is_active": null, "readonly": null, "is_dash_creator": null, "dash_created_count": null, "is_chart_creator": null, "charts_created_count": null } }, { "creation_time": "2024-04-21T17:58:26.688469Z", "comments": { "results": [], "count": 0 }, "parented": true, "embed_url": "https://chart-studio.plotly.com/~dianelysgallardosanabria/1.embed", "fid": "dianelysgallardosanabria:1", "filename": "Plot 1", "filetype": "plot", "img_url": "https://storage.googleapis.com/plotly-prod-images/dianelysgallardosanabria/1/9_BLGBCPHHIPM2WOKEKHWY8DCHWZIDNM.png", "image_urls": { "default": "https://storage.googleapis.com/plotly-prod-images/dianelysgallardosanabria/1/2_ESU1Z8C04Z7BRIIOYEZ2S68W4Y5M3T.png", "block-thumb": "https://storage.googleapis.com/plotly-prod-images/dianelysgallardosanabria/1/8_5PB2SX5ZRWT1ZAUK7I9QRZVWH5KO6N.png", "list-thumb": "https://storage.googleapis.com/plotly-prod-images/dianelysgallardosanabria/1/9_BLGBCPHHIPM2WOKEKHWY8DCHWZIDNM.png" }, "api_urls": { "files": "https://api.plotly.com/v2/files/dianelysgallardosanabria:1", "plots": "https://api.plotly.com/v2/plots/dianelysgallardosanabria:1", "parent": "https://api.plotly.com/v2/folders/home?user=dianelysgallardosanabria" }, "owner": "dianelysgallardosanabria", "parent": -1, "preview": "", "referencers": [], "references": [], "title": "", "views": 1, "web_url": "https://chart-studio.plotly.com/~dianelysgallardosanabria/1/", "world_readable": true, "date_modified": "2024-04-21T17:58:26.702Z", "stars": { "results": [], "count": 0 }, "collaborators": { "results": [], "count": 0 }, "subfolder_count": null, "refresh_interval": null, "organize_view_url": "https://chart-studio.plotly.com/~dianelysgallardosanabria/1/", "current_user_permission": "read", "is_theme": null, "is_template": false, "autosize": true, "caption": "", "figure": { "data": [ { "meta": { "columnNames": { "labels": "diagnosis", "values": "id" } }, "mode": "markers", "type": "pie", "labelssrc": "dianelysgallardosanabria:0:fee958", "valuessrc": "dianelysgallardosanabria:0:a33ce2" } ], "frames": [], "layout": { "title": { "text": "Click to enter Plot title" }, "xaxis": { "range": [ -1, 6 ], "autorange": true }, "yaxis": { "range": [ -1, 4 ], "autorange": true }, "autosize": true, "template": { "data": { "bar": [ { "type": "bar", "marker": { "colorbar": { "ticks": "", "outlinewidth": 0 } } } ], "table": [ { "type": "table", "cells": { "fill": { "color": "#EBF0F8" }, "line": { "color": "white" } }, "header": { "fill": { "color": "#C8D4E3" }, "line": { "color": "white" } } } ], "carpet": [ { "type": "carpet", "aaxis": { "gridcolor": "#C8D4E3", "linecolor": "#C8D4E3", "endlinecolor": "#2a3f5f", "minorgridcolor": "#C8D4E3", "startlinecolor": "#2a3f5f" }, "baxis": { "gridcolor": "#C8D4E3", "linecolor": "#C8D4E3", "endlinecolor": "#2a3f5f", "minorgridcolor": "#C8D4E3", "startlinecolor": "#2a3f5f" } } ], "mesh3d": [ { "type": "mesh3d", "colorbar": { "ticks": "", "outlinewidth": 0 } } ], "contour": [ { "type": "contour", "colorbar": { "ticks": "", "outlinewidth": 0 }, "autocolorscale": true } ], "heatmap": [ { "type": "heatmap", "colorbar": { "ticks": "", "outlinewidth": 0 }, "autocolorscale": true } ], "scatter": [ { "type": "scatter", "marker": { "colorbar": { "ticks": "", "outlinewidth": 0 } } } ], "surface": [ { "type": "surface", "colorbar": { "ticks": "", "outlinewidth": 0 } } ], "heatmapgl": [ { "type": "heatmapgl", "colorbar": { "ticks": "", "outlinewidth": 0 } } ], "histogram": [ { "type": "histogram", "marker": { "colorbar": { "ticks": "", "outlinewidth": 0 } } } ], "parcoords": [ { "line": { "colorbar": { "ticks": "", "outlinewidth": 0 } }, "type": "parcoords" } ], "scatter3d": [ { "type": "scatter3d", "marker": { "colorbar": { "ticks": "", "outlinewidth": 0 } } } ], "scattergl": [ { "type": "scattergl", "marker": { "colorbar": { "ticks": "", "outlinewidth": 0 } } } ], "choropleth": [ { "type": "choropleth", "colorbar": { "ticks": "", "outlinewidth": 0 } } ], "scattergeo": [ { "type": "scattergeo", "marker": { "colorbar": { "ticks": "", "outlinewidth": 0 } } } ], "histogram2d": [ { "type": "histogram2d", "colorbar": { "ticks": "", "outlinewidth": 0 }, "autocolorscale": true } ], "scatterpolar": [ { "type": "scatterpolar", "marker": { "colorbar": { "ticks": "", "outlinewidth": 0 } } } ], "contourcarpet": [ { "type": "contourcarpet", "colorbar": { "ticks": "", "outlinewidth": 0 } } ], "scattercarpet": [ { "type": "scattercarpet", "marker": { "colorbar": { "ticks": "", "outlinewidth": 0 } } } ], "scattermapbox": [ { "type": "scattermapbox", "marker": { "colorbar": { "ticks": "", "outlinewidth": 0 } } } ], "scatterpolargl": [ { "type": "scatterpolargl", "marker": { "colorbar": { "ticks": "", "outlinewidth": 0 } } } ], "scatterternary": [ { "type": "scatterternary", "marker": { "colorbar": { "ticks": "", "outlinewidth": 0 } } } ], "histogram2dcontour": [ { "type": "histogram2dcontour", "colorbar": { "ticks": "", "outlinewidth": 0 }, "autocolorscale": true } ] }, "layout": { "geo": { "bgcolor": "white", "showland": true, "lakecolor": "white", "landcolor": "white", "showlakes": true, "subunitcolor": "#C8D4E3" }, "font": { "color": "#2a3f5f" }, "polar": { "bgcolor": "white", "radialaxis": { "ticks": "", "gridcolor": "#EBF0F8", "linecolor": "#EBF0F8" }, "angularaxis": { "ticks": "", "gridcolor": "#EBF0F8", "linecolor": "#EBF0F8" } }, "scene": { "xaxis": { "ticks": "", "gridcolor": "#DFE8F3", "gridwidth": 2, "linecolor": "#EBF0F8", "zerolinecolor": "#EBF0F8", "showbackground": true, "backgroundcolor": "white" }, "yaxis": { "ticks": "", "gridcolor": "#DFE8F3", "gridwidth": 2, "linecolor": "#EBF0F8", "zerolinecolor": "#EBF0F8", "showbackground": true, "backgroundcolor": "white" }, "zaxis": { "ticks": "", "gridcolor": "#DFE8F3", "gridwidth": 2, "linecolor": "#EBF0F8", "zerolinecolor": "#EBF0F8", "showbackground": true, "backgroundcolor": "white" } }, "title": { "x": 0.05 }, "xaxis": { "ticks": "", "gridcolor": "#EBF0F8", "linecolor": "#EBF0F8", "automargin": true, "zerolinecolor": "#EBF0F8", "zerolinewidth": 2 }, "yaxis": { "ticks": "", "gridcolor": "#EBF0F8", "linecolor": "#EBF0F8", "automargin": true, "zerolinecolor": "#EBF0F8", "zerolinewidth": 2 }, "ternary": { "aaxis": { "ticks": "", "gridcolor": "#DFE8F3", "linecolor": "#A2B1C6" }, "baxis": { "ticks": "", "gridcolor": "#DFE8F3", "linecolor": "#A2B1C6" }, "caxis": { "ticks": "", "gridcolor": "#DFE8F3", "linecolor": "#A2B1C6" }, "bgcolor": "white" }, "colorway": [ "#636efa", "#EF553B", "#00cc96", "#ab63fa", "#19d3f3", "#e763fa", "#fecb52", "#ffa15a", "#ff6692", "#b6e880" ], "hovermode": "closest", "colorscale": { "diverging": [ [ 0, "#8e0152" ], [ 0.1, "#c51b7d" ], [ 0.2, "#de77ae" ], [ 0.3, "#f1b6da" ], [ 0.4, "#fde0ef" ], [ 0.5, "#f7f7f7" ], [ 0.6, "#e6f5d0" ], [ 0.7, "#b8e186" ], [ 0.8, "#7fbc41" ], [ 0.9, "#4d9221" ], [ 1, "#276419" ] ], "sequential": [ [ 0, "#0508b8" ], [ 0.0893854748603352, "#1910d8" ], [ 0.1787709497206704, "#3c19f0" ], [ 0.2681564245810056, "#6b1cfb" ], [ 0.3575418994413408, "#981cfd" ], [ 0.44692737430167595, "#bf1cfd" ], [ 0.5363128491620112, "#dd2bfd" ], [ 0.6256983240223464, "#f246fe" ], [ 0.7150837988826816, "#fc67fd" ], [ 0.8044692737430168, "#fe88fc" ], [ 0.8938547486033519, "#fea5fd" ], [ 0.9832402234636871, "#febefe" ], [ 1, "#fec3fe" ] ], "sequentialminus": [ [ 0, "#0508b8" ], [ 0.0893854748603352, "#1910d8" ], [ 0.1787709497206704, "#3c19f0" ], [ 0.2681564245810056, "#6b1cfb" ], [ 0.3575418994413408, "#981cfd" ], [ 0.44692737430167595, "#bf1cfd" ], [ 0.5363128491620112, "#dd2bfd" ], [ 0.6256983240223464, "#f246fe" ], [ 0.7150837988826816, "#fc67fd" ], [ 0.8044692737430168, "#fe88fc" ], [ 0.8938547486033519, "#fea5fd" ], [ 0.9832402234636871, "#febefe" ], [ 1, "#fec3fe" ] ] }, "plot_bgcolor": "white", "paper_bgcolor": "white", "shapedefaults": { "line": { "width": 0 }, "opacity": 0.4, "fillcolor": "#506784" }, "annotationdefaults": { "arrowhead": 0, "arrowcolor": "#506784", "arrowwidth": 1 } }, "themeRef": "PLOTLY_WHITE" }, "hovermode": "x", "colorscale": { "sequential": [ [ 0, "#fff5f0" ], [ 0.125, "#fee0d2" ], [ 0.25, "#fcbba1" ], [ 0.375, "#fc9272" ], [ 0.5, "#fb6a4a" ], [ 0.625, "#ef3b2c" ], [ 0.75, "#cb181d" ], [ 0.875, "#a50f15" ], [ 1, "#67000d" ] ] } } }, "height": null, "width": null, "user": { "profile_url": "https://chart-studio.plotly.com/~dianelysgallardosanabria", "avatar_url": "https://storage.googleapis.com/plotly-prod-profiles/20.jpg", "background_url": "https://storage.googleapis.com/plotly-prod-profiles/bg-3.jpg", "bio": "", "nickname": "", "website": "", "stream_tokens": null, "feature_set_id": null, "csrf_token": null, "date_joined": "2024-04-21 17:58:10", "mapbox_access_tokens": null, "has_password": null, "username": "dianelysgallardosanabria", "email": null, "is_active": null, "readonly": null, "is_dash_creator": null, "dash_created_count": null, "is_chart_creator": null, "charts_created_count": null } }, { "creation_time": "2024-04-21T17:54:03.332938Z", "comments": { "results": [], "count": 0 }, "parented": true, "embed_url": "https://chart-studio.plotly.com/~24vaggarwal/15.embed", "fid": "24vaggarwal:15", "filename": "Plot 15", "filetype": "plot", "img_url": "https://storage.googleapis.com/plotly-prod-images/24vaggarwal/15/9_FRD8Y9KIY8JF2RHEQ07TM7J4KODY87.png", "image_urls": { "default": "https://storage.googleapis.com/plotly-prod-images/24vaggarwal/15/2_2T013140C53SWLKSHH0D6IK19QIZVM.png", "block-thumb": "https://storage.googleapis.com/plotly-prod-images/24vaggarwal/15/8_77T2F0K61SXCH6F46Q36FXBPCGSBAO.png", "list-thumb": "https://storage.googleapis.com/plotly-prod-images/24vaggarwal/15/9_FRD8Y9KIY8JF2RHEQ07TM7J4KODY87.png" }, "api_urls": { "files": "https://api.plotly.com/v2/files/24vaggarwal:15", "plots": "https://api.plotly.com/v2/plots/24vaggarwal:15", "parent": "https://api.plotly.com/v2/folders/home?user=24vaggarwal" }, "owner": "24vaggarwal", "parent": -1, "preview": "", "referencers": [], "references": [], "title": "", "views": 1, "web_url": "https://chart-studio.plotly.com/~24vaggarwal/15/", "world_readable": true, "date_modified": "2024-04-21T17:54:03.344Z", "stars": { "results": [], "count": 0 }, "collaborators": { "results": [], "count": 0 }, "subfolder_count": null, "refresh_interval": null, "organize_view_url": "https://chart-studio.plotly.com/~24vaggarwal/15/", "current_user_permission": "read", "is_theme": null, "is_template": false, "autosize": true, "caption": "", "figure": { "data": [ { "uid": "aa328e", "meta": { "columnNames": { "x": "A", "y": "B" } }, "mode": "markers", "type": "scatter", "xsrc": "24vaggarwal:14:bc0aaf", "ysrc": "24vaggarwal:14:1f855e" }, { "uid": "e9708b", "transforms": [ { "rms": "", "type": "fit", "inputUid": "aa328e", "regressor": "x", "parameters": [ { "hold": false, "name": "m", "error": 0.010279856121324175, "value": 0.3374969865859651 }, { "hold": false, "name": "b", "error": 3.3642837829939474, "value": 2.3933215863810267 } ], "regressand": "y", "correlation": "", "fitfunction": "m*x + b", "inputxrange": [], "outputxrange": [], "interpolation": 50 } ] } ], "frames": [], "layout": { "title": { "text": "Resistance versus Length/Surface Area" }, "xaxis": { "type": "linear", "range": [ 71.20610751382706, 665.143892486173 ], "title": { "text": "Length over Surface Area (1/m)" }, "autorange": true }, "yaxis": { "type": "linear", "range": [ 26.757824462464093, 238.62652435228807 ], "title": { "text": "Resistance (ohms)" }, "autorange": true }, "autosize": true, "template": { "data": { "bar": [ { "type": "bar", "marker": { "colorbar": { "ticks": "", "outlinewidth": 0 } } } ], "table": [ { "type": "table", "cells": { "fill": { "color": "#EBF0F8" }, "line": { "color": "white" } }, "header": { "fill": { "color": "#C8D4E3" }, "line": { "color": "white" } } } ], "carpet": [ { "type": "carpet", "aaxis": { "gridcolor": "#C8D4E3", "linecolor": "#C8D4E3", "endlinecolor": "#2a3f5f", "minorgridcolor": "#C8D4E3", "startlinecolor": "#2a3f5f" }, "baxis": { "gridcolor": "#C8D4E3", "linecolor": "#C8D4E3", "endlinecolor": "#2a3f5f", "minorgridcolor": "#C8D4E3", "startlinecolor": "#2a3f5f" } } ], "mesh3d": [ { "type": "mesh3d", "colorbar": { "ticks": "", "outlinewidth": 0 } } ], "contour": [ { "type": "contour", "colorbar": { "ticks": "", "outlinewidth": 0 }, "autocolorscale": true } ], "heatmap": [ { "type": "heatmap", "colorbar": { "ticks": "", "outlinewidth": 0 }, "autocolorscale": true } ], "scatter": [ { "type": "scatter", "marker": { "colorbar": { "ticks": "", "outlinewidth": 0 } } } ], "surface": [ { "type": "surface", "colorbar": { "ticks": "", "outlinewidth": 0 } } ], "heatmapgl": [ { "type": "heatmapgl", "colorbar": { "ticks": "", "outlinewidth": 0 } } ], "histogram": [ { "type": "histogram", "marker": { "colorbar": { "ticks": "", "outlinewidth": 0 } } } ], "parcoords": [ { "line": { "colorbar": { "ticks": "", "outlinewidth": 0 } }, "type": "parcoords" } ], "scatter3d": [ { "type": "scatter3d", "marker": { "colorbar": { "ticks": "", "outlinewidth": 0 } } } ], "scattergl": [ { "type": "scattergl", "marker": { "colorbar": { "ticks": "", "outlinewidth": 0 } } } ], "choropleth": [ { "type": "choropleth", "colorbar": { "ticks": "", "outlinewidth": 0 } } ], "scattergeo": [ { "type": "scattergeo", "marker": { "colorbar": { "ticks": "", "outlinewidth": 0 } } } ], "histogram2d": [ { "type": "histogram2d", "colorbar": { "ticks": "", "outlinewidth": 0 }, "autocolorscale": true } ], "scatterpolar": [ { "type": "scatterpolar", "marker": { "colorbar": { "ticks": "", "outlinewidth": 0 } } } ], "contourcarpet": [ { "type": "contourcarpet", "colorbar": { "ticks": "", "outlinewidth": 0 } } ], "scattercarpet": [ { "type": "scattercarpet", "marker": { "colorbar": { "ticks": "", "outlinewidth": 0 } } } ], "scattermapbox": [ { "type": "scattermapbox", "marker": { "colorbar": { "ticks": "", "outlinewidth": 0 } } } ], "scatterpolargl": [ { "type": "scatterpolargl", "marker": { "colorbar": { "ticks": "", "outlinewidth": 0 } } } ], "scatterternary": [ { "type": "scatterternary", "marker": { "colorbar": { "ticks": "", "outlinewidth": 0 } } } ], "histogram2dcontour": [ { "type": "histogram2dcontour", "colorbar": { "ticks": "", "outlinewidth": 0 }, "autocolorscale": true } ] }, "layout": { "geo": { "bgcolor": "white", "showland": true, "lakecolor": "white", "landcolor": "white", "showlakes": true, "subunitcolor": "#C8D4E3" }, "font": { "color": "#2a3f5f" }, "polar": { "bgcolor": "white", "radialaxis": { "ticks": "", "gridcolor": "#EBF0F8", "linecolor": "#EBF0F8" }, "angularaxis": { "ticks": "", "gridcolor": "#EBF0F8", "linecolor": "#EBF0F8" } }, "scene": { "xaxis": { "ticks": "", "gridcolor": "#DFE8F3", "gridwidth": 2, "linecolor": "#EBF0F8", "zerolinecolor": "#EBF0F8", "showbackground": true, "backgroundcolor": "white" }, "yaxis": { "ticks": "", "gridcolor": "#DFE8F3", "gridwidth": 2, "linecolor": "#EBF0F8", "zerolinecolor": "#EBF0F8", "showbackground": true, "backgroundcolor": "white" }, "zaxis": { "ticks": "", "gridcolor": "#DFE8F3", "gridwidth": 2, "linecolor": "#EBF0F8", "zerolinecolor": "#EBF0F8", "showbackground": true, "backgroundcolor": "white" } }, "title": { "x": 0.05 }, "xaxis": { "ticks": "", "gridcolor": "#EBF0F8", "linecolor": "#EBF0F8", "automargin": true, "zerolinecolor": "#EBF0F8", "zerolinewidth": 2 }, "yaxis": { "ticks": "", "gridcolor": "#EBF0F8", "linecolor": "#EBF0F8", "automargin": true, "zerolinecolor": "#EBF0F8", "zerolinewidth": 2 }, "ternary": { "aaxis": { "ticks": "", "gridcolor": "#DFE8F3", "linecolor": "#A2B1C6" }, "baxis": { "ticks": "", "gridcolor": "#DFE8F3", "linecolor": "#A2B1C6" }, "caxis": { "ticks": "", "gridcolor": "#DFE8F3", "linecolor": "#A2B1C6" }, "bgcolor": "white" }, "colorway": [ "#636efa", "#EF553B", "#00cc96", "#ab63fa", "#19d3f3", "#e763fa", "#fecb52", "#ffa15a", "#ff6692", "#b6e880" ], "hovermode": "closest", "colorscale": { "diverging": [ [ 0, "#8e0152" ], [ 0.1, "#c51b7d" ], [ 0.2, "#de77ae" ], [ 0.3, "#f1b6da" ], [ 0.4, "#fde0ef" ], [ 0.5, "#f7f7f7" ], [ 0.6, "#e6f5d0" ], [ 0.7, "#b8e186" ], [ 0.8, "#7fbc41" ], [ 0.9, "#4d9221" ], [ 1, "#276419" ] ], "sequential": [ [ 0, "#0508b8" ], [ 0.0893854748603352, "#1910d8" ], [ 0.1787709497206704, "#3c19f0" ], [ 0.2681564245810056, "#6b1cfb" ], [ 0.3575418994413408, "#981cfd" ], [ 0.44692737430167595, "#bf1cfd" ], [ 0.5363128491620112, "#dd2bfd" ], [ 0.6256983240223464, "#f246fe" ], [ 0.7150837988826816, "#fc67fd" ], [ 0.8044692737430168, "#fe88fc" ], [ 0.8938547486033519, "#fea5fd" ], [ 0.9832402234636871, "#febefe" ], [ 1, "#fec3fe" ] ], "sequentialminus": [ [ 0, "#0508b8" ], [ 0.0893854748603352, "#1910d8" ], [ 0.1787709497206704, "#3c19f0" ], [ 0.2681564245810056, "#6b1cfb" ], [ 0.3575418994413408, "#981cfd" ], [ 0.44692737430167595, "#bf1cfd" ], [ 0.5363128491620112, "#dd2bfd" ], [ 0.6256983240223464, "#f246fe" ], [ 0.7150837988826816, "#fc67fd" ], [ 0.8044692737430168, "#fe88fc" ], [ 0.8938547486033519, "#fea5fd" ], [ 0.9832402234636871, "#febefe" ], [ 1, "#fec3fe" ] ] }, "plot_bgcolor": "white", "paper_bgcolor": "white", "shapedefaults": { "line": { "width": 0 }, "opacity": 0.4, "fillcolor": "#506784" }, "annotationdefaults": { "arrowhead": 0, "arrowcolor": "#506784", "arrowwidth": 1 } }, "themeRef": "PLOTLY_WHITE" } } }, "height": null, "width": null, "user": { "profile_url": "https://chart-studio.plotly.com/~24vaggarwal", "avatar_url": "https://storage.googleapis.com/plotly-prod-profiles/23.jpg", "background_url": "https://storage.googleapis.com/plotly-prod-profiles/bg-13.jpg", "bio": "", "nickname": "", "website": "", "stream_tokens": null, "feature_set_id": null, "csrf_token": null, "date_joined": "2023-10-17 17:00:59", "mapbox_access_tokens": null, "has_password": null, "username": "24vaggarwal", "email": null, "is_active": null, "readonly": null, "is_dash_creator": null, "dash_created_count": null, "is_chart_creator": null, "charts_created_count": null } }, { "creation_time": "2024-04-21T17:34:11.392051Z", "comments": { "results": [], "count": 0 }, "parented": true, "embed_url": "https://chart-studio.plotly.com/~haiderawan732/1.embed", "fid": "haiderawan732:1", "filename": "Plot 1", "filetype": "plot", "img_url": "https://storage.googleapis.com/plotly-prod-images/haiderawan732/1/9_NDWH1NJE2GM5E5WBP2KQ6D2W772UEW.png", "image_urls": { "default": "https://storage.googleapis.com/plotly-prod-images/haiderawan732/1/2_P073RUKT5MCEN7NXFN62ZZUR0N6SUT.png", "block-thumb": "https://storage.googleapis.com/plotly-prod-images/haiderawan732/1/8_08CXL031V1PYYIXVROVTVDY5VU6QYZ.png", "list-thumb": "https://storage.googleapis.com/plotly-prod-images/haiderawan732/1/9_NDWH1NJE2GM5E5WBP2KQ6D2W772UEW.png" }, "api_urls": { "files": "https://api.plotly.com/v2/files/haiderawan732:1", "plots": "https://api.plotly.com/v2/plots/haiderawan732:1", "parent": "https://api.plotly.com/v2/folders/home?user=haiderawan732" }, "owner": "haiderawan732", "parent": -1, "preview": "", "referencers": [], "references": [], "title": "", "views": 1, "web_url": "https://chart-studio.plotly.com/~haiderawan732/1/", "world_readable": true, "date_modified": "2024-04-21T18:00:56.539Z", "stars": { "results": [], "count": 0 }, "collaborators": { "results": [], "count": 0 }, "subfolder_count": null, "refresh_interval": null, "organize_view_url": "https://chart-studio.plotly.com/~haiderawan732/1/", "current_user_permission": "read", "is_theme": null, "is_template": false, "autosize": true, "caption": "", "figure": { "data": [ { "line": { "shape": "spline" }, "meta": { "columnNames": { "x": "C", "y": "B", "marker": { "size": "B" } } }, "mode": "markers+lines+text", "type": "scatter", "xsrc": "haiderawan732:0:659129", "ysrc": "haiderawan732:0:b4e925", "marker": { "meta": { "columnNames": { "size": "B" } }, "size": 8, "color": "rgb(4, 19, 233)", "symbol": "circle-open", "opacity": 1, "sizeref": null, "sizemode": "area" }, "opacity": 1, "hoverinfo": "x+y", "connectgaps": false } ], "frames": [], "layout": { "title": { "text": " Phillips Curve" }, "xaxis": { "range": [ 0.006604844814534494, 6.943395155185465 ], "title": { "text": "Unemployment Rate " }, "autorange": true, "showspikes": false }, "yaxis": { "range": [ 0.9598521584861031, 21.860147841513896 ], "title": { "text": "Inflation Rate" }, "autorange": true, "showspikes": false }, "autosize": true, "dragmode": "pan", "template": { "data": { "bar": [ { "type": "bar", "marker": { "colorbar": { "ticks": "", "outlinewidth": 0 } } } ], "table": [ { "type": "table", "cells": { "fill": { "color": "#EBF0F8" }, "line": { "color": "white" } }, "header": { "fill": { "color": "#C8D4E3" }, "line": { "color": "white" } } } ], "carpet": [ { "type": "carpet", "aaxis": { "gridcolor": "#C8D4E3", "linecolor": "#C8D4E3", "endlinecolor": "#2a3f5f", "minorgridcolor": "#C8D4E3", "startlinecolor": "#2a3f5f" }, "baxis": { "gridcolor": "#C8D4E3", "linecolor": "#C8D4E3", "endlinecolor": "#2a3f5f", "minorgridcolor": "#C8D4E3", "startlinecolor": "#2a3f5f" } } ], "mesh3d": [ { "type": "mesh3d", "colorbar": { "ticks": "", "outlinewidth": 0 } } ], "contour": [ { "type": "contour", "colorbar": { "ticks": "", "outlinewidth": 0 }, "autocolorscale": true } ], "heatmap": [ { "type": "heatmap", "colorbar": { "ticks": "", "outlinewidth": 0 }, "autocolorscale": true } ], "scatter": [ { "type": "scatter", "marker": { "colorbar": { "ticks": "", "outlinewidth": 0 } } } ], "surface": [ { "type": "surface", "colorbar": { "ticks": "", "outlinewidth": 0 } } ], "heatmapgl": [ { "type": "heatmapgl", "colorbar": { "ticks": "", "outlinewidth": 0 } } ], "histogram": [ { "type": "histogram", "marker": { "colorbar": { "ticks": "", "outlinewidth": 0 } } } ], "parcoords": [ { "line": { "colorbar": { "ticks": "", "outlinewidth": 0 } }, "type": "parcoords" } ], "scatter3d": [ { "type": "scatter3d", "marker": { "colorbar": { "ticks": "", "outlinewidth": 0 } } } ], "scattergl": [ { "type": "scattergl", "marker": { "colorbar": { "ticks": "", "outlinewidth": 0 } } } ], "choropleth": [ { "type": "choropleth", "colorbar": { "ticks": "", "outlinewidth": 0 } } ], "scattergeo": [ { "type": "scattergeo", "marker": { "colorbar": { "ticks": "", "outlinewidth": 0 } } } ], "histogram2d": [ { "type": "histogram2d", "colorbar": { "ticks": "", "outlinewidth": 0 }, "autocolorscale": true } ], "scatterpolar": [ { "type": "scatterpolar", "marker": { "colorbar": { "ticks": "", "outlinewidth": 0 } } } ], "contourcarpet": [ { "type": "contourcarpet", "colorbar": { "ticks": "", "outlinewidth": 0 } } ], "scattercarpet": [ { "type": "scattercarpet", "marker": { "colorbar": { "ticks": "", "outlinewidth": 0 } } } ], "scattermapbox": [ { "type": "scattermapbox", "marker": { "colorbar": { "ticks": "", "outlinewidth": 0 } } } ], "scatterpolargl": [ { "type": "scatterpolargl", "marker": { "colorbar": { "ticks": "", "outlinewidth": 0 } } } ], "scatterternary": [ { "type": "scatterternary", "marker": { "colorbar": { "ticks": "", "outlinewidth": 0 } } } ], "histogram2dcontour": [ { "type": "histogram2dcontour", "colorbar": { "ticks": "", "outlinewidth": 0 }, "autocolorscale": true } ] }, "layout": { "geo": { "bgcolor": "white", "showland": true, "lakecolor": "white", "landcolor": "white", "showlakes": true, "subunitcolor": "#C8D4E3" }, "font": { "color": "#2a3f5f" }, "polar": { "bgcolor": "white", "radialaxis": { "ticks": "", "gridcolor": "#EBF0F8", "linecolor": "#EBF0F8" }, "angularaxis": { "ticks": "", "gridcolor": "#EBF0F8", "linecolor": "#EBF0F8" } }, "scene": { "xaxis": { "ticks": "", "gridcolor": "#DFE8F3", "gridwidth": 2, "linecolor": "#EBF0F8", "zerolinecolor": "#EBF0F8", "showbackground": true, "backgroundcolor": "white" }, "yaxis": { "ticks": "", "gridcolor": "#DFE8F3", "gridwidth": 2, "linecolor": "#EBF0F8", "zerolinecolor": "#EBF0F8", "showbackground": true, "backgroundcolor": "white" }, "zaxis": { "ticks": "", "gridcolor": "#DFE8F3", "gridwidth": 2, "linecolor": "#EBF0F8", "zerolinecolor": "#EBF0F8", "showbackground": true, "backgroundcolor": "white" } }, "title": { "x": 0.05 }, "xaxis": { "ticks": "", "gridcolor": "#EBF0F8", "linecolor": "#EBF0F8", "automargin": true, "zerolinecolor": "#EBF0F8", "zerolinewidth": 2 }, "yaxis": { "ticks": "", "gridcolor": "#EBF0F8", "linecolor": "#EBF0F8", "automargin": true, "zerolinecolor": "#EBF0F8", "zerolinewidth": 2 }, "ternary": { "aaxis": { "ticks": "", "gridcolor": "#DFE8F3", "linecolor": "#A2B1C6" }, "baxis": { "ticks": "", "gridcolor": "#DFE8F3", "linecolor": "#A2B1C6" }, "caxis": { "ticks": "", "gridcolor": "#DFE8F3", "linecolor": "#A2B1C6" }, "bgcolor": "white" }, "colorway": [ "#636efa", "#EF553B", "#00cc96", "#ab63fa", "#19d3f3", "#e763fa", "#fecb52", "#ffa15a", "#ff6692", "#b6e880" ], "hovermode": "closest", "colorscale": { "diverging": [ [ 0, "#8e0152" ], [ 0.1, "#c51b7d" ], [ 0.2, "#de77ae" ], [ 0.3, "#f1b6da" ], [ 0.4, "#fde0ef" ], [ 0.5, "#f7f7f7" ], [ 0.6, "#e6f5d0" ], [ 0.7, "#b8e186" ], [ 0.8, "#7fbc41" ], [ 0.9, "#4d9221" ], [ 1, "#276419" ] ], "sequential": [ [ 0, "#0508b8" ], [ 0.0893854748603352, "#1910d8" ], [ 0.1787709497206704, "#3c19f0" ], [ 0.2681564245810056, "#6b1cfb" ], [ 0.3575418994413408, "#981cfd" ], [ 0.44692737430167595, "#bf1cfd" ], [ 0.5363128491620112, "#dd2bfd" ], [ 0.6256983240223464, "#f246fe" ], [ 0.7150837988826816, "#fc67fd" ], [ 0.8044692737430168, "#fe88fc" ], [ 0.8938547486033519, "#fea5fd" ], [ 0.9832402234636871, "#febefe" ], [ 1, "#fec3fe" ] ], "sequentialminus": [ [ 0, "#0508b8" ], [ 0.0893854748603352, "#1910d8" ], [ 0.1787709497206704, "#3c19f0" ], [ 0.2681564245810056, "#6b1cfb" ], [ 0.3575418994413408, "#981cfd" ], [ 0.44692737430167595, "#bf1cfd" ], [ 0.5363128491620112, "#dd2bfd" ], [ 0.6256983240223464, "#f246fe" ], [ 0.7150837988826816, "#fc67fd" ], [ 0.8044692737430168, "#fe88fc" ], [ 0.8938547486033519, "#fea5fd" ], [ 0.9832402234636871, "#febefe" ], [ 1, "#fec3fe" ] ] }, "plot_bgcolor": "white", "paper_bgcolor": "white", "shapedefaults": { "line": { "width": 0 }, "opacity": 0.4, "fillcolor": "#506784" }, "annotationdefaults": { "arrowhead": 0, "arrowcolor": "#506784", "arrowwidth": 1 } }, "themeRef": "PLOTLY_WHITE" } } }, "height": null, "width": null, "user": { "profile_url": "https://chart-studio.plotly.com/~haiderawan732", "avatar_url": "https://storage.googleapis.com/plotly-prod-profiles/58.jpg", "background_url": "https://storage.googleapis.com/plotly-prod-profiles/bg-9.jpg", "bio": "", "nickname": "", "website": "", "stream_tokens": null, "feature_set_id": null, "csrf_token": null, "date_joined": "2024-04-21 17:33:38", "mapbox_access_tokens": null, "has_password": null, "username": "haiderawan732", "email": null, "is_active": null, "readonly": null, "is_dash_creator": null, "dash_created_count": null, "is_chart_creator": null, "charts_created_count": null } }, { "creation_time": "2024-04-21T17:13:55.273914Z", "comments": { "results": [], "count": 0 }, "parented": true, "embed_url": "https://chart-studio.plotly.com/~arch1t3ctluce/12.embed", "fid": "arch1t3ctluce:12", "filename": "Plot 3 copy", "filetype": "plot", "img_url": "https://storage.googleapis.com/plotly-prod-images/arch1t3ctluce/12/9_A2A5YLHZZ6AEUFU6VVOE85UT3991XF.png", "image_urls": { "default": "https://storage.googleapis.com/plotly-prod-images/arch1t3ctluce/12/2_9E3S8DNFG5QNWMAQ6O84TZI8NFE0K6.png", "block-thumb": "https://storage.googleapis.com/plotly-prod-images/arch1t3ctluce/12/8_IRZ8MHLZLO678K7ORSFN0OW6X3UTUE.png", "list-thumb": "https://storage.googleapis.com/plotly-prod-images/arch1t3ctluce/12/9_A2A5YLHZZ6AEUFU6VVOE85UT3991XF.png" }, "api_urls": { "files": "https://api.plotly.com/v2/files/arch1t3ctluce:12", "plots": "https://api.plotly.com/v2/plots/arch1t3ctluce:12", "parent": "https://api.plotly.com/v2/folders/home?user=arch1t3ctluce" }, "owner": "arch1t3ctluce", "parent": -1, "preview": "", "referencers": [], "references": [], "title": "", "views": 1, "web_url": "https://chart-studio.plotly.com/~arch1t3ctluce/12/", "world_readable": true, "date_modified": "2024-04-21T22:31:28.855Z", "stars": { "results": [], "count": 0 }, "collaborators": { "results": [], "count": 0 }, "subfolder_count": null, "refresh_interval": null, "organize_view_url": "https://chart-studio.plotly.com/~arch1t3ctluce/12/", "current_user_permission": "read", "is_theme": null, "is_template": false, "autosize": true, "caption": "", "figure": { "data": [ { "line": { "color": "rgb(255, 0, 0)" }, "meta": { "columnNames": { "x": "A", "y": "B" } }, "mode": "lines", "name": "RCP8.5 control run", "type": "scatter", "xsrc": "arch1t3ctluce:11:699154", "ysrc": "arch1t3ctluce:11:4e09ae" }, { "line": { "dash": "dot", "color": "rgb(196, 15, 15)" }, "meta": { "columnNames": { "x": "A", "y": "C" } }, "mode": "lines", "name": "Snow DDF adjusted by -0.001", "type": "scatter", "xsrc": "arch1t3ctluce:11:699154", "ysrc": "arch1t3ctluce:11:02bea3", "stackgroup": null }, { "fill": "tonexty", "line": { "dash": "dot", "color": "rgb(255, 151, 151)" }, "meta": { "columnNames": { "x": "A", "y": "D" } }, "mode": "lines", "name": "Snow DDF adjusted by +0.001", "type": "scatter", "xsrc": "arch1t3ctluce:11:699154", "ysrc": "arch1t3ctluce:11:27ce54", "stackgroup": null }, { "line": { "dash": "dot" }, "meta": { "columnNames": { "x": "A", "y": "E" } }, "mode": "lines", "name": "Ice DDF adjusted by -0.001", "type": "scatter", "xsrc": "arch1t3ctluce:11:699154", "ysrc": "arch1t3ctluce:11:3d25bd", "stackgroup": null }, { "fill": "tonexty", "line": { "dash": "dot", "color": "rgb(195, 143, 241)" }, "meta": { "columnNames": { "x": "A", "y": "F" } }, "mode": "lines", "name": "Ice DDF adjusted by +0.001", "type": "scatter", "xsrc": "arch1t3ctluce:11:699154", "ysrc": "arch1t3ctluce:11:331a02", "fillcolor": "rgba(231, 216, 245, 0.5)", "stackgroup": null, "connectgaps": false } ], "frames": [], "layout": { "title": { "text": "Glacier volume projected to 2100 under adjusted snow and ice DDFs, assuming RCP8.5" }, "xaxis": { "type": "linear", "range": [ 2030, 2100 ], "title": { "text": "Year" }, "autorange": true }, "yaxis": { "type": "linear", "range": [ -0.01416388888888889, 0.2691138888888889 ], "title": { "text": "Glacier Volume (km3)" }, "autorange": true }, "shapes": [ { "x0": 2055, "x1": 2060, "y0": 0, "y1": 0.26, "line": { "color": "#444444", "width": 0 }, "type": "rect", "opacity": 0.3, "visible": false, "fillcolor": "rgb(247, 187, 187)" }, { "x0": 2060, "x1": 2065, "y0": 0, "y1": 0.26, "line": { "color": "rgb(255, 0, 0)", "width": 0 }, "type": "rect", "opacity": 0.3, "visible": false, "fillcolor": "rgb(255, 0, 0)" }, { "x0": 2065, "x1": 2070, "y0": 0, "y1": 0.26, "line": { "color": "#444444" }, "opacity": 0.3, "visible": false, "fillcolor": "rgb(176, 4, 4)" } ], "autosize": true, "dragmode": "zoom", "template": { "data": { "bar": [ { "type": "bar", "marker": { "colorbar": { "ticks": "", "outlinewidth": 0 } } } ], "table": [ { "type": "table", "cells": { "fill": { "color": "#EBF0F8" }, "line": { "color": "white" } }, "header": { "fill": { "color": "#C8D4E3" }, "line": { "color": "white" } } } ], "carpet": [ { "type": "carpet", "aaxis": { "gridcolor": "#C8D4E3", "linecolor": "#C8D4E3", "endlinecolor": "#2a3f5f", "minorgridcolor": "#C8D4E3", "startlinecolor": "#2a3f5f" }, "baxis": { "gridcolor": "#C8D4E3", "linecolor": "#C8D4E3", "endlinecolor": "#2a3f5f", "minorgridcolor": "#C8D4E3", "startlinecolor": "#2a3f5f" } } ], "mesh3d": [ { "type": "mesh3d", "colorbar": { "ticks": "", "outlinewidth": 0 } } ], "contour": [ { "type": "contour", "colorbar": { "ticks": "", "outlinewidth": 0 }, "autocolorscale": true } ], "heatmap": [ { "type": "heatmap", "colorbar": { "ticks": "", "outlinewidth": 0 }, "autocolorscale": true } ], "scatter": [ { "type": "scatter", "marker": { "colorbar": { "ticks": "", "outlinewidth": 0 } } } ], "surface": [ { "type": "surface", "colorbar": { "ticks": "", "outlinewidth": 0 } } ], "heatmapgl": [ { "type": "heatmapgl", "colorbar": { "ticks": "", "outlinewidth": 0 } } ], "histogram": [ { "type": "histogram", "marker": { "colorbar": { "ticks": "", "outlinewidth": 0 } } } ], "parcoords": [ { "line": { "colorbar": { "ticks": "", "outlinewidth": 0 } }, "type": "parcoords" } ], "scatter3d": [ { "type": "scatter3d", "marker": { "colorbar": { "ticks": "", "outlinewidth": 0 } } } ], "scattergl": [ { "type": "scattergl", "marker": { "colorbar": { "ticks": "", "outlinewidth": 0 } } } ], "choropleth": [ { "type": "choropleth", "colorbar": { "ticks": "", "outlinewidth": 0 } } ], "scattergeo": [ { "type": "scattergeo", "marker": { "colorbar": { "ticks": "", "outlinewidth": 0 } } } ], "histogram2d": [ { "type": "histogram2d", "colorbar": { "ticks": "", "outlinewidth": 0 }, "autocolorscale": true } ], "scatterpolar": [ { "type": "scatterpolar", "marker": { "colorbar": { "ticks": "", "outlinewidth": 0 } } } ], "contourcarpet": [ { "type": "contourcarpet", "colorbar": { "ticks": "", "outlinewidth": 0 } } ], "scattercarpet": [ { "type": "scattercarpet", "marker": { "colorbar": { "ticks": "", "outlinewidth": 0 } } } ], "scattermapbox": [ { "type": "scattermapbox", "marker": { "colorbar": { "ticks": "", "outlinewidth": 0 } } } ], "scatterpolargl": [ { "type": "scatterpolargl", "marker": { "colorbar": { "ticks": "", "outlinewidth": 0 } } } ], "scatterternary": [ { "type": "scatterternary", "marker": { "colorbar": { "ticks": "", "outlinewidth": 0 } } } ], "histogram2dcontour": [ { "type": "histogram2dcontour", "colorbar": { "ticks": "", "outlinewidth": 0 }, "autocolorscale": true } ] }, "layout": { "geo": { "bgcolor": "white", "showland": true, "lakecolor": "white", "landcolor": "white", "showlakes": true, "subunitcolor": "#C8D4E3" }, "font": { "color": "#2a3f5f" }, "polar": { "bgcolor": "white", "radialaxis": { "ticks": "", "gridcolor": "#EBF0F8", "linecolor": "#EBF0F8" }, "angularaxis": { "ticks": "", "gridcolor": "#EBF0F8", "linecolor": "#EBF0F8" } }, "scene": { "xaxis": { "ticks": "", "gridcolor": "#DFE8F3", "gridwidth": 2, "linecolor": "#EBF0F8", "zerolinecolor": "#EBF0F8", "showbackground": true, "backgroundcolor": "white" }, "yaxis": { "ticks": "", "gridcolor": "#DFE8F3", "gridwidth": 2, "linecolor": "#EBF0F8", "zerolinecolor": "#EBF0F8", "showbackground": true, "backgroundcolor": "white" }, "zaxis": { "ticks": "", "gridcolor": "#DFE8F3", "gridwidth": 2, "linecolor": "#EBF0F8", "zerolinecolor": "#EBF0F8", "showbackground": true, "backgroundcolor": "white" } }, "title": { "x": 0.05 }, "xaxis": { "ticks": "", "gridcolor": "#EBF0F8", "linecolor": "#EBF0F8", "automargin": true, "zerolinecolor": "#EBF0F8", "zerolinewidth": 2 }, "yaxis": { "ticks": "", "gridcolor": "#EBF0F8", "linecolor": "#EBF0F8", "automargin": true, "zerolinecolor": "#EBF0F8", "zerolinewidth": 2 }, "ternary": { "aaxis": { "ticks": "", "gridcolor": "#DFE8F3", "linecolor": "#A2B1C6" }, "baxis": { "ticks": "", "gridcolor": "#DFE8F3", "linecolor": "#A2B1C6" }, "caxis": { "ticks": "", "gridcolor": "#DFE8F3", "linecolor": "#A2B1C6" }, "bgcolor": "white" }, "colorway": [ "#636efa", "#EF553B", "#00cc96", "#ab63fa", "#19d3f3", "#e763fa", "#fecb52", "#ffa15a", "#ff6692", "#b6e880" ], "hovermode": "closest", "colorscale": { "diverging": [ [ 0, "#8e0152" ], [ 0.1, "#c51b7d" ], [ 0.2, "#de77ae" ], [ 0.3, "#f1b6da" ], [ 0.4, "#fde0ef" ], [ 0.5, "#f7f7f7" ], [ 0.6, "#e6f5d0" ], [ 0.7, "#b8e186" ], [ 0.8, "#7fbc41" ], [ 0.9, "#4d9221" ], [ 1, "#276419" ] ], "sequential": [ [ 0, "#0508b8" ], [ 0.0893854748603352, "#1910d8" ], [ 0.1787709497206704, "#3c19f0" ], [ 0.2681564245810056, "#6b1cfb" ], [ 0.3575418994413408, "#981cfd" ], [ 0.44692737430167595, "#bf1cfd" ], [ 0.5363128491620112, "#dd2bfd" ], [ 0.6256983240223464, "#f246fe" ], [ 0.7150837988826816, "#fc67fd" ], [ 0.8044692737430168, "#fe88fc" ], [ 0.8938547486033519, "#fea5fd" ], [ 0.9832402234636871, "#febefe" ], [ 1, "#fec3fe" ] ], "sequentialminus": [ [ 0, "#0508b8" ], [ 0.0893854748603352, "#1910d8" ], [ 0.1787709497206704, "#3c19f0" ], [ 0.2681564245810056, "#6b1cfb" ], [ 0.3575418994413408, "#981cfd" ], [ 0.44692737430167595, "#bf1cfd" ], [ 0.5363128491620112, "#dd2bfd" ], [ 0.6256983240223464, "#f246fe" ], [ 0.7150837988826816, "#fc67fd" ], [ 0.8044692737430168, "#fe88fc" ], [ 0.8938547486033519, "#fea5fd" ], [ 0.9832402234636871, "#febefe" ], [ 1, "#fec3fe" ] ] }, "plot_bgcolor": "white", "paper_bgcolor": "white", "shapedefaults": { "line": { "width": 0 }, "opacity": 0.4, "fillcolor": "#506784" }, "annotationdefaults": { "arrowhead": 0, "arrowcolor": "#506784", "arrowwidth": 1 } }, "themeRef": "PLOTLY_WHITE" }, "annotations": [] } }, "height": null, "width": null, "user": { "profile_url": "https://chart-studio.plotly.com/~arch1t3ctluce", "avatar_url": "https://storage.googleapis.com/plotly-prod-profiles/4.jpg", "background_url": "https://storage.googleapis.com/plotly-prod-profiles/bg-1.jpg", "bio": "", "nickname": "", "website": "", "stream_tokens": null, "feature_set_id": null, "csrf_token": null, "date_joined": "2024-04-18 17:48:46", "mapbox_access_tokens": null, "has_password": null, "username": "arch1t3ctluce", "email": null, "is_active": null, "readonly": null, "is_dash_creator": null, "dash_created_count": null, "is_chart_creator": null, "charts_created_count": null } }, { "creation_time": "2024-04-21T17:13:44.329329Z", "comments": { "results": [], "count": 0 }, "parented": true, "embed_url": "https://chart-studio.plotly.com/~arch1t3ctluce/10.embed", "fid": "arch1t3ctluce:10", "filename": "Plot 1 copy", "filetype": "plot", "img_url": "https://storage.googleapis.com/plotly-prod-images/arch1t3ctluce/10/9_30SIX2MMM902BXTMA4UQH1G5URIYMO.png", "image_urls": { "default": "https://storage.googleapis.com/plotly-prod-images/arch1t3ctluce/10/2_UAZK8OVX2S8C6DELG56Z6YKN5QMTR0.png", "block-thumb": "https://storage.googleapis.com/plotly-prod-images/arch1t3ctluce/10/8_W7EW4ROQ98YHOZFO1RXTP5S36I8EYZ.png", "list-thumb": "https://storage.googleapis.com/plotly-prod-images/arch1t3ctluce/10/9_30SIX2MMM902BXTMA4UQH1G5URIYMO.png" }, "api_urls": { "files": "https://api.plotly.com/v2/files/arch1t3ctluce:10", "plots": "https://api.plotly.com/v2/plots/arch1t3ctluce:10", "parent": "https://api.plotly.com/v2/folders/home?user=arch1t3ctluce" }, "owner": "arch1t3ctluce", "parent": -1, "preview": "", "referencers": [], "references": [], "title": "", "views": 1, "web_url": "https://chart-studio.plotly.com/~arch1t3ctluce/10/", "world_readable": true, "date_modified": "2024-04-21T21:12:33.430Z", "stars": { "results": [], "count": 0 }, "collaborators": { "results": [], "count": 0 }, "subfolder_count": null, "refresh_interval": null, "organize_view_url": "https://chart-studio.plotly.com/~arch1t3ctluce/10/", "current_user_permission": "read", "is_theme": null, "is_template": false, "autosize": true, "caption": "", "figure": { "data": [ { "uid": "40bba5", "line": { "dash": "solid" }, "meta": { "columnNames": { "x": "A", "y": "B" } }, "mode": "lines", "name": "RCP2.6 control run", "type": "scatter", "xsrc": "arch1t3ctluce:9:779ac9", "ysrc": "arch1t3ctluce:9:37afc7" }, { "uid": "eefc11", "line": { "dash": "dot", "color": "rgb(8, 32, 160)" }, "meta": { "columnNames": { "x": "A", "y": "C" } }, "mode": "lines", "name": "Snow DDF adjusted by -0.001", "type": "scatter", "xsrc": "arch1t3ctluce:9:779ac9", "ysrc": "arch1t3ctluce:9:243c08", "xaxis": "x", "yaxis": "y", "stackgroup": null }, { "uid": "46278e", "fill": "tonexty", "line": { "dash": "dot", "color": "rgb(146, 165, 207)" }, "meta": { "columnNames": { "x": "A", "y": "D" } }, "mode": "lines", "name": "Snow DDF adjusted by +0.001", "type": "scatter", "xsrc": "arch1t3ctluce:9:779ac9", "ysrc": "arch1t3ctluce:9:8c2942", "visible": true }, { "line": { "dash": "dot", "color": "rgb(76, 184, 20)" }, "meta": { "columnNames": { "x": "A", "y": "E" } }, "mode": "lines", "name": "Ice DDF adjusted by -0.001", "type": "scatter", "xsrc": "arch1t3ctluce:9:779ac9", "ysrc": "arch1t3ctluce:9:39df86", "stackgroup": null }, { "fill": "tonexty", "line": { "dash": "dot", "color": "rgb(228, 255, 173)" }, "meta": { "columnNames": { "x": "A", "y": "F" } }, "mode": "lines", "name": "Ice DDF adjusted by +0.001", "type": "scatter", "xsrc": "arch1t3ctluce:9:779ac9", "ysrc": "arch1t3ctluce:9:f1ae2b", "stackgroup": null } ], "frames": [], "layout": { "title": { "text": "Glacier volume projected to 2100 under adjusted snow and ice DDFs, assuming RCP2.6" }, "xaxis": { "type": "linear", "range": [ 2030, 2100 ], "title": { "text": "Year" }, "autorange": true }, "yaxis": { "type": "linear", "range": [ -0.01575888888888889, 0.2994188888888889 ], "title": { "text": "Glacier Volume (km3)" }, "autorange": true }, "shapes": [ { "x0": 2070, "x1": 2075, "y0": 0, "y1": 0.3, "line": { "color": "rgb(168, 200, 227)", "width": 0 }, "type": "rect", "yref": "y", "opacity": 0.3, "visible": false, "fillcolor": "rgb(147, 184, 222)" }, { "x0": 2090, "x1": 2095, "y0": 0, "y1": 0.3, "line": { "color": "rgb(31, 61, 238)", "width": 0 }, "type": "rect", "opacity": 0.3, "visible": false, "fillcolor": "rgb(31, 61, 238)" } ], "autosize": true, "dragmode": "pan", "template": { "data": { "bar": [ { "type": "bar", "marker": { "colorbar": { "ticks": "", "outlinewidth": 0 } } } ], "table": [ { "type": "table", "cells": { "fill": { "color": "#EBF0F8" }, "line": { "color": "white" } }, "header": { "fill": { "color": "#C8D4E3" }, "line": { "color": "white" } } } ], "carpet": [ { "type": "carpet", "aaxis": { "gridcolor": "#C8D4E3", "linecolor": "#C8D4E3", "endlinecolor": "#2a3f5f", "minorgridcolor": "#C8D4E3", "startlinecolor": "#2a3f5f" }, "baxis": { "gridcolor": "#C8D4E3", "linecolor": "#C8D4E3", "endlinecolor": "#2a3f5f", "minorgridcolor": "#C8D4E3", "startlinecolor": "#2a3f5f" } } ], "mesh3d": [ { "type": "mesh3d", "colorbar": { "ticks": "", "outlinewidth": 0 } } ], "contour": [ { "type": "contour", "colorbar": { "ticks": "", "outlinewidth": 0 }, "autocolorscale": true } ], "heatmap": [ { "type": "heatmap", "colorbar": { "ticks": "", "outlinewidth": 0 }, "autocolorscale": true } ], "scatter": [ { "type": "scatter", "marker": { "colorbar": { "ticks": "", "outlinewidth": 0 } } } ], "surface": [ { "type": "surface", "colorbar": { "ticks": "", "outlinewidth": 0 } } ], "heatmapgl": [ { "type": "heatmapgl", "colorbar": { "ticks": "", "outlinewidth": 0 } } ], "histogram": [ { "type": "histogram", "marker": { "colorbar": { "ticks": "", "outlinewidth": 0 } } } ], "parcoords": [ { "line": { "colorbar": { "ticks": "", "outlinewidth": 0 } }, "type": "parcoords" } ], "scatter3d": [ { "type": "scatter3d", "marker": { "colorbar": { "ticks": "", "outlinewidth": 0 } } } ], "scattergl": [ { "type": "scattergl", "marker": { "colorbar": { "ticks": "", "outlinewidth": 0 } } } ], "choropleth": [ { "type": "choropleth", "colorbar": { "ticks": "", "outlinewidth": 0 } } ], "scattergeo": [ { "type": "scattergeo", "marker": { "colorbar": { "ticks": "", "outlinewidth": 0 } } } ], "histogram2d": [ { "type": "histogram2d", "colorbar": { "ticks": "", "outlinewidth": 0 }, "autocolorscale": true } ], "scatterpolar": [ { "type": "scatterpolar", "marker": { "colorbar": { "ticks": "", "outlinewidth": 0 } } } ], "contourcarpet": [ { "type": "contourcarpet", "colorbar": { "ticks": "", "outlinewidth": 0 } } ], "scattercarpet": [ { "type": "scattercarpet", "marker": { "colorbar": { "ticks": "", "outlinewidth": 0 } } } ], "scattermapbox": [ { "type": "scattermapbox", "marker": { "colorbar": { "ticks": "", "outlinewidth": 0 } } } ], "scatterpolargl": [ { "type": "scatterpolargl", "marker": { "colorbar": { "ticks": "", "outlinewidth": 0 } } } ], "scatterternary": [ { "type": "scatterternary", "marker": { "colorbar": { "ticks": "", "outlinewidth": 0 } } } ], "histogram2dcontour": [ { "type": "histogram2dcontour", "colorbar": { "ticks": "", "outlinewidth": 0 }, "autocolorscale": true } ] }, "layout": { "geo": { "bgcolor": "white", "showland": true, "lakecolor": "white", "landcolor": "white", "showlakes": true, "subunitcolor": "#C8D4E3" }, "font": { "color": "#2a3f5f" }, "polar": { "bgcolor": "white", "radialaxis": { "ticks": "", "gridcolor": "#EBF0F8", "linecolor": "#EBF0F8" }, "angularaxis": { "ticks": "", "gridcolor": "#EBF0F8", "linecolor": "#EBF0F8" } }, "scene": { "xaxis": { "ticks": "", "gridcolor": "#DFE8F3", "gridwidth": 2, "linecolor": "#EBF0F8", "zerolinecolor": "#EBF0F8", "showbackground": true, "backgroundcolor": "white" }, "yaxis": { "ticks": "", "gridcolor": "#DFE8F3", "gridwidth": 2, "linecolor": "#EBF0F8", "zerolinecolor": "#EBF0F8", "showbackground": true, "backgroundcolor": "white" }, "zaxis": { "ticks": "", "gridcolor": "#DFE8F3", "gridwidth": 2, "linecolor": "#EBF0F8", "zerolinecolor": "#EBF0F8", "showbackground": true, "backgroundcolor": "white" } }, "title": { "x": 0.05 }, "xaxis": { "ticks": "", "gridcolor": "#EBF0F8", "linecolor": "#EBF0F8", "automargin": true, "zerolinecolor": "#EBF0F8", "zerolinewidth": 2 }, "yaxis": { "ticks": "", "gridcolor": "#EBF0F8", "linecolor": "#EBF0F8", "automargin": true, "zerolinecolor": "#EBF0F8", "zerolinewidth": 2 }, "ternary": { "aaxis": { "ticks": "", "gridcolor": "#DFE8F3", "linecolor": "#A2B1C6" }, "baxis": { "ticks": "", "gridcolor": "#DFE8F3", "linecolor": "#A2B1C6" }, "caxis": { "ticks": "", "gridcolor": "#DFE8F3", "linecolor": "#A2B1C6" }, "bgcolor": "white" }, "colorway": [ "#636efa", "#EF553B", "#00cc96", "#ab63fa", "#19d3f3", "#e763fa", "#fecb52", "#ffa15a", "#ff6692", "#b6e880" ], "hovermode": "closest", "colorscale": { "diverging": [ [ 0, "#8e0152" ], [ 0.1, "#c51b7d" ], [ 0.2, "#de77ae" ], [ 0.3, "#f1b6da" ], [ 0.4, "#fde0ef" ], [ 0.5, "#f7f7f7" ], [ 0.6, "#e6f5d0" ], [ 0.7, "#b8e186" ], [ 0.8, "#7fbc41" ], [ 0.9, "#4d9221" ], [ 1, "#276419" ] ], "sequential": [ [ 0, "#0508b8" ], [ 0.0893854748603352, "#1910d8" ], [ 0.1787709497206704, "#3c19f0" ], [ 0.2681564245810056, "#6b1cfb" ], [ 0.3575418994413408, "#981cfd" ], [ 0.44692737430167595, "#bf1cfd" ], [ 0.5363128491620112, "#dd2bfd" ], [ 0.6256983240223464, "#f246fe" ], [ 0.7150837988826816, "#fc67fd" ], [ 0.8044692737430168, "#fe88fc" ], [ 0.8938547486033519, "#fea5fd" ], [ 0.9832402234636871, "#febefe" ], [ 1, "#fec3fe" ] ], "sequentialminus": [ [ 0, "#0508b8" ], [ 0.0893854748603352, "#1910d8" ], [ 0.1787709497206704, "#3c19f0" ], [ 0.2681564245810056, "#6b1cfb" ], [ 0.3575418994413408, "#981cfd" ], [ 0.44692737430167595, "#bf1cfd" ], [ 0.5363128491620112, "#dd2bfd" ], [ 0.6256983240223464, "#f246fe" ], [ 0.7150837988826816, "#fc67fd" ], [ 0.8044692737430168, "#fe88fc" ], [ 0.8938547486033519, "#fea5fd" ], [ 0.9832402234636871, "#febefe" ], [ 1, "#fec3fe" ] ] }, "plot_bgcolor": "white", "paper_bgcolor": "white", "shapedefaults": { "line": { "width": 0 }, "opacity": 0.4, "fillcolor": "#506784" }, "annotationdefaults": { "arrowhead": 0, "arrowcolor": "#506784", "arrowwidth": 1 } }, "themeRef": "PLOTLY_WHITE" }, "colorscale": { "diverging": [ [ 0, "#9e0142" ], [ 0.1, "#d53e4f" ], [ 0.2, "#f46d43" ], [ 0.3, "#fdae61" ], [ 0.4, "#fee08b" ], [ 0.5, "#ffffbf" ], [ 0.6, "#e6f598" ], [ 0.7, "#abdda4" ], [ 0.8, "#66c2a5" ], [ 0.9, "#3288bd" ], [ 1, "#5e4fa2" ] ] } } }, "height": null, "width": null, "user": { "profile_url": "https://chart-studio.plotly.com/~arch1t3ctluce", "avatar_url": "https://storage.googleapis.com/plotly-prod-profiles/4.jpg", "background_url": "https://storage.googleapis.com/plotly-prod-profiles/bg-1.jpg", "bio": "", "nickname": "", "website": "", "stream_tokens": null, "feature_set_id": null, "csrf_token": null, "date_joined": "2024-04-18 17:48:46", "mapbox_access_tokens": null, "has_password": null, "username": "arch1t3ctluce", "email": null, "is_active": null, "readonly": null, "is_dash_creator": null, "dash_created_count": null, "is_chart_creator": null, "charts_created_count": null } }, { "creation_time": "2024-04-21T17:13:30.841863Z", "comments": { "results": [], "count": 0 }, "parented": true, "embed_url": "https://chart-studio.plotly.com/~arch1t3ctluce/8.embed", "fid": "arch1t3ctluce:8", "filename": "Plot 5 copy", "filetype": "plot", "img_url": "https://storage.googleapis.com/plotly-prod-images/arch1t3ctluce/8/9_1R0QRUUJDAJVKUPKXYIS7UO62QKW9H.png", "image_urls": { "default": "https://storage.googleapis.com/plotly-prod-images/arch1t3ctluce/8/2_XSLG07HIRXYGQUVZT7Q7BMX9X7QGTI.png", "block-thumb": "https://storage.googleapis.com/plotly-prod-images/arch1t3ctluce/8/8_XCSSEEJGK0RJXL6KJZGR50OSNOCC80.png", "list-thumb": "https://storage.googleapis.com/plotly-prod-images/arch1t3ctluce/8/9_1R0QRUUJDAJVKUPKXYIS7UO62QKW9H.png" }, "api_urls": { "files": "https://api.plotly.com/v2/files/arch1t3ctluce:8", "plots": "https://api.plotly.com/v2/plots/arch1t3ctluce:8", "parent": "https://api.plotly.com/v2/folders/home?user=arch1t3ctluce" }, "owner": "arch1t3ctluce", "parent": -1, "preview": "", "referencers": [], "references": [], "title": "", "views": 1, "web_url": "https://chart-studio.plotly.com/~arch1t3ctluce/8/", "world_readable": true, "date_modified": "2024-04-21T21:25:05.828Z", "stars": { "results": [], "count": 0 }, "collaborators": { "results": [], "count": 0 }, "subfolder_count": null, "refresh_interval": null, "organize_view_url": "https://chart-studio.plotly.com/~arch1t3ctluce/8/", "current_user_permission": "read", "is_theme": null, "is_template": false, "autosize": true, "caption": "", "figure": { "data": [ { "line": { "color": "rgb(250, 207, 99)" }, "meta": { "columnNames": { "x": "A", "y": "B" } }, "mode": "lines", "name": "RCP4.5 control run", "type": "scatter", "xsrc": "arch1t3ctluce:7:ee94aa", "ysrc": "arch1t3ctluce:7:f1d92b" }, { "line": { "dash": "dot", "color": "rgb(189, 136, 0)" }, "meta": { "columnNames": { "x": "A", "y": "C" } }, "mode": "lines", "name": "Snow DDF adjusted by -0.001", "type": "scatter", "xsrc": "arch1t3ctluce:7:ee94aa", "ysrc": "arch1t3ctluce:7:e50ec9" }, { "fill": "tonexty", "line": { "dash": "dot", "color": "rgb(255, 235, 183)" }, "meta": { "columnNames": { "x": "A", "y": "D" } }, "mode": "lines", "name": "Snow DDF adjusted by +0.001", "type": "scatter", "xsrc": "arch1t3ctluce:7:ee94aa", "ysrc": "arch1t3ctluce:7:62f392", "fillcolor": "rgba(247, 182, 10, 0.5)", "stackgroup": null }, { "line": { "dash": "dot", "color": "rgb(239, 136, 27)", "width": 2 }, "meta": { "columnNames": { "x": "A", "y": "E" } }, "mode": "lines", "name": "Ice DDF adjusted by -0.001", "type": "scatter", "xsrc": "arch1t3ctluce:7:ee94aa", "ysrc": "arch1t3ctluce:7:70bbbf", "stackgroup": null }, { "fill": "tonexty", "line": { "dash": "dot", "color": "rgb(252, 196, 119)" }, "meta": { "columnNames": { "x": "A", "y": "F" } }, "mode": "lines", "name": "Ice DDF adjusted by +0.001", "type": "scatter", "xsrc": "arch1t3ctluce:7:ee94aa", "ysrc": "arch1t3ctluce:7:afe73e", "fillcolor": "rgba(252, 234, 211, 0.5)", "stackgroup": null } ], "frames": [], "layout": { "title": { "text": "Glacier volume projected to 2100 under adjusted snow and ice DDFs, assuming RCP4.5" }, "xaxis": { "type": "linear", "range": [ 2030, 2100 ], "title": { "text": "Year" }, "autorange": true }, "yaxis": { "type": "linear", "range": [ -0.014025555555555557, 0.2664855555555556 ], "title": { "text": "Glacier Volume (km3)" }, "autorange": true }, "shapes": [ { "x0": 2065, "x1": 2070, "y0": 0, "y1": 0.26, "line": { "color": "#444444" }, "opacity": 0.5, "visible": false, "fillcolor": "rgb(250, 207, 99)" }, { "x0": 2075, "x1": 2080, "y0": 0, "y1": 0.26, "line": { "color": "#444444" }, "opacity": 0.3, "visible": false, "fillcolor": "rgb(186, 135, 7)" }, { "x0": 2060, "x1": 2065, "y0": 0, "y1": 0.26, "line": { "color": "#444444" }, "opacity": 0.3, "visible": false, "fillcolor": "rgb(255, 235, 183)" } ], "autosize": true, "template": { "data": { "bar": [ { "type": "bar", "marker": { "colorbar": { "ticks": "", "outlinewidth": 0 } } } ], "table": [ { "type": "table", "cells": { "fill": { "color": "#EBF0F8" }, "line": { "color": "white" } }, "header": { "fill": { "color": "#C8D4E3" }, "line": { "color": "white" } } } ], "carpet": [ { "type": "carpet", "aaxis": { "gridcolor": "#C8D4E3", "linecolor": "#C8D4E3", "endlinecolor": "#2a3f5f", "minorgridcolor": "#C8D4E3", "startlinecolor": "#2a3f5f" }, "baxis": { "gridcolor": "#C8D4E3", "linecolor": "#C8D4E3", "endlinecolor": "#2a3f5f", "minorgridcolor": "#C8D4E3", "startlinecolor": "#2a3f5f" } } ], "mesh3d": [ { "type": "mesh3d", "colorbar": { "ticks": "", "outlinewidth": 0 } } ], "contour": [ { "type": "contour", "colorbar": { "ticks": "", "outlinewidth": 0 }, "autocolorscale": true } ], "heatmap": [ { "type": "heatmap", "colorbar": { "ticks": "", "outlinewidth": 0 }, "autocolorscale": true } ], "scatter": [ { "type": "scatter", "marker": { "colorbar": { "ticks": "", "outlinewidth": 0 } } } ], "surface": [ { "type": "surface", "colorbar": { "ticks": "", "outlinewidth": 0 } } ], "heatmapgl": [ { "type": "heatmapgl", "colorbar": { "ticks": "", "outlinewidth": 0 } } ], "histogram": [ { "type": "histogram", "marker": { "colorbar": { "ticks": "", "outlinewidth": 0 } } } ], "parcoords": [ { "line": { "colorbar": { "ticks": "", "outlinewidth": 0 } }, "type": "parcoords" } ], "scatter3d": [ { "type": "scatter3d", "marker": { "colorbar": { "ticks": "", "outlinewidth": 0 } } } ], "scattergl": [ { "type": "scattergl", "marker": { "colorbar": { "ticks": "", "outlinewidth": 0 } } } ], "choropleth": [ { "type": "choropleth", "colorbar": { "ticks": "", "outlinewidth": 0 } } ], "scattergeo": [ { "type": "scattergeo", "marker": { "colorbar": { "ticks": "", "outlinewidth": 0 } } } ], "histogram2d": [ { "type": "histogram2d", "colorbar": { "ticks": "", "outlinewidth": 0 }, "autocolorscale": true } ], "scatterpolar": [ { "type": "scatterpolar", "marker": { "colorbar": { "ticks": "", "outlinewidth": 0 } } } ], "contourcarpet": [ { "type": "contourcarpet", "colorbar": { "ticks": "", "outlinewidth": 0 } } ], "scattercarpet": [ { "type": "scattercarpet", "marker": { "colorbar": { "ticks": "", "outlinewidth": 0 } } } ], "scattermapbox": [ { "type": "scattermapbox", "marker": { "colorbar": { "ticks": "", "outlinewidth": 0 } } } ], "scatterpolargl": [ { "type": "scatterpolargl", "marker": { "colorbar": { "ticks": "", "outlinewidth": 0 } } } ], "scatterternary": [ { "type": "scatterternary", "marker": { "colorbar": { "ticks": "", "outlinewidth": 0 } } } ], "histogram2dcontour": [ { "type": "histogram2dcontour", "colorbar": { "ticks": "", "outlinewidth": 0 }, "autocolorscale": true } ] }, "layout": { "geo": { "bgcolor": "white", "showland": true, "lakecolor": "white", "landcolor": "white", "showlakes": true, "subunitcolor": "#C8D4E3" }, "font": { "color": "#2a3f5f" }, "polar": { "bgcolor": "white", "radialaxis": { "ticks": "", "gridcolor": "#EBF0F8", "linecolor": "#EBF0F8" }, "angularaxis": { "ticks": "", "gridcolor": "#EBF0F8", "linecolor": "#EBF0F8" } }, "scene": { "xaxis": { "ticks": "", "gridcolor": "#DFE8F3", "gridwidth": 2, "linecolor": "#EBF0F8", "zerolinecolor": "#EBF0F8", "showbackground": true, "backgroundcolor": "white" }, "yaxis": { "ticks": "", "gridcolor": "#DFE8F3", "gridwidth": 2, "linecolor": "#EBF0F8", "zerolinecolor": "#EBF0F8", "showbackground": true, "backgroundcolor": "white" }, "zaxis": { "ticks": "", "gridcolor": "#DFE8F3", "gridwidth": 2, "linecolor": "#EBF0F8", "zerolinecolor": "#EBF0F8", "showbackground": true, "backgroundcolor": "white" } }, "title": { "x": 0.05 }, "xaxis": { "ticks": "", "gridcolor": "#EBF0F8", "linecolor": "#EBF0F8", "automargin": true, "zerolinecolor": "#EBF0F8", "zerolinewidth": 2 }, "yaxis": { "ticks": "", "gridcolor": "#EBF0F8", "linecolor": "#EBF0F8", "automargin": true, "zerolinecolor": "#EBF0F8", "zerolinewidth": 2 }, "ternary": { "aaxis": { "ticks": "", "gridcolor": "#DFE8F3", "linecolor": "#A2B1C6" }, "baxis": { "ticks": "", "gridcolor": "#DFE8F3", "linecolor": "#A2B1C6" }, "caxis": { "ticks": "", "gridcolor": "#DFE8F3", "linecolor": "#A2B1C6" }, "bgcolor": "white" }, "colorway": [ "#636efa", "#EF553B", "#00cc96", "#ab63fa", "#19d3f3", "#e763fa", "#fecb52", "#ffa15a", "#ff6692", "#b6e880" ], "hovermode": "closest", "colorscale": { "diverging": [ [ 0, "#8e0152" ], [ 0.1, "#c51b7d" ], [ 0.2, "#de77ae" ], [ 0.3, "#f1b6da" ], [ 0.4, "#fde0ef" ], [ 0.5, "#f7f7f7" ], [ 0.6, "#e6f5d0" ], [ 0.7, "#b8e186" ], [ 0.8, "#7fbc41" ], [ 0.9, "#4d9221" ], [ 1, "#276419" ] ], "sequential": [ [ 0, "#0508b8" ], [ 0.0893854748603352, "#1910d8" ], [ 0.1787709497206704, "#3c19f0" ], [ 0.2681564245810056, "#6b1cfb" ], [ 0.3575418994413408, "#981cfd" ], [ 0.44692737430167595, "#bf1cfd" ], [ 0.5363128491620112, "#dd2bfd" ], [ 0.6256983240223464, "#f246fe" ], [ 0.7150837988826816, "#fc67fd" ], [ 0.8044692737430168, "#fe88fc" ], [ 0.8938547486033519, "#fea5fd" ], [ 0.9832402234636871, "#febefe" ], [ 1, "#fec3fe" ] ], "sequentialminus": [ [ 0, "#0508b8" ], [ 0.0893854748603352, "#1910d8" ], [ 0.1787709497206704, "#3c19f0" ], [ 0.2681564245810056, "#6b1cfb" ], [ 0.3575418994413408, "#981cfd" ], [ 0.44692737430167595, "#bf1cfd" ], [ 0.5363128491620112, "#dd2bfd" ], [ 0.6256983240223464, "#f246fe" ], [ 0.7150837988826816, "#fc67fd" ], [ 0.8044692737430168, "#fe88fc" ], [ 0.8938547486033519, "#fea5fd" ], [ 0.9832402234636871, "#febefe" ], [ 1, "#fec3fe" ] ] }, "plot_bgcolor": "white", "paper_bgcolor": "white", "shapedefaults": { "line": { "width": 0 }, "opacity": 0.4, "fillcolor": "#506784" }, "annotationdefaults": { "arrowhead": 0, "arrowcolor": "#506784", "arrowwidth": 1 } }, "themeRef": "PLOTLY_WHITE" } } }, "height": null, "width": null, "user": { "profile_url": "https://chart-studio.plotly.com/~arch1t3ctluce", "avatar_url": "https://storage.googleapis.com/plotly-prod-profiles/4.jpg", "background_url": "https://storage.googleapis.com/plotly-prod-profiles/bg-1.jpg", "bio": "", "nickname": "", "website": "", "stream_tokens": null, "feature_set_id": null, "csrf_token": null, "date_joined": "2024-04-18 17:48:46", "mapbox_access_tokens": null, "has_password": null, "username": "arch1t3ctluce", "email": null, "is_active": null, "readonly": null, "is_dash_creator": null, "dash_created_count": null, "is_chart_creator": null, "charts_created_count": null } } ] }
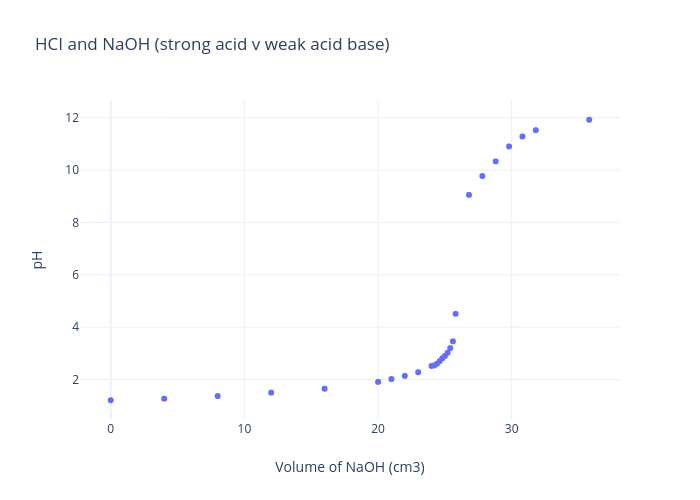