Plots


Jump to API response

This endpoint handles manipulation of Plotly plot files.

Reference

Authorization


Any user with or without a Plotly account may view public plots. For private plots, see authentication.

Actions


list

Listing all public plots can be done via a GET request to this endpoint. By default, plots will be listed in order of date created. The order_by query parameter is accepted at this endpoint. Currently, only ordering by views is supported. It is possible to filter the plots by quality with min_quality or max_quality as query parameter.

Example:

// GET https://api.plotly.com/v2/plots/ ---> 200

// GET https://api.plotly.com/v2/plots/?order_by=-views ---> 200

// GET https://api.plotly.com/v2/plots/?min_quality=5 ---> 200

// GET https://api.plotly.com/v2/plots/?max_quality=5 ---> 200

feed

Listing all handpicked feed plots can be done via a GET request to this endpoint. By default, plots will be listed in a random order.

Example:

// GET https://api.plotly.com/v2/plots/feed ---> 200

create

You can create new plot resources here. The only required field is 'figure'. Currently, the figure is restricted to only contain references to grid data. That is, this will fail if raw data arrays are passed in. To create and manipulate underlying grids for plots, see the grids endpoint.

Example:

// This fails because a figure field is required.
// POST https://api.plotly.com/v2/plots ---> 400 Bad Request
{}

// This fails because the figure has raw data
//POST https://api.plotly.com/v2/plots ---> 400 Bad Request
{
    "figure": {"data": [{"y": ['this', 'is', 'raw', 'data']}]}
}

// This succeeds because the figure has src keys, not raw data.
//POST https://api.plotly.com/v2/plots ---> 200 OK
{
    "figure": {"data": [{"ysrc": "sven:88:u8nd62"}]}
}

When creating a grid, you can optionally specify a source_fid to specify where a plot has come from:

  • source_fid: the fid of a plot that was copied (and presumably edited) to produce this one

detail

There is a lot of meta information stored about plot files including filename, title, share_url, and content_url to name a few.

This information can only be reached with a GET to this endpoint.

Example:

// GET https://api.plotly.com/v2/plots/iheartgraphs:90

content

The contents of a plot can be downloaded via the content resource. The plot content contains referenced grid/column data by default. If you wish to return the raw grid/column data, the inline_data=true query must be included in the request url. The Content-Type header will be appropriately set for the response body.

Alternatively, you can set ?map_data=unreadable to append a mapping of sources to data that belongs to grids which are unreadable for the requestor. This is useful when you have read access to another users plot, but that plot contains grid references which you don't have access to.

Examples:

// Returns referenced grid/column data
// GET https://api.plotly.com/v2/plots/iheartgraphs:90/content ---> 200 OK

// Returns full grid/column data
// GET https://api.plotly.com/v2/plots/iheartgraphs:90/content?inline_data=true ---> 200 OK

// Returns full grid/column data when requestor doesn't have permission
// to read the referenced grid.
// GET https://api.plotly.com/v2/plots/iheartgraphs:90/content?map_data=unreadable ---> 200 OK

GET /v2/plots?cursor=cD0yMDI0LTA0LTIxKzEwJTNBMDclM0E1Ni45NzgzMDQlMkIwMCUzQTAw&format=api
HTTP 200 OK
Allow: GET, POST, HEAD, OPTIONS
Content-Type: application/json
Vary: Accept

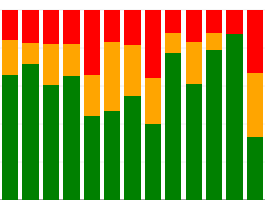
{
    "next": "https://api.plotly.com/v2/plots?cursor=cD0yMDI0LTA0LTIxKzA4JTNBNTYlM0E0NS40ODAyMzIlMkIwMCUzQTAw&format=api",
    "previous": "https://api.plotly.com/v2/plots?cursor=cj0xJnA9MjAyNC0wNC0yMSsxMCUzQTA3JTNBMzYuNzgxMzExJTJCMDAlM0EwMA%3D%3D&format=api",
    "results": [
        {
            "creation_time": "2024-04-21T10:07:36.781311Z",
            "comments": {
                "results": [],
                "count": 0
            },
            "parented": true,
            "embed_url": "https://chart-studio.plotly.com/~ShengYan/74.embed",
            "fid": "ShengYan:74",
            "filename": "Design method evaluation",
            "filetype": "plot",
            "img_url": "https://storage.googleapis.com/plotly-prod-images/ShengYan/74/9_Z9ON00WCDCYOZLH7FTV42XHSBFDZ4L.png",
            "image_urls": {
                "default": "https://storage.googleapis.com/plotly-prod-images/ShengYan/74/2_6UNCFRFVWHNZ5ZTKWFQ71IWUZ70QB2.png",
                "block-thumb": "https://storage.googleapis.com/plotly-prod-images/ShengYan/74/8_BM9XCQQL3C0VTIPLRUX6XNKKLQ3I93.png",
                "list-thumb": "https://storage.googleapis.com/plotly-prod-images/ShengYan/74/9_Z9ON00WCDCYOZLH7FTV42XHSBFDZ4L.png"
            },
            "api_urls": {
                "files": "https://api.plotly.com/v2/files/ShengYan:74",
                "plots": "https://api.plotly.com/v2/plots/ShengYan:74",
                "parent": "https://api.plotly.com/v2/folders/home?user=ShengYan"
            },
            "owner": "ShengYan",
            "parent": -1,
            "preview": "",
            "referencers": [],
            "references": [],
            "title": "",
            "views": 22,
            "web_url": "https://chart-studio.plotly.com/~ShengYan/74/",
            "world_readable": true,
            "date_modified": "2024-04-21T10:11:50.670Z",
            "stars": {
                "results": [],
                "count": 0
            },
            "collaborators": {
                "results": [],
                "count": 0
            },
            "subfolder_count": null,
            "refresh_interval": null,
            "organize_view_url": "https://chart-studio.plotly.com/~ShengYan/74/",
            "current_user_permission": "read",
            "is_theme": null,
            "is_template": null,
            "autosize": true,
            "caption": "",
            "figure": {
                "data": [
                    {
                        "mode": "lines",
                        "name": "Terminal designs based on<br>ex-post traffic simulations",
                        "type": "scatter",
                        "xsrc": "ShengYan:79:118e37",
                        "ysrc": "ShengYan:79:6e405a",
                        "xaxis": "x",
                        "yaxis": "y",
                        "marker": {
                            "color": "rgba(55, 83, 109, 1)"
                        },
                        "showlegend": true,
                        "legendgroup": "Terminal designs based on<br>ex-post traffic simulations"
                    },
                    {
                        "mode": "lines",
                        "name": "Terminal designs based on<br>ex-ante traffic projections",
                        "type": "scatter",
                        "xsrc": "ShengYan:79:f728cb",
                        "ysrc": "ShengYan:79:516480",
                        "xaxis": "x",
                        "yaxis": "y",
                        "marker": {
                            "color": "rgb(214, 39, 40)"
                        },
                        "showlegend": true,
                        "legendgroup": "Terminal designs based on<br>ex-ante traffic projections"
                    },
                    {
                        "mode": "markers",
                        "name": "Terminal designs based on<br>ex-post traffic simulations",
                        "type": "scatter",
                        "xsrc": "ShengYan:79:7b07d9",
                        "ysrc": "ShengYan:79:4d119d",
                        "xaxis": "x",
                        "yaxis": "y2",
                        "marker": {
                            "color": "rgba(55, 83, 109, 1)",
                            "symbol": "line-ns-open"
                        },
                        "showlegend": false,
                        "legendgroup": "Terminal designs based on<br>ex-post traffic simulations"
                    },
                    {
                        "mode": "markers",
                        "name": "Terminal designs based on<br>ex-ante traffic projections",
                        "type": "scatter",
                        "xsrc": "ShengYan:79:b3f2d1",
                        "ysrc": "ShengYan:79:b8ae41",
                        "xaxis": "x",
                        "yaxis": "y2",
                        "marker": {
                            "color": "rgb(214, 39, 40)",
                            "symbol": "line-ns-open"
                        },
                        "showlegend": false,
                        "legendgroup": "Terminal designs based on<br>ex-ante traffic projections"
                    }
                ],
                "layout": {
                    "title": {
                        "text": "Evaluation of the method based on forecasts"
                    },
                    "xaxis": {
                        "range": [
                            20000000,
                            70000000
                        ],
                        "title": {
                            "text": "Project NPV"
                        },
                        "anchor": "y2",
                        "domain": [
                            0.0,
                            1.0
                        ],
                        "zeroline": false,
                        "tickprefix": "$"
                    },
                    "yaxis": {
                        "ticks": "",
                        "title": {
                            "text": "Probability distribution (%)"
                        },
                        "anchor": "free",
                        "domain": [
                            0.35,
                            1
                        ],
                        "position": 0.0,
                        "showgrid": true,
                        "showline": true,
                        "zeroline": true,
                        "autorange": true,
                        "showticklabels": false
                    },
                    "legend": {
                        "x": 0.78,
                        "y": 1,
                        "traceorder": "reversed"
                    },
                    "shapes": [
                        {
                            "x0": 43710227.428571425,
                            "x1": 43710227.428571425,
                            "y0": 0.36,
                            "y1": 0.65,
                            "line": {
                                "dash": "dot",
                                "color": "rgba(55, 83, 109, 1)",
                                "width": 2
                            },
                            "type": "line",
                            "yref": "paper"
                        },
                        {
                            "x0": 43710227.428571425,
                            "x1": 43710227.428571425,
                            "y0": 0.75,
                            "y1": 1,
                            "line": {
                                "dash": "dot",
                                "color": "rgba(55, 83, 109, 1)",
                                "width": 2
                            },
                            "type": "line",
                            "yref": "paper"
                        },
                        {
                            "x0": 43288369.7475083,
                            "x1": 43288369.7475083,
                            "y0": 0.36,
                            "y1": 0.65,
                            "line": {
                                "dash": "dot",
                                "color": "rgb(214, 39, 40)",
                                "width": 2
                            },
                            "type": "line",
                            "yref": "paper"
                        },
                        {
                            "x0": 43288369.7475083,
                            "x1": 43288369.7475083,
                            "y0": 0.74,
                            "y1": 1,
                            "line": {
                                "dash": "dot",
                                "color": "rgb(214, 39, 40)",
                                "width": 2
                            },
                            "type": "line",
                            "yref": "paper"
                        }
                    ],
                    "yaxis2": {
                        "dtick": 1,
                        "anchor": "x",
                        "domain": [
                            0,
                            0.25
                        ],
                        "showticklabels": false
                    },
                    "barmode": "overlay",
                    "template": {
                        "data": {
                            "bar": [
                                {
                                    "type": "bar",
                                    "marker": {
                                        "line": {
                                            "color": "rgb(17,17,17)",
                                            "width": 0.5
                                        },
                                        "pattern": {
                                            "size": 10,
                                            "fillmode": "overlay",
                                            "solidity": 0.2
                                        }
                                    },
                                    "error_x": {
                                        "color": "#f2f5fa"
                                    },
                                    "error_y": {
                                        "color": "#f2f5fa"
                                    }
                                }
                            ],
                            "pie": [
                                {
                                    "type": "pie",
                                    "automargin": true
                                }
                            ],
                            "table": [
                                {
                                    "type": "table",
                                    "cells": {
                                        "fill": {
                                            "color": "#506784"
                                        },
                                        "line": {
                                            "color": "rgb(17,17,17)"
                                        }
                                    },
                                    "header": {
                                        "fill": {
                                            "color": "#2a3f5f"
                                        },
                                        "line": {
                                            "color": "rgb(17,17,17)"
                                        }
                                    }
                                }
                            ],
                            "carpet": [
                                {
                                    "type": "carpet",
                                    "aaxis": {
                                        "gridcolor": "#506784",
                                        "linecolor": "#506784",
                                        "endlinecolor": "#A2B1C6",
                                        "minorgridcolor": "#506784",
                                        "startlinecolor": "#A2B1C6"
                                    },
                                    "baxis": {
                                        "gridcolor": "#506784",
                                        "linecolor": "#506784",
                                        "endlinecolor": "#A2B1C6",
                                        "minorgridcolor": "#506784",
                                        "startlinecolor": "#A2B1C6"
                                    }
                                }
                            ],
                            "mesh3d": [
                                {
                                    "type": "mesh3d",
                                    "colorbar": {
                                        "ticks": "",
                                        "outlinewidth": 0
                                    }
                                }
                            ],
                            "contour": [
                                {
                                    "type": "contour",
                                    "colorbar": {
                                        "ticks": "",
                                        "outlinewidth": 0
                                    },
                                    "colorscale": [
                                        [
                                            0.0,
                                            "#0d0887"
                                        ],
                                        [
                                            0.1111111111111111,
                                            "#46039f"
                                        ],
                                        [
                                            0.2222222222222222,
                                            "#7201a8"
                                        ],
                                        [
                                            0.3333333333333333,
                                            "#9c179e"
                                        ],
                                        [
                                            0.4444444444444444,
                                            "#bd3786"
                                        ],
                                        [
                                            0.5555555555555556,
                                            "#d8576b"
                                        ],
                                        [
                                            0.6666666666666666,
                                            "#ed7953"
                                        ],
                                        [
                                            0.7777777777777778,
                                            "#fb9f3a"
                                        ],
                                        [
                                            0.8888888888888888,
                                            "#fdca26"
                                        ],
                                        [
                                            1.0,
                                            "#f0f921"
                                        ]
                                    ]
                                }
                            ],
                            "heatmap": [
                                {
                                    "type": "heatmap",
                                    "colorbar": {
                                        "ticks": "",
                                        "outlinewidth": 0
                                    },
                                    "colorscale": [
                                        [
                                            0.0,
                                            "#0d0887"
                                        ],
                                        [
                                            0.1111111111111111,
                                            "#46039f"
                                        ],
                                        [
                                            0.2222222222222222,
                                            "#7201a8"
                                        ],
                                        [
                                            0.3333333333333333,
                                            "#9c179e"
                                        ],
                                        [
                                            0.4444444444444444,
                                            "#bd3786"
                                        ],
                                        [
                                            0.5555555555555556,
                                            "#d8576b"
                                        ],
                                        [
                                            0.6666666666666666,
                                            "#ed7953"
                                        ],
                                        [
                                            0.7777777777777778,
                                            "#fb9f3a"
                                        ],
                                        [
                                            0.8888888888888888,
                                            "#fdca26"
                                        ],
                                        [
                                            1.0,
                                            "#f0f921"
                                        ]
                                    ]
                                }
                            ],
                            "scatter": [
                                {
                                    "type": "scatter",
                                    "marker": {
                                        "line": {
                                            "color": "#283442"
                                        }
                                    }
                                }
                            ],
                            "surface": [
                                {
                                    "type": "surface",
                                    "colorbar": {
                                        "ticks": "",
                                        "outlinewidth": 0
                                    },
                                    "colorscale": [
                                        [
                                            0.0,
                                            "#0d0887"
                                        ],
                                        [
                                            0.1111111111111111,
                                            "#46039f"
                                        ],
                                        [
                                            0.2222222222222222,
                                            "#7201a8"
                                        ],
                                        [
                                            0.3333333333333333,
                                            "#9c179e"
                                        ],
                                        [
                                            0.4444444444444444,
                                            "#bd3786"
                                        ],
                                        [
                                            0.5555555555555556,
                                            "#d8576b"
                                        ],
                                        [
                                            0.6666666666666666,
                                            "#ed7953"
                                        ],
                                        [
                                            0.7777777777777778,
                                            "#fb9f3a"
                                        ],
                                        [
                                            0.8888888888888888,
                                            "#fdca26"
                                        ],
                                        [
                                            1.0,
                                            "#f0f921"
                                        ]
                                    ]
                                }
                            ],
                            "barpolar": [
                                {
                                    "type": "barpolar",
                                    "marker": {
                                        "line": {
                                            "color": "rgb(17,17,17)",
                                            "width": 0.5
                                        },
                                        "pattern": {
                                            "size": 10,
                                            "fillmode": "overlay",
                                            "solidity": 0.2
                                        }
                                    }
                                }
                            ],
                            "heatmapgl": [
                                {
                                    "type": "heatmapgl",
                                    "colorbar": {
                                        "ticks": "",
                                        "outlinewidth": 0
                                    },
                                    "colorscale": [
                                        [
                                            0.0,
                                            "#0d0887"
                                        ],
                                        [
                                            0.1111111111111111,
                                            "#46039f"
                                        ],
                                        [
                                            0.2222222222222222,
                                            "#7201a8"
                                        ],
                                        [
                                            0.3333333333333333,
                                            "#9c179e"
                                        ],
                                        [
                                            0.4444444444444444,
                                            "#bd3786"
                                        ],
                                        [
                                            0.5555555555555556,
                                            "#d8576b"
                                        ],
                                        [
                                            0.6666666666666666,
                                            "#ed7953"
                                        ],
                                        [
                                            0.7777777777777778,
                                            "#fb9f3a"
                                        ],
                                        [
                                            0.8888888888888888,
                                            "#fdca26"
                                        ],
                                        [
                                            1.0,
                                            "#f0f921"
                                        ]
                                    ]
                                }
                            ],
                            "histogram": [
                                {
                                    "type": "histogram",
                                    "marker": {
                                        "pattern": {
                                            "size": 10,
                                            "fillmode": "overlay",
                                            "solidity": 0.2
                                        }
                                    }
                                }
                            ],
                            "parcoords": [
                                {
                                    "line": {
                                        "colorbar": {
                                            "ticks": "",
                                            "outlinewidth": 0
                                        }
                                    },
                                    "type": "parcoords"
                                }
                            ],
                            "scatter3d": [
                                {
                                    "line": {
                                        "colorbar": {
                                            "ticks": "",
                                            "outlinewidth": 0
                                        }
                                    },
                                    "type": "scatter3d",
                                    "marker": {
                                        "colorbar": {
                                            "ticks": "",
                                            "outlinewidth": 0
                                        }
                                    }
                                }
                            ],
                            "scattergl": [
                                {
                                    "type": "scattergl",
                                    "marker": {
                                        "line": {
                                            "color": "#283442"
                                        }
                                    }
                                }
                            ],
                            "choropleth": [
                                {
                                    "type": "choropleth",
                                    "colorbar": {
                                        "ticks": "",
                                        "outlinewidth": 0
                                    }
                                }
                            ],
                            "scattergeo": [
                                {
                                    "type": "scattergeo",
                                    "marker": {
                                        "colorbar": {
                                            "ticks": "",
                                            "outlinewidth": 0
                                        }
                                    }
                                }
                            ],
                            "histogram2d": [
                                {
                                    "type": "histogram2d",
                                    "colorbar": {
                                        "ticks": "",
                                        "outlinewidth": 0
                                    },
                                    "colorscale": [
                                        [
                                            0.0,
                                            "#0d0887"
                                        ],
                                        [
                                            0.1111111111111111,
                                            "#46039f"
                                        ],
                                        [
                                            0.2222222222222222,
                                            "#7201a8"
                                        ],
                                        [
                                            0.3333333333333333,
                                            "#9c179e"
                                        ],
                                        [
                                            0.4444444444444444,
                                            "#bd3786"
                                        ],
                                        [
                                            0.5555555555555556,
                                            "#d8576b"
                                        ],
                                        [
                                            0.6666666666666666,
                                            "#ed7953"
                                        ],
                                        [
                                            0.7777777777777778,
                                            "#fb9f3a"
                                        ],
                                        [
                                            0.8888888888888888,
                                            "#fdca26"
                                        ],
                                        [
                                            1.0,
                                            "#f0f921"
                                        ]
                                    ]
                                }
                            ],
                            "scatterpolar": [
                                {
                                    "type": "scatterpolar",
                                    "marker": {
                                        "colorbar": {
                                            "ticks": "",
                                            "outlinewidth": 0
                                        }
                                    }
                                }
                            ],
                            "contourcarpet": [
                                {
                                    "type": "contourcarpet",
                                    "colorbar": {
                                        "ticks": "",
                                        "outlinewidth": 0
                                    }
                                }
                            ],
                            "scattercarpet": [
                                {
                                    "type": "scattercarpet",
                                    "marker": {
                                        "colorbar": {
                                            "ticks": "",
                                            "outlinewidth": 0
                                        }
                                    }
                                }
                            ],
                            "scattermapbox": [
                                {
                                    "type": "scattermapbox",
                                    "marker": {
                                        "colorbar": {
                                            "ticks": "",
                                            "outlinewidth": 0
                                        }
                                    }
                                }
                            ],
                            "scatterpolargl": [
                                {
                                    "type": "scatterpolargl",
                                    "marker": {
                                        "colorbar": {
                                            "ticks": "",
                                            "outlinewidth": 0
                                        }
                                    }
                                }
                            ],
                            "scatterternary": [
                                {
                                    "type": "scatterternary",
                                    "marker": {
                                        "colorbar": {
                                            "ticks": "",
                                            "outlinewidth": 0
                                        }
                                    }
                                }
                            ],
                            "histogram2dcontour": [
                                {
                                    "type": "histogram2dcontour",
                                    "colorbar": {
                                        "ticks": "",
                                        "outlinewidth": 0
                                    },
                                    "colorscale": [
                                        [
                                            0.0,
                                            "#0d0887"
                                        ],
                                        [
                                            0.1111111111111111,
                                            "#46039f"
                                        ],
                                        [
                                            0.2222222222222222,
                                            "#7201a8"
                                        ],
                                        [
                                            0.3333333333333333,
                                            "#9c179e"
                                        ],
                                        [
                                            0.4444444444444444,
                                            "#bd3786"
                                        ],
                                        [
                                            0.5555555555555556,
                                            "#d8576b"
                                        ],
                                        [
                                            0.6666666666666666,
                                            "#ed7953"
                                        ],
                                        [
                                            0.7777777777777778,
                                            "#fb9f3a"
                                        ],
                                        [
                                            0.8888888888888888,
                                            "#fdca26"
                                        ],
                                        [
                                            1.0,
                                            "#f0f921"
                                        ]
                                    ]
                                }
                            ]
                        },
                        "layout": {
                            "geo": {
                                "bgcolor": "rgb(17,17,17)",
                                "showland": true,
                                "lakecolor": "rgb(17,17,17)",
                                "landcolor": "rgb(17,17,17)",
                                "showlakes": true,
                                "subunitcolor": "#506784"
                            },
                            "font": {
                                "color": "#f2f5fa"
                            },
                            "polar": {
                                "bgcolor": "rgb(17,17,17)",
                                "radialaxis": {
                                    "ticks": "",
                                    "gridcolor": "#506784",
                                    "linecolor": "#506784"
                                },
                                "angularaxis": {
                                    "ticks": "",
                                    "gridcolor": "#506784",
                                    "linecolor": "#506784"
                                }
                            },
                            "scene": {
                                "xaxis": {
                                    "ticks": "",
                                    "gridcolor": "#506784",
                                    "gridwidth": 2,
                                    "linecolor": "#506784",
                                    "zerolinecolor": "#C8D4E3",
                                    "showbackground": true,
                                    "backgroundcolor": "rgb(17,17,17)"
                                },
                                "yaxis": {
                                    "ticks": "",
                                    "gridcolor": "#506784",
                                    "gridwidth": 2,
                                    "linecolor": "#506784",
                                    "zerolinecolor": "#C8D4E3",
                                    "showbackground": true,
                                    "backgroundcolor": "rgb(17,17,17)"
                                },
                                "zaxis": {
                                    "ticks": "",
                                    "gridcolor": "#506784",
                                    "gridwidth": 2,
                                    "linecolor": "#506784",
                                    "zerolinecolor": "#C8D4E3",
                                    "showbackground": true,
                                    "backgroundcolor": "rgb(17,17,17)"
                                }
                            },
                            "title": {
                                "x": 0.05
                            },
                            "xaxis": {
                                "ticks": "",
                                "title": {
                                    "standoff": 15
                                },
                                "gridcolor": "#283442",
                                "linecolor": "#506784",
                                "automargin": true,
                                "zerolinecolor": "#283442",
                                "zerolinewidth": 2
                            },
                            "yaxis": {
                                "ticks": "",
                                "title": {
                                    "standoff": 15
                                },
                                "gridcolor": "#283442",
                                "linecolor": "#506784",
                                "automargin": true,
                                "zerolinecolor": "#283442",
                                "zerolinewidth": 2
                            },
                            "mapbox": {
                                "style": "dark"
                            },
                            "ternary": {
                                "aaxis": {
                                    "ticks": "",
                                    "gridcolor": "#506784",
                                    "linecolor": "#506784"
                                },
                                "baxis": {
                                    "ticks": "",
                                    "gridcolor": "#506784",
                                    "linecolor": "#506784"
                                },
                                "caxis": {
                                    "ticks": "",
                                    "gridcolor": "#506784",
                                    "linecolor": "#506784"
                                },
                                "bgcolor": "rgb(17,17,17)"
                            },
                            "colorway": [
                                "#636efa",
                                "#EF553B",
                                "#00cc96",
                                "#ab63fa",
                                "#FFA15A",
                                "#19d3f3",
                                "#FF6692",
                                "#B6E880",
                                "#FF97FF",
                                "#FECB52"
                            ],
                            "coloraxis": {
                                "colorbar": {
                                    "ticks": "",
                                    "outlinewidth": 0
                                }
                            },
                            "hovermode": "closest",
                            "colorscale": {
                                "diverging": [
                                    [
                                        0,
                                        "#8e0152"
                                    ],
                                    [
                                        0.1,
                                        "#c51b7d"
                                    ],
                                    [
                                        0.2,
                                        "#de77ae"
                                    ],
                                    [
                                        0.3,
                                        "#f1b6da"
                                    ],
                                    [
                                        0.4,
                                        "#fde0ef"
                                    ],
                                    [
                                        0.5,
                                        "#f7f7f7"
                                    ],
                                    [
                                        0.6,
                                        "#e6f5d0"
                                    ],
                                    [
                                        0.7,
                                        "#b8e186"
                                    ],
                                    [
                                        0.8,
                                        "#7fbc41"
                                    ],
                                    [
                                        0.9,
                                        "#4d9221"
                                    ],
                                    [
                                        1,
                                        "#276419"
                                    ]
                                ],
                                "sequential": [
                                    [
                                        0.0,
                                        "#0d0887"
                                    ],
                                    [
                                        0.1111111111111111,
                                        "#46039f"
                                    ],
                                    [
                                        0.2222222222222222,
                                        "#7201a8"
                                    ],
                                    [
                                        0.3333333333333333,
                                        "#9c179e"
                                    ],
                                    [
                                        0.4444444444444444,
                                        "#bd3786"
                                    ],
                                    [
                                        0.5555555555555556,
                                        "#d8576b"
                                    ],
                                    [
                                        0.6666666666666666,
                                        "#ed7953"
                                    ],
                                    [
                                        0.7777777777777778,
                                        "#fb9f3a"
                                    ],
                                    [
                                        0.8888888888888888,
                                        "#fdca26"
                                    ],
                                    [
                                        1.0,
                                        "#f0f921"
                                    ]
                                ],
                                "sequentialminus": [
                                    [
                                        0.0,
                                        "#0d0887"
                                    ],
                                    [
                                        0.1111111111111111,
                                        "#46039f"
                                    ],
                                    [
                                        0.2222222222222222,
                                        "#7201a8"
                                    ],
                                    [
                                        0.3333333333333333,
                                        "#9c179e"
                                    ],
                                    [
                                        0.4444444444444444,
                                        "#bd3786"
                                    ],
                                    [
                                        0.5555555555555556,
                                        "#d8576b"
                                    ],
                                    [
                                        0.6666666666666666,
                                        "#ed7953"
                                    ],
                                    [
                                        0.7777777777777778,
                                        "#fb9f3a"
                                    ],
                                    [
                                        0.8888888888888888,
                                        "#fdca26"
                                    ],
                                    [
                                        1.0,
                                        "#f0f921"
                                    ]
                                ]
                            },
                            "hoverlabel": {
                                "align": "left"
                            },
                            "plot_bgcolor": "rgb(17,17,17)",
                            "paper_bgcolor": "rgb(17,17,17)",
                            "shapedefaults": {
                                "line": {
                                    "color": "#f2f5fa"
                                }
                            },
                            "sliderdefaults": {
                                "bgcolor": "#C8D4E3",
                                "tickwidth": 0,
                                "bordercolor": "rgb(17,17,17)",
                                "borderwidth": 1
                            },
                            "autotypenumbers": "strict",
                            "annotationdefaults": {
                                "arrowhead": 0,
                                "arrowcolor": "#f2f5fa",
                                "arrowwidth": 1
                            },
                            "updatemenudefaults": {
                                "bgcolor": "#506784",
                                "borderwidth": 0
                            }
                        }
                    },
                    "hovermode": "closest",
                    "annotations": [
                        {
                            "x": 43499298.0,
                            "y": 0.73,
                            "font": {
                                "size": 13
                            },
                            "text": "Δ NPV: 1.0%",
                            "yref": "paper",
                            "showarrow": false
                        },
                        {
                            "x": 43710227.428571425,
                            "y": 0.56,
                            "font": {
                                "size": 11,
                                "color": "rgba(55, 83, 109, 1)"
                            },
                            "text": "Average simulated value<br>$43,710,227",
                            "yref": "paper",
                            "xanchor": "left",
                            "showarrow": false
                        },
                        {
                            "x": 43288369.7475083,
                            "y": 0.49,
                            "font": {
                                "size": 11,
                                "color": "rgb(214, 39, 40)"
                            },
                            "text": "Estimated value<br>$43,288,369",
                            "yref": "paper",
                            "xanchor": "right",
                            "showarrow": false
                        },
                        {
                            "x": 1,
                            "y": -0.12,
                            "text": "Source: Computer model",
                            "xref": "paper",
                            "yref": "paper",
                            "showarrow": false
                        }
                    ]
                }
            },
            "height": null,
            "width": null,
            "user": {
                "profile_url": "https://chart-studio.plotly.com/~ShengYan",
                "avatar_url": "https://storage.googleapis.com/plotly-prod-profiles/66.jpg",
                "background_url": "https://storage.googleapis.com/plotly-prod-profiles/bg-0.jpg",
                "bio": "",
                "nickname": "",
                "website": "",
                "stream_tokens": null,
                "feature_set_id": null,
                "csrf_token": null,
                "date_joined": "2024-04-20 11:27:04",
                "mapbox_access_tokens": null,
                "has_password": null,
                "username": "ShengYan",
                "email": null,
                "is_active": null,
                "readonly": null,
                "is_dash_creator": null,
                "dash_created_count": null,
                "is_chart_creator": null,
                "charts_created_count": null
            }
        },
        {
            "creation_time": "2024-04-21T10:01:52.841219Z",
            "comments": {
                "results": [],
                "count": 0
            },
            "parented": true,
            "embed_url": "https://chart-studio.plotly.com/~jay.p3497/24.embed",
            "fid": "jay.p3497:24",
            "filename": "attribution-table",
            "filetype": "plot",
            "img_url": "https://storage.googleapis.com/plotly-prod-images/jay.p3497/24/9_4MIXOJGI7PN5JT8MHUK6P9S00A0C87.png",
            "image_urls": {
                "default": "https://storage.googleapis.com/plotly-prod-images/jay.p3497/24/2_VCCG09X1CUSVQ7613OQ00FVARPFGJJ.png",
                "block-thumb": "https://storage.googleapis.com/plotly-prod-images/jay.p3497/24/8_YSZRNCOQ17POUHPQT5SFTJGF28J0XR.png",
                "list-thumb": "https://storage.googleapis.com/plotly-prod-images/jay.p3497/24/9_4MIXOJGI7PN5JT8MHUK6P9S00A0C87.png"
            },
            "api_urls": {
                "files": "https://api.plotly.com/v2/files/jay.p3497:24",
                "plots": "https://api.plotly.com/v2/plots/jay.p3497:24",
                "parent": "https://api.plotly.com/v2/folders/home?user=jay.p3497"
            },
            "owner": "jay.p3497",
            "parent": -1,
            "preview": "",
            "referencers": [],
            "references": [],
            "title": "Attribution Data for Poor Ratings with Name INP",
            "views": 1,
            "web_url": "https://chart-studio.plotly.com/~jay.p3497/24/attribution-data-for-poor-ratings-with-name-inp/",
            "world_readable": true,
            "date_modified": "2024-04-21T10:01:53.345Z",
            "stars": {
                "results": [],
                "count": 0
            },
            "collaborators": {
                "results": [],
                "count": 0
            },
            "subfolder_count": null,
            "refresh_interval": null,
            "organize_view_url": "https://chart-studio.plotly.com/~jay.p3497/24/",
            "current_user_permission": "read",
            "is_theme": null,
            "is_template": null,
            "autosize": true,
            "caption": "",
            "figure": {
                "data": [
                    {
                        "type": "table",
                        "cells": {
                            "font": {
                                "size": 11,
                                "family": "Arial",
                                "colorsrc": "jay.p3497:25:2edcf5"
                            },
                            "line": {
                                "color": "black",
                                "width": 1
                            },
                            "alignsrc": "jay.p3497:25:afd229",
                            "valuessrc": "jay.p3497:25:3164c6,35dee5"
                        },
                        "header": {
                            "fill": {
                                "color": "grey"
                            },
                            "font": {
                                "size": 12,
                                "color": "white",
                                "family": "Arial"
                            },
                            "line": {
                                "color": "black",
                                "width": 1
                            },
                            "alignsrc": "jay.p3497:25:afd229",
                            "valuessrc": "jay.p3497:25:6b8560"
                        }
                    }
                ],
                "layout": {
                    "title": "Attribution Data for Poor Ratings with Name INP",
                    "autosize": true
                }
            },
            "height": null,
            "width": null,
            "user": {
                "profile_url": "https://chart-studio.plotly.com/~jay.p3497",
                "avatar_url": "https://storage.googleapis.com/plotly-prod-profiles/56.jpg",
                "background_url": "https://storage.googleapis.com/plotly-prod-profiles/bg-0.jpg",
                "bio": "",
                "nickname": "",
                "website": "",
                "stream_tokens": null,
                "feature_set_id": null,
                "csrf_token": null,
                "date_joined": "2024-04-21 08:45:42",
                "mapbox_access_tokens": null,
                "has_password": null,
                "username": "jay.p3497",
                "email": null,
                "is_active": null,
                "readonly": null,
                "is_dash_creator": null,
                "dash_created_count": null,
                "is_chart_creator": null,
                "charts_created_count": null
            }
        },
        {
            "creation_time": "2024-04-21T09:51:22.231008Z",
            "comments": {
                "results": [],
                "count": 0
            },
            "parented": true,
            "embed_url": "https://chart-studio.plotly.com/~Koveee/1.embed",
            "fid": "Koveee:1",
            "filename": "Plot 1",
            "filetype": "plot",
            "img_url": "https://storage.googleapis.com/plotly-prod-images/Koveee/1/9_60H2HWZ36RSURCUGPOFKGOUZMI38TU.png",
            "image_urls": {
                "default": "https://storage.googleapis.com/plotly-prod-images/Koveee/1/2_SXR569WXF1FJ09JWT1HHI457TTXJJ7.png",
                "block-thumb": "https://storage.googleapis.com/plotly-prod-images/Koveee/1/8_X3RFUX5H0V052MVGMPIIZJBZ2VW0JT.png",
                "list-thumb": "https://storage.googleapis.com/plotly-prod-images/Koveee/1/9_60H2HWZ36RSURCUGPOFKGOUZMI38TU.png"
            },
            "api_urls": {
                "files": "https://api.plotly.com/v2/files/Koveee:1",
                "plots": "https://api.plotly.com/v2/plots/Koveee:1",
                "parent": "https://api.plotly.com/v2/folders/home?user=Koveee"
            },
            "owner": "Koveee",
            "parent": -1,
            "preview": "",
            "referencers": [],
            "references": [],
            "title": "",
            "views": 1,
            "web_url": "https://chart-studio.plotly.com/~Koveee/1/",
            "world_readable": true,
            "date_modified": "2024-04-21T09:51:22.240Z",
            "stars": {
                "results": [],
                "count": 0
            },
            "collaborators": {
                "results": [],
                "count": 0
            },
            "subfolder_count": null,
            "refresh_interval": null,
            "organize_view_url": "https://chart-studio.plotly.com/~Koveee/1/",
            "current_user_permission": "read",
            "is_theme": null,
            "is_template": false,
            "autosize": true,
            "caption": "",
            "figure": {
                "data": [
                    {
                        "meta": {
                            "columnNames": {
                                "r": "A",
                                "y": "A"
                            }
                        },
                        "mode": "lines",
                        "name": "Simítatlan",
                        "rsrc": "Koveee:0:c8f3f0",
                        "type": "scatter",
                        "ysrc": "Koveee:0:c8f3f0"
                    },
                    {
                        "meta": {
                            "columnNames": {
                                "y": "B"
                            }
                        },
                        "mode": "lines",
                        "name": "Simított",
                        "type": "scatter",
                        "ysrc": "Koveee:0:7e8094",
                        "stackgroup": null
                    }
                ],
                "frames": [],
                "layout": {
                    "polar": {
                        "radialaxis": {
                            "type": "linear",
                            "range": [
                                -51.12224719101123,
                                0
                            ],
                            "autorange": true
                        },
                        "angularaxis": {}
                    },
                    "title": {
                        "text": "Mediapipe head gemoetry simítás előtt és után"
                    },
                    "xaxis": {
                        "range": [
                            0,
                            99
                        ],
                        "title": {
                            "text": "Mérések"
                        },
                        "autorange": true
                    },
                    "yaxis": {
                        "type": "linear",
                        "range": [
                            -50.38748333333333,
                            -46.28781666666667
                        ],
                        "title": {
                            "text": "Mérés értéke"
                        },
                        "autorange": true
                    },
                    "autosize": true,
                    "dragmode": "zoom",
                    "template": {
                        "data": {
                            "bar": [
                                {
                                    "type": "bar",
                                    "marker": {
                                        "colorbar": {
                                            "ticks": "",
                                            "outlinewidth": 0
                                        }
                                    }
                                }
                            ],
                            "table": [
                                {
                                    "type": "table",
                                    "cells": {
                                        "fill": {
                                            "color": "#EBF0F8"
                                        },
                                        "line": {
                                            "color": "white"
                                        }
                                    },
                                    "header": {
                                        "fill": {
                                            "color": "#C8D4E3"
                                        },
                                        "line": {
                                            "color": "white"
                                        }
                                    }
                                }
                            ],
                            "carpet": [
                                {
                                    "type": "carpet",
                                    "aaxis": {
                                        "gridcolor": "#C8D4E3",
                                        "linecolor": "#C8D4E3",
                                        "endlinecolor": "#2a3f5f",
                                        "minorgridcolor": "#C8D4E3",
                                        "startlinecolor": "#2a3f5f"
                                    },
                                    "baxis": {
                                        "gridcolor": "#C8D4E3",
                                        "linecolor": "#C8D4E3",
                                        "endlinecolor": "#2a3f5f",
                                        "minorgridcolor": "#C8D4E3",
                                        "startlinecolor": "#2a3f5f"
                                    }
                                }
                            ],
                            "mesh3d": [
                                {
                                    "type": "mesh3d",
                                    "colorbar": {
                                        "ticks": "",
                                        "outlinewidth": 0
                                    }
                                }
                            ],
                            "contour": [
                                {
                                    "type": "contour",
                                    "colorbar": {
                                        "ticks": "",
                                        "outlinewidth": 0
                                    },
                                    "autocolorscale": true
                                }
                            ],
                            "heatmap": [
                                {
                                    "type": "heatmap",
                                    "colorbar": {
                                        "ticks": "",
                                        "outlinewidth": 0
                                    },
                                    "autocolorscale": true
                                }
                            ],
                            "scatter": [
                                {
                                    "type": "scatter",
                                    "marker": {
                                        "colorbar": {
                                            "ticks": "",
                                            "outlinewidth": 0
                                        }
                                    }
                                }
                            ],
                            "surface": [
                                {
                                    "type": "surface",
                                    "colorbar": {
                                        "ticks": "",
                                        "outlinewidth": 0
                                    }
                                }
                            ],
                            "heatmapgl": [
                                {
                                    "type": "heatmapgl",
                                    "colorbar": {
                                        "ticks": "",
                                        "outlinewidth": 0
                                    }
                                }
                            ],
                            "histogram": [
                                {
                                    "type": "histogram",
                                    "marker": {
                                        "colorbar": {
                                            "ticks": "",
                                            "outlinewidth": 0
                                        }
                                    }
                                }
                            ],
                            "parcoords": [
                                {
                                    "line": {
                                        "colorbar": {
                                            "ticks": "",
                                            "outlinewidth": 0
                                        }
                                    },
                                    "type": "parcoords"
                                }
                            ],
                            "scatter3d": [
                                {
                                    "type": "scatter3d",
                                    "marker": {
                                        "colorbar": {
                                            "ticks": "",
                                            "outlinewidth": 0
                                        }
                                    }
                                }
                            ],
                            "scattergl": [
                                {
                                    "type": "scattergl",
                                    "marker": {
                                        "colorbar": {
                                            "ticks": "",
                                            "outlinewidth": 0
                                        }
                                    }
                                }
                            ],
                            "choropleth": [
                                {
                                    "type": "choropleth",
                                    "colorbar": {
                                        "ticks": "",
                                        "outlinewidth": 0
                                    }
                                }
                            ],
                            "scattergeo": [
                                {
                                    "type": "scattergeo",
                                    "marker": {
                                        "colorbar": {
                                            "ticks": "",
                                            "outlinewidth": 0
                                        }
                                    }
                                }
                            ],
                            "histogram2d": [
                                {
                                    "type": "histogram2d",
                                    "colorbar": {
                                        "ticks": "",
                                        "outlinewidth": 0
                                    },
                                    "autocolorscale": true
                                }
                            ],
                            "scatterpolar": [
                                {
                                    "type": "scatterpolar",
                                    "marker": {
                                        "colorbar": {
                                            "ticks": "",
                                            "outlinewidth": 0
                                        }
                                    }
                                }
                            ],
                            "contourcarpet": [
                                {
                                    "type": "contourcarpet",
                                    "colorbar": {
                                        "ticks": "",
                                        "outlinewidth": 0
                                    }
                                }
                            ],
                            "scattercarpet": [
                                {
                                    "type": "scattercarpet",
                                    "marker": {
                                        "colorbar": {
                                            "ticks": "",
                                            "outlinewidth": 0
                                        }
                                    }
                                }
                            ],
                            "scattermapbox": [
                                {
                                    "type": "scattermapbox",
                                    "marker": {
                                        "colorbar": {
                                            "ticks": "",
                                            "outlinewidth": 0
                                        }
                                    }
                                }
                            ],
                            "scatterpolargl": [
                                {
                                    "type": "scatterpolargl",
                                    "marker": {
                                        "colorbar": {
                                            "ticks": "",
                                            "outlinewidth": 0
                                        }
                                    }
                                }
                            ],
                            "scatterternary": [
                                {
                                    "type": "scatterternary",
                                    "marker": {
                                        "colorbar": {
                                            "ticks": "",
                                            "outlinewidth": 0
                                        }
                                    }
                                }
                            ],
                            "histogram2dcontour": [
                                {
                                    "type": "histogram2dcontour",
                                    "colorbar": {
                                        "ticks": "",
                                        "outlinewidth": 0
                                    },
                                    "autocolorscale": true
                                }
                            ]
                        },
                        "layout": {
                            "geo": {
                                "bgcolor": "white",
                                "showland": true,
                                "lakecolor": "white",
                                "landcolor": "white",
                                "showlakes": true,
                                "subunitcolor": "#C8D4E3"
                            },
                            "font": {
                                "color": "#2a3f5f"
                            },
                            "polar": {
                                "bgcolor": "white",
                                "radialaxis": {
                                    "ticks": "",
                                    "gridcolor": "#EBF0F8",
                                    "linecolor": "#EBF0F8"
                                },
                                "angularaxis": {
                                    "ticks": "",
                                    "gridcolor": "#EBF0F8",
                                    "linecolor": "#EBF0F8"
                                }
                            },
                            "scene": {
                                "xaxis": {
                                    "ticks": "",
                                    "gridcolor": "#DFE8F3",
                                    "gridwidth": 2,
                                    "linecolor": "#EBF0F8",
                                    "zerolinecolor": "#EBF0F8",
                                    "showbackground": true,
                                    "backgroundcolor": "white"
                                },
                                "yaxis": {
                                    "ticks": "",
                                    "gridcolor": "#DFE8F3",
                                    "gridwidth": 2,
                                    "linecolor": "#EBF0F8",
                                    "zerolinecolor": "#EBF0F8",
                                    "showbackground": true,
                                    "backgroundcolor": "white"
                                },
                                "zaxis": {
                                    "ticks": "",
                                    "gridcolor": "#DFE8F3",
                                    "gridwidth": 2,
                                    "linecolor": "#EBF0F8",
                                    "zerolinecolor": "#EBF0F8",
                                    "showbackground": true,
                                    "backgroundcolor": "white"
                                }
                            },
                            "title": {
                                "x": 0.05
                            },
                            "xaxis": {
                                "ticks": "",
                                "gridcolor": "#EBF0F8",
                                "linecolor": "#EBF0F8",
                                "automargin": true,
                                "zerolinecolor": "#EBF0F8",
                                "zerolinewidth": 2
                            },
                            "yaxis": {
                                "ticks": "",
                                "gridcolor": "#EBF0F8",
                                "linecolor": "#EBF0F8",
                                "automargin": true,
                                "zerolinecolor": "#EBF0F8",
                                "zerolinewidth": 2
                            },
                            "ternary": {
                                "aaxis": {
                                    "ticks": "",
                                    "gridcolor": "#DFE8F3",
                                    "linecolor": "#A2B1C6"
                                },
                                "baxis": {
                                    "ticks": "",
                                    "gridcolor": "#DFE8F3",
                                    "linecolor": "#A2B1C6"
                                },
                                "caxis": {
                                    "ticks": "",
                                    "gridcolor": "#DFE8F3",
                                    "linecolor": "#A2B1C6"
                                },
                                "bgcolor": "white"
                            },
                            "colorway": [
                                "#636efa",
                                "#EF553B",
                                "#00cc96",
                                "#ab63fa",
                                "#19d3f3",
                                "#e763fa",
                                "#fecb52",
                                "#ffa15a",
                                "#ff6692",
                                "#b6e880"
                            ],
                            "hovermode": "closest",
                            "colorscale": {
                                "diverging": [
                                    [
                                        0,
                                        "#8e0152"
                                    ],
                                    [
                                        0.1,
                                        "#c51b7d"
                                    ],
                                    [
                                        0.2,
                                        "#de77ae"
                                    ],
                                    [
                                        0.3,
                                        "#f1b6da"
                                    ],
                                    [
                                        0.4,
                                        "#fde0ef"
                                    ],
                                    [
                                        0.5,
                                        "#f7f7f7"
                                    ],
                                    [
                                        0.6,
                                        "#e6f5d0"
                                    ],
                                    [
                                        0.7,
                                        "#b8e186"
                                    ],
                                    [
                                        0.8,
                                        "#7fbc41"
                                    ],
                                    [
                                        0.9,
                                        "#4d9221"
                                    ],
                                    [
                                        1,
                                        "#276419"
                                    ]
                                ],
                                "sequential": [
                                    [
                                        0,
                                        "#0508b8"
                                    ],
                                    [
                                        0.0893854748603352,
                                        "#1910d8"
                                    ],
                                    [
                                        0.1787709497206704,
                                        "#3c19f0"
                                    ],
                                    [
                                        0.2681564245810056,
                                        "#6b1cfb"
                                    ],
                                    [
                                        0.3575418994413408,
                                        "#981cfd"
                                    ],
                                    [
                                        0.44692737430167595,
                                        "#bf1cfd"
                                    ],
                                    [
                                        0.5363128491620112,
                                        "#dd2bfd"
                                    ],
                                    [
                                        0.6256983240223464,
                                        "#f246fe"
                                    ],
                                    [
                                        0.7150837988826816,
                                        "#fc67fd"
                                    ],
                                    [
                                        0.8044692737430168,
                                        "#fe88fc"
                                    ],
                                    [
                                        0.8938547486033519,
                                        "#fea5fd"
                                    ],
                                    [
                                        0.9832402234636871,
                                        "#febefe"
                                    ],
                                    [
                                        1,
                                        "#fec3fe"
                                    ]
                                ],
                                "sequentialminus": [
                                    [
                                        0,
                                        "#0508b8"
                                    ],
                                    [
                                        0.0893854748603352,
                                        "#1910d8"
                                    ],
                                    [
                                        0.1787709497206704,
                                        "#3c19f0"
                                    ],
                                    [
                                        0.2681564245810056,
                                        "#6b1cfb"
                                    ],
                                    [
                                        0.3575418994413408,
                                        "#981cfd"
                                    ],
                                    [
                                        0.44692737430167595,
                                        "#bf1cfd"
                                    ],
                                    [
                                        0.5363128491620112,
                                        "#dd2bfd"
                                    ],
                                    [
                                        0.6256983240223464,
                                        "#f246fe"
                                    ],
                                    [
                                        0.7150837988826816,
                                        "#fc67fd"
                                    ],
                                    [
                                        0.8044692737430168,
                                        "#fe88fc"
                                    ],
                                    [
                                        0.8938547486033519,
                                        "#fea5fd"
                                    ],
                                    [
                                        0.9832402234636871,
                                        "#febefe"
                                    ],
                                    [
                                        1,
                                        "#fec3fe"
                                    ]
                                ]
                            },
                            "plot_bgcolor": "white",
                            "paper_bgcolor": "white",
                            "shapedefaults": {
                                "line": {
                                    "width": 0
                                },
                                "opacity": 0.4,
                                "fillcolor": "#506784"
                            },
                            "annotationdefaults": {
                                "arrowhead": 0,
                                "arrowcolor": "#506784",
                                "arrowwidth": 1
                            }
                        },
                        "themeRef": "PLOTLY_WHITE"
                    }
                }
            },
            "height": null,
            "width": null,
            "user": {
                "profile_url": "https://chart-studio.plotly.com/~Koveee",
                "avatar_url": "https://storage.googleapis.com/plotly-prod-profiles/75.jpg",
                "background_url": "https://storage.googleapis.com/plotly-prod-profiles/bg-5.jpg",
                "bio": "",
                "nickname": "",
                "website": "",
                "stream_tokens": null,
                "feature_set_id": null,
                "csrf_token": null,
                "date_joined": "2024-04-21 09:49:01",
                "mapbox_access_tokens": null,
                "has_password": null,
                "username": "Koveee",
                "email": null,
                "is_active": null,
                "readonly": null,
                "is_dash_creator": null,
                "dash_created_count": null,
                "is_chart_creator": null,
                "charts_created_count": null
            }
        },
        {
            "creation_time": "2024-04-21T09:49:25.788099Z",
            "comments": {
                "results": [],
                "count": 0
            },
            "parented": true,
            "embed_url": "https://chart-studio.plotly.com/~andikarisky28/1.embed",
            "fid": "andikarisky28:1",
            "filename": "Plot 1",
            "filetype": "plot",
            "img_url": "https://storage.googleapis.com/plotly-prod-images/andikarisky28/1/9_W87165CH6VGL8PJ5ZQNBJH8EIHFWUP.png",
            "image_urls": {
                "default": "https://storage.googleapis.com/plotly-prod-images/andikarisky28/1/2_A24IAIM63SHODTONY96Z66PRZZGFPZ.png",
                "block-thumb": "https://storage.googleapis.com/plotly-prod-images/andikarisky28/1/8_00IAC6XU3N5R05X7X99JOEDLWL6TFV.png",
                "list-thumb": "https://storage.googleapis.com/plotly-prod-images/andikarisky28/1/9_W87165CH6VGL8PJ5ZQNBJH8EIHFWUP.png"
            },
            "api_urls": {
                "files": "https://api.plotly.com/v2/files/andikarisky28:1",
                "plots": "https://api.plotly.com/v2/plots/andikarisky28:1",
                "parent": "https://api.plotly.com/v2/folders/home?user=andikarisky28"
            },
            "owner": "andikarisky28",
            "parent": -1,
            "preview": "",
            "referencers": [],
            "references": [],
            "title": "",
            "views": 2,
            "web_url": "https://chart-studio.plotly.com/~andikarisky28/1/",
            "world_readable": true,
            "date_modified": "2024-04-21T09:49:25.802Z",
            "stars": {
                "results": [],
                "count": 0
            },
            "collaborators": {
                "results": [],
                "count": 0
            },
            "subfolder_count": null,
            "refresh_interval": null,
            "organize_view_url": "https://chart-studio.plotly.com/~andikarisky28/1/",
            "current_user_permission": "read",
            "is_theme": null,
            "is_template": false,
            "autosize": true,
            "caption": "",
            "figure": {
                "data": [
                    {
                        "meta": {
                            "columnNames": {
                                "x": "E",
                                "y": "A"
                            }
                        },
                        "mode": "lines",
                        "name": "Accuracy  Train",
                        "type": "scatter",
                        "xsrc": "andikarisky28:0:a57010",
                        "ysrc": "andikarisky28:0:13c40a"
                    },
                    {
                        "meta": {
                            "columnNames": {
                                "x": "E",
                                "y": "B"
                            }
                        },
                        "mode": "lines",
                        "name": "Loss Train",
                        "type": "scatter",
                        "xsrc": "andikarisky28:0:a57010",
                        "ysrc": "andikarisky28:0:419de8",
                        "stackgroup": null
                    }
                ],
                "frames": [],
                "layout": {
                    "title": {
                        "text": "Click to enter Plot title"
                    },
                    "xaxis": {
                        "type": "linear",
                        "range": [
                            1,
                            7
                        ],
                        "autorange": true
                    },
                    "yaxis": {
                        "type": "linear",
                        "range": [
                            0.6899468269613054,
                            0.7189362082216475
                        ],
                        "autorange": true
                    },
                    "autosize": true,
                    "template": {
                        "data": {
                            "bar": [
                                {
                                    "type": "bar",
                                    "marker": {
                                        "colorbar": {
                                            "ticks": "",
                                            "outlinewidth": 0
                                        }
                                    }
                                }
                            ],
                            "table": [
                                {
                                    "type": "table",
                                    "cells": {
                                        "fill": {
                                            "color": "#EBF0F8"
                                        },
                                        "line": {
                                            "color": "white"
                                        }
                                    },
                                    "header": {
                                        "fill": {
                                            "color": "#C8D4E3"
                                        },
                                        "line": {
                                            "color": "white"
                                        }
                                    }
                                }
                            ],
                            "carpet": [
                                {
                                    "type": "carpet",
                                    "aaxis": {
                                        "gridcolor": "#C8D4E3",
                                        "linecolor": "#C8D4E3",
                                        "endlinecolor": "#2a3f5f",
                                        "minorgridcolor": "#C8D4E3",
                                        "startlinecolor": "#2a3f5f"
                                    },
                                    "baxis": {
                                        "gridcolor": "#C8D4E3",
                                        "linecolor": "#C8D4E3",
                                        "endlinecolor": "#2a3f5f",
                                        "minorgridcolor": "#C8D4E3",
                                        "startlinecolor": "#2a3f5f"
                                    }
                                }
                            ],
                            "mesh3d": [
                                {
                                    "type": "mesh3d",
                                    "colorbar": {
                                        "ticks": "",
                                        "outlinewidth": 0
                                    }
                                }
                            ],
                            "contour": [
                                {
                                    "type": "contour",
                                    "colorbar": {
                                        "ticks": "",
                                        "outlinewidth": 0
                                    },
                                    "autocolorscale": true
                                }
                            ],
                            "heatmap": [
                                {
                                    "type": "heatmap",
                                    "colorbar": {
                                        "ticks": "",
                                        "outlinewidth": 0
                                    },
                                    "autocolorscale": true
                                }
                            ],
                            "scatter": [
                                {
                                    "type": "scatter",
                                    "marker": {
                                        "colorbar": {
                                            "ticks": "",
                                            "outlinewidth": 0
                                        }
                                    }
                                }
                            ],
                            "surface": [
                                {
                                    "type": "surface",
                                    "colorbar": {
                                        "ticks": "",
                                        "outlinewidth": 0
                                    }
                                }
                            ],
                            "heatmapgl": [
                                {
                                    "type": "heatmapgl",
                                    "colorbar": {
                                        "ticks": "",
                                        "outlinewidth": 0
                                    }
                                }
                            ],
                            "histogram": [
                                {
                                    "type": "histogram",
                                    "marker": {
                                        "colorbar": {
                                            "ticks": "",
                                            "outlinewidth": 0
                                        }
                                    }
                                }
                            ],
                            "parcoords": [
                                {
                                    "line": {
                                        "colorbar": {
                                            "ticks": "",
                                            "outlinewidth": 0
                                        }
                                    },
                                    "type": "parcoords"
                                }
                            ],
                            "scatter3d": [
                                {
                                    "type": "scatter3d",
                                    "marker": {
                                        "colorbar": {
                                            "ticks": "",
                                            "outlinewidth": 0
                                        }
                                    }
                                }
                            ],
                            "scattergl": [
                                {
                                    "type": "scattergl",
                                    "marker": {
                                        "colorbar": {
                                            "ticks": "",
                                            "outlinewidth": 0
                                        }
                                    }
                                }
                            ],
                            "choropleth": [
                                {
                                    "type": "choropleth",
                                    "colorbar": {
                                        "ticks": "",
                                        "outlinewidth": 0
                                    }
                                }
                            ],
                            "scattergeo": [
                                {
                                    "type": "scattergeo",
                                    "marker": {
                                        "colorbar": {
                                            "ticks": "",
                                            "outlinewidth": 0
                                        }
                                    }
                                }
                            ],
                            "histogram2d": [
                                {
                                    "type": "histogram2d",
                                    "colorbar": {
                                        "ticks": "",
                                        "outlinewidth": 0
                                    },
                                    "autocolorscale": true
                                }
                            ],
                            "scatterpolar": [
                                {
                                    "type": "scatterpolar",
                                    "marker": {
                                        "colorbar": {
                                            "ticks": "",
                                            "outlinewidth": 0
                                        }
                                    }
                                }
                            ],
                            "contourcarpet": [
                                {
                                    "type": "contourcarpet",
                                    "colorbar": {
                                        "ticks": "",
                                        "outlinewidth": 0
                                    }
                                }
                            ],
                            "scattercarpet": [
                                {
                                    "type": "scattercarpet",
                                    "marker": {
                                        "colorbar": {
                                            "ticks": "",
                                            "outlinewidth": 0
                                        }
                                    }
                                }
                            ],
                            "scattermapbox": [
                                {
                                    "type": "scattermapbox",
                                    "marker": {
                                        "colorbar": {
                                            "ticks": "",
                                            "outlinewidth": 0
                                        }
                                    }
                                }
                            ],
                            "scatterpolargl": [
                                {
                                    "type": "scatterpolargl",
                                    "marker": {
                                        "colorbar": {
                                            "ticks": "",
                                            "outlinewidth": 0
                                        }
                                    }
                                }
                            ],
                            "scatterternary": [
                                {
                                    "type": "scatterternary",
                                    "marker": {
                                        "colorbar": {
                                            "ticks": "",
                                            "outlinewidth": 0
                                        }
                                    }
                                }
                            ],
                            "histogram2dcontour": [
                                {
                                    "type": "histogram2dcontour",
                                    "colorbar": {
                                        "ticks": "",
                                        "outlinewidth": 0
                                    },
                                    "autocolorscale": true
                                }
                            ]
                        },
                        "layout": {
                            "geo": {
                                "bgcolor": "white",
                                "showland": true,
                                "lakecolor": "white",
                                "landcolor": "white",
                                "showlakes": true,
                                "subunitcolor": "#C8D4E3"
                            },
                            "font": {
                                "color": "#2a3f5f"
                            },
                            "polar": {
                                "bgcolor": "white",
                                "radialaxis": {
                                    "ticks": "",
                                    "gridcolor": "#EBF0F8",
                                    "linecolor": "#EBF0F8"
                                },
                                "angularaxis": {
                                    "ticks": "",
                                    "gridcolor": "#EBF0F8",
                                    "linecolor": "#EBF0F8"
                                }
                            },
                            "scene": {
                                "xaxis": {
                                    "ticks": "",
                                    "gridcolor": "#DFE8F3",
                                    "gridwidth": 2,
                                    "linecolor": "#EBF0F8",
                                    "zerolinecolor": "#EBF0F8",
                                    "showbackground": true,
                                    "backgroundcolor": "white"
                                },
                                "yaxis": {
                                    "ticks": "",
                                    "gridcolor": "#DFE8F3",
                                    "gridwidth": 2,
                                    "linecolor": "#EBF0F8",
                                    "zerolinecolor": "#EBF0F8",
                                    "showbackground": true,
                                    "backgroundcolor": "white"
                                },
                                "zaxis": {
                                    "ticks": "",
                                    "gridcolor": "#DFE8F3",
                                    "gridwidth": 2,
                                    "linecolor": "#EBF0F8",
                                    "zerolinecolor": "#EBF0F8",
                                    "showbackground": true,
                                    "backgroundcolor": "white"
                                }
                            },
                            "title": {
                                "x": 0.05
                            },
                            "xaxis": {
                                "ticks": "",
                                "gridcolor": "#EBF0F8",
                                "linecolor": "#EBF0F8",
                                "automargin": true,
                                "zerolinecolor": "#EBF0F8",
                                "zerolinewidth": 2
                            },
                            "yaxis": {
                                "ticks": "",
                                "gridcolor": "#EBF0F8",
                                "linecolor": "#EBF0F8",
                                "automargin": true,
                                "zerolinecolor": "#EBF0F8",
                                "zerolinewidth": 2
                            },
                            "ternary": {
                                "aaxis": {
                                    "ticks": "",
                                    "gridcolor": "#DFE8F3",
                                    "linecolor": "#A2B1C6"
                                },
                                "baxis": {
                                    "ticks": "",
                                    "gridcolor": "#DFE8F3",
                                    "linecolor": "#A2B1C6"
                                },
                                "caxis": {
                                    "ticks": "",
                                    "gridcolor": "#DFE8F3",
                                    "linecolor": "#A2B1C6"
                                },
                                "bgcolor": "white"
                            },
                            "colorway": [
                                "#636efa",
                                "#EF553B",
                                "#00cc96",
                                "#ab63fa",
                                "#19d3f3",
                                "#e763fa",
                                "#fecb52",
                                "#ffa15a",
                                "#ff6692",
                                "#b6e880"
                            ],
                            "hovermode": "closest",
                            "colorscale": {
                                "diverging": [
                                    [
                                        0,
                                        "#8e0152"
                                    ],
                                    [
                                        0.1,
                                        "#c51b7d"
                                    ],
                                    [
                                        0.2,
                                        "#de77ae"
                                    ],
                                    [
                                        0.3,
                                        "#f1b6da"
                                    ],
                                    [
                                        0.4,
                                        "#fde0ef"
                                    ],
                                    [
                                        0.5,
                                        "#f7f7f7"
                                    ],
                                    [
                                        0.6,
                                        "#e6f5d0"
                                    ],
                                    [
                                        0.7,
                                        "#b8e186"
                                    ],
                                    [
                                        0.8,
                                        "#7fbc41"
                                    ],
                                    [
                                        0.9,
                                        "#4d9221"
                                    ],
                                    [
                                        1,
                                        "#276419"
                                    ]
                                ],
                                "sequential": [
                                    [
                                        0,
                                        "#0508b8"
                                    ],
                                    [
                                        0.0893854748603352,
                                        "#1910d8"
                                    ],
                                    [
                                        0.1787709497206704,
                                        "#3c19f0"
                                    ],
                                    [
                                        0.2681564245810056,
                                        "#6b1cfb"
                                    ],
                                    [
                                        0.3575418994413408,
                                        "#981cfd"
                                    ],
                                    [
                                        0.44692737430167595,
                                        "#bf1cfd"
                                    ],
                                    [
                                        0.5363128491620112,
                                        "#dd2bfd"
                                    ],
                                    [
                                        0.6256983240223464,
                                        "#f246fe"
                                    ],
                                    [
                                        0.7150837988826816,
                                        "#fc67fd"
                                    ],
                                    [
                                        0.8044692737430168,
                                        "#fe88fc"
                                    ],
                                    [
                                        0.8938547486033519,
                                        "#fea5fd"
                                    ],
                                    [
                                        0.9832402234636871,
                                        "#febefe"
                                    ],
                                    [
                                        1,
                                        "#fec3fe"
                                    ]
                                ],
                                "sequentialminus": [
                                    [
                                        0,
                                        "#0508b8"
                                    ],
                                    [
                                        0.0893854748603352,
                                        "#1910d8"
                                    ],
                                    [
                                        0.1787709497206704,
                                        "#3c19f0"
                                    ],
                                    [
                                        0.2681564245810056,
                                        "#6b1cfb"
                                    ],
                                    [
                                        0.3575418994413408,
                                        "#981cfd"
                                    ],
                                    [
                                        0.44692737430167595,
                                        "#bf1cfd"
                                    ],
                                    [
                                        0.5363128491620112,
                                        "#dd2bfd"
                                    ],
                                    [
                                        0.6256983240223464,
                                        "#f246fe"
                                    ],
                                    [
                                        0.7150837988826816,
                                        "#fc67fd"
                                    ],
                                    [
                                        0.8044692737430168,
                                        "#fe88fc"
                                    ],
                                    [
                                        0.8938547486033519,
                                        "#fea5fd"
                                    ],
                                    [
                                        0.9832402234636871,
                                        "#febefe"
                                    ],
                                    [
                                        1,
                                        "#fec3fe"
                                    ]
                                ]
                            },
                            "plot_bgcolor": "white",
                            "paper_bgcolor": "white",
                            "shapedefaults": {
                                "line": {
                                    "width": 0
                                },
                                "opacity": 0.4,
                                "fillcolor": "#506784"
                            },
                            "annotationdefaults": {
                                "arrowhead": 0,
                                "arrowcolor": "#506784",
                                "arrowwidth": 1
                            }
                        },
                        "themeRef": "PLOTLY_WHITE"
                    }
                }
            },
            "height": null,
            "width": null,
            "user": {
                "profile_url": "https://chart-studio.plotly.com/~andikarisky28",
                "avatar_url": "https://storage.googleapis.com/plotly-prod-profiles/53.jpg",
                "background_url": "https://storage.googleapis.com/plotly-prod-profiles/bg-2.jpg",
                "bio": "",
                "nickname": "",
                "website": "",
                "stream_tokens": null,
                "feature_set_id": null,
                "csrf_token": null,
                "date_joined": "2024-04-21 09:48:58",
                "mapbox_access_tokens": null,
                "has_password": null,
                "username": "andikarisky28",
                "email": null,
                "is_active": null,
                "readonly": null,
                "is_dash_creator": null,
                "dash_created_count": null,
                "is_chart_creator": null,
                "charts_created_count": null
            }
        },
        {
            "creation_time": "2024-04-21T09:49:23.823694Z",
            "comments": {
                "results": [],
                "count": 0
            },
            "parented": true,
            "embed_url": "https://chart-studio.plotly.com/~jay.p3497/6.embed",
            "fid": "jay.p3497:6",
            "filename": "rating-distribution-by-page-mobile-inp",
            "filetype": "plot",
            "img_url": "https://storage.googleapis.com/plotly-prod-images/jay.p3497/6/9_J7SU3W51NMOUAQ9ACGXM0NTJL0L8OK.png",
            "image_urls": {
                "default": "https://storage.googleapis.com/plotly-prod-images/jay.p3497/6/2_0I8IMHNMWJU5E5BSA757UMMS0BBXTI.png",
                "block-thumb": "https://storage.googleapis.com/plotly-prod-images/jay.p3497/6/8_AB125FGQAB6LMZUEWDJV4EYTM8QQQA.png",
                "list-thumb": "https://storage.googleapis.com/plotly-prod-images/jay.p3497/6/9_J7SU3W51NMOUAQ9ACGXM0NTJL0L8OK.png"
            },
            "api_urls": {
                "files": "https://api.plotly.com/v2/files/jay.p3497:6",
                "plots": "https://api.plotly.com/v2/plots/jay.p3497:6",
                "parent": "https://api.plotly.com/v2/folders/home?user=jay.p3497"
            },
            "owner": "jay.p3497",
            "parent": -1,
            "preview": "",
            "referencers": [],
            "references": [],
            "title": "Rating Distribution by Page (Mobile) with Name INP 23 April",
            "views": 2,
            "web_url": "https://chart-studio.plotly.com/~jay.p3497/6/rating-distribution-by-page-mobile-with-name-inp-23-april/",
            "world_readable": true,
            "date_modified": "2024-04-25T19:56:45.589Z",
            "stars": {
                "results": [],
                "count": 0
            },
            "collaborators": {
                "results": [],
                "count": 0
            },
            "subfolder_count": null,
            "refresh_interval": null,
            "organize_view_url": "https://chart-studio.plotly.com/~jay.p3497/6/",
            "current_user_permission": "read",
            "is_theme": null,
            "is_template": null,
            "autosize": true,
            "caption": "",
            "figure": {
                "data": [
                    {
                        "name": "Good",
                        "type": "bar",
                        "xsrc": "jay.p3497:9:ead42b",
                        "ysrc": "jay.p3497:9:c09603",
                        "marker": {
                            "color": "green"
                        }
                    },
                    {
                        "name": "Needs Improvement",
                        "type": "bar",
                        "xsrc": "jay.p3497:9:ead42b",
                        "ysrc": "jay.p3497:9:bc4a3f",
                        "marker": {
                            "color": "orange"
                        }
                    },
                    {
                        "name": "Poor",
                        "type": "bar",
                        "xsrc": "jay.p3497:9:ead42b",
                        "ysrc": "jay.p3497:9:1fe77a",
                        "marker": {
                            "color": "red"
                        }
                    }
                ],
                "layout": {
                    "title": "Rating Distribution by Page (Mobile) with Name INP 23 April",
                    "xaxis": {
                        "title": "Page"
                    },
                    "yaxis": {
                        "title": "Rating Percentage"
                    },
                    "barmode": "stack"
                }
            },
            "height": null,
            "width": null,
            "user": {
                "profile_url": "https://chart-studio.plotly.com/~jay.p3497",
                "avatar_url": "https://storage.googleapis.com/plotly-prod-profiles/56.jpg",
                "background_url": "https://storage.googleapis.com/plotly-prod-profiles/bg-0.jpg",
                "bio": "",
                "nickname": "",
                "website": "",
                "stream_tokens": null,
                "feature_set_id": null,
                "csrf_token": null,
                "date_joined": "2024-04-21 08:45:42",
                "mapbox_access_tokens": null,
                "has_password": null,
                "username": "jay.p3497",
                "email": null,
                "is_active": null,
                "readonly": null,
                "is_dash_creator": null,
                "dash_created_count": null,
                "is_chart_creator": null,
                "charts_created_count": null
            }
        },
        {
            "creation_time": "2024-04-21T09:49:23.795254Z",
            "comments": {
                "results": [],
                "count": 0
            },
            "parented": true,
            "embed_url": "https://chart-studio.plotly.com/~jay.p3497/7.embed",
            "fid": "jay.p3497:7",
            "filename": "rating-distribution-by-page-desktop-inp",
            "filetype": "plot",
            "img_url": "https://storage.googleapis.com/plotly-prod-images/jay.p3497/7/9_BCXM0V2SMFQ0KKP16L99BFBJ93B320.png",
            "image_urls": {
                "default": "https://storage.googleapis.com/plotly-prod-images/jay.p3497/7/2_FK2VS3V9NZNEC8YGUTZDDWSO8L8JH4.png",
                "block-thumb": "https://storage.googleapis.com/plotly-prod-images/jay.p3497/7/8_6O0UNBPXFOU60XGJNKVF0WZ33OFCIZ.png",
                "list-thumb": "https://storage.googleapis.com/plotly-prod-images/jay.p3497/7/9_BCXM0V2SMFQ0KKP16L99BFBJ93B320.png"
            },
            "api_urls": {
                "files": "https://api.plotly.com/v2/files/jay.p3497:7",
                "plots": "https://api.plotly.com/v2/plots/jay.p3497:7",
                "parent": "https://api.plotly.com/v2/folders/home?user=jay.p3497"
            },
            "owner": "jay.p3497",
            "parent": -1,
            "preview": "",
            "referencers": [],
            "references": [],
            "title": "Rating Distribution by Page (Desktop) with Name INP 23 April",
            "views": 1,
            "web_url": "https://chart-studio.plotly.com/~jay.p3497/7/rating-distribution-by-page-desktop-with-name-inp-23-april/",
            "world_readable": true,
            "date_modified": "2024-04-25T19:56:45.575Z",
            "stars": {
                "results": [],
                "count": 0
            },
            "collaborators": {
                "results": [],
                "count": 0
            },
            "subfolder_count": null,
            "refresh_interval": null,
            "organize_view_url": "https://chart-studio.plotly.com/~jay.p3497/7/",
            "current_user_permission": "read",
            "is_theme": null,
            "is_template": null,
            "autosize": true,
            "caption": "",
            "figure": {
                "data": [
                    {
                        "name": "Good",
                        "type": "bar",
                        "xsrc": "jay.p3497:8:24f216",
                        "ysrc": "jay.p3497:8:32c1ea",
                        "marker": {
                            "color": "green"
                        }
                    },
                    {
                        "name": "Needs Improvement",
                        "type": "bar",
                        "xsrc": "jay.p3497:8:24f216",
                        "ysrc": "jay.p3497:8:4ed9b9",
                        "marker": {
                            "color": "orange"
                        }
                    },
                    {
                        "name": "Poor",
                        "type": "bar",
                        "xsrc": "jay.p3497:8:24f216",
                        "ysrc": "jay.p3497:8:47a2f3",
                        "marker": {
                            "color": "red"
                        }
                    }
                ],
                "layout": {
                    "title": "Rating Distribution by Page (Desktop) with Name INP 23 April",
                    "xaxis": {
                        "title": "Page"
                    },
                    "yaxis": {
                        "title": "Rating Percentage"
                    },
                    "barmode": "stack"
                }
            },
            "height": null,
            "width": null,
            "user": {
                "profile_url": "https://chart-studio.plotly.com/~jay.p3497",
                "avatar_url": "https://storage.googleapis.com/plotly-prod-profiles/56.jpg",
                "background_url": "https://storage.googleapis.com/plotly-prod-profiles/bg-0.jpg",
                "bio": "",
                "nickname": "",
                "website": "",
                "stream_tokens": null,
                "feature_set_id": null,
                "csrf_token": null,
                "date_joined": "2024-04-21 08:45:42",
                "mapbox_access_tokens": null,
                "has_password": null,
                "username": "jay.p3497",
                "email": null,
                "is_active": null,
                "readonly": null,
                "is_dash_creator": null,
                "dash_created_count": null,
                "is_chart_creator": null,
                "charts_created_count": null
            }
        },
        {
            "creation_time": "2024-04-21T09:43:55.407453Z",
            "comments": {
                "results": [],
                "count": 0
            },
            "parented": true,
            "embed_url": "https://chart-studio.plotly.com/~elab/56.embed",
            "fid": "elab:56",
            "filename": "FGI_mobile",
            "filetype": "plot",
            "img_url": "https://storage.googleapis.com/plotly-prod-images/elab/56/9_I1GKDUVV7LKDTDIG42QI8BM8R00P4W.png",
            "image_urls": {
                "default": "https://storage.googleapis.com/plotly-prod-images/elab/56/2_ILJN219NJVPE6UBMNXA95KXTKH390T.png",
                "block-thumb": "https://storage.googleapis.com/plotly-prod-images/elab/56/8_FHS7XJ05EJXDSJ1T5CPP03F0EFCF9L.png",
                "list-thumb": "https://storage.googleapis.com/plotly-prod-images/elab/56/9_I1GKDUVV7LKDTDIG42QI8BM8R00P4W.png"
            },
            "api_urls": {
                "files": "https://api.plotly.com/v2/files/elab:56",
                "plots": "https://api.plotly.com/v2/plots/elab:56",
                "parent": "https://api.plotly.com/v2/folders/home?user=elab"
            },
            "owner": "elab",
            "parent": -1,
            "preview": "",
            "referencers": [],
            "references": [],
            "title": "",
            "views": 6,
            "web_url": "https://chart-studio.plotly.com/~elab/56/",
            "world_readable": true,
            "date_modified": "2024-04-21T09:45:42.356Z",
            "stars": {
                "results": [],
                "count": 0
            },
            "collaborators": {
                "results": [],
                "count": 0
            },
            "subfolder_count": null,
            "refresh_interval": null,
            "organize_view_url": "https://chart-studio.plotly.com/~elab/56/",
            "current_user_permission": "read",
            "is_theme": null,
            "is_template": null,
            "autosize": true,
            "caption": "",
            "figure": {
                "data": [
                    {
                        "mode": "lines",
                        "type": "scatter",
                        "xsrc": "elab:58:b94666",
                        "ysrc": "elab:58:8a917d"
                    }
                ],
                "layout": {
                    "width": 360,
                    "xaxis": {
                        "showgrid": true,
                        "tickfont": {
                            "size": 16
                        },
                        "ticktext": [
                            "24-04-2023",
                            "30-05-2023",
                            "06-07-2023",
                            "10-08-2023",
                            "15-09-2023",
                            "20-10-2023",
                            "27-11-2023",
                            "03-01-2024",
                            "08-02-2024",
                            "15-03-2024",
                            "19-04-2024"
                        ],
                        "tickvals": [
                            0,
                            25,
                            50,
                            75,
                            100,
                            125,
                            150,
                            175,
                            200,
                            225,
                            250
                        ],
                        "gridcolor": "lightgrey",
                        "gridwidth": 1,
                        "tickangle": 90
                    },
                    "yaxis": {
                        "showgrid": true,
                        "tickfont": {
                            "size": 16
                        },
                        "gridcolor": "lightgrey",
                        "gridwidth": 1
                    },
                    "height": 1200,
                    "shapes": [
                        {
                            "x0": "24-04-2023",
                            "x1": "20-04-2024",
                            "y0": 0,
                            "y1": 25,
                            "line": {
                                "color": "rgba(0,0,0,0)"
                            },
                            "type": "rect",
                            "layer": "below",
                            "opacity": 0.3,
                            "fillcolor": "darkgreen"
                        },
                        {
                            "x0": "24-04-2023",
                            "x1": "20-04-2024",
                            "y0": 25,
                            "y1": 45,
                            "line": {
                                "color": "rgba(0,0,0,0)"
                            },
                            "type": "rect",
                            "layer": "below",
                            "opacity": 0.3,
                            "fillcolor": "lightgreen"
                        },
                        {
                            "x0": "24-04-2023",
                            "x1": "20-04-2024",
                            "y0": 45,
                            "y1": 55,
                            "line": {
                                "color": "rgba(0,0,0,0)"
                            },
                            "type": "rect",
                            "layer": "below",
                            "opacity": 0.3,
                            "fillcolor": "yellow"
                        },
                        {
                            "x0": "24-04-2023",
                            "x1": "20-04-2024",
                            "y0": 55,
                            "y1": 75,
                            "line": {
                                "color": "rgba(0,0,0,0)"
                            },
                            "type": "rect",
                            "layer": "below",
                            "opacity": 0.3,
                            "fillcolor": "red"
                        },
                        {
                            "x0": "24-04-2023",
                            "x1": "20-04-2024",
                            "y0": 75,
                            "y1": 100,
                            "line": {
                                "color": "rgba(0,0,0,0)"
                            },
                            "type": "rect",
                            "layer": "below",
                            "opacity": 0.3,
                            "fillcolor": "black"
                        }
                    ],
                    "template": {
                        "layout": {
                            "annotations": [
                                {
                                    "x": 0.5,
                                    "y": 0.5,
                                    "font": {
                                        "size": 100,
                                        "color": "gold"
                                    },
                                    "name": "draft watermark",
                                    "text": "ELAB",
                                    "xref": "paper",
                                    "yref": "paper",
                                    "opacity": 0.3,
                                    "showarrow": false,
                                    "textangle": -30
                                }
                            ]
                        }
                    }
                }
            },
            "height": 1200,
            "width": 360,
            "user": {
                "profile_url": "https://chart-studio.plotly.com/~elab",
                "avatar_url": "https://storage.googleapis.com/plotly-prod-profiles/68.jpg",
                "background_url": "https://storage.googleapis.com/plotly-prod-profiles/bg-9.jpg",
                "bio": "",
                "nickname": "",
                "website": "",
                "stream_tokens": null,
                "feature_set_id": null,
                "csrf_token": null,
                "date_joined": "2024-04-11 05:29:21",
                "mapbox_access_tokens": null,
                "has_password": null,
                "username": "elab",
                "email": null,
                "is_active": null,
                "readonly": null,
                "is_dash_creator": null,
                "dash_created_count": null,
                "is_chart_creator": null,
                "charts_created_count": null
            }
        },
        {
            "creation_time": "2024-04-21T09:38:32.904490Z",
            "comments": {
                "results": [],
                "count": 0
            },
            "parented": true,
            "embed_url": "https://chart-studio.plotly.com/~elab/53.embed",
            "fid": "elab:53",
            "filename": "VIX2",
            "filetype": "plot",
            "img_url": "https://storage.googleapis.com/plotly-prod-images/elab/53/9_CW7JXCNMDG1STADB3Z9NLWDW5E8JH0.png",
            "image_urls": {
                "default": "https://storage.googleapis.com/plotly-prod-images/elab/53/2_AEM4FYH9MJDMWS9U8N6I0QGC8RG72Q.png",
                "block-thumb": "https://storage.googleapis.com/plotly-prod-images/elab/53/8_BJSAAJU6LXB8ZL4APC9UJHTC4UW1TV.png",
                "list-thumb": "https://storage.googleapis.com/plotly-prod-images/elab/53/9_CW7JXCNMDG1STADB3Z9NLWDW5E8JH0.png"
            },
            "api_urls": {
                "files": "https://api.plotly.com/v2/files/elab:53",
                "plots": "https://api.plotly.com/v2/plots/elab:53",
                "parent": "https://api.plotly.com/v2/folders/home?user=elab"
            },
            "owner": "elab",
            "parent": -1,
            "preview": "",
            "referencers": [],
            "references": [],
            "title": "",
            "views": 74,
            "web_url": "https://chart-studio.plotly.com/~elab/53/",
            "world_readable": true,
            "date_modified": "2024-04-21T09:38:32.915Z",
            "stars": {
                "results": [],
                "count": 0
            },
            "collaborators": {
                "results": [],
                "count": 0
            },
            "subfolder_count": null,
            "refresh_interval": null,
            "organize_view_url": "https://chart-studio.plotly.com/~elab/53/",
            "current_user_permission": "read",
            "is_theme": null,
            "is_template": null,
            "autosize": true,
            "caption": "",
            "figure": {
                "data": [
                    {
                        "mode": "lines",
                        "type": "scatter",
                        "xsrc": "elab:52:30a334",
                        "ysrc": "elab:52:a9e85d"
                    }
                ],
                "layout": {
                    "width": 700,
                    "xaxis": {
                        "showgrid": true,
                        "tickfont": {
                            "size": 16
                        },
                        "ticktext": [
                            "24-04-2023",
                            "12-05-2023",
                            "02-06-2023",
                            "23-06-2023",
                            "14-07-2023",
                            "03-08-2023",
                            "23-08-2023",
                            "13-09-2023",
                            "03-10-2023",
                            "23-10-2023",
                            "10-11-2023",
                            "01-12-2023",
                            "21-12-2023",
                            "12-01-2024",
                            "02-02-2024",
                            "23-02-2024",
                            "14-03-2024",
                            "04-04-2024"
                        ],
                        "tickvals": [
                            0,
                            14,
                            28,
                            42,
                            56,
                            70,
                            84,
                            98,
                            112,
                            126,
                            140,
                            154,
                            168,
                            182,
                            196,
                            210,
                            224,
                            238
                        ],
                        "gridcolor": "lightgrey",
                        "gridwidth": 1,
                        "tickangle": 45
                    },
                    "yaxis": {
                        "showgrid": true,
                        "tickfont": {
                            "size": 16
                        },
                        "gridcolor": "lightgrey",
                        "gridwidth": 1
                    },
                    "height": 600,
                    "shapes": [
                        {
                            "x0": "24-04-2023",
                            "x1": "19-04-2024",
                            "y0": 10,
                            "y1": 15,
                            "line": {
                                "dash": "dash",
                                "color": "red",
                                "width": 4
                            },
                            "type": "rect",
                            "layer": "below",
                            "opacity": 0.3,
                            "fillcolor": "lightgreen"
                        }
                    ],
                    "template": {
                        "layout": {
                            "annotations": [
                                {
                                    "x": 0.5,
                                    "y": 0.5,
                                    "font": {
                                        "size": 100,
                                        "color": "gold"
                                    },
                                    "name": "draft watermark",
                                    "text": "ELAB",
                                    "xref": "paper",
                                    "yref": "paper",
                                    "opacity": 0.3,
                                    "showarrow": false,
                                    "textangle": -30
                                }
                            ]
                        }
                    }
                }
            },
            "height": 600,
            "width": 700,
            "user": {
                "profile_url": "https://chart-studio.plotly.com/~elab",
                "avatar_url": "https://storage.googleapis.com/plotly-prod-profiles/68.jpg",
                "background_url": "https://storage.googleapis.com/plotly-prod-profiles/bg-9.jpg",
                "bio": "",
                "nickname": "",
                "website": "",
                "stream_tokens": null,
                "feature_set_id": null,
                "csrf_token": null,
                "date_joined": "2024-04-11 05:29:21",
                "mapbox_access_tokens": null,
                "has_password": null,
                "username": "elab",
                "email": null,
                "is_active": null,
                "readonly": null,
                "is_dash_creator": null,
                "dash_created_count": null,
                "is_chart_creator": null,
                "charts_created_count": null
            }
        },
        {
            "creation_time": "2024-04-21T09:34:30.351017Z",
            "comments": {
                "results": [],
                "count": 0
            },
            "parented": true,
            "embed_url": "https://chart-studio.plotly.com/~jay.p3497/4.embed",
            "fid": "jay.p3497:4",
            "filename": "rating-distribution-by-page-desktop",
            "filetype": "plot",
            "img_url": "https://storage.googleapis.com/plotly-prod-images/jay.p3497/4/9_0FFD070PUIDAVWEPZY0I2J9AYMVJAZ.png",
            "image_urls": {
                "default": "https://storage.googleapis.com/plotly-prod-images/jay.p3497/4/2_THA8E542D79CHLWX5N56FTDGXSMASX.png",
                "block-thumb": "https://storage.googleapis.com/plotly-prod-images/jay.p3497/4/8_T1X1NKPEM39XTLDEDK5NJ6Y133ZPTM.png",
                "list-thumb": "https://storage.googleapis.com/plotly-prod-images/jay.p3497/4/9_0FFD070PUIDAVWEPZY0I2J9AYMVJAZ.png"
            },
            "api_urls": {
                "files": "https://api.plotly.com/v2/files/jay.p3497:4",
                "plots": "https://api.plotly.com/v2/plots/jay.p3497:4",
                "parent": "https://api.plotly.com/v2/folders/home?user=jay.p3497"
            },
            "owner": "jay.p3497",
            "parent": -1,
            "preview": "",
            "referencers": [],
            "references": [],
            "title": "Rating Distribution by Page Name (Desktop)",
            "views": 1,
            "web_url": "https://chart-studio.plotly.com/~jay.p3497/4/rating-distribution-by-page-name-desktop/",
            "world_readable": true,
            "date_modified": "2024-04-21T09:39:26.480Z",
            "stars": {
                "results": [],
                "count": 0
            },
            "collaborators": {
                "results": [],
                "count": 0
            },
            "subfolder_count": null,
            "refresh_interval": null,
            "organize_view_url": "https://chart-studio.plotly.com/~jay.p3497/4/",
            "current_user_permission": "read",
            "is_theme": null,
            "is_template": null,
            "autosize": true,
            "caption": "",
            "figure": {
                "data": [
                    {
                        "name": "Good",
                        "type": "bar",
                        "xsrc": "jay.p3497:5:a8602c",
                        "ysrc": "jay.p3497:5:a52d69",
                        "marker": {
                            "color": "green"
                        }
                    },
                    {
                        "name": "Needs Improvement",
                        "type": "bar",
                        "xsrc": "jay.p3497:5:a8602c",
                        "ysrc": "jay.p3497:5:c8527d",
                        "marker": {
                            "color": "orange"
                        }
                    },
                    {
                        "name": "Poor",
                        "type": "bar",
                        "xsrc": "jay.p3497:5:a8602c",
                        "ysrc": "jay.p3497:5:fdf317",
                        "marker": {
                            "color": "red"
                        }
                    }
                ],
                "layout": {
                    "title": "Rating Distribution by Page Name (Desktop)",
                    "xaxis": {
                        "title": "Page Name"
                    },
                    "yaxis": {
                        "title": "Rating Percentage"
                    },
                    "barmode": "stack"
                }
            },
            "height": null,
            "width": null,
            "user": {
                "profile_url": "https://chart-studio.plotly.com/~jay.p3497",
                "avatar_url": "https://storage.googleapis.com/plotly-prod-profiles/56.jpg",
                "background_url": "https://storage.googleapis.com/plotly-prod-profiles/bg-0.jpg",
                "bio": "",
                "nickname": "",
                "website": "",
                "stream_tokens": null,
                "feature_set_id": null,
                "csrf_token": null,
                "date_joined": "2024-04-21 08:45:42",
                "mapbox_access_tokens": null,
                "has_password": null,
                "username": "jay.p3497",
                "email": null,
                "is_active": null,
                "readonly": null,
                "is_dash_creator": null,
                "dash_created_count": null,
                "is_chart_creator": null,
                "charts_created_count": null
            }
        },
        {
            "creation_time": "2024-04-21T08:56:45.480232Z",
            "comments": {
                "results": [],
                "count": 0
            },
            "parented": true,
            "embed_url": "https://chart-studio.plotly.com/~jay.p3497/2.embed",
            "fid": "jay.p3497:2",
            "filename": "rating-distribution-by-page-mobile",
            "filetype": "plot",
            "img_url": "https://storage.googleapis.com/plotly-prod-images/jay.p3497/2/9_QZ0M76Y82C2J7IJKL2F7UW8K5Q34IK.png",
            "image_urls": {
                "default": "https://storage.googleapis.com/plotly-prod-images/jay.p3497/2/2_SH83YZ3AP06OISJJEH7JA7DDT2P54A.png",
                "block-thumb": "https://storage.googleapis.com/plotly-prod-images/jay.p3497/2/8_AHPRLU6MFPJZ4O991IW6JICMDHVVXQ.png",
                "list-thumb": "https://storage.googleapis.com/plotly-prod-images/jay.p3497/2/9_QZ0M76Y82C2J7IJKL2F7UW8K5Q34IK.png"
            },
            "api_urls": {
                "files": "https://api.plotly.com/v2/files/jay.p3497:2",
                "plots": "https://api.plotly.com/v2/plots/jay.p3497:2",
                "parent": "https://api.plotly.com/v2/folders/home?user=jay.p3497"
            },
            "owner": "jay.p3497",
            "parent": -1,
            "preview": "",
            "referencers": [],
            "references": [],
            "title": "Rating Distribution by Page Name (Mobile)",
            "views": 1,
            "web_url": "https://chart-studio.plotly.com/~jay.p3497/2/rating-distribution-by-page-name-mobile/",
            "world_readable": true,
            "date_modified": "2024-04-21T09:39:26.432Z",
            "stars": {
                "results": [],
                "count": 0
            },
            "collaborators": {
                "results": [],
                "count": 0
            },
            "subfolder_count": null,
            "refresh_interval": null,
            "organize_view_url": "https://chart-studio.plotly.com/~jay.p3497/2/",
            "current_user_permission": "read",
            "is_theme": null,
            "is_template": null,
            "autosize": true,
            "caption": "",
            "figure": {
                "data": [
                    {
                        "name": "Good",
                        "type": "bar",
                        "xsrc": "jay.p3497:3:14c40d",
                        "ysrc": "jay.p3497:3:3b7e7f",
                        "marker": {
                            "color": "green"
                        }
                    },
                    {
                        "name": "Needs Improvement",
                        "type": "bar",
                        "xsrc": "jay.p3497:3:14c40d",
                        "ysrc": "jay.p3497:3:f71c7d",
                        "marker": {
                            "color": "orange"
                        }
                    },
                    {
                        "name": "Poor",
                        "type": "bar",
                        "xsrc": "jay.p3497:3:14c40d",
                        "ysrc": "jay.p3497:3:096356",
                        "marker": {
                            "color": "red"
                        }
                    }
                ],
                "layout": {
                    "title": "Rating Distribution by Page Name (Mobile)",
                    "xaxis": {
                        "title": "Page Name"
                    },
                    "yaxis": {
                        "title": "Rating Percentage"
                    },
                    "barmode": "stack"
                }
            },
            "height": null,
            "width": null,
            "user": {
                "profile_url": "https://chart-studio.plotly.com/~jay.p3497",
                "avatar_url": "https://storage.googleapis.com/plotly-prod-profiles/56.jpg",
                "background_url": "https://storage.googleapis.com/plotly-prod-profiles/bg-0.jpg",
                "bio": "",
                "nickname": "",
                "website": "",
                "stream_tokens": null,
                "feature_set_id": null,
                "csrf_token": null,
                "date_joined": "2024-04-21 08:45:42",
                "mapbox_access_tokens": null,
                "has_password": null,
                "username": "jay.p3497",
                "email": null,
                "is_active": null,
                "readonly": null,
                "is_dash_creator": null,
                "dash_created_count": null,
                "is_chart_creator": null,
                "charts_created_count": null
            }
        }
    ]
}