Plots List
Plots
This endpoint handles manipulation of Plotly plot files.
Reference
Authorization
Any user with or without a Plotly account may view public plots. For private plots, see authentication.
Actions
list
Listing all public plots can be done via a GET request to this endpoint.
By default, plots will be listed in order of date created. The order_by
query parameter is accepted at this endpoint. Currently, only ordering by
views is supported. It is possible to filter the plots by quality
with min_quality or max_quality as query parameter.
Example:
// GET https://api.plotly.com/v2/plots/ ---> 200

// GET https://api.plotly.com/v2/plots/?order_by=-views ---> 200

// GET https://api.plotly.com/v2/plots/?min_quality=5 ---> 200

// GET https://api.plotly.com/v2/plots/?max_quality=5 ---> 200
feed
Listing all handpicked feed plots can be done via a GET request to this endpoint. By default, plots will be listed in a random order.
Example:
// GET https://api.plotly.com/v2/plots/feed ---> 200
create
You can create new plot resources here. The only required field is 'figure'. Currently, the figure is restricted to only contain references to grid data. That is, this will fail if raw data arrays are passed in. To create and manipulate underlying grids for plots, see the grids endpoint.
Example:
// This fails because a figure field is required.
// POST https://api.plotly.com/v2/plots ---> 400 Bad Request
{}

// This fails because the figure has raw data
//POST https://api.plotly.com/v2/plots ---> 400 Bad Request
{
    "figure": {"data": [{"y": ['this', 'is', 'raw', 'data']}]}
}

// This succeeds because the figure has src keys, not raw data.
//POST https://api.plotly.com/v2/plots ---> 200 OK
{
    "figure": {"data": [{"ysrc": "sven:88:u8nd62"}]}
}
When creating a grid, you can optionally specify a source_fid to specify where a plot has come from:
- source_fid: the fid of a plot that was copied (and presumably edited) to produce this one
detail
There is a lot of meta information stored about plot files including filename, title, share_url, and content_url to name a few.
This information can only be reached with a GET to this endpoint.
Example:
// GET https://api.plotly.com/v2/plots/iheartgraphs:90
content
The contents of a plot can be downloaded via the content resource. The plot
content contains referenced grid/column data by default. If you wish to
return the raw grid/column data, the inline_data=true query must be included
in the request url. The Content-Type header will be appropriately set for the
response body.
Alternatively, you can set ?map_data=unreadable to append a mapping of
sources to data that belongs to grids which are unreadable for the
requestor. This is useful when you have read access to another users plot,
but that plot contains grid references which you don't have access to.
Examples:
// Returns referenced grid/column data
// GET https://api.plotly.com/v2/plots/iheartgraphs:90/content ---> 200 OK

// Returns full grid/column data
// GET https://api.plotly.com/v2/plots/iheartgraphs:90/content?inline_data=true ---> 200 OK

// Returns full grid/column data when requestor doesn't have permission
// to read the referenced grid.
// GET https://api.plotly.com/v2/plots/iheartgraphs:90/content?map_data=unreadable ---> 200 OK
GET /v2/plots?cursor=cD0yMDI1LTA2LTA2KzEwJTNBNTMlM0EzNS4xNTU0NDclMkIwMCUzQTAw&format=api
{ "next": "https://api.plotly.com/v2/plots?cursor=cD0yMDI1LTA2LTA2KzA2JTNBMzElM0EzMi45ODY4MjAlMkIwMCUzQTAw&format=api", "previous": "https://api.plotly.com/v2/plots?cursor=cj0xJnA9MjAyNS0wNi0wNisxMCUzQTQzJTNBMjkuNjM2NDA0JTJCMDAlM0EwMA%3D%3D&format=api", "results": [ { "creation_time": "2025-06-06T10:43:29.636404Z", "comments": { "results": [], "count": 0 }, "parented": true, "embed_url": "https://chart-studio.plotly.com/~Stuart.Duggan/2.embed", "fid": "Stuart.Duggan:2", "filename": "Plot 2", "filetype": "plot", "img_url": "https://api.plotly.com/v2/files/Stuart.Duggan:2/image?image_name=list-thumb", "image_urls": { "default": "https://api.plotly.com/v2/files/Stuart.Duggan:2/image?image_name=default", "block-thumb": "https://storage.googleapis.com/plotly-prod-images/Stuart.Duggan/2/8_SSU7E2AMGQEJEE8JW6T97HAX6P7L25.png", "list-thumb": "https://api.plotly.com/v2/files/Stuart.Duggan:2/image?image_name=list-thumb" }, "api_urls": { "files": "https://api.plotly.com/v2/files/Stuart.Duggan:2", "plots": "https://api.plotly.com/v2/plots/Stuart.Duggan:2", "parent": "https://api.plotly.com/v2/folders/home?user=Stuart.Duggan" }, "owner": "Stuart.Duggan", "parent": -1, "preview": "", "referencers": [], "references": [], "title": "", "views": 0, "web_url": "https://chart-studio.plotly.com/~Stuart.Duggan/2/", "world_readable": true, "date_modified": "2025-06-06T10:43:29.648Z", "stars": { "results": [], "count": 0 }, "collaborators": { "results": [], "count": 0 }, "subfolder_count": null, "refresh_interval": null, "organize_view_url": "https://chart-studio.plotly.com/~Stuart.Duggan/2/", "current_user_permission": "read", "is_theme": null, "is_template": false, "autosize": true, "caption": "", "figure": { "data": [ { "link": { "meta": { "columnNames": { "value": "Value", "source": "Source", "target": "Target" } }, "valuesrc": "Stuart.Duggan:1:448298", "sourcesrc": "Stuart.Duggan:1:c31035", "targetsrc": "Stuart.Duggan:1:a87745" }, "meta": { "columnNames": { "link": { "value": "Value", "source": "Source", "target": "Target" }, "node": { "x": "A", "y": "B", "label": "A", "groups": "B" } } }, "mode": "markers", "node": { "meta": { "columnNames": { "x": "A", "y": "B", "label": "A", "groups": "B" } }, "xsrc": "Stuart.Duggan:0:3d044e", "ysrc": "Stuart.Duggan:0:fefb5d", "labelsrc": "Stuart.Duggan:0:3d044e", "groupssrc": "Stuart.Duggan:0:fefb5d" }, "type": "sankey", "domain": { "x": [ 0, 1 ] }, "orientation": "h" } ], "frames": [], "layout": { "title": { "text": "Balance sheet" }, "xaxis": { "range": [ -1, 6 ], "autorange": true }, "yaxis": { "range": [ -1, 4 ], "autorange": true }, "autosize": true, "template": { "data": { "bar": [ { "type": "bar", "marker": { "colorbar": { "ticks": "", "outlinewidth": 0 } } } ], "table": [ { "type": "table", "cells": { "fill": { "color": "#EBF0F8" }, "line": { "color": "white" } }, "header": { "fill": { "color": "#C8D4E3" }, "line": { "color": "white" } } } ], "carpet": [ { "type": "carpet", "aaxis": { "gridcolor": "#C8D4E3", "linecolor": "#C8D4E3", "endlinecolor": "#2a3f5f", "minorgridcolor": "#C8D4E3", "startlinecolor": "#2a3f5f" }, "baxis": { "gridcolor": "#C8D4E3", "linecolor": "#C8D4E3", "endlinecolor": "#2a3f5f", "minorgridcolor": "#C8D4E3", "startlinecolor": "#2a3f5f" } } ], "mesh3d": [ { "type": "mesh3d", "colorbar": { "ticks": "", "outlinewidth": 0 } } ], "contour": [ { "type": "contour", "colorbar": { "ticks": "", "outlinewidth": 0 }, "autocolorscale": true } ], "heatmap": [ { "type": "heatmap", "colorbar": { "ticks": "", "outlinewidth": 0 }, "autocolorscale": true } ], "scatter": [ { "type": "scatter", "marker": { "colorbar": { "ticks": "", "outlinewidth": 0 } } } ], "surface": [ { "type": "surface", "colorbar": { "ticks": "", "outlinewidth": 0 } } ], "heatmapgl": [ { "type": "heatmapgl", "colorbar": { "ticks": "", "outlinewidth": 0 } } ], "histogram": [ { "type": "histogram", "marker": { "colorbar": { "ticks": "", "outlinewidth": 0 } } } ], "parcoords": [ { "line": { "colorbar": { "ticks": "", "outlinewidth": 0 } }, "type": "parcoords" } ], "scatter3d": [ { "type": "scatter3d", "marker": { "colorbar": { "ticks": "", "outlinewidth": 0 } } } ], "scattergl": [ { "type": "scattergl", "marker": { "colorbar": { "ticks": "", "outlinewidth": 0 } } } ], "choropleth": [ { "type": "choropleth", "colorbar": { "ticks": "", "outlinewidth": 0 } } ], "scattergeo": [ { "type": "scattergeo", "marker": { "colorbar": { "ticks": "", "outlinewidth": 0 } } } ], "histogram2d": [ { "type": "histogram2d", "colorbar": { "ticks": "", "outlinewidth": 0 }, "autocolorscale": true } ], "scatterpolar": [ { "type": "scatterpolar", "marker": { "colorbar": { "ticks": "", "outlinewidth": 0 } } } ], "contourcarpet": [ { "type": "contourcarpet", "colorbar": { "ticks": "", "outlinewidth": 0 } } ], "scattercarpet": [ { "type": "scattercarpet", "marker": { "colorbar": { "ticks": "", "outlinewidth": 0 } } } ], "scattermapbox": [ { "type": "scattermapbox", "marker": { "colorbar": { "ticks": "", "outlinewidth": 0 } } } ], "scatterpolargl": [ { "type": "scatterpolargl", "marker": { "colorbar": { "ticks": "", "outlinewidth": 0 } } } ], "scatterternary": [ { "type": "scatterternary", "marker": { "colorbar": { "ticks": "", "outlinewidth": 0 } } } ], "histogram2dcontour": [ { "type": "histogram2dcontour", "colorbar": { "ticks": "", "outlinewidth": 0 }, "autocolorscale": true } ] }, "layout": { "geo": { "bgcolor": "white", "showland": true, "lakecolor": "white", "landcolor": "white", "showlakes": true, "subunitcolor": "#C8D4E3" }, "font": { "color": "#2a3f5f" }, "polar": { "bgcolor": "white", "radialaxis": { "ticks": "", "gridcolor": "#EBF0F8", "linecolor": "#EBF0F8" }, "angularaxis": { "ticks": "", "gridcolor": "#EBF0F8", "linecolor": "#EBF0F8" } }, "scene": { "xaxis": { "ticks": "", "gridcolor": "#DFE8F3", "gridwidth": 2, "linecolor": "#EBF0F8", "zerolinecolor": "#EBF0F8", "showbackground": true, "backgroundcolor": "white" }, "yaxis": { "ticks": "", "gridcolor": "#DFE8F3", "gridwidth": 2, "linecolor": "#EBF0F8", "zerolinecolor": "#EBF0F8", "showbackground": true, "backgroundcolor": "white" }, "zaxis": { "ticks": "", "gridcolor": "#DFE8F3", "gridwidth": 2, "linecolor": "#EBF0F8", "zerolinecolor": "#EBF0F8", "showbackground": true, "backgroundcolor": "white" } }, "title": { "x": 0.05 }, "xaxis": { "ticks": "", "gridcolor": "#EBF0F8", "linecolor": "#EBF0F8", "automargin": true, "zerolinecolor": "#EBF0F8", "zerolinewidth": 2 }, "yaxis": { "ticks": "", "gridcolor": "#EBF0F8", "linecolor": "#EBF0F8", "automargin": true, "zerolinecolor": "#EBF0F8", "zerolinewidth": 2 }, "ternary": { "aaxis": { "ticks": "", "gridcolor": "#DFE8F3", "linecolor": "#A2B1C6" }, "baxis": { "ticks": "", "gridcolor": "#DFE8F3", "linecolor": "#A2B1C6" }, "caxis": { "ticks": "", "gridcolor": "#DFE8F3", "linecolor": "#A2B1C6" }, "bgcolor": "white" }, "colorway": [ "#636efa", "#EF553B", "#00cc96", "#ab63fa", "#19d3f3", "#e763fa", "#fecb52", "#ffa15a", "#ff6692", "#b6e880" ], "hovermode": "closest", "colorscale": { "diverging": [ [ 0, "#8e0152" ], [ 0.1, "#c51b7d" ], [ 0.2, "#de77ae" ], [ 0.3, "#f1b6da" ], [ 0.4, "#fde0ef" ], [ 0.5, "#f7f7f7" ], [ 0.6, "#e6f5d0" ], [ 0.7, "#b8e186" ], [ 0.8, "#7fbc41" ], [ 0.9, "#4d9221" ], [ 1, "#276419" ] ], "sequential": [ [ 0, "#0508b8" ], [ 0.0893854748603352, "#1910d8" ], [ 0.1787709497206704, "#3c19f0" ], [ 0.2681564245810056, "#6b1cfb" ], [ 0.3575418994413408, "#981cfd" ], [ 0.44692737430167595, "#bf1cfd" ], [ 0.5363128491620112, "#dd2bfd" ], [ 0.6256983240223464, "#f246fe" ], [ 0.7150837988826816, "#fc67fd" ], [ 0.8044692737430168, "#fe88fc" ], [ 0.8938547486033519, "#fea5fd" ], [ 0.9832402234636871, "#febefe" ], [ 1, "#fec3fe" ] ], "sequentialminus": [ [ 0, "#0508b8" ], [ 0.0893854748603352, "#1910d8" ], [ 0.1787709497206704, "#3c19f0" ], [ 0.2681564245810056, "#6b1cfb" ], [ 0.3575418994413408, "#981cfd" ], [ 0.44692737430167595, "#bf1cfd" ], [ 0.5363128491620112, "#dd2bfd" ], [ 0.6256983240223464, "#f246fe" ], [ 0.7150837988826816, "#fc67fd" ], [ 0.8044692737430168, "#fe88fc" ], [ 0.8938547486033519, "#fea5fd" ], [ 0.9832402234636871, "#febefe" ], [ 1, "#fec3fe" ] ] }, "plot_bgcolor": "white", "paper_bgcolor": "white", "shapedefaults": { "line": { "width": 0 }, "opacity": 0.4, "fillcolor": "#506784" }, "annotationdefaults": { "arrowhead": 0, "arrowcolor": "#506784", "arrowwidth": 1 } }, "themeRef": "PLOTLY_WHITE" } } }, "height": null, "width": null, "user": { "profile_url": "https://chart-studio.plotly.com/~Stuart.Duggan", "avatar_url": "https://storage.googleapis.com/plotly-prod-profiles/18.jpg", "background_url": "https://storage.googleapis.com/plotly-prod-profiles/bg-6.jpg", "bio": "", "nickname": "", "website": "", "stream_tokens": null, "feature_set_id": null, "csrf_token": null, "date_joined": "2025-06-06 10:42:36", "mapbox_access_tokens": null, "has_password": null, "username": "Stuart.Duggan", "email": null, "is_active": null, "readonly": null, "is_dash_creator": null, "dash_created_count": null, "is_chart_creator": null, "charts_created_count": null } }, { "creation_time": "2025-06-06T09:51:35.889042Z", "comments": { "results": [], "count": 0 }, "parented": true, "embed_url": "https://chart-studio.plotly.com/~Misterroni/3.embed", "fid": "Misterroni:3", "filename": "Plot 1 copy", "filetype": "plot", "img_url": "https://api.plotly.com/v2/files/Misterroni:3/image?image_name=list-thumb", "image_urls": { "default": "https://api.plotly.com/v2/files/Misterroni:3/image?image_name=default", "block-thumb": "https://storage.googleapis.com/plotly-prod-images/Misterroni/3/8_ZVOG9E38GV58B6WBN4ZN3LRISTL0FI.png", "list-thumb": "https://api.plotly.com/v2/files/Misterroni:3/image?image_name=list-thumb" }, "api_urls": { "files": "https://api.plotly.com/v2/files/Misterroni:3", "plots": "https://api.plotly.com/v2/plots/Misterroni:3", "parent": "https://api.plotly.com/v2/folders/home?user=Misterroni" }, "owner": "Misterroni", "parent": -1, "preview": "", "referencers": [], "references": [], "title": "", "views": 1, "web_url": "https://chart-studio.plotly.com/~Misterroni/3/", "world_readable": true, "date_modified": "2025-06-06T09:51:36.288Z", "stars": { "results": [], "count": 0 }, "collaborators": { "results": [], "count": 0 }, "subfolder_count": null, "refresh_interval": null, "organize_view_url": "https://chart-studio.plotly.com/~Misterroni/3/", "current_user_permission": "read", "is_theme": null, "is_template": false, "autosize": true, "caption": "", "figure": { "data": [ { "uid": "c7a1ba", "meta": { "columnNames": { "x": "A", "y": "B" } }, "mode": "markers", "name": "<b>measurements</b>", "type": "scatter", "xsrc": "Misterroni:2:b7b726", "ysrc": "Misterroni:2:209450", "marker": { "color": "rgb(15, 158, 213)" }, "visible": true, "orientation": "v" }, { "uid": "2f5d58", "name": "<b>Fit of measurements</b>", "transforms": [ { "rms": "", "type": "fit", "inputUid": "c7a1ba", "regressor": "x", "parameters": [ { "hold": false, "name": "m", "error": 6.960046571132374e-05, "value": 0.0011143747815927961 }, { "hold": false, "name": "b", "error": 0.010430854642539044, "value": 0.01804374465070833 } ], "regressand": "y", "correlation": "", "fitfunction": "m*x + b", "inputxrange": [], "outputxrange": [], "interpolation": 50 } ] } ], "frames": [], "layout": { "font": { "family": "Arial" }, "title": { "text": "<b>Proportionality of P</b><sub><b>electr.</b></sub><b> and v</b><sup><b>3</b></sup>" }, "xaxis": { "type": "linear", "range": [ 31.49455550548295, 238.36144449451703 ], "title": { "text": "<b>v</b><sup><b>3</b></sup>" }, "autorange": false }, "yaxis": { "type": "linear", "range": [ 0.05339184891917882, 0.30200613876559146 ], "title": { "text": "<b>P</b><sub><b>electr.</b></sub><br>" }, "autorange": true }, "legend": { "title": { "text": "<br>" } }, "autosize": true, "template": { "data": { "bar": [ { "type": "bar", "marker": { "colorbar": { "ticks": "", "outlinewidth": 0 } } } ], "table": [ { "type": "table", "cells": { "fill": { "color": "#EBF0F8" }, "line": { "color": "white" } }, "header": { "fill": { "color": "#C8D4E3" }, "line": { "color": "white" } } } ], "carpet": [ { "type": "carpet", "aaxis": { "gridcolor": "#C8D4E3", "linecolor": "#C8D4E3", "endlinecolor": "#2a3f5f", "minorgridcolor": "#C8D4E3", "startlinecolor": "#2a3f5f" }, "baxis": { "gridcolor": "#C8D4E3", "linecolor": "#C8D4E3", "endlinecolor": "#2a3f5f", "minorgridcolor": "#C8D4E3", "startlinecolor": "#2a3f5f" } } ], "mesh3d": [ { "type": "mesh3d", "colorbar": { "ticks": "", "outlinewidth": 0 } } ], "contour": [ { "type": "contour", "colorbar": { "ticks": "", "outlinewidth": 0 }, "autocolorscale": true } ], "heatmap": [ { "type": "heatmap", "colorbar": { "ticks": "", "outlinewidth": 0 }, "autocolorscale": true } ], "scatter": [ { "type": "scatter", "marker": { "colorbar": { "ticks": "", "outlinewidth": 0 } } } ], "surface": [ { "type": "surface", "colorbar": { "ticks": "", "outlinewidth": 0 } } ], "heatmapgl": [ { "type": "heatmapgl", "colorbar": { "ticks": "", "outlinewidth": 0 } } ], "histogram": [ { "type": "histogram", "marker": { "colorbar": { "ticks": "", "outlinewidth": 0 } } } ], "parcoords": [ { "line": { "colorbar": { "ticks": "", "outlinewidth": 0 } }, "type": "parcoords" } ], "scatter3d": [ { "type": "scatter3d", "marker": { "colorbar": { "ticks": "", "outlinewidth": 0 } } } ], "scattergl": [ { "type": "scattergl", "marker": { "colorbar": { "ticks": "", "outlinewidth": 0 } } } ], "choropleth": [ { "type": "choropleth", "colorbar": { "ticks": "", "outlinewidth": 0 } } ], "scattergeo": [ { "type": "scattergeo", "marker": { "colorbar": { "ticks": "", "outlinewidth": 0 } } } ], "histogram2d": [ { "type": "histogram2d", "colorbar": { "ticks": "", "outlinewidth": 0 }, "autocolorscale": true } ], "scatterpolar": [ { "type": "scatterpolar", "marker": { "colorbar": { "ticks": "", "outlinewidth": 0 } } } ], "contourcarpet": [ { "type": "contourcarpet", "colorbar": { "ticks": "", "outlinewidth": 0 } } ], "scattercarpet": [ { "type": "scattercarpet", "marker": { "colorbar": { "ticks": "", "outlinewidth": 0 } } } ], "scattermapbox": [ { "type": "scattermapbox", "marker": { "colorbar": { "ticks": "", "outlinewidth": 0 } } } ], "scatterpolargl": [ { "type": "scatterpolargl", "marker": { "colorbar": { "ticks": "", "outlinewidth": 0 } } } ], "scatterternary": [ { "type": "scatterternary", "marker": { "colorbar": { "ticks": "", "outlinewidth": 0 } } } ], "histogram2dcontour": [ { "type": "histogram2dcontour", "colorbar": { "ticks": "", "outlinewidth": 0 }, "autocolorscale": true } ] }, "layout": { "geo": { "bgcolor": "white", "showland": true, "lakecolor": "white", "landcolor": "white", "showlakes": true, "subunitcolor": "#C8D4E3" }, "font": { "color": "#2a3f5f" }, "polar": { "bgcolor": "white", "radialaxis": { "ticks": "", "gridcolor": "#EBF0F8", "linecolor": "#EBF0F8" }, "angularaxis": { "ticks": "", "gridcolor": "#EBF0F8", "linecolor": "#EBF0F8" } }, "scene": { "xaxis": { "ticks": "", "gridcolor": "#DFE8F3", "gridwidth": 2, "linecolor": "#EBF0F8", "zerolinecolor": "#EBF0F8", "showbackground": true, "backgroundcolor": "white" }, "yaxis": { "ticks": "", "gridcolor": "#DFE8F3", "gridwidth": 2, "linecolor": "#EBF0F8", "zerolinecolor": "#EBF0F8", "showbackground": true, "backgroundcolor": "white" }, "zaxis": { "ticks": "", "gridcolor": "#DFE8F3", "gridwidth": 2, "linecolor": "#EBF0F8", "zerolinecolor": "#EBF0F8", "showbackground": true, "backgroundcolor": "white" } }, "title": { "x": 0.05 }, "xaxis": { "ticks": "", "gridcolor": "#EBF0F8", "linecolor": "#EBF0F8", "automargin": true, "zerolinecolor": "#EBF0F8", "zerolinewidth": 2 }, "yaxis": { "ticks": "", "gridcolor": "#EBF0F8", "linecolor": "#EBF0F8", "automargin": true, "zerolinecolor": "#EBF0F8", "zerolinewidth": 2 }, "ternary": { "aaxis": { "ticks": "", "gridcolor": "#DFE8F3", "linecolor": "#A2B1C6" }, "baxis": { "ticks": "", "gridcolor": "#DFE8F3", "linecolor": "#A2B1C6" }, "caxis": { "ticks": "", "gridcolor": "#DFE8F3", "linecolor": "#A2B1C6" }, "bgcolor": "white" }, "colorway": [ "#636efa", "#EF553B", "#00cc96", "#ab63fa", "#19d3f3", "#e763fa", "#fecb52", "#ffa15a", "#ff6692", "#b6e880" ], "hovermode": "closest", "colorscale": { "diverging": [ [ 0, "#8e0152" ], [ 0.1, "#c51b7d" ], [ 0.2, "#de77ae" ], [ 0.3, "#f1b6da" ], [ 0.4, "#fde0ef" ], [ 0.5, "#f7f7f7" ], [ 0.6, "#e6f5d0" ], [ 0.7, "#b8e186" ], [ 0.8, "#7fbc41" ], [ 0.9, "#4d9221" ], [ 1, "#276419" ] ], "sequential": [ [ 0, "#0508b8" ], [ 0.0893854748603352, "#1910d8" ], [ 0.1787709497206704, "#3c19f0" ], [ 0.2681564245810056, "#6b1cfb" ], [ 0.3575418994413408, "#981cfd" ], [ 0.44692737430167595, "#bf1cfd" ], [ 0.5363128491620112, "#dd2bfd" ], [ 0.6256983240223464, "#f246fe" ], [ 0.7150837988826816, "#fc67fd" ], [ 0.8044692737430168, "#fe88fc" ], [ 0.8938547486033519, "#fea5fd" ], [ 0.9832402234636871, "#febefe" ], [ 1, "#fec3fe" ] ], "sequentialminus": [ [ 0, "#0508b8" ], [ 0.0893854748603352, "#1910d8" ], [ 0.1787709497206704, "#3c19f0" ], [ 0.2681564245810056, "#6b1cfb" ], [ 0.3575418994413408, "#981cfd" ], [ 0.44692737430167595, "#bf1cfd" ], [ 0.5363128491620112, "#dd2bfd" ], [ 0.6256983240223464, "#f246fe" ], [ 0.7150837988826816, "#fc67fd" ], [ 0.8044692737430168, "#fe88fc" ], [ 0.8938547486033519, "#fea5fd" ], [ 0.9832402234636871, "#febefe" ], [ 1, "#fec3fe" ] ] }, "plot_bgcolor": "white", "paper_bgcolor": "white", "shapedefaults": { "line": { "width": 0 }, "opacity": 0.4, "fillcolor": "#506784" }, "annotationdefaults": { "arrowhead": 0, "arrowcolor": "#506784", "arrowwidth": 1 } }, "themeRef": "PLOTLY_WHITE" }, "hovermode": "closest" } }, "height": null, "width": null, "user": { "profile_url": "https://chart-studio.plotly.com/~Misterroni", "avatar_url": "https://storage.googleapis.com/plotly-prod-profiles/51.jpg", "background_url": "https://storage.googleapis.com/plotly-prod-profiles/bg-2.jpg", "bio": "", "nickname": "", "website": "", "stream_tokens": null, "feature_set_id": null, "csrf_token": null, "date_joined": "2025-06-05 20:03:00", "mapbox_access_tokens": null, "has_password": null, "username": "Misterroni", "email": null, "is_active": null, "readonly": null, "is_dash_creator": null, "dash_created_count": null, "is_chart_creator": null, "charts_created_count": null } }, { "creation_time": "2025-06-06T09:48:51.681895Z", "comments": { "results": [], "count": 0 }, "parented": true, "embed_url": "https://chart-studio.plotly.com/~Misterroni/1.embed", "fid": "Misterroni:1", "filename": "Plot 1", "filetype": "plot", "img_url": "https://storage.googleapis.com/plotly-prod-images/Misterroni/1/9_52V8UP7O9B6H9TI6PC0IFDUXRKDCZ4.png", "image_urls": { "default": "https://storage.googleapis.com/plotly-prod-images/Misterroni/1/2_KLOVBIFJWG7HL12RJFD6016265FVYV.png", "block-thumb": "https://storage.googleapis.com/plotly-prod-images/Misterroni/1/8_WMCCJVY73YPWRFIMLOW985AP9RJF6V.png", "list-thumb": "https://storage.googleapis.com/plotly-prod-images/Misterroni/1/9_52V8UP7O9B6H9TI6PC0IFDUXRKDCZ4.png" }, "api_urls": { "files": "https://api.plotly.com/v2/files/Misterroni:1", "plots": "https://api.plotly.com/v2/plots/Misterroni:1", "parent": "https://api.plotly.com/v2/folders/home?user=Misterroni" }, "owner": "Misterroni", "parent": -1, "preview": "", "referencers": [], "references": [], "title": "", "views": 0, "web_url": "https://chart-studio.plotly.com/~Misterroni/1/", "world_readable": true, "date_modified": "2025-06-06T09:48:51.697Z", "stars": { "results": [], "count": 0 }, "collaborators": { "results": [], "count": 0 }, "subfolder_count": null, "refresh_interval": null, "organize_view_url": "https://chart-studio.plotly.com/~Misterroni/1/", "current_user_permission": "read", "is_theme": null, "is_template": false, "autosize": true, "caption": "", "figure": { "data": [ { "uid": "c7a1ba", "meta": { "columnNames": { "x": "A", "y": "B" } }, "mode": "markers", "name": "<b>measurements</b>", "type": "scatter", "xsrc": "Misterroni:0:b7b726", "ysrc": "Misterroni:0:209450", "marker": { "color": "rgb(15, 158, 213)" }, "visible": true, "orientation": "v" }, { "uid": "2f5d58", "name": "<b>Fit of measurements</b>", "transforms": [ { "rms": "", "type": "fit", "inputUid": "c7a1ba", "regressor": "x", "parameters": [ { "hold": false, "name": "m", "error": 6.960046571132374e-05, "value": 0.0011143747815927961 }, { "hold": false, "name": "b", "error": 0.010430854642539044, "value": 0.01804374465070833 } ], "regressand": "y", "correlation": "", "fitfunction": "m*x + b", "inputxrange": [], "outputxrange": [], "interpolation": 50 } ] } ], "frames": [], "layout": { "font": { "family": "Arial" }, "title": { "text": "<b>Proportionality of P</b><sub><b>electr.</b></sub><b> and v</b><sup><b>3</b></sup>" }, "xaxis": { "type": "linear", "range": [ 31.49455550548295, 238.36144449451703 ], "title": { "text": "<b>v</b><sup><b>3</b></sup>" }, "autorange": false }, "yaxis": { "type": "linear", "range": [ 0.05339184891917882, 0.30200613876559146 ], "title": { "text": "<b>P</b><sub><b>electr.</b></sub><br>" }, "autorange": true }, "legend": { "title": { "text": "<br>" } }, "autosize": true, "template": { "data": { "bar": [ { "type": "bar", "marker": { "colorbar": { "ticks": "", "outlinewidth": 0 } } } ], "table": [ { "type": "table", "cells": { "fill": { "color": "#EBF0F8" }, "line": { "color": "white" } }, "header": { "fill": { "color": "#C8D4E3" }, "line": { "color": "white" } } } ], "carpet": [ { "type": "carpet", "aaxis": { "gridcolor": "#C8D4E3", "linecolor": "#C8D4E3", "endlinecolor": "#2a3f5f", "minorgridcolor": "#C8D4E3", "startlinecolor": "#2a3f5f" }, "baxis": { "gridcolor": "#C8D4E3", "linecolor": "#C8D4E3", "endlinecolor": "#2a3f5f", "minorgridcolor": "#C8D4E3", "startlinecolor": "#2a3f5f" } } ], "mesh3d": [ { "type": "mesh3d", "colorbar": { "ticks": "", "outlinewidth": 0 } } ], "contour": [ { "type": "contour", "colorbar": { "ticks": "", "outlinewidth": 0 }, "autocolorscale": true } ], "heatmap": [ { "type": "heatmap", "colorbar": { "ticks": "", "outlinewidth": 0 }, "autocolorscale": true } ], "scatter": [ { "type": "scatter", "marker": { "colorbar": { "ticks": "", "outlinewidth": 0 } } } ], "surface": [ { "type": "surface", "colorbar": { "ticks": "", "outlinewidth": 0 } } ], "heatmapgl": [ { "type": "heatmapgl", "colorbar": { "ticks": "", "outlinewidth": 0 } } ], "histogram": [ { "type": "histogram", "marker": { "colorbar": { "ticks": "", "outlinewidth": 0 } } } ], "parcoords": [ { "line": { "colorbar": { "ticks": "", "outlinewidth": 0 } }, "type": "parcoords" } ], "scatter3d": [ { "type": "scatter3d", "marker": { "colorbar": { "ticks": "", "outlinewidth": 0 } } } ], "scattergl": [ { "type": "scattergl", "marker": { "colorbar": { "ticks": "", "outlinewidth": 0 } } } ], "choropleth": [ { "type": "choropleth", "colorbar": { "ticks": "", "outlinewidth": 0 } } ], "scattergeo": [ { "type": "scattergeo", "marker": { "colorbar": { "ticks": "", "outlinewidth": 0 } } } ], "histogram2d": [ { "type": "histogram2d", "colorbar": { "ticks": "", "outlinewidth": 0 }, "autocolorscale": true } ], "scatterpolar": [ { "type": "scatterpolar", "marker": { "colorbar": { "ticks": "", "outlinewidth": 0 } } } ], "contourcarpet": [ { "type": "contourcarpet", "colorbar": { "ticks": "", "outlinewidth": 0 } } ], "scattercarpet": [ { "type": "scattercarpet", "marker": { "colorbar": { "ticks": "", "outlinewidth": 0 } } } ], "scattermapbox": [ { "type": "scattermapbox", "marker": { "colorbar": { "ticks": "", "outlinewidth": 0 } } } ], "scatterpolargl": [ { "type": "scatterpolargl", "marker": { "colorbar": { "ticks": "", "outlinewidth": 0 } } } ], "scatterternary": [ { "type": "scatterternary", "marker": { "colorbar": { "ticks": "", "outlinewidth": 0 } } } ], "histogram2dcontour": [ { "type": "histogram2dcontour", "colorbar": { "ticks": "", "outlinewidth": 0 }, "autocolorscale": true } ] }, "layout": { "geo": { "bgcolor": "white", "showland": true, "lakecolor": "white", "landcolor": "white", "showlakes": true, "subunitcolor": "#C8D4E3" }, "font": { "color": "#2a3f5f" }, "polar": { "bgcolor": "white", "radialaxis": { "ticks": "", "gridcolor": "#EBF0F8", "linecolor": "#EBF0F8" }, "angularaxis": { "ticks": "", "gridcolor": "#EBF0F8", "linecolor": "#EBF0F8" } }, "scene": { "xaxis": { "ticks": "", "gridcolor": "#DFE8F3", "gridwidth": 2, "linecolor": "#EBF0F8", "zerolinecolor": "#EBF0F8", "showbackground": true, "backgroundcolor": "white" }, "yaxis": { "ticks": "", "gridcolor": "#DFE8F3", "gridwidth": 2, "linecolor": "#EBF0F8", "zerolinecolor": "#EBF0F8", "showbackground": true, "backgroundcolor": "white" }, "zaxis": { "ticks": "", "gridcolor": "#DFE8F3", "gridwidth": 2, "linecolor": "#EBF0F8", "zerolinecolor": "#EBF0F8", "showbackground": true, "backgroundcolor": "white" } }, "title": { "x": 0.05 }, "xaxis": { "ticks": "", "gridcolor": "#EBF0F8", "linecolor": "#EBF0F8", "automargin": true, "zerolinecolor": "#EBF0F8", "zerolinewidth": 2 }, "yaxis": { "ticks": "", "gridcolor": "#EBF0F8", "linecolor": "#EBF0F8", "automargin": true, "zerolinecolor": "#EBF0F8", "zerolinewidth": 2 }, "ternary": { "aaxis": { "ticks": "", "gridcolor": "#DFE8F3", "linecolor": "#A2B1C6" }, "baxis": { "ticks": "", "gridcolor": "#DFE8F3", "linecolor": "#A2B1C6" }, "caxis": { "ticks": "", "gridcolor": "#DFE8F3", "linecolor": "#A2B1C6" }, "bgcolor": "white" }, "colorway": [ "#636efa", "#EF553B", "#00cc96", "#ab63fa", "#19d3f3", "#e763fa", "#fecb52", "#ffa15a", "#ff6692", "#b6e880" ], "hovermode": "closest", "colorscale": { "diverging": [ [ 0, "#8e0152" ], [ 0.1, "#c51b7d" ], [ 0.2, "#de77ae" ], [ 0.3, "#f1b6da" ], [ 0.4, "#fde0ef" ], [ 0.5, "#f7f7f7" ], [ 0.6, "#e6f5d0" ], [ 0.7, "#b8e186" ], [ 0.8, "#7fbc41" ], [ 0.9, "#4d9221" ], [ 1, "#276419" ] ], "sequential": [ [ 0, "#0508b8" ], [ 0.0893854748603352, "#1910d8" ], [ 0.1787709497206704, "#3c19f0" ], [ 0.2681564245810056, "#6b1cfb" ], [ 0.3575418994413408, "#981cfd" ], [ 0.44692737430167595, "#bf1cfd" ], [ 0.5363128491620112, "#dd2bfd" ], [ 0.6256983240223464, "#f246fe" ], [ 0.7150837988826816, "#fc67fd" ], [ 0.8044692737430168, "#fe88fc" ], [ 0.8938547486033519, "#fea5fd" ], [ 0.9832402234636871, "#febefe" ], [ 1, "#fec3fe" ] ], "sequentialminus": [ [ 0, "#0508b8" ], [ 0.0893854748603352, "#1910d8" ], [ 0.1787709497206704, "#3c19f0" ], [ 0.2681564245810056, "#6b1cfb" ], [ 0.3575418994413408, "#981cfd" ], [ 0.44692737430167595, "#bf1cfd" ], [ 0.5363128491620112, "#dd2bfd" ], [ 0.6256983240223464, "#f246fe" ], [ 0.7150837988826816, "#fc67fd" ], [ 0.8044692737430168, "#fe88fc" ], [ 0.8938547486033519, "#fea5fd" ], [ 0.9832402234636871, "#febefe" ], [ 1, "#fec3fe" ] ] }, "plot_bgcolor": "white", "paper_bgcolor": "white", "shapedefaults": { "line": { "width": 0 }, "opacity": 0.4, "fillcolor": "#506784" }, "annotationdefaults": { "arrowhead": 0, "arrowcolor": "#506784", "arrowwidth": 1 } }, "themeRef": "PLOTLY_WHITE" }, "hovermode": "closest" } }, "height": null, "width": null, "user": { "profile_url": "https://chart-studio.plotly.com/~Misterroni", "avatar_url": "https://storage.googleapis.com/plotly-prod-profiles/51.jpg", "background_url": "https://storage.googleapis.com/plotly-prod-profiles/bg-2.jpg", "bio": "", "nickname": "", "website": "", "stream_tokens": null, "feature_set_id": null, "csrf_token": null, "date_joined": "2025-06-05 20:03:00", "mapbox_access_tokens": null, "has_password": null, "username": "Misterroni", "email": null, "is_active": null, "readonly": null, "is_dash_creator": null, "dash_created_count": null, "is_chart_creator": null, "charts_created_count": null } }, { "creation_time": "2025-06-06T09:24:18.234274Z", "comments": { "results": [], "count": 0 }, "parented": true, "embed_url": "https://chart-studio.plotly.com/~baldassa.simone/21.embed", "fid": "baldassa.simone:21", "filename": "grafico_tracciabilita_plotly", "filetype": "plot", "img_url": "https://storage.googleapis.com/plotly-prod-images/baldassa.simone/21/9_3FB06KR2ISP1HQWVZ2OIXKMAPB6AQK.png", "image_urls": { "default": "https://api.plotly.com/v2/files/baldassa.simone:21/image?image_name=default", "block-thumb": "https://storage.googleapis.com/plotly-prod-images/baldassa.simone/21/8_UGDGD540B9EP4N11DG5Q5JBZ3O8IKT.png", "list-thumb": "https://storage.googleapis.com/plotly-prod-images/baldassa.simone/21/9_3FB06KR2ISP1HQWVZ2OIXKMAPB6AQK.png" }, "api_urls": { "files": "https://api.plotly.com/v2/files/baldassa.simone:21", "plots": "https://api.plotly.com/v2/plots/baldassa.simone:21", "parent": "https://api.plotly.com/v2/folders/home?user=baldassa.simone" }, "owner": "baldassa.simone", "parent": -1, "preview": "", "referencers": [], "references": [], "title": "", "views": 1, "web_url": "https://chart-studio.plotly.com/~baldassa.simone/21/", "world_readable": true, "date_modified": "2025-06-10T13:24:59.760Z", "stars": { "results": [], "count": 0 }, "collaborators": { "results": [], "count": 0 }, "subfolder_count": null, "refresh_interval": null, "organize_view_url": "https://chart-studio.plotly.com/~baldassa.simone/21/", "current_user_permission": "read", "is_theme": null, "is_template": null, "autosize": true, "caption": "", "figure": { "data": [], "layout": { "width": 600, "xaxis": { "visible": false }, "yaxis": { "visible": false }, "height": 2050, "margin": { "b": 20, "l": 20, "r": 20, "t": 20 }, "shapes": [ { "x0": -125.0, "x1": 125.0, "y0": 100, "y1": 0, "line": { "color": "black" }, "type": "rect", "fillcolor": "lightblue" }, { "x0": -125.0, "x1": 125.0, "y0": -150, "y1": -250, "line": { "color": "black" }, "type": "rect", "fillcolor": "lightblue" }, { "x0": -125.0, "x1": 125.0, "y0": -400, "y1": -500, "line": { "color": "black" }, "type": "rect", "fillcolor": "lightblue" }, { "x0": -150, "x1": 150, "y0": -700, "y1": -620, "line": { "color": "black" }, "type": "rect", "fillcolor": "lightgreen" }, { "x0": -125.0, "x1": 125.0, "y0": -650, "y1": -750, "line": { "color": "black" }, "type": "rect", "fillcolor": "lightblue" }, { "x0": -125.0, "x1": 125.0, "y0": -900, "y1": -1000, "line": { "color": "black" }, "type": "rect", "fillcolor": "lightblue" }, { "x0": -150, "x1": 150, "y0": -1200, "y1": -1120, "line": { "color": "black" }, "type": "rect", "fillcolor": "lightgreen" }, { "x0": -125.0, "x1": 125.0, "y0": -1150, "y1": -1250, "line": { "color": "black" }, "type": "rect", "fillcolor": "lightblue" }, { "x0": -125.0, "x1": 125.0, "y0": -1400, "y1": -1500, "line": { "color": "black" }, "type": "rect", "fillcolor": "lightblue" } ], "template": { "data": { "bar": [ { "type": "bar", "marker": { "line": { "color": "#E5ECF6", "width": 0.5 }, "pattern": { "size": 10, "fillmode": "overlay", "solidity": 0.2 } }, "error_x": { "color": "#2a3f5f" }, "error_y": { "color": "#2a3f5f" } } ], "pie": [ { "type": "pie", "automargin": true } ], "table": [ { "type": "table", "cells": { "fill": { "color": "#EBF0F8" }, "line": { "color": "white" } }, "header": { "fill": { "color": "#C8D4E3" }, "line": { "color": "white" } } } ], "carpet": [ { "type": "carpet", "aaxis": { "gridcolor": "white", "linecolor": "white", "endlinecolor": "#2a3f5f", "minorgridcolor": "white", "startlinecolor": "#2a3f5f" }, "baxis": { "gridcolor": "white", "linecolor": "white", "endlinecolor": "#2a3f5f", "minorgridcolor": "white", "startlinecolor": "#2a3f5f" } } ], "mesh3d": [ { "type": "mesh3d", "colorbar": { "ticks": "", "outlinewidth": 0 } } ], "contour": [ { "type": "contour", "colorbar": { "ticks": "", "outlinewidth": 0 }, "colorscale": [ [ 0.0, "#0d0887" ], [ 0.1111111111111111, "#46039f" ], [ 0.2222222222222222, "#7201a8" ], [ 0.3333333333333333, "#9c179e" ], [ 0.4444444444444444, "#bd3786" ], [ 0.5555555555555556, "#d8576b" ], [ 0.6666666666666666, "#ed7953" ], [ 0.7777777777777778, "#fb9f3a" ], [ 0.8888888888888888, "#fdca26" ], [ 1.0, "#f0f921" ] ] } ], "heatmap": [ { "type": "heatmap", "colorbar": { "ticks": "", "outlinewidth": 0 }, "colorscale": [ [ 0.0, "#0d0887" ], [ 0.1111111111111111, "#46039f" ], [ 0.2222222222222222, "#7201a8" ], [ 0.3333333333333333, "#9c179e" ], [ 0.4444444444444444, "#bd3786" ], [ 0.5555555555555556, "#d8576b" ], [ 0.6666666666666666, "#ed7953" ], [ 0.7777777777777778, "#fb9f3a" ], [ 0.8888888888888888, "#fdca26" ], [ 1.0, "#f0f921" ] ] } ], "scatter": [ { "type": "scatter", "fillpattern": { "size": 10, "fillmode": "overlay", "solidity": 0.2 } } ], "surface": [ { "type": "surface", "colorbar": { "ticks": "", "outlinewidth": 0 }, "colorscale": [ [ 0.0, "#0d0887" ], [ 0.1111111111111111, "#46039f" ], [ 0.2222222222222222, "#7201a8" ], [ 0.3333333333333333, "#9c179e" ], [ 0.4444444444444444, "#bd3786" ], [ 0.5555555555555556, "#d8576b" ], [ 0.6666666666666666, "#ed7953" ], [ 0.7777777777777778, "#fb9f3a" ], [ 0.8888888888888888, "#fdca26" ], [ 1.0, "#f0f921" ] ] } ], "barpolar": [ { "type": "barpolar", "marker": { "line": { "color": "#E5ECF6", "width": 0.5 }, "pattern": { "size": 10, "fillmode": "overlay", "solidity": 0.2 } } } ], "heatmapgl": [ { "type": "heatmapgl", "colorbar": { "ticks": "", "outlinewidth": 0 }, "colorscale": [ [ 0.0, "#0d0887" ], [ 0.1111111111111111, "#46039f" ], [ 0.2222222222222222, "#7201a8" ], [ 0.3333333333333333, "#9c179e" ], [ 0.4444444444444444, "#bd3786" ], [ 0.5555555555555556, "#d8576b" ], [ 0.6666666666666666, "#ed7953" ], [ 0.7777777777777778, "#fb9f3a" ], [ 0.8888888888888888, "#fdca26" ], [ 1.0, "#f0f921" ] ] } ], "histogram": [ { "type": "histogram", "marker": { "pattern": { "size": 10, "fillmode": "overlay", "solidity": 0.2 } } } ], "parcoords": [ { "line": { "colorbar": { "ticks": "", "outlinewidth": 0 } }, "type": "parcoords" } ], "scatter3d": [ { "line": { "colorbar": { "ticks": "", "outlinewidth": 0 } }, "type": "scatter3d", "marker": { "colorbar": { "ticks": "", "outlinewidth": 0 } } } ], "scattergl": [ { "type": "scattergl", "marker": { "colorbar": { "ticks": "", "outlinewidth": 0 } } } ], "choropleth": [ { "type": "choropleth", "colorbar": { "ticks": "", "outlinewidth": 0 } } ], "scattergeo": [ { "type": "scattergeo", "marker": { "colorbar": { "ticks": "", "outlinewidth": 0 } } } ], "histogram2d": [ { "type": "histogram2d", "colorbar": { "ticks": "", "outlinewidth": 0 }, "colorscale": [ [ 0.0, "#0d0887" ], [ 0.1111111111111111, "#46039f" ], [ 0.2222222222222222, "#7201a8" ], [ 0.3333333333333333, "#9c179e" ], [ 0.4444444444444444, "#bd3786" ], [ 0.5555555555555556, "#d8576b" ], [ 0.6666666666666666, "#ed7953" ], [ 0.7777777777777778, "#fb9f3a" ], [ 0.8888888888888888, "#fdca26" ], [ 1.0, "#f0f921" ] ] } ], "scatterpolar": [ { "type": "scatterpolar", "marker": { "colorbar": { "ticks": "", "outlinewidth": 0 } } } ], "contourcarpet": [ { "type": "contourcarpet", "colorbar": { "ticks": "", "outlinewidth": 0 } } ], "scattercarpet": [ { "type": "scattercarpet", "marker": { "colorbar": { "ticks": "", "outlinewidth": 0 } } } ], "scattermapbox": [ { "type": "scattermapbox", "marker": { "colorbar": { "ticks": "", "outlinewidth": 0 } } } ], "scatterpolargl": [ { "type": "scatterpolargl", "marker": { "colorbar": { "ticks": "", "outlinewidth": 0 } } } ], "scatterternary": [ { "type": "scatterternary", "marker": { "colorbar": { "ticks": "", "outlinewidth": 0 } } } ], "histogram2dcontour": [ { "type": "histogram2dcontour", "colorbar": { "ticks": "", "outlinewidth": 0 }, "colorscale": [ [ 0.0, "#0d0887" ], [ 0.1111111111111111, "#46039f" ], [ 0.2222222222222222, "#7201a8" ], [ 0.3333333333333333, "#9c179e" ], [ 0.4444444444444444, "#bd3786" ], [ 0.5555555555555556, "#d8576b" ], [ 0.6666666666666666, "#ed7953" ], [ 0.7777777777777778, "#fb9f3a" ], [ 0.8888888888888888, "#fdca26" ], [ 1.0, "#f0f921" ] ] } ] }, "layout": { "geo": { "bgcolor": "white", "showland": true, "lakecolor": "white", "landcolor": "#E5ECF6", "showlakes": true, "subunitcolor": "white" }, "font": { "color": "#2a3f5f" }, "polar": { "bgcolor": "#E5ECF6", "radialaxis": { "ticks": "", "gridcolor": "white", "linecolor": "white" }, "angularaxis": { "ticks": "", "gridcolor": "white", "linecolor": "white" } }, "scene": { "xaxis": { "ticks": "", "gridcolor": "white", "gridwidth": 2, "linecolor": "white", "zerolinecolor": "white", "showbackground": true, "backgroundcolor": "#E5ECF6" }, "yaxis": { "ticks": "", "gridcolor": "white", "gridwidth": 2, "linecolor": "white", "zerolinecolor": "white", "showbackground": true, "backgroundcolor": "#E5ECF6" }, "zaxis": { "ticks": "", "gridcolor": "white", "gridwidth": 2, "linecolor": "white", "zerolinecolor": "white", "showbackground": true, "backgroundcolor": "#E5ECF6" } }, "title": { "x": 0.05 }, "xaxis": { "ticks": "", "title": { "standoff": 15 }, "gridcolor": "white", "linecolor": "white", "automargin": true, "zerolinecolor": "white", "zerolinewidth": 2 }, "yaxis": { "ticks": "", "title": { "standoff": 15 }, "gridcolor": "white", "linecolor": "white", "automargin": true, "zerolinecolor": "white", "zerolinewidth": 2 }, "mapbox": { "style": "light" }, "ternary": { "aaxis": { "ticks": "", "gridcolor": "white", "linecolor": "white" }, "baxis": { "ticks": "", "gridcolor": "white", "linecolor": "white" }, "caxis": { "ticks": "", "gridcolor": "white", "linecolor": "white" }, "bgcolor": "#E5ECF6" }, "colorway": [ "#636efa", "#EF553B", "#00cc96", "#ab63fa", "#FFA15A", "#19d3f3", "#FF6692", "#B6E880", "#FF97FF", "#FECB52" ], "coloraxis": { "colorbar": { "ticks": "", "outlinewidth": 0 } }, "hovermode": "closest", "colorscale": { "diverging": [ [ 0, "#8e0152" ], [ 0.1, "#c51b7d" ], [ 0.2, "#de77ae" ], [ 0.3, "#f1b6da" ], [ 0.4, "#fde0ef" ], [ 0.5, "#f7f7f7" ], [ 0.6, "#e6f5d0" ], [ 0.7, "#b8e186" ], [ 0.8, "#7fbc41" ], [ 0.9, "#4d9221" ], [ 1, "#276419" ] ], "sequential": [ [ 0.0, "#0d0887" ], [ 0.1111111111111111, "#46039f" ], [ 0.2222222222222222, "#7201a8" ], [ 0.3333333333333333, "#9c179e" ], [ 0.4444444444444444, "#bd3786" ], [ 0.5555555555555556, "#d8576b" ], [ 0.6666666666666666, "#ed7953" ], [ 0.7777777777777778, "#fb9f3a" ], [ 0.8888888888888888, "#fdca26" ], [ 1.0, "#f0f921" ] ], "sequentialminus": [ [ 0.0, "#0d0887" ], [ 0.1111111111111111, "#46039f" ], [ 0.2222222222222222, "#7201a8" ], [ 0.3333333333333333, "#9c179e" ], [ 0.4444444444444444, "#bd3786" ], [ 0.5555555555555556, "#d8576b" ], [ 0.6666666666666666, "#ed7953" ], [ 0.7777777777777778, "#fb9f3a" ], [ 0.8888888888888888, "#fdca26" ], [ 1.0, "#f0f921" ] ] }, "hoverlabel": { "align": "left" }, "plot_bgcolor": "#E5ECF6", "paper_bgcolor": "white", "shapedefaults": { "line": { "color": "#2a3f5f" } }, "autotypenumbers": "strict", "annotationdefaults": { "arrowhead": 0, "arrowcolor": "#2a3f5f", "arrowwidth": 1 } } }, "annotations": [ { "x": 0, "y": 50.0, "font": { "size": 12 }, "text": "Farm 1<br>Region A<br>Batch: Milk consignment 1", "showarrow": false }, { "x": 0, "y": 90, "ax": 0, "ay": 60, "text": "", "arrowhead": 2, "showarrow": true }, { "x": 0, "y": -200.0, "font": { "size": 12 }, "text": "Collection company<br>Region A<br>Batch: Milk consignment 6", "showarrow": false }, { "x": 0, "y": -160, "ax": 0, "ay": -190, "text": "", "arrowhead": 2, "showarrow": true }, { "x": 0, "y": -450.0, "font": { "size": 12 }, "text": "Milk supplier<br>Region A<br>Batch: Milk batch 1", "showarrow": false }, { "x": 0, "y": -410, "ax": 0, "ay": -440, "text": "", "arrowhead": 2, "showarrow": true }, { "x": 0, "y": -660.0, "font": { "size": 11 }, "text": "Sample<br>Batch: Milk batch 1<br>Date: 2024-12-07<br>Type: Own check<br>Pathogen: Negative", "showarrow": false }, { "x": 0, "y": -500, "ax": 0, "ay": -610, "text": "", "arrowhead": 2, "showarrow": true }, { "x": 0, "y": -700.0, "font": { "size": 12 }, "text": "Cheese producer 1<br>Region B<br>Batch: Cheese batch 1", "showarrow": false }, { "x": 0, "y": -660, "ax": 0, "ay": -690, "text": "", "arrowhead": 2, "showarrow": true }, { "x": 0, "y": -950.0, "font": { "size": 12 }, "text": "Wholesaler 1<br>Region B<br>Batch: Cheese batch 1", "showarrow": false }, { "x": 0, "y": -910, "ax": 0, "ay": -940, "text": "", "arrowhead": 2, "showarrow": true }, { "x": 0, "y": -1160.0, "font": { "size": 11 }, "text": "Sample<br>Batch: Cheese batch 1<br>Date: 2024-12-12<br>Type: Own check<br>Pathogen: Negative", "showarrow": false }, { "x": 0, "y": -1000, "ax": 0, "ay": -1110, "text": "", "arrowhead": 2, "showarrow": true }, { "x": 0, "y": -1200.0, "font": { "size": 12 }, "text": "Wholesaler 4<br>Region B<br>Batch: Cheese batch 1", "showarrow": false }, { "x": 0, "y": -1160, "ax": 0, "ay": -1190, "text": "", "arrowhead": 2, "showarrow": true }, { "x": 0, "y": -1450.0, "font": { "size": 12 }, "text": "Wholesalers in region B<br>Region B<br>Batch: Cheese batch 1", "showarrow": false } ] } }, "height": 2050, "width": 600, "user": { "profile_url": "https://chart-studio.plotly.com/~baldassa.simone", "avatar_url": "https://storage.googleapis.com/plotly-prod-profiles/33.jpg", "background_url": "https://storage.googleapis.com/plotly-prod-profiles/bg-1.jpg", "bio": "", "nickname": "", "website": "", "stream_tokens": null, "feature_set_id": null, "csrf_token": null, "date_joined": "2025-04-23 08:46:06", "mapbox_access_tokens": null, "has_password": null, "username": "baldassa.simone", "email": null, "is_active": null, "readonly": null, "is_dash_creator": null, "dash_created_count": null, "is_chart_creator": null, "charts_created_count": null } }, { "creation_time": "2025-06-06T09:00:27.294341Z", "comments": { "results": [], "count": 0 }, "parented": true, "embed_url": "https://chart-studio.plotly.com/~Sereneee/3.embed", "fid": "Sereneee:3", "filename": "Psychology", "filetype": "plot", "img_url": "https://api.plotly.com/v2/files/Sereneee:3/image?image_name=list-thumb", "image_urls": { "default": "https://api.plotly.com/v2/files/Sereneee:3/image?image_name=default", "block-thumb": "https://storage.googleapis.com/plotly-prod-images/Sereneee/3/8_CXAIIEM7WK5YGH5IEKG63J4LMJDD4D.png", "list-thumb": "https://api.plotly.com/v2/files/Sereneee:3/image?image_name=list-thumb" }, "api_urls": { "files": "https://api.plotly.com/v2/files/Sereneee:3", "plots": "https://api.plotly.com/v2/plots/Sereneee:3", "parent": "https://api.plotly.com/v2/folders/home?user=Sereneee" }, "owner": "Sereneee", "parent": -1, "preview": "", "referencers": [], "references": [], "title": "", "views": 0, "web_url": "https://chart-studio.plotly.com/~Sereneee/3/", "world_readable": true, "date_modified": "2025-06-06T09:00:27.305Z", "stars": { "results": [], "count": 0 }, "collaborators": { "results": [], "count": 0 }, "subfolder_count": null, "refresh_interval": null, "organize_view_url": "https://chart-studio.plotly.com/~Sereneee/3/", "current_user_permission": "read", "is_theme": null, "is_template": false, "autosize": true, "caption": "", "figure": { "data": [ { "meta": { "columnNames": { "x": "data.0.x", "y": "data.0.y", "text": "", "textposition": "" } }, "type": "bar", "xsrc": "Sereneee:2:acf769", "ysrc": "Sereneee:2:088c89", "marker": { "line": { "width": 0.5 }, "color": "rgb(32, 43, 207)", "opacity": 1 }, "hoverinfo": "x+y", "textposition": "none", "hovertemplate": "" } ], "frames": [], "layout": { "font": { "size": 12, "family": "Times New Roman" }, "title": { "x": 0.24, "font": { "size": 17 }, "text": "<b>Anchoring Effect: Time Estimates Influence Perceived Poem Quality</b>" }, "xaxis": { "side": "bottom", "type": "category", "dtick": 1, "range": [ -0.5, 1.5 ], "tick0": 0, "ticks": "", "title": { "font": { "size": 14, "family": "Times New Roman" }, "text": "Anchor Value Provided (Suggested Time)" }, "showgrid": false, "tickfont": { "size": 14, "family": "Times New Roman" }, "tickmode": "linear", "zeroline": false, "autorange": false, "automargin": true, "showspikes": false, "rangeslider": { "range": [ -0.5, 1.5 ], "yaxis": {}, "visible": false, "autorange": true } }, "yaxis": { "type": "linear", "range": [ 0, 8.421052631578947 ], "title": { "font": { "family": "Times New Roman" }, "text": "Participants’ Rating of Poem Quality" }, "autorange": true }, "bargap": 0.52, "margin": { "r": 80 }, "template": { "data": { "bar": [ { "type": "bar", "marker": { "line": { "color": "#E5ECF6", "width": 0.5 } } } ], "table": [ { "type": "table", "cells": { "fill": { "color": "#EBF0F8" }, "line": { "color": "white" } }, "header": { "fill": { "color": "#C8D4E3" }, "line": { "color": "white" } } } ], "carpet": [ { "type": "carpet", "aaxis": { "gridcolor": "white", "linecolor": "white", "endlinecolor": "#2a3f5f", "minorgridcolor": "white", "startlinecolor": "#2a3f5f" }, "baxis": { "gridcolor": "white", "linecolor": "white", "endlinecolor": "#2a3f5f", "minorgridcolor": "white", "startlinecolor": "#2a3f5f" } } ], "mesh3d": [ { "type": "mesh3d", "colorbar": { "ticks": "", "outlinewidth": 0 } } ], "contour": [ { "type": "contour", "colorbar": { "ticks": "", "outlinewidth": 0 }, "colorscale": [ [ 0, "#0d0887" ], [ 0.1111111111111111, "#46039f" ], [ 0.2222222222222222, "#7201a8" ], [ 0.3333333333333333, "#9c179e" ], [ 0.4444444444444444, "#bd3786" ], [ 0.5555555555555556, "#d8576b" ], [ 0.6666666666666666, "#ed7953" ], [ 0.7777777777777778, "#fb9f3a" ], [ 0.8888888888888888, "#fdca26" ], [ 1, "#f0f921" ] ] } ], "heatmap": [ { "type": "heatmap", "colorbar": { "ticks": "", "outlinewidth": 0 }, "colorscale": [ [ 0, "#0d0887" ], [ 0.1111111111111111, "#46039f" ], [ 0.2222222222222222, "#7201a8" ], [ 0.3333333333333333, "#9c179e" ], [ 0.4444444444444444, "#bd3786" ], [ 0.5555555555555556, "#d8576b" ], [ 0.6666666666666666, "#ed7953" ], [ 0.7777777777777778, "#fb9f3a" ], [ 0.8888888888888888, "#fdca26" ], [ 1, "#f0f921" ] ] } ], "scatter": [ { "type": "scatter", "marker": { "colorbar": { "ticks": "", "outlinewidth": 0 } } } ], "surface": [ { "type": "surface", "colorbar": { "ticks": "", "outlinewidth": 0 } } ], "barpolar": [ { "type": "barpolar", "marker": { "line": { "color": "#E5ECF6", "width": 0.5 } } } ], "heatmapgl": [ { "type": "heatmapgl", "colorbar": { "ticks": "", "outlinewidth": 0 } } ], "histogram": [ { "type": "histogram", "marker": { "colorbar": { "ticks": "", "outlinewidth": 0 } } } ], "parcoords": [ { "line": { "colorbar": { "ticks": "", "outlinewidth": 0 } }, "type": "parcoords" } ], "scatter3d": [ { "line": { "colorbar": { "ticks": "", "outlinewidth": 0 } }, "type": "scatter3d", "marker": { "colorbar": { "ticks": "", "outlinewidth": 0 } } } ], "scattergl": [ { "type": "scattergl", "marker": { "colorbar": { "ticks": "", "outlinewidth": 0 } } } ], "choropleth": [ { "type": "choropleth", "colorbar": { "ticks": "", "outlinewidth": 0 } } ], "scattergeo": [ { "type": "scattergeo", "marker": { "colorbar": { "ticks": "", "outlinewidth": 0 } } } ], "histogram2d": [ { "type": "histogram2d", "colorbar": { "ticks": "", "outlinewidth": 0 }, "colorscale": [ [ 0, "#0d0887" ], [ 0.1111111111111111, "#46039f" ], [ 0.2222222222222222, "#7201a8" ], [ 0.3333333333333333, "#9c179e" ], [ 0.4444444444444444, "#bd3786" ], [ 0.5555555555555556, "#d8576b" ], [ 0.6666666666666666, "#ed7953" ], [ 0.7777777777777778, "#fb9f3a" ], [ 0.8888888888888888, "#fdca26" ], [ 1, "#f0f921" ] ] } ], "scatterpolar": [ { "type": "scatterpolar", "marker": { "colorbar": { "ticks": "", "outlinewidth": 0 } } } ], "contourcarpet": [ { "type": "contourcarpet", "colorbar": { "ticks": "", "outlinewidth": 0 } } ], "scattercarpet": [ { "type": "scattercarpet", "marker": { "colorbar": { "ticks": "", "outlinewidth": 0 } } } ], "scattermapbox": [ { "type": "scattermapbox", "marker": { "colorbar": { "ticks": "", "outlinewidth": 0 } } } ], "scatterpolargl": [ { "type": "scatterpolargl", "marker": { "colorbar": { "ticks": "", "outlinewidth": 0 } } } ], "scatterternary": [ { "type": "scatterternary", "marker": { "colorbar": { "ticks": "", "outlinewidth": 0 } } } ], "histogram2dcontour": [ { "type": "histogram2dcontour", "colorbar": { "ticks": "", "outlinewidth": 0 }, "colorscale": [ [ 0, "#0d0887" ], [ 0.1111111111111111, "#46039f" ], [ 0.2222222222222222, "#7201a8" ], [ 0.3333333333333333, "#9c179e" ], [ 0.4444444444444444, "#bd3786" ], [ 0.5555555555555556, "#d8576b" ], [ 0.6666666666666666, "#ed7953" ], [ 0.7777777777777778, "#fb9f3a" ], [ 0.8888888888888888, "#fdca26" ], [ 1, "#f0f921" ] ] } ] }, "layout": { "geo": { "bgcolor": "white", "showland": true, "lakecolor": "white", "landcolor": "#E5ECF6", "showlakes": true, "subunitcolor": "white" }, "font": { "color": "#2a3f5f" }, "polar": { "bgcolor": "#E5ECF6", "radialaxis": { "ticks": "", "gridcolor": "white", "linecolor": "white" }, "angularaxis": { "ticks": "", "gridcolor": "white", "linecolor": "white" } }, "scene": { "xaxis": { "ticks": "", "gridcolor": "white", "gridwidth": 2, "linecolor": "white", "zerolinecolor": "white", "showbackground": true, "backgroundcolor": "#E5ECF6" }, "yaxis": { "ticks": "", "gridcolor": "white", "gridwidth": 2, "linecolor": "white", "zerolinecolor": "white", "showbackground": true, "backgroundcolor": "#E5ECF6" }, "zaxis": { "ticks": "", "gridcolor": "white", "gridwidth": 2, "linecolor": "white", "zerolinecolor": "white", "showbackground": true, "backgroundcolor": "#E5ECF6" } }, "title": { "x": 0.05 }, "xaxis": { "ticks": "", "gridcolor": "white", "linecolor": "white", "automargin": true, "zerolinecolor": "white", "zerolinewidth": 2 }, "yaxis": { "ticks": "", "gridcolor": "white", "linecolor": "white", "automargin": true, "zerolinecolor": "white", "zerolinewidth": 2 }, "mapbox": { "style": "light" }, "ternary": { "aaxis": { "ticks": "", "gridcolor": "white", "linecolor": "white" }, "baxis": { "ticks": "", "gridcolor": "white", "linecolor": "white" }, "caxis": { "ticks": "", "gridcolor": "white", "linecolor": "white" }, "bgcolor": "#E5ECF6" }, "colorway": [ "#636efa", "#EF553B", "#00cc96", "#ab63fa", "#FFA15A", "#19d3f3", "#FF6692", "#B6E880", "#FF97FF", "#FECB52" ], "hovermode": "closest", "colorscale": { "diverging": [ [ 0, "#8e0152" ], [ 0.1, "#c51b7d" ], [ 0.2, "#de77ae" ], [ 0.3, "#f1b6da" ], [ 0.4, "#fde0ef" ], [ 0.5, "#f7f7f7" ], [ 0.6, "#e6f5d0" ], [ 0.7, "#b8e186" ], [ 0.8, "#7fbc41" ], [ 0.9, "#4d9221" ], [ 1, "#276419" ] ], "sequential": [ [ 0, "#0d0887" ], [ 0.1111111111111111, "#46039f" ], [ 0.2222222222222222, "#7201a8" ], [ 0.3333333333333333, "#9c179e" ], [ 0.4444444444444444, "#bd3786" ], [ 0.5555555555555556, "#d8576b" ], [ 0.6666666666666666, "#ed7953" ], [ 0.7777777777777778, "#fb9f3a" ], [ 0.8888888888888888, "#fdca26" ], [ 1, "#f0f921" ] ], "sequentialminus": [ [ 0, "#0d0887" ], [ 0.1111111111111111, "#46039f" ], [ 0.2222222222222222, "#7201a8" ], [ 0.3333333333333333, "#9c179e" ], [ 0.4444444444444444, "#bd3786" ], [ 0.5555555555555556, "#d8576b" ], [ 0.6666666666666666, "#ed7953" ], [ 0.7777777777777778, "#fb9f3a" ], [ 0.8888888888888888, "#fdca26" ], [ 1, "#f0f921" ] ] }, "hoverlabel": { "align": "left" }, "plot_bgcolor": "#E5ECF6", "paper_bgcolor": "white", "shapedefaults": { "line": { "width": 0 }, "opacity": 0.4, "fillcolor": "#506784" }, "annotationdefaults": { "arrowhead": 0, "arrowcolor": "#506784", "arrowwidth": 1 } } }, "hoverlabel": { "font": { "size": 13 } }, "showlegend": false, "uniformtext": { "mode": false }, "plot_bgcolor": "rgb(241, 246, 252)" } }, "height": null, "width": null, "user": { "profile_url": "https://chart-studio.plotly.com/~Sereneee", "avatar_url": "https://storage.googleapis.com/plotly-prod-profiles/69.jpg", "background_url": "https://storage.googleapis.com/plotly-prod-profiles/bg-4.jpg", "bio": "", "nickname": "", "website": "", "stream_tokens": null, "feature_set_id": null, "csrf_token": null, "date_joined": "2025-05-01 04:11:39", "mapbox_access_tokens": null, "has_password": null, "username": "Sereneee", "email": null, "is_active": null, "readonly": null, "is_dash_creator": null, "dash_created_count": null, "is_chart_creator": null, "charts_created_count": null } }, { "creation_time": "2025-06-06T08:50:37.157138Z", "comments": { "results": [], "count": 0 }, "parented": true, "embed_url": "https://chart-studio.plotly.com/~parmend/141.embed", "fid": "parmend:141", "filename": "test___", "filetype": "plot", "img_url": "https://api.plotly.com/v2/files/parmend:141/image?image_name=list-thumb", "image_urls": { "default": "https://storage.googleapis.com/plotly-prod-images/parmend/141/2_ODZREA75ML0U1ABQRGOSXRX0L2YD9M.png", "block-thumb": "https://storage.googleapis.com/plotly-prod-images/parmend/141/8_H28Q6TY6024D0E36NHTTV6W9DD9C79.png", "list-thumb": "https://api.plotly.com/v2/files/parmend:141/image?image_name=list-thumb" }, "api_urls": { "files": "https://api.plotly.com/v2/files/parmend:141", "plots": "https://api.plotly.com/v2/plots/parmend:141", "parent": "https://api.plotly.com/v2/folders/home?user=parmend" }, "owner": "parmend", "parent": -1, "preview": "", "referencers": [], "references": [], "title": "", "views": 0, "web_url": "https://chart-studio.plotly.com/~parmend/141/", "world_readable": true, "date_modified": "2025-06-06T08:50:37.167Z", "stars": { "results": [], "count": 0 }, "collaborators": { "results": [], "count": 0 }, "subfolder_count": null, "refresh_interval": null, "organize_view_url": "https://chart-studio.plotly.com/~parmend/141/", "current_user_permission": "read", "is_theme": null, "is_template": false, "autosize": true, "caption": "", "figure": { "data": [ { "meta": { "columnNames": { "x": "A", "y": "B", "z": "C" } }, "mode": "markers", "type": "heatmap", "xsrc": "parmend:140:515849", "ysrc": "parmend:140:007fb4", "zsrc": "parmend:140:ad13a4", "autocolorscale": true } ], "frames": [], "layout": { "xaxis": { "type": "linear", "range": [ 2, 500 ], "autorange": true }, "yaxis": { "type": "category", "range": [ -0.5071047957371225, 0.5071047957371225 ], "autorange": true }, "shapes": [ { "x0": 250, "x1": 250, "y0": -0.5, "y1": 0.5, "line": { "color": "#444444", "width": 8 }, "type": "line", "opacity": 0.3, "fillcolor": "#7f7f7f" } ], "autosize": true, "template": { "data": { "bar": [ { "type": "bar", "marker": { "colorbar": { "ticks": "", "outlinewidth": 0 } } } ], "table": [ { "type": "table", "cells": { "fill": { "color": "#EBF0F8" }, "line": { "color": "white" } }, "header": { "fill": { "color": "#C8D4E3" }, "line": { "color": "white" } } } ], "carpet": [ { "type": "carpet", "aaxis": { "gridcolor": "#C8D4E3", "linecolor": "#C8D4E3", "endlinecolor": "#2a3f5f", "minorgridcolor": "#C8D4E3", "startlinecolor": "#2a3f5f" }, "baxis": { "gridcolor": "#C8D4E3", "linecolor": "#C8D4E3", "endlinecolor": "#2a3f5f", "minorgridcolor": "#C8D4E3", "startlinecolor": "#2a3f5f" } } ], "mesh3d": [ { "type": "mesh3d", "colorbar": { "ticks": "", "outlinewidth": 0 } } ], "contour": [ { "type": "contour", "colorbar": { "ticks": "", "outlinewidth": 0 }, "autocolorscale": true } ], "heatmap": [ { "type": "heatmap", "colorbar": { "ticks": "", "outlinewidth": 0 }, "autocolorscale": true } ], "scatter": [ { "type": "scatter", "marker": { "colorbar": { "ticks": "", "outlinewidth": 0 } } } ], "surface": [ { "type": "surface", "colorbar": { "ticks": "", "outlinewidth": 0 } } ], "heatmapgl": [ { "type": "heatmapgl", "colorbar": { "ticks": "", "outlinewidth": 0 } } ], "histogram": [ { "type": "histogram", "marker": { "colorbar": { "ticks": "", "outlinewidth": 0 } } } ], "parcoords": [ { "line": { "colorbar": { "ticks": "", "outlinewidth": 0 } }, "type": "parcoords" } ], "scatter3d": [ { "type": "scatter3d", "marker": { "colorbar": { "ticks": "", "outlinewidth": 0 } } } ], "scattergl": [ { "type": "scattergl", "marker": { "colorbar": { "ticks": "", "outlinewidth": 0 } } } ], "choropleth": [ { "type": "choropleth", "colorbar": { "ticks": "", "outlinewidth": 0 } } ], "scattergeo": [ { "type": "scattergeo", "marker": { "colorbar": { "ticks": "", "outlinewidth": 0 } } } ], "histogram2d": [ { "type": "histogram2d", "colorbar": { "ticks": "", "outlinewidth": 0 }, "autocolorscale": true } ], "scatterpolar": [ { "type": "scatterpolar", "marker": { "colorbar": { "ticks": "", "outlinewidth": 0 } } } ], "contourcarpet": [ { "type": "contourcarpet", "colorbar": { "ticks": "", "outlinewidth": 0 } } ], "scattercarpet": [ { "type": "scattercarpet", "marker": { "colorbar": { "ticks": "", "outlinewidth": 0 } } } ], "scattermapbox": [ { "type": "scattermapbox", "marker": { "colorbar": { "ticks": "", "outlinewidth": 0 } } } ], "scatterpolargl": [ { "type": "scatterpolargl", "marker": { "colorbar": { "ticks": "", "outlinewidth": 0 } } } ], "scatterternary": [ { "type": "scatterternary", "marker": { "colorbar": { "ticks": "", "outlinewidth": 0 } } } ], "histogram2dcontour": [ { "type": "histogram2dcontour", "colorbar": { "ticks": "", "outlinewidth": 0 }, "autocolorscale": true } ] }, "layout": { "geo": { "bgcolor": "white", "showland": true, "lakecolor": "white", "landcolor": "white", "showlakes": true, "subunitcolor": "#C8D4E3" }, "font": { "color": "#2a3f5f" }, "polar": { "bgcolor": "white", "radialaxis": { "ticks": "", "gridcolor": "#EBF0F8", "linecolor": "#EBF0F8" }, "angularaxis": { "ticks": "", "gridcolor": "#EBF0F8", "linecolor": "#EBF0F8" } }, "scene": { "xaxis": { "ticks": "", "gridcolor": "#DFE8F3", "gridwidth": 2, "linecolor": "#EBF0F8", "zerolinecolor": "#EBF0F8", "showbackground": true, "backgroundcolor": "white" }, "yaxis": { "ticks": "", "gridcolor": "#DFE8F3", "gridwidth": 2, "linecolor": "#EBF0F8", "zerolinecolor": "#EBF0F8", "showbackground": true, "backgroundcolor": "white" }, "zaxis": { "ticks": "", "gridcolor": "#DFE8F3", "gridwidth": 2, "linecolor": "#EBF0F8", "zerolinecolor": "#EBF0F8", "showbackground": true, "backgroundcolor": "white" } }, "title": { "x": 0.05 }, "xaxis": { "ticks": "", "gridcolor": "#EBF0F8", "linecolor": "#EBF0F8", "automargin": true, "zerolinecolor": "#EBF0F8", "zerolinewidth": 2 }, "yaxis": { "ticks": "", "gridcolor": "#EBF0F8", "linecolor": "#EBF0F8", "automargin": true, "zerolinecolor": "#EBF0F8", "zerolinewidth": 2 }, "ternary": { "aaxis": { "ticks": "", "gridcolor": "#DFE8F3", "linecolor": "#A2B1C6" }, "baxis": { "ticks": "", "gridcolor": "#DFE8F3", "linecolor": "#A2B1C6" }, "caxis": { "ticks": "", "gridcolor": "#DFE8F3", "linecolor": "#A2B1C6" }, "bgcolor": "white" }, "colorway": [ "#636efa", "#EF553B", "#00cc96", "#ab63fa", "#19d3f3", "#e763fa", "#fecb52", "#ffa15a", "#ff6692", "#b6e880" ], "hovermode": "closest", "colorscale": { "diverging": [ [ 0, "#8e0152" ], [ 0.1, "#c51b7d" ], [ 0.2, "#de77ae" ], [ 0.3, "#f1b6da" ], [ 0.4, "#fde0ef" ], [ 0.5, "#f7f7f7" ], [ 0.6, "#e6f5d0" ], [ 0.7, "#b8e186" ], [ 0.8, "#7fbc41" ], [ 0.9, "#4d9221" ], [ 1, "#276419" ] ], "sequential": [ [ 0, "#0508b8" ], [ 0.0893854748603352, "#1910d8" ], [ 0.1787709497206704, "#3c19f0" ], [ 0.2681564245810056, "#6b1cfb" ], [ 0.3575418994413408, "#981cfd" ], [ 0.44692737430167595, "#bf1cfd" ], [ 0.5363128491620112, "#dd2bfd" ], [ 0.6256983240223464, "#f246fe" ], [ 0.7150837988826816, "#fc67fd" ], [ 0.8044692737430168, "#fe88fc" ], [ 0.8938547486033519, "#fea5fd" ], [ 0.9832402234636871, "#febefe" ], [ 1, "#fec3fe" ] ], "sequentialminus": [ [ 0, "#0508b8" ], [ 0.0893854748603352, "#1910d8" ], [ 0.1787709497206704, "#3c19f0" ], [ 0.2681564245810056, "#6b1cfb" ], [ 0.3575418994413408, "#981cfd" ], [ 0.44692737430167595, "#bf1cfd" ], [ 0.5363128491620112, "#dd2bfd" ], [ 0.6256983240223464, "#f246fe" ], [ 0.7150837988826816, "#fc67fd" ], [ 0.8044692737430168, "#fe88fc" ], [ 0.8938547486033519, "#fea5fd" ], [ 0.9832402234636871, "#febefe" ], [ 1, "#fec3fe" ] ] }, "plot_bgcolor": "white", "paper_bgcolor": "white", "shapedefaults": { "line": { "width": 0 }, "opacity": 0.4, "fillcolor": "#506784" }, "annotationdefaults": { "arrowhead": 0, "arrowcolor": "#506784", "arrowwidth": 1 } }, "themeRef": "PLOTLY_WHITE" } } }, "height": null, "width": null, "user": { "profile_url": "https://chart-studio.plotly.com/~parmend", "avatar_url": "https://storage.googleapis.com/plotly-prod-profiles/91.jpg", "background_url": "https://storage.googleapis.com/plotly-prod-profiles/bg-8.jpg", "bio": "", "nickname": "", "website": "", "stream_tokens": null, "feature_set_id": null, "csrf_token": null, "date_joined": "2022-11-13 14:05:14", "mapbox_access_tokens": null, "has_password": null, "username": "parmend", "email": null, "is_active": null, "readonly": null, "is_dash_creator": null, "dash_created_count": null, "is_chart_creator": null, "charts_created_count": null } }, { "creation_time": "2025-06-06T07:59:11.300200Z", "comments": { "results": [], "count": 0 }, "parented": true, "embed_url": "https://chart-studio.plotly.com/~myy08493/1.embed", "fid": "myy08493:1", "filename": "Plot 1", "filetype": "plot", "img_url": "https://api.plotly.com/v2/files/myy08493:1/image?image_name=list-thumb", "image_urls": { "default": "https://storage.googleapis.com/plotly-prod-images/myy08493/1/2_O7HH81DXJRLOS0IBGLKRP7LUE16CXO.png", "block-thumb": "https://storage.googleapis.com/plotly-prod-images/myy08493/1/8_5YCWTFP613JV1TI9U6QEBESEXT43YL.png", "list-thumb": "https://api.plotly.com/v2/files/myy08493:1/image?image_name=list-thumb" }, "api_urls": { "files": "https://api.plotly.com/v2/files/myy08493:1", "plots": "https://api.plotly.com/v2/plots/myy08493:1", "parent": "https://api.plotly.com/v2/folders/home?user=myy08493" }, "owner": "myy08493", "parent": -1, "preview": "", "referencers": [], "references": [], "title": "", "views": 1, "web_url": "https://chart-studio.plotly.com/~myy08493/1/", "world_readable": true, "date_modified": "2025-06-06T07:59:11.314Z", "stars": { "results": [], "count": 0 }, "collaborators": { "results": [], "count": 0 }, "subfolder_count": null, "refresh_interval": null, "organize_view_url": "https://chart-studio.plotly.com/~myy08493/1/", "current_user_permission": "read", "is_theme": null, "is_template": false, "autosize": true, "caption": "", "figure": { "data": [ { "meta": { "columnNames": { "y": "A", "z": "实际为 0 - 实际为 1" } }, "mode": "markers", "type": "heatmap", "ysrc": "myy08493:0:661ddf", "zsrc": "myy08493:0:e32f8f,f92f36", "autocolorscale": true } ], "frames": [], "layout": { "font": { "family": "Arial" }, "xaxis": { "range": [ -0.5, 1.5 ], "autorange": true }, "yaxis": { "type": "category", "range": [ -0.5, 1.5 ], "autorange": true }, "autosize": true, "template": { "data": { "bar": [ { "type": "bar", "marker": { "colorbar": { "ticks": "", "outlinewidth": 0 } } } ], "table": [ { "type": "table", "cells": { "fill": { "color": "#EBF0F8" }, "line": { "color": "white" } }, "header": { "fill": { "color": "#C8D4E3" }, "line": { "color": "white" } } } ], "carpet": [ { "type": "carpet", "aaxis": { "gridcolor": "#C8D4E3", "linecolor": "#C8D4E3", "endlinecolor": "#2a3f5f", "minorgridcolor": "#C8D4E3", "startlinecolor": "#2a3f5f" }, "baxis": { "gridcolor": "#C8D4E3", "linecolor": "#C8D4E3", "endlinecolor": "#2a3f5f", "minorgridcolor": "#C8D4E3", "startlinecolor": "#2a3f5f" } } ], "mesh3d": [ { "type": "mesh3d", "colorbar": { "ticks": "", "outlinewidth": 0 } } ], "contour": [ { "type": "contour", "colorbar": { "ticks": "", "outlinewidth": 0 }, "autocolorscale": true } ], "heatmap": [ { "type": "heatmap", "colorbar": { "ticks": "", "outlinewidth": 0 }, "autocolorscale": true } ], "scatter": [ { "type": "scatter", "marker": { "colorbar": { "ticks": "", "outlinewidth": 0 } } } ], "surface": [ { "type": "surface", "colorbar": { "ticks": "", "outlinewidth": 0 } } ], "heatmapgl": [ { "type": "heatmapgl", "colorbar": { "ticks": "", "outlinewidth": 0 } } ], "histogram": [ { "type": "histogram", "marker": { "colorbar": { "ticks": "", "outlinewidth": 0 } } } ], "parcoords": [ { "line": { "colorbar": { "ticks": "", "outlinewidth": 0 } }, "type": "parcoords" } ], "scatter3d": [ { "type": "scatter3d", "marker": { "colorbar": { "ticks": "", "outlinewidth": 0 } } } ], "scattergl": [ { "type": "scattergl", "marker": { "colorbar": { "ticks": "", "outlinewidth": 0 } } } ], "choropleth": [ { "type": "choropleth", "colorbar": { "ticks": "", "outlinewidth": 0 } } ], "scattergeo": [ { "type": "scattergeo", "marker": { "colorbar": { "ticks": "", "outlinewidth": 0 } } } ], "histogram2d": [ { "type": "histogram2d", "colorbar": { "ticks": "", "outlinewidth": 0 }, "autocolorscale": true } ], "scatterpolar": [ { "type": "scatterpolar", "marker": { "colorbar": { "ticks": "", "outlinewidth": 0 } } } ], "contourcarpet": [ { "type": "contourcarpet", "colorbar": { "ticks": "", "outlinewidth": 0 } } ], "scattercarpet": [ { "type": "scattercarpet", "marker": { "colorbar": { "ticks": "", "outlinewidth": 0 } } } ], "scattermapbox": [ { "type": "scattermapbox", "marker": { "colorbar": { "ticks": "", "outlinewidth": 0 } } } ], "scatterpolargl": [ { "type": "scatterpolargl", "marker": { "colorbar": { "ticks": "", "outlinewidth": 0 } } } ], "scatterternary": [ { "type": "scatterternary", "marker": { "colorbar": { "ticks": "", "outlinewidth": 0 } } } ], "histogram2dcontour": [ { "type": "histogram2dcontour", "colorbar": { "ticks": "", "outlinewidth": 0 }, "autocolorscale": true } ] }, "layout": { "geo": { "bgcolor": "white", "showland": true, "lakecolor": "white", "landcolor": "white", "showlakes": true, "subunitcolor": "#C8D4E3" }, "font": { "color": "#2a3f5f" }, "polar": { "bgcolor": "white", "radialaxis": { "ticks": "", "gridcolor": "#EBF0F8", "linecolor": "#EBF0F8" }, "angularaxis": { "ticks": "", "gridcolor": "#EBF0F8", "linecolor": "#EBF0F8" } }, "scene": { "xaxis": { "ticks": "", "gridcolor": "#DFE8F3", "gridwidth": 2, "linecolor": "#EBF0F8", "zerolinecolor": "#EBF0F8", "showbackground": true, "backgroundcolor": "white" }, "yaxis": { "ticks": "", "gridcolor": "#DFE8F3", "gridwidth": 2, "linecolor": "#EBF0F8", "zerolinecolor": "#EBF0F8", "showbackground": true, "backgroundcolor": "white" }, "zaxis": { "ticks": "", "gridcolor": "#DFE8F3", "gridwidth": 2, "linecolor": "#EBF0F8", "zerolinecolor": "#EBF0F8", "showbackground": true, "backgroundcolor": "white" } }, "title": { "x": 0.05 }, "xaxis": { "ticks": "", "gridcolor": "#EBF0F8", "linecolor": "#EBF0F8", "automargin": true, "zerolinecolor": "#EBF0F8", "zerolinewidth": 2 }, "yaxis": { "ticks": "", "gridcolor": "#EBF0F8", "linecolor": "#EBF0F8", "automargin": true, "zerolinecolor": "#EBF0F8", "zerolinewidth": 2 }, "ternary": { "aaxis": { "ticks": "", "gridcolor": "#DFE8F3", "linecolor": "#A2B1C6" }, "baxis": { "ticks": "", "gridcolor": "#DFE8F3", "linecolor": "#A2B1C6" }, "caxis": { "ticks": "", "gridcolor": "#DFE8F3", "linecolor": "#A2B1C6" }, "bgcolor": "white" }, "colorway": [ "#636efa", "#EF553B", "#00cc96", "#ab63fa", "#19d3f3", "#e763fa", "#fecb52", "#ffa15a", "#ff6692", "#b6e880" ], "hovermode": "closest", "colorscale": { "diverging": [ [ 0, "#8e0152" ], [ 0.1, "#c51b7d" ], [ 0.2, "#de77ae" ], [ 0.3, "#f1b6da" ], [ 0.4, "#fde0ef" ], [ 0.5, "#f7f7f7" ], [ 0.6, "#e6f5d0" ], [ 0.7, "#b8e186" ], [ 0.8, "#7fbc41" ], [ 0.9, "#4d9221" ], [ 1, "#276419" ] ], "sequential": [ [ 0, "#0508b8" ], [ 0.0893854748603352, "#1910d8" ], [ 0.1787709497206704, "#3c19f0" ], [ 0.2681564245810056, "#6b1cfb" ], [ 0.3575418994413408, "#981cfd" ], [ 0.44692737430167595, "#bf1cfd" ], [ 0.5363128491620112, "#dd2bfd" ], [ 0.6256983240223464, "#f246fe" ], [ 0.7150837988826816, "#fc67fd" ], [ 0.8044692737430168, "#fe88fc" ], [ 0.8938547486033519, "#fea5fd" ], [ 0.9832402234636871, "#febefe" ], [ 1, "#fec3fe" ] ], "sequentialminus": [ [ 0, "#0508b8" ], [ 0.0893854748603352, "#1910d8" ], [ 0.1787709497206704, "#3c19f0" ], [ 0.2681564245810056, "#6b1cfb" ], [ 0.3575418994413408, "#981cfd" ], [ 0.44692737430167595, "#bf1cfd" ], [ 0.5363128491620112, "#dd2bfd" ], [ 0.6256983240223464, "#f246fe" ], [ 0.7150837988826816, "#fc67fd" ], [ 0.8044692737430168, "#fe88fc" ], [ 0.8938547486033519, "#fea5fd" ], [ 0.9832402234636871, "#febefe" ], [ 1, "#fec3fe" ] ] }, "plot_bgcolor": "white", "paper_bgcolor": "white", "shapedefaults": { "line": { "width": 0 }, "opacity": 0.4, "fillcolor": "#506784" }, "annotationdefaults": { "arrowhead": 0, "arrowcolor": "#506784", "arrowwidth": 1 } }, "themeRef": "PLOTLY_WHITE" }, "colorscale": { "sequential": [ [ 0, "#0508b8" ], [ 0.08333333333333333, "#1910d8" ], [ 0.16666666666666666, "#3c19f0" ], [ 0.25, "#6b1cfb" ], [ 0.3333333333333333, "#981cfd" ], [ 0.4166666666666667, "#bf1cfd" ], [ 0.5, "#dd2bfd" ], [ 0.5833333333333334, "#f246fe" ], [ 0.6666666666666666, "#fc67fd" ], [ 0.75, "#fe88fc" ], [ 0.8333333333333334, "#fea5fd" ], [ 0.9166666666666666, "#febefe" ], [ 1, "#fec3fe" ] ] }, "uniformtext": { "mode": "show", "minsize": 8 } } }, "height": null, "width": null, "user": { "profile_url": "https://chart-studio.plotly.com/~myy08493", "avatar_url": "https://storage.googleapis.com/plotly-prod-profiles/59.jpg", "background_url": "https://storage.googleapis.com/plotly-prod-profiles/bg-1.jpg", "bio": "", "nickname": "", "website": "", "stream_tokens": null, "feature_set_id": null, "csrf_token": null, "date_joined": "2025-06-06 07:17:25", "mapbox_access_tokens": null, "has_password": null, "username": "myy08493", "email": null, "is_active": null, "readonly": null, "is_dash_creator": null, "dash_created_count": null, "is_chart_creator": null, "charts_created_count": null } }, { "creation_time": "2025-06-06T07:43:07.789075Z", "comments": { "results": [], "count": 0 }, "parented": true, "embed_url": "https://chart-studio.plotly.com/~raptor7037/191.embed", "fid": "raptor7037:191", "filename": "GC4 vs GC10 BP bar", "filetype": "plot", "img_url": "https://api.plotly.com/v2/files/raptor7037:191/image?image_name=list-thumb", "image_urls": { "default": "https://storage.googleapis.com/plotly-prod-images/raptor7037/191/2_JCR8E09BCZVSDJZCZD1HLGQ71YM09D.png", "block-thumb": "https://storage.googleapis.com/plotly-prod-images/raptor7037/191/8_H9JEWZ5SNXAWNZ1BHNR7UNAIBRY65B.png", "list-thumb": "https://api.plotly.com/v2/files/raptor7037:191/image?image_name=list-thumb" }, "api_urls": { "files": "https://api.plotly.com/v2/files/raptor7037:191", "plots": "https://api.plotly.com/v2/plots/raptor7037:191", "parent": "https://api.plotly.com/v2/folders/home?user=raptor7037" }, "owner": "raptor7037", "parent": -1, "preview": "", "referencers": [], "references": [], "title": "", "views": 2, "web_url": "https://chart-studio.plotly.com/~raptor7037/191/", "world_readable": true, "date_modified": "2025-06-06T08:00:15.886Z", "stars": { "results": [], "count": 0 }, "collaborators": { "results": [], "count": 0 }, "subfolder_count": null, "refresh_interval": null, "organize_view_url": "https://chart-studio.plotly.com/~raptor7037/191/", "current_user_permission": "read", "is_theme": null, "is_template": false, "autosize": false, "caption": "", "figure": { "data": [ { "meta": { "columnNames": { "x": "Count", "y": "Description", "marker": { "color": "pvalue" } } }, "mode": "markers", "name": "<br>", "type": "bar", "xsrc": "raptor7037:190:472a1e", "ysrc": "raptor7037:190:d2f4d1", "marker": { "cmax": 3e-16, "cmin": 3e-300, "line": { "color": "rgb(245, 244, 244)", "width": 0 }, "meta": { "columnNames": { "color": "pvalue" } }, "cauto": false, "opacity": 0.53, "colorbar": { "x": 1.0184021653693072, "y": 0.5084985835694051, "len": 0.5, "xpad": 10, "ypad": 22, "dtick": 5, "tick0": 1, "ticks": "inside", "title": { "font": { "size": 13, "color": "rgb(51,51,51)", "family": "Arial" }, "side": "top", "text": "<i>p</i> value" }, "nticks": 0, "bgcolor": "rgba(0, 0, 0, 0)", "lenmode": "fraction", "ticklen": 6, "xanchor": "left", "yanchor": "middle", "tickfont": { "size": 13, "color": "rgb(51,51,51)", "family": "Roboto" }, "tickmode": "auto", "thickness": 17, "tickangle": "auto", "tickcolor": "rgb(237,237,237)", "tickwidth": 1, "tickformat": "", "tickprefix": "", "ticksuffix": "", "bordercolor": "#444", "borderwidth": 0, "minexponent": 3, "outlinecolor": "#444", "outlinewidth": 0, "showexponent": "all", "thicknessmode": "pixels", "exponentformat": "B", "showticklabels": true, "separatethousands": false, "ticklabelposition": "outside" }, "colorsrc": "raptor7037:190:c151bd", "colorscale": [ [ 0, "#9e0142" ], [ 0.1, "#d53e4f" ], [ 0.2, "#f46d43" ], [ 0.3, "#fdae61" ], [ 0.4, "#fee08b" ], [ 0.5, "#ffffbf" ], [ 0.6, "#e6f598" ], [ 0.7, "#abdda4" ], [ 0.8, "#66c2a5" ], [ 0.9, "#3288bd" ], [ 1, "#5e4fa2" ] ], "reversescale": false, "autocolorscale": false }, "opacity": 1, "hoverinfo": "x+y", "orientation": "h", "textposition": "middle center", "hovertemplate": "", "autocolorscale": false } ], "frames": [], "layout": { "font": { "size": 17, "color": "rgb(0, 0, 0)", "family": "Arial" }, "title": { "x": 0.5, "font": { "size": 15 }, "text": "<br>" }, "width": 1000, "xaxis": { "side": "bottom", "type": "linear", "range": [ 0, 289.4736842105263 ], "title": { "font": { "size": 18, "family": "Arial" }, "text": "<b>Counts</b>" }, "ticklen": 6, "showline": false, "tickfont": { "size": 16, "family": "Arial" }, "tickmode": "auto", "zeroline": false, "autorange": true, "gridwidth": 2, "tickwidth": 1, "automargin": true, "fixedrange": true, "showspikes": true, "tickformat": "", "rangeslider": { "range": [ 0, 29.473684210526315 ], "yaxis": {}, "visible": false, "autorange": true }, "showticklabels": true, "spikethickness": 12 }, "yaxis": { "type": "category", "range": [ -0.5, 19.5 ], "title": { "font": { "size": 14 } }, "ticklen": 6, "autorange": true, "gridwidth": 2, "tickwidth": 1, "showspikes": false, "spikethickness": 12 }, "bargap": 0.19999999999999996, "height": 800, "margin": { "b": 0, "l": 0, "r": 0, "t": 0 }, "barmode": "group", "barnorm": "", "modebar": { "color": "rgba(131, 61, 61, 0.3)", "bgcolor": "#f4efef", "activecolor": "rgba(68, 68, 68, 0.7)", "orientation": "h" }, "autosize": false, "colorway": [ "#66c2a5", "#fc8d62", "#8da0cb", "#e78ac3", "#a6d854", "#ffd92f", "#e5c494", "#b3b3b3" ], "dragmode": "select", "template": { "data": { "bar": [ { "type": "bar", "marker": { "colorbar": { "len": 0.2, "ticks": "inside", "ticklen": 6, "tickcolor": "rgb(237,237,237)", "outlinewidth": 0 } } } ], "table": [ { "type": "table", "cells": { "fill": { "color": "rgb(237,237,237)" }, "line": { "color": "white" } }, "header": { "fill": { "color": "rgb(217,217,217)" }, "line": { "color": "white" } } } ], "carpet": [ { "type": "carpet", "aaxis": { "gridcolor": "white", "linecolor": "white", "endlinecolor": "rgb(51,51,51)", "minorgridcolor": "white", "startlinecolor": "rgb(51,51,51)" }, "baxis": { "gridcolor": "white", "linecolor": "white", "endlinecolor": "rgb(51,51,51)", "minorgridcolor": "white", "startlinecolor": "rgb(51,51,51)" } } ], "mesh3d": [ { "type": "mesh3d", "colorbar": { "len": 0.2, "ticks": "inside", "ticklen": 6, "tickcolor": "rgb(237,237,237)", "outlinewidth": 0 } } ], "contour": [ { "type": "contour", "colorbar": { "len": 0.2, "ticks": "inside", "ticklen": 6, "tickcolor": "rgb(237,237,237)", "outlinewidth": 0 }, "autocolorscale": true } ], "heatmap": [ { "type": "heatmap", "colorbar": { "len": 0.2, "ticks": "inside", "ticklen": 6, "tickcolor": "rgb(237,237,237)", "outlinewidth": 0 }, "autocolorscale": true } ], "scatter": [ { "type": "scatter", "marker": { "colorbar": { "len": 0.2, "ticks": "inside", "ticklen": 6, "tickcolor": "rgb(237,237,237)", "outlinewidth": 0 } } } ], "surface": [ { "type": "surface", "colorbar": { "len": 0.2, "ticks": "inside", "ticklen": 6, "tickcolor": "rgb(237,237,237)", "outlinewidth": 0 } } ], "heatmapgl": [ { "type": "heatmapgl", "colorbar": { "len": 0.2, "ticks": "inside", "ticklen": 6, "tickcolor": "rgb(237,237,237)", "outlinewidth": 0 } } ], "histogram": [ { "type": "histogram", "marker": { "colorbar": { "len": 0.2, "ticks": "inside", "ticklen": 6, "tickcolor": "rgb(237,237,237)", "outlinewidth": 0 } } } ], "parcoords": [ { "line": { "colorbar": { "len": 0.2, "ticks": "inside", "ticklen": 6, "tickcolor": "rgb(237,237,237)", "outlinewidth": 0 } }, "type": "parcoords" } ], "scatter3d": [ { "type": "scatter3d", "marker": { "colorbar": { "len": 0.2, "ticks": "inside", "ticklen": 6, "tickcolor": "rgb(237,237,237)", "outlinewidth": 0 } } } ], "scattergl": [ { "type": "scattergl", "marker": { "colorbar": { "len": 0.2, "ticks": "inside", "ticklen": 6, "tickcolor": "rgb(237,237,237)", "outlinewidth": 0 } } } ], "choropleth": [ { "type": "choropleth", "colorbar": { "len": 0.2, "ticks": "inside", "ticklen": 6, "tickcolor": "rgb(237,237,237)", "outlinewidth": 0 } } ], "scattergeo": [ { "type": "scattergeo", "marker": { "colorbar": { "len": 0.2, "ticks": "inside", "ticklen": 6, "tickcolor": "rgb(237,237,237)", "outlinewidth": 0 } } } ], "histogram2d": [ { "type": "histogram2d", "colorbar": { "len": 0.2, "ticks": "inside", "ticklen": 6, "tickcolor": "rgb(237,237,237)", "outlinewidth": 0 }, "autocolorscale": true } ], "scatterpolar": [ { "type": "scatterpolar", "marker": { "colorbar": { "len": 0.2, "ticks": "inside", "ticklen": 6, "tickcolor": "rgb(237,237,237)", "outlinewidth": 0 } } } ], "contourcarpet": [ { "type": "contourcarpet", "colorbar": { "len": 0.2, "ticks": "inside", "ticklen": 6, "tickcolor": "rgb(237,237,237)", "outlinewidth": 0 } } ], "scattercarpet": [ { "type": "scattercarpet", "marker": { "colorbar": { "len": 0.2, "ticks": "inside", "ticklen": 6, "tickcolor": "rgb(237,237,237)", "outlinewidth": 0 } } } ], "scattermapbox": [ { "type": "scattermapbox", "marker": { "colorbar": { "len": 0.2, "ticks": "inside", "ticklen": 6, "tickcolor": "rgb(237,237,237)", "outlinewidth": 0 } } } ], "scatterpolargl": [ { "type": "scatterpolargl", "marker": { "colorbar": { "len": 0.2, "ticks": "inside", "ticklen": 6, "tickcolor": "rgb(237,237,237)", "outlinewidth": 0 } } } ], "scatterternary": [ { "type": "scatterternary", "marker": { "colorbar": { "len": 0.2, "ticks": "inside", "ticklen": 6, "tickcolor": "rgb(237,237,237)", "outlinewidth": 0 } } } ], "histogram2dcontour": [ { "type": "histogram2dcontour", "colorbar": { "len": 0.2, "ticks": "inside", "ticklen": 6, "tickcolor": "rgb(237,237,237)", "outlinewidth": 0 }, "autocolorscale": true } ] }, "layout": { "geo": { "bgcolor": "white", "showland": true, "lakecolor": "white", "landcolor": "rgb(237,237,237)", "showlakes": true, "subunitcolor": "white" }, "font": { "color": "rgb(51,51,51)" }, "polar": { "bgcolor": "rgb(237,237,237)", "radialaxis": { "ticks": "outside", "showgrid": true, "gridcolor": "white", "linecolor": "white", "tickcolor": "rgb(51,51,51)" }, "angularaxis": { "ticks": "outside", "showgrid": true, "gridcolor": "white", "linecolor": "white", "tickcolor": "rgb(51,51,51)" } }, "scene": { "xaxis": { "ticks": "outside", "showgrid": true, "gridcolor": "white", "gridwidth": 2, "linecolor": "white", "tickcolor": "rgb(51,51,51)", "zerolinecolor": "white", "showbackground": true, "backgroundcolor": "rgb(237,237,237)" }, "yaxis": { "ticks": "outside", "showgrid": true, "gridcolor": "white", "gridwidth": 2, "linecolor": "white", "tickcolor": "rgb(51,51,51)", "zerolinecolor": "white", "showbackground": true, "backgroundcolor": "rgb(237,237,237)" }, "zaxis": { "ticks": "outside", "showgrid": true, "gridcolor": "white", "gridwidth": 2, "linecolor": "white", "tickcolor": "rgb(51,51,51)", "zerolinecolor": "white", "showbackground": true, "backgroundcolor": "rgb(237,237,237)" } }, "xaxis": { "ticks": "outside", "showgrid": true, "gridcolor": "white", "linecolor": "white", "tickcolor": "rgb(51,51,51)", "automargin": true, "zerolinecolor": "white" }, "yaxis": { "ticks": "outside", "showgrid": true, "gridcolor": "white", "linecolor": "white", "tickcolor": "rgb(51,51,51)", "automargin": true, "zerolinecolor": "white" }, "ternary": { "aaxis": { "ticks": "outside", "showgrid": true, "gridcolor": "white", "linecolor": "white", "tickcolor": "rgb(51,51,51)" }, "baxis": { "ticks": "outside", "showgrid": true, "gridcolor": "white", "linecolor": "white", "tickcolor": "rgb(51,51,51)" }, "caxis": { "ticks": "outside", "showgrid": true, "gridcolor": "white", "linecolor": "white", "tickcolor": "rgb(51,51,51)" }, "bgcolor": "rgb(237,237,237)" }, "colorway": [ "#F8766D", "#A3A500", "#00BF7D", "#00B0F6", "#E76BF3" ], "hovermode": "closest", "colorscale": { "diverging": [ [ 0, "#40004b" ], [ 0.1, "#762a83" ], [ 0.2, "#9970ab" ], [ 0.3, "#c2a5cf" ], [ 0.4, "#e7d4e8" ], [ 0.5, "#f7f7f7" ], [ 0.6, "#d9f0d3" ], [ 0.7, "#a6dba0" ], [ 0.8, "#5aae61" ], [ 0.9, "#1b7837" ], [ 1, "#00441b" ] ], "sequential": [ [ 0, "rgb(20,44,66)" ], [ 1, "rgb(90,179,244)" ] ], "sequentialminus": [ [ 0, "rgb(20,44,66)" ], [ 1, "rgb(90,179,244)" ] ] }, "plot_bgcolor": "rgb(237,237,237)", "paper_bgcolor": "white", "shapedefaults": { "line": { "width": 0 }, "opacity": 0.3, "fillcolor": "black" }, "annotationdefaults": { "arrowhead": 0, "arrowwidth": 1 } }, "themeRef": "GGPLOT2" }, "hovermode": "closest", "colorscale": { "diverging": [ [ 0, "#9e0142" ], [ 0.1, "#d53e4f" ], [ 0.2, "#f46d43" ], [ 0.3, "#fdae61" ], [ 0.4, "#fee08b" ], [ 0.5, "#ffffbf" ], [ 0.6, "#e6f598" ], [ 0.7, "#abdda4" ], [ 0.8, "#66c2a5" ], [ 0.9, "#3288bd" ], [ 1, "#5e4fa2" ] ], "sequentialminus": [ [ 0, "#f7fcfd" ], [ 0.125, "#e5f5f9" ], [ 0.25, "#ccece6" ], [ 0.375, "#99d8c9" ], [ 0.5, "#66c2a4" ], [ 0.625, "#41ae76" ], [ 0.75, "#238b45" ], [ 0.875, "#006d2c" ], [ 1, "#00441b" ] ] }, "showlegend": false, "bargroupgap": 0, "uniformtext": { "mode": "show", "minsize": 0 }, "plot_bgcolor": "rgb(251, 251, 251)" } }, "height": 800, "width": 1000, "user": { "profile_url": "https://chart-studio.plotly.com/~raptor7037", "avatar_url": "https://storage.googleapis.com/plotly-prod-profiles/36.jpg", "background_url": "https://storage.googleapis.com/plotly-prod-profiles/bg-7.jpg", "bio": "", "nickname": "", "website": "", "stream_tokens": null, "feature_set_id": null, "csrf_token": null, "date_joined": "2022-11-02 05:09:32", "mapbox_access_tokens": null, "has_password": null, "username": "raptor7037", "email": null, "is_active": null, "readonly": null, "is_dash_creator": null, "dash_created_count": null, "is_chart_creator": null, "charts_created_count": null } }, { "creation_time": "2025-06-06T07:18:34.498701Z", "comments": { "results": [], "count": 0 }, "parented": true, "embed_url": "https://chart-studio.plotly.com/~EDUCAYION/1.embed", "fid": "EDUCAYION:1", "filename": "Plot 1", "filetype": "plot", "img_url": "https://api.plotly.com/v2/files/EDUCAYION:1/image?image_name=list-thumb", "image_urls": { "default": "https://storage.googleapis.com/plotly-prod-images/EDUCAYION/1/2_5SV6NCLM7JD823XU2AU405G5VCHYYI.png", "block-thumb": "https://storage.googleapis.com/plotly-prod-images/EDUCAYION/1/8_HY76HYNWIQBSU02YV7CQZU3AMV7W84.png", "list-thumb": "https://api.plotly.com/v2/files/EDUCAYION:1/image?image_name=list-thumb" }, "api_urls": { "files": "https://api.plotly.com/v2/files/EDUCAYION:1", "plots": "https://api.plotly.com/v2/plots/EDUCAYION:1", "parent": "https://api.plotly.com/v2/folders/home?user=EDUCAYION" }, "owner": "EDUCAYION", "parent": -1, "preview": "", "referencers": [], "references": [], "title": "", "views": 0, "web_url": "https://chart-studio.plotly.com/~EDUCAYION/1/", "world_readable": true, "date_modified": "2025-06-06T07:33:38.058Z", "stars": { "results": [], "count": 0 }, "collaborators": { "results": [], "count": 0 }, "subfolder_count": null, "refresh_interval": null, "organize_view_url": "https://chart-studio.plotly.com/~EDUCAYION/1/", "current_user_permission": "read", "is_theme": null, "is_template": false, "autosize": true, "caption": "", "figure": { "data": [ { "meta": { "columnNames": { "i": "", "x": "A", "y": "B", "z": "C", "text": "D", "facecolor": "B", "intensity": "A", "vertexcolor": "C" } }, "mode": "markers", "type": "mesh3d", "xsrc": "EDUCAYION:0:e6968a", "ysrc": "EDUCAYION:0:dbe2b3", "zsrc": "EDUCAYION:0:94d603", "cauto": true, "opacity": 0.5, "textsrc": "EDUCAYION:0:01a039", "colorbar": { "x": 1.0135519125683061, "y": 0.46138888888888907, "dtick": 35, "tick0": 23, "ticks": "outside", "title": { "font": { "size": 19 }, "text": "" }, "bgcolor": "rgb(42, 205, 221)", "ticklen": 22, "xanchor": "center", "yanchor": "middle", "tickfont": { "size": 14, "color": "rgb(255, 243, 70)" }, "tickmode": "linear", "tickangle": 180, "tickcolor": "rgb(55, 219, 55)", "tickwidth": 50, "bordercolor": "rgb(114, 232, 61)", "outlinecolor": "rgb(16, 192, 187)", "showticklabels": true }, "lighting": { "ambient": 0.35, "diffuse": 1, "specular": 1.66 }, "showscale": true, "colorscale": [ [ 0, "#313131" ], [ 0.0625, "#3d019d" ], [ 0.125, "#3810dc" ], [ 0.1875, "#2d47f9" ], [ 0.25, "#2593ff" ], [ 0.3125, "#2adef6" ], [ 0.375, "#60fdfa" ], [ 0.4375, "#aefdff" ], [ 0.5, "#f3f3f1" ], [ 0.5625, "#fffda9" ], [ 0.625, "#fafd5b" ], [ 0.6875, "#f7da29" ], [ 0.75, "#ff8e25" ], [ 0.8125, "#f8432d" ], [ 0.875, "#d90d39" ], [ 0.9375, "#97023d" ], [ 1, "#313131" ] ], "flatshading": true, "facecolorsrc": "EDUCAYION:0:dbe2b3", "intensitysrc": "EDUCAYION:0:e6968a", "reversescale": false, "lightposition": { "x": 100000, "z": -30000 }, "autocolorscale": false, "vertexcolorsrc": "EDUCAYION:0:94d603" } ], "frames": [], "layout": { "scene": { "xaxis": { "type": "linear", "title": { "font": { "color": "rgb(42, 95, 43)", "family": "Times New Roman" }, "text": "conc. ppm for MCP" }, "showgrid": true, "showspikes": false }, "yaxis": { "type": "linear", "title": { "text": "Absorbance " }, "showspikes": false }, "zaxis": { "type": "linear", "title": { "text": "Time (minute )" }, "showspikes": false }, "camera": { "up": { "x": 0.5522046565454999, "y": 0.7934475205523572, "z": 0.25595126375695637 }, "eye": { "x": -1.468758664480787, "y": 1.2903128948780997, "z": -0.7941604888553695 }, "center": { "x": 0.08164767704570242, "y": -0.027376169769578906, "z": -0.054271507276124176 }, "projection": { "type": "orthographic" } }, "domain": { "x": [ null, 1 ], "y": [ 0, 1 ] }, "bgcolor": "rgb(243, 248, 244)", "dragmode": "orbit", "hovermode": false, "aspectmode": "auto", "aspectratio": { "x": 1, "y": 1, "z": 1 } }, "title": { "text": "Absorbance at 426 nm" }, "xaxis": { "type": "linear", "range": [ 275.7352941176471, 724.2647058823529 ], "autorange": true }, "yaxis": { "type": "linear", "range": [ 4.278903456495828, 15.72109654350417 ], "autorange": true }, "metasrc": "EDUCAYION:0:e6968a", "autosize": true, "colorway": [ "#636efa", "#EF553B", "#00cc96", "#ab63fa", "#19d3f3", "#e763fa", "#fecb52", "#ffa15a", "#ff6692", "#b6e880" ], "dragmode": "zoom", "template": { "data": { "bar": [ { "type": "bar", "marker": { "colorbar": { "ticks": "", "outlinewidth": 0 } } } ], "table": [ { "type": "table", "cells": { "fill": { "color": "#EBF0F8" }, "line": { "color": "white" } }, "header": { "fill": { "color": "#C8D4E3" }, "line": { "color": "white" } } } ], "carpet": [ { "type": "carpet", "aaxis": { "gridcolor": "#C8D4E3", "linecolor": "#C8D4E3", "endlinecolor": "#2a3f5f", "minorgridcolor": "#C8D4E3", "startlinecolor": "#2a3f5f" }, "baxis": { "gridcolor": "#C8D4E3", "linecolor": "#C8D4E3", "endlinecolor": "#2a3f5f", "minorgridcolor": "#C8D4E3", "startlinecolor": "#2a3f5f" } } ], "mesh3d": [ { "type": "mesh3d", "colorbar": { "ticks": "", "outlinewidth": 0 } } ], "contour": [ { "type": "contour", "colorbar": { "ticks": "", "outlinewidth": 0 }, "autocolorscale": true } ], "heatmap": [ { "type": "heatmap", "colorbar": { "ticks": "", "outlinewidth": 0 }, "autocolorscale": true } ], "scatter": [ { "type": "scatter", "marker": { "colorbar": { "ticks": "", "outlinewidth": 0 } } } ], "surface": [ { "type": "surface", "colorbar": { "ticks": "", "outlinewidth": 0 } } ], "heatmapgl": [ { "type": "heatmapgl", "colorbar": { "ticks": "", "outlinewidth": 0 } } ], "histogram": [ { "type": "histogram", "marker": { "colorbar": { "ticks": "", "outlinewidth": 0 } } } ], "parcoords": [ { "line": { "colorbar": { "ticks": "", "outlinewidth": 0 } }, "type": "parcoords" } ], "scatter3d": [ { "type": "scatter3d", "marker": { "colorbar": { "ticks": "", "outlinewidth": 0 } } } ], "scattergl": [ { "type": "scattergl", "marker": { "colorbar": { "ticks": "", "outlinewidth": 0 } } } ], "choropleth": [ { "type": "choropleth", "colorbar": { "ticks": "", "outlinewidth": 0 } } ], "scattergeo": [ { "type": "scattergeo", "marker": { "colorbar": { "ticks": "", "outlinewidth": 0 } } } ], "histogram2d": [ { "type": "histogram2d", "colorbar": { "ticks": "", "outlinewidth": 0 }, "autocolorscale": true } ], "scatterpolar": [ { "type": "scatterpolar", "marker": { "colorbar": { "ticks": "", "outlinewidth": 0 } } } ], "contourcarpet": [ { "type": "contourcarpet", "colorbar": { "ticks": "", "outlinewidth": 0 } } ], "scattercarpet": [ { "type": "scattercarpet", "marker": { "colorbar": { "ticks": "", "outlinewidth": 0 } } } ], "scattermapbox": [ { "type": "scattermapbox", "marker": { "colorbar": { "ticks": "", "outlinewidth": 0 } } } ], "scatterpolargl": [ { "type": "scatterpolargl", "marker": { "colorbar": { "ticks": "", "outlinewidth": 0 } } } ], "scatterternary": [ { "type": "scatterternary", "marker": { "colorbar": { "ticks": "", "outlinewidth": 0 } } } ], "histogram2dcontour": [ { "type": "histogram2dcontour", "colorbar": { "ticks": "", "outlinewidth": 0 }, "autocolorscale": true } ] }, "layout": { "geo": { "bgcolor": "white", "showland": true, "lakecolor": "white", "landcolor": "white", "showlakes": true, "subunitcolor": "#C8D4E3" }, "font": { "color": "#2a3f5f" }, "polar": { "bgcolor": "white", "radialaxis": { "ticks": "", "gridcolor": "#EBF0F8", "linecolor": "#EBF0F8" }, "angularaxis": { "ticks": "", "gridcolor": "#EBF0F8", "linecolor": "#EBF0F8" } }, "scene": { "xaxis": { "ticks": "", "gridcolor": "#DFE8F3", "gridwidth": 2, "linecolor": "#EBF0F8", "zerolinecolor": "#EBF0F8", "showbackground": true, "backgroundcolor": "white" }, "yaxis": { "ticks": "", "gridcolor": "#DFE8F3", "gridwidth": 2, "linecolor": "#EBF0F8", "zerolinecolor": "#EBF0F8", "showbackground": true, "backgroundcolor": "white" }, "zaxis": { "ticks": "", "gridcolor": "#DFE8F3", "gridwidth": 2, "linecolor": "#EBF0F8", "zerolinecolor": "#EBF0F8", "showbackground": true, "backgroundcolor": "white" } }, "title": { "x": 0.05 }, "xaxis": { "ticks": "", "gridcolor": "#EBF0F8", "linecolor": "#EBF0F8", "automargin": true, "zerolinecolor": "#EBF0F8", "zerolinewidth": 2 }, "yaxis": { "ticks": "", "gridcolor": "#EBF0F8", "linecolor": "#EBF0F8", "automargin": true, "zerolinecolor": "#EBF0F8", "zerolinewidth": 2 }, "ternary": { "aaxis": { "ticks": "", "gridcolor": "#DFE8F3", "linecolor": "#A2B1C6" }, "baxis": { "ticks": "", "gridcolor": "#DFE8F3", "linecolor": "#A2B1C6" }, "caxis": { "ticks": "", "gridcolor": "#DFE8F3", "linecolor": "#A2B1C6" }, "bgcolor": "white" }, "colorway": [ "#636efa", "#EF553B", "#00cc96", "#ab63fa", "#19d3f3", "#e763fa", "#fecb52", "#ffa15a", "#ff6692", "#b6e880" ], "hovermode": "closest", "colorscale": { "diverging": [ [ 0, "#8e0152" ], [ 0.1, "#c51b7d" ], [ 0.2, "#de77ae" ], [ 0.3, "#f1b6da" ], [ 0.4, "#fde0ef" ], [ 0.5, "#f7f7f7" ], [ 0.6, "#e6f5d0" ], [ 0.7, "#b8e186" ], [ 0.8, "#7fbc41" ], [ 0.9, "#4d9221" ], [ 1, "#276419" ] ], "sequential": [ [ 0, "#0508b8" ], [ 0.0893854748603352, "#1910d8" ], [ 0.1787709497206704, "#3c19f0" ], [ 0.2681564245810056, "#6b1cfb" ], [ 0.3575418994413408, "#981cfd" ], [ 0.44692737430167595, "#bf1cfd" ], [ 0.5363128491620112, "#dd2bfd" ], [ 0.6256983240223464, "#f246fe" ], [ 0.7150837988826816, "#fc67fd" ], [ 0.8044692737430168, "#fe88fc" ], [ 0.8938547486033519, "#fea5fd" ], [ 0.9832402234636871, "#febefe" ], [ 1, "#fec3fe" ] ], "sequentialminus": [ [ 0, "#0508b8" ], [ 0.0893854748603352, "#1910d8" ], [ 0.1787709497206704, "#3c19f0" ], [ 0.2681564245810056, "#6b1cfb" ], [ 0.3575418994413408, "#981cfd" ], [ 0.44692737430167595, "#bf1cfd" ], [ 0.5363128491620112, "#dd2bfd" ], [ 0.6256983240223464, "#f246fe" ], [ 0.7150837988826816, "#fc67fd" ], [ 0.8044692737430168, "#fe88fc" ], [ 0.8938547486033519, "#fea5fd" ], [ 0.9832402234636871, "#febefe" ], [ 1, "#fec3fe" ] ] }, "plot_bgcolor": "white", "paper_bgcolor": "white", "shapedefaults": { "line": { "width": 0 }, "opacity": 0.4, "fillcolor": "#506784" }, "annotationdefaults": { "arrowhead": 0, "arrowcolor": "#506784", "arrowwidth": 1 } }, "themeRef": "PLOTLY_WHITE" }, "hoverlabel": { "font": { "size": 14, "family": "Times New Roman" } }, "showlegend": true, "paper_bgcolor": "rgb(255, 255, 255)" } }, "height": null, "width": null, "user": { "profile_url": "https://chart-studio.plotly.com/~EDUCAYION", "avatar_url": "https://storage.googleapis.com/plotly-prod-profiles/1.jpg", "background_url": "https://storage.googleapis.com/plotly-prod-profiles/bg-5.jpg", "bio": "", "nickname": "", "website": "", "stream_tokens": null, "feature_set_id": null, "csrf_token": null, "date_joined": "2025-06-06 05:00:46", "mapbox_access_tokens": null, "has_password": null, "username": "EDUCAYION", "email": null, "is_active": null, "readonly": null, "is_dash_creator": null, "dash_created_count": null, "is_chart_creator": null, "charts_created_count": null } }, { "creation_time": "2025-06-06T06:31:32.986820Z", "comments": { "results": [], "count": 0 }, "parented": true, "embed_url": "https://chart-studio.plotly.com/~Jasmine2806/32.embed", "fid": "Jasmine2806:32", "filename": "llama 1B-2K", "filetype": "plot", "img_url": "https://api.plotly.com/v2/files/Jasmine2806:32/image?image_name=list-thumb", "image_urls": { "default": "https://storage.googleapis.com/plotly-prod-images/Jasmine2806/32/2_9YAY4NH5F0N68ST37345EGW531IHRZ.png", "block-thumb": "https://storage.googleapis.com/plotly-prod-images/Jasmine2806/32/8_JCMVHQ40AJOD9BABRAX0BRX94EGD59.png", "list-thumb": "https://api.plotly.com/v2/files/Jasmine2806:32/image?image_name=list-thumb" }, "api_urls": { "files": "https://api.plotly.com/v2/files/Jasmine2806:32", "plots": "https://api.plotly.com/v2/plots/Jasmine2806:32", "parent": "https://api.plotly.com/v2/folders/home?user=Jasmine2806" }, "owner": "Jasmine2806", "parent": -1, "preview": "", "referencers": [], "references": [], "title": "", "views": 0, "web_url": "https://chart-studio.plotly.com/~Jasmine2806/32/", "world_readable": true, "date_modified": "2025-06-06T06:31:32.996Z", "stars": { "results": [], "count": 0 }, "collaborators": { "results": [], "count": 0 }, "subfolder_count": null, "refresh_interval": null, "organize_view_url": "https://chart-studio.plotly.com/~Jasmine2806/32/", "current_user_permission": "read", "is_theme": null, "is_template": false, "autosize": true, "caption": "", "figure": { "data": [ { "meta": { "columnNames": { "x": "Model, x; 16,x; 32, x; 64,x; 128,x", "y": "16,y", "text": "16,y" } }, "mode": "markers", "name": "<b>r = 16</b>", "type": "bar", "xsrc": "Jasmine2806:31:c9ac57", "ysrc": "Jasmine2806:31:ce0302", "marker": { "color": "rgb(52, 93, 167)" }, "textsrc": "Jasmine2806:31:ce0302", "orientation": "v", "textposition": "outside" }, { "meta": { "columnNames": { "x": "Model, x; 16,x; 32, x; 64,x; 128,x", "y": "32, y", "text": "32, y" } }, "name": "<b>r = 32</b>", "type": "bar", "xsrc": "Jasmine2806:31:c9ac57", "ysrc": "Jasmine2806:31:db3594", "marker": { "color": "rgb(59, 138, 196)" }, "textsrc": "Jasmine2806:31:db3594", "orientation": "v", "textposition": "outside" }, { "meta": { "columnNames": { "x": "Model, x; 16,x; 32, x; 64,x; 128,x", "y": "64,y", "text": "64,y" } }, "name": "<b>r = 64</b>", "type": "bar", "xsrc": "Jasmine2806:31:c9ac57", "ysrc": "Jasmine2806:31:910f73", "marker": { "color": "rgb(75, 180, 222)" }, "textsrc": "Jasmine2806:31:910f73", "orientation": "v", "textposition": "outside" }, { "meta": { "columnNames": { "x": "Model, x; 16,x; 32, x; 64,x; 128,x", "y": "128,y" } }, "name": "<b>r = 128</b>", "type": "bar", "xsrc": "Jasmine2806:31:c9ac57", "ysrc": "Jasmine2806:31:5f63a5", "marker": { "color": "rgb(239, 219, 203)" }, "orientation": "v" } ], "frames": [], "layout": { "title": { "x": 0.5, "font": { "size": 29 }, "text": "<b>FINETUNE MODEL LLAMA3.2-1B WITH DATA 2000 </b>" }, "xaxis": { "type": "category", "range": [ -0.5, 5.5 ], "title": { "font": { "size": 15 } }, "tickfont": { "size": 17 }, "autorange": true }, "yaxis": { "type": "linear", "range": [ 0, 1 ], "title": { "font": { "size": 22 }, "text": "ACCURANCY(%)" }, "autorange": false }, "autosize": true, "template": { "data": { "bar": [ { "type": "bar", "marker": { "colorbar": { "ticks": "", "outlinewidth": 0 } } } ], "table": [ { "type": "table", "cells": { "fill": { "color": "#EBF0F8" }, "line": { "color": "white" } }, "header": { "fill": { "color": "#C8D4E3" }, "line": { "color": "white" } } } ], "carpet": [ { "type": "carpet", "aaxis": { "gridcolor": "#C8D4E3", "linecolor": "#C8D4E3", "endlinecolor": "#2a3f5f", "minorgridcolor": "#C8D4E3", "startlinecolor": "#2a3f5f" }, "baxis": { "gridcolor": "#C8D4E3", "linecolor": "#C8D4E3", "endlinecolor": "#2a3f5f", "minorgridcolor": "#C8D4E3", "startlinecolor": "#2a3f5f" } } ], "mesh3d": [ { "type": "mesh3d", "colorbar": { "ticks": "", "outlinewidth": 0 } } ], "contour": [ { "type": "contour", "colorbar": { "ticks": "", "outlinewidth": 0 }, "autocolorscale": true } ], "heatmap": [ { "type": "heatmap", "colorbar": { "ticks": "", "outlinewidth": 0 }, "autocolorscale": true } ], "scatter": [ { "type": "scatter", "marker": { "colorbar": { "ticks": "", "outlinewidth": 0 } } } ], "surface": [ { "type": "surface", "colorbar": { "ticks": "", "outlinewidth": 0 } } ], "heatmapgl": [ { "type": "heatmapgl", "colorbar": { "ticks": "", "outlinewidth": 0 } } ], "histogram": [ { "type": "histogram", "marker": { "colorbar": { "ticks": "", "outlinewidth": 0 } } } ], "parcoords": [ { "line": { "colorbar": { "ticks": "", "outlinewidth": 0 } }, "type": "parcoords" } ], "scatter3d": [ { "type": "scatter3d", "marker": { "colorbar": { "ticks": "", "outlinewidth": 0 } } } ], "scattergl": [ { "type": "scattergl", "marker": { "colorbar": { "ticks": "", "outlinewidth": 0 } } } ], "choropleth": [ { "type": "choropleth", "colorbar": { "ticks": "", "outlinewidth": 0 } } ], "scattergeo": [ { "type": "scattergeo", "marker": { "colorbar": { "ticks": "", "outlinewidth": 0 } } } ], "histogram2d": [ { "type": "histogram2d", "colorbar": { "ticks": "", "outlinewidth": 0 }, "autocolorscale": true } ], "scatterpolar": [ { "type": "scatterpolar", "marker": { "colorbar": { "ticks": "", "outlinewidth": 0 } } } ], "contourcarpet": [ { "type": "contourcarpet", "colorbar": { "ticks": "", "outlinewidth": 0 } } ], "scattercarpet": [ { "type": "scattercarpet", "marker": { "colorbar": { "ticks": "", "outlinewidth": 0 } } } ], "scattermapbox": [ { "type": "scattermapbox", "marker": { "colorbar": { "ticks": "", "outlinewidth": 0 } } } ], "scatterpolargl": [ { "type": "scatterpolargl", "marker": { "colorbar": { "ticks": "", "outlinewidth": 0 } } } ], "scatterternary": [ { "type": "scatterternary", "marker": { "colorbar": { "ticks": "", "outlinewidth": 0 } } } ], "histogram2dcontour": [ { "type": "histogram2dcontour", "colorbar": { "ticks": "", "outlinewidth": 0 }, "autocolorscale": true } ] }, "layout": { "geo": { "bgcolor": "white", "showland": true, "lakecolor": "white", "landcolor": "white", "showlakes": true, "subunitcolor": "#C8D4E3" }, "font": { "color": "#2a3f5f" }, "polar": { "bgcolor": "white", "radialaxis": { "ticks": "", "gridcolor": "#EBF0F8", "linecolor": "#EBF0F8" }, "angularaxis": { "ticks": "", "gridcolor": "#EBF0F8", "linecolor": "#EBF0F8" } }, "scene": { "xaxis": { "ticks": "", "gridcolor": "#DFE8F3", "gridwidth": 2, "linecolor": "#EBF0F8", "zerolinecolor": "#EBF0F8", "showbackground": true, "backgroundcolor": "white" }, "yaxis": { "ticks": "", "gridcolor": "#DFE8F3", "gridwidth": 2, "linecolor": "#EBF0F8", "zerolinecolor": "#EBF0F8", "showbackground": true, "backgroundcolor": "white" }, "zaxis": { "ticks": "", "gridcolor": "#DFE8F3", "gridwidth": 2, "linecolor": "#EBF0F8", "zerolinecolor": "#EBF0F8", "showbackground": true, "backgroundcolor": "white" } }, "title": { "x": 0.05 }, "xaxis": { "ticks": "", "gridcolor": "#EBF0F8", "linecolor": "#EBF0F8", "automargin": true, "zerolinecolor": "#EBF0F8", "zerolinewidth": 2 }, "yaxis": { "ticks": "", "gridcolor": "#EBF0F8", "linecolor": "#EBF0F8", "automargin": true, "zerolinecolor": "#EBF0F8", "zerolinewidth": 2 }, "ternary": { "aaxis": { "ticks": "", "gridcolor": "#DFE8F3", "linecolor": "#A2B1C6" }, "baxis": { "ticks": "", "gridcolor": "#DFE8F3", "linecolor": "#A2B1C6" }, "caxis": { "ticks": "", "gridcolor": "#DFE8F3", "linecolor": "#A2B1C6" }, "bgcolor": "white" }, "colorway": [ "#636efa", "#EF553B", "#00cc96", "#ab63fa", "#19d3f3", "#e763fa", "#fecb52", "#ffa15a", "#ff6692", "#b6e880" ], "hovermode": "closest", "colorscale": { "diverging": [ [ 0, "#8e0152" ], [ 0.1, "#c51b7d" ], [ 0.2, "#de77ae" ], [ 0.3, "#f1b6da" ], [ 0.4, "#fde0ef" ], [ 0.5, "#f7f7f7" ], [ 0.6, "#e6f5d0" ], [ 0.7, "#b8e186" ], [ 0.8, "#7fbc41" ], [ 0.9, "#4d9221" ], [ 1, "#276419" ] ], "sequential": [ [ 0, "#0508b8" ], [ 0.0893854748603352, "#1910d8" ], [ 0.1787709497206704, "#3c19f0" ], [ 0.2681564245810056, "#6b1cfb" ], [ 0.3575418994413408, "#981cfd" ], [ 0.44692737430167595, "#bf1cfd" ], [ 0.5363128491620112, "#dd2bfd" ], [ 0.6256983240223464, "#f246fe" ], [ 0.7150837988826816, "#fc67fd" ], [ 0.8044692737430168, "#fe88fc" ], [ 0.8938547486033519, "#fea5fd" ], [ 0.9832402234636871, "#febefe" ], [ 1, "#fec3fe" ] ], "sequentialminus": [ [ 0, "#0508b8" ], [ 0.0893854748603352, "#1910d8" ], [ 0.1787709497206704, "#3c19f0" ], [ 0.2681564245810056, "#6b1cfb" ], [ 0.3575418994413408, "#981cfd" ], [ 0.44692737430167595, "#bf1cfd" ], [ 0.5363128491620112, "#dd2bfd" ], [ 0.6256983240223464, "#f246fe" ], [ 0.7150837988826816, "#fc67fd" ], [ 0.8044692737430168, "#fe88fc" ], [ 0.8938547486033519, "#fea5fd" ], [ 0.9832402234636871, "#febefe" ], [ 1, "#fec3fe" ] ] }, "plot_bgcolor": "white", "paper_bgcolor": "white", "shapedefaults": { "line": { "width": 0 }, "opacity": 0.4, "fillcolor": "#506784" }, "annotationdefaults": { "arrowhead": 0, "arrowcolor": "#506784", "arrowwidth": 1 } }, "themeRef": "PLOTLY_WHITE" } } }, "height": null, "width": null, "user": { "profile_url": "https://chart-studio.plotly.com/~Jasmine2806", "avatar_url": "https://storage.googleapis.com/plotly-prod-profiles/2.jpg", "background_url": "https://storage.googleapis.com/plotly-prod-profiles/bg-12.jpg", "bio": "", "nickname": "", "website": "", "stream_tokens": null, "feature_set_id": null, "csrf_token": null, "date_joined": "2025-05-27 06:15:48", "mapbox_access_tokens": null, "has_password": null, "username": "Jasmine2806", "email": null, "is_active": null, "readonly": null, "is_dash_creator": null, "dash_created_count": null, "is_chart_creator": null, "charts_created_count": null } } ] }
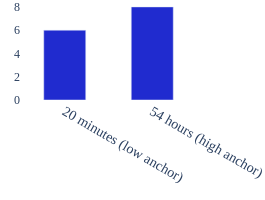