Plots


Jump to API response

This endpoint handles manipulation of Plotly plot files.

Reference

Authorization


Any user with or without a Plotly account may view public plots. For private plots, see authentication.

Actions


list

Listing all public plots can be done via a GET request to this endpoint. By default, plots will be listed in order of date created. The order_by query parameter is accepted at this endpoint. Currently, only ordering by views is supported. It is possible to filter the plots by quality with min_quality or max_quality as query parameter.

Example:

// GET https://api.plotly.com/v2/plots/ ---> 200

// GET https://api.plotly.com/v2/plots/?order_by=-views ---> 200

// GET https://api.plotly.com/v2/plots/?min_quality=5 ---> 200

// GET https://api.plotly.com/v2/plots/?max_quality=5 ---> 200

feed

Listing all handpicked feed plots can be done via a GET request to this endpoint. By default, plots will be listed in a random order.

Example:

// GET https://api.plotly.com/v2/plots/feed ---> 200

create

You can create new plot resources here. The only required field is 'figure'. Currently, the figure is restricted to only contain references to grid data. That is, this will fail if raw data arrays are passed in. To create and manipulate underlying grids for plots, see the grids endpoint.

Example:

// This fails because a figure field is required.
// POST https://api.plotly.com/v2/plots ---> 400 Bad Request
{}

// This fails because the figure has raw data
//POST https://api.plotly.com/v2/plots ---> 400 Bad Request
{
    "figure": {"data": [{"y": ['this', 'is', 'raw', 'data']}]}
}

// This succeeds because the figure has src keys, not raw data.
//POST https://api.plotly.com/v2/plots ---> 200 OK
{
    "figure": {"data": [{"ysrc": "sven:88:u8nd62"}]}
}

When creating a grid, you can optionally specify a source_fid to specify where a plot has come from:

  • source_fid: the fid of a plot that was copied (and presumably edited) to produce this one

detail

There is a lot of meta information stored about plot files including filename, title, share_url, and content_url to name a few.

This information can only be reached with a GET to this endpoint.

Example:

// GET https://api.plotly.com/v2/plots/iheartgraphs:90

content

The contents of a plot can be downloaded via the content resource. The plot content contains referenced grid/column data by default. If you wish to return the raw grid/column data, the inline_data=true query must be included in the request url. The Content-Type header will be appropriately set for the response body.

Alternatively, you can set ?map_data=unreadable to append a mapping of sources to data that belongs to grids which are unreadable for the requestor. This is useful when you have read access to another users plot, but that plot contains grid references which you don't have access to.

Examples:

// Returns referenced grid/column data
// GET https://api.plotly.com/v2/plots/iheartgraphs:90/content ---> 200 OK

// Returns full grid/column data
// GET https://api.plotly.com/v2/plots/iheartgraphs:90/content?inline_data=true ---> 200 OK

// Returns full grid/column data when requestor doesn't have permission
// to read the referenced grid.
// GET https://api.plotly.com/v2/plots/iheartgraphs:90/content?map_data=unreadable ---> 200 OK

GET /v2/plots?cursor=cD0yMDI1LTA4LTA2KzE2JTNBNTAlM0EzOS42MDE5ODAlMkIwMCUzQTAw&format=api
HTTP 200 OK
Allow: GET, POST, HEAD, OPTIONS
Content-Type: application/json
Vary: Accept

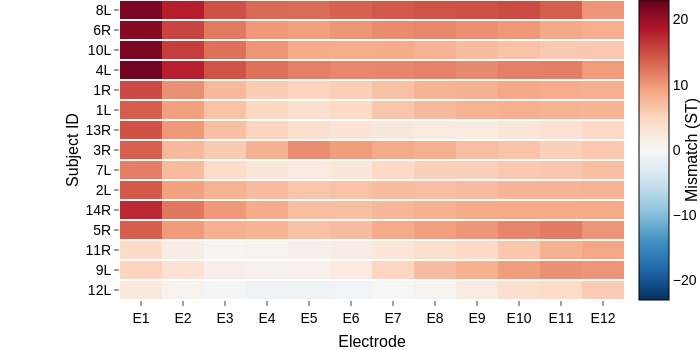
{
    "next": "https://api.plotly.com/v2/plots?cursor=cD0yMDI1LTA4LTA2KzE0JTNBMTclM0ExNS42NDA4MTAlMkIwMCUzQTAw&format=api",
    "previous": "https://api.plotly.com/v2/plots?cursor=cj0xJnA9MjAyNS0wOC0wNisxNiUzQTMxJTNBMjMuODQ4MTI2JTJCMDAlM0EwMA%3D%3D&format=api",
    "results": [
        {
            "creation_time": "2025-08-06T16:31:23.848126Z",
            "comments": {
                "results": [],
                "count": 0
            },
            "parented": true,
            "embed_url": "https://chart-studio.plotly.com/~ginammc/15.embed",
            "fid": "ginammc:15",
            "filename": "24up2",
            "filetype": "plot",
            "img_url": "https://storage.googleapis.com/plotly-prod-images/ginammc/15/9_AF1XV66BZZKWLJ2L9HQMWBL4MP67TA.png",
            "image_urls": {
                "default": "https://storage.googleapis.com/plotly-prod-images/ginammc/15/2_K8DVMPVZ411LNKBF3LJVKZX70V8UMC.png",
                "block-thumb": "https://storage.googleapis.com/plotly-prod-images/ginammc/15/8_H3UJ0HEBS8MGBKRK8KRJZJUG37EESN.png",
                "list-thumb": "https://storage.googleapis.com/plotly-prod-images/ginammc/15/9_AF1XV66BZZKWLJ2L9HQMWBL4MP67TA.png"
            },
            "api_urls": {
                "files": "https://api.plotly.com/v2/files/ginammc:15",
                "plots": "https://api.plotly.com/v2/plots/ginammc:15",
                "parent": "https://api.plotly.com/v2/folders/home?user=ginammc"
            },
            "owner": "ginammc",
            "parent": -1,
            "preview": "",
            "referencers": [],
            "references": [],
            "title": "",
            "views": 1,
            "web_url": "https://chart-studio.plotly.com/~ginammc/15/",
            "world_readable": true,
            "date_modified": "2025-08-11T12:08:09.779Z",
            "stars": {
                "results": [],
                "count": 0
            },
            "collaborators": {
                "results": [],
                "count": 0
            },
            "subfolder_count": null,
            "refresh_interval": null,
            "organize_view_url": "https://chart-studio.plotly.com/~ginammc/15/",
            "current_user_permission": "read",
            "is_theme": null,
            "is_template": false,
            "autosize": false,
            "caption": "",
            "figure": {
                "data": [
                    {
                        "meta": {
                            "columnNames": {
                                "x": "-Log (FDR)",
                                "y": "GO term - geneSet",
                                "text": "Gene size",
                                "marker": {
                                    "color": "Fold Enrichment"
                                },
                                "textposition": "Gene size"
                            }
                        },
                        "mode": "markers",
                        "name": "<br>",
                        "type": "bar",
                        "xsrc": "ginammc:14:86d19b",
                        "ysrc": "ginammc:14:993ab3,0e552c*",
                        "marker": {
                            "cmax": 305,
                            "cmin": 12,
                            "line": {
                                "color": "#444",
                                "width": 0
                            },
                            "meta": {
                                "columnNames": {
                                    "color": "Fold Enrichment"
                                }
                            },
                            "cauto": false,
                            "opacity": 1,
                            "colorbar": {
                                "x": 1.02,
                                "y": 0.5,
                                "len": 1,
                                "xpad": 5,
                                "ypad": 0,
                                "ticks": "outside",
                                "title": {
                                    "font": {
                                        "size": 12,
                                        "color": "rgb(17, 17, 18)",
                                        "family": "Arial"
                                    },
                                    "side": "top",
                                    "text": "Fold enrichment"
                                },
                                "nticks": 0,
                                "bgcolor": "rgba(0, 0, 0, 0)",
                                "lenmode": "fraction",
                                "ticklen": 5,
                                "xanchor": "left",
                                "yanchor": "middle",
                                "tickfont": {
                                    "size": 12,
                                    "color": "#2a3f5f",
                                    "family": "Arial"
                                },
                                "tickmode": "auto",
                                "thickness": 30,
                                "tickangle": "auto",
                                "tickcolor": "#444",
                                "tickwidth": 1,
                                "tickformat": "",
                                "tickprefix": "",
                                "ticksuffix": "",
                                "bordercolor": "#444",
                                "borderwidth": 0,
                                "minexponent": 3,
                                "outlinecolor": "#444",
                                "outlinewidth": 0,
                                "showexponent": "all",
                                "thicknessmode": "pixels",
                                "exponentformat": "B",
                                "showticklabels": true,
                                "separatethousands": false,
                                "ticklabelposition": "outside"
                            },
                            "colorsrc": "ginammc:14:f64777",
                            "showscale": true,
                            "colorscale": [
                                [
                                    0,
                                    "#ffffcc"
                                ],
                                [
                                    0.125,
                                    "#ffeda0"
                                ],
                                [
                                    0.25,
                                    "#fed976"
                                ],
                                [
                                    0.375,
                                    "#feb24c"
                                ],
                                [
                                    0.5,
                                    "#fd8d3c"
                                ],
                                [
                                    0.625,
                                    "#fc4e2a"
                                ],
                                [
                                    0.75,
                                    "#e31a1c"
                                ],
                                [
                                    0.875,
                                    "#bd0026"
                                ],
                                [
                                    1,
                                    "#800026"
                                ]
                            ],
                            "reversescale": true,
                            "autocolorscale": false
                        },
                        "error_x": {
                            "visible": false
                        },
                        "error_y": {
                            "visible": false
                        },
                        "opacity": 1,
                        "textsrc": "ginammc:14:7c1385",
                        "visible": true,
                        "xperiod": 0,
                        "yperiod": 0,
                        "selected": {
                            "marker": {
                                "opacity": 1
                            }
                        },
                        "textfont": {
                            "size": 14,
                            "color": "rgb(24, 24, 228)",
                            "family": "Arial"
                        },
                        "hoverinfo": "x+y+text",
                        "hovertext": "",
                        "textangle": 0,
                        "xcalendar": "gregorian",
                        "ycalendar": "gregorian",
                        "cliponaxis": true,
                        "hoverlabel": {
                            "font": {
                                "size": 13,
                                "family": "Arial, sans-serif"
                            },
                            "align": "auto",
                            "namelength": 15,
                            "bordercolor": "rgb(255, 253, 253)"
                        },
                        "showlegend": true,
                        "unselected": {
                            "marker": {
                                "opacity": 0.2
                            }
                        },
                        "legendgroup": "",
                        "offsetgroup": "",
                        "orientation": "h",
                        "textposition": "outside",
                        "texttemplate": "",
                        "constraintext": "outside",
                        "hovertemplate": "",
                        "alignmentgroup": "",
                        "autocolorscale": false,
                        "insidetextfont": {
                            "size": 12,
                            "color": "rgb(24, 24, 228)",
                            "family": "Arial"
                        },
                        "outsidetextfont": {
                            "size": 12,
                            "color": "rgb(24, 24, 228)",
                            "family": "Arial"
                        }
                    }
                ],
                "frames": [],
                "layout": {
                    "font": {
                        "size": 14,
                        "color": "rgb(17, 17, 18)",
                        "family": "Roboto"
                    },
                    "scene": {
                        "camera": {
                            "up": {
                                "x": 0,
                                "y": 0,
                                "z": 1
                            },
                            "eye": {
                                "x": 0.4866717968876489,
                                "y": 0.48667179688764883,
                                "z": 0.4866717968876489
                            },
                            "center": {
                                "x": 0,
                                "y": 0,
                                "z": 0
                            },
                            "projection": {
                                "type": "perspective"
                            }
                        },
                        "aspectmode": "auto",
                        "aspectratio": {
                            "x": 1,
                            "y": 1,
                            "z": 1
                        }
                    },
                    "title": {
                        "x": 0.5,
                        "font": {
                            "size": 14
                        },
                        "text": ""
                    },
                    "width": 780.81,
                    "xaxis": {
                        "side": "bottom",
                        "type": "linear",
                        "dtick": 1,
                        "range": [
                            1.0488599348534202,
                            3.54885993485342
                        ],
                        "ticks": "",
                        "title": {
                            "font": {
                                "size": 14
                            },
                            "text": "<b>- Log (FDR)</b>"
                        },
                        "anchor": "y",
                        "domain": [
                            0,
                            1
                        ],
                        "nticks": 4,
                        "showgrid": false,
                        "tickfont": {
                            "size": 12
                        },
                        "tickmode": "linear",
                        "autorange": false,
                        "gridwidth": 1,
                        "tickangle": "auto",
                        "automargin": false,
                        "fixedrange": false,
                        "showspikes": false,
                        "tickformat": "",
                        "rangeslider": {
                            "range": [
                                0,
                                3.4892218421052634
                            ],
                            "yaxis": {},
                            "visible": false,
                            "autorange": true,
                            "borderwidth": 0
                        },
                        "showexponent": "all",
                        "zerolinecolor": "rgb(255, 253, 253)",
                        "zerolinewidth": 0,
                        "exponentformat": "none",
                        "separatethousands": false
                    },
                    "yaxis": {
                        "side": "left",
                        "type": "multicategory",
                        "range": [
                            -0.5,
                            19.5
                        ],
                        "anchor": "x",
                        "domain": [
                            0,
                            1
                        ],
                        "showgrid": false,
                        "showline": false,
                        "tickfont": {
                            "size": 12
                        },
                        "zeroline": false,
                        "autorange": false,
                        "fixedrange": false,
                        "showspikes": false,
                        "showdividers": false,
                        "separatethousands": false
                    },
                    "bargap": 0.18000000000000005,
                    "height": 430,
                    "margin": {
                        "b": 80,
                        "l": 80,
                        "t": 40,
                        "pad": 5
                    },
                    "barmode": "group",
                    "barnorm": "",
                    "modebar": {
                        "orientation": "h"
                    },
                    "autosize": false,
                    "dragmode": "pan",
                    "template": {
                        "data": {
                            "bar": [
                                {
                                    "type": "bar",
                                    "marker": {
                                        "colorbar": {
                                            "ticks": "",
                                            "outlinewidth": 0
                                        }
                                    }
                                }
                            ],
                            "table": [
                                {
                                    "type": "table",
                                    "cells": {
                                        "fill": {
                                            "color": "#EBF0F8"
                                        },
                                        "line": {
                                            "color": "white"
                                        }
                                    },
                                    "header": {
                                        "fill": {
                                            "color": "#C8D4E3"
                                        },
                                        "line": {
                                            "color": "white"
                                        }
                                    }
                                }
                            ],
                            "carpet": [
                                {
                                    "type": "carpet",
                                    "aaxis": {
                                        "gridcolor": "#C8D4E3",
                                        "linecolor": "#C8D4E3",
                                        "endlinecolor": "#2a3f5f",
                                        "minorgridcolor": "#C8D4E3",
                                        "startlinecolor": "#2a3f5f"
                                    },
                                    "baxis": {
                                        "gridcolor": "#C8D4E3",
                                        "linecolor": "#C8D4E3",
                                        "endlinecolor": "#2a3f5f",
                                        "minorgridcolor": "#C8D4E3",
                                        "startlinecolor": "#2a3f5f"
                                    }
                                }
                            ],
                            "mesh3d": [
                                {
                                    "type": "mesh3d",
                                    "colorbar": {
                                        "ticks": "",
                                        "outlinewidth": 0
                                    }
                                }
                            ],
                            "contour": [
                                {
                                    "type": "contour",
                                    "colorbar": {
                                        "ticks": "",
                                        "outlinewidth": 0
                                    },
                                    "autocolorscale": true
                                }
                            ],
                            "heatmap": [
                                {
                                    "type": "heatmap",
                                    "colorbar": {
                                        "ticks": "",
                                        "outlinewidth": 0
                                    },
                                    "autocolorscale": true
                                }
                            ],
                            "scatter": [
                                {
                                    "type": "scatter",
                                    "marker": {
                                        "colorbar": {
                                            "ticks": "",
                                            "outlinewidth": 0
                                        }
                                    }
                                }
                            ],
                            "surface": [
                                {
                                    "type": "surface",
                                    "colorbar": {
                                        "ticks": "",
                                        "outlinewidth": 0
                                    }
                                }
                            ],
                            "heatmapgl": [
                                {
                                    "type": "heatmapgl",
                                    "colorbar": {
                                        "ticks": "",
                                        "outlinewidth": 0
                                    }
                                }
                            ],
                            "histogram": [
                                {
                                    "type": "histogram",
                                    "marker": {
                                        "colorbar": {
                                            "ticks": "",
                                            "outlinewidth": 0
                                        }
                                    }
                                }
                            ],
                            "parcoords": [
                                {
                                    "line": {
                                        "colorbar": {
                                            "ticks": "",
                                            "outlinewidth": 0
                                        }
                                    },
                                    "type": "parcoords"
                                }
                            ],
                            "scatter3d": [
                                {
                                    "type": "scatter3d",
                                    "marker": {
                                        "colorbar": {
                                            "ticks": "",
                                            "outlinewidth": 0
                                        }
                                    }
                                }
                            ],
                            "scattergl": [
                                {
                                    "type": "scattergl",
                                    "marker": {
                                        "colorbar": {
                                            "ticks": "",
                                            "outlinewidth": 0
                                        }
                                    }
                                }
                            ],
                            "choropleth": [
                                {
                                    "type": "choropleth",
                                    "colorbar": {
                                        "ticks": "",
                                        "outlinewidth": 0
                                    }
                                }
                            ],
                            "scattergeo": [
                                {
                                    "type": "scattergeo",
                                    "marker": {
                                        "colorbar": {
                                            "ticks": "",
                                            "outlinewidth": 0
                                        }
                                    }
                                }
                            ],
                            "histogram2d": [
                                {
                                    "type": "histogram2d",
                                    "colorbar": {
                                        "ticks": "",
                                        "outlinewidth": 0
                                    },
                                    "autocolorscale": true
                                }
                            ],
                            "scatterpolar": [
                                {
                                    "type": "scatterpolar",
                                    "marker": {
                                        "colorbar": {
                                            "ticks": "",
                                            "outlinewidth": 0
                                        }
                                    }
                                }
                            ],
                            "contourcarpet": [
                                {
                                    "type": "contourcarpet",
                                    "colorbar": {
                                        "ticks": "",
                                        "outlinewidth": 0
                                    }
                                }
                            ],
                            "scattercarpet": [
                                {
                                    "type": "scattercarpet",
                                    "marker": {
                                        "colorbar": {
                                            "ticks": "",
                                            "outlinewidth": 0
                                        }
                                    }
                                }
                            ],
                            "scattermapbox": [
                                {
                                    "type": "scattermapbox",
                                    "marker": {
                                        "colorbar": {
                                            "ticks": "",
                                            "outlinewidth": 0
                                        }
                                    }
                                }
                            ],
                            "scatterpolargl": [
                                {
                                    "type": "scatterpolargl",
                                    "marker": {
                                        "colorbar": {
                                            "ticks": "",
                                            "outlinewidth": 0
                                        }
                                    }
                                }
                            ],
                            "scatterternary": [
                                {
                                    "type": "scatterternary",
                                    "marker": {
                                        "colorbar": {
                                            "ticks": "",
                                            "outlinewidth": 0
                                        }
                                    }
                                }
                            ],
                            "histogram2dcontour": [
                                {
                                    "type": "histogram2dcontour",
                                    "colorbar": {
                                        "ticks": "",
                                        "outlinewidth": 0
                                    },
                                    "autocolorscale": true
                                }
                            ]
                        },
                        "layout": {
                            "geo": {
                                "bgcolor": "white",
                                "showland": true,
                                "lakecolor": "white",
                                "landcolor": "white",
                                "showlakes": true,
                                "subunitcolor": "#C8D4E3"
                            },
                            "font": {
                                "color": "#2a3f5f"
                            },
                            "polar": {
                                "bgcolor": "white",
                                "radialaxis": {
                                    "ticks": "",
                                    "gridcolor": "#EBF0F8",
                                    "linecolor": "#EBF0F8"
                                },
                                "angularaxis": {
                                    "ticks": "",
                                    "gridcolor": "#EBF0F8",
                                    "linecolor": "#EBF0F8"
                                }
                            },
                            "scene": {
                                "xaxis": {
                                    "ticks": "",
                                    "gridcolor": "#DFE8F3",
                                    "gridwidth": 2,
                                    "linecolor": "#EBF0F8",
                                    "zerolinecolor": "#EBF0F8",
                                    "showbackground": true,
                                    "backgroundcolor": "white"
                                },
                                "yaxis": {
                                    "ticks": "",
                                    "gridcolor": "#DFE8F3",
                                    "gridwidth": 2,
                                    "linecolor": "#EBF0F8",
                                    "zerolinecolor": "#EBF0F8",
                                    "showbackground": true,
                                    "backgroundcolor": "white"
                                },
                                "zaxis": {
                                    "ticks": "",
                                    "gridcolor": "#DFE8F3",
                                    "gridwidth": 2,
                                    "linecolor": "#EBF0F8",
                                    "zerolinecolor": "#EBF0F8",
                                    "showbackground": true,
                                    "backgroundcolor": "white"
                                }
                            },
                            "title": {
                                "x": 0.05
                            },
                            "xaxis": {
                                "ticks": "",
                                "gridcolor": "#EBF0F8",
                                "linecolor": "#EBF0F8",
                                "automargin": true,
                                "zerolinecolor": "#EBF0F8",
                                "zerolinewidth": 2
                            },
                            "yaxis": {
                                "ticks": "",
                                "gridcolor": "#EBF0F8",
                                "linecolor": "#EBF0F8",
                                "automargin": true,
                                "zerolinecolor": "#EBF0F8",
                                "zerolinewidth": 2
                            },
                            "ternary": {
                                "aaxis": {
                                    "ticks": "",
                                    "gridcolor": "#DFE8F3",
                                    "linecolor": "#A2B1C6"
                                },
                                "baxis": {
                                    "ticks": "",
                                    "gridcolor": "#DFE8F3",
                                    "linecolor": "#A2B1C6"
                                },
                                "caxis": {
                                    "ticks": "",
                                    "gridcolor": "#DFE8F3",
                                    "linecolor": "#A2B1C6"
                                },
                                "bgcolor": "white"
                            },
                            "colorway": [
                                "#636efa",
                                "#EF553B",
                                "#00cc96",
                                "#ab63fa",
                                "#19d3f3",
                                "#e763fa",
                                "#fecb52",
                                "#ffa15a",
                                "#ff6692",
                                "#b6e880"
                            ],
                            "hovermode": "closest",
                            "colorscale": {
                                "diverging": [
                                    [
                                        0,
                                        "#8e0152"
                                    ],
                                    [
                                        0.1,
                                        "#c51b7d"
                                    ],
                                    [
                                        0.2,
                                        "#de77ae"
                                    ],
                                    [
                                        0.3,
                                        "#f1b6da"
                                    ],
                                    [
                                        0.4,
                                        "#fde0ef"
                                    ],
                                    [
                                        0.5,
                                        "#f7f7f7"
                                    ],
                                    [
                                        0.6,
                                        "#e6f5d0"
                                    ],
                                    [
                                        0.7,
                                        "#b8e186"
                                    ],
                                    [
                                        0.8,
                                        "#7fbc41"
                                    ],
                                    [
                                        0.9,
                                        "#4d9221"
                                    ],
                                    [
                                        1,
                                        "#276419"
                                    ]
                                ],
                                "sequential": [
                                    [
                                        0,
                                        "#0508b8"
                                    ],
                                    [
                                        0.0893854748603352,
                                        "#1910d8"
                                    ],
                                    [
                                        0.1787709497206704,
                                        "#3c19f0"
                                    ],
                                    [
                                        0.2681564245810056,
                                        "#6b1cfb"
                                    ],
                                    [
                                        0.3575418994413408,
                                        "#981cfd"
                                    ],
                                    [
                                        0.44692737430167595,
                                        "#bf1cfd"
                                    ],
                                    [
                                        0.5363128491620112,
                                        "#dd2bfd"
                                    ],
                                    [
                                        0.6256983240223464,
                                        "#f246fe"
                                    ],
                                    [
                                        0.7150837988826816,
                                        "#fc67fd"
                                    ],
                                    [
                                        0.8044692737430168,
                                        "#fe88fc"
                                    ],
                                    [
                                        0.8938547486033519,
                                        "#fea5fd"
                                    ],
                                    [
                                        0.9832402234636871,
                                        "#febefe"
                                    ],
                                    [
                                        1,
                                        "#fec3fe"
                                    ]
                                ],
                                "sequentialminus": [
                                    [
                                        0,
                                        "#0508b8"
                                    ],
                                    [
                                        0.0893854748603352,
                                        "#1910d8"
                                    ],
                                    [
                                        0.1787709497206704,
                                        "#3c19f0"
                                    ],
                                    [
                                        0.2681564245810056,
                                        "#6b1cfb"
                                    ],
                                    [
                                        0.3575418994413408,
                                        "#981cfd"
                                    ],
                                    [
                                        0.44692737430167595,
                                        "#bf1cfd"
                                    ],
                                    [
                                        0.5363128491620112,
                                        "#dd2bfd"
                                    ],
                                    [
                                        0.6256983240223464,
                                        "#f246fe"
                                    ],
                                    [
                                        0.7150837988826816,
                                        "#fc67fd"
                                    ],
                                    [
                                        0.8044692737430168,
                                        "#fe88fc"
                                    ],
                                    [
                                        0.8938547486033519,
                                        "#fea5fd"
                                    ],
                                    [
                                        0.9832402234636871,
                                        "#febefe"
                                    ],
                                    [
                                        1,
                                        "#fec3fe"
                                    ]
                                ]
                            },
                            "plot_bgcolor": "white",
                            "paper_bgcolor": "white",
                            "shapedefaults": {
                                "line": {
                                    "width": 0
                                },
                                "opacity": 0.4,
                                "fillcolor": "#506784"
                            },
                            "annotationdefaults": {
                                "arrowhead": 0,
                                "arrowcolor": "#506784",
                                "arrowwidth": 1
                            }
                        },
                        "themeRef": "PLOTLY_WHITE"
                    },
                    "clickmode": "event+select",
                    "hovermode": "x",
                    "hoverlabel": {
                        "font": {
                            "size": 13
                        },
                        "align": "auto",
                        "bordercolor": "rgb(255, 253, 253)"
                    },
                    "showlegend": false,
                    "bargroupgap": 0,
                    "uniformtext": {
                        "mode": "hide",
                        "minsize": 0
                    },
                    "selectdirection": "any"
                }
            },
            "height": 430,
            "width": 780,
            "user": {
                "profile_url": "https://chart-studio.plotly.com/~ginammc",
                "avatar_url": "https://storage.googleapis.com/plotly-prod-profiles/39.jpg",
                "background_url": "https://storage.googleapis.com/plotly-prod-profiles/bg-7.jpg",
                "bio": "",
                "nickname": "",
                "website": "",
                "stream_tokens": null,
                "feature_set_id": null,
                "csrf_token": null,
                "date_joined": "2025-07-24 16:17:19",
                "mapbox_access_tokens": null,
                "has_password": null,
                "username": "ginammc",
                "email": null,
                "is_active": null,
                "readonly": null,
                "is_dash_creator": null,
                "dash_created_count": null,
                "is_chart_creator": null,
                "charts_created_count": null
            }
        },
        {
            "creation_time": "2025-08-06T16:19:29.730276Z",
            "comments": {
                "results": [],
                "count": 0
            },
            "parented": true,
            "embed_url": "https://chart-studio.plotly.com/~melanie.gilbert/436.embed",
            "fid": "melanie.gilbert:436",
            "filename": "FPCT 13 month CI Placement Heatmap v01",
            "filetype": "plot",
            "img_url": "https://storage.googleapis.com/plotly-prod-images/melanie.gilbert/436/9_QK6RTGK9B3JTS4PM7KRY6ZALWDOPAN.png",
            "image_urls": {
                "default": "https://storage.googleapis.com/plotly-prod-images/melanie.gilbert/436/2_SQK7ZIC2M7ZM2S2OVVURL2TOYPFZTQ.png",
                "block-thumb": "https://storage.googleapis.com/plotly-prod-images/melanie.gilbert/436/8_FITN3RTSN2AJB68K2QA1X2HKQ2ROPJ.png",
                "list-thumb": "https://storage.googleapis.com/plotly-prod-images/melanie.gilbert/436/9_QK6RTGK9B3JTS4PM7KRY6ZALWDOPAN.png"
            },
            "api_urls": {
                "files": "https://api.plotly.com/v2/files/melanie.gilbert:436",
                "plots": "https://api.plotly.com/v2/plots/melanie.gilbert:436",
                "parent": "https://api.plotly.com/v2/folders/home?user=melanie.gilbert"
            },
            "owner": "melanie.gilbert",
            "parent": -1,
            "preview": "",
            "referencers": [],
            "references": [],
            "title": "",
            "views": 0,
            "web_url": "https://chart-studio.plotly.com/~melanie.gilbert/436/",
            "world_readable": true,
            "date_modified": "2025-08-06T17:03:56.147Z",
            "stars": {
                "results": [],
                "count": 0
            },
            "collaborators": {
                "results": [],
                "count": 0
            },
            "subfolder_count": null,
            "refresh_interval": null,
            "organize_view_url": "https://chart-studio.plotly.com/~melanie.gilbert/436/",
            "current_user_permission": "read",
            "is_theme": null,
            "is_template": false,
            "autosize": false,
            "caption": "",
            "figure": {
                "data": [
                    {
                        "meta": {
                            "columnNames": {
                                "x": "Electrode",
                                "y": "ID",
                                "z": "E1 - E2 - E3 - E4 - E5 - E6 - E7 - E8 - E9 - E10 - E11 - E12"
                            }
                        },
                        "mode": "markers",
                        "type": "heatmap",
                        "xgap": 0,
                        "xsrc": "melanie.gilbert:435:ce0192",
                        "ygap": 2,
                        "ysrc": "melanie.gilbert:435:11cc70",
                        "zmax": 23,
                        "zmin": -23,
                        "zsrc": "melanie.gilbert:435:4f9c4a,0641af,bcddde,d17c17,73dc67,0048fd,e1748c,01476c,022973,5643a7,5930ad,122f39",
                        "zauto": false,
                        "zsmooth": false,
                        "colorbar": {
                            "x": 1.0297040982695098,
                            "y": 1,
                            "len": 1,
                            "xpad": 0,
                            "ypad": 0,
                            "title": {
                                "font": {
                                    "size": 16,
                                    "color": "rgb(0, 0, 0)",
                                    "family": "Arial"
                                },
                                "side": "right",
                                "text": "Mismatch (ST)"
                            },
                            "yanchor": "top",
                            "tickfont": {
                                "color": "rgb(0, 0, 0)",
                                "family": "Arial"
                            },
                            "thickness": 30,
                            "bordercolor": "rgb(0, 0, 0)",
                            "outlinecolor": "rgb(0, 0, 0)"
                        },
                        "reversescale": true,
                        "autocolorscale": true
                    }
                ],
                "frames": [],
                "layout": {
                    "font": {
                        "size": 14,
                        "color": "rgb(0, 0, 0)",
                        "family": "Arial"
                    },
                    "title": {
                        "font": {
                            "size": 17,
                            "color": "rgb(0, 0, 0)",
                            "family": "Arial"
                        },
                        "text": "Click to enter Plot title"
                    },
                    "width": 700,
                    "xaxis": {
                        "type": "category",
                        "range": [
                            -0.5,
                            11.5
                        ],
                        "title": {
                            "font": {
                                "size": 16,
                                "color": "rgb(0, 0, 0)",
                                "family": "Arial"
                            },
                            "text": "Electrode"
                        },
                        "showgrid": false,
                        "showline": false,
                        "tickfont": {
                            "size": 14,
                            "color": "rgb(0, 0, 0)",
                            "family": "Arial"
                        },
                        "zeroline": false,
                        "autorange": true
                    },
                    "yaxis": {
                        "type": "category",
                        "range": [
                            -0.5,
                            14.5
                        ],
                        "title": {
                            "font": {
                                "size": 16,
                                "color": "rgb(0, 0, 0)",
                                "family": "Arial"
                            },
                            "text": "Subject ID"
                        },
                        "showgrid": false,
                        "showline": false,
                        "tickfont": {
                            "size": 14,
                            "color": "rgb(0, 0, 0)",
                            "family": "Arial"
                        },
                        "zeroline": false,
                        "autorange": true
                    },
                    "height": 350,
                    "images": [],
                    "legend": {
                        "font": {
                            "color": "rgb(0, 0, 0)"
                        },
                        "title": {
                            "text": "<br>"
                        }
                    },
                    "margin": {
                        "b": 50,
                        "l": 120,
                        "r": 0,
                        "t": 0,
                        "pad": 0
                    },
                    "autosize": false,
                    "colorscale": {
                        "diverging": [
                            [
                                0,
                                "#67001f"
                            ],
                            [
                                0.1,
                                "#b2182b"
                            ],
                            [
                                0.2,
                                "#d6604d"
                            ],
                            [
                                0.3,
                                "#f4a582"
                            ],
                            [
                                0.4,
                                "#fddbc7"
                            ],
                            [
                                0.5,
                                "#f7f7f7"
                            ],
                            [
                                0.6,
                                "#d1e5f0"
                            ],
                            [
                                0.7,
                                "#92c5de"
                            ],
                            [
                                0.8,
                                "#4393c3"
                            ],
                            [
                                0.9,
                                "#2166ac"
                            ],
                            [
                                1,
                                "#053061"
                            ]
                        ]
                    },
                    "showlegend": false
                }
            },
            "height": 350,
            "width": 700,
            "user": {
                "profile_url": "https://chart-studio.plotly.com/~melanie.gilbert",
                "avatar_url": "https://storage.googleapis.com/plotly-prod-profiles/97.jpg",
                "background_url": "https://storage.googleapis.com/plotly-prod-profiles/bg-11.jpg",
                "bio": "",
                "nickname": "",
                "website": "",
                "stream_tokens": null,
                "feature_set_id": null,
                "csrf_token": null,
                "date_joined": "2019-07-05 18:03:59",
                "mapbox_access_tokens": null,
                "has_password": null,
                "username": "melanie.gilbert",
                "email": null,
                "is_active": null,
                "readonly": null,
                "is_dash_creator": null,
                "dash_created_count": null,
                "is_chart_creator": null,
                "charts_created_count": null
            }
        },
        {
            "creation_time": "2025-08-06T15:49:00.833377Z",
            "comments": {
                "results": [],
                "count": 0
            },
            "parented": true,
            "embed_url": "https://chart-studio.plotly.com/~lea.malezan/2.embed",
            "fid": "lea.malezan:2",
            "filename": "Plot 2",
            "filetype": "plot",
            "img_url": "https://storage.googleapis.com/plotly-prod-images/lea.malezan/2/9_KEO2MGX9XVOIEZ42ILVYNF4HX0YGM6.png",
            "image_urls": {
                "default": "https://storage.googleapis.com/plotly-prod-images/lea.malezan/2/2_LOSX1GBNXJVTL2U85BEUT37PKCT29I.png",
                "block-thumb": "https://storage.googleapis.com/plotly-prod-images/lea.malezan/2/8_923D4VK60N84NH3BOK6C2EW62VRUGK.png",
                "list-thumb": "https://storage.googleapis.com/plotly-prod-images/lea.malezan/2/9_KEO2MGX9XVOIEZ42ILVYNF4HX0YGM6.png"
            },
            "api_urls": {
                "files": "https://api.plotly.com/v2/files/lea.malezan:2",
                "plots": "https://api.plotly.com/v2/plots/lea.malezan:2",
                "parent": "https://api.plotly.com/v2/folders/home?user=lea.malezan"
            },
            "owner": "lea.malezan",
            "parent": -1,
            "preview": "",
            "referencers": [],
            "references": [],
            "title": "",
            "views": 0,
            "web_url": "https://chart-studio.plotly.com/~lea.malezan/2/",
            "world_readable": true,
            "date_modified": "2025-08-06T15:50:14.322Z",
            "stars": {
                "results": [],
                "count": 0
            },
            "collaborators": {
                "results": [],
                "count": 0
            },
            "subfolder_count": null,
            "refresh_interval": null,
            "organize_view_url": "https://chart-studio.plotly.com/~lea.malezan/2/",
            "current_user_permission": "read",
            "is_theme": null,
            "is_template": false,
            "autosize": true,
            "caption": "",
            "figure": {
                "data": [
                    {
                        "meta": {
                            "columnNames": {
                                "x": "A",
                                "y": "B"
                            }
                        },
                        "mode": "lines",
                        "type": "scatter",
                        "xsrc": "lea.malezan:1:3f01e9",
                        "ysrc": "lea.malezan:1:f108b4"
                    }
                ],
                "frames": [],
                "layout": {
                    "xaxis": {
                        "type": "linear",
                        "range": [
                            0,
                            600
                        ],
                        "autorange": true
                    },
                    "yaxis": {
                        "type": "linear",
                        "range": [
                            -0.014275916666666666,
                            0.28128441666666665
                        ],
                        "autorange": true
                    },
                    "autosize": true,
                    "template": {
                        "data": {
                            "bar": [
                                {
                                    "type": "bar",
                                    "marker": {
                                        "colorbar": {
                                            "ticks": "",
                                            "outlinewidth": 0
                                        }
                                    }
                                }
                            ],
                            "table": [
                                {
                                    "type": "table",
                                    "cells": {
                                        "fill": {
                                            "color": "#EBF0F8"
                                        },
                                        "line": {
                                            "color": "white"
                                        }
                                    },
                                    "header": {
                                        "fill": {
                                            "color": "#C8D4E3"
                                        },
                                        "line": {
                                            "color": "white"
                                        }
                                    }
                                }
                            ],
                            "carpet": [
                                {
                                    "type": "carpet",
                                    "aaxis": {
                                        "gridcolor": "#C8D4E3",
                                        "linecolor": "#C8D4E3",
                                        "endlinecolor": "#2a3f5f",
                                        "minorgridcolor": "#C8D4E3",
                                        "startlinecolor": "#2a3f5f"
                                    },
                                    "baxis": {
                                        "gridcolor": "#C8D4E3",
                                        "linecolor": "#C8D4E3",
                                        "endlinecolor": "#2a3f5f",
                                        "minorgridcolor": "#C8D4E3",
                                        "startlinecolor": "#2a3f5f"
                                    }
                                }
                            ],
                            "mesh3d": [
                                {
                                    "type": "mesh3d",
                                    "colorbar": {
                                        "ticks": "",
                                        "outlinewidth": 0
                                    }
                                }
                            ],
                            "contour": [
                                {
                                    "type": "contour",
                                    "colorbar": {
                                        "ticks": "",
                                        "outlinewidth": 0
                                    },
                                    "autocolorscale": true
                                }
                            ],
                            "heatmap": [
                                {
                                    "type": "heatmap",
                                    "colorbar": {
                                        "ticks": "",
                                        "outlinewidth": 0
                                    },
                                    "autocolorscale": true
                                }
                            ],
                            "scatter": [
                                {
                                    "type": "scatter",
                                    "marker": {
                                        "colorbar": {
                                            "ticks": "",
                                            "outlinewidth": 0
                                        }
                                    }
                                }
                            ],
                            "surface": [
                                {
                                    "type": "surface",
                                    "colorbar": {
                                        "ticks": "",
                                        "outlinewidth": 0
                                    }
                                }
                            ],
                            "heatmapgl": [
                                {
                                    "type": "heatmapgl",
                                    "colorbar": {
                                        "ticks": "",
                                        "outlinewidth": 0
                                    }
                                }
                            ],
                            "histogram": [
                                {
                                    "type": "histogram",
                                    "marker": {
                                        "colorbar": {
                                            "ticks": "",
                                            "outlinewidth": 0
                                        }
                                    }
                                }
                            ],
                            "parcoords": [
                                {
                                    "line": {
                                        "colorbar": {
                                            "ticks": "",
                                            "outlinewidth": 0
                                        }
                                    },
                                    "type": "parcoords"
                                }
                            ],
                            "scatter3d": [
                                {
                                    "type": "scatter3d",
                                    "marker": {
                                        "colorbar": {
                                            "ticks": "",
                                            "outlinewidth": 0
                                        }
                                    }
                                }
                            ],
                            "scattergl": [
                                {
                                    "type": "scattergl",
                                    "marker": {
                                        "colorbar": {
                                            "ticks": "",
                                            "outlinewidth": 0
                                        }
                                    }
                                }
                            ],
                            "choropleth": [
                                {
                                    "type": "choropleth",
                                    "colorbar": {
                                        "ticks": "",
                                        "outlinewidth": 0
                                    }
                                }
                            ],
                            "scattergeo": [
                                {
                                    "type": "scattergeo",
                                    "marker": {
                                        "colorbar": {
                                            "ticks": "",
                                            "outlinewidth": 0
                                        }
                                    }
                                }
                            ],
                            "histogram2d": [
                                {
                                    "type": "histogram2d",
                                    "colorbar": {
                                        "ticks": "",
                                        "outlinewidth": 0
                                    },
                                    "autocolorscale": true
                                }
                            ],
                            "scatterpolar": [
                                {
                                    "type": "scatterpolar",
                                    "marker": {
                                        "colorbar": {
                                            "ticks": "",
                                            "outlinewidth": 0
                                        }
                                    }
                                }
                            ],
                            "contourcarpet": [
                                {
                                    "type": "contourcarpet",
                                    "colorbar": {
                                        "ticks": "",
                                        "outlinewidth": 0
                                    }
                                }
                            ],
                            "scattercarpet": [
                                {
                                    "type": "scattercarpet",
                                    "marker": {
                                        "colorbar": {
                                            "ticks": "",
                                            "outlinewidth": 0
                                        }
                                    }
                                }
                            ],
                            "scattermapbox": [
                                {
                                    "type": "scattermapbox",
                                    "marker": {
                                        "colorbar": {
                                            "ticks": "",
                                            "outlinewidth": 0
                                        }
                                    }
                                }
                            ],
                            "scatterpolargl": [
                                {
                                    "type": "scatterpolargl",
                                    "marker": {
                                        "colorbar": {
                                            "ticks": "",
                                            "outlinewidth": 0
                                        }
                                    }
                                }
                            ],
                            "scatterternary": [
                                {
                                    "type": "scatterternary",
                                    "marker": {
                                        "colorbar": {
                                            "ticks": "",
                                            "outlinewidth": 0
                                        }
                                    }
                                }
                            ],
                            "histogram2dcontour": [
                                {
                                    "type": "histogram2dcontour",
                                    "colorbar": {
                                        "ticks": "",
                                        "outlinewidth": 0
                                    },
                                    "autocolorscale": true
                                }
                            ]
                        },
                        "layout": {
                            "geo": {
                                "bgcolor": "white",
                                "showland": true,
                                "lakecolor": "white",
                                "landcolor": "white",
                                "showlakes": true,
                                "subunitcolor": "#C8D4E3"
                            },
                            "font": {
                                "color": "#2a3f5f"
                            },
                            "polar": {
                                "bgcolor": "white",
                                "radialaxis": {
                                    "ticks": "",
                                    "gridcolor": "#EBF0F8",
                                    "linecolor": "#EBF0F8"
                                },
                                "angularaxis": {
                                    "ticks": "",
                                    "gridcolor": "#EBF0F8",
                                    "linecolor": "#EBF0F8"
                                }
                            },
                            "scene": {
                                "xaxis": {
                                    "ticks": "",
                                    "gridcolor": "#DFE8F3",
                                    "gridwidth": 2,
                                    "linecolor": "#EBF0F8",
                                    "zerolinecolor": "#EBF0F8",
                                    "showbackground": true,
                                    "backgroundcolor": "white"
                                },
                                "yaxis": {
                                    "ticks": "",
                                    "gridcolor": "#DFE8F3",
                                    "gridwidth": 2,
                                    "linecolor": "#EBF0F8",
                                    "zerolinecolor": "#EBF0F8",
                                    "showbackground": true,
                                    "backgroundcolor": "white"
                                },
                                "zaxis": {
                                    "ticks": "",
                                    "gridcolor": "#DFE8F3",
                                    "gridwidth": 2,
                                    "linecolor": "#EBF0F8",
                                    "zerolinecolor": "#EBF0F8",
                                    "showbackground": true,
                                    "backgroundcolor": "white"
                                }
                            },
                            "title": {
                                "x": 0.05
                            },
                            "xaxis": {
                                "ticks": "",
                                "gridcolor": "#EBF0F8",
                                "linecolor": "#EBF0F8",
                                "automargin": true,
                                "zerolinecolor": "#EBF0F8",
                                "zerolinewidth": 2
                            },
                            "yaxis": {
                                "ticks": "",
                                "gridcolor": "#EBF0F8",
                                "linecolor": "#EBF0F8",
                                "automargin": true,
                                "zerolinecolor": "#EBF0F8",
                                "zerolinewidth": 2
                            },
                            "ternary": {
                                "aaxis": {
                                    "ticks": "",
                                    "gridcolor": "#DFE8F3",
                                    "linecolor": "#A2B1C6"
                                },
                                "baxis": {
                                    "ticks": "",
                                    "gridcolor": "#DFE8F3",
                                    "linecolor": "#A2B1C6"
                                },
                                "caxis": {
                                    "ticks": "",
                                    "gridcolor": "#DFE8F3",
                                    "linecolor": "#A2B1C6"
                                },
                                "bgcolor": "white"
                            },
                            "colorway": [
                                "#636efa",
                                "#EF553B",
                                "#00cc96",
                                "#ab63fa",
                                "#19d3f3",
                                "#e763fa",
                                "#fecb52",
                                "#ffa15a",
                                "#ff6692",
                                "#b6e880"
                            ],
                            "hovermode": "closest",
                            "colorscale": {
                                "diverging": [
                                    [
                                        0,
                                        "#8e0152"
                                    ],
                                    [
                                        0.1,
                                        "#c51b7d"
                                    ],
                                    [
                                        0.2,
                                        "#de77ae"
                                    ],
                                    [
                                        0.3,
                                        "#f1b6da"
                                    ],
                                    [
                                        0.4,
                                        "#fde0ef"
                                    ],
                                    [
                                        0.5,
                                        "#f7f7f7"
                                    ],
                                    [
                                        0.6,
                                        "#e6f5d0"
                                    ],
                                    [
                                        0.7,
                                        "#b8e186"
                                    ],
                                    [
                                        0.8,
                                        "#7fbc41"
                                    ],
                                    [
                                        0.9,
                                        "#4d9221"
                                    ],
                                    [
                                        1,
                                        "#276419"
                                    ]
                                ],
                                "sequential": [
                                    [
                                        0,
                                        "#0508b8"
                                    ],
                                    [
                                        0.0893854748603352,
                                        "#1910d8"
                                    ],
                                    [
                                        0.1787709497206704,
                                        "#3c19f0"
                                    ],
                                    [
                                        0.2681564245810056,
                                        "#6b1cfb"
                                    ],
                                    [
                                        0.3575418994413408,
                                        "#981cfd"
                                    ],
                                    [
                                        0.44692737430167595,
                                        "#bf1cfd"
                                    ],
                                    [
                                        0.5363128491620112,
                                        "#dd2bfd"
                                    ],
                                    [
                                        0.6256983240223464,
                                        "#f246fe"
                                    ],
                                    [
                                        0.7150837988826816,
                                        "#fc67fd"
                                    ],
                                    [
                                        0.8044692737430168,
                                        "#fe88fc"
                                    ],
                                    [
                                        0.8938547486033519,
                                        "#fea5fd"
                                    ],
                                    [
                                        0.9832402234636871,
                                        "#febefe"
                                    ],
                                    [
                                        1,
                                        "#fec3fe"
                                    ]
                                ],
                                "sequentialminus": [
                                    [
                                        0,
                                        "#0508b8"
                                    ],
                                    [
                                        0.0893854748603352,
                                        "#1910d8"
                                    ],
                                    [
                                        0.1787709497206704,
                                        "#3c19f0"
                                    ],
                                    [
                                        0.2681564245810056,
                                        "#6b1cfb"
                                    ],
                                    [
                                        0.3575418994413408,
                                        "#981cfd"
                                    ],
                                    [
                                        0.44692737430167595,
                                        "#bf1cfd"
                                    ],
                                    [
                                        0.5363128491620112,
                                        "#dd2bfd"
                                    ],
                                    [
                                        0.6256983240223464,
                                        "#f246fe"
                                    ],
                                    [
                                        0.7150837988826816,
                                        "#fc67fd"
                                    ],
                                    [
                                        0.8044692737430168,
                                        "#fe88fc"
                                    ],
                                    [
                                        0.8938547486033519,
                                        "#fea5fd"
                                    ],
                                    [
                                        0.9832402234636871,
                                        "#febefe"
                                    ],
                                    [
                                        1,
                                        "#fec3fe"
                                    ]
                                ]
                            },
                            "plot_bgcolor": "white",
                            "paper_bgcolor": "white",
                            "shapedefaults": {
                                "line": {
                                    "width": 0
                                },
                                "opacity": 0.4,
                                "fillcolor": "#506784"
                            },
                            "annotationdefaults": {
                                "arrowhead": 0,
                                "arrowcolor": "#506784",
                                "arrowwidth": 1
                            }
                        },
                        "themeRef": "PLOTLY_WHITE"
                    }
                }
            },
            "height": null,
            "width": null,
            "user": {
                "profile_url": "https://chart-studio.plotly.com/~lea.malezan",
                "avatar_url": "https://storage.googleapis.com/plotly-prod-profiles/98.jpg",
                "background_url": "https://storage.googleapis.com/plotly-prod-profiles/bg-8.jpg",
                "bio": "",
                "nickname": "",
                "website": "",
                "stream_tokens": null,
                "feature_set_id": null,
                "csrf_token": null,
                "date_joined": "2025-08-06 15:38:10",
                "mapbox_access_tokens": null,
                "has_password": null,
                "username": "lea.malezan",
                "email": null,
                "is_active": null,
                "readonly": null,
                "is_dash_creator": null,
                "dash_created_count": null,
                "is_chart_creator": null,
                "charts_created_count": null
            }
        },
        {
            "creation_time": "2025-08-06T15:46:10.339783Z",
            "comments": {
                "results": [],
                "count": 0
            },
            "parented": true,
            "embed_url": "https://chart-studio.plotly.com/~melanie.gilbert/434.embed",
            "fid": "melanie.gilbert:434",
            "filename": "12v13 FPCT Pitch Interval MvH v01",
            "filetype": "plot",
            "img_url": "https://storage.googleapis.com/plotly-prod-images/melanie.gilbert/434/9_LU690L23PHGH2PQKFCPKBIBC3V5CQF.png",
            "image_urls": {
                "default": "https://storage.googleapis.com/plotly-prod-images/melanie.gilbert/434/2_UQTNYAGW6DL0QXNRRDMGAQTX1MZB67.png",
                "block-thumb": "https://storage.googleapis.com/plotly-prod-images/melanie.gilbert/434/8_H4ZNC9MGBSWCFTEWFYQLRAYHXBI33K.png",
                "list-thumb": "https://storage.googleapis.com/plotly-prod-images/melanie.gilbert/434/9_LU690L23PHGH2PQKFCPKBIBC3V5CQF.png"
            },
            "api_urls": {
                "files": "https://api.plotly.com/v2/files/melanie.gilbert:434",
                "plots": "https://api.plotly.com/v2/plots/melanie.gilbert:434",
                "parent": "https://api.plotly.com/v2/folders/home?user=melanie.gilbert"
            },
            "owner": "melanie.gilbert",
            "parent": -1,
            "preview": "",
            "referencers": [],
            "references": [],
            "title": "",
            "views": 1,
            "web_url": "https://chart-studio.plotly.com/~melanie.gilbert/434/",
            "world_readable": true,
            "date_modified": "2025-08-06T15:48:51.702Z",
            "stars": {
                "results": [],
                "count": 0
            },
            "collaborators": {
                "results": [],
                "count": 0
            },
            "subfolder_count": null,
            "refresh_interval": null,
            "organize_view_url": "https://chart-studio.plotly.com/~melanie.gilbert/434/",
            "current_user_permission": "read",
            "is_theme": null,
            "is_template": false,
            "autosize": false,
            "caption": "",
            "figure": {
                "data": [
                    {
                        "meta": {
                            "columnNames": {
                                "x": "",
                                "y": "CT"
                            }
                        },
                        "mode": "markers",
                        "name": "CT",
                        "type": "box",
                        "ysrc": "melanie.gilbert:433:211e75",
                        "points": "all",
                        "bandwidth": 0,
                        "boxpoints": "all"
                    },
                    {
                        "meta": {
                            "columnNames": {
                                "y": "Default"
                            }
                        },
                        "name": "Default",
                        "type": "box",
                        "ysrc": "melanie.gilbert:433:e4577a",
                        "points": "all",
                        "bandwidth": 0,
                        "boxpoints": "all"
                    }
                ],
                "frames": [],
                "layout": {
                    "font": {
                        "size": 18
                    },
                    "title": {
                        "x": 0.5,
                        "font": {
                            "size": 24,
                            "color": "rgb(0, 0, 0)"
                        },
                        "text": "Pitch Interval: Mid vs High"
                    },
                    "width": 400,
                    "xaxis": {
                        "type": "category",
                        "range": [
                            -0.5253164556962026,
                            1.5
                        ],
                        "title": {
                            "font": {
                                "size": 18,
                                "color": "rgb(0, 0, 0)"
                            },
                            "text": "Map"
                        },
                        "autorange": true
                    },
                    "yaxis": {
                        "type": "linear",
                        "range": [
                            -8.08225338458967,
                            4.064963730569949
                        ],
                        "title": {
                            "font": {
                                "size": 18,
                                "color": "rgb(0, 0, 0)"
                            },
                            "text": "Semitones"
                        },
                        "autorange": false
                    },
                    "height": 600,
                    "margin": {
                        "t": 100
                    },
                    "autosize": false,
                    "showlegend": false
                }
            },
            "height": 600,
            "width": 400,
            "user": {
                "profile_url": "https://chart-studio.plotly.com/~melanie.gilbert",
                "avatar_url": "https://storage.googleapis.com/plotly-prod-profiles/97.jpg",
                "background_url": "https://storage.googleapis.com/plotly-prod-profiles/bg-11.jpg",
                "bio": "",
                "nickname": "",
                "website": "",
                "stream_tokens": null,
                "feature_set_id": null,
                "csrf_token": null,
                "date_joined": "2019-07-05 18:03:59",
                "mapbox_access_tokens": null,
                "has_password": null,
                "username": "melanie.gilbert",
                "email": null,
                "is_active": null,
                "readonly": null,
                "is_dash_creator": null,
                "dash_created_count": null,
                "is_chart_creator": null,
                "charts_created_count": null
            }
        },
        {
            "creation_time": "2025-08-06T15:45:34.634262Z",
            "comments": {
                "results": [],
                "count": 0
            },
            "parented": true,
            "embed_url": "https://chart-studio.plotly.com/~melanie.gilbert/432.embed",
            "fid": "melanie.gilbert:432",
            "filename": "12v13 FPCT Pitch Interval LvM v01",
            "filetype": "plot",
            "img_url": "https://storage.googleapis.com/plotly-prod-images/melanie.gilbert/432/9_OKO03P7OMJHA0NT9AL95W7XW0WUQQB.png",
            "image_urls": {
                "default": "https://storage.googleapis.com/plotly-prod-images/melanie.gilbert/432/2_7OXF0PKXHTVFG8NA8HXT89SNLZYVOH.png",
                "block-thumb": "https://storage.googleapis.com/plotly-prod-images/melanie.gilbert/432/8_IBE48D01W216KGMHL2NB16S7AMWDPK.png",
                "list-thumb": "https://storage.googleapis.com/plotly-prod-images/melanie.gilbert/432/9_OKO03P7OMJHA0NT9AL95W7XW0WUQQB.png"
            },
            "api_urls": {
                "files": "https://api.plotly.com/v2/files/melanie.gilbert:432",
                "plots": "https://api.plotly.com/v2/plots/melanie.gilbert:432",
                "parent": "https://api.plotly.com/v2/folders/home?user=melanie.gilbert"
            },
            "owner": "melanie.gilbert",
            "parent": -1,
            "preview": "",
            "referencers": [],
            "references": [],
            "title": "",
            "views": 0,
            "web_url": "https://chart-studio.plotly.com/~melanie.gilbert/432/",
            "world_readable": true,
            "date_modified": "2025-08-06T15:48:47.846Z",
            "stars": {
                "results": [],
                "count": 0
            },
            "collaborators": {
                "results": [],
                "count": 0
            },
            "subfolder_count": null,
            "refresh_interval": null,
            "organize_view_url": "https://chart-studio.plotly.com/~melanie.gilbert/432/",
            "current_user_permission": "read",
            "is_theme": null,
            "is_template": false,
            "autosize": false,
            "caption": "",
            "figure": {
                "data": [
                    {
                        "meta": {
                            "columnNames": {
                                "x": "",
                                "y": "CT"
                            }
                        },
                        "mode": "markers",
                        "name": "CT",
                        "type": "box",
                        "ysrc": "melanie.gilbert:431:211e75",
                        "points": "all",
                        "bandwidth": 0,
                        "boxpoints": "all"
                    },
                    {
                        "meta": {
                            "columnNames": {
                                "y": "Default"
                            }
                        },
                        "name": "Default",
                        "type": "box",
                        "ysrc": "melanie.gilbert:431:e4577a",
                        "points": "all",
                        "bandwidth": 0,
                        "boxpoints": "all"
                    }
                ],
                "frames": [],
                "layout": {
                    "font": {
                        "size": 18
                    },
                    "title": {
                        "x": 0.5,
                        "font": {
                            "size": 24,
                            "color": "rgb(0, 0, 0)"
                        },
                        "text": "Pitch Interval: Low vs Mid"
                    },
                    "width": 400,
                    "xaxis": {
                        "type": "category",
                        "range": [
                            -0.5253164556962026,
                            1.5
                        ],
                        "title": {
                            "font": {
                                "size": 18,
                                "color": "rgb(0, 0, 0)"
                            },
                            "text": "Map"
                        },
                        "autorange": true
                    },
                    "yaxis": {
                        "type": "linear",
                        "range": [
                            -8.872222222222224,
                            4.118768768768771
                        ],
                        "title": {
                            "font": {
                                "size": 18,
                                "color": "rgb(0, 0, 0)"
                            },
                            "text": "Semitones"
                        },
                        "autorange": false
                    },
                    "height": 600,
                    "margin": {
                        "t": 100
                    },
                    "autosize": false,
                    "showlegend": false
                }
            },
            "height": 600,
            "width": 400,
            "user": {
                "profile_url": "https://chart-studio.plotly.com/~melanie.gilbert",
                "avatar_url": "https://storage.googleapis.com/plotly-prod-profiles/97.jpg",
                "background_url": "https://storage.googleapis.com/plotly-prod-profiles/bg-11.jpg",
                "bio": "",
                "nickname": "",
                "website": "",
                "stream_tokens": null,
                "feature_set_id": null,
                "csrf_token": null,
                "date_joined": "2019-07-05 18:03:59",
                "mapbox_access_tokens": null,
                "has_password": null,
                "username": "melanie.gilbert",
                "email": null,
                "is_active": null,
                "readonly": null,
                "is_dash_creator": null,
                "dash_created_count": null,
                "is_chart_creator": null,
                "charts_created_count": null
            }
        },
        {
            "creation_time": "2025-08-06T15:31:19.011264Z",
            "comments": {
                "results": [],
                "count": 0
            },
            "parented": true,
            "embed_url": "https://chart-studio.plotly.com/~nandan123/58.embed",
            "fid": "nandan123:58",
            "filename": "Plot 58",
            "filetype": "plot",
            "img_url": "https://storage.googleapis.com/plotly-prod-images/nandan123/58/9_EPOAXE9G3SRI3KA134KBI6S4KXW8WI.png",
            "image_urls": {
                "default": "https://storage.googleapis.com/plotly-prod-images/nandan123/58/2_G5209DH1ABQ3UFH97PJT5CIB5H7EL9.png",
                "block-thumb": "https://storage.googleapis.com/plotly-prod-images/nandan123/58/8_BITGIWB1UQMCPKU8XKUWUBXOANG4ZY.png",
                "list-thumb": "https://storage.googleapis.com/plotly-prod-images/nandan123/58/9_EPOAXE9G3SRI3KA134KBI6S4KXW8WI.png"
            },
            "api_urls": {
                "files": "https://api.plotly.com/v2/files/nandan123:58",
                "plots": "https://api.plotly.com/v2/plots/nandan123:58",
                "parent": "https://api.plotly.com/v2/folders/home?user=nandan123"
            },
            "owner": "nandan123",
            "parent": -1,
            "preview": "",
            "referencers": [],
            "references": [],
            "title": "",
            "views": 0,
            "web_url": "https://chart-studio.plotly.com/~nandan123/58/",
            "world_readable": true,
            "date_modified": "2025-09-04T16:19:56.382Z",
            "stars": {
                "results": [],
                "count": 0
            },
            "collaborators": {
                "results": [],
                "count": 0
            },
            "subfolder_count": null,
            "refresh_interval": null,
            "organize_view_url": "https://chart-studio.plotly.com/~nandan123/58/",
            "current_user_permission": "read",
            "is_theme": null,
            "is_template": false,
            "autosize": true,
            "caption": "",
            "figure": {
                "data": [
                    {
                        "meta": {
                            "columnNames": {
                                "x": "A",
                                "y": "B"
                            }
                        },
                        "mode": "markers+lines",
                        "name": "300 fs",
                        "type": "scatter",
                        "xsrc": "nandan123:55:05b0fb",
                        "ysrc": "nandan123:55:5e808f"
                    },
                    {
                        "meta": {
                            "columnNames": {
                                "x": "A",
                                "y": "B"
                            }
                        },
                        "mode": "markers+lines",
                        "name": "500 fs",
                        "type": "scatter",
                        "xsrc": "nandan123:57:7321b6",
                        "ysrc": "nandan123:57:166f5a",
                        "stackgroup": null
                    },
                    {
                        "meta": {
                            "columnNames": {
                                "x": "A",
                                "y": "B"
                            }
                        },
                        "mode": "markers+lines",
                        "name": "700 fs",
                        "type": "scatter",
                        "xsrc": "nandan123:54:c5d26c",
                        "ysrc": "nandan123:54:4b106a",
                        "stackgroup": null
                    },
                    {
                        "meta": {
                            "columnNames": {
                                "x": "A",
                                "y": "B"
                            }
                        },
                        "mode": "markers+lines",
                        "name": "1000 fs",
                        "type": "scatter",
                        "xsrc": "nandan123:56:d2b867",
                        "ysrc": "nandan123:56:bc5fb3",
                        "stackgroup": null
                    },
                    {
                        "line": {
                            "dash": "dot"
                        },
                        "meta": {
                            "columnNames": {
                                "x": "A",
                                "y": "B"
                            }
                        },
                        "mode": "markers+lines",
                        "type": "scatter",
                        "xsrc": "nandan123:82:4034ca",
                        "ysrc": "nandan123:82:2310a3",
                        "marker": {
                            "color": "rgb(99, 110, 250)"
                        },
                        "stackgroup": null
                    },
                    {
                        "line": {
                            "dash": "dot"
                        },
                        "meta": {
                            "columnNames": {
                                "x": "A",
                                "y": "B"
                            }
                        },
                        "mode": "markers+lines",
                        "type": "scatter",
                        "xsrc": "nandan123:83:d81770",
                        "ysrc": "nandan123:83:0ef3ae",
                        "marker": {
                            "color": "rgb(239, 85, 59)"
                        },
                        "stackgroup": null
                    },
                    {
                        "line": {
                            "dash": "dot"
                        },
                        "meta": {
                            "columnNames": {
                                "x": "A",
                                "y": "B"
                            }
                        },
                        "mode": "markers+lines",
                        "type": "scatter",
                        "xsrc": "nandan123:84:2abcd7",
                        "ysrc": "nandan123:84:50eb9a",
                        "marker": {
                            "color": "rgb(0, 204, 150)"
                        },
                        "stackgroup": null
                    },
                    {
                        "line": {
                            "dash": "dot"
                        },
                        "meta": {
                            "columnNames": {
                                "x": "A",
                                "y": "B"
                            }
                        },
                        "mode": "markers+lines",
                        "type": "scatter",
                        "xsrc": "nandan123:85:9d1c51",
                        "ysrc": "nandan123:85:c31d35",
                        "marker": {
                            "color": "rgb(171, 99, 250)"
                        },
                        "stackgroup": null
                    }
                ],
                "frames": [],
                "layout": {
                    "title": {
                        "text": "516.75 kHz, 50 mm/s"
                    },
                    "xaxis": {
                        "type": "linear",
                        "dtick": 100,
                        "range": [
                            0,
                            950
                        ],
                        "title": {
                            "text": "Pulse Energy (nJ)"
                        },
                        "tickmode": "linear",
                        "autorange": false
                    },
                    "yaxis": {
                        "type": "linear",
                        "dtick": 5,
                        "range": [
                            0,
                            75
                        ],
                        "title": {
                            "text": "Selectivity"
                        },
                        "tickmode": "linear",
                        "autorange": false
                    },
                    "autosize": true,
                    "template": {
                        "data": {
                            "bar": [
                                {
                                    "type": "bar",
                                    "marker": {
                                        "colorbar": {
                                            "ticks": "",
                                            "outlinewidth": 0
                                        }
                                    }
                                }
                            ],
                            "table": [
                                {
                                    "type": "table",
                                    "cells": {
                                        "fill": {
                                            "color": "#EBF0F8"
                                        },
                                        "line": {
                                            "color": "white"
                                        }
                                    },
                                    "header": {
                                        "fill": {
                                            "color": "#C8D4E3"
                                        },
                                        "line": {
                                            "color": "white"
                                        }
                                    }
                                }
                            ],
                            "carpet": [
                                {
                                    "type": "carpet",
                                    "aaxis": {
                                        "gridcolor": "#C8D4E3",
                                        "linecolor": "#C8D4E3",
                                        "endlinecolor": "#2a3f5f",
                                        "minorgridcolor": "#C8D4E3",
                                        "startlinecolor": "#2a3f5f"
                                    },
                                    "baxis": {
                                        "gridcolor": "#C8D4E3",
                                        "linecolor": "#C8D4E3",
                                        "endlinecolor": "#2a3f5f",
                                        "minorgridcolor": "#C8D4E3",
                                        "startlinecolor": "#2a3f5f"
                                    }
                                }
                            ],
                            "mesh3d": [
                                {
                                    "type": "mesh3d",
                                    "colorbar": {
                                        "ticks": "",
                                        "outlinewidth": 0
                                    }
                                }
                            ],
                            "contour": [
                                {
                                    "type": "contour",
                                    "colorbar": {
                                        "ticks": "",
                                        "outlinewidth": 0
                                    },
                                    "autocolorscale": true
                                }
                            ],
                            "heatmap": [
                                {
                                    "type": "heatmap",
                                    "colorbar": {
                                        "ticks": "",
                                        "outlinewidth": 0
                                    },
                                    "autocolorscale": true
                                }
                            ],
                            "scatter": [
                                {
                                    "type": "scatter",
                                    "marker": {
                                        "colorbar": {
                                            "ticks": "",
                                            "outlinewidth": 0
                                        }
                                    }
                                }
                            ],
                            "surface": [
                                {
                                    "type": "surface",
                                    "colorbar": {
                                        "ticks": "",
                                        "outlinewidth": 0
                                    }
                                }
                            ],
                            "heatmapgl": [
                                {
                                    "type": "heatmapgl",
                                    "colorbar": {
                                        "ticks": "",
                                        "outlinewidth": 0
                                    }
                                }
                            ],
                            "histogram": [
                                {
                                    "type": "histogram",
                                    "marker": {
                                        "colorbar": {
                                            "ticks": "",
                                            "outlinewidth": 0
                                        }
                                    }
                                }
                            ],
                            "parcoords": [
                                {
                                    "line": {
                                        "colorbar": {
                                            "ticks": "",
                                            "outlinewidth": 0
                                        }
                                    },
                                    "type": "parcoords"
                                }
                            ],
                            "scatter3d": [
                                {
                                    "type": "scatter3d",
                                    "marker": {
                                        "colorbar": {
                                            "ticks": "",
                                            "outlinewidth": 0
                                        }
                                    }
                                }
                            ],
                            "scattergl": [
                                {
                                    "type": "scattergl",
                                    "marker": {
                                        "colorbar": {
                                            "ticks": "",
                                            "outlinewidth": 0
                                        }
                                    }
                                }
                            ],
                            "choropleth": [
                                {
                                    "type": "choropleth",
                                    "colorbar": {
                                        "ticks": "",
                                        "outlinewidth": 0
                                    }
                                }
                            ],
                            "scattergeo": [
                                {
                                    "type": "scattergeo",
                                    "marker": {
                                        "colorbar": {
                                            "ticks": "",
                                            "outlinewidth": 0
                                        }
                                    }
                                }
                            ],
                            "histogram2d": [
                                {
                                    "type": "histogram2d",
                                    "colorbar": {
                                        "ticks": "",
                                        "outlinewidth": 0
                                    },
                                    "autocolorscale": true
                                }
                            ],
                            "scatterpolar": [
                                {
                                    "type": "scatterpolar",
                                    "marker": {
                                        "colorbar": {
                                            "ticks": "",
                                            "outlinewidth": 0
                                        }
                                    }
                                }
                            ],
                            "contourcarpet": [
                                {
                                    "type": "contourcarpet",
                                    "colorbar": {
                                        "ticks": "",
                                        "outlinewidth": 0
                                    }
                                }
                            ],
                            "scattercarpet": [
                                {
                                    "type": "scattercarpet",
                                    "marker": {
                                        "colorbar": {
                                            "ticks": "",
                                            "outlinewidth": 0
                                        }
                                    }
                                }
                            ],
                            "scattermapbox": [
                                {
                                    "type": "scattermapbox",
                                    "marker": {
                                        "colorbar": {
                                            "ticks": "",
                                            "outlinewidth": 0
                                        }
                                    }
                                }
                            ],
                            "scatterpolargl": [
                                {
                                    "type": "scatterpolargl",
                                    "marker": {
                                        "colorbar": {
                                            "ticks": "",
                                            "outlinewidth": 0
                                        }
                                    }
                                }
                            ],
                            "scatterternary": [
                                {
                                    "type": "scatterternary",
                                    "marker": {
                                        "colorbar": {
                                            "ticks": "",
                                            "outlinewidth": 0
                                        }
                                    }
                                }
                            ],
                            "histogram2dcontour": [
                                {
                                    "type": "histogram2dcontour",
                                    "colorbar": {
                                        "ticks": "",
                                        "outlinewidth": 0
                                    },
                                    "autocolorscale": true
                                }
                            ]
                        },
                        "layout": {
                            "geo": {
                                "bgcolor": "white",
                                "showland": true,
                                "lakecolor": "white",
                                "landcolor": "white",
                                "showlakes": true,
                                "subunitcolor": "#C8D4E3"
                            },
                            "font": {
                                "color": "#2a3f5f"
                            },
                            "polar": {
                                "bgcolor": "white",
                                "radialaxis": {
                                    "ticks": "",
                                    "gridcolor": "#EBF0F8",
                                    "linecolor": "#EBF0F8"
                                },
                                "angularaxis": {
                                    "ticks": "",
                                    "gridcolor": "#EBF0F8",
                                    "linecolor": "#EBF0F8"
                                }
                            },
                            "scene": {
                                "xaxis": {
                                    "ticks": "",
                                    "gridcolor": "#DFE8F3",
                                    "gridwidth": 2,
                                    "linecolor": "#EBF0F8",
                                    "zerolinecolor": "#EBF0F8",
                                    "showbackground": true,
                                    "backgroundcolor": "white"
                                },
                                "yaxis": {
                                    "ticks": "",
                                    "gridcolor": "#DFE8F3",
                                    "gridwidth": 2,
                                    "linecolor": "#EBF0F8",
                                    "zerolinecolor": "#EBF0F8",
                                    "showbackground": true,
                                    "backgroundcolor": "white"
                                },
                                "zaxis": {
                                    "ticks": "",
                                    "gridcolor": "#DFE8F3",
                                    "gridwidth": 2,
                                    "linecolor": "#EBF0F8",
                                    "zerolinecolor": "#EBF0F8",
                                    "showbackground": true,
                                    "backgroundcolor": "white"
                                }
                            },
                            "title": {
                                "x": 0.05
                            },
                            "xaxis": {
                                "ticks": "",
                                "gridcolor": "#EBF0F8",
                                "linecolor": "#EBF0F8",
                                "automargin": true,
                                "zerolinecolor": "#EBF0F8",
                                "zerolinewidth": 2
                            },
                            "yaxis": {
                                "ticks": "",
                                "gridcolor": "#EBF0F8",
                                "linecolor": "#EBF0F8",
                                "automargin": true,
                                "zerolinecolor": "#EBF0F8",
                                "zerolinewidth": 2
                            },
                            "ternary": {
                                "aaxis": {
                                    "ticks": "",
                                    "gridcolor": "#DFE8F3",
                                    "linecolor": "#A2B1C6"
                                },
                                "baxis": {
                                    "ticks": "",
                                    "gridcolor": "#DFE8F3",
                                    "linecolor": "#A2B1C6"
                                },
                                "caxis": {
                                    "ticks": "",
                                    "gridcolor": "#DFE8F3",
                                    "linecolor": "#A2B1C6"
                                },
                                "bgcolor": "white"
                            },
                            "colorway": [
                                "#636efa",
                                "#EF553B",
                                "#00cc96",
                                "#ab63fa",
                                "#19d3f3",
                                "#e763fa",
                                "#fecb52",
                                "#ffa15a",
                                "#ff6692",
                                "#b6e880"
                            ],
                            "hovermode": "closest",
                            "colorscale": {
                                "diverging": [
                                    [
                                        0,
                                        "#8e0152"
                                    ],
                                    [
                                        0.1,
                                        "#c51b7d"
                                    ],
                                    [
                                        0.2,
                                        "#de77ae"
                                    ],
                                    [
                                        0.3,
                                        "#f1b6da"
                                    ],
                                    [
                                        0.4,
                                        "#fde0ef"
                                    ],
                                    [
                                        0.5,
                                        "#f7f7f7"
                                    ],
                                    [
                                        0.6,
                                        "#e6f5d0"
                                    ],
                                    [
                                        0.7,
                                        "#b8e186"
                                    ],
                                    [
                                        0.8,
                                        "#7fbc41"
                                    ],
                                    [
                                        0.9,
                                        "#4d9221"
                                    ],
                                    [
                                        1,
                                        "#276419"
                                    ]
                                ],
                                "sequential": [
                                    [
                                        0,
                                        "#0508b8"
                                    ],
                                    [
                                        0.0893854748603352,
                                        "#1910d8"
                                    ],
                                    [
                                        0.1787709497206704,
                                        "#3c19f0"
                                    ],
                                    [
                                        0.2681564245810056,
                                        "#6b1cfb"
                                    ],
                                    [
                                        0.3575418994413408,
                                        "#981cfd"
                                    ],
                                    [
                                        0.44692737430167595,
                                        "#bf1cfd"
                                    ],
                                    [
                                        0.5363128491620112,
                                        "#dd2bfd"
                                    ],
                                    [
                                        0.6256983240223464,
                                        "#f246fe"
                                    ],
                                    [
                                        0.7150837988826816,
                                        "#fc67fd"
                                    ],
                                    [
                                        0.8044692737430168,
                                        "#fe88fc"
                                    ],
                                    [
                                        0.8938547486033519,
                                        "#fea5fd"
                                    ],
                                    [
                                        0.9832402234636871,
                                        "#febefe"
                                    ],
                                    [
                                        1,
                                        "#fec3fe"
                                    ]
                                ],
                                "sequentialminus": [
                                    [
                                        0,
                                        "#0508b8"
                                    ],
                                    [
                                        0.0893854748603352,
                                        "#1910d8"
                                    ],
                                    [
                                        0.1787709497206704,
                                        "#3c19f0"
                                    ],
                                    [
                                        0.2681564245810056,
                                        "#6b1cfb"
                                    ],
                                    [
                                        0.3575418994413408,
                                        "#981cfd"
                                    ],
                                    [
                                        0.44692737430167595,
                                        "#bf1cfd"
                                    ],
                                    [
                                        0.5363128491620112,
                                        "#dd2bfd"
                                    ],
                                    [
                                        0.6256983240223464,
                                        "#f246fe"
                                    ],
                                    [
                                        0.7150837988826816,
                                        "#fc67fd"
                                    ],
                                    [
                                        0.8044692737430168,
                                        "#fe88fc"
                                    ],
                                    [
                                        0.8938547486033519,
                                        "#fea5fd"
                                    ],
                                    [
                                        0.9832402234636871,
                                        "#febefe"
                                    ],
                                    [
                                        1,
                                        "#fec3fe"
                                    ]
                                ]
                            },
                            "plot_bgcolor": "white",
                            "paper_bgcolor": "white",
                            "shapedefaults": {
                                "line": {
                                    "width": 0
                                },
                                "opacity": 0.4,
                                "fillcolor": "#506784"
                            },
                            "annotationdefaults": {
                                "arrowhead": 0,
                                "arrowcolor": "#506784",
                                "arrowwidth": 1
                            }
                        },
                        "themeRef": "PLOTLY_WHITE"
                    }
                }
            },
            "height": null,
            "width": null,
            "user": {
                "profile_url": "https://chart-studio.plotly.com/~nandan123",
                "avatar_url": "https://storage.googleapis.com/plotly-prod-profiles/62.jpg",
                "background_url": "https://storage.googleapis.com/plotly-prod-profiles/bg-2.jpg",
                "bio": "",
                "nickname": "",
                "website": "",
                "stream_tokens": null,
                "feature_set_id": null,
                "csrf_token": null,
                "date_joined": "2025-05-14 23:12:44",
                "mapbox_access_tokens": null,
                "has_password": null,
                "username": "nandan123",
                "email": null,
                "is_active": null,
                "readonly": null,
                "is_dash_creator": null,
                "dash_created_count": null,
                "is_chart_creator": null,
                "charts_created_count": null
            }
        },
        {
            "creation_time": "2025-08-06T15:22:56.854680Z",
            "comments": {
                "results": [],
                "count": 0
            },
            "parented": true,
            "embed_url": "https://chart-studio.plotly.com/~pablo_255/6.embed",
            "fid": "pablo_255:6",
            "filename": "Plot 6",
            "filetype": "plot",
            "img_url": "https://storage.googleapis.com/plotly-prod-images/pablo_255/6/9_VDFFM9RCO165ORKMGU3S67D6NP1K7Q.png",
            "image_urls": {
                "default": "https://storage.googleapis.com/plotly-prod-images/pablo_255/6/2_HUYQK4SPS9YRABSJYK6JOYPASQG9GZ.png",
                "block-thumb": "https://storage.googleapis.com/plotly-prod-images/pablo_255/6/8_11XM8MJ34YQ96GCE1N17FGVYBAS0MD.png",
                "list-thumb": "https://storage.googleapis.com/plotly-prod-images/pablo_255/6/9_VDFFM9RCO165ORKMGU3S67D6NP1K7Q.png"
            },
            "api_urls": {
                "files": "https://api.plotly.com/v2/files/pablo_255:6",
                "plots": "https://api.plotly.com/v2/plots/pablo_255:6",
                "parent": "https://api.plotly.com/v2/folders/home?user=pablo_255"
            },
            "owner": "pablo_255",
            "parent": -1,
            "preview": "",
            "referencers": [],
            "references": [],
            "title": "",
            "views": 0,
            "web_url": "https://chart-studio.plotly.com/~pablo_255/6/",
            "world_readable": true,
            "date_modified": "2025-08-06T15:22:56.865Z",
            "stars": {
                "results": [],
                "count": 0
            },
            "collaborators": {
                "results": [],
                "count": 0
            },
            "subfolder_count": null,
            "refresh_interval": null,
            "organize_view_url": "https://chart-studio.plotly.com/~pablo_255/6/",
            "current_user_permission": "read",
            "is_theme": null,
            "is_template": false,
            "autosize": true,
            "caption": "",
            "figure": {
                "data": [
                    {
                        "meta": {
                            "columnNames": {
                                "x": "A",
                                "y": "C",
                                "z": "B"
                            }
                        },
                        "mode": "markers+lines",
                        "name": "Den1_on_BEST",
                        "type": "scatter3d",
                        "xsrc": "pablo_255:0:5c9ec5",
                        "ysrc": "pablo_255:0:05e38f",
                        "zsrc": "pablo_255:0:cc5858"
                    },
                    {
                        "meta": {
                            "columnNames": {
                                "x": "A",
                                "y": "C",
                                "z": "B"
                            }
                        },
                        "mode": "markers+lines",
                        "name": "Den1_on_MP",
                        "type": "scatter3d",
                        "xsrc": "pablo_255:1:4f5be2",
                        "ysrc": "pablo_255:1:bfe4aa",
                        "zsrc": "pablo_255:1:ebe364",
                        "scene": "scene"
                    },
                    {
                        "meta": {
                            "columnNames": {
                                "x": "A",
                                "y": "C",
                                "z": "B"
                            }
                        },
                        "mode": "markers+lines",
                        "name": "Den1_on_OFFSHORE",
                        "type": "scatter3d",
                        "xsrc": "pablo_255:2:479f59",
                        "ysrc": "pablo_255:1:bfe4aa",
                        "zsrc": "pablo_255:2:78c50f"
                    },
                    {
                        "meta": {
                            "columnNames": {
                                "x": "A",
                                "y": "C",
                                "z": "B"
                            }
                        },
                        "mode": "markers+lines",
                        "name": "Escot_on_BEST",
                        "type": "scatter3d",
                        "xsrc": "pablo_255:3:97ea54",
                        "ysrc": "pablo_255:3:9b0e29",
                        "zsrc": "pablo_255:3:83b25c"
                    },
                    {
                        "meta": {
                            "columnNames": {
                                "x": "A",
                                "y": "C",
                                "z": "B"
                            }
                        },
                        "mode": "markers+lines",
                        "name": "<b>Escot_on_MP</b>",
                        "type": "scatter3d",
                        "xsrc": "pablo_255:4:7f9d66",
                        "ysrc": "pablo_255:1:bfe4aa",
                        "zsrc": "pablo_255:2:78c50f"
                    },
                    {
                        "meta": {
                            "columnNames": {
                                "x": "A",
                                "y": "C",
                                "z": "B"
                            }
                        },
                        "mode": "markers+lines",
                        "name": "Escot_on_OFFSHORE",
                        "type": "scatter3d",
                        "xsrc": "pablo_255:5:503b38",
                        "ysrc": "pablo_255:5:3f1035",
                        "zsrc": "pablo_255:5:a2e5ae"
                    }
                ],
                "frames": [],
                "layout": {
                    "scene": {
                        "camera": {
                            "up": {
                                "x": 0,
                                "y": 0,
                                "z": 1
                            },
                            "eye": {
                                "x": -0.19576684458911958,
                                "y": 1.7908130936991637,
                                "z": 0.477603970164131
                            },
                            "center": {
                                "x": 0,
                                "y": 0,
                                "z": 0
                            },
                            "projection": {
                                "type": "perspective"
                            }
                        },
                        "dragmode": "turntable",
                        "aspectmode": "auto",
                        "aspectratio": {
                            "x": 1,
                            "y": 1,
                            "z": 1
                        }
                    },
                    "title": {
                        "text": "Click to enter Plot title"
                    },
                    "xaxis": {
                        "range": [
                            -1,
                            6
                        ],
                        "autorange": true
                    },
                    "yaxis": {
                        "range": [
                            -1,
                            4
                        ],
                        "autorange": true
                    },
                    "autosize": true,
                    "dragmode": "zoom"
                }
            },
            "height": null,
            "width": null,
            "user": {
                "profile_url": "https://chart-studio.plotly.com/~pablo_255",
                "avatar_url": "https://storage.googleapis.com/plotly-prod-profiles/15.jpg",
                "background_url": "https://storage.googleapis.com/plotly-prod-profiles/bg-13.jpg",
                "bio": "",
                "nickname": "",
                "website": "",
                "stream_tokens": null,
                "feature_set_id": null,
                "csrf_token": null,
                "date_joined": "2025-08-06 14:57:35",
                "mapbox_access_tokens": null,
                "has_password": null,
                "username": "pablo_255",
                "email": null,
                "is_active": null,
                "readonly": null,
                "is_dash_creator": null,
                "dash_created_count": null,
                "is_chart_creator": null,
                "charts_created_count": null
            }
        },
        {
            "creation_time": "2025-08-06T14:45:19.797515Z",
            "comments": {
                "results": [],
                "count": 0
            },
            "parented": true,
            "embed_url": "https://chart-studio.plotly.com/~swegner98/3.embed",
            "fid": "swegner98:3",
            "filename": "Plot 3",
            "filetype": "plot",
            "img_url": "https://storage.googleapis.com/plotly-prod-images/swegner98/3/9_SFNEECIUIZYQ6DBAN12ZLA5I72PBH5.png",
            "image_urls": {
                "default": "https://storage.googleapis.com/plotly-prod-images/swegner98/3/2_WK6CYMAQ8OT8GHZC9ABD9IG402EFYA.png",
                "block-thumb": "https://storage.googleapis.com/plotly-prod-images/swegner98/3/8_EU38FL0GTHTL95DX3SDZJM4IRF1YY0.png",
                "list-thumb": "https://storage.googleapis.com/plotly-prod-images/swegner98/3/9_SFNEECIUIZYQ6DBAN12ZLA5I72PBH5.png"
            },
            "api_urls": {
                "files": "https://api.plotly.com/v2/files/swegner98:3",
                "plots": "https://api.plotly.com/v2/plots/swegner98:3",
                "parent": "https://api.plotly.com/v2/folders/home?user=swegner98"
            },
            "owner": "swegner98",
            "parent": -1,
            "preview": "",
            "referencers": [],
            "references": [],
            "title": "",
            "views": 1,
            "web_url": "https://chart-studio.plotly.com/~swegner98/3/",
            "world_readable": true,
            "date_modified": "2025-08-06T14:45:19.809Z",
            "stars": {
                "results": [],
                "count": 0
            },
            "collaborators": {
                "results": [],
                "count": 0
            },
            "subfolder_count": null,
            "refresh_interval": null,
            "organize_view_url": "https://chart-studio.plotly.com/~swegner98/3/",
            "current_user_permission": "read",
            "is_theme": null,
            "is_template": false,
            "autosize": true,
            "caption": "",
            "figure": {
                "data": [
                    {
                        "meta": {
                            "columnNames": {
                                "y": "Fehlerentwicklung Sham"
                            }
                        },
                        "mode": "markers",
                        "name": "Sham",
                        "type": "box",
                        "ysrc": "swegner98:2:d1cba2",
                        "boxmean": true,
                        "boxpoints": false
                    },
                    {
                        "meta": {
                            "columnNames": {
                                "y": "Fehlerentwicklung Stim"
                            }
                        },
                        "name": "Stim",
                        "type": "box",
                        "ysrc": "swegner98:2:f2b860",
                        "boxmean": true,
                        "boxpoints": false
                    },
                    {
                        "meta": {
                            "columnNames": {
                                "y": "Fehlerentwicklung Split"
                            }
                        },
                        "name": "Split",
                        "type": "box",
                        "ysrc": "swegner98:2:8a09bc",
                        "boxmean": true,
                        "boxpoints": false
                    }
                ],
                "frames": [],
                "layout": {
                    "xaxis": {
                        "type": "category",
                        "range": [
                            -0.5,
                            2.5
                        ],
                        "title": {
                            "text": "Stimulationssetting"
                        },
                        "showline": false,
                        "autorange": true
                    },
                    "yaxis": {
                        "type": "linear",
                        "dtick": 3,
                        "range": [
                            -13,
                            7
                        ],
                        "title": {
                            "text": "Fehlerentwicklung"
                        },
                        "tickfont": {
                            "size": 12
                        },
                        "tickmode": "linear",
                        "autorange": true
                    },
                    "autosize": true,
                    "template": {
                        "data": {
                            "bar": [
                                {
                                    "type": "bar",
                                    "marker": {
                                        "colorbar": {
                                            "ticks": "",
                                            "outlinewidth": 0
                                        }
                                    }
                                }
                            ],
                            "table": [
                                {
                                    "type": "table",
                                    "cells": {
                                        "fill": {
                                            "color": "#EBF0F8"
                                        },
                                        "line": {
                                            "color": "white"
                                        }
                                    },
                                    "header": {
                                        "fill": {
                                            "color": "#C8D4E3"
                                        },
                                        "line": {
                                            "color": "white"
                                        }
                                    }
                                }
                            ],
                            "carpet": [
                                {
                                    "type": "carpet",
                                    "aaxis": {
                                        "gridcolor": "#C8D4E3",
                                        "linecolor": "#C8D4E3",
                                        "endlinecolor": "#2a3f5f",
                                        "minorgridcolor": "#C8D4E3",
                                        "startlinecolor": "#2a3f5f"
                                    },
                                    "baxis": {
                                        "gridcolor": "#C8D4E3",
                                        "linecolor": "#C8D4E3",
                                        "endlinecolor": "#2a3f5f",
                                        "minorgridcolor": "#C8D4E3",
                                        "startlinecolor": "#2a3f5f"
                                    }
                                }
                            ],
                            "mesh3d": [
                                {
                                    "type": "mesh3d",
                                    "colorbar": {
                                        "ticks": "",
                                        "outlinewidth": 0
                                    }
                                }
                            ],
                            "contour": [
                                {
                                    "type": "contour",
                                    "colorbar": {
                                        "ticks": "",
                                        "outlinewidth": 0
                                    },
                                    "autocolorscale": true
                                }
                            ],
                            "heatmap": [
                                {
                                    "type": "heatmap",
                                    "colorbar": {
                                        "ticks": "",
                                        "outlinewidth": 0
                                    },
                                    "autocolorscale": true
                                }
                            ],
                            "scatter": [
                                {
                                    "type": "scatter",
                                    "marker": {
                                        "colorbar": {
                                            "ticks": "",
                                            "outlinewidth": 0
                                        }
                                    }
                                }
                            ],
                            "surface": [
                                {
                                    "type": "surface",
                                    "colorbar": {
                                        "ticks": "",
                                        "outlinewidth": 0
                                    }
                                }
                            ],
                            "heatmapgl": [
                                {
                                    "type": "heatmapgl",
                                    "colorbar": {
                                        "ticks": "",
                                        "outlinewidth": 0
                                    }
                                }
                            ],
                            "histogram": [
                                {
                                    "type": "histogram",
                                    "marker": {
                                        "colorbar": {
                                            "ticks": "",
                                            "outlinewidth": 0
                                        }
                                    }
                                }
                            ],
                            "parcoords": [
                                {
                                    "line": {
                                        "colorbar": {
                                            "ticks": "",
                                            "outlinewidth": 0
                                        }
                                    },
                                    "type": "parcoords"
                                }
                            ],
                            "scatter3d": [
                                {
                                    "type": "scatter3d",
                                    "marker": {
                                        "colorbar": {
                                            "ticks": "",
                                            "outlinewidth": 0
                                        }
                                    }
                                }
                            ],
                            "scattergl": [
                                {
                                    "type": "scattergl",
                                    "marker": {
                                        "colorbar": {
                                            "ticks": "",
                                            "outlinewidth": 0
                                        }
                                    }
                                }
                            ],
                            "choropleth": [
                                {
                                    "type": "choropleth",
                                    "colorbar": {
                                        "ticks": "",
                                        "outlinewidth": 0
                                    }
                                }
                            ],
                            "scattergeo": [
                                {
                                    "type": "scattergeo",
                                    "marker": {
                                        "colorbar": {
                                            "ticks": "",
                                            "outlinewidth": 0
                                        }
                                    }
                                }
                            ],
                            "histogram2d": [
                                {
                                    "type": "histogram2d",
                                    "colorbar": {
                                        "ticks": "",
                                        "outlinewidth": 0
                                    },
                                    "autocolorscale": true
                                }
                            ],
                            "scatterpolar": [
                                {
                                    "type": "scatterpolar",
                                    "marker": {
                                        "colorbar": {
                                            "ticks": "",
                                            "outlinewidth": 0
                                        }
                                    }
                                }
                            ],
                            "contourcarpet": [
                                {
                                    "type": "contourcarpet",
                                    "colorbar": {
                                        "ticks": "",
                                        "outlinewidth": 0
                                    }
                                }
                            ],
                            "scattercarpet": [
                                {
                                    "type": "scattercarpet",
                                    "marker": {
                                        "colorbar": {
                                            "ticks": "",
                                            "outlinewidth": 0
                                        }
                                    }
                                }
                            ],
                            "scattermapbox": [
                                {
                                    "type": "scattermapbox",
                                    "marker": {
                                        "colorbar": {
                                            "ticks": "",
                                            "outlinewidth": 0
                                        }
                                    }
                                }
                            ],
                            "scatterpolargl": [
                                {
                                    "type": "scatterpolargl",
                                    "marker": {
                                        "colorbar": {
                                            "ticks": "",
                                            "outlinewidth": 0
                                        }
                                    }
                                }
                            ],
                            "scatterternary": [
                                {
                                    "type": "scatterternary",
                                    "marker": {
                                        "colorbar": {
                                            "ticks": "",
                                            "outlinewidth": 0
                                        }
                                    }
                                }
                            ],
                            "histogram2dcontour": [
                                {
                                    "type": "histogram2dcontour",
                                    "colorbar": {
                                        "ticks": "",
                                        "outlinewidth": 0
                                    },
                                    "autocolorscale": true
                                }
                            ]
                        },
                        "layout": {
                            "geo": {
                                "bgcolor": "white",
                                "showland": true,
                                "lakecolor": "white",
                                "landcolor": "white",
                                "showlakes": true,
                                "subunitcolor": "#C8D4E3"
                            },
                            "font": {
                                "color": "#2a3f5f"
                            },
                            "polar": {
                                "bgcolor": "white",
                                "radialaxis": {
                                    "ticks": "",
                                    "gridcolor": "#EBF0F8",
                                    "linecolor": "#EBF0F8"
                                },
                                "angularaxis": {
                                    "ticks": "",
                                    "gridcolor": "#EBF0F8",
                                    "linecolor": "#EBF0F8"
                                }
                            },
                            "scene": {
                                "xaxis": {
                                    "ticks": "",
                                    "gridcolor": "#DFE8F3",
                                    "gridwidth": 2,
                                    "linecolor": "#EBF0F8",
                                    "zerolinecolor": "#EBF0F8",
                                    "showbackground": true,
                                    "backgroundcolor": "white"
                                },
                                "yaxis": {
                                    "ticks": "",
                                    "gridcolor": "#DFE8F3",
                                    "gridwidth": 2,
                                    "linecolor": "#EBF0F8",
                                    "zerolinecolor": "#EBF0F8",
                                    "showbackground": true,
                                    "backgroundcolor": "white"
                                },
                                "zaxis": {
                                    "ticks": "",
                                    "gridcolor": "#DFE8F3",
                                    "gridwidth": 2,
                                    "linecolor": "#EBF0F8",
                                    "zerolinecolor": "#EBF0F8",
                                    "showbackground": true,
                                    "backgroundcolor": "white"
                                }
                            },
                            "title": {
                                "x": 0.05
                            },
                            "xaxis": {
                                "ticks": "",
                                "gridcolor": "#EBF0F8",
                                "linecolor": "#EBF0F8",
                                "automargin": true,
                                "zerolinecolor": "#EBF0F8",
                                "zerolinewidth": 2
                            },
                            "yaxis": {
                                "ticks": "",
                                "gridcolor": "#EBF0F8",
                                "linecolor": "#EBF0F8",
                                "automargin": true,
                                "zerolinecolor": "#EBF0F8",
                                "zerolinewidth": 2
                            },
                            "ternary": {
                                "aaxis": {
                                    "ticks": "",
                                    "gridcolor": "#DFE8F3",
                                    "linecolor": "#A2B1C6"
                                },
                                "baxis": {
                                    "ticks": "",
                                    "gridcolor": "#DFE8F3",
                                    "linecolor": "#A2B1C6"
                                },
                                "caxis": {
                                    "ticks": "",
                                    "gridcolor": "#DFE8F3",
                                    "linecolor": "#A2B1C6"
                                },
                                "bgcolor": "white"
                            },
                            "colorway": [
                                "#636efa",
                                "#EF553B",
                                "#00cc96",
                                "#ab63fa",
                                "#19d3f3",
                                "#e763fa",
                                "#fecb52",
                                "#ffa15a",
                                "#ff6692",
                                "#b6e880"
                            ],
                            "hovermode": "closest",
                            "colorscale": {
                                "diverging": [
                                    [
                                        0,
                                        "#8e0152"
                                    ],
                                    [
                                        0.1,
                                        "#c51b7d"
                                    ],
                                    [
                                        0.2,
                                        "#de77ae"
                                    ],
                                    [
                                        0.3,
                                        "#f1b6da"
                                    ],
                                    [
                                        0.4,
                                        "#fde0ef"
                                    ],
                                    [
                                        0.5,
                                        "#f7f7f7"
                                    ],
                                    [
                                        0.6,
                                        "#e6f5d0"
                                    ],
                                    [
                                        0.7,
                                        "#b8e186"
                                    ],
                                    [
                                        0.8,
                                        "#7fbc41"
                                    ],
                                    [
                                        0.9,
                                        "#4d9221"
                                    ],
                                    [
                                        1,
                                        "#276419"
                                    ]
                                ],
                                "sequential": [
                                    [
                                        0,
                                        "#0508b8"
                                    ],
                                    [
                                        0.0893854748603352,
                                        "#1910d8"
                                    ],
                                    [
                                        0.1787709497206704,
                                        "#3c19f0"
                                    ],
                                    [
                                        0.2681564245810056,
                                        "#6b1cfb"
                                    ],
                                    [
                                        0.3575418994413408,
                                        "#981cfd"
                                    ],
                                    [
                                        0.44692737430167595,
                                        "#bf1cfd"
                                    ],
                                    [
                                        0.5363128491620112,
                                        "#dd2bfd"
                                    ],
                                    [
                                        0.6256983240223464,
                                        "#f246fe"
                                    ],
                                    [
                                        0.7150837988826816,
                                        "#fc67fd"
                                    ],
                                    [
                                        0.8044692737430168,
                                        "#fe88fc"
                                    ],
                                    [
                                        0.8938547486033519,
                                        "#fea5fd"
                                    ],
                                    [
                                        0.9832402234636871,
                                        "#febefe"
                                    ],
                                    [
                                        1,
                                        "#fec3fe"
                                    ]
                                ],
                                "sequentialminus": [
                                    [
                                        0,
                                        "#0508b8"
                                    ],
                                    [
                                        0.0893854748603352,
                                        "#1910d8"
                                    ],
                                    [
                                        0.1787709497206704,
                                        "#3c19f0"
                                    ],
                                    [
                                        0.2681564245810056,
                                        "#6b1cfb"
                                    ],
                                    [
                                        0.3575418994413408,
                                        "#981cfd"
                                    ],
                                    [
                                        0.44692737430167595,
                                        "#bf1cfd"
                                    ],
                                    [
                                        0.5363128491620112,
                                        "#dd2bfd"
                                    ],
                                    [
                                        0.6256983240223464,
                                        "#f246fe"
                                    ],
                                    [
                                        0.7150837988826816,
                                        "#fc67fd"
                                    ],
                                    [
                                        0.8044692737430168,
                                        "#fe88fc"
                                    ],
                                    [
                                        0.8938547486033519,
                                        "#fea5fd"
                                    ],
                                    [
                                        0.9832402234636871,
                                        "#febefe"
                                    ],
                                    [
                                        1,
                                        "#fec3fe"
                                    ]
                                ]
                            },
                            "plot_bgcolor": "white",
                            "paper_bgcolor": "white",
                            "shapedefaults": {
                                "line": {
                                    "width": 0
                                },
                                "opacity": 0.4,
                                "fillcolor": "#506784"
                            },
                            "annotationdefaults": {
                                "arrowhead": 0,
                                "arrowcolor": "#506784",
                                "arrowwidth": 1
                            }
                        },
                        "themeRef": "PLOTLY_WHITE"
                    }
                }
            },
            "height": null,
            "width": null,
            "user": {
                "profile_url": "https://chart-studio.plotly.com/~swegner98",
                "avatar_url": "https://storage.googleapis.com/plotly-prod-profiles/8.jpg",
                "background_url": "https://storage.googleapis.com/plotly-prod-profiles/bg-13.jpg",
                "bio": "",
                "nickname": "",
                "website": "",
                "stream_tokens": null,
                "feature_set_id": null,
                "csrf_token": null,
                "date_joined": "2025-08-06 13:26:15",
                "mapbox_access_tokens": null,
                "has_password": null,
                "username": "swegner98",
                "email": null,
                "is_active": null,
                "readonly": null,
                "is_dash_creator": null,
                "dash_created_count": null,
                "is_chart_creator": null,
                "charts_created_count": null
            }
        },
        {
            "creation_time": "2025-08-06T14:27:14.678465Z",
            "comments": {
                "results": [],
                "count": 0
            },
            "parented": true,
            "embed_url": "https://chart-studio.plotly.com/~antle/216.embed",
            "fid": "antle:216",
            "filename": "antle20",
            "filetype": "plot",
            "img_url": "https://storage.googleapis.com/plotly-prod-images/antle/216/9_IX6ERUIZVORRB97X73ZK9M8L2ZQAX4.png",
            "image_urls": {
                "default": "https://storage.googleapis.com/plotly-prod-images/antle/216/2_ONKSNWHRZSOCV6BN55IAZJ7LID6IJ7.png",
                "block-thumb": "https://storage.googleapis.com/plotly-prod-images/antle/216/8_055ZO0PX1PXB6094P2FP8ESQVLPT7G.png",
                "list-thumb": "https://storage.googleapis.com/plotly-prod-images/antle/216/9_IX6ERUIZVORRB97X73ZK9M8L2ZQAX4.png"
            },
            "api_urls": {
                "files": "https://api.plotly.com/v2/files/antle:216",
                "plots": "https://api.plotly.com/v2/plots/antle:216",
                "parent": "https://api.plotly.com/v2/folders/home?user=antle"
            },
            "owner": "antle",
            "parent": -1,
            "preview": "",
            "referencers": [],
            "references": [],
            "title": "",
            "views": 1,
            "web_url": "https://chart-studio.plotly.com/~antle/216/",
            "world_readable": true,
            "date_modified": "2025-08-06T14:27:14.689Z",
            "stars": {
                "results": [],
                "count": 0
            },
            "collaborators": {
                "results": [],
                "count": 0
            },
            "subfolder_count": null,
            "refresh_interval": null,
            "organize_view_url": "https://chart-studio.plotly.com/~antle/216/",
            "current_user_permission": "read",
            "is_theme": null,
            "is_template": null,
            "autosize": true,
            "caption": "",
            "figure": {
                "data": [
                    {
                        "name": "노령 제외 인구 (64세 미만)",
                        "type": "bar",
                        "xsrc": "antle:215:dac44d",
                        "ysrc": "antle:215:521d21",
                        "marker": {
                            "color": "#4cc9f0"
                        },
                        "textsrc": "antle:215:5b89d0",
                        "textposition": "outside"
                    },
                    {
                        "name": "노령 인구 (65세 이상)",
                        "type": "bar",
                        "xsrc": "antle:215:e46883",
                        "ysrc": "antle:215:25e3c6",
                        "marker": {
                            "color": "#7209b7"
                        },
                        "textsrc": "antle:215:729464",
                        "textposition": "outside"
                    }
                ],
                "layout": {
                    "title": {
                        "text": "성남시 구별 인구"
                    },
                    "xaxis": {
                        "title": {
                            "text": "구별"
                        }
                    },
                    "yaxis": {
                        "title": {
                            "text": "인구 수 (명)"
                        },
                        "tickformat": ","
                    },
                    "height": 700,
                    "legend": {
                        "title": {
                            "text": "구성"
                        }
                    },
                    "barmode": "group",
                    "template": {
                        "data": {
                            "bar": [
                                {
                                    "type": "bar",
                                    "marker": {
                                        "line": {
                                            "color": "#E5ECF6",
                                            "width": 0.5
                                        },
                                        "pattern": {
                                            "size": 10,
                                            "fillmode": "overlay",
                                            "solidity": 0.2
                                        }
                                    },
                                    "error_x": {
                                        "color": "#2a3f5f"
                                    },
                                    "error_y": {
                                        "color": "#2a3f5f"
                                    }
                                }
                            ],
                            "pie": [
                                {
                                    "type": "pie",
                                    "automargin": true
                                }
                            ],
                            "table": [
                                {
                                    "type": "table",
                                    "cells": {
                                        "fill": {
                                            "color": "#EBF0F8"
                                        },
                                        "line": {
                                            "color": "white"
                                        }
                                    },
                                    "header": {
                                        "fill": {
                                            "color": "#C8D4E3"
                                        },
                                        "line": {
                                            "color": "white"
                                        }
                                    }
                                }
                            ],
                            "carpet": [
                                {
                                    "type": "carpet",
                                    "aaxis": {
                                        "gridcolor": "white",
                                        "linecolor": "white",
                                        "endlinecolor": "#2a3f5f",
                                        "minorgridcolor": "white",
                                        "startlinecolor": "#2a3f5f"
                                    },
                                    "baxis": {
                                        "gridcolor": "white",
                                        "linecolor": "white",
                                        "endlinecolor": "#2a3f5f",
                                        "minorgridcolor": "white",
                                        "startlinecolor": "#2a3f5f"
                                    }
                                }
                            ],
                            "mesh3d": [
                                {
                                    "type": "mesh3d",
                                    "colorbar": {
                                        "ticks": "",
                                        "outlinewidth": 0
                                    }
                                }
                            ],
                            "contour": [
                                {
                                    "type": "contour",
                                    "colorbar": {
                                        "ticks": "",
                                        "outlinewidth": 0
                                    },
                                    "colorscale": [
                                        [
                                            0.0,
                                            "#0d0887"
                                        ],
                                        [
                                            0.1111111111111111,
                                            "#46039f"
                                        ],
                                        [
                                            0.2222222222222222,
                                            "#7201a8"
                                        ],
                                        [
                                            0.3333333333333333,
                                            "#9c179e"
                                        ],
                                        [
                                            0.4444444444444444,
                                            "#bd3786"
                                        ],
                                        [
                                            0.5555555555555556,
                                            "#d8576b"
                                        ],
                                        [
                                            0.6666666666666666,
                                            "#ed7953"
                                        ],
                                        [
                                            0.7777777777777778,
                                            "#fb9f3a"
                                        ],
                                        [
                                            0.8888888888888888,
                                            "#fdca26"
                                        ],
                                        [
                                            1.0,
                                            "#f0f921"
                                        ]
                                    ]
                                }
                            ],
                            "heatmap": [
                                {
                                    "type": "heatmap",
                                    "colorbar": {
                                        "ticks": "",
                                        "outlinewidth": 0
                                    },
                                    "colorscale": [
                                        [
                                            0.0,
                                            "#0d0887"
                                        ],
                                        [
                                            0.1111111111111111,
                                            "#46039f"
                                        ],
                                        [
                                            0.2222222222222222,
                                            "#7201a8"
                                        ],
                                        [
                                            0.3333333333333333,
                                            "#9c179e"
                                        ],
                                        [
                                            0.4444444444444444,
                                            "#bd3786"
                                        ],
                                        [
                                            0.5555555555555556,
                                            "#d8576b"
                                        ],
                                        [
                                            0.6666666666666666,
                                            "#ed7953"
                                        ],
                                        [
                                            0.7777777777777778,
                                            "#fb9f3a"
                                        ],
                                        [
                                            0.8888888888888888,
                                            "#fdca26"
                                        ],
                                        [
                                            1.0,
                                            "#f0f921"
                                        ]
                                    ]
                                }
                            ],
                            "scatter": [
                                {
                                    "type": "scatter",
                                    "fillpattern": {
                                        "size": 10,
                                        "fillmode": "overlay",
                                        "solidity": 0.2
                                    }
                                }
                            ],
                            "surface": [
                                {
                                    "type": "surface",
                                    "colorbar": {
                                        "ticks": "",
                                        "outlinewidth": 0
                                    },
                                    "colorscale": [
                                        [
                                            0.0,
                                            "#0d0887"
                                        ],
                                        [
                                            0.1111111111111111,
                                            "#46039f"
                                        ],
                                        [
                                            0.2222222222222222,
                                            "#7201a8"
                                        ],
                                        [
                                            0.3333333333333333,
                                            "#9c179e"
                                        ],
                                        [
                                            0.4444444444444444,
                                            "#bd3786"
                                        ],
                                        [
                                            0.5555555555555556,
                                            "#d8576b"
                                        ],
                                        [
                                            0.6666666666666666,
                                            "#ed7953"
                                        ],
                                        [
                                            0.7777777777777778,
                                            "#fb9f3a"
                                        ],
                                        [
                                            0.8888888888888888,
                                            "#fdca26"
                                        ],
                                        [
                                            1.0,
                                            "#f0f921"
                                        ]
                                    ]
                                }
                            ],
                            "barpolar": [
                                {
                                    "type": "barpolar",
                                    "marker": {
                                        "line": {
                                            "color": "#E5ECF6",
                                            "width": 0.5
                                        },
                                        "pattern": {
                                            "size": 10,
                                            "fillmode": "overlay",
                                            "solidity": 0.2
                                        }
                                    }
                                }
                            ],
                            "heatmapgl": [
                                {
                                    "type": "heatmapgl",
                                    "colorbar": {
                                        "ticks": "",
                                        "outlinewidth": 0
                                    },
                                    "colorscale": [
                                        [
                                            0.0,
                                            "#0d0887"
                                        ],
                                        [
                                            0.1111111111111111,
                                            "#46039f"
                                        ],
                                        [
                                            0.2222222222222222,
                                            "#7201a8"
                                        ],
                                        [
                                            0.3333333333333333,
                                            "#9c179e"
                                        ],
                                        [
                                            0.4444444444444444,
                                            "#bd3786"
                                        ],
                                        [
                                            0.5555555555555556,
                                            "#d8576b"
                                        ],
                                        [
                                            0.6666666666666666,
                                            "#ed7953"
                                        ],
                                        [
                                            0.7777777777777778,
                                            "#fb9f3a"
                                        ],
                                        [
                                            0.8888888888888888,
                                            "#fdca26"
                                        ],
                                        [
                                            1.0,
                                            "#f0f921"
                                        ]
                                    ]
                                }
                            ],
                            "histogram": [
                                {
                                    "type": "histogram",
                                    "marker": {
                                        "pattern": {
                                            "size": 10,
                                            "fillmode": "overlay",
                                            "solidity": 0.2
                                        }
                                    }
                                }
                            ],
                            "parcoords": [
                                {
                                    "line": {
                                        "colorbar": {
                                            "ticks": "",
                                            "outlinewidth": 0
                                        }
                                    },
                                    "type": "parcoords"
                                }
                            ],
                            "scatter3d": [
                                {
                                    "line": {
                                        "colorbar": {
                                            "ticks": "",
                                            "outlinewidth": 0
                                        }
                                    },
                                    "type": "scatter3d",
                                    "marker": {
                                        "colorbar": {
                                            "ticks": "",
                                            "outlinewidth": 0
                                        }
                                    }
                                }
                            ],
                            "scattergl": [
                                {
                                    "type": "scattergl",
                                    "marker": {
                                        "colorbar": {
                                            "ticks": "",
                                            "outlinewidth": 0
                                        }
                                    }
                                }
                            ],
                            "choropleth": [
                                {
                                    "type": "choropleth",
                                    "colorbar": {
                                        "ticks": "",
                                        "outlinewidth": 0
                                    }
                                }
                            ],
                            "scattergeo": [
                                {
                                    "type": "scattergeo",
                                    "marker": {
                                        "colorbar": {
                                            "ticks": "",
                                            "outlinewidth": 0
                                        }
                                    }
                                }
                            ],
                            "histogram2d": [
                                {
                                    "type": "histogram2d",
                                    "colorbar": {
                                        "ticks": "",
                                        "outlinewidth": 0
                                    },
                                    "colorscale": [
                                        [
                                            0.0,
                                            "#0d0887"
                                        ],
                                        [
                                            0.1111111111111111,
                                            "#46039f"
                                        ],
                                        [
                                            0.2222222222222222,
                                            "#7201a8"
                                        ],
                                        [
                                            0.3333333333333333,
                                            "#9c179e"
                                        ],
                                        [
                                            0.4444444444444444,
                                            "#bd3786"
                                        ],
                                        [
                                            0.5555555555555556,
                                            "#d8576b"
                                        ],
                                        [
                                            0.6666666666666666,
                                            "#ed7953"
                                        ],
                                        [
                                            0.7777777777777778,
                                            "#fb9f3a"
                                        ],
                                        [
                                            0.8888888888888888,
                                            "#fdca26"
                                        ],
                                        [
                                            1.0,
                                            "#f0f921"
                                        ]
                                    ]
                                }
                            ],
                            "scatterpolar": [
                                {
                                    "type": "scatterpolar",
                                    "marker": {
                                        "colorbar": {
                                            "ticks": "",
                                            "outlinewidth": 0
                                        }
                                    }
                                }
                            ],
                            "contourcarpet": [
                                {
                                    "type": "contourcarpet",
                                    "colorbar": {
                                        "ticks": "",
                                        "outlinewidth": 0
                                    }
                                }
                            ],
                            "scattercarpet": [
                                {
                                    "type": "scattercarpet",
                                    "marker": {
                                        "colorbar": {
                                            "ticks": "",
                                            "outlinewidth": 0
                                        }
                                    }
                                }
                            ],
                            "scattermapbox": [
                                {
                                    "type": "scattermapbox",
                                    "marker": {
                                        "colorbar": {
                                            "ticks": "",
                                            "outlinewidth": 0
                                        }
                                    }
                                }
                            ],
                            "scatterpolargl": [
                                {
                                    "type": "scatterpolargl",
                                    "marker": {
                                        "colorbar": {
                                            "ticks": "",
                                            "outlinewidth": 0
                                        }
                                    }
                                }
                            ],
                            "scatterternary": [
                                {
                                    "type": "scatterternary",
                                    "marker": {
                                        "colorbar": {
                                            "ticks": "",
                                            "outlinewidth": 0
                                        }
                                    }
                                }
                            ],
                            "histogram2dcontour": [
                                {
                                    "type": "histogram2dcontour",
                                    "colorbar": {
                                        "ticks": "",
                                        "outlinewidth": 0
                                    },
                                    "colorscale": [
                                        [
                                            0.0,
                                            "#0d0887"
                                        ],
                                        [
                                            0.1111111111111111,
                                            "#46039f"
                                        ],
                                        [
                                            0.2222222222222222,
                                            "#7201a8"
                                        ],
                                        [
                                            0.3333333333333333,
                                            "#9c179e"
                                        ],
                                        [
                                            0.4444444444444444,
                                            "#bd3786"
                                        ],
                                        [
                                            0.5555555555555556,
                                            "#d8576b"
                                        ],
                                        [
                                            0.6666666666666666,
                                            "#ed7953"
                                        ],
                                        [
                                            0.7777777777777778,
                                            "#fb9f3a"
                                        ],
                                        [
                                            0.8888888888888888,
                                            "#fdca26"
                                        ],
                                        [
                                            1.0,
                                            "#f0f921"
                                        ]
                                    ]
                                }
                            ]
                        },
                        "layout": {
                            "geo": {
                                "bgcolor": "white",
                                "showland": true,
                                "lakecolor": "white",
                                "landcolor": "#E5ECF6",
                                "showlakes": true,
                                "subunitcolor": "white"
                            },
                            "font": {
                                "color": "#2a3f5f"
                            },
                            "polar": {
                                "bgcolor": "#E5ECF6",
                                "radialaxis": {
                                    "ticks": "",
                                    "gridcolor": "white",
                                    "linecolor": "white"
                                },
                                "angularaxis": {
                                    "ticks": "",
                                    "gridcolor": "white",
                                    "linecolor": "white"
                                }
                            },
                            "scene": {
                                "xaxis": {
                                    "ticks": "",
                                    "gridcolor": "white",
                                    "gridwidth": 2,
                                    "linecolor": "white",
                                    "zerolinecolor": "white",
                                    "showbackground": true,
                                    "backgroundcolor": "#E5ECF6"
                                },
                                "yaxis": {
                                    "ticks": "",
                                    "gridcolor": "white",
                                    "gridwidth": 2,
                                    "linecolor": "white",
                                    "zerolinecolor": "white",
                                    "showbackground": true,
                                    "backgroundcolor": "#E5ECF6"
                                },
                                "zaxis": {
                                    "ticks": "",
                                    "gridcolor": "white",
                                    "gridwidth": 2,
                                    "linecolor": "white",
                                    "zerolinecolor": "white",
                                    "showbackground": true,
                                    "backgroundcolor": "#E5ECF6"
                                }
                            },
                            "title": {
                                "x": 0.05
                            },
                            "xaxis": {
                                "ticks": "",
                                "title": {
                                    "standoff": 15
                                },
                                "gridcolor": "white",
                                "linecolor": "white",
                                "automargin": true,
                                "zerolinecolor": "white",
                                "zerolinewidth": 2
                            },
                            "yaxis": {
                                "ticks": "",
                                "title": {
                                    "standoff": 15
                                },
                                "gridcolor": "white",
                                "linecolor": "white",
                                "automargin": true,
                                "zerolinecolor": "white",
                                "zerolinewidth": 2
                            },
                            "mapbox": {
                                "style": "light"
                            },
                            "ternary": {
                                "aaxis": {
                                    "ticks": "",
                                    "gridcolor": "white",
                                    "linecolor": "white"
                                },
                                "baxis": {
                                    "ticks": "",
                                    "gridcolor": "white",
                                    "linecolor": "white"
                                },
                                "caxis": {
                                    "ticks": "",
                                    "gridcolor": "white",
                                    "linecolor": "white"
                                },
                                "bgcolor": "#E5ECF6"
                            },
                            "colorway": [
                                "#636efa",
                                "#EF553B",
                                "#00cc96",
                                "#ab63fa",
                                "#FFA15A",
                                "#19d3f3",
                                "#FF6692",
                                "#B6E880",
                                "#FF97FF",
                                "#FECB52"
                            ],
                            "coloraxis": {
                                "colorbar": {
                                    "ticks": "",
                                    "outlinewidth": 0
                                }
                            },
                            "hovermode": "closest",
                            "colorscale": {
                                "diverging": [
                                    [
                                        0,
                                        "#8e0152"
                                    ],
                                    [
                                        0.1,
                                        "#c51b7d"
                                    ],
                                    [
                                        0.2,
                                        "#de77ae"
                                    ],
                                    [
                                        0.3,
                                        "#f1b6da"
                                    ],
                                    [
                                        0.4,
                                        "#fde0ef"
                                    ],
                                    [
                                        0.5,
                                        "#f7f7f7"
                                    ],
                                    [
                                        0.6,
                                        "#e6f5d0"
                                    ],
                                    [
                                        0.7,
                                        "#b8e186"
                                    ],
                                    [
                                        0.8,
                                        "#7fbc41"
                                    ],
                                    [
                                        0.9,
                                        "#4d9221"
                                    ],
                                    [
                                        1,
                                        "#276419"
                                    ]
                                ],
                                "sequential": [
                                    [
                                        0.0,
                                        "#0d0887"
                                    ],
                                    [
                                        0.1111111111111111,
                                        "#46039f"
                                    ],
                                    [
                                        0.2222222222222222,
                                        "#7201a8"
                                    ],
                                    [
                                        0.3333333333333333,
                                        "#9c179e"
                                    ],
                                    [
                                        0.4444444444444444,
                                        "#bd3786"
                                    ],
                                    [
                                        0.5555555555555556,
                                        "#d8576b"
                                    ],
                                    [
                                        0.6666666666666666,
                                        "#ed7953"
                                    ],
                                    [
                                        0.7777777777777778,
                                        "#fb9f3a"
                                    ],
                                    [
                                        0.8888888888888888,
                                        "#fdca26"
                                    ],
                                    [
                                        1.0,
                                        "#f0f921"
                                    ]
                                ],
                                "sequentialminus": [
                                    [
                                        0.0,
                                        "#0d0887"
                                    ],
                                    [
                                        0.1111111111111111,
                                        "#46039f"
                                    ],
                                    [
                                        0.2222222222222222,
                                        "#7201a8"
                                    ],
                                    [
                                        0.3333333333333333,
                                        "#9c179e"
                                    ],
                                    [
                                        0.4444444444444444,
                                        "#bd3786"
                                    ],
                                    [
                                        0.5555555555555556,
                                        "#d8576b"
                                    ],
                                    [
                                        0.6666666666666666,
                                        "#ed7953"
                                    ],
                                    [
                                        0.7777777777777778,
                                        "#fb9f3a"
                                    ],
                                    [
                                        0.8888888888888888,
                                        "#fdca26"
                                    ],
                                    [
                                        1.0,
                                        "#f0f921"
                                    ]
                                ]
                            },
                            "hoverlabel": {
                                "align": "left"
                            },
                            "plot_bgcolor": "#E5ECF6",
                            "paper_bgcolor": "white",
                            "shapedefaults": {
                                "line": {
                                    "color": "#2a3f5f"
                                }
                            },
                            "autotypenumbers": "strict",
                            "annotationdefaults": {
                                "arrowhead": 0,
                                "arrowcolor": "#2a3f5f",
                                "arrowwidth": 1
                            }
                        }
                    }
                }
            },
            "height": 700,
            "width": null,
            "user": {
                "profile_url": "https://chart-studio.plotly.com/~antle",
                "avatar_url": "https://storage.googleapis.com/plotly-prod-profiles/54.jpg",
                "background_url": "https://storage.googleapis.com/plotly-prod-profiles/bg-9.jpg",
                "bio": "",
                "nickname": "",
                "website": "",
                "stream_tokens": null,
                "feature_set_id": null,
                "csrf_token": null,
                "date_joined": "2025-06-17 11:08:35",
                "mapbox_access_tokens": null,
                "has_password": null,
                "username": "antle",
                "email": null,
                "is_active": null,
                "readonly": null,
                "is_dash_creator": null,
                "dash_created_count": null,
                "is_chart_creator": null,
                "charts_created_count": null
            }
        },
        {
            "creation_time": "2025-08-06T14:17:15.640810Z",
            "comments": {
                "results": [],
                "count": 0
            },
            "parented": true,
            "embed_url": "https://chart-studio.plotly.com/~Camila.Siqueira/3.embed",
            "fid": "Camila.Siqueira:3",
            "filename": "Plot 3",
            "filetype": "plot",
            "img_url": "https://storage.googleapis.com/plotly-prod-images/Camila.Siqueira/3/9_O0QLS6Y5GP5ADRP2U1ZTFF5B4DYGQG.png",
            "image_urls": {
                "default": "https://storage.googleapis.com/plotly-prod-images/Camila.Siqueira/3/2_1NO6T69VFQGKP2WODS69NHIYXAMHAA.png",
                "block-thumb": "https://storage.googleapis.com/plotly-prod-images/Camila.Siqueira/3/8_S8C93567DSIKZG9FCNE2SMPMK06O90.png",
                "list-thumb": "https://storage.googleapis.com/plotly-prod-images/Camila.Siqueira/3/9_O0QLS6Y5GP5ADRP2U1ZTFF5B4DYGQG.png"
            },
            "api_urls": {
                "files": "https://api.plotly.com/v2/files/Camila.Siqueira:3",
                "plots": "https://api.plotly.com/v2/plots/Camila.Siqueira:3",
                "parent": "https://api.plotly.com/v2/folders/home?user=Camila.Siqueira"
            },
            "owner": "Camila.Siqueira",
            "parent": -1,
            "preview": "",
            "referencers": [],
            "references": [],
            "title": "",
            "views": 0,
            "web_url": "https://chart-studio.plotly.com/~Camila.Siqueira/3/",
            "world_readable": true,
            "date_modified": "2025-08-06T14:17:15.651Z",
            "stars": {
                "results": [],
                "count": 0
            },
            "collaborators": {
                "results": [],
                "count": 0
            },
            "subfolder_count": null,
            "refresh_interval": null,
            "organize_view_url": "https://chart-studio.plotly.com/~Camila.Siqueira/3/",
            "current_user_permission": "read",
            "is_theme": null,
            "is_template": false,
            "autosize": true,
            "caption": "",
            "figure": {
                "data": [
                    {
                        "meta": {
                            "columnNames": {
                                "x": "A",
                                "y": "B"
                            }
                        },
                        "mode": "lines",
                        "type": "scatter",
                        "xsrc": "Camila.Siqueira:2:7ee946",
                        "ysrc": "Camila.Siqueira:2:36c8d9"
                    },
                    {
                        "meta": {
                            "columnNames": {
                                "x": "A",
                                "y": "C"
                            }
                        },
                        "mode": "lines",
                        "type": "scatter",
                        "xsrc": "Camila.Siqueira:2:7ee946",
                        "ysrc": "Camila.Siqueira:2:a44fb4",
                        "stackgroup": null
                    },
                    {
                        "meta": {
                            "columnNames": {
                                "x": "A",
                                "y": "D"
                            }
                        },
                        "mode": "lines",
                        "type": "scatter",
                        "xsrc": "Camila.Siqueira:2:7ee946",
                        "ysrc": "Camila.Siqueira:2:a807b3",
                        "stackgroup": null
                    }
                ],
                "frames": [],
                "layout": {
                    "title": {
                        "text": "Gráfico de Adsorção AVIP224"
                    },
                    "xaxis": {
                        "type": "linear",
                        "range": [
                            0,
                            30
                        ],
                        "title": {
                            "text": "Tempo"
                        },
                        "autorange": true
                    },
                    "yaxis": {
                        "type": "linear",
                        "range": [
                            -988388.8888888891,
                            18999388.888888888
                        ],
                        "title": {
                            "text": "UMdsorção em Log"
                        },
                        "autorange": true
                    },
                    "template": {
                        "data": {
                            "bar": [
                                {
                                    "type": "bar",
                                    "marker": {
                                        "colorbar": {
                                            "ticks": "",
                                            "outlinewidth": 0
                                        }
                                    }
                                }
                            ],
                            "table": [
                                {
                                    "type": "table",
                                    "cells": {
                                        "fill": {
                                            "color": "#EBF0F8"
                                        },
                                        "line": {
                                            "color": "white"
                                        }
                                    },
                                    "header": {
                                        "fill": {
                                            "color": "#C8D4E3"
                                        },
                                        "line": {
                                            "color": "white"
                                        }
                                    }
                                }
                            ],
                            "carpet": [
                                {
                                    "type": "carpet",
                                    "aaxis": {
                                        "gridcolor": "#C8D4E3",
                                        "linecolor": "#C8D4E3",
                                        "endlinecolor": "#2a3f5f",
                                        "minorgridcolor": "#C8D4E3",
                                        "startlinecolor": "#2a3f5f"
                                    },
                                    "baxis": {
                                        "gridcolor": "#C8D4E3",
                                        "linecolor": "#C8D4E3",
                                        "endlinecolor": "#2a3f5f",
                                        "minorgridcolor": "#C8D4E3",
                                        "startlinecolor": "#2a3f5f"
                                    }
                                }
                            ],
                            "mesh3d": [
                                {
                                    "type": "mesh3d",
                                    "colorbar": {
                                        "ticks": "",
                                        "outlinewidth": 0
                                    }
                                }
                            ],
                            "contour": [
                                {
                                    "type": "contour",
                                    "colorbar": {
                                        "ticks": "",
                                        "outlinewidth": 0
                                    },
                                    "autocolorscale": true
                                }
                            ],
                            "heatmap": [
                                {
                                    "type": "heatmap",
                                    "colorbar": {
                                        "ticks": "",
                                        "outlinewidth": 0
                                    },
                                    "autocolorscale": true
                                }
                            ],
                            "scatter": [
                                {
                                    "type": "scatter",
                                    "marker": {
                                        "colorbar": {
                                            "ticks": "",
                                            "outlinewidth": 0
                                        }
                                    }
                                }
                            ],
                            "surface": [
                                {
                                    "type": "surface",
                                    "colorbar": {
                                        "ticks": "",
                                        "outlinewidth": 0
                                    }
                                }
                            ],
                            "heatmapgl": [
                                {
                                    "type": "heatmapgl",
                                    "colorbar": {
                                        "ticks": "",
                                        "outlinewidth": 0
                                    }
                                }
                            ],
                            "histogram": [
                                {
                                    "type": "histogram",
                                    "marker": {
                                        "colorbar": {
                                            "ticks": "",
                                            "outlinewidth": 0
                                        }
                                    }
                                }
                            ],
                            "parcoords": [
                                {
                                    "line": {
                                        "colorbar": {
                                            "ticks": "",
                                            "outlinewidth": 0
                                        }
                                    },
                                    "type": "parcoords"
                                }
                            ],
                            "scatter3d": [
                                {
                                    "type": "scatter3d",
                                    "marker": {
                                        "colorbar": {
                                            "ticks": "",
                                            "outlinewidth": 0
                                        }
                                    }
                                }
                            ],
                            "scattergl": [
                                {
                                    "type": "scattergl",
                                    "marker": {
                                        "colorbar": {
                                            "ticks": "",
                                            "outlinewidth": 0
                                        }
                                    }
                                }
                            ],
                            "choropleth": [
                                {
                                    "type": "choropleth",
                                    "colorbar": {
                                        "ticks": "",
                                        "outlinewidth": 0
                                    }
                                }
                            ],
                            "scattergeo": [
                                {
                                    "type": "scattergeo",
                                    "marker": {
                                        "colorbar": {
                                            "ticks": "",
                                            "outlinewidth": 0
                                        }
                                    }
                                }
                            ],
                            "histogram2d": [
                                {
                                    "type": "histogram2d",
                                    "colorbar": {
                                        "ticks": "",
                                        "outlinewidth": 0
                                    },
                                    "autocolorscale": true
                                }
                            ],
                            "scatterpolar": [
                                {
                                    "type": "scatterpolar",
                                    "marker": {
                                        "colorbar": {
                                            "ticks": "",
                                            "outlinewidth": 0
                                        }
                                    }
                                }
                            ],
                            "contourcarpet": [
                                {
                                    "type": "contourcarpet",
                                    "colorbar": {
                                        "ticks": "",
                                        "outlinewidth": 0
                                    }
                                }
                            ],
                            "scattercarpet": [
                                {
                                    "type": "scattercarpet",
                                    "marker": {
                                        "colorbar": {
                                            "ticks": "",
                                            "outlinewidth": 0
                                        }
                                    }
                                }
                            ],
                            "scattermapbox": [
                                {
                                    "type": "scattermapbox",
                                    "marker": {
                                        "colorbar": {
                                            "ticks": "",
                                            "outlinewidth": 0
                                        }
                                    }
                                }
                            ],
                            "scatterpolargl": [
                                {
                                    "type": "scatterpolargl",
                                    "marker": {
                                        "colorbar": {
                                            "ticks": "",
                                            "outlinewidth": 0
                                        }
                                    }
                                }
                            ],
                            "scatterternary": [
                                {
                                    "type": "scatterternary",
                                    "marker": {
                                        "colorbar": {
                                            "ticks": "",
                                            "outlinewidth": 0
                                        }
                                    }
                                }
                            ],
                            "histogram2dcontour": [
                                {
                                    "type": "histogram2dcontour",
                                    "colorbar": {
                                        "ticks": "",
                                        "outlinewidth": 0
                                    },
                                    "autocolorscale": true
                                }
                            ]
                        },
                        "layout": {
                            "geo": {
                                "bgcolor": "white",
                                "showland": true,
                                "lakecolor": "white",
                                "landcolor": "white",
                                "showlakes": true,
                                "subunitcolor": "#C8D4E3"
                            },
                            "font": {
                                "color": "#2a3f5f"
                            },
                            "polar": {
                                "bgcolor": "white",
                                "radialaxis": {
                                    "ticks": "",
                                    "gridcolor": "#EBF0F8",
                                    "linecolor": "#EBF0F8"
                                },
                                "angularaxis": {
                                    "ticks": "",
                                    "gridcolor": "#EBF0F8",
                                    "linecolor": "#EBF0F8"
                                }
                            },
                            "scene": {
                                "xaxis": {
                                    "ticks": "",
                                    "gridcolor": "#DFE8F3",
                                    "gridwidth": 2,
                                    "linecolor": "#EBF0F8",
                                    "zerolinecolor": "#EBF0F8",
                                    "showbackground": true,
                                    "backgroundcolor": "white"
                                },
                                "yaxis": {
                                    "ticks": "",
                                    "gridcolor": "#DFE8F3",
                                    "gridwidth": 2,
                                    "linecolor": "#EBF0F8",
                                    "zerolinecolor": "#EBF0F8",
                                    "showbackground": true,
                                    "backgroundcolor": "white"
                                },
                                "zaxis": {
                                    "ticks": "",
                                    "gridcolor": "#DFE8F3",
                                    "gridwidth": 2,
                                    "linecolor": "#EBF0F8",
                                    "zerolinecolor": "#EBF0F8",
                                    "showbackground": true,
                                    "backgroundcolor": "white"
                                }
                            },
                            "title": {
                                "x": 0.05
                            },
                            "xaxis": {
                                "ticks": "",
                                "gridcolor": "#EBF0F8",
                                "linecolor": "#EBF0F8",
                                "automargin": true,
                                "zerolinecolor": "#EBF0F8",
                                "zerolinewidth": 2
                            },
                            "yaxis": {
                                "ticks": "",
                                "gridcolor": "#EBF0F8",
                                "linecolor": "#EBF0F8",
                                "automargin": true,
                                "zerolinecolor": "#EBF0F8",
                                "zerolinewidth": 2
                            },
                            "ternary": {
                                "aaxis": {
                                    "ticks": "",
                                    "gridcolor": "#DFE8F3",
                                    "linecolor": "#A2B1C6"
                                },
                                "baxis": {
                                    "ticks": "",
                                    "gridcolor": "#DFE8F3",
                                    "linecolor": "#A2B1C6"
                                },
                                "caxis": {
                                    "ticks": "",
                                    "gridcolor": "#DFE8F3",
                                    "linecolor": "#A2B1C6"
                                },
                                "bgcolor": "white"
                            },
                            "colorway": [
                                "#636efa",
                                "#EF553B",
                                "#00cc96",
                                "#ab63fa",
                                "#19d3f3",
                                "#e763fa",
                                "#fecb52",
                                "#ffa15a",
                                "#ff6692",
                                "#b6e880"
                            ],
                            "hovermode": "closest",
                            "colorscale": {
                                "diverging": [
                                    [
                                        0,
                                        "#8e0152"
                                    ],
                                    [
                                        0.1,
                                        "#c51b7d"
                                    ],
                                    [
                                        0.2,
                                        "#de77ae"
                                    ],
                                    [
                                        0.3,
                                        "#f1b6da"
                                    ],
                                    [
                                        0.4,
                                        "#fde0ef"
                                    ],
                                    [
                                        0.5,
                                        "#f7f7f7"
                                    ],
                                    [
                                        0.6,
                                        "#e6f5d0"
                                    ],
                                    [
                                        0.7,
                                        "#b8e186"
                                    ],
                                    [
                                        0.8,
                                        "#7fbc41"
                                    ],
                                    [
                                        0.9,
                                        "#4d9221"
                                    ],
                                    [
                                        1,
                                        "#276419"
                                    ]
                                ],
                                "sequential": [
                                    [
                                        0,
                                        "#0508b8"
                                    ],
                                    [
                                        0.0893854748603352,
                                        "#1910d8"
                                    ],
                                    [
                                        0.1787709497206704,
                                        "#3c19f0"
                                    ],
                                    [
                                        0.2681564245810056,
                                        "#6b1cfb"
                                    ],
                                    [
                                        0.3575418994413408,
                                        "#981cfd"
                                    ],
                                    [
                                        0.44692737430167595,
                                        "#bf1cfd"
                                    ],
                                    [
                                        0.5363128491620112,
                                        "#dd2bfd"
                                    ],
                                    [
                                        0.6256983240223464,
                                        "#f246fe"
                                    ],
                                    [
                                        0.7150837988826816,
                                        "#fc67fd"
                                    ],
                                    [
                                        0.8044692737430168,
                                        "#fe88fc"
                                    ],
                                    [
                                        0.8938547486033519,
                                        "#fea5fd"
                                    ],
                                    [
                                        0.9832402234636871,
                                        "#febefe"
                                    ],
                                    [
                                        1,
                                        "#fec3fe"
                                    ]
                                ],
                                "sequentialminus": [
                                    [
                                        0,
                                        "#0508b8"
                                    ],
                                    [
                                        0.0893854748603352,
                                        "#1910d8"
                                    ],
                                    [
                                        0.1787709497206704,
                                        "#3c19f0"
                                    ],
                                    [
                                        0.2681564245810056,
                                        "#6b1cfb"
                                    ],
                                    [
                                        0.3575418994413408,
                                        "#981cfd"
                                    ],
                                    [
                                        0.44692737430167595,
                                        "#bf1cfd"
                                    ],
                                    [
                                        0.5363128491620112,
                                        "#dd2bfd"
                                    ],
                                    [
                                        0.6256983240223464,
                                        "#f246fe"
                                    ],
                                    [
                                        0.7150837988826816,
                                        "#fc67fd"
                                    ],
                                    [
                                        0.8044692737430168,
                                        "#fe88fc"
                                    ],
                                    [
                                        0.8938547486033519,
                                        "#fea5fd"
                                    ],
                                    [
                                        0.9832402234636871,
                                        "#febefe"
                                    ],
                                    [
                                        1,
                                        "#fec3fe"
                                    ]
                                ]
                            },
                            "plot_bgcolor": "white",
                            "paper_bgcolor": "white",
                            "shapedefaults": {
                                "line": {
                                    "width": 0
                                },
                                "opacity": 0.4,
                                "fillcolor": "#506784"
                            },
                            "annotationdefaults": {
                                "arrowhead": 0,
                                "arrowcolor": "#506784",
                                "arrowwidth": 1
                            }
                        },
                        "themeRef": "PLOTLY_WHITE"
                    }
                }
            },
            "height": null,
            "width": null,
            "user": {
                "profile_url": "https://chart-studio.plotly.com/~Camila.Siqueira",
                "avatar_url": "https://storage.googleapis.com/plotly-prod-profiles/75.jpg",
                "background_url": "https://storage.googleapis.com/plotly-prod-profiles/bg-14.jpg",
                "bio": "",
                "nickname": "",
                "website": "",
                "stream_tokens": null,
                "feature_set_id": null,
                "csrf_token": null,
                "date_joined": "2025-07-29 13:57:56",
                "mapbox_access_tokens": null,
                "has_password": null,
                "username": "Camila.Siqueira",
                "email": null,
                "is_active": null,
                "readonly": null,
                "is_dash_creator": null,
                "dash_created_count": null,
                "is_chart_creator": null,
                "charts_created_count": null
            }
        }
    ]
}