Plots List
Plots
This endpoint handles manipulation of Plotly plot files.
Reference
Authorization
Any user with or without a Plotly account may view public plots. For private plots, see authentication.
Actions
list
Listing all public plots can be done via a GET request to this endpoint.
By default, plots will be listed in order of date created. The order_by
query parameter is accepted at this endpoint. Currently, only ordering by
views is supported. It is possible to filter the plots by quality
with min_quality or max_quality as query parameter.
Example:
// GET https://api.plotly.com/v2/plots/ ---> 200

// GET https://api.plotly.com/v2/plots/?order_by=-views ---> 200

// GET https://api.plotly.com/v2/plots/?min_quality=5 ---> 200

// GET https://api.plotly.com/v2/plots/?max_quality=5 ---> 200
feed
Listing all handpicked feed plots can be done via a GET request to this endpoint. By default, plots will be listed in a random order.
Example:
// GET https://api.plotly.com/v2/plots/feed ---> 200
create
You can create new plot resources here. The only required field is 'figure'. Currently, the figure is restricted to only contain references to grid data. That is, this will fail if raw data arrays are passed in. To create and manipulate underlying grids for plots, see the grids endpoint.
Example:
// This fails because a figure field is required.
// POST https://api.plotly.com/v2/plots ---> 400 Bad Request
{}

// This fails because the figure has raw data
//POST https://api.plotly.com/v2/plots ---> 400 Bad Request
{
    "figure": {"data": [{"y": ['this', 'is', 'raw', 'data']}]}
}

// This succeeds because the figure has src keys, not raw data.
//POST https://api.plotly.com/v2/plots ---> 200 OK
{
    "figure": {"data": [{"ysrc": "sven:88:u8nd62"}]}
}
When creating a grid, you can optionally specify a source_fid to specify where a plot has come from:
- source_fid: the fid of a plot that was copied (and presumably edited) to produce this one
detail
There is a lot of meta information stored about plot files including filename, title, share_url, and content_url to name a few.
This information can only be reached with a GET to this endpoint.
Example:
// GET https://api.plotly.com/v2/plots/iheartgraphs:90
content
The contents of a plot can be downloaded via the content resource. The plot
content contains referenced grid/column data by default. If you wish to
return the raw grid/column data, the inline_data=true query must be included
in the request url. The Content-Type header will be appropriately set for the
response body.
Alternatively, you can set ?map_data=unreadable to append a mapping of
sources to data that belongs to grids which are unreadable for the
requestor. This is useful when you have read access to another users plot,
but that plot contains grid references which you don't have access to.
Examples:
// Returns referenced grid/column data
// GET https://api.plotly.com/v2/plots/iheartgraphs:90/content ---> 200 OK

// Returns full grid/column data
// GET https://api.plotly.com/v2/plots/iheartgraphs:90/content?inline_data=true ---> 200 OK

// Returns full grid/column data when requestor doesn't have permission
// to read the referenced grid.
// GET https://api.plotly.com/v2/plots/iheartgraphs:90/content?map_data=unreadable ---> 200 OK
GET /v2/plots?cursor=cD0yMDI1LTA4LTA3KzEzJTNBMzAlM0E1OS41MDE1NDQlMkIwMCUzQTAw&format=api
{ "next": "https://api.plotly.com/v2/plots?cursor=cD0yMDI1LTA4LTA3KzA3JTNBNDclM0ExMi4wMzQ0MDklMkIwMCUzQTAw&format=api", "previous": "https://api.plotly.com/v2/plots?cursor=cj0xJnA9MjAyNS0wOC0wNysxMiUzQTQ4JTNBNTAuMTgxOTk3JTJCMDAlM0EwMA%3D%3D&format=api", "results": [ { "creation_time": "2025-08-07T12:48:50.181997Z", "comments": { "results": [], "count": 0 }, "parented": true, "embed_url": "https://chart-studio.plotly.com/~KoenGeurts/5.embed", "fid": "KoenGeurts:5", "filename": "GSPC_dashboard", "filetype": "plot", "img_url": "https://api.plotly.com/v2/files/KoenGeurts:5/image?image_name=list-thumb", "image_urls": { "default": "https://api.plotly.com/v2/files/KoenGeurts:5/image?image_name=default", "block-thumb": "https://api.plotly.com/v2/files/KoenGeurts:5/image?image_name=block-thumb", "list-thumb": "https://api.plotly.com/v2/files/KoenGeurts:5/image?image_name=list-thumb" }, "api_urls": { "files": "https://api.plotly.com/v2/files/KoenGeurts:5", "plots": "https://api.plotly.com/v2/plots/KoenGeurts:5", "parent": "https://api.plotly.com/v2/folders/home?user=KoenGeurts" }, "owner": "KoenGeurts", "parent": -1, "preview": "", "referencers": [], "references": [], "title": "", "views": 39, "web_url": "https://chart-studio.plotly.com/~KoenGeurts/5/", "world_readable": true, "date_modified": "2025-08-25T05:16:29.045Z", "stars": { "results": [], "count": 0 }, "collaborators": { "results": [], "count": 0 }, "subfolder_count": null, "refresh_interval": null, "organize_view_url": "https://chart-studio.plotly.com/~KoenGeurts/5/", "current_user_permission": "read", "is_theme": null, "is_template": null, "autosize": true, "caption": "", "figure": { "data": [ { "name": "14/07/2025", "type": "bar", "xsrc": "KoenGeurts:25:1f5612", "ysrc": "KoenGeurts:25:a80950", "width": 0.04, "xaxis": "x", "yaxis": "y", "marker": { "color": "gray" }, "opacity": 0.005172413793103448, "showlegend": false }, { "name": "15/07/2025", "type": "bar", "xsrc": "KoenGeurts:25:9101a0", "ysrc": "KoenGeurts:25:7e9e44", "width": 0.04, "xaxis": "x", "yaxis": "y", "marker": { "color": "gray" }, "opacity": 0.018965517241379314, "showlegend": false }, { "name": "16/07/2025", "type": "bar", "xsrc": "KoenGeurts:25:c8dcf7", "ysrc": "KoenGeurts:25:958173", "width": 0.04, "xaxis": "x", "yaxis": "y", "marker": { "color": "gray" }, "opacity": 0.032758620689655175, "showlegend": false }, { "name": "17/07/2025", "type": "bar", "xsrc": "KoenGeurts:25:88a5ef", "ysrc": "KoenGeurts:25:fd87e6", "width": 0.04, "xaxis": "x", "yaxis": "y", "marker": { "color": "gray" }, "opacity": 0.04655172413793104, "showlegend": false }, { "name": "18/07/2025", "type": "bar", "xsrc": "KoenGeurts:25:e62510", "ysrc": "KoenGeurts:25:a16097", "width": 0.04, "xaxis": "x", "yaxis": "y", "marker": { "color": "gray" }, "opacity": 0.0603448275862069, "showlegend": false }, { "name": "21/07/2025", "type": "bar", "xsrc": "KoenGeurts:25:004606", "ysrc": "KoenGeurts:25:2008bc", "width": 0.04, "xaxis": "x", "yaxis": "y", "marker": { "color": "gray" }, "opacity": 0.07413793103448275, "showlegend": false }, { "name": "22/07/2025", "type": "bar", "xsrc": "KoenGeurts:25:c111e2", "ysrc": "KoenGeurts:25:f031d9", "width": 0.04, "xaxis": "x", "yaxis": "y", "marker": { "color": "gray" }, "opacity": 0.08793103448275863, "showlegend": false }, { "name": "23/07/2025", "type": "bar", "xsrc": "KoenGeurts:25:e9903f", "ysrc": "KoenGeurts:25:9a7dde", "width": 0.04, "xaxis": "x", "yaxis": "y", "marker": { "color": "gray" }, "opacity": 0.10172413793103449, "showlegend": false }, { "name": "24/07/2025", "type": "bar", "xsrc": "KoenGeurts:25:33d874", "ysrc": "KoenGeurts:25:8af030", "width": 0.04, "xaxis": "x", "yaxis": "y", "marker": { "color": "gray" }, "opacity": 0.11551724137931035, "showlegend": false }, { "name": "25/07/2025", "type": "bar", "xsrc": "KoenGeurts:25:c82c44", "ysrc": "KoenGeurts:25:1dcca8", "width": 0.04, "xaxis": "x", "yaxis": "y", "marker": { "color": "gray" }, "opacity": 0.12931034482758622, "showlegend": false }, { "name": "28/07/2025", "type": "bar", "xsrc": "KoenGeurts:25:c441e8", "ysrc": "KoenGeurts:25:a855f3", "width": 0.04, "xaxis": "x", "yaxis": "y", "marker": { "color": "gray" }, "opacity": 0.14310344827586208, "showlegend": false }, { "name": "29/07/2025", "type": "bar", "xsrc": "KoenGeurts:25:1bda59", "ysrc": "KoenGeurts:25:67c52e", "width": 0.04, "xaxis": "x", "yaxis": "y", "marker": { "color": "gray" }, "opacity": 0.15689655172413797, "showlegend": false }, { "name": "30/07/2025", "type": "bar", "xsrc": "KoenGeurts:25:65c0d9", "ysrc": "KoenGeurts:25:a87a49", "width": 0.04, "xaxis": "x", "yaxis": "y", "marker": { "color": "gray" }, "opacity": 0.17068965517241383, "showlegend": false }, { "name": "31/07/2025", "type": "bar", "xsrc": "KoenGeurts:25:6126f9", "ysrc": "KoenGeurts:25:804fd5", "width": 0.04, "xaxis": "x", "yaxis": "y", "marker": { "color": "gray" }, "opacity": 0.18448275862068966, "showlegend": false }, { "name": "01/08/2025", "type": "bar", "xsrc": "KoenGeurts:25:76c292", "ysrc": "KoenGeurts:25:7bb471", "width": 0.04, "xaxis": "x", "yaxis": "y", "marker": { "color": "gray" }, "opacity": 0.19827586206896555, "showlegend": false }, { "name": "04/08/2025", "type": "bar", "xsrc": "KoenGeurts:25:c7fbe8", "ysrc": "KoenGeurts:25:11be88", "width": 0.04, "xaxis": "x", "yaxis": "y", "marker": { "color": "gray" }, "opacity": 0.2120689655172414, "showlegend": false }, { "name": "05/08/2025", "type": "bar", "xsrc": "KoenGeurts:25:984c09", "ysrc": "KoenGeurts:25:5e83cb", "width": 0.04, "xaxis": "x", "yaxis": "y", "marker": { "color": "gray" }, "opacity": 0.22586206896551728, "showlegend": false }, { "name": "06/08/2025", "type": "bar", "xsrc": "KoenGeurts:25:925ea8", "ysrc": "KoenGeurts:25:cfe973", "width": 0.04, "xaxis": "x", "yaxis": "y", "marker": { "color": "gray" }, "opacity": 0.23965517241379314, "showlegend": false }, { "name": "07/08/2025", "type": "bar", "xsrc": "KoenGeurts:25:d39883", "ysrc": "KoenGeurts:25:3c2471", "width": 0.04, "xaxis": "x", "yaxis": "y", "marker": { "color": "gray" }, "opacity": 0.253448275862069, "showlegend": false }, { "name": "08/08/2025", "type": "bar", "xsrc": "KoenGeurts:25:5a9ea9", "ysrc": "KoenGeurts:25:63fb25", "width": 0.04, "xaxis": "x", "yaxis": "y", "marker": { "color": "gray" }, "opacity": 0.26724137931034486, "showlegend": false }, { "name": "11/08/2025", "type": "bar", "xsrc": "KoenGeurts:25:de1edd", "ysrc": "KoenGeurts:25:875fa1", "width": 0.04, "xaxis": "x", "yaxis": "y", "marker": { "color": "gray" }, "opacity": 0.2810344827586207, "showlegend": false }, { "name": "12/08/2025", "type": "bar", "xsrc": "KoenGeurts:25:ff87d0", "ysrc": "KoenGeurts:25:9d55a9", "width": 0.04, "xaxis": "x", "yaxis": "y", "marker": { "color": "gray" }, "opacity": 0.2948275862068966, "showlegend": false }, { "name": "13/08/2025", "type": "bar", "xsrc": "KoenGeurts:25:57633b", "ysrc": "KoenGeurts:25:501e27", "width": 0.04, "xaxis": "x", "yaxis": "y", "marker": { "color": "gray" }, "opacity": 0.3086206896551725, "showlegend": false }, { "name": "14/08/2025", "type": "bar", "xsrc": "KoenGeurts:25:f7def4", "ysrc": "KoenGeurts:25:e0799c", "width": 0.04, "xaxis": "x", "yaxis": "y", "marker": { "color": "gray" }, "opacity": 0.3224137931034483, "showlegend": false }, { "name": "15/08/2025", "type": "bar", "xsrc": "KoenGeurts:25:292592", "ysrc": "KoenGeurts:25:78ed7e", "width": 0.04, "xaxis": "x", "yaxis": "y", "marker": { "color": "gray" }, "opacity": 0.3362068965517242, "showlegend": false }, { "name": "18/08/2025", "type": "bar", "xsrc": "KoenGeurts:25:939e6e", "ysrc": "KoenGeurts:25:18921d", "width": 0.04, "xaxis": "x", "yaxis": "y", "marker": { "color": "gray" }, "opacity": 0.35000000000000003, "showlegend": false }, { "name": "19/08/2025", "type": "bar", "xsrc": "KoenGeurts:25:463c1b", "ysrc": "KoenGeurts:25:d4de8d", "width": 0.04, "xaxis": "x", "yaxis": "y", "marker": { "color": "gray" }, "opacity": 0.36379310344827587, "showlegend": false }, { "name": "20/08/2025", "type": "bar", "xsrc": "KoenGeurts:25:ef449a", "ysrc": "KoenGeurts:25:e18e00", "width": 0.04, "xaxis": "x", "yaxis": "y", "marker": { "color": "gray" }, "opacity": 0.37758620689655176, "showlegend": false }, { "name": "21/08/2025", "type": "bar", "xsrc": "KoenGeurts:25:620785", "ysrc": "KoenGeurts:25:024422", "width": 0.04, "xaxis": "x", "yaxis": "y", "marker": { "color": "gray" }, "opacity": 0.39137931034482765, "showlegend": false }, { "name": "22/08/2025", "type": "bar", "xsrc": "KoenGeurts:25:d07134", "ysrc": "KoenGeurts:25:50e78d", "width": 0.04, "xaxis": "x", "yaxis": "y", "marker": { "cmax": 1.5, "cmin": -1.7, "colorbar": { "x": -0.2, "title": { "text": "Sentiment" }, "ticktextsrc": "KoenGeurts:25:4bccb2", "tickvalssrc": "KoenGeurts:25:14a483" }, "colorsrc": "KoenGeurts:25:6534e8", "colorscale": [ [ 0.0, "rgb(165,0,38)" ], [ 0.1, "rgb(215,48,39)" ], [ 0.2, "rgb(244,109,67)" ], [ 0.3, "rgb(253,174,97)" ], [ 0.4, "rgb(254,224,139)" ], [ 0.5, "rgb(255,255,191)" ], [ 0.6, "rgb(217,239,139)" ], [ 0.7, "rgb(166,217,106)" ], [ 0.8, "rgb(102,189,99)" ], [ 0.9, "rgb(26,152,80)" ], [ 1.0, "rgb(0,104,55)" ] ] }, "opacity": 1, "showlegend": false }, { "name": "sentiment", "type": "scatter", "xsrc": "KoenGeurts:25:c5850b", "ysrc": "KoenGeurts:25:bae964", "xaxis": "x2", "yaxis": "y2", "marker": { "color": "blue" }, "opacity": 0.7 }, { "name": "close", "type": "scatter", "xsrc": "KoenGeurts:25:a4bcd7", "ysrc": "KoenGeurts:25:6492eb", "xaxis": "x2", "yaxis": "y2", "marker": { "color": "gray" } } ], "layout": { "xaxis": { "range": [ -3, 2 ], "anchor": "y", "domain": [ 0.0, 1.0 ], "ticktext": [ "bear", "-0.4", "neutral", "0.4", "bull" ], "tickvals": [ -1, -0.4, 0, 0.4, 1 ] }, "yaxis": { "range": [ 0, 1 ], "anchor": "x", "domain": [ 0.55, 1.0 ], "showticklabels": false }, "legend": { "x": 1.02, "y": 0.45, "xanchor": "left", "yanchor": "middle", "orientation": "v" }, "shapes": [ { "x0": 0.4, "x1": 0.4, "y0": 0, "y1": 1, "line": { "dash": "dash", "color": "black", "width": 1 }, "type": "line", "xref": "x", "yref": "y domain" }, { "x0": -0.4, "x1": -0.4, "y0": 0, "y1": 1, "line": { "dash": "dash", "color": "black", "width": 1 }, "type": "line", "xref": "x", "yref": "y domain" }, { "x0": 0, "x1": 1, "y0": 0.4, "y1": 0.4, "line": { "dash": "dash", "color": "black", "width": 1 }, "type": "line", "xref": "x2 domain", "yref": "y2" }, { "x0": 0, "x1": 1, "y0": -0.4, "y1": -0.4, "line": { "dash": "dash", "color": "black", "width": 1 }, "type": "line", "xref": "x2 domain", "yref": "y2" } ], "xaxis2": { "anchor": "y2", "domain": [ 0.0, 1.0 ], "showticklabels": true }, "yaxis2": { "anchor": "x2", "domain": [ 0.0, 0.45 ] }, "template": { "data": { "bar": [ { "type": "bar", "marker": { "line": { "color": "#E5ECF6", "width": 0.5 }, "pattern": { "size": 10, "fillmode": "overlay", "solidity": 0.2 } }, "error_x": { "color": "#2a3f5f" }, "error_y": { "color": "#2a3f5f" } } ], "pie": [ { "type": "pie", "automargin": true } ], "table": [ { "type": "table", "cells": { "fill": { "color": "#EBF0F8" }, "line": { "color": "white" } }, "header": { "fill": { "color": "#C8D4E3" }, "line": { "color": "white" } } } ], "carpet": [ { "type": "carpet", "aaxis": { "gridcolor": "white", "linecolor": "white", "endlinecolor": "#2a3f5f", "minorgridcolor": "white", "startlinecolor": "#2a3f5f" }, "baxis": { "gridcolor": "white", "linecolor": "white", "endlinecolor": "#2a3f5f", "minorgridcolor": "white", "startlinecolor": "#2a3f5f" } } ], "mesh3d": [ { "type": "mesh3d", "colorbar": { "ticks": "", "outlinewidth": 0 } } ], "contour": [ { "type": "contour", "colorbar": { "ticks": "", "outlinewidth": 0 }, "colorscale": [ [ 0.0, "#0d0887" ], [ 0.1111111111111111, "#46039f" ], [ 0.2222222222222222, "#7201a8" ], [ 0.3333333333333333, "#9c179e" ], [ 0.4444444444444444, "#bd3786" ], [ 0.5555555555555556, "#d8576b" ], [ 0.6666666666666666, "#ed7953" ], [ 0.7777777777777778, "#fb9f3a" ], [ 0.8888888888888888, "#fdca26" ], [ 1.0, "#f0f921" ] ] } ], "heatmap": [ { "type": "heatmap", "colorbar": { "ticks": "", "outlinewidth": 0 }, "colorscale": [ [ 0.0, "#0d0887" ], [ 0.1111111111111111, "#46039f" ], [ 0.2222222222222222, "#7201a8" ], [ 0.3333333333333333, "#9c179e" ], [ 0.4444444444444444, "#bd3786" ], [ 0.5555555555555556, "#d8576b" ], [ 0.6666666666666666, "#ed7953" ], [ 0.7777777777777778, "#fb9f3a" ], [ 0.8888888888888888, "#fdca26" ], [ 1.0, "#f0f921" ] ] } ], "scatter": [ { "type": "scatter", "fillpattern": { "size": 10, "fillmode": "overlay", "solidity": 0.2 } } ], "surface": [ { "type": "surface", "colorbar": { "ticks": "", "outlinewidth": 0 }, "colorscale": [ [ 0.0, "#0d0887" ], [ 0.1111111111111111, "#46039f" ], [ 0.2222222222222222, "#7201a8" ], [ 0.3333333333333333, "#9c179e" ], [ 0.4444444444444444, "#bd3786" ], [ 0.5555555555555556, "#d8576b" ], [ 0.6666666666666666, "#ed7953" ], [ 0.7777777777777778, "#fb9f3a" ], [ 0.8888888888888888, "#fdca26" ], [ 1.0, "#f0f921" ] ] } ], "barpolar": [ { "type": "barpolar", "marker": { "line": { "color": "#E5ECF6", "width": 0.5 }, "pattern": { "size": 10, "fillmode": "overlay", "solidity": 0.2 } } } ], "heatmapgl": [ { "type": "heatmapgl", "colorbar": { "ticks": "", "outlinewidth": 0 }, "colorscale": [ [ 0.0, "#0d0887" ], [ 0.1111111111111111, "#46039f" ], [ 0.2222222222222222, "#7201a8" ], [ 0.3333333333333333, "#9c179e" ], [ 0.4444444444444444, "#bd3786" ], [ 0.5555555555555556, "#d8576b" ], [ 0.6666666666666666, "#ed7953" ], [ 0.7777777777777778, "#fb9f3a" ], [ 0.8888888888888888, "#fdca26" ], [ 1.0, "#f0f921" ] ] } ], "histogram": [ { "type": "histogram", "marker": { "pattern": { "size": 10, "fillmode": "overlay", "solidity": 0.2 } } } ], "parcoords": [ { "line": { "colorbar": { "ticks": "", "outlinewidth": 0 } }, "type": "parcoords" } ], "scatter3d": [ { "line": { "colorbar": { "ticks": "", "outlinewidth": 0 } }, "type": "scatter3d", "marker": { "colorbar": { "ticks": "", "outlinewidth": 0 } } } ], "scattergl": [ { "type": "scattergl", "marker": { "colorbar": { "ticks": "", "outlinewidth": 0 } } } ], "choropleth": [ { "type": "choropleth", "colorbar": { "ticks": "", "outlinewidth": 0 } } ], "scattergeo": [ { "type": "scattergeo", "marker": { "colorbar": { "ticks": "", "outlinewidth": 0 } } } ], "histogram2d": [ { "type": "histogram2d", "colorbar": { "ticks": "", "outlinewidth": 0 }, "colorscale": [ [ 0.0, "#0d0887" ], [ 0.1111111111111111, "#46039f" ], [ 0.2222222222222222, "#7201a8" ], [ 0.3333333333333333, "#9c179e" ], [ 0.4444444444444444, "#bd3786" ], [ 0.5555555555555556, "#d8576b" ], [ 0.6666666666666666, "#ed7953" ], [ 0.7777777777777778, "#fb9f3a" ], [ 0.8888888888888888, "#fdca26" ], [ 1.0, "#f0f921" ] ] } ], "scatterpolar": [ { "type": "scatterpolar", "marker": { "colorbar": { "ticks": "", "outlinewidth": 0 } } } ], "contourcarpet": [ { "type": "contourcarpet", "colorbar": { "ticks": "", "outlinewidth": 0 } } ], "scattercarpet": [ { "type": "scattercarpet", "marker": { "colorbar": { "ticks": "", "outlinewidth": 0 } } } ], "scattermapbox": [ { "type": "scattermapbox", "marker": { "colorbar": { "ticks": "", "outlinewidth": 0 } } } ], "scatterpolargl": [ { "type": "scatterpolargl", "marker": { "colorbar": { "ticks": "", "outlinewidth": 0 } } } ], "scatterternary": [ { "type": "scatterternary", "marker": { "colorbar": { "ticks": "", "outlinewidth": 0 } } } ], "histogram2dcontour": [ { "type": "histogram2dcontour", "colorbar": { "ticks": "", "outlinewidth": 0 }, "colorscale": [ [ 0.0, "#0d0887" ], [ 0.1111111111111111, "#46039f" ], [ 0.2222222222222222, "#7201a8" ], [ 0.3333333333333333, "#9c179e" ], [ 0.4444444444444444, "#bd3786" ], [ 0.5555555555555556, "#d8576b" ], [ 0.6666666666666666, "#ed7953" ], [ 0.7777777777777778, "#fb9f3a" ], [ 0.8888888888888888, "#fdca26" ], [ 1.0, "#f0f921" ] ] } ] }, "layout": { "geo": { "bgcolor": "white", "showland": true, "lakecolor": "white", "landcolor": "#E5ECF6", "showlakes": true, "subunitcolor": "white" }, "font": { "color": "#2a3f5f" }, "polar": { "bgcolor": "#E5ECF6", "radialaxis": { "ticks": "", "gridcolor": "white", "linecolor": "white" }, "angularaxis": { "ticks": "", "gridcolor": "white", "linecolor": "white" } }, "scene": { "xaxis": { "ticks": "", "gridcolor": "white", "gridwidth": 2, "linecolor": "white", "zerolinecolor": "white", "showbackground": true, "backgroundcolor": "#E5ECF6" }, "yaxis": { "ticks": "", "gridcolor": "white", "gridwidth": 2, "linecolor": "white", "zerolinecolor": "white", "showbackground": true, "backgroundcolor": "#E5ECF6" }, "zaxis": { "ticks": "", "gridcolor": "white", "gridwidth": 2, "linecolor": "white", "zerolinecolor": "white", "showbackground": true, "backgroundcolor": "#E5ECF6" } }, "title": { "x": 0.05 }, "xaxis": { "ticks": "", "title": { "standoff": 15 }, "gridcolor": "white", "linecolor": "white", "automargin": true, "zerolinecolor": "white", "zerolinewidth": 2 }, "yaxis": { "ticks": "", "title": { "standoff": 15 }, "gridcolor": "white", "linecolor": "white", "automargin": true, "zerolinecolor": "white", "zerolinewidth": 2 }, "mapbox": { "style": "light" }, "ternary": { "aaxis": { "ticks": "", "gridcolor": "white", "linecolor": "white" }, "baxis": { "ticks": "", "gridcolor": "white", "linecolor": "white" }, "caxis": { "ticks": "", "gridcolor": "white", "linecolor": "white" }, "bgcolor": "#E5ECF6" }, "colorway": [ "#636efa", "#EF553B", "#00cc96", "#ab63fa", "#FFA15A", "#19d3f3", "#FF6692", "#B6E880", "#FF97FF", "#FECB52" ], "coloraxis": { "colorbar": { "ticks": "", "outlinewidth": 0 } }, "hovermode": "closest", "colorscale": { "diverging": [ [ 0, "#8e0152" ], [ 0.1, "#c51b7d" ], [ 0.2, "#de77ae" ], [ 0.3, "#f1b6da" ], [ 0.4, "#fde0ef" ], [ 0.5, "#f7f7f7" ], [ 0.6, "#e6f5d0" ], [ 0.7, "#b8e186" ], [ 0.8, "#7fbc41" ], [ 0.9, "#4d9221" ], [ 1, "#276419" ] ], "sequential": [ [ 0.0, "#0d0887" ], [ 0.1111111111111111, "#46039f" ], [ 0.2222222222222222, "#7201a8" ], [ 0.3333333333333333, "#9c179e" ], [ 0.4444444444444444, "#bd3786" ], [ 0.5555555555555556, "#d8576b" ], [ 0.6666666666666666, "#ed7953" ], [ 0.7777777777777778, "#fb9f3a" ], [ 0.8888888888888888, "#fdca26" ], [ 1.0, "#f0f921" ] ], "sequentialminus": [ [ 0.0, "#0d0887" ], [ 0.1111111111111111, "#46039f" ], [ 0.2222222222222222, "#7201a8" ], [ 0.3333333333333333, "#9c179e" ], [ 0.4444444444444444, "#bd3786" ], [ 0.5555555555555556, "#d8576b" ], [ 0.6666666666666666, "#ed7953" ], [ 0.7777777777777778, "#fb9f3a" ], [ 0.8888888888888888, "#fdca26" ], [ 1.0, "#f0f921" ] ] }, "hoverlabel": { "align": "left" }, "plot_bgcolor": "#E5ECF6", "paper_bgcolor": "white", "shapedefaults": { "line": { "color": "#2a3f5f" } }, "autotypenumbers": "strict", "annotationdefaults": { "arrowhead": 0, "arrowcolor": "#2a3f5f", "arrowwidth": 1 } } }, "annotations": [ { "x": 0.5, "y": 1.0, "font": { "size": 16 }, "text": "^GSPC - S&P 500 index - daily sentiment for last 6 weeks - UPDATED: 22/08/2025", "xref": "paper", "yref": "paper", "xanchor": "center", "yanchor": "bottom", "showarrow": false }, { "x": 0.5, "y": 0.45, "font": { "size": 16 }, "text": "closing price and sentiment indicators for last 2 years - UPDATED: 22/08/2025", "xref": "paper", "yref": "paper", "xanchor": "center", "yanchor": "bottom", "showarrow": false } ] } }, "height": null, "width": null, "user": { "profile_url": "https://chart-studio.plotly.com/~KoenGeurts", "avatar_url": "https://storage.googleapis.com/plotly-prod-profiles/86.jpg", "background_url": "https://storage.googleapis.com/plotly-prod-profiles/bg-12.jpg", "bio": "", "nickname": "", "website": "", "stream_tokens": null, "feature_set_id": null, "csrf_token": null, "date_joined": "2025-08-07 09:35:33", "mapbox_access_tokens": null, "has_password": null, "username": "KoenGeurts", "email": null, "is_active": null, "readonly": null, "is_dash_creator": null, "dash_created_count": null, "is_chart_creator": null, "charts_created_count": null } }, { "creation_time": "2025-08-07T12:47:30.714510Z", "comments": { "results": [], "count": 0 }, "parented": true, "embed_url": "https://chart-studio.plotly.com/~ThadLee/214.embed", "fid": "ThadLee:214", "filename": "uvpure", "filetype": "plot", "img_url": "https://api.plotly.com/v2/files/ThadLee:214/image?image_name=list-thumb", "image_urls": { "default": "https://api.plotly.com/v2/files/ThadLee:214/image?image_name=default", "block-thumb": "https://storage.googleapis.com/plotly-prod-images/ThadLee/214/8_9K6JH7OQAHFCR3OMRMZ7AGVF506BN4.png", "list-thumb": "https://api.plotly.com/v2/files/ThadLee:214/image?image_name=list-thumb" }, "api_urls": { "files": "https://api.plotly.com/v2/files/ThadLee:214", "plots": "https://api.plotly.com/v2/plots/ThadLee:214", "parent": "https://api.plotly.com/v2/folders/home?user=ThadLee" }, "owner": "ThadLee", "parent": -1, "preview": "", "referencers": [], "references": [], "title": "", "views": 0, "web_url": "https://chart-studio.plotly.com/~ThadLee/214/", "world_readable": true, "date_modified": "2025-08-18T12:37:08.529Z", "stars": { "results": [], "count": 0 }, "collaborators": { "results": [], "count": 0 }, "subfolder_count": null, "refresh_interval": null, "organize_view_url": "https://chart-studio.plotly.com/~ThadLee/214/", "current_user_permission": "read", "is_theme": null, "is_template": false, "autosize": true, "caption": "", "figure": { "data": [ { "line": { "width": 1 }, "meta": { "columnNames": { "x": "A", "y": "B" } }, "mode": "lines", "name": "MB<sub>initial</sub>", "type": "scatter", "xsrc": "ThadLee:213:b62d5b", "ysrc": "ThadLee:213:ee4033" }, { "line": { "width": 1 }, "meta": { "columnNames": { "x": "A", "y": "C" } }, "mode": "lines", "name": "MB<sub>dark(eq)</sub>", "type": "scatter", "xsrc": "ThadLee:213:b62d5b", "ysrc": "ThadLee:213:33fe49", "visible": true, "stackgroup": null }, { "line": { "width": 1 }, "meta": { "columnNames": { "x": "A", "y": "D" } }, "mode": "lines", "name": "30 min", "type": "scatter", "xsrc": "ThadLee:213:b62d5b", "ysrc": "ThadLee:213:b67b45", "visible": true, "stackgroup": null }, { "line": { "width": 1 }, "meta": { "columnNames": { "x": "A", "y": "E" } }, "mode": "lines", "name": "60 min", "type": "scatter", "xsrc": "ThadLee:213:b62d5b", "ysrc": "ThadLee:213:26bb20", "stackgroup": null }, { "line": { "width": 1 }, "meta": { "columnNames": { "x": "A", "y": "F" } }, "mode": "lines", "name": "90 min", "type": "scatter", "xsrc": "ThadLee:213:b62d5b", "ysrc": "ThadLee:213:9d054a", "stackgroup": null }, { "line": { "width": 1 }, "meta": { "columnNames": { "x": "A", "y": "G" } }, "mode": "lines", "name": "120 min", "type": "scatter", "xsrc": "ThadLee:213:b62d5b", "ysrc": "ThadLee:213:2c201a", "stackgroup": null }, { "line": { "width": 1 }, "meta": { "columnNames": { "x": "A", "y": "H" } }, "mode": "lines", "name": "150 min", "type": "scatter", "xsrc": "ThadLee:213:b62d5b", "ysrc": "ThadLee:213:54af70", "stackgroup": null }, { "line": { "width": 1 }, "meta": { "columnNames": { "x": "A", "y": "I" } }, "mode": "lines", "name": "180 min", "type": "scatter", "xsrc": "ThadLee:213:b62d5b", "ysrc": "ThadLee:213:1d71c5", "stackgroup": null }, { "line": { "width": 1 }, "meta": { "columnNames": { "x": "A", "y": "J" } }, "mode": "lines", "name": "210 min", "type": "scatter", "xsrc": "ThadLee:213:b62d5b", "ysrc": "ThadLee:213:0345ca", "opacity": 0, "showlegend": false, "stackgroup": null }, { "line": { "width": 1 }, "meta": { "columnNames": { "x": "A", "y": "K" } }, "mode": "lines", "name": "240 min", "type": "scatter", "xsrc": "ThadLee:213:b62d5b", "ysrc": "ThadLee:213:e8d656", "opacity": 0, "visible": true, "showlegend": false, "stackgroup": null }, { "mode": "lines", "type": "scatter", "xaxis": "x2", "yaxis": "y2", "stackgroup": null } ], "frames": [], "layout": { "xaxis": { "side": "bottom", "type": "linear", "range": [ 400, 900 ], "ticks": "outside", "title": { "font": { "size": 20 }, "text": "Wavelength (nm) " }, "domain": [ 0, 0.375 ], "mirror": false, "showgrid": false, "showline": true, "tickfont": { "size": 16 }, "zeroline": true, "autorange": false, "gridcolor": "rgb(1, 10, 25)", "linecolor": "rgb(1, 7, 17)", "zerolinecolor": "rgb(0, 6, 15)", "zerolinewidth": 1 }, "yaxis": { "type": "linear", "range": [ 0, 2.4493507777777777 ], "ticks": "inside", "title": { "font": { "size": 20 }, "text": "Absorbance (a.u.)" }, "domain": [ 0, 1 ], "mirror": false, "showgrid": false, "showline": true, "zeroline": true, "autorange": false, "linecolor": "rgb(1, 7, 17)", "zerolinecolor": "rgb(0, 6, 15)", "zerolinewidth": 1, "showticklabels": false }, "legend": { "x": 0.22410532511440037, "y": 0.9768876848985207, "title": { "font": { "size": 1 }, "text": "<br>" }, "valign": "top", "itemsizing": "trace", "borderwidth": 0, "orientation": "v" }, "xaxis2": { "side": "top", "range": [ -1, 6 ], "showgrid": false, "showline": true, "zeroline": false, "autorange": false, "linecolor": "rgb(0, 3, 7)", "overlaying": "x", "showticklabels": false }, "yaxis2": { "side": "right", "range": [ -1, 4 ], "showgrid": false, "showline": true, "zeroline": false, "autorange": true, "linecolor": "rgb(0, 3, 7)", "overlaying": "y", "showticklabels": false }, "autosize": true, "template": { "data": { "bar": [ { "type": "bar", "marker": { "colorbar": { "ticks": "", "outlinewidth": 0 } } } ], "table": [ { "type": "table", "cells": { "fill": { "color": "#EBF0F8" }, "line": { "color": "white" } }, "header": { "fill": { "color": "#C8D4E3" }, "line": { "color": "white" } } } ], "carpet": [ { "type": "carpet", "aaxis": { "gridcolor": "#C8D4E3", "linecolor": "#C8D4E3", "endlinecolor": "#2a3f5f", "minorgridcolor": "#C8D4E3", "startlinecolor": "#2a3f5f" }, "baxis": { "gridcolor": "#C8D4E3", "linecolor": "#C8D4E3", "endlinecolor": "#2a3f5f", "minorgridcolor": "#C8D4E3", "startlinecolor": "#2a3f5f" } } ], "mesh3d": [ { "type": "mesh3d", "colorbar": { "ticks": "", "outlinewidth": 0 } } ], "contour": [ { "type": "contour", "colorbar": { "ticks": "", "outlinewidth": 0 }, "autocolorscale": true } ], "heatmap": [ { "type": "heatmap", "colorbar": { "ticks": "", "outlinewidth": 0 }, "autocolorscale": true } ], "scatter": [ { "type": "scatter", "marker": { "colorbar": { "ticks": "", "outlinewidth": 0 } } } ], "surface": [ { "type": "surface", "colorbar": { "ticks": "", "outlinewidth": 0 } } ], "heatmapgl": [ { "type": "heatmapgl", "colorbar": { "ticks": "", "outlinewidth": 0 } } ], "histogram": [ { "type": "histogram", "marker": { "colorbar": { "ticks": "", "outlinewidth": 0 } } } ], "parcoords": [ { "line": { "colorbar": { "ticks": "", "outlinewidth": 0 } }, "type": "parcoords" } ], "scatter3d": [ { "type": "scatter3d", "marker": { "colorbar": { "ticks": "", "outlinewidth": 0 } } } ], "scattergl": [ { "type": "scattergl", "marker": { "colorbar": { "ticks": "", "outlinewidth": 0 } } } ], "choropleth": [ { "type": "choropleth", "colorbar": { "ticks": "", "outlinewidth": 0 } } ], "scattergeo": [ { "type": "scattergeo", "marker": { "colorbar": { "ticks": "", "outlinewidth": 0 } } } ], "histogram2d": [ { "type": "histogram2d", "colorbar": { "ticks": "", "outlinewidth": 0 }, "autocolorscale": true } ], "scatterpolar": [ { "type": "scatterpolar", "marker": { "colorbar": { "ticks": "", "outlinewidth": 0 } } } ], "contourcarpet": [ { "type": "contourcarpet", "colorbar": { "ticks": "", "outlinewidth": 0 } } ], "scattercarpet": [ { "type": "scattercarpet", "marker": { "colorbar": { "ticks": "", "outlinewidth": 0 } } } ], "scattermapbox": [ { "type": "scattermapbox", "marker": { "colorbar": { "ticks": "", "outlinewidth": 0 } } } ], "scatterpolargl": [ { "type": "scatterpolargl", "marker": { "colorbar": { "ticks": "", "outlinewidth": 0 } } } ], "scatterternary": [ { "type": "scatterternary", "marker": { "colorbar": { "ticks": "", "outlinewidth": 0 } } } ], "histogram2dcontour": [ { "type": "histogram2dcontour", "colorbar": { "ticks": "", "outlinewidth": 0 }, "autocolorscale": true } ] }, "layout": { "geo": { "bgcolor": "white", "showland": true, "lakecolor": "white", "landcolor": "white", "showlakes": true, "subunitcolor": "#C8D4E3" }, "font": { "color": "#2a3f5f" }, "polar": { "bgcolor": "white", "radialaxis": { "ticks": "", "gridcolor": "#EBF0F8", "linecolor": "#EBF0F8" }, "angularaxis": { "ticks": "", "gridcolor": "#EBF0F8", "linecolor": "#EBF0F8" } }, "scene": { "xaxis": { "ticks": "", "gridcolor": "#DFE8F3", "gridwidth": 2, "linecolor": "#EBF0F8", "zerolinecolor": "#EBF0F8", "showbackground": true, "backgroundcolor": "white" }, "yaxis": { "ticks": "", "gridcolor": "#DFE8F3", "gridwidth": 2, "linecolor": "#EBF0F8", "zerolinecolor": "#EBF0F8", "showbackground": true, "backgroundcolor": "white" }, "zaxis": { "ticks": "", "gridcolor": "#DFE8F3", "gridwidth": 2, "linecolor": "#EBF0F8", "zerolinecolor": "#EBF0F8", "showbackground": true, "backgroundcolor": "white" } }, "title": { "x": 0.05 }, "xaxis": { "ticks": "", "gridcolor": "#EBF0F8", "linecolor": "#EBF0F8", "automargin": true, "zerolinecolor": "#EBF0F8", "zerolinewidth": 2 }, "yaxis": { "ticks": "", "gridcolor": "#EBF0F8", "linecolor": "#EBF0F8", "automargin": true, "zerolinecolor": "#EBF0F8", "zerolinewidth": 2 }, "ternary": { "aaxis": { "ticks": "", "gridcolor": "#DFE8F3", "linecolor": "#A2B1C6" }, "baxis": { "ticks": "", "gridcolor": "#DFE8F3", "linecolor": "#A2B1C6" }, "caxis": { "ticks": "", "gridcolor": "#DFE8F3", "linecolor": "#A2B1C6" }, "bgcolor": "white" }, "colorway": [ "#636efa", "#EF553B", "#00cc96", "#ab63fa", "#19d3f3", "#e763fa", "#fecb52", "#ffa15a", "#ff6692", "#b6e880" ], "hovermode": "closest", "colorscale": { "diverging": [ [ 0, "#8e0152" ], [ 0.1, "#c51b7d" ], [ 0.2, "#de77ae" ], [ 0.3, "#f1b6da" ], [ 0.4, "#fde0ef" ], [ 0.5, "#f7f7f7" ], [ 0.6, "#e6f5d0" ], [ 0.7, "#b8e186" ], [ 0.8, "#7fbc41" ], [ 0.9, "#4d9221" ], [ 1, "#276419" ] ], "sequential": [ [ 0, "#0508b8" ], [ 0.0893854748603352, "#1910d8" ], [ 0.1787709497206704, "#3c19f0" ], [ 0.2681564245810056, "#6b1cfb" ], [ 0.3575418994413408, "#981cfd" ], [ 0.44692737430167595, "#bf1cfd" ], [ 0.5363128491620112, "#dd2bfd" ], [ 0.6256983240223464, "#f246fe" ], [ 0.7150837988826816, "#fc67fd" ], [ 0.8044692737430168, "#fe88fc" ], [ 0.8938547486033519, "#fea5fd" ], [ 0.9832402234636871, "#febefe" ], [ 1, "#fec3fe" ] ], "sequentialminus": [ [ 0, "#0508b8" ], [ 0.0893854748603352, "#1910d8" ], [ 0.1787709497206704, "#3c19f0" ], [ 0.2681564245810056, "#6b1cfb" ], [ 0.3575418994413408, "#981cfd" ], [ 0.44692737430167595, "#bf1cfd" ], [ 0.5363128491620112, "#dd2bfd" ], [ 0.6256983240223464, "#f246fe" ], [ 0.7150837988826816, "#fc67fd" ], [ 0.8044692737430168, "#fe88fc" ], [ 0.8938547486033519, "#fea5fd" ], [ 0.9832402234636871, "#febefe" ], [ 1, "#fec3fe" ] ] }, "plot_bgcolor": "white", "paper_bgcolor": "white", "shapedefaults": { "line": { "width": 0 }, "opacity": 0.4, "fillcolor": "#506784" }, "annotationdefaults": { "arrowhead": 0, "arrowcolor": "#506784", "arrowwidth": 1 } }, "themeRef": "PLOTLY_WHITE" } } }, "height": null, "width": null, "user": { "profile_url": "https://chart-studio.plotly.com/~ThadLee", "avatar_url": "https://storage.googleapis.com/plotly-prod-profiles/14.jpg", "background_url": "https://storage.googleapis.com/plotly-prod-profiles/bg-7.jpg", "bio": "", "nickname": "", "website": "", "stream_tokens": null, "feature_set_id": null, "csrf_token": null, "date_joined": "2023-08-26 05:56:46", "mapbox_access_tokens": null, "has_password": null, "username": "ThadLee", "email": null, "is_active": null, "readonly": null, "is_dash_creator": null, "dash_created_count": null, "is_chart_creator": null, "charts_created_count": null } }, { "creation_time": "2025-08-07T11:59:22.436395Z", "comments": { "results": [], "count": 0 }, "parented": true, "embed_url": "https://chart-studio.plotly.com/~AlexWhittaker/1.embed", "fid": "AlexWhittaker:1", "filename": "Bridge Deck Deformation", "filetype": "plot", "img_url": "https://storage.googleapis.com/plotly-prod-images/AlexWhittaker/1/9_C35Q3YMROP78X4M1WEKGU49YGQR27T.png", "image_urls": { "default": "https://storage.googleapis.com/plotly-prod-images/AlexWhittaker/1/2_IKOAUKU90Z12M5Q9Z0P9HVY6NNKE2B.png", "block-thumb": "https://storage.googleapis.com/plotly-prod-images/AlexWhittaker/1/8_A3MY3E2X92XEO1GRCIOCPYNJ051D22.png", "list-thumb": "https://storage.googleapis.com/plotly-prod-images/AlexWhittaker/1/9_C35Q3YMROP78X4M1WEKGU49YGQR27T.png" }, "api_urls": { "files": "https://api.plotly.com/v2/files/AlexWhittaker:1", "plots": "https://api.plotly.com/v2/plots/AlexWhittaker:1", "parent": "https://api.plotly.com/v2/folders/home?user=AlexWhittaker" }, "owner": "AlexWhittaker", "parent": -1, "preview": "", "referencers": [], "references": [], "title": "", "views": 1, "web_url": "https://chart-studio.plotly.com/~AlexWhittaker/1/", "world_readable": true, "date_modified": "2025-08-08T11:06:06.947Z", "stars": { "results": [], "count": 0 }, "collaborators": { "results": [], "count": 0 }, "subfolder_count": null, "refresh_interval": null, "organize_view_url": "https://chart-studio.plotly.com/~AlexWhittaker/1/", "current_user_permission": "read", "is_theme": null, "is_template": false, "autosize": false, "caption": "", "figure": { "data": [ { "cmax": 0, "cmin": -3, "meta": { "columnNames": { "x": "A", "y": "B", "z": "LT1", "facecolor": "", "intensity": "LT1", "vertexcolor": "" } }, "mode": "markers", "type": "mesh3d", "xsrc": "AlexWhittaker:0:50904d", "ysrc": "AlexWhittaker:0:494d9a", "zsrc": "AlexWhittaker:0:7d7a4f", "cauto": false, "contour": { "show": false }, "opacity": 1, "colorbar": { "x": 0.8599999999999999, "y": 0.54, "title": { "text": "Deflection (mm)" } }, "contours": { "end": 0, "size": 0.2, "start": -2.8000000000000003 }, "showscale": true, "transpose": false, "colorscale": [ [ 0, "#a50026" ], [ 0.1, "#d73027" ], [ 0.2, "#f46d43" ], [ 0.3, "#fdae61" ], [ 0.4, "#fee08b" ], [ 0.5, "#ffffbf" ], [ 0.6, "#d9ef8b" ], [ 0.7, "#a6d96a" ], [ 0.8, "#66bd63" ], [ 0.9, "#1a9850" ], [ 1, "#006837" ] ], "autocontour": true, "flatshading": false, "intensitysrc": "AlexWhittaker:0:7d7a4f", "reversescale": false, "autocolorscale": false } ], "frames": [], "layout": { "scene": { "xaxis": { "type": "linear", "title": { "text": "x (mm)" }, "autorange": true, "gridwidth": 2, "exponentformat": "none" }, "yaxis": { "type": "linear", "title": { "text": "y (mm)" }, "exponentformat": "none" }, "zaxis": { "type": "linear", "range": [ -3.000000000000001, 1.0000000000000009 ], "title": { "text": "z (mm)" }, "autorange": false, "exponentformat": "none" }, "camera": { "up": { "x": 0, "y": 0, "z": 1 }, "eye": { "x": 1.1307060953532955, "y": 2.042548786451287, "z": 0.8304098745065971 }, "center": { "x": 0.08190502049308586, "y": -0.02574216580417912, "z": -0.09865847657571265 }, "projection": { "type": "perspective" } }, "dragmode": "turntable", "aspectmode": "auto", "aspectratio": { "x": 1, "y": 1, "z": 1 } }, "title": { "x": 0.48, "font": { "size": 22 }, "text": "Bridge Deck Deformation Load Test 2 (South to North)" }, "width": 1300, "xaxis": { "type": "linear", "range": [ -594.0625, 17584.0625 ], "autorange": true }, "yaxis": { "type": "linear", "range": [ -558.242463117383, 13158.242463117384 ], "autorange": true }, "height": 1009, "margin": { "l": 95 }, "autosize": false, "dragmode": "zoom", "template": { "data": { "bar": [ { "type": "bar", "marker": { "colorbar": { "ticks": "", "outlinewidth": 0 } } } ], "table": [ { "type": "table", "cells": { "fill": { "color": "#506784" }, "line": { "color": "rgb(17,17,17)" } }, "header": { "fill": { "color": "#2a3f5f" }, "line": { "color": "rgb(17,17,17)" } } } ], "carpet": [ { "type": "carpet", "aaxis": { "gridcolor": "#506784", "linecolor": "#506784", "endlinecolor": "#A2B1C6", "minorgridcolor": "#506784", "startlinecolor": "#A2B1C6" }, "baxis": { "gridcolor": "#506784", "linecolor": "#506784", "endlinecolor": "#A2B1C6", "minorgridcolor": "#506784", "startlinecolor": "#A2B1C6" } } ], "mesh3d": [ { "type": "mesh3d", "colorbar": { "ticks": "", "outlinewidth": 0 } } ], "contour": [ { "type": "contour", "colorbar": { "ticks": "", "outlinewidth": 0 }, "autocolorscale": true } ], "heatmap": [ { "type": "heatmap", "colorbar": { "ticks": "", "outlinewidth": 0 }, "autocolorscale": true } ], "scatter": [ { "type": "scatter", "marker": { "colorbar": { "ticks": "", "outlinewidth": 0 } } } ], "surface": [ { "type": "surface", "colorbar": { "ticks": "", "outlinewidth": 0 } } ], "heatmapgl": [ { "type": "heatmapgl", "colorbar": { "ticks": "", "outlinewidth": 0 } } ], "histogram": [ { "type": "histogram", "marker": { "colorbar": { "ticks": "", "outlinewidth": 0 } } } ], "parcoords": [ { "line": { "colorbar": { "ticks": "", "outlinewidth": 0 } }, "type": "parcoords" } ], "scatter3d": [ { "type": "scatter3d", "marker": { "colorbar": { "ticks": "", "outlinewidth": 0 } } } ], "scattergl": [ { "type": "scattergl", "marker": { "colorbar": { "ticks": "", "outlinewidth": 0 } } } ], "choropleth": [ { "type": "choropleth", "colorbar": { "ticks": "", "outlinewidth": 0 } } ], "scattergeo": [ { "type": "scattergeo", "marker": { "colorbar": { "ticks": "", "outlinewidth": 0 } } } ], "histogram2d": [ { "type": "histogram2d", "colorbar": { "ticks": "", "outlinewidth": 0 }, "autocolorscale": true } ], "scatterpolar": [ { "type": "scatterpolar", "marker": { "colorbar": { "ticks": "", "outlinewidth": 0 } } } ], "contourcarpet": [ { "type": "contourcarpet", "colorbar": { "ticks": "", "outlinewidth": 0 } } ], "scattercarpet": [ { "type": "scattercarpet", "marker": { "colorbar": { "ticks": "", "outlinewidth": 0 } } } ], "scattermapbox": [ { "type": "scattermapbox", "marker": { "colorbar": { "ticks": "", "outlinewidth": 0 } } } ], "scatterpolargl": [ { "type": "scatterpolargl", "marker": { "colorbar": { "ticks": "", "outlinewidth": 0 } } } ], "scatterternary": [ { "type": "scatterternary", "marker": { "colorbar": { "ticks": "", "outlinewidth": 0 } } } ], "histogram2dcontour": [ { "type": "histogram2dcontour", "colorbar": { "ticks": "", "outlinewidth": 0 }, "autocolorscale": true } ] }, "layout": { "geo": { "bgcolor": "rgb(17,17,17)", "showland": true, "lakecolor": "rgb(17,17,17)", "landcolor": "rgb(17,17,17)", "showlakes": true, "subunitcolor": "#506784" }, "font": { "color": "#f2f5fa" }, "polar": { "bgcolor": "rgb(17,17,17)", "radialaxis": { "ticks": "", "gridcolor": "#506784", "linecolor": "#506784" }, "angularaxis": { "ticks": "", "gridcolor": "#506784", "linecolor": "#506784" } }, "scene": { "xaxis": { "ticks": "", "gridcolor": "#506784", "gridwidth": 2, "linecolor": "#506784", "zerolinecolor": "#C8D4E3", "showbackground": true, "backgroundcolor": "rgb(17,17,17)" }, "yaxis": { "ticks": "", "gridcolor": "#506784", "gridwidth": 2, "linecolor": "#506784", "zerolinecolor": "#C8D4E3", "showbackground": true, "backgroundcolor": "rgb(17,17,17)" }, "zaxis": { "ticks": "", "gridcolor": "#506784", "gridwidth": 2, "linecolor": "#506784", "zerolinecolor": "#C8D4E3", "showbackground": true, "backgroundcolor": "rgb(17,17,17)" } }, "title": { "x": 0.05 }, "xaxis": { "ticks": "", "gridcolor": "#283442", "linecolor": "#506784", "automargin": true, "zerolinecolor": "#283442", "zerolinewidth": 2 }, "yaxis": { "ticks": "", "gridcolor": "#283442", "linecolor": "#506784", "automargin": true, "zerolinecolor": "#283442", "zerolinewidth": 2 }, "ternary": { "aaxis": { "ticks": "", "gridcolor": "#506784", "linecolor": "#506784" }, "baxis": { "ticks": "", "gridcolor": "#506784", "linecolor": "#506784" }, "caxis": { "ticks": "", "gridcolor": "#506784", "linecolor": "#506784" }, "bgcolor": "rgb(17,17,17)" }, "colorway": [ "#636efa", "#EF553B", "#00cc96", "#ab63fa", "#19d3f3", "#e763fa", "#fecb52", "#ffa15a", "#ff6692", "#b6e880" ], "hovermode": "closest", "colorscale": { "diverging": [ [ 0, "#8e0152" ], [ 0.1, "#c51b7d" ], [ 0.2, "#de77ae" ], [ 0.3, "#f1b6da" ], [ 0.4, "#fde0ef" ], [ 0.5, "#f7f7f7" ], [ 0.6, "#e6f5d0" ], [ 0.7, "#b8e186" ], [ 0.8, "#7fbc41" ], [ 0.9, "#4d9221" ], [ 1, "#276419" ] ], "sequential": [ [ 0, "#0508b8" ], [ 0.0893854748603352, "#1910d8" ], [ 0.1787709497206704, "#3c19f0" ], [ 0.2681564245810056, "#6b1cfb" ], [ 0.3575418994413408, "#981cfd" ], [ 0.44692737430167595, "#bf1cfd" ], [ 0.5363128491620112, "#dd2bfd" ], [ 0.6256983240223464, "#f246fe" ], [ 0.7150837988826816, "#fc67fd" ], [ 0.8044692737430168, "#fe88fc" ], [ 0.8938547486033519, "#fea5fd" ], [ 0.9832402234636871, "#febefe" ], [ 1, "#fec3fe" ] ], "sequentialminus": [ [ 0, "#0508b8" ], [ 0.0893854748603352, "#1910d8" ], [ 0.1787709497206704, "#3c19f0" ], [ 0.2681564245810056, "#6b1cfb" ], [ 0.3575418994413408, "#981cfd" ], [ 0.44692737430167595, "#bf1cfd" ], [ 0.5363128491620112, "#dd2bfd" ], [ 0.6256983240223464, "#f246fe" ], [ 0.7150837988826816, "#fc67fd" ], [ 0.8044692737430168, "#fe88fc" ], [ 0.8938547486033519, "#fea5fd" ], [ 0.9832402234636871, "#febefe" ], [ 1, "#fec3fe" ] ] }, "plot_bgcolor": "rgb(17,17,17)", "paper_bgcolor": "rgb(17,17,17)", "shapedefaults": { "line": { "width": 0 }, "opacity": 0.4, "fillcolor": "#f2f5fa" }, "sliderdefaults": { "bgcolor": "#C8D4E3", "tickwidth": 0, "bordercolor": "rgb(17,17,17)", "borderwidth": 1 }, "annotationdefaults": { "arrowhead": 0, "arrowcolor": "#f2f5fa", "arrowwidth": 1 }, "updatemenudefaults": { "bgcolor": "#506784", "borderwidth": 0 } }, "themeRef": "PLOTLY_DARK" }, "colorscale": { "sequential": [ [ 0, "#0508b8" ], [ 0.08333333333333333, "#1910d8" ], [ 0.16666666666666666, "#3c19f0" ], [ 0.25, "#6b1cfb" ], [ 0.3333333333333333, "#981cfd" ], [ 0.4166666666666667, "#bf1cfd" ], [ 0.5, "#dd2bfd" ], [ 0.5833333333333334, "#f246fe" ], [ 0.6666666666666666, "#fc67fd" ], [ 0.75, "#fe88fc" ], [ 0.8333333333333334, "#fea5fd" ], [ 0.9166666666666666, "#febefe" ], [ 1, "#fec3fe" ] ], "sequentialminus": [ [ 0, "#0508b8" ], [ 0.08333333333333333, "#1910d8" ], [ 0.16666666666666666, "#3c19f0" ], [ 0.25, "#6b1cfb" ], [ 0.3333333333333333, "#981cfd" ], [ 0.4166666666666667, "#bf1cfd" ], [ 0.5, "#dd2bfd" ], [ 0.5833333333333334, "#f246fe" ], [ 0.6666666666666666, "#fc67fd" ], [ 0.75, "#fe88fc" ], [ 0.8333333333333334, "#fea5fd" ], [ 0.9166666666666666, "#febefe" ], [ 1, "#fec3fe" ] ] }, "showlegend": false } }, "height": 1009, "width": 1300, "user": { "profile_url": "https://chart-studio.plotly.com/~AlexWhittaker", "avatar_url": "https://storage.googleapis.com/plotly-prod-profiles/52.jpg", "background_url": "https://storage.googleapis.com/plotly-prod-profiles/bg-0.jpg", "bio": "", "nickname": "", "website": "", "stream_tokens": null, "feature_set_id": null, "csrf_token": null, "date_joined": "2025-08-07 10:26:10", "mapbox_access_tokens": null, "has_password": null, "username": "AlexWhittaker", "email": null, "is_active": null, "readonly": null, "is_dash_creator": null, "dash_created_count": null, "is_chart_creator": null, "charts_created_count": null } }, { "creation_time": "2025-08-07T11:56:30.482552Z", "comments": { "results": [], "count": 0 }, "parented": true, "embed_url": "https://chart-studio.plotly.com/~Gonkalorian/23.embed", "fid": "Gonkalorian:23", "filename": "Plot 23", "filetype": "plot", "img_url": "https://storage.googleapis.com/plotly-prod-images/Gonkalorian/23/9_0W3QISR2Y9LR4FU0XY5XN3EAZC1NN6.png", "image_urls": { "default": "https://storage.googleapis.com/plotly-prod-images/Gonkalorian/23/2_JYOVA402IH8MUBA73Q5596HVKWBS00.png", "block-thumb": "https://storage.googleapis.com/plotly-prod-images/Gonkalorian/23/8_GWJ4IISM2OFK56Z0X9SNFYGX8647UP.png", "list-thumb": "https://storage.googleapis.com/plotly-prod-images/Gonkalorian/23/9_0W3QISR2Y9LR4FU0XY5XN3EAZC1NN6.png" }, "api_urls": { "files": "https://api.plotly.com/v2/files/Gonkalorian:23", "plots": "https://api.plotly.com/v2/plots/Gonkalorian:23", "parent": "https://api.plotly.com/v2/folders/home?user=Gonkalorian" }, "owner": "Gonkalorian", "parent": -1, "preview": "", "referencers": [], "references": [], "title": "", "views": 1, "web_url": "https://chart-studio.plotly.com/~Gonkalorian/23/", "world_readable": true, "date_modified": "2025-08-07T11:56:30.498Z", "stars": { "results": [], "count": 0 }, "collaborators": { "results": [], "count": 0 }, "subfolder_count": null, "refresh_interval": null, "organize_view_url": "https://chart-studio.plotly.com/~Gonkalorian/23/", "current_user_permission": "read", "is_theme": null, "is_template": false, "autosize": true, "caption": "", "figure": { "data": [ { "uid": "c1a979", "meta": { "columnNames": { "x": "A", "y": "B", "error_y": { "array": "D" } } }, "mode": "markers", "type": "scatter", "xsrc": "Gonkalorian:22:c8253a", "ysrc": "Gonkalorian:22:d4692c", "error_x": { "value": 0.01, "visible": true, "symmetric": true }, "error_y": { "meta": { "columnNames": { "array": "D" } }, "type": "data", "visible": true, "arraysrc": "Gonkalorian:22:398e3a", "symmetric": true } }, { "uid": "f3bee3", "transforms": [ { "rms": "", "type": "fit", "inputUid": "c1a979", "regressor": "x", "parameters": [ { "hold": false, "name": "m", "error": 0.18913323126404571, "value": 4.250255110632628 }, { "hold": false, "name": "b", "error": 0.0968652541940561, "value": -0.09160083287366505 } ], "regressand": "y", "correlation": "", "fitfunction": "m*x + b", "inputxrange": [], "outputxrange": [], "interpolation": 50 } ] }, { "uid": "80621c", "line": { "color": "rgb(4, 143, 0)" }, "transforms": [ { "rms": 0.07276876652181682, "type": "fit", "xmid": 0.45099999999999996, "ymid": 1.8476991671269443, "inputUid": "c1a979", "regressor": "x", "parameters": [ { "hold": true, "name": "m", "error": 0.18913323126340564, "value": 4.4 }, { "hold": true, "name": "b", "error": 0.09686525419393079, "value": -0.09160083287305554 } ], "regressand": "y", "correlation": 0.9980256777087378, "fitfunction": "m*x + b", "inputxrange": [], "outputxrange": [], "interpolation": 50 } ] }, { "uid": "6aae8a", "line": { "color": "rgb(216, 50, 0)" }, "transforms": [ { "rms": 0.09027669336393537, "type": "fit", "xmid": 0.45099999999999996, "ymid": 1.8242500000245405, "inputUid": "c1a979", "regressor": "x", "parameters": [ { "hold": true, "name": "m", "error": 0.18913323126353215, "value": 4.15 }, { "hold": false, "name": "b", "error": 0.04202762746100719, "value": -0.04706249997499129 } ], "regressand": "y", "correlation": 0.9980256777087381, "fitfunction": "m*x + b", "inputxrange": [], "outputxrange": [], "interpolation": 50 } ] } ], "frames": [], "layout": { "title": { "text": "Period^2 vs Length of a Simple Pendulum" }, "xaxis": { "type": "linear", "range": [ 0.07688156723063222, 0.8251184327693678 ], "title": { "text": "Length, m" }, "autorange": true }, "yaxis": { "type": "linear", "range": [ 0.23515613581450676, 3.5796233612729207 ], "title": { "text": "Period^2, s^2" }, "autorange": true }, "autosize": true, "template": { "data": { "bar": [ { "type": "bar", "marker": { "colorbar": { "ticks": "", "outlinewidth": 0 } } } ], "table": [ { "type": "table", "cells": { "fill": { "color": "#EBF0F8" }, "line": { "color": "white" } }, "header": { "fill": { "color": "#C8D4E3" }, "line": { "color": "white" } } } ], "carpet": [ { "type": "carpet", "aaxis": { "gridcolor": "#C8D4E3", "linecolor": "#C8D4E3", "endlinecolor": "#2a3f5f", "minorgridcolor": "#C8D4E3", "startlinecolor": "#2a3f5f" }, "baxis": { "gridcolor": "#C8D4E3", "linecolor": "#C8D4E3", "endlinecolor": "#2a3f5f", "minorgridcolor": "#C8D4E3", "startlinecolor": "#2a3f5f" } } ], "mesh3d": [ { "type": "mesh3d", "colorbar": { "ticks": "", "outlinewidth": 0 } } ], "contour": [ { "type": "contour", "colorbar": { "ticks": "", "outlinewidth": 0 }, "autocolorscale": true } ], "heatmap": [ { "type": "heatmap", "colorbar": { "ticks": "", "outlinewidth": 0 }, "autocolorscale": true } ], "scatter": [ { "type": "scatter", "marker": { "colorbar": { "ticks": "", "outlinewidth": 0 } } } ], "surface": [ { "type": "surface", "colorbar": { "ticks": "", "outlinewidth": 0 } } ], "heatmapgl": [ { "type": "heatmapgl", "colorbar": { "ticks": "", "outlinewidth": 0 } } ], "histogram": [ { "type": "histogram", "marker": { "colorbar": { "ticks": "", "outlinewidth": 0 } } } ], "parcoords": [ { "line": { "colorbar": { "ticks": "", "outlinewidth": 0 } }, "type": "parcoords" } ], "scatter3d": [ { "type": "scatter3d", "marker": { "colorbar": { "ticks": "", "outlinewidth": 0 } } } ], "scattergl": [ { "type": "scattergl", "marker": { "colorbar": { "ticks": "", "outlinewidth": 0 } } } ], "choropleth": [ { "type": "choropleth", "colorbar": { "ticks": "", "outlinewidth": 0 } } ], "scattergeo": [ { "type": "scattergeo", "marker": { "colorbar": { "ticks": "", "outlinewidth": 0 } } } ], "histogram2d": [ { "type": "histogram2d", "colorbar": { "ticks": "", "outlinewidth": 0 }, "autocolorscale": true } ], "scatterpolar": [ { "type": "scatterpolar", "marker": { "colorbar": { "ticks": "", "outlinewidth": 0 } } } ], "contourcarpet": [ { "type": "contourcarpet", "colorbar": { "ticks": "", "outlinewidth": 0 } } ], "scattercarpet": [ { "type": "scattercarpet", "marker": { "colorbar": { "ticks": "", "outlinewidth": 0 } } } ], "scattermapbox": [ { "type": "scattermapbox", "marker": { "colorbar": { "ticks": "", "outlinewidth": 0 } } } ], "scatterpolargl": [ { "type": "scatterpolargl", "marker": { "colorbar": { "ticks": "", "outlinewidth": 0 } } } ], "scatterternary": [ { "type": "scatterternary", "marker": { "colorbar": { "ticks": "", "outlinewidth": 0 } } } ], "histogram2dcontour": [ { "type": "histogram2dcontour", "colorbar": { "ticks": "", "outlinewidth": 0 }, "autocolorscale": true } ] }, "layout": { "geo": { "bgcolor": "white", "showland": true, "lakecolor": "white", "landcolor": "white", "showlakes": true, "subunitcolor": "#C8D4E3" }, "font": { "color": "#2a3f5f" }, "polar": { "bgcolor": "white", "radialaxis": { "ticks": "", "gridcolor": "#EBF0F8", "linecolor": "#EBF0F8" }, "angularaxis": { "ticks": "", "gridcolor": "#EBF0F8", "linecolor": "#EBF0F8" } }, "scene": { "xaxis": { "ticks": "", "gridcolor": "#DFE8F3", "gridwidth": 2, "linecolor": "#EBF0F8", "zerolinecolor": "#EBF0F8", "showbackground": true, "backgroundcolor": "white" }, "yaxis": { "ticks": "", "gridcolor": "#DFE8F3", "gridwidth": 2, "linecolor": "#EBF0F8", "zerolinecolor": "#EBF0F8", "showbackground": true, "backgroundcolor": "white" }, "zaxis": { "ticks": "", "gridcolor": "#DFE8F3", "gridwidth": 2, "linecolor": "#EBF0F8", "zerolinecolor": "#EBF0F8", "showbackground": true, "backgroundcolor": "white" } }, "title": { "x": 0.05 }, "xaxis": { "ticks": "", "gridcolor": "#EBF0F8", "linecolor": "#EBF0F8", "automargin": true, "zerolinecolor": "#EBF0F8", "zerolinewidth": 2 }, "yaxis": { "ticks": "", "gridcolor": "#EBF0F8", "linecolor": "#EBF0F8", "automargin": true, "zerolinecolor": "#EBF0F8", "zerolinewidth": 2 }, "ternary": { "aaxis": { "ticks": "", "gridcolor": "#DFE8F3", "linecolor": "#A2B1C6" }, "baxis": { "ticks": "", "gridcolor": "#DFE8F3", "linecolor": "#A2B1C6" }, "caxis": { "ticks": "", "gridcolor": "#DFE8F3", "linecolor": "#A2B1C6" }, "bgcolor": "white" }, "colorway": [ "#636efa", "#EF553B", "#00cc96", "#ab63fa", "#19d3f3", "#e763fa", "#fecb52", "#ffa15a", "#ff6692", "#b6e880" ], "hovermode": "closest", "colorscale": { "diverging": [ [ 0, "#8e0152" ], [ 0.1, "#c51b7d" ], [ 0.2, "#de77ae" ], [ 0.3, "#f1b6da" ], [ 0.4, "#fde0ef" ], [ 0.5, "#f7f7f7" ], [ 0.6, "#e6f5d0" ], [ 0.7, "#b8e186" ], [ 0.8, "#7fbc41" ], [ 0.9, "#4d9221" ], [ 1, "#276419" ] ], "sequential": [ [ 0, "#0508b8" ], [ 0.0893854748603352, "#1910d8" ], [ 0.1787709497206704, "#3c19f0" ], [ 0.2681564245810056, "#6b1cfb" ], [ 0.3575418994413408, "#981cfd" ], [ 0.44692737430167595, "#bf1cfd" ], [ 0.5363128491620112, "#dd2bfd" ], [ 0.6256983240223464, "#f246fe" ], [ 0.7150837988826816, "#fc67fd" ], [ 0.8044692737430168, "#fe88fc" ], [ 0.8938547486033519, "#fea5fd" ], [ 0.9832402234636871, "#febefe" ], [ 1, "#fec3fe" ] ], "sequentialminus": [ [ 0, "#0508b8" ], [ 0.0893854748603352, "#1910d8" ], [ 0.1787709497206704, "#3c19f0" ], [ 0.2681564245810056, "#6b1cfb" ], [ 0.3575418994413408, "#981cfd" ], [ 0.44692737430167595, "#bf1cfd" ], [ 0.5363128491620112, "#dd2bfd" ], [ 0.6256983240223464, "#f246fe" ], [ 0.7150837988826816, "#fc67fd" ], [ 0.8044692737430168, "#fe88fc" ], [ 0.8938547486033519, "#fea5fd" ], [ 0.9832402234636871, "#febefe" ], [ 1, "#fec3fe" ] ] }, "plot_bgcolor": "white", "paper_bgcolor": "white", "shapedefaults": { "line": { "width": 0 }, "opacity": 0.4, "fillcolor": "#506784" }, "annotationdefaults": { "arrowhead": 0, "arrowcolor": "#506784", "arrowwidth": 1 } }, "themeRef": "PLOTLY_WHITE" } } }, "height": null, "width": null, "user": { "profile_url": "https://chart-studio.plotly.com/~Gonkalorian", "avatar_url": "https://storage.googleapis.com/plotly-prod-profiles/43.jpg", "background_url": "https://storage.googleapis.com/plotly-prod-profiles/bg-14.jpg", "bio": "", "nickname": "", "website": "", "stream_tokens": null, "feature_set_id": null, "csrf_token": null, "date_joined": "2023-07-17 10:39:19", "mapbox_access_tokens": null, "has_password": null, "username": "Gonkalorian", "email": null, "is_active": null, "readonly": null, "is_dash_creator": null, "dash_created_count": null, "is_chart_creator": null, "charts_created_count": null } }, { "creation_time": "2025-08-07T09:44:02.692623Z", "comments": { "results": [], "count": 0 }, "parented": true, "embed_url": "https://chart-studio.plotly.com/~AnmariVB/3.embed", "fid": "AnmariVB:3", "filename": "Plot 3", "filetype": "plot", "img_url": "https://api.plotly.com/v2/files/AnmariVB:3/image?image_name=list-thumb", "image_urls": { "default": "https://storage.googleapis.com/plotly-prod-images/AnmariVB/3/2_HK8IWDDYIV8MLMHQT1VUS6XBIOUNDD.png", "block-thumb": "https://storage.googleapis.com/plotly-prod-images/AnmariVB/3/8_U5ZW2L5A609XM1DYY8HIH2UVV935NU.png", "list-thumb": "https://api.plotly.com/v2/files/AnmariVB:3/image?image_name=list-thumb" }, "api_urls": { "files": "https://api.plotly.com/v2/files/AnmariVB:3", "plots": "https://api.plotly.com/v2/plots/AnmariVB:3", "parent": "https://api.plotly.com/v2/folders/home?user=AnmariVB" }, "owner": "AnmariVB", "parent": -1, "preview": "", "referencers": [], "references": [], "title": "", "views": 0, "web_url": "https://chart-studio.plotly.com/~AnmariVB/3/", "world_readable": true, "date_modified": "2025-08-07T09:44:02.704Z", "stars": { "results": [], "count": 0 }, "collaborators": { "results": [], "count": 0 }, "subfolder_count": null, "refresh_interval": null, "organize_view_url": "https://chart-studio.plotly.com/~AnmariVB/3/", "current_user_permission": "read", "is_theme": null, "is_template": false, "autosize": true, "caption": "", "figure": { "data": [ { "meta": { "columnNames": { "labels": "A", "values": "B" } }, "mode": "markers", "type": "pie", "labelssrc": "AnmariVB:2:b4011f", "valuessrc": "AnmariVB:2:a7d2e2" } ], "frames": [], "layout": { "title": { "text": "Nursery one " }, "xaxis": { "range": [ -1, 6 ], "autorange": true }, "yaxis": { "range": [ -1, 4 ], "autorange": true }, "autosize": true, "template": { "data": { "bar": [ { "type": "bar", "marker": { "colorbar": { "ticks": "", "outlinewidth": 0 } } } ], "table": [ { "type": "table", "cells": { "fill": { "color": "#EBF0F8" }, "line": { "color": "white" } }, "header": { "fill": { "color": "#C8D4E3" }, "line": { "color": "white" } } } ], "carpet": [ { "type": "carpet", "aaxis": { "gridcolor": "#C8D4E3", "linecolor": "#C8D4E3", "endlinecolor": "#2a3f5f", "minorgridcolor": "#C8D4E3", "startlinecolor": "#2a3f5f" }, "baxis": { "gridcolor": "#C8D4E3", "linecolor": "#C8D4E3", "endlinecolor": "#2a3f5f", "minorgridcolor": "#C8D4E3", "startlinecolor": "#2a3f5f" } } ], "mesh3d": [ { "type": "mesh3d", "colorbar": { "ticks": "", "outlinewidth": 0 } } ], "contour": [ { "type": "contour", "colorbar": { "ticks": "", "outlinewidth": 0 }, "autocolorscale": true } ], "heatmap": [ { "type": "heatmap", "colorbar": { "ticks": "", "outlinewidth": 0 }, "autocolorscale": true } ], "scatter": [ { "type": "scatter", "marker": { "colorbar": { "ticks": "", "outlinewidth": 0 } } } ], "surface": [ { "type": "surface", "colorbar": { "ticks": "", "outlinewidth": 0 } } ], "heatmapgl": [ { "type": "heatmapgl", "colorbar": { "ticks": "", "outlinewidth": 0 } } ], "histogram": [ { "type": "histogram", "marker": { "colorbar": { "ticks": "", "outlinewidth": 0 } } } ], "parcoords": [ { "line": { "colorbar": { "ticks": "", "outlinewidth": 0 } }, "type": "parcoords" } ], "scatter3d": [ { "type": "scatter3d", "marker": { "colorbar": { "ticks": "", "outlinewidth": 0 } } } ], "scattergl": [ { "type": "scattergl", "marker": { "colorbar": { "ticks": "", "outlinewidth": 0 } } } ], "choropleth": [ { "type": "choropleth", "colorbar": { "ticks": "", "outlinewidth": 0 } } ], "scattergeo": [ { "type": "scattergeo", "marker": { "colorbar": { "ticks": "", "outlinewidth": 0 } } } ], "histogram2d": [ { "type": "histogram2d", "colorbar": { "ticks": "", "outlinewidth": 0 }, "autocolorscale": true } ], "scatterpolar": [ { "type": "scatterpolar", "marker": { "colorbar": { "ticks": "", "outlinewidth": 0 } } } ], "contourcarpet": [ { "type": "contourcarpet", "colorbar": { "ticks": "", "outlinewidth": 0 } } ], "scattercarpet": [ { "type": "scattercarpet", "marker": { "colorbar": { "ticks": "", "outlinewidth": 0 } } } ], "scattermapbox": [ { "type": "scattermapbox", "marker": { "colorbar": { "ticks": "", "outlinewidth": 0 } } } ], "scatterpolargl": [ { "type": "scatterpolargl", "marker": { "colorbar": { "ticks": "", "outlinewidth": 0 } } } ], "scatterternary": [ { "type": "scatterternary", "marker": { "colorbar": { "ticks": "", "outlinewidth": 0 } } } ], "histogram2dcontour": [ { "type": "histogram2dcontour", "colorbar": { "ticks": "", "outlinewidth": 0 }, "autocolorscale": true } ] }, "layout": { "geo": { "bgcolor": "white", "showland": true, "lakecolor": "white", "landcolor": "white", "showlakes": true, "subunitcolor": "#C8D4E3" }, "font": { "color": "#2a3f5f" }, "polar": { "bgcolor": "white", "radialaxis": { "ticks": "", "gridcolor": "#EBF0F8", "linecolor": "#EBF0F8" }, "angularaxis": { "ticks": "", "gridcolor": "#EBF0F8", "linecolor": "#EBF0F8" } }, "scene": { "xaxis": { "ticks": "", "gridcolor": "#DFE8F3", "gridwidth": 2, "linecolor": "#EBF0F8", "zerolinecolor": "#EBF0F8", "showbackground": true, "backgroundcolor": "white" }, "yaxis": { "ticks": "", "gridcolor": "#DFE8F3", "gridwidth": 2, "linecolor": "#EBF0F8", "zerolinecolor": "#EBF0F8", "showbackground": true, "backgroundcolor": "white" }, "zaxis": { "ticks": "", "gridcolor": "#DFE8F3", "gridwidth": 2, "linecolor": "#EBF0F8", "zerolinecolor": "#EBF0F8", "showbackground": true, "backgroundcolor": "white" } }, "title": { "x": 0.05 }, "xaxis": { "ticks": "", "gridcolor": "#EBF0F8", "linecolor": "#EBF0F8", "automargin": true, "zerolinecolor": "#EBF0F8", "zerolinewidth": 2 }, "yaxis": { "ticks": "", "gridcolor": "#EBF0F8", "linecolor": "#EBF0F8", "automargin": true, "zerolinecolor": "#EBF0F8", "zerolinewidth": 2 }, "ternary": { "aaxis": { "ticks": "", "gridcolor": "#DFE8F3", "linecolor": "#A2B1C6" }, "baxis": { "ticks": "", "gridcolor": "#DFE8F3", "linecolor": "#A2B1C6" }, "caxis": { "ticks": "", "gridcolor": "#DFE8F3", "linecolor": "#A2B1C6" }, "bgcolor": "white" }, "colorway": [ "#636efa", "#EF553B", "#00cc96", "#ab63fa", "#19d3f3", "#e763fa", "#fecb52", "#ffa15a", "#ff6692", "#b6e880" ], "hovermode": "closest", "colorscale": { "diverging": [ [ 0, "#8e0152" ], [ 0.1, "#c51b7d" ], [ 0.2, "#de77ae" ], [ 0.3, "#f1b6da" ], [ 0.4, "#fde0ef" ], [ 0.5, "#f7f7f7" ], [ 0.6, "#e6f5d0" ], [ 0.7, "#b8e186" ], [ 0.8, "#7fbc41" ], [ 0.9, "#4d9221" ], [ 1, "#276419" ] ], "sequential": [ [ 0, "#0508b8" ], [ 0.0893854748603352, "#1910d8" ], [ 0.1787709497206704, "#3c19f0" ], [ 0.2681564245810056, "#6b1cfb" ], [ 0.3575418994413408, "#981cfd" ], [ 0.44692737430167595, "#bf1cfd" ], [ 0.5363128491620112, "#dd2bfd" ], [ 0.6256983240223464, "#f246fe" ], [ 0.7150837988826816, "#fc67fd" ], [ 0.8044692737430168, "#fe88fc" ], [ 0.8938547486033519, "#fea5fd" ], [ 0.9832402234636871, "#febefe" ], [ 1, "#fec3fe" ] ], "sequentialminus": [ [ 0, "#0508b8" ], [ 0.0893854748603352, "#1910d8" ], [ 0.1787709497206704, "#3c19f0" ], [ 0.2681564245810056, "#6b1cfb" ], [ 0.3575418994413408, "#981cfd" ], [ 0.44692737430167595, "#bf1cfd" ], [ 0.5363128491620112, "#dd2bfd" ], [ 0.6256983240223464, "#f246fe" ], [ 0.7150837988826816, "#fc67fd" ], [ 0.8044692737430168, "#fe88fc" ], [ 0.8938547486033519, "#fea5fd" ], [ 0.9832402234636871, "#febefe" ], [ 1, "#fec3fe" ] ] }, "plot_bgcolor": "white", "paper_bgcolor": "white", "shapedefaults": { "line": { "width": 0 }, "opacity": 0.4, "fillcolor": "#506784" }, "annotationdefaults": { "arrowhead": 0, "arrowcolor": "#506784", "arrowwidth": 1 } }, "themeRef": "PLOTLY_WHITE" } } }, "height": null, "width": null, "user": { "profile_url": "https://chart-studio.plotly.com/~AnmariVB", "avatar_url": "https://storage.googleapis.com/plotly-prod-profiles/66.jpg", "background_url": "https://storage.googleapis.com/plotly-prod-profiles/bg-13.jpg", "bio": "", "nickname": "", "website": "", "stream_tokens": null, "feature_set_id": null, "csrf_token": null, "date_joined": "2025-08-07 09:09:41", "mapbox_access_tokens": null, "has_password": null, "username": "AnmariVB", "email": null, "is_active": null, "readonly": null, "is_dash_creator": null, "dash_created_count": null, "is_chart_creator": null, "charts_created_count": null } }, { "creation_time": "2025-08-07T09:26:37.959427Z", "comments": { "results": [], "count": 0 }, "parented": true, "embed_url": "https://chart-studio.plotly.com/~AnmariVB/1.embed", "fid": "AnmariVB:1", "filename": "Plot 1", "filetype": "plot", "img_url": "https://api.plotly.com/v2/files/AnmariVB:1/image?image_name=list-thumb", "image_urls": { "default": "https://storage.googleapis.com/plotly-prod-images/AnmariVB/1/2_1K4BWM9Q3T9F0PO65Y5RPCOEPSE09C.png", "block-thumb": "https://storage.googleapis.com/plotly-prod-images/AnmariVB/1/8_Z6XP1AVP6LOWKNXODUJ852QW2NKYUX.png", "list-thumb": "https://api.plotly.com/v2/files/AnmariVB:1/image?image_name=list-thumb" }, "api_urls": { "files": "https://api.plotly.com/v2/files/AnmariVB:1", "plots": "https://api.plotly.com/v2/plots/AnmariVB:1", "parent": "https://api.plotly.com/v2/folders/home?user=AnmariVB" }, "owner": "AnmariVB", "parent": -1, "preview": "", "referencers": [], "references": [], "title": "", "views": 0, "web_url": "https://chart-studio.plotly.com/~AnmariVB/1/", "world_readable": true, "date_modified": "2025-08-07T09:26:37.972Z", "stars": { "results": [], "count": 0 }, "collaborators": { "results": [], "count": 0 }, "subfolder_count": null, "refresh_interval": null, "organize_view_url": "https://chart-studio.plotly.com/~AnmariVB/1/", "current_user_permission": "read", "is_theme": null, "is_template": false, "autosize": true, "caption": "", "figure": { "data": [ { "meta": { "columnNames": { "labels": "A", "values": "B" } }, "mode": "markers", "type": "pie", "labelssrc": "AnmariVB:0:294bee", "valuessrc": "AnmariVB:0:422d18" } ], "frames": [], "layout": { "title": { "text": "Distribution of BRR-Associated fungal genera in South Africa" }, "xaxis": { "range": [ -1, 6 ], "autorange": true, "showspikes": false }, "yaxis": { "range": [ -1, 4 ], "autorange": true, "showspikes": false }, "legend": { "title": { "text": "Genera" } }, "autosize": true, "colorway": [ "#1b9e77", "#d95f02", "#7570b3", "#e7298a", "#66a61e", "#e6ab02", "#a6761d", "#666666" ], "dragmode": "pan", "template": { "data": { "bar": [ { "type": "bar", "marker": { "colorbar": { "ticks": "", "outlinewidth": 0 } } } ], "table": [ { "type": "table", "cells": { "fill": { "color": "#EBF0F8" }, "line": { "color": "white" } }, "header": { "fill": { "color": "#C8D4E3" }, "line": { "color": "white" } } } ], "carpet": [ { "type": "carpet", "aaxis": { "gridcolor": "#C8D4E3", "linecolor": "#C8D4E3", "endlinecolor": "#2a3f5f", "minorgridcolor": "#C8D4E3", "startlinecolor": "#2a3f5f" }, "baxis": { "gridcolor": "#C8D4E3", "linecolor": "#C8D4E3", "endlinecolor": "#2a3f5f", "minorgridcolor": "#C8D4E3", "startlinecolor": "#2a3f5f" } } ], "mesh3d": [ { "type": "mesh3d", "colorbar": { "ticks": "", "outlinewidth": 0 } } ], "contour": [ { "type": "contour", "colorbar": { "ticks": "", "outlinewidth": 0 }, "autocolorscale": true } ], "heatmap": [ { "type": "heatmap", "colorbar": { "ticks": "", "outlinewidth": 0 }, "autocolorscale": true } ], "scatter": [ { "type": "scatter", "marker": { "colorbar": { "ticks": "", "outlinewidth": 0 } } } ], "surface": [ { "type": "surface", "colorbar": { "ticks": "", "outlinewidth": 0 } } ], "heatmapgl": [ { "type": "heatmapgl", "colorbar": { "ticks": "", "outlinewidth": 0 } } ], "histogram": [ { "type": "histogram", "marker": { "colorbar": { "ticks": "", "outlinewidth": 0 } } } ], "parcoords": [ { "line": { "colorbar": { "ticks": "", "outlinewidth": 0 } }, "type": "parcoords" } ], "scatter3d": [ { "type": "scatter3d", "marker": { "colorbar": { "ticks": "", "outlinewidth": 0 } } } ], "scattergl": [ { "type": "scattergl", "marker": { "colorbar": { "ticks": "", "outlinewidth": 0 } } } ], "choropleth": [ { "type": "choropleth", "colorbar": { "ticks": "", "outlinewidth": 0 } } ], "scattergeo": [ { "type": "scattergeo", "marker": { "colorbar": { "ticks": "", "outlinewidth": 0 } } } ], "histogram2d": [ { "type": "histogram2d", "colorbar": { "ticks": "", "outlinewidth": 0 }, "autocolorscale": true } ], "scatterpolar": [ { "type": "scatterpolar", "marker": { "colorbar": { "ticks": "", "outlinewidth": 0 } } } ], "contourcarpet": [ { "type": "contourcarpet", "colorbar": { "ticks": "", "outlinewidth": 0 } } ], "scattercarpet": [ { "type": "scattercarpet", "marker": { "colorbar": { "ticks": "", "outlinewidth": 0 } } } ], "scattermapbox": [ { "type": "scattermapbox", "marker": { "colorbar": { "ticks": "", "outlinewidth": 0 } } } ], "scatterpolargl": [ { "type": "scatterpolargl", "marker": { "colorbar": { "ticks": "", "outlinewidth": 0 } } } ], "scatterternary": [ { "type": "scatterternary", "marker": { "colorbar": { "ticks": "", "outlinewidth": 0 } } } ], "histogram2dcontour": [ { "type": "histogram2dcontour", "colorbar": { "ticks": "", "outlinewidth": 0 }, "autocolorscale": true } ] }, "layout": { "geo": { "bgcolor": "white", "showland": true, "lakecolor": "white", "landcolor": "white", "showlakes": true, "subunitcolor": "#C8D4E3" }, "font": { "color": "#2a3f5f" }, "polar": { "bgcolor": "white", "radialaxis": { "ticks": "", "gridcolor": "#EBF0F8", "linecolor": "#EBF0F8" }, "angularaxis": { "ticks": "", "gridcolor": "#EBF0F8", "linecolor": "#EBF0F8" } }, "scene": { "xaxis": { "ticks": "", "gridcolor": "#DFE8F3", "gridwidth": 2, "linecolor": "#EBF0F8", "zerolinecolor": "#EBF0F8", "showbackground": true, "backgroundcolor": "white" }, "yaxis": { "ticks": "", "gridcolor": "#DFE8F3", "gridwidth": 2, "linecolor": "#EBF0F8", "zerolinecolor": "#EBF0F8", "showbackground": true, "backgroundcolor": "white" }, "zaxis": { "ticks": "", "gridcolor": "#DFE8F3", "gridwidth": 2, "linecolor": "#EBF0F8", "zerolinecolor": "#EBF0F8", "showbackground": true, "backgroundcolor": "white" } }, "title": { "x": 0.05 }, "xaxis": { "ticks": "", "gridcolor": "#EBF0F8", "linecolor": "#EBF0F8", "automargin": true, "zerolinecolor": "#EBF0F8", "zerolinewidth": 2 }, "yaxis": { "ticks": "", "gridcolor": "#EBF0F8", "linecolor": "#EBF0F8", "automargin": true, "zerolinecolor": "#EBF0F8", "zerolinewidth": 2 }, "ternary": { "aaxis": { "ticks": "", "gridcolor": "#DFE8F3", "linecolor": "#A2B1C6" }, "baxis": { "ticks": "", "gridcolor": "#DFE8F3", "linecolor": "#A2B1C6" }, "caxis": { "ticks": "", "gridcolor": "#DFE8F3", "linecolor": "#A2B1C6" }, "bgcolor": "white" }, "colorway": [ "#636efa", "#EF553B", "#00cc96", "#ab63fa", "#19d3f3", "#e763fa", "#fecb52", "#ffa15a", "#ff6692", "#b6e880" ], "hovermode": "closest", "colorscale": { "diverging": [ [ 0, "#8e0152" ], [ 0.1, "#c51b7d" ], [ 0.2, "#de77ae" ], [ 0.3, "#f1b6da" ], [ 0.4, "#fde0ef" ], [ 0.5, "#f7f7f7" ], [ 0.6, "#e6f5d0" ], [ 0.7, "#b8e186" ], [ 0.8, "#7fbc41" ], [ 0.9, "#4d9221" ], [ 1, "#276419" ] ], "sequential": [ [ 0, "#0508b8" ], [ 0.0893854748603352, "#1910d8" ], [ 0.1787709497206704, "#3c19f0" ], [ 0.2681564245810056, "#6b1cfb" ], [ 0.3575418994413408, "#981cfd" ], [ 0.44692737430167595, "#bf1cfd" ], [ 0.5363128491620112, "#dd2bfd" ], [ 0.6256983240223464, "#f246fe" ], [ 0.7150837988826816, "#fc67fd" ], [ 0.8044692737430168, "#fe88fc" ], [ 0.8938547486033519, "#fea5fd" ], [ 0.9832402234636871, "#febefe" ], [ 1, "#fec3fe" ] ], "sequentialminus": [ [ 0, "#0508b8" ], [ 0.0893854748603352, "#1910d8" ], [ 0.1787709497206704, "#3c19f0" ], [ 0.2681564245810056, "#6b1cfb" ], [ 0.3575418994413408, "#981cfd" ], [ 0.44692737430167595, "#bf1cfd" ], [ 0.5363128491620112, "#dd2bfd" ], [ 0.6256983240223464, "#f246fe" ], [ 0.7150837988826816, "#fc67fd" ], [ 0.8044692737430168, "#fe88fc" ], [ 0.8938547486033519, "#fea5fd" ], [ 0.9832402234636871, "#febefe" ], [ 1, "#fec3fe" ] ] }, "plot_bgcolor": "white", "paper_bgcolor": "white", "shapedefaults": { "line": { "width": 0 }, "opacity": 0.4, "fillcolor": "#506784" }, "annotationdefaults": { "arrowhead": 0, "arrowcolor": "#506784", "arrowwidth": 1 } }, "themeRef": "PLOTLY_WHITE" }, "colorscale": { "diverging": [ [ 0, "#9e0142" ], [ 0.1, "#d53e4f" ], [ 0.2, "#f46d43" ], [ 0.3, "#fdae61" ], [ 0.4, "#fee08b" ], [ 0.5, "#ffffbf" ], [ 0.6, "#e6f598" ], [ 0.7, "#abdda4" ], [ 0.8, "#66c2a5" ], [ 0.9, "#3288bd" ], [ 1, "#5e4fa2" ] ], "sequential": [ [ 0, "#fcfbfd" ], [ 0.125, "#efedf5" ], [ 0.25, "#dadaeb" ], [ 0.375, "#bcbddc" ], [ 0.5, "#9e9ac8" ], [ 0.625, "#807dba" ], [ 0.75, "#6a51a3" ], [ 0.875, "#54278f" ], [ 1, "#3f007d" ] ], "sequentialminus": [ [ 0, "#0508b8" ], [ 0.08333333333333333, "#1910d8" ], [ 0.16666666666666666, "#3c19f0" ], [ 0.25, "#6b1cfb" ], [ 0.3333333333333333, "#981cfd" ], [ 0.4166666666666667, "#bf1cfd" ], [ 0.5, "#dd2bfd" ], [ 0.5833333333333334, "#f246fe" ], [ 0.6666666666666666, "#fc67fd" ], [ 0.75, "#fe88fc" ], [ 0.8333333333333334, "#fea5fd" ], [ 0.9166666666666666, "#febefe" ], [ 1, "#fec3fe" ] ] } } }, "height": null, "width": null, "user": { "profile_url": "https://chart-studio.plotly.com/~AnmariVB", "avatar_url": "https://storage.googleapis.com/plotly-prod-profiles/66.jpg", "background_url": "https://storage.googleapis.com/plotly-prod-profiles/bg-13.jpg", "bio": "", "nickname": "", "website": "", "stream_tokens": null, "feature_set_id": null, "csrf_token": null, "date_joined": "2025-08-07 09:09:41", "mapbox_access_tokens": null, "has_password": null, "username": "AnmariVB", "email": null, "is_active": null, "readonly": null, "is_dash_creator": null, "dash_created_count": null, "is_chart_creator": null, "charts_created_count": null } }, { "creation_time": "2025-08-07T08:28:44.167971Z", "comments": { "results": [], "count": 0 }, "parented": true, "embed_url": "https://chart-studio.plotly.com/~wngns99/7.embed", "fid": "wngns99:7", "filename": "검출유무", "filetype": "plot", "img_url": "https://api.plotly.com/v2/files/wngns99:7/image?image_name=list-thumb", "image_urls": { "default": "https://storage.googleapis.com/plotly-prod-images/wngns99/7/2_79XG5E4G4WTKUR54YKSRM2L4LHEP1G.png", "block-thumb": "https://storage.googleapis.com/plotly-prod-images/wngns99/7/8_797XLO3QHC05W8DHYKLYKN7YNQBIMK.png", "list-thumb": "https://api.plotly.com/v2/files/wngns99:7/image?image_name=list-thumb" }, "api_urls": { "files": "https://api.plotly.com/v2/files/wngns99:7", "plots": "https://api.plotly.com/v2/plots/wngns99:7", "parent": "https://api.plotly.com/v2/folders/home?user=wngns99" }, "owner": "wngns99", "parent": -1, "preview": "", "referencers": [], "references": [], "title": "", "views": 0, "web_url": "https://chart-studio.plotly.com/~wngns99/7/", "world_readable": true, "date_modified": "2025-08-07T08:28:44.177Z", "stars": { "results": [], "count": 0 }, "collaborators": { "results": [], "count": 0 }, "subfolder_count": null, "refresh_interval": null, "organize_view_url": "https://chart-studio.plotly.com/~wngns99/7/", "current_user_permission": "read", "is_theme": null, "is_template": false, "autosize": true, "caption": "", "figure": { "data": [ { "meta": { "columnNames": { "x": "SF Zoo, x; LA Zoo, x - SF Zoo, y", "y": "LA Zoo, y" } }, "name": "Gastrointestinal disorders", "type": "bar", "xsrc": "wngns99:6:49d8de,db1fe6*", "ysrc": "wngns99:6:21f5ab" }, { "meta": { "columnNames": { "x": "SF Zoo, x; LA Zoo, x - SF Zoo, y", "y": "D" } }, "name": "Dermatological disorders", "type": "bar", "xsrc": "wngns99:6:49d8de,db1fe6*", "ysrc": "wngns99:6:95860e", "orientation": "v" }, { "meta": { "columnNames": { "x": "SF Zoo, x; LA Zoo, x - SF Zoo, y", "y": "E" } }, "name": "Obesity", "type": "bar", "xsrc": "wngns99:6:49d8de,db1fe6*", "ysrc": "wngns99:6:1a6f35", "orientation": "v" }, { "meta": { "columnNames": { "x": "SF Zoo, x; LA Zoo, x - SF Zoo, y", "y": "F" } }, "name": "Healthy", "type": "bar", "xsrc": "wngns99:6:49d8de,db1fe6*", "ysrc": "wngns99:6:af294d", "orientation": "v" } ], "frames": [], "layout": { "xaxis": { "type": "multicategory", "range": [ -0.46817820206841687, 3.5318217979315834 ], "title": { "text": "C. perfringens Detection and Symptom Classification" }, "autorange": false }, "yaxis": { "type": "linear", "range": [ 0, 95.78947368421052 ], "title": { "text": "Number of Dogs" }, "autorange": true }, "barmode": "stack", "autosize": true, "colorway": [ "#4c78a8", "#f58518", "#e45756", "#72b7b2", "#54a24b", "#eeca3b", "#b279a2", "#ff9da6", "#9d755d", "#bab0ac" ], "colorscale": { "sequential": [ [ 0, "#dcdcdc" ], [ 0.3333333333333333, "#f5c39d" ], [ 0.6666666666666666, "#f5a069" ], [ 1, "#b20a1c" ] ] } } }, "height": null, "width": null, "user": { "profile_url": "https://chart-studio.plotly.com/~wngns99", "avatar_url": "https://storage.googleapis.com/plotly-prod-profiles/21.jpg", "background_url": "https://storage.googleapis.com/plotly-prod-profiles/bg-11.jpg", "bio": "", "nickname": "", "website": "", "stream_tokens": null, "feature_set_id": null, "csrf_token": null, "date_joined": "2025-08-06 06:56:30", "mapbox_access_tokens": null, "has_password": null, "username": "wngns99", "email": null, "is_active": null, "readonly": null, "is_dash_creator": null, "dash_created_count": null, "is_chart_creator": null, "charts_created_count": null } }, { "creation_time": "2025-08-07T08:22:01.212426Z", "comments": { "results": [], "count": 0 }, "parented": true, "embed_url": "https://chart-studio.plotly.com/~EC./5.embed", "fid": "EC.:5", "filename": "Plot 5", "filetype": "plot", "img_url": "https://storage.googleapis.com/plotly-prod-images/EC./5/9_VDR2VMYLN3E7IW1FEZ1SQE1ZXT5FJL.png", "image_urls": { "default": "https://storage.googleapis.com/plotly-prod-images/EC./5/2_2AI203UJFWL7JBV3AQLD0XPLBR841K.png", "block-thumb": "https://storage.googleapis.com/plotly-prod-images/EC./5/8_4EX7QTQTKNZOAM0SBNOQDVTO9XDJ0Y.png", "list-thumb": "https://storage.googleapis.com/plotly-prod-images/EC./5/9_VDR2VMYLN3E7IW1FEZ1SQE1ZXT5FJL.png" }, "api_urls": { "files": "https://api.plotly.com/v2/files/EC.:5", "plots": "https://api.plotly.com/v2/plots/EC.:5", "parent": "https://api.plotly.com/v2/folders/home?user=EC." }, "owner": "EC.", "parent": -1, "preview": "", "referencers": [], "references": [], "title": "", "views": 1, "web_url": "https://chart-studio.plotly.com/~EC./5/", "world_readable": true, "date_modified": "2025-08-08T09:22:43.937Z", "stars": { "results": [], "count": 0 }, "collaborators": { "results": [], "count": 0 }, "subfolder_count": null, "refresh_interval": null, "organize_view_url": "https://chart-studio.plotly.com/~EC./5/", "current_user_permission": "read", "is_theme": null, "is_template": false, "autosize": true, "caption": "", "figure": { "data": [ { "meta": { "columnNames": { "x": "A", "y": "B" } }, "mode": "lines", "name": "P3", "type": "scatter", "xsrc": "EC.:4:e025e1", "ysrc": "EC.:4:f46b3d", "error_x": { "type": "constant", "color": "#636efa", "value": 10, "width": 4, "visible": false, "symmetric": true, "thickness": 2 }, "error_y": { "type": "percent", "color": "#636efa", "value": 10, "width": 4, "visible": false, "symmetric": false, "thickness": 2, "valueminus": 10 } }, { "meta": { "columnNames": { "x": "A", "y": "C" } }, "mode": "lines", "name": "P4", "type": "scatter", "xsrc": "EC.:4:e025e1", "ysrc": "EC.:4:49a994", "stackgroup": null }, { "meta": { "columnNames": { "x": "A", "y": "D" } }, "mode": "lines", "name": "P6", "type": "scatter", "xsrc": "EC.:4:e025e1", "ysrc": "EC.:4:dc157b", "stackgroup": null }, { "meta": { "columnNames": { "x": "A", "y": "E" } }, "mode": "lines", "name": "P7", "type": "scatter", "xsrc": "EC.:4:e025e1", "ysrc": "EC.:4:27e4aa", "stackgroup": null }, { "meta": { "columnNames": { "x": "A", "y": "F" } }, "mode": "lines", "name": "P8", "type": "scatter", "xsrc": "EC.:4:e025e1", "ysrc": "EC.:4:10c9ba", "stackgroup": null }, { "meta": { "columnNames": { "x": "A", "y": "G" } }, "mode": "lines", "name": "P10", "type": "scatter", "xsrc": "EC.:4:e025e1", "ysrc": "EC.:4:d19f4c", "stackgroup": null }, { "meta": { "columnNames": { "x": "A", "y": "H" } }, "mode": "lines", "name": "P12", "type": "scatter", "xsrc": "EC.:4:e025e1", "ysrc": "EC.:4:de8da5", "stackgroup": null }, { "meta": { "columnNames": { "x": "A", "y": "I" } }, "mode": "lines", "name": "P13", "type": "scatter", "xsrc": "EC.:4:e025e1", "ysrc": "EC.:4:6c71f1", "stackgroup": null }, { "meta": { "columnNames": { "x": "A", "y": "I" } }, "mode": "lines", "name": "P19", "type": "scatter", "xsrc": "EC.:4:e025e1", "ysrc": "EC.:4:6c71f1", "stackgroup": null }, { "meta": { "columnNames": { "x": "A", "y": "J" } }, "mode": "lines", "name": "P22", "type": "scatter", "xsrc": "EC.:4:e025e1", "ysrc": "EC.:4:ec4e11", "orientation": "v" }, { "meta": { "columnNames": { "x": "M", "y": "N", "error_y": { "array": "O" } } }, "mode": "lines", "name": "Moyenne", "type": "bar", "xsrc": "EC.:4:1fb6da", "ysrc": "EC.:4:6b1475", "marker": { "color": "#b6e880" }, "error_y": { "meta": { "columnNames": { "array": "O" } }, "type": "data", "color": "#444", "width": 4, "visible": true, "arraysrc": "EC.:4:0a2ca7", "traceref": 0, "symmetric": true, "thickness": 3, "tracerefminus": 0 }, "stackgroup": null, "orientation": "v", "textposition": "middle center" } ], "frames": [], "layout": { "font": { "size": 12 }, "title": { "x": 0.08, "text": "" }, "xaxis": { "type": "category", "range": [ -0.5, 1.5 ], "title": { "text": "Session" }, "tickson": "labels", "showgrid": true, "autorange": true }, "yaxis": { "range": [ -68.15056360555556, 26.744766505555557 ], "title": { "text": "Taux de variations de la force max (%)" }, "autorange": true }, "bargap": 0.63, "height": 555, "margin": { "b": 80, "l": 500, "r": 50, "t": 200 }, "autosize": false, "dragmode": "zoom", "template": { "data": { "bar": [ { "type": "bar", "marker": { "colorbar": { "ticks": "", "outlinewidth": 0 } } } ], "table": [ { "type": "table", "cells": { "fill": { "color": "#EBF0F8" }, "line": { "color": "white" } }, "header": { "fill": { "color": "#C8D4E3" }, "line": { "color": "white" } } } ], "carpet": [ { "type": "carpet", "aaxis": { "gridcolor": "#C8D4E3", "linecolor": "#C8D4E3", "endlinecolor": "#2a3f5f", "minorgridcolor": "#C8D4E3", "startlinecolor": "#2a3f5f" }, "baxis": { "gridcolor": "#C8D4E3", "linecolor": "#C8D4E3", "endlinecolor": "#2a3f5f", "minorgridcolor": "#C8D4E3", "startlinecolor": "#2a3f5f" } } ], "mesh3d": [ { "type": "mesh3d", "colorbar": { "ticks": "", "outlinewidth": 0 } } ], "contour": [ { "type": "contour", "colorbar": { "ticks": "", "outlinewidth": 0 }, "autocolorscale": true } ], "heatmap": [ { "type": "heatmap", "colorbar": { "ticks": "", "outlinewidth": 0 }, "autocolorscale": true } ], "scatter": [ { "type": "scatter", "marker": { "colorbar": { "ticks": "", "outlinewidth": 0 } } } ], "surface": [ { "type": "surface", "colorbar": { "ticks": "", "outlinewidth": 0 } } ], "heatmapgl": [ { "type": "heatmapgl", "colorbar": { "ticks": "", "outlinewidth": 0 } } ], "histogram": [ { "type": "histogram", "marker": { "colorbar": { "ticks": "", "outlinewidth": 0 } } } ], "parcoords": [ { "line": { "colorbar": { "ticks": "", "outlinewidth": 0 } }, "type": "parcoords" } ], "scatter3d": [ { "type": "scatter3d", "marker": { "colorbar": { "ticks": "", "outlinewidth": 0 } } } ], "scattergl": [ { "type": "scattergl", "marker": { "colorbar": { "ticks": "", "outlinewidth": 0 } } } ], "choropleth": [ { "type": "choropleth", "colorbar": { "ticks": "", "outlinewidth": 0 } } ], "scattergeo": [ { "type": "scattergeo", "marker": { "colorbar": { "ticks": "", "outlinewidth": 0 } } } ], "histogram2d": [ { "type": "histogram2d", "colorbar": { "ticks": "", "outlinewidth": 0 }, "autocolorscale": true } ], "scatterpolar": [ { "type": "scatterpolar", "marker": { "colorbar": { "ticks": "", "outlinewidth": 0 } } } ], "contourcarpet": [ { "type": "contourcarpet", "colorbar": { "ticks": "", "outlinewidth": 0 } } ], "scattercarpet": [ { "type": "scattercarpet", "marker": { "colorbar": { "ticks": "", "outlinewidth": 0 } } } ], "scattermapbox": [ { "type": "scattermapbox", "marker": { "colorbar": { "ticks": "", "outlinewidth": 0 } } } ], "scatterpolargl": [ { "type": "scatterpolargl", "marker": { "colorbar": { "ticks": "", "outlinewidth": 0 } } } ], "scatterternary": [ { "type": "scatterternary", "marker": { "colorbar": { "ticks": "", "outlinewidth": 0 } } } ], "histogram2dcontour": [ { "type": "histogram2dcontour", "colorbar": { "ticks": "", "outlinewidth": 0 }, "autocolorscale": true } ] }, "layout": { "geo": { "bgcolor": "white", "showland": true, "lakecolor": "white", "landcolor": "white", "showlakes": true, "subunitcolor": "#C8D4E3" }, "font": { "color": "#2a3f5f" }, "polar": { "bgcolor": "white", "radialaxis": { "ticks": "", "gridcolor": "#EBF0F8", "linecolor": "#EBF0F8" }, "angularaxis": { "ticks": "", "gridcolor": "#EBF0F8", "linecolor": "#EBF0F8" } }, "scene": { "xaxis": { "ticks": "", "gridcolor": "#DFE8F3", "gridwidth": 2, "linecolor": "#EBF0F8", "zerolinecolor": "#EBF0F8", "showbackground": true, "backgroundcolor": "white" }, "yaxis": { "ticks": "", "gridcolor": "#DFE8F3", "gridwidth": 2, "linecolor": "#EBF0F8", "zerolinecolor": "#EBF0F8", "showbackground": true, "backgroundcolor": "white" }, "zaxis": { "ticks": "", "gridcolor": "#DFE8F3", "gridwidth": 2, "linecolor": "#EBF0F8", "zerolinecolor": "#EBF0F8", "showbackground": true, "backgroundcolor": "white" } }, "title": { "x": 0.05 }, "xaxis": { "ticks": "", "gridcolor": "#EBF0F8", "linecolor": "#EBF0F8", "automargin": true, "zerolinecolor": "#EBF0F8", "zerolinewidth": 2 }, "yaxis": { "ticks": "", "gridcolor": "#EBF0F8", "linecolor": "#EBF0F8", "automargin": true, "zerolinecolor": "#EBF0F8", "zerolinewidth": 2 }, "ternary": { "aaxis": { "ticks": "", "gridcolor": "#DFE8F3", "linecolor": "#A2B1C6" }, "baxis": { "ticks": "", "gridcolor": "#DFE8F3", "linecolor": "#A2B1C6" }, "caxis": { "ticks": "", "gridcolor": "#DFE8F3", "linecolor": "#A2B1C6" }, "bgcolor": "white" }, "colorway": [ "#636efa", "#EF553B", "#00cc96", "#ab63fa", "#19d3f3", "#e763fa", "#fecb52", "#ffa15a", "#ff6692", "#b6e880" ], "hovermode": "closest", "colorscale": { "diverging": [ [ 0, "#8e0152" ], [ 0.1, "#c51b7d" ], [ 0.2, "#de77ae" ], [ 0.3, "#f1b6da" ], [ 0.4, "#fde0ef" ], [ 0.5, "#f7f7f7" ], [ 0.6, "#e6f5d0" ], [ 0.7, "#b8e186" ], [ 0.8, "#7fbc41" ], [ 0.9, "#4d9221" ], [ 1, "#276419" ] ], "sequential": [ [ 0, "#0508b8" ], [ 0.0893854748603352, "#1910d8" ], [ 0.1787709497206704, "#3c19f0" ], [ 0.2681564245810056, "#6b1cfb" ], [ 0.3575418994413408, "#981cfd" ], [ 0.44692737430167595, "#bf1cfd" ], [ 0.5363128491620112, "#dd2bfd" ], [ 0.6256983240223464, "#f246fe" ], [ 0.7150837988826816, "#fc67fd" ], [ 0.8044692737430168, "#fe88fc" ], [ 0.8938547486033519, "#fea5fd" ], [ 0.9832402234636871, "#febefe" ], [ 1, "#fec3fe" ] ], "sequentialminus": [ [ 0, "#0508b8" ], [ 0.0893854748603352, "#1910d8" ], [ 0.1787709497206704, "#3c19f0" ], [ 0.2681564245810056, "#6b1cfb" ], [ 0.3575418994413408, "#981cfd" ], [ 0.44692737430167595, "#bf1cfd" ], [ 0.5363128491620112, "#dd2bfd" ], [ 0.6256983240223464, "#f246fe" ], [ 0.7150837988826816, "#fc67fd" ], [ 0.8044692737430168, "#fe88fc" ], [ 0.8938547486033519, "#fea5fd" ], [ 0.9832402234636871, "#febefe" ], [ 1, "#fec3fe" ] ] }, "plot_bgcolor": "white", "paper_bgcolor": "white", "shapedefaults": { "line": { "width": 0 }, "opacity": 0.4, "fillcolor": "#506784" }, "annotationdefaults": { "arrowhead": 0, "arrowcolor": "#506784", "arrowwidth": 1 } }, "themeRef": "PLOTLY_WHITE" } } }, "height": 555, "width": null, "user": { "profile_url": "https://chart-studio.plotly.com/~EC.", "avatar_url": "https://storage.googleapis.com/plotly-prod-profiles/98.jpg", "background_url": "https://storage.googleapis.com/plotly-prod-profiles/bg-2.jpg", "bio": "", "nickname": "", "website": "", "stream_tokens": null, "feature_set_id": null, "csrf_token": null, "date_joined": "2025-08-04 14:38:25", "mapbox_access_tokens": null, "has_password": null, "username": "EC.", "email": null, "is_active": null, "readonly": null, "is_dash_creator": null, "dash_created_count": null, "is_chart_creator": null, "charts_created_count": null } }, { "creation_time": "2025-08-07T08:12:43.759094Z", "comments": { "results": [], "count": 0 }, "parented": true, "embed_url": "https://chart-studio.plotly.com/~antle/218.embed", "fid": "antle:218", "filename": "antle21", "filetype": "plot", "img_url": "https://storage.googleapis.com/plotly-prod-images/antle/218/9_09QZZMOKN2M45K3MGTW6XPWKNYJC9N.png", "image_urls": { "default": "https://storage.googleapis.com/plotly-prod-images/antle/218/2_TIWQNDZAM8IAW0HXO5ZQN1397X18CS.png", "block-thumb": "https://storage.googleapis.com/plotly-prod-images/antle/218/8_DJIB0NVDAZ7IIMCIL8OJO9JM9K8VVQ.png", "list-thumb": "https://storage.googleapis.com/plotly-prod-images/antle/218/9_09QZZMOKN2M45K3MGTW6XPWKNYJC9N.png" }, "api_urls": { "files": "https://api.plotly.com/v2/files/antle:218", "plots": "https://api.plotly.com/v2/plots/antle:218", "parent": "https://api.plotly.com/v2/folders/home?user=antle" }, "owner": "antle", "parent": -1, "preview": "", "referencers": [], "references": [], "title": "", "views": 1, "web_url": "https://chart-studio.plotly.com/~antle/218/", "world_readable": true, "date_modified": "2025-08-07T08:12:43.769Z", "stars": { "results": [], "count": 0 }, "collaborators": { "results": [], "count": 0 }, "subfolder_count": null, "refresh_interval": null, "organize_view_url": "https://chart-studio.plotly.com/~antle/218/", "current_user_permission": "read", "is_theme": null, "is_template": null, "autosize": true, "caption": "", "figure": { "data": [ { "type": "pie", "marker": { "colorssrc": "antle:217:1c357b" }, "pullsrc": "antle:217:534b6a", "textinfo": "label+percent+value", "labelssrc": "antle:217:cbaa80", "valuessrc": "antle:217:4bb7c3" } ], "layout": { "title": { "text": "성남시 노령 인구 비율" }, "height": 500, "template": { "data": { "bar": [ { "type": "bar", "marker": { "line": { "color": "#E5ECF6", "width": 0.5 }, "pattern": { "size": 10, "fillmode": "overlay", "solidity": 0.2 } }, "error_x": { "color": "#2a3f5f" }, "error_y": { "color": "#2a3f5f" } } ], "pie": [ { "type": "pie", "automargin": true } ], "table": [ { "type": "table", "cells": { "fill": { "color": "#EBF0F8" }, "line": { "color": "white" } }, "header": { "fill": { "color": "#C8D4E3" }, "line": { "color": "white" } } } ], "carpet": [ { "type": "carpet", "aaxis": { "gridcolor": "white", "linecolor": "white", "endlinecolor": "#2a3f5f", "minorgridcolor": "white", "startlinecolor": "#2a3f5f" }, "baxis": { "gridcolor": "white", "linecolor": "white", "endlinecolor": "#2a3f5f", "minorgridcolor": "white", "startlinecolor": "#2a3f5f" } } ], "mesh3d": [ { "type": "mesh3d", "colorbar": { "ticks": "", "outlinewidth": 0 } } ], "contour": [ { "type": "contour", "colorbar": { "ticks": "", "outlinewidth": 0 }, "colorscale": [ [ 0.0, "#0d0887" ], [ 0.1111111111111111, "#46039f" ], [ 0.2222222222222222, "#7201a8" ], [ 0.3333333333333333, "#9c179e" ], [ 0.4444444444444444, "#bd3786" ], [ 0.5555555555555556, "#d8576b" ], [ 0.6666666666666666, "#ed7953" ], [ 0.7777777777777778, "#fb9f3a" ], [ 0.8888888888888888, "#fdca26" ], [ 1.0, "#f0f921" ] ] } ], "heatmap": [ { "type": "heatmap", "colorbar": { "ticks": "", "outlinewidth": 0 }, "colorscale": [ [ 0.0, "#0d0887" ], [ 0.1111111111111111, "#46039f" ], [ 0.2222222222222222, "#7201a8" ], [ 0.3333333333333333, "#9c179e" ], [ 0.4444444444444444, "#bd3786" ], [ 0.5555555555555556, "#d8576b" ], [ 0.6666666666666666, "#ed7953" ], [ 0.7777777777777778, "#fb9f3a" ], [ 0.8888888888888888, "#fdca26" ], [ 1.0, "#f0f921" ] ] } ], "scatter": [ { "type": "scatter", "fillpattern": { "size": 10, "fillmode": "overlay", "solidity": 0.2 } } ], "surface": [ { "type": "surface", "colorbar": { "ticks": "", "outlinewidth": 0 }, "colorscale": [ [ 0.0, "#0d0887" ], [ 0.1111111111111111, "#46039f" ], [ 0.2222222222222222, "#7201a8" ], [ 0.3333333333333333, "#9c179e" ], [ 0.4444444444444444, "#bd3786" ], [ 0.5555555555555556, "#d8576b" ], [ 0.6666666666666666, "#ed7953" ], [ 0.7777777777777778, "#fb9f3a" ], [ 0.8888888888888888, "#fdca26" ], [ 1.0, "#f0f921" ] ] } ], "barpolar": [ { "type": "barpolar", "marker": { "line": { "color": "#E5ECF6", "width": 0.5 }, "pattern": { "size": 10, "fillmode": "overlay", "solidity": 0.2 } } } ], "heatmapgl": [ { "type": "heatmapgl", "colorbar": { "ticks": "", "outlinewidth": 0 }, "colorscale": [ [ 0.0, "#0d0887" ], [ 0.1111111111111111, "#46039f" ], [ 0.2222222222222222, "#7201a8" ], [ 0.3333333333333333, "#9c179e" ], [ 0.4444444444444444, "#bd3786" ], [ 0.5555555555555556, "#d8576b" ], [ 0.6666666666666666, "#ed7953" ], [ 0.7777777777777778, "#fb9f3a" ], [ 0.8888888888888888, "#fdca26" ], [ 1.0, "#f0f921" ] ] } ], "histogram": [ { "type": "histogram", "marker": { "pattern": { "size": 10, "fillmode": "overlay", "solidity": 0.2 } } } ], "parcoords": [ { "line": { "colorbar": { "ticks": "", "outlinewidth": 0 } }, "type": "parcoords" } ], "scatter3d": [ { "line": { "colorbar": { "ticks": "", "outlinewidth": 0 } }, "type": "scatter3d", "marker": { "colorbar": { "ticks": "", "outlinewidth": 0 } } } ], "scattergl": [ { "type": "scattergl", "marker": { "colorbar": { "ticks": "", "outlinewidth": 0 } } } ], "choropleth": [ { "type": "choropleth", "colorbar": { "ticks": "", "outlinewidth": 0 } } ], "scattergeo": [ { "type": "scattergeo", "marker": { "colorbar": { "ticks": "", "outlinewidth": 0 } } } ], "histogram2d": [ { "type": "histogram2d", "colorbar": { "ticks": "", "outlinewidth": 0 }, "colorscale": [ [ 0.0, "#0d0887" ], [ 0.1111111111111111, "#46039f" ], [ 0.2222222222222222, "#7201a8" ], [ 0.3333333333333333, "#9c179e" ], [ 0.4444444444444444, "#bd3786" ], [ 0.5555555555555556, "#d8576b" ], [ 0.6666666666666666, "#ed7953" ], [ 0.7777777777777778, "#fb9f3a" ], [ 0.8888888888888888, "#fdca26" ], [ 1.0, "#f0f921" ] ] } ], "scatterpolar": [ { "type": "scatterpolar", "marker": { "colorbar": { "ticks": "", "outlinewidth": 0 } } } ], "contourcarpet": [ { "type": "contourcarpet", "colorbar": { "ticks": "", "outlinewidth": 0 } } ], "scattercarpet": [ { "type": "scattercarpet", "marker": { "colorbar": { "ticks": "", "outlinewidth": 0 } } } ], "scattermapbox": [ { "type": "scattermapbox", "marker": { "colorbar": { "ticks": "", "outlinewidth": 0 } } } ], "scatterpolargl": [ { "type": "scatterpolargl", "marker": { "colorbar": { "ticks": "", "outlinewidth": 0 } } } ], "scatterternary": [ { "type": "scatterternary", "marker": { "colorbar": { "ticks": "", "outlinewidth": 0 } } } ], "histogram2dcontour": [ { "type": "histogram2dcontour", "colorbar": { "ticks": "", "outlinewidth": 0 }, "colorscale": [ [ 0.0, "#0d0887" ], [ 0.1111111111111111, "#46039f" ], [ 0.2222222222222222, "#7201a8" ], [ 0.3333333333333333, "#9c179e" ], [ 0.4444444444444444, "#bd3786" ], [ 0.5555555555555556, "#d8576b" ], [ 0.6666666666666666, "#ed7953" ], [ 0.7777777777777778, "#fb9f3a" ], [ 0.8888888888888888, "#fdca26" ], [ 1.0, "#f0f921" ] ] } ] }, "layout": { "geo": { "bgcolor": "white", "showland": true, "lakecolor": "white", "landcolor": "#E5ECF6", "showlakes": true, "subunitcolor": "white" }, "font": { "color": "#2a3f5f" }, "polar": { "bgcolor": "#E5ECF6", "radialaxis": { "ticks": "", "gridcolor": "white", "linecolor": "white" }, "angularaxis": { "ticks": "", "gridcolor": "white", "linecolor": "white" } }, "scene": { "xaxis": { "ticks": "", "gridcolor": "white", "gridwidth": 2, "linecolor": "white", "zerolinecolor": "white", "showbackground": true, "backgroundcolor": "#E5ECF6" }, "yaxis": { "ticks": "", "gridcolor": "white", "gridwidth": 2, "linecolor": "white", "zerolinecolor": "white", "showbackground": true, "backgroundcolor": "#E5ECF6" }, "zaxis": { "ticks": "", "gridcolor": "white", "gridwidth": 2, "linecolor": "white", "zerolinecolor": "white", "showbackground": true, "backgroundcolor": "#E5ECF6" } }, "title": { "x": 0.05 }, "xaxis": { "ticks": "", "title": { "standoff": 15 }, "gridcolor": "white", "linecolor": "white", "automargin": true, "zerolinecolor": "white", "zerolinewidth": 2 }, "yaxis": { "ticks": "", "title": { "standoff": 15 }, "gridcolor": "white", "linecolor": "white", "automargin": true, "zerolinecolor": "white", "zerolinewidth": 2 }, "mapbox": { "style": "light" }, "ternary": { "aaxis": { "ticks": "", "gridcolor": "white", "linecolor": "white" }, "baxis": { "ticks": "", "gridcolor": "white", "linecolor": "white" }, "caxis": { "ticks": "", "gridcolor": "white", "linecolor": "white" }, "bgcolor": "#E5ECF6" }, "colorway": [ "#636efa", "#EF553B", "#00cc96", "#ab63fa", "#FFA15A", "#19d3f3", "#FF6692", "#B6E880", "#FF97FF", "#FECB52" ], "coloraxis": { "colorbar": { "ticks": "", "outlinewidth": 0 } }, "hovermode": "closest", "colorscale": { "diverging": [ [ 0, "#8e0152" ], [ 0.1, "#c51b7d" ], [ 0.2, "#de77ae" ], [ 0.3, "#f1b6da" ], [ 0.4, "#fde0ef" ], [ 0.5, "#f7f7f7" ], [ 0.6, "#e6f5d0" ], [ 0.7, "#b8e186" ], [ 0.8, "#7fbc41" ], [ 0.9, "#4d9221" ], [ 1, "#276419" ] ], "sequential": [ [ 0.0, "#0d0887" ], [ 0.1111111111111111, "#46039f" ], [ 0.2222222222222222, "#7201a8" ], [ 0.3333333333333333, "#9c179e" ], [ 0.4444444444444444, "#bd3786" ], [ 0.5555555555555556, "#d8576b" ], [ 0.6666666666666666, "#ed7953" ], [ 0.7777777777777778, "#fb9f3a" ], [ 0.8888888888888888, "#fdca26" ], [ 1.0, "#f0f921" ] ], "sequentialminus": [ [ 0.0, "#0d0887" ], [ 0.1111111111111111, "#46039f" ], [ 0.2222222222222222, "#7201a8" ], [ 0.3333333333333333, "#9c179e" ], [ 0.4444444444444444, "#bd3786" ], [ 0.5555555555555556, "#d8576b" ], [ 0.6666666666666666, "#ed7953" ], [ 0.7777777777777778, "#fb9f3a" ], [ 0.8888888888888888, "#fdca26" ], [ 1.0, "#f0f921" ] ] }, "hoverlabel": { "align": "left" }, "plot_bgcolor": "#E5ECF6", "paper_bgcolor": "white", "shapedefaults": { "line": { "color": "#2a3f5f" } }, "autotypenumbers": "strict", "annotationdefaults": { "arrowhead": 0, "arrowcolor": "#2a3f5f", "arrowwidth": 1 } } }, "annotations": [ { "x": 0.5, "y": 0.5, "font": { "size": 24 }, "text": "100%", "showarrow": false } ] } }, "height": 500, "width": null, "user": { "profile_url": "https://chart-studio.plotly.com/~antle", "avatar_url": "https://storage.googleapis.com/plotly-prod-profiles/54.jpg", "background_url": "https://storage.googleapis.com/plotly-prod-profiles/bg-9.jpg", "bio": "", "nickname": "", "website": "", "stream_tokens": null, "feature_set_id": null, "csrf_token": null, "date_joined": "2025-06-17 11:08:35", "mapbox_access_tokens": null, "has_password": null, "username": "antle", "email": null, "is_active": null, "readonly": null, "is_dash_creator": null, "dash_created_count": null, "is_chart_creator": null, "charts_created_count": null } }, { "creation_time": "2025-08-07T07:47:12.034409Z", "comments": { "results": [], "count": 0 }, "parented": true, "embed_url": "https://chart-studio.plotly.com/~aidenshin/18.embed", "fid": "aidenshin:18", "filename": "Epoch 진행에 따른 Residual 변화 : MAE(avg) 기준 top-70 (out of 1400)", "filetype": "plot", "img_url": "https://api.plotly.com/v2/files/aidenshin:18/image?image_name=list-thumb", "image_urls": { "default": "https://storage.googleapis.com/plotly-prod-images/aidenshin/18/2_QXFBNK0P0CDWG1Q4GU15VZUKUQJQDS.png", "block-thumb": "https://storage.googleapis.com/plotly-prod-images/aidenshin/18/8_7GUL68SJUP3QCGVXAO31PT2V71AZ6Z.png", "list-thumb": "https://api.plotly.com/v2/files/aidenshin:18/image?image_name=list-thumb" }, "api_urls": { "files": "https://api.plotly.com/v2/files/aidenshin:18", "plots": "https://api.plotly.com/v2/plots/aidenshin:18", "parent": "https://api.plotly.com/v2/folders/home?user=aidenshin" }, "owner": "aidenshin", "parent": -1, "preview": "", "referencers": [], "references": [], "title": "", "views": 0, "web_url": "https://chart-studio.plotly.com/~aidenshin/18/", "world_readable": true, "date_modified": "2025-08-07T07:47:12.043Z", "stars": { "results": [], "count": 0 }, "collaborators": { "results": [], "count": 0 }, "subfolder_count": null, "refresh_interval": null, "organize_view_url": "https://chart-studio.plotly.com/~aidenshin/18/", "current_user_permission": "read", "is_theme": null, "is_template": null, "autosize": true, "caption": "", "figure": { "data": [ { "line": { "color": "rgba(68,1,84,0.8)", "width": 1.0 }, "mode": "lines", "name": "sample 821", "type": "scatter", "xsrc": "aidenshin:17:d98bd4", "ysrc": "aidenshin:17:bb1ee8", "hoverinfo": "text+y", "hoverlabel": { "font": { "size": 13 }, "align": "left", "namelength": -1 }, "showlegend": false, "hovertextsrc": "aidenshin:17:da24e6" }, { "line": { "color": "rgba(69,5,89,0.8)", "width": 1.0 }, "mode": "lines", "name": "sample 718", "type": "scatter", "xsrc": "aidenshin:17:dccbb8", "ysrc": "aidenshin:17:1b1fbf", "hoverinfo": "text+y", "hoverlabel": { "font": { "size": 13 }, "align": "left", "namelength": -1 }, "showlegend": false, "hovertextsrc": "aidenshin:17:a14426" }, { "line": { "color": "rgba(70,11,94,0.8)", "width": 1.0 }, "mode": "lines", "name": "sample 462", "type": "scatter", "xsrc": "aidenshin:17:ec7efa", "ysrc": "aidenshin:17:17aba5", "hoverinfo": "text+y", "hoverlabel": { "font": { "size": 13 }, "align": "left", "namelength": -1 }, "showlegend": false, "hovertextsrc": "aidenshin:17:0b5411" }, { "line": { "color": "rgba(71,17,100,0.8)", "width": 1.0 }, "mode": "lines", "name": "sample 828", "type": "scatter", "xsrc": "aidenshin:17:5f6d02", "ysrc": "aidenshin:17:3f7969", "hoverinfo": "text+y", "hoverlabel": { "font": { "size": 13 }, "align": "left", "namelength": -1 }, "showlegend": false, "hovertextsrc": "aidenshin:17:8ec2a0" }, { "line": { "color": "rgba(72,22,104,0.8)", "width": 1.0 }, "mode": "lines", "name": "sample 1014", "type": "scatter", "xsrc": "aidenshin:17:1f98b0", "ysrc": "aidenshin:17:c091af", "hoverinfo": "text+y", "hoverlabel": { "font": { "size": 13 }, "align": "left", "namelength": -1 }, "showlegend": false, "hovertextsrc": "aidenshin:17:7282a8" }, { "line": { "color": "rgba(72,27,109,0.8)", "width": 1.0 }, "mode": "lines", "name": "sample 71", "type": "scatter", "xsrc": "aidenshin:17:b7f726", "ysrc": "aidenshin:17:9d41c9", "hoverinfo": "text+y", "hoverlabel": { "font": { "size": 13 }, "align": "left", "namelength": -1 }, "showlegend": false, "hovertextsrc": "aidenshin:17:f9cc0b" }, { "line": { "color": "rgba(72,32,113,0.8)", "width": 1.0 }, "mode": "lines", "name": "sample 86", "type": "scatter", "xsrc": "aidenshin:17:698af7", "ysrc": "aidenshin:17:908fdb", "hoverinfo": "text+y", "hoverlabel": { "font": { "size": 13 }, "align": "left", "namelength": -1 }, "showlegend": false, "hovertextsrc": "aidenshin:17:62a2a4" }, { "line": { "color": "rgba(72,36,117,0.8)", "width": 1.0 }, "mode": "lines", "name": "sample 785", "type": "scatter", "xsrc": "aidenshin:17:881d16", "ysrc": "aidenshin:17:57bbaa", "hoverinfo": "text+y", "hoverlabel": { "font": { "size": 13 }, "align": "left", "namelength": -1 }, "showlegend": false, "hovertextsrc": "aidenshin:17:775475" }, { "line": { "color": "rgba(72,41,121,0.8)", "width": 1.0 }, "mode": "lines", "name": "sample 1148", "type": "scatter", "xsrc": "aidenshin:17:628d05", "ysrc": "aidenshin:17:2ca601", "hoverinfo": "text+y", "hoverlabel": { "font": { "size": 13 }, "align": "left", "namelength": -1 }, "showlegend": false, "hovertextsrc": "aidenshin:17:300e08" }, { "line": { "color": "rgba(71,46,124,0.8)", "width": 1.0 }, "mode": "lines", "name": "sample 263", "type": "scatter", "xsrc": "aidenshin:17:75a1f7", "ysrc": "aidenshin:17:323950", "hoverinfo": "text+y", "hoverlabel": { "font": { "size": 13 }, "align": "left", "namelength": -1 }, "showlegend": false, "hovertextsrc": "aidenshin:17:a39269" }, { "line": { "color": "rgba(70,51,127,0.8)", "width": 1.0 }, "mode": "lines", "name": "sample 961", "type": "scatter", "xsrc": "aidenshin:17:94a1b8", "ysrc": "aidenshin:17:50cfd7", "hoverinfo": "text+y", "hoverlabel": { "font": { "size": 13 }, "align": "left", "namelength": -1 }, "showlegend": false, "hovertextsrc": "aidenshin:17:43917c" }, { "line": { "color": "rgba(69,55,129,0.8)", "width": 1.0 }, "mode": "lines", "name": "sample 1180", "type": "scatter", "xsrc": "aidenshin:17:cb371e", "ysrc": "aidenshin:17:41aa50", "hoverinfo": "text+y", "hoverlabel": { "font": { "size": 13 }, "align": "left", "namelength": -1 }, "showlegend": false, "hovertextsrc": "aidenshin:17:742238" }, { "line": { "color": "rgba(68,59,132,0.8)", "width": 1.0 }, "mode": "lines", "name": "sample 382", "type": "scatter", "xsrc": "aidenshin:17:262d06", "ysrc": "aidenshin:17:020c63", "hoverinfo": "text+y", "hoverlabel": { "font": { "size": 13 }, "align": "left", "namelength": -1 }, "showlegend": false, "hovertextsrc": "aidenshin:17:d15a7e" }, { "line": { "color": "rgba(66,64,134,0.8)", "width": 1.0 }, "mode": "lines", "name": "sample 832", "type": "scatter", "xsrc": "aidenshin:17:a703f1", "ysrc": "aidenshin:17:424118", "hoverinfo": "text+y", "hoverlabel": { "font": { "size": 13 }, "align": "left", "namelength": -1 }, "showlegend": false, "hovertextsrc": "aidenshin:17:8ae907" }, { "line": { "color": "rgba(65,68,135,0.8)", "width": 1.0 }, "mode": "lines", "name": "sample 84", "type": "scatter", "xsrc": "aidenshin:17:47376c", "ysrc": "aidenshin:17:e611c6", "hoverinfo": "text+y", "hoverlabel": { "font": { "size": 13 }, "align": "left", "namelength": -1 }, "showlegend": false, "hovertextsrc": "aidenshin:17:806a08" }, { "line": { "color": "rgba(63,72,137,0.8)", "width": 1.0 }, "mode": "lines", "name": "sample 357", "type": "scatter", "xsrc": "aidenshin:17:9682c3", "ysrc": "aidenshin:17:0469c0", "hoverinfo": "text+y", "hoverlabel": { "font": { "size": 13 }, "align": "left", "namelength": -1 }, "showlegend": false, "hovertextsrc": "aidenshin:17:b5d622" }, { "line": { "color": "rgba(61,77,138,0.8)", "width": 1.0 }, "mode": "lines", "name": "sample 117", "type": "scatter", "xsrc": "aidenshin:17:faea18", "ysrc": "aidenshin:17:c51979", "hoverinfo": "text+y", "hoverlabel": { "font": { "size": 13 }, "align": "left", "namelength": -1 }, "showlegend": false, "hovertextsrc": "aidenshin:17:91986b" }, { "line": { "color": "rgba(59,81,139,0.8)", "width": 1.0 }, "mode": "lines", "name": "sample 795", "type": "scatter", "xsrc": "aidenshin:17:510bae", "ysrc": "aidenshin:17:57d64a", "hoverinfo": "text+y", "hoverlabel": { "font": { "size": 13 }, "align": "left", "namelength": -1 }, "showlegend": false, "hovertextsrc": "aidenshin:17:7f06a8" }, { "line": { "color": "rgba(58,84,140,0.8)", "width": 1.0 }, "mode": "lines", "name": "sample 579", "type": "scatter", "xsrc": "aidenshin:17:5cb0b5", "ysrc": "aidenshin:17:e14d8f", "hoverinfo": "text+y", "hoverlabel": { "font": { "size": 13 }, "align": "left", "namelength": -1 }, "showlegend": false, "hovertextsrc": "aidenshin:17:9e1581" }, { "line": { "color": "rgba(56,89,140,0.8)", "width": 1.0 }, "mode": "lines", "name": "sample 1362", "type": "scatter", "xsrc": "aidenshin:17:f03e3f", "ysrc": "aidenshin:17:7bc456", "hoverinfo": "text+y", "hoverlabel": { "font": { "size": 13 }, "align": "left", "namelength": -1 }, "showlegend": false, "hovertextsrc": "aidenshin:17:973e44" }, { "line": { "color": "rgba(54,93,141,0.8)", "width": 1.0 }, "mode": "lines", "name": "sample 212", "type": "scatter", "xsrc": "aidenshin:17:72628a", "ysrc": "aidenshin:17:013734", "hoverinfo": "text+y", "hoverlabel": { "font": { "size": 13 }, "align": "left", "namelength": -1 }, "showlegend": false, "hovertextsrc": "aidenshin:17:d10dfc" }, { "line": { "color": "rgba(52,96,141,0.8)", "width": 1.0 }, "mode": "lines", "name": "sample 995", "type": "scatter", "xsrc": "aidenshin:17:7caa68", "ysrc": "aidenshin:17:414831", "hoverinfo": "text+y", "hoverlabel": { "font": { "size": 13 }, "align": "left", "namelength": -1 }, "showlegend": false, "hovertextsrc": "aidenshin:17:2b8f97" }, { "line": { "color": "rgba(50,100,142,0.8)", "width": 1.0 }, "mode": "lines", "name": "sample 1055", "type": "scatter", "xsrc": "aidenshin:17:2d5121", "ysrc": "aidenshin:17:884b6a", "hoverinfo": "text+y", "hoverlabel": { "font": { "size": 13 }, "align": "left", "namelength": -1 }, "showlegend": false, "hovertextsrc": "aidenshin:17:60ca74" }, { "line": { "color": "rgba(49,104,142,0.8)", "width": 1.0 }, "mode": "lines", "name": "sample 953", "type": "scatter", "xsrc": "aidenshin:17:d7153c", "ysrc": "aidenshin:17:faea81", "hoverinfo": "text+y", "hoverlabel": { "font": { "size": 13 }, "align": "left", "namelength": -1 }, "showlegend": false, "hovertextsrc": "aidenshin:17:da98e7" }, { "line": { "color": "rgba(47,108,142,0.8)", "width": 1.0 }, "mode": "lines", "name": "sample 1096", "type": "scatter", "xsrc": "aidenshin:17:4e865f", "ysrc": "aidenshin:17:4f0d4e", "hoverinfo": "text+y", "hoverlabel": { "font": { "size": 13 }, "align": "left", "namelength": -1 }, "showlegend": false, "hovertextsrc": "aidenshin:17:7a3a3a" }, { "line": { "color": "rgba(46,111,142,0.8)", "width": 1.0 }, "mode": "lines", "name": "sample 1037", "type": "scatter", "xsrc": "aidenshin:17:5d96c2", "ysrc": "aidenshin:17:2d7efc", "hoverinfo": "text+y", "hoverlabel": { "font": { "size": 13 }, "align": "left", "namelength": -1 }, "showlegend": false, "hovertextsrc": "aidenshin:17:24cda3" }, { "line": { "color": "rgba(44,114,142,0.8)", "width": 1.0 }, "mode": "lines", "name": "sample 509", "type": "scatter", "xsrc": "aidenshin:17:56242f", "ysrc": "aidenshin:17:33c8a8", "hoverinfo": "text+y", "hoverlabel": { "font": { "size": 13 }, "align": "left", "namelength": -1 }, "showlegend": false, "hovertextsrc": "aidenshin:17:ac876e" }, { "line": { "color": "rgba(42,118,142,0.8)", "width": 1.0 }, "mode": "lines", "name": "sample 346", "type": "scatter", "xsrc": "aidenshin:17:be0f4c", "ysrc": "aidenshin:17:e297d5", "hoverinfo": "text+y", "hoverlabel": { "font": { "size": 13 }, "align": "left", "namelength": -1 }, "showlegend": false, "hovertextsrc": "aidenshin:17:6cef75" }, { "line": { "color": "rgba(41,121,142,0.8)", "width": 1.0 }, "mode": "lines", "name": "sample 542", "type": "scatter", "xsrc": "aidenshin:17:a5c738", "ysrc": "aidenshin:17:75cb14", "hoverinfo": "text+y", "hoverlabel": { "font": { "size": 13 }, "align": "left", "namelength": -1 }, "showlegend": false, "hovertextsrc": "aidenshin:17:60ea64" }, { "line": { "color": "rgba(40,125,142,0.8)", "width": 1.0 }, "mode": "lines", "name": "sample 987", "type": "scatter", "xsrc": "aidenshin:17:a39457", "ysrc": "aidenshin:17:62077d", "hoverinfo": "text+y", "hoverlabel": { "font": { "size": 13 }, "align": "left", "namelength": -1 }, "showlegend": false, "hovertextsrc": "aidenshin:17:79ee2b" }, { "line": { "color": "rgba(38,129,142,0.8)", "width": 1.0 }, "mode": "lines", "name": "sample 1206", "type": "scatter", "xsrc": "aidenshin:17:f99419", "ysrc": "aidenshin:17:0c94ff", "hoverinfo": "text+y", "hoverlabel": { "font": { "size": 13 }, "align": "left", "namelength": -1 }, "showlegend": false, "hovertextsrc": "aidenshin:17:27bb6b" }, { "line": { "color": "rgba(37,132,142,0.8)", "width": 1.0 }, "mode": "lines", "name": "sample 1130", "type": "scatter", "xsrc": "aidenshin:17:d42a70", "ysrc": "aidenshin:17:b650c0", "hoverinfo": "text+y", "hoverlabel": { "font": { "size": 13 }, "align": "left", "namelength": -1 }, "showlegend": false, "hovertextsrc": "aidenshin:17:a9fc1d" }, { "line": { "color": "rgba(36,135,142,0.8)", "width": 1.0 }, "mode": "lines", "name": "sample 1128", "type": "scatter", "xsrc": "aidenshin:17:abaa49", "ysrc": "aidenshin:17:a34d8b", "hoverinfo": "text+y", "hoverlabel": { "font": { "size": 13 }, "align": "left", "namelength": -1 }, "showlegend": false, "hovertextsrc": "aidenshin:17:3e1066" }, { "line": { "color": "rgba(34,139,141,0.8)", "width": 1.0 }, "mode": "lines", "name": "sample 566", "type": "scatter", "xsrc": "aidenshin:17:b16035", "ysrc": "aidenshin:17:34ffb9", "hoverinfo": "text+y", "hoverlabel": { "font": { "size": 13 }, "align": "left", "namelength": -1 }, "showlegend": false, "hovertextsrc": "aidenshin:17:5025dc" }, { "line": { "color": "rgba(33,143,141,0.8)", "width": 1.0 }, "mode": "lines", "name": "sample 1059", "type": "scatter", "xsrc": "aidenshin:17:55c140", "ysrc": "aidenshin:17:5b9223", "hoverinfo": "text+y", "hoverlabel": { "font": { "size": 13 }, "align": "left", "namelength": -1 }, "showlegend": false, "hovertextsrc": "aidenshin:17:c19c62" }, { "line": { "color": "rgba(32,146,140,0.8)", "width": 1.0 }, "mode": "lines", "name": "sample 606", "type": "scatter", "xsrc": "aidenshin:17:2b6c5e", "ysrc": "aidenshin:17:a34573", "hoverinfo": "text+y", "hoverlabel": { "font": { "size": 13 }, "align": "left", "namelength": -1 }, "showlegend": false, "hovertextsrc": "aidenshin:17:d23809" }, { "line": { "color": "rgba(32,146,140,0.8)", "width": 1.0 }, "mode": "lines", "name": "sample 535", "type": "scatter", "xsrc": "aidenshin:17:109eda", "ysrc": "aidenshin:17:593903", "hoverinfo": "text+y", "hoverlabel": { "font": { "size": 13 }, "align": "left", "namelength": -1 }, "showlegend": false, "hovertextsrc": "aidenshin:17:a9df74" }, { "line": { "color": "rgba(31,153,138,0.8)", "width": 1.0 }, "mode": "lines", "name": "sample 1280", "type": "scatter", "xsrc": "aidenshin:17:528ce1", "ysrc": "aidenshin:17:c81ac0", "hoverinfo": "text+y", "hoverlabel": { "font": { "size": 13 }, "align": "left", "namelength": -1 }, "showlegend": false, "hovertextsrc": "aidenshin:17:e48f92" }, { "line": { "color": "rgba(30,156,137,0.8)", "width": 1.0 }, "mode": "lines", "name": "sample 877", "type": "scatter", "xsrc": "aidenshin:17:d6ffa2", "ysrc": "aidenshin:17:0f8afb", "hoverinfo": "text+y", "hoverlabel": { "font": { "size": 13 }, "align": "left", "namelength": -1 }, "showlegend": false, "hovertextsrc": "aidenshin:17:2cf056" }, { "line": { "color": "rgba(31,160,136,0.8)", "width": 1.0 }, "mode": "lines", "name": "sample 925", "type": "scatter", "xsrc": "aidenshin:17:17b62a", "ysrc": "aidenshin:17:8c010f", "hoverinfo": "text+y", "hoverlabel": { "font": { "size": 13 }, "align": "left", "namelength": -1 }, "showlegend": false, "hovertextsrc": "aidenshin:17:09e8f9" }, { "line": { "color": "rgba(32,163,134,0.8)", "width": 1.0 }, "mode": "lines", "name": "sample 986", "type": "scatter", "xsrc": "aidenshin:17:e69dea", "ysrc": "aidenshin:17:80fec7", "hoverinfo": "text+y", "hoverlabel": { "font": { "size": 13 }, "align": "left", "namelength": -1 }, "showlegend": false, "hovertextsrc": "aidenshin:17:388414" }, { "line": { "color": "rgba(34,167,133,0.8)", "width": 1.0 }, "mode": "lines", "name": "sample 354", "type": "scatter", "xsrc": "aidenshin:17:d79e06", "ysrc": "aidenshin:17:4dcd12", "hoverinfo": "text+y", "hoverlabel": { "font": { "size": 13 }, "align": "left", "namelength": -1 }, "showlegend": false, "hovertextsrc": "aidenshin:17:2c63dc" }, { "line": { "color": "rgba(36,170,131,0.8)", "width": 1.0 }, "mode": "lines", "name": "sample 1069", "type": "scatter", "xsrc": "aidenshin:17:590712", "ysrc": "aidenshin:17:f4ae20", "hoverinfo": "text+y", "hoverlabel": { "font": { "size": 13 }, "align": "left", "namelength": -1 }, "showlegend": false, "hovertextsrc": "aidenshin:17:07b00d" }, { "line": { "color": "rgba(39,173,129,0.8)", "width": 1.0 }, "mode": "lines", "name": "sample 706", "type": "scatter", "xsrc": "aidenshin:17:4ff9f7", "ysrc": "aidenshin:17:aab58f", "hoverinfo": "text+y", "hoverlabel": { "font": { "size": 13 }, "align": "left", "namelength": -1 }, "showlegend": false, "hovertextsrc": "aidenshin:17:daf52a" }, { "line": { "color": "rgba(44,177,126,0.8)", "width": 1.0 }, "mode": "lines", "name": "sample 644", "type": "scatter", "xsrc": "aidenshin:17:4a1390", "ysrc": "aidenshin:17:9e9d5e", "hoverinfo": "text+y", "hoverlabel": { "font": { "size": 13 }, "align": "left", "namelength": -1 }, "showlegend": false, "hovertextsrc": "aidenshin:17:c98492" }, { "line": { "color": "rgba(47,180,124,0.8)", "width": 1.0 }, "mode": "lines", "name": "sample 956", "type": "scatter", "xsrc": "aidenshin:17:7d9981", "ysrc": "aidenshin:17:a6c938", "hoverinfo": "text+y", "hoverlabel": { "font": { "size": 13 }, "align": "left", "namelength": -1 }, "showlegend": false, "hovertextsrc": "aidenshin:17:e16242" }, { "line": { "color": "rgba(53,183,121,0.8)", "width": 1.0 }, "mode": "lines", "name": "sample 541", "type": "scatter", "xsrc": "aidenshin:17:b355d4", "ysrc": "aidenshin:17:249cde", "hoverinfo": "text+y", "hoverlabel": { "font": { "size": 13 }, "align": "left", "namelength": -1 }, "showlegend": false, "hovertextsrc": "aidenshin:17:4e33ba" }, { "line": { "color": "rgba(59,187,117,0.8)", "width": 1.0 }, "mode": "lines", "name": "sample 355", "type": "scatter", "xsrc": "aidenshin:17:ccb53c", "ysrc": "aidenshin:17:3646f4", "hoverinfo": "text+y", "hoverlabel": { "font": { "size": 13 }, "align": "left", "namelength": -1 }, "showlegend": false, "hovertextsrc": "aidenshin:17:479336" }, { "line": { "color": "rgba(66,190,113,0.8)", "width": 1.0 }, "mode": "lines", "name": "sample 949", "type": "scatter", "xsrc": "aidenshin:17:842bc8", "ysrc": "aidenshin:17:8319f8", "hoverinfo": "text+y", "hoverlabel": { "font": { "size": 13 }, "align": "left", "namelength": -1 }, "showlegend": false, "hovertextsrc": "aidenshin:17:7e8aae" }, { "line": { "color": "rgba(72,193,110,0.8)", "width": 1.0 }, "mode": "lines", "name": "sample 698", "type": "scatter", "xsrc": "aidenshin:17:e08370", "ysrc": "aidenshin:17:09dcad", "hoverinfo": "text+y", "hoverlabel": { "font": { "size": 13 }, "align": "left", "namelength": -1 }, "showlegend": false, "hovertextsrc": "aidenshin:17:e0cc40" }, { "line": { "color": "rgba(80,196,106,0.8)", "width": 1.0 }, "mode": "lines", "name": "sample 1215", "type": "scatter", "xsrc": "aidenshin:17:b50fd8", "ysrc": "aidenshin:17:f94c06", "hoverinfo": "text+y", "hoverlabel": { "font": { "size": 13 }, "align": "left", "namelength": -1 }, "showlegend": false, "hovertextsrc": "aidenshin:17:61dcb0" }, { "line": { "color": "rgba(88,199,101,0.8)", "width": 1.0 }, "mode": "lines", "name": "sample 220", "type": "scatter", "xsrc": "aidenshin:17:e4c7d2", "ysrc": "aidenshin:17:377379", "hoverinfo": "text+y", "hoverlabel": { "font": { "size": 13 }, "align": "left", "namelength": -1 }, "showlegend": false, "hovertextsrc": "aidenshin:17:d640b8" }, { "line": { "color": "rgba(94,201,98,0.8)", "width": 1.0 }, "mode": "lines", "name": "sample 176", "type": "scatter", "xsrc": "aidenshin:17:e9869e", "ysrc": "aidenshin:17:90c756", "hoverinfo": "text+y", "hoverlabel": { "font": { "size": 13 }, "align": "left", "namelength": -1 }, "showlegend": false, "hovertextsrc": "aidenshin:17:7d8e61" }, { "line": { "color": "rgba(103,204,92,0.8)", "width": 1.0 }, "mode": "lines", "name": "sample 1369", "type": "scatter", "xsrc": "aidenshin:17:b57bcb", "ysrc": "aidenshin:17:d10413", "hoverinfo": "text+y", "hoverlabel": { "font": { "size": 13 }, "align": "left", "namelength": -1 }, "showlegend": false, "hovertextsrc": "aidenshin:17:a8423c" }, { "line": { "color": "rgba(112,207,87,0.8)", "width": 1.0 }, "mode": "lines", "name": "sample 926", "type": "scatter", "xsrc": "aidenshin:17:41134f", "ysrc": "aidenshin:17:216c44", "hoverinfo": "text+y", "hoverlabel": { "font": { "size": 13 }, "align": "left", "namelength": -1 }, "showlegend": false, "hovertextsrc": "aidenshin:17:fb9cbf" }, { "line": { "color": "rgba(122,209,81,0.8)", "width": 1.0 }, "mode": "lines", "name": "sample 1017", "type": "scatter", "xsrc": "aidenshin:17:471225", "ysrc": "aidenshin:17:ebdf50", "hoverinfo": "text+y", "hoverlabel": { "font": { "size": 13 }, "align": "left", "namelength": -1 }, "showlegend": false, "hovertextsrc": "aidenshin:17:b873ed" }, { "line": { "color": "rgba(129,211,77,0.8)", "width": 1.0 }, "mode": "lines", "name": "sample 1251", "type": "scatter", "xsrc": "aidenshin:17:e160aa", "ysrc": "aidenshin:17:9aa168", "hoverinfo": "text+y", "hoverlabel": { "font": { "size": 13 }, "align": "left", "namelength": -1 }, "showlegend": false, "hovertextsrc": "aidenshin:17:8ba699" }, { "line": { "color": "rgba(139,214,70,0.8)", "width": 1.0 }, "mode": "lines", "name": "sample 93", "type": "scatter", "xsrc": "aidenshin:17:6c46c7", "ysrc": "aidenshin:17:c2ec14", "hoverinfo": "text+y", "hoverlabel": { "font": { "size": 13 }, "align": "left", "namelength": -1 }, "showlegend": false, "hovertextsrc": "aidenshin:17:59ade9" }, { "line": { "color": "rgba(149,216,64,0.8)", "width": 1.0 }, "mode": "lines", "name": "sample 1354", "type": "scatter", "xsrc": "aidenshin:17:ae13d1", "ysrc": "aidenshin:17:810e0c", "hoverinfo": "text+y", "hoverlabel": { "font": { "size": 13 }, "align": "left", "namelength": -1 }, "showlegend": false, "hovertextsrc": "aidenshin:17:6bd7ed" }, { "line": { "color": "rgba(157,217,59,0.8)", "width": 1.0 }, "mode": "lines", "name": "sample 677", "type": "scatter", "xsrc": "aidenshin:17:2e9808", "ysrc": "aidenshin:17:b0f189", "hoverinfo": "text+y", "hoverlabel": { "font": { "size": 13 }, "align": "left", "namelength": -1 }, "showlegend": false, "hovertextsrc": "aidenshin:17:357908" }, { "line": { "color": "rgba(168,219,52,0.8)", "width": 1.0 }, "mode": "lines", "name": "sample 320", "type": "scatter", "xsrc": "aidenshin:17:ceb9b8", "ysrc": "aidenshin:17:05dd32", "hoverinfo": "text+y", "hoverlabel": { "font": { "size": 13 }, "align": "left", "namelength": -1 }, "showlegend": false, "hovertextsrc": "aidenshin:17:6675ea" }, { "line": { "color": "rgba(178,221,45,0.8)", "width": 1.0 }, "mode": "lines", "name": "sample 1255", "type": "scatter", "xsrc": "aidenshin:17:3b487c", "ysrc": "aidenshin:17:77cc92", "hoverinfo": "text+y", "hoverlabel": { "font": { "size": 13 }, "align": "left", "namelength": -1 }, "showlegend": false, "hovertextsrc": "aidenshin:17:45d0b7" }, { "line": { "color": "rgba(189,223,38,0.8)", "width": 1.0 }, "mode": "lines", "name": "sample 238", "type": "scatter", "xsrc": "aidenshin:17:7c2ae3", "ysrc": "aidenshin:17:2a621f", "hoverinfo": "text+y", "hoverlabel": { "font": { "size": 13 }, "align": "left", "namelength": -1 }, "showlegend": false, "hovertextsrc": "aidenshin:17:209d57" }, { "line": { "color": "rgba(197,224,33,0.8)", "width": 1.0 }, "mode": "lines", "name": "sample 279", "type": "scatter", "xsrc": "aidenshin:17:0c9a89", "ysrc": "aidenshin:17:2c4d71", "hoverinfo": "text+y", "hoverlabel": { "font": { "size": 13 }, "align": "left", "namelength": -1 }, "showlegend": false, "hovertextsrc": "aidenshin:17:f70130" }, { "line": { "color": "rgba(208,225,28,0.8)", "width": 1.0 }, "mode": "lines", "name": "sample 886", "type": "scatter", "xsrc": "aidenshin:17:4451ce", "ysrc": "aidenshin:17:817a2b", "hoverinfo": "text+y", "hoverlabel": { "font": { "size": 13 }, "align": "left", "namelength": -1 }, "showlegend": false, "hovertextsrc": "aidenshin:17:04b4f2" }, { "line": { "color": "rgba(218,227,25,0.8)", "width": 1.0 }, "mode": "lines", "name": "sample 439", "type": "scatter", "xsrc": "aidenshin:17:646735", "ysrc": "aidenshin:17:818024", "hoverinfo": "text+y", "hoverlabel": { "font": { "size": 13 }, "align": "left", "namelength": -1 }, "showlegend": false, "hovertextsrc": "aidenshin:17:1a9c22" }, { "line": { "color": "rgba(226,228,24,0.8)", "width": 1.0 }, "mode": "lines", "name": "sample 990", "type": "scatter", "xsrc": "aidenshin:17:f69da4", "ysrc": "aidenshin:17:bc8132", "hoverinfo": "text+y", "hoverlabel": { "font": { "size": 13 }, "align": "left", "namelength": -1 }, "showlegend": false, "hovertextsrc": "aidenshin:17:4bb814" }, { "line": { "color": "rgba(236,229,27,0.8)", "width": 1.0 }, "mode": "lines", "name": "sample 50", "type": "scatter", "xsrc": "aidenshin:17:3d342d", "ysrc": "aidenshin:17:8dcd78", "hoverinfo": "text+y", "hoverlabel": { "font": { "size": 13 }, "align": "left", "namelength": -1 }, "showlegend": false, "hovertextsrc": "aidenshin:17:7d393d" }, { "line": { "color": "rgba(246,230,32,0.8)", "width": 1.0 }, "mode": "lines", "name": "sample 896", "type": "scatter", "xsrc": "aidenshin:17:965aac", "ysrc": "aidenshin:17:a14b7a", "hoverinfo": "text+y", "hoverlabel": { "font": { "size": 13 }, "align": "left", "namelength": -1 }, "showlegend": false, "hovertextsrc": "aidenshin:17:f97a33" }, { "line": { "color": "rgba(253,231,37,0.8)", "width": 1.0 }, "mode": "lines", "name": "sample 748", "type": "scatter", "xsrc": "aidenshin:17:e474ad", "ysrc": "aidenshin:17:c12d8b", "hoverinfo": "text+y", "hoverlabel": { "font": { "size": 13 }, "align": "left", "namelength": -1 }, "showlegend": false, "hovertextsrc": "aidenshin:17:2fc07a" }, { "line": { "color": "red", "width": 2 }, "mode": "lines", "name": "실제 요금과 동일한 예측값을 가질때의 기준선 (Zero Error)", "type": "scatter", "xsrc": "aidenshin:17:e110cc", "ysrc": "aidenshin:17:2fde07", "showlegend": true } ], "layout": { "title": { "text": "Epoch 진행에 따른 Residual 변화 : MAE(avg) 기준 top-70 (out of 1400)" }, "width": 1200, "xaxis": { "title": { "text": "Epoch" } }, "yaxis": { "range": [ -50000, 50000 ], "title": { "text": "Prediction Error (Pred - True)" } }, "height": 600, "legend": { "x": 1, "y": 1.02, "xanchor": "right", "yanchor": "bottom", "orientation": "h" }, "margin": { "t": 100 }, "template": { "data": { "bar": [ { "type": "bar", "marker": { "line": { "color": "#E5ECF6", "width": 0.5 }, "pattern": { "size": 10, "fillmode": "overlay", "solidity": 0.2 } }, "error_x": { "color": "#2a3f5f" }, "error_y": { "color": "#2a3f5f" } } ], "pie": [ { "type": "pie", "automargin": true } ], "table": [ { "type": "table", "cells": { "fill": { "color": "#EBF0F8" }, "line": { "color": "white" } }, "header": { "fill": { "color": "#C8D4E3" }, "line": { "color": "white" } } } ], "carpet": [ { "type": "carpet", "aaxis": { "gridcolor": "white", "linecolor": "white", "endlinecolor": "#2a3f5f", "minorgridcolor": "white", "startlinecolor": "#2a3f5f" }, "baxis": { "gridcolor": "white", "linecolor": "white", "endlinecolor": "#2a3f5f", "minorgridcolor": "white", "startlinecolor": "#2a3f5f" } } ], "mesh3d": [ { "type": "mesh3d", "colorbar": { "ticks": "", "outlinewidth": 0 } } ], "contour": [ { "type": "contour", "colorbar": { "ticks": "", "outlinewidth": 0 }, "colorscale": [ [ 0.0, "#0d0887" ], [ 0.1111111111111111, "#46039f" ], [ 0.2222222222222222, "#7201a8" ], [ 0.3333333333333333, "#9c179e" ], [ 0.4444444444444444, "#bd3786" ], [ 0.5555555555555556, "#d8576b" ], [ 0.6666666666666666, "#ed7953" ], [ 0.7777777777777778, "#fb9f3a" ], [ 0.8888888888888888, "#fdca26" ], [ 1.0, "#f0f921" ] ] } ], "heatmap": [ { "type": "heatmap", "colorbar": { "ticks": "", "outlinewidth": 0 }, "colorscale": [ [ 0.0, "#0d0887" ], [ 0.1111111111111111, "#46039f" ], [ 0.2222222222222222, "#7201a8" ], [ 0.3333333333333333, "#9c179e" ], [ 0.4444444444444444, "#bd3786" ], [ 0.5555555555555556, "#d8576b" ], [ 0.6666666666666666, "#ed7953" ], [ 0.7777777777777778, "#fb9f3a" ], [ 0.8888888888888888, "#fdca26" ], [ 1.0, "#f0f921" ] ] } ], "scatter": [ { "type": "scatter", "fillpattern": { "size": 10, "fillmode": "overlay", "solidity": 0.2 } } ], "surface": [ { "type": "surface", "colorbar": { "ticks": "", "outlinewidth": 0 }, "colorscale": [ [ 0.0, "#0d0887" ], [ 0.1111111111111111, "#46039f" ], [ 0.2222222222222222, "#7201a8" ], [ 0.3333333333333333, "#9c179e" ], [ 0.4444444444444444, "#bd3786" ], [ 0.5555555555555556, "#d8576b" ], [ 0.6666666666666666, "#ed7953" ], [ 0.7777777777777778, "#fb9f3a" ], [ 0.8888888888888888, "#fdca26" ], [ 1.0, "#f0f921" ] ] } ], "barpolar": [ { "type": "barpolar", "marker": { "line": { "color": "#E5ECF6", "width": 0.5 }, "pattern": { "size": 10, "fillmode": "overlay", "solidity": 0.2 } } } ], "heatmapgl": [ { "type": "heatmapgl", "colorbar": { "ticks": "", "outlinewidth": 0 }, "colorscale": [ [ 0.0, "#0d0887" ], [ 0.1111111111111111, "#46039f" ], [ 0.2222222222222222, "#7201a8" ], [ 0.3333333333333333, "#9c179e" ], [ 0.4444444444444444, "#bd3786" ], [ 0.5555555555555556, "#d8576b" ], [ 0.6666666666666666, "#ed7953" ], [ 0.7777777777777778, "#fb9f3a" ], [ 0.8888888888888888, "#fdca26" ], [ 1.0, "#f0f921" ] ] } ], "histogram": [ { "type": "histogram", "marker": { "pattern": { "size": 10, "fillmode": "overlay", "solidity": 0.2 } } } ], "parcoords": [ { "line": { "colorbar": { "ticks": "", "outlinewidth": 0 } }, "type": "parcoords" } ], "scatter3d": [ { "line": { "colorbar": { "ticks": "", "outlinewidth": 0 } }, "type": "scatter3d", "marker": { "colorbar": { "ticks": "", "outlinewidth": 0 } } } ], "scattergl": [ { "type": "scattergl", "marker": { "colorbar": { "ticks": "", "outlinewidth": 0 } } } ], "choropleth": [ { "type": "choropleth", "colorbar": { "ticks": "", "outlinewidth": 0 } } ], "scattergeo": [ { "type": "scattergeo", "marker": { "colorbar": { "ticks": "", "outlinewidth": 0 } } } ], "histogram2d": [ { "type": "histogram2d", "colorbar": { "ticks": "", "outlinewidth": 0 }, "colorscale": [ [ 0.0, "#0d0887" ], [ 0.1111111111111111, "#46039f" ], [ 0.2222222222222222, "#7201a8" ], [ 0.3333333333333333, "#9c179e" ], [ 0.4444444444444444, "#bd3786" ], [ 0.5555555555555556, "#d8576b" ], [ 0.6666666666666666, "#ed7953" ], [ 0.7777777777777778, "#fb9f3a" ], [ 0.8888888888888888, "#fdca26" ], [ 1.0, "#f0f921" ] ] } ], "scatterpolar": [ { "type": "scatterpolar", "marker": { "colorbar": { "ticks": "", "outlinewidth": 0 } } } ], "contourcarpet": [ { "type": "contourcarpet", "colorbar": { "ticks": "", "outlinewidth": 0 } } ], "scattercarpet": [ { "type": "scattercarpet", "marker": { "colorbar": { "ticks": "", "outlinewidth": 0 } } } ], "scattermapbox": [ { "type": "scattermapbox", "marker": { "colorbar": { "ticks": "", "outlinewidth": 0 } } } ], "scatterpolargl": [ { "type": "scatterpolargl", "marker": { "colorbar": { "ticks": "", "outlinewidth": 0 } } } ], "scatterternary": [ { "type": "scatterternary", "marker": { "colorbar": { "ticks": "", "outlinewidth": 0 } } } ], "histogram2dcontour": [ { "type": "histogram2dcontour", "colorbar": { "ticks": "", "outlinewidth": 0 }, "colorscale": [ [ 0.0, "#0d0887" ], [ 0.1111111111111111, "#46039f" ], [ 0.2222222222222222, "#7201a8" ], [ 0.3333333333333333, "#9c179e" ], [ 0.4444444444444444, "#bd3786" ], [ 0.5555555555555556, "#d8576b" ], [ 0.6666666666666666, "#ed7953" ], [ 0.7777777777777778, "#fb9f3a" ], [ 0.8888888888888888, "#fdca26" ], [ 1.0, "#f0f921" ] ] } ] }, "layout": { "geo": { "bgcolor": "white", "showland": true, "lakecolor": "white", "landcolor": "#E5ECF6", "showlakes": true, "subunitcolor": "white" }, "font": { "color": "#2a3f5f" }, "polar": { "bgcolor": "#E5ECF6", "radialaxis": { "ticks": "", "gridcolor": "white", "linecolor": "white" }, "angularaxis": { "ticks": "", "gridcolor": "white", "linecolor": "white" } }, "scene": { "xaxis": { "ticks": "", "gridcolor": "white", "gridwidth": 2, "linecolor": "white", "zerolinecolor": "white", "showbackground": true, "backgroundcolor": "#E5ECF6" }, "yaxis": { "ticks": "", "gridcolor": "white", "gridwidth": 2, "linecolor": "white", "zerolinecolor": "white", "showbackground": true, "backgroundcolor": "#E5ECF6" }, "zaxis": { "ticks": "", "gridcolor": "white", "gridwidth": 2, "linecolor": "white", "zerolinecolor": "white", "showbackground": true, "backgroundcolor": "#E5ECF6" } }, "title": { "x": 0.05 }, "xaxis": { "ticks": "", "title": { "standoff": 15 }, "gridcolor": "white", "linecolor": "white", "automargin": true, "zerolinecolor": "white", "zerolinewidth": 2 }, "yaxis": { "ticks": "", "title": { "standoff": 15 }, "gridcolor": "white", "linecolor": "white", "automargin": true, "zerolinecolor": "white", "zerolinewidth": 2 }, "mapbox": { "style": "light" }, "ternary": { "aaxis": { "ticks": "", "gridcolor": "white", "linecolor": "white" }, "baxis": { "ticks": "", "gridcolor": "white", "linecolor": "white" }, "caxis": { "ticks": "", "gridcolor": "white", "linecolor": "white" }, "bgcolor": "#E5ECF6" }, "colorway": [ "#636efa", "#EF553B", "#00cc96", "#ab63fa", "#FFA15A", "#19d3f3", "#FF6692", "#B6E880", "#FF97FF", "#FECB52" ], "coloraxis": { "colorbar": { "ticks": "", "outlinewidth": 0 } }, "hovermode": "closest", "colorscale": { "diverging": [ [ 0, "#8e0152" ], [ 0.1, "#c51b7d" ], [ 0.2, "#de77ae" ], [ 0.3, "#f1b6da" ], [ 0.4, "#fde0ef" ], [ 0.5, "#f7f7f7" ], [ 0.6, "#e6f5d0" ], [ 0.7, "#b8e186" ], [ 0.8, "#7fbc41" ], [ 0.9, "#4d9221" ], [ 1, "#276419" ] ], "sequential": [ [ 0.0, "#0d0887" ], [ 0.1111111111111111, "#46039f" ], [ 0.2222222222222222, "#7201a8" ], [ 0.3333333333333333, "#9c179e" ], [ 0.4444444444444444, "#bd3786" ], [ 0.5555555555555556, "#d8576b" ], [ 0.6666666666666666, "#ed7953" ], [ 0.7777777777777778, "#fb9f3a" ], [ 0.8888888888888888, "#fdca26" ], [ 1.0, "#f0f921" ] ], "sequentialminus": [ [ 0.0, "#0d0887" ], [ 0.1111111111111111, "#46039f" ], [ 0.2222222222222222, "#7201a8" ], [ 0.3333333333333333, "#9c179e" ], [ 0.4444444444444444, "#bd3786" ], [ 0.5555555555555556, "#d8576b" ], [ 0.6666666666666666, "#ed7953" ], [ 0.7777777777777778, "#fb9f3a" ], [ 0.8888888888888888, "#fdca26" ], [ 1.0, "#f0f921" ] ] }, "hoverlabel": { "align": "left" }, "plot_bgcolor": "#E5ECF6", "paper_bgcolor": "white", "shapedefaults": { "line": { "color": "#2a3f5f" } }, "autotypenumbers": "strict", "annotationdefaults": { "arrowhead": 0, "arrowcolor": "#2a3f5f", "arrowwidth": 1 } } }, "hovermode": "closest", "hoverlabel": { "font": { "size": 13 }, "align": "left", "namelength": -1 }, "plot_bgcolor": "rgb(210, 210, 210)" } }, "height": 600, "width": 1200, "user": { "profile_url": "https://chart-studio.plotly.com/~aidenshin", "avatar_url": "https://storage.googleapis.com/plotly-prod-profiles/11.jpg", "background_url": "https://storage.googleapis.com/plotly-prod-profiles/bg-8.jpg", "bio": "", "nickname": "", "website": "", "stream_tokens": null, "feature_set_id": null, "csrf_token": null, "date_joined": "2025-07-30 21:23:38", "mapbox_access_tokens": null, "has_password": null, "username": "aidenshin", "email": null, "is_active": null, "readonly": null, "is_dash_creator": null, "dash_created_count": null, "is_chart_creator": null, "charts_created_count": null } } ] }
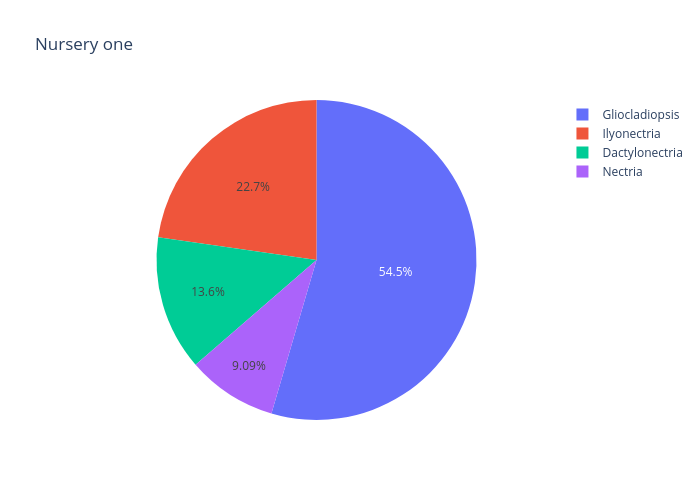
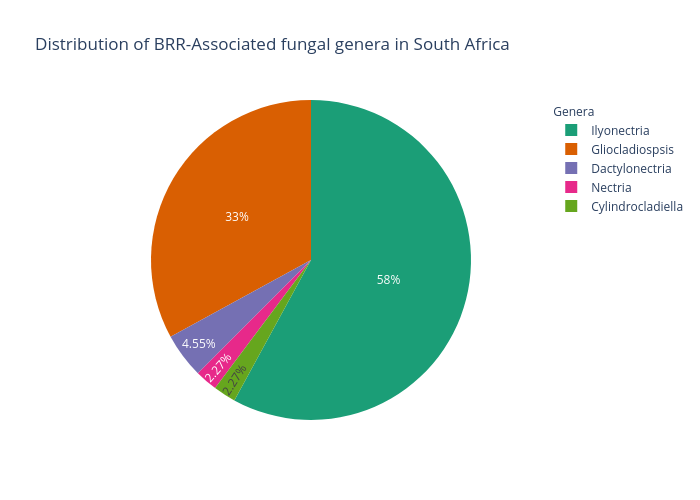