Plots List
Plots
This endpoint handles manipulation of Plotly plot files.
Reference
Authorization
Any user with or without a Plotly account may view public plots. For private plots, see authentication.
Actions
list
Listing all public plots can be done via a GET request to this endpoint.
By default, plots will be listed in order of date created. The order_by
query parameter is accepted at this endpoint. Currently, only ordering by
views is supported. It is possible to filter the plots by quality
with min_quality or max_quality as query parameter.
Example:
// GET https://api.plotly.com/v2/plots/ ---> 200

// GET https://api.plotly.com/v2/plots/?order_by=-views ---> 200

// GET https://api.plotly.com/v2/plots/?min_quality=5 ---> 200

// GET https://api.plotly.com/v2/plots/?max_quality=5 ---> 200
feed
Listing all handpicked feed plots can be done via a GET request to this endpoint. By default, plots will be listed in a random order.
Example:
// GET https://api.plotly.com/v2/plots/feed ---> 200
create
You can create new plot resources here. The only required field is 'figure'. Currently, the figure is restricted to only contain references to grid data. That is, this will fail if raw data arrays are passed in. To create and manipulate underlying grids for plots, see the grids endpoint.
Example:
// This fails because a figure field is required.
// POST https://api.plotly.com/v2/plots ---> 400 Bad Request
{}

// This fails because the figure has raw data
//POST https://api.plotly.com/v2/plots ---> 400 Bad Request
{
    "figure": {"data": [{"y": ['this', 'is', 'raw', 'data']}]}
}

// This succeeds because the figure has src keys, not raw data.
//POST https://api.plotly.com/v2/plots ---> 200 OK
{
    "figure": {"data": [{"ysrc": "sven:88:u8nd62"}]}
}
When creating a grid, you can optionally specify a source_fid to specify where a plot has come from:
- source_fid: the fid of a plot that was copied (and presumably edited) to produce this one
detail
There is a lot of meta information stored about plot files including filename, title, share_url, and content_url to name a few.
This information can only be reached with a GET to this endpoint.
Example:
// GET https://api.plotly.com/v2/plots/iheartgraphs:90
content
The contents of a plot can be downloaded via the content resource. The plot
content contains referenced grid/column data by default. If you wish to
return the raw grid/column data, the inline_data=true query must be included
in the request url. The Content-Type header will be appropriately set for the
response body.
Alternatively, you can set ?map_data=unreadable to append a mapping of
sources to data that belongs to grids which are unreadable for the
requestor. This is useful when you have read access to another users plot,
but that plot contains grid references which you don't have access to.
Examples:
// Returns referenced grid/column data
// GET https://api.plotly.com/v2/plots/iheartgraphs:90/content ---> 200 OK

// Returns full grid/column data
// GET https://api.plotly.com/v2/plots/iheartgraphs:90/content?inline_data=true ---> 200 OK

// Returns full grid/column data when requestor doesn't have permission
// to read the referenced grid.
// GET https://api.plotly.com/v2/plots/iheartgraphs:90/content?map_data=unreadable ---> 200 OK
GET /v2/plots?cursor=cD0yMDI1LTA4LTA4KzAzJTNBMTAlM0EwMy43NzYxNDUlMkIwMCUzQTAw&format=api
{ "next": "https://api.plotly.com/v2/plots?cursor=cD0yMDI1LTA4LTA3KzE5JTNBNDMlM0E1My4zMzU3NjQlMkIwMCUzQTAw&format=api", "previous": "https://api.plotly.com/v2/plots?cursor=cj0xJnA9MjAyNS0wOC0wOCswMyUzQTA3JTNBMTMuODg0NTU2JTJCMDAlM0EwMA%3D%3D&format=api", "results": [ { "creation_time": "2025-08-08T03:07:13.884556Z", "comments": { "results": [], "count": 0 }, "parented": true, "embed_url": "https://chart-studio.plotly.com/~Yingbin/3.embed", "fid": "Yingbin:3", "filename": "Plot 3", "filetype": "plot", "img_url": "https://storage.googleapis.com/plotly-prod-images/Yingbin/3/9_D4Y9MSWTP8U3IVOQ03SJJ5DNZ10E61.png", "image_urls": { "default": "https://storage.googleapis.com/plotly-prod-images/Yingbin/3/2_CMMAWL8BX5O8XJ7P831LPHTEX41CLD.png", "block-thumb": "https://storage.googleapis.com/plotly-prod-images/Yingbin/3/8_OML8NVZVDMN2TKSVA8FAAMX56QQ78F.png", "list-thumb": "https://storage.googleapis.com/plotly-prod-images/Yingbin/3/9_D4Y9MSWTP8U3IVOQ03SJJ5DNZ10E61.png" }, "api_urls": { "files": "https://api.plotly.com/v2/files/Yingbin:3", "plots": "https://api.plotly.com/v2/plots/Yingbin:3", "parent": "https://api.plotly.com/v2/folders/home?user=Yingbin" }, "owner": "Yingbin", "parent": -1, "preview": "", "referencers": [], "references": [], "title": "", "views": 2, "web_url": "https://chart-studio.plotly.com/~Yingbin/3/", "world_readable": true, "date_modified": "2025-08-08T03:07:13.895Z", "stars": { "results": [], "count": 0 }, "collaborators": { "results": [], "count": 0 }, "subfolder_count": null, "refresh_interval": null, "organize_view_url": "https://chart-studio.plotly.com/~Yingbin/3/", "current_user_permission": "read", "is_theme": null, "is_template": true, "autosize": true, "caption": "", "figure": { "data": [ { "fill": "none", "line": { "dash": "solid", "width": 3 }, "meta": { "columnNames": { "x": "A", "y": "B", "marker": { "size": "C", "color": "B" } } }, "mode": "markers+lines", "name": "MMSE", "type": "scattergl", "xsrc": "Yingbin:2:0ffe1c", "ysrc": "Yingbin:2:e9f82c", "yaxis": "y", "marker": { "line": { "width": 0 }, "meta": { "columnNames": { "size": "C", "color": "B" } }, "size": 11, "symbol": "square", "sizeref": null, "sizemode": "area", "maxdisplayed": 0 }, "opacity": 0.96, "visible": true, "hovertemplate": "" }, { "fill": "none", "line": { "width": 3 }, "meta": { "columnNames": { "x": "A", "y": "C", "marker": { "size": "C", "color": "B" } } }, "mode": "markers+lines", "name": "LS", "type": "scatter", "xsrc": "Yingbin:2:0ffe1c", "ysrc": "Yingbin:2:8021b3", "marker": { "line": { "width": 0 }, "meta": { "columnNames": { "size": "C", "color": "B" } }, "size": 11, "symbol": "square", "sizeref": null, "sizemode": "area", "maxdisplayed": 0 }, "opacity": 1, "stackgroup": null, "hovertemplate": "" }, { "fill": "none", "line": { "width": 3 }, "meta": { "columnNames": { "x": "A", "y": "D", "marker": { "size": "C", "color": "B" } } }, "mode": "markers+lines", "name": "deeplearning", "type": "scatter", "xsrc": "Yingbin:2:0ffe1c", "ysrc": "Yingbin:2:b8276c", "marker": { "line": { "width": 0 }, "meta": { "columnNames": { "size": "C", "color": "B" } }, "size": 11, "symbol": "square", "sizeref": null, "sizemode": "area", "maxdisplayed": 0 }, "opacity": 1, "stackgroup": null, "hovertemplate": "" } ], "frames": [], "layout": { "font": { "size": 20, "family": "Arial" }, "title": { "x": 0.48, "font": { "size": 23 }, "text": "<b>性能对比</b>" }, "xaxis": { "side": "bottom", "type": "linear", "range": [ -13.179214936208133, 38.17921493620813 ], "ticks": "", "title": { "font": { "size": 25 }, "text": "信噪比(dB)" }, "anchor": "y", "domain": [ 0.16, 0.75 ], "mirror": "ticks", "nticks": 11, "showgrid": true, "showline": false, "tickmode": "auto", "autorange": true, "gridcolor": "rgb(189, 191, 196)", "linecolor": "rgb(12, 40, 61)", "showspikes": true, "rangeslider": { "range": [ -13.179214936208133, 38.17921493620813 ], "yaxis": {}, "visible": false, "autorange": true }, "zerolinecolor": "rgb(195, 195, 204)", "zerolinewidth": 1, "spikethickness": 1, "separatethousands": false }, "yaxis": { "side": "left", "type": "linear", "range": [ -42.18818661229059, 13.616331717290592 ], "ticks": "", "title": { "text": "NMSE(dB)" }, "domain": [ 0, 1 ], "mirror": "ticks", "nticks": 10, "showgrid": true, "showline": false, "autorange": true, "gridcolor": "rgb(198, 201, 206)", "linecolor": "rgb(12, 40, 61)", "showspikes": true, "zerolinecolor": "rgb(195, 198, 204)", "zerolinewidth": 1 }, "legend": { "x": 0.5872809196165153, "y": 0.975929978118162 }, "margin": { "t": 80, "pad": 10 }, "modebar": { "color": "rgba(134, 132, 132, 0.3)", "bgcolor": "rgba(249, 245, 245, 0.5)", "activecolor": "rgba(54, 9, 30, 0.7)", "orientation": "h" }, "autosize": true, "colorway": [ "#1f77b4", "#ff7f0e", "#2ca02c", "#d62728", "#9467bd", "#8c564b", "#e377c2", "#7f7f7f", "#bcbd22", "#17becf" ], "dragmode": "select", "template": { "data": { "bar": [ { "type": "bar", "marker": { "colorbar": { "ticks": "", "outlinewidth": 0 } } } ], "table": [ { "type": "table", "cells": { "fill": { "color": "#EBF0F8" }, "line": { "color": "white" } }, "header": { "fill": { "color": "#C8D4E3" }, "line": { "color": "white" } } } ], "carpet": [ { "type": "carpet", "aaxis": { "gridcolor": "#C8D4E3", "linecolor": "#C8D4E3", "endlinecolor": "#2a3f5f", "minorgridcolor": "#C8D4E3", "startlinecolor": "#2a3f5f" }, "baxis": { "gridcolor": "#C8D4E3", "linecolor": "#C8D4E3", "endlinecolor": "#2a3f5f", "minorgridcolor": "#C8D4E3", "startlinecolor": "#2a3f5f" } } ], "mesh3d": [ { "type": "mesh3d", "colorbar": { "ticks": "", "outlinewidth": 0 } } ], "contour": [ { "type": "contour", "colorbar": { "ticks": "", "outlinewidth": 0 }, "autocolorscale": true } ], "heatmap": [ { "type": "heatmap", "colorbar": { "ticks": "", "outlinewidth": 0 }, "autocolorscale": true } ], "scatter": [ { "type": "scatter", "marker": { "colorbar": { "ticks": "", "outlinewidth": 0 } } } ], "surface": [ { "type": "surface", "colorbar": { "ticks": "", "outlinewidth": 0 } } ], "heatmapgl": [ { "type": "heatmapgl", "colorbar": { "ticks": "", "outlinewidth": 0 } } ], "histogram": [ { "type": "histogram", "marker": { "colorbar": { "ticks": "", "outlinewidth": 0 } } } ], "parcoords": [ { "line": { "colorbar": { "ticks": "", "outlinewidth": 0 } }, "type": "parcoords" } ], "scatter3d": [ { "type": "scatter3d", "marker": { "colorbar": { "ticks": "", "outlinewidth": 0 } } } ], "scattergl": [ { "type": "scattergl", "marker": { "colorbar": { "ticks": "", "outlinewidth": 0 } } } ], "choropleth": [ { "type": "choropleth", "colorbar": { "ticks": "", "outlinewidth": 0 } } ], "scattergeo": [ { "type": "scattergeo", "marker": { "colorbar": { "ticks": "", "outlinewidth": 0 } } } ], "histogram2d": [ { "type": "histogram2d", "colorbar": { "ticks": "", "outlinewidth": 0 }, "autocolorscale": true } ], "scatterpolar": [ { "type": "scatterpolar", "marker": { "colorbar": { "ticks": "", "outlinewidth": 0 } } } ], "contourcarpet": [ { "type": "contourcarpet", "colorbar": { "ticks": "", "outlinewidth": 0 } } ], "scattercarpet": [ { "type": "scattercarpet", "marker": { "colorbar": { "ticks": "", "outlinewidth": 0 } } } ], "scattermapbox": [ { "type": "scattermapbox", "marker": { "colorbar": { "ticks": "", "outlinewidth": 0 } } } ], "scatterpolargl": [ { "type": "scatterpolargl", "marker": { "colorbar": { "ticks": "", "outlinewidth": 0 } } } ], "scatterternary": [ { "type": "scatterternary", "marker": { "colorbar": { "ticks": "", "outlinewidth": 0 } } } ], "histogram2dcontour": [ { "type": "histogram2dcontour", "colorbar": { "ticks": "", "outlinewidth": 0 }, "autocolorscale": true } ] }, "layout": { "geo": { "bgcolor": "white", "showland": true, "lakecolor": "white", "landcolor": "white", "showlakes": true, "subunitcolor": "#C8D4E3" }, "font": { "color": "#2a3f5f" }, "polar": { "bgcolor": "white", "radialaxis": { "ticks": "", "gridcolor": "#EBF0F8", "linecolor": "#EBF0F8" }, "angularaxis": { "ticks": "", "gridcolor": "#EBF0F8", "linecolor": "#EBF0F8" } }, "scene": { "xaxis": { "ticks": "", "gridcolor": "#DFE8F3", "gridwidth": 2, "linecolor": "#EBF0F8", "zerolinecolor": "#EBF0F8", "showbackground": true, "backgroundcolor": "white" }, "yaxis": { "ticks": "", "gridcolor": "#DFE8F3", "gridwidth": 2, "linecolor": "#EBF0F8", "zerolinecolor": "#EBF0F8", "showbackground": true, "backgroundcolor": "white" }, "zaxis": { "ticks": "", "gridcolor": "#DFE8F3", "gridwidth": 2, "linecolor": "#EBF0F8", "zerolinecolor": "#EBF0F8", "showbackground": true, "backgroundcolor": "white" } }, "title": { "x": 0.05 }, "xaxis": { "ticks": "", "gridcolor": "#EBF0F8", "linecolor": "#EBF0F8", "automargin": true, "zerolinecolor": "#EBF0F8", "zerolinewidth": 2 }, "yaxis": { "ticks": "", "gridcolor": "#EBF0F8", "linecolor": "#EBF0F8", "automargin": true, "zerolinecolor": "#EBF0F8", "zerolinewidth": 2 }, "ternary": { "aaxis": { "ticks": "", "gridcolor": "#DFE8F3", "linecolor": "#A2B1C6" }, "baxis": { "ticks": "", "gridcolor": "#DFE8F3", "linecolor": "#A2B1C6" }, "caxis": { "ticks": "", "gridcolor": "#DFE8F3", "linecolor": "#A2B1C6" }, "bgcolor": "white" }, "colorway": [ "#636efa", "#EF553B", "#00cc96", "#ab63fa", "#19d3f3", "#e763fa", "#fecb52", "#ffa15a", "#ff6692", "#b6e880" ], "hovermode": "closest", "colorscale": { "diverging": [ [ 0, "#8e0152" ], [ 0.1, "#c51b7d" ], [ 0.2, "#de77ae" ], [ 0.3, "#f1b6da" ], [ 0.4, "#fde0ef" ], [ 0.5, "#f7f7f7" ], [ 0.6, "#e6f5d0" ], [ 0.7, "#b8e186" ], [ 0.8, "#7fbc41" ], [ 0.9, "#4d9221" ], [ 1, "#276419" ] ], "sequential": [ [ 0, "#0508b8" ], [ 0.0893854748603352, "#1910d8" ], [ 0.1787709497206704, "#3c19f0" ], [ 0.2681564245810056, "#6b1cfb" ], [ 0.3575418994413408, "#981cfd" ], [ 0.44692737430167595, "#bf1cfd" ], [ 0.5363128491620112, "#dd2bfd" ], [ 0.6256983240223464, "#f246fe" ], [ 0.7150837988826816, "#fc67fd" ], [ 0.8044692737430168, "#fe88fc" ], [ 0.8938547486033519, "#fea5fd" ], [ 0.9832402234636871, "#febefe" ], [ 1, "#fec3fe" ] ], "sequentialminus": [ [ 0, "#0508b8" ], [ 0.0893854748603352, "#1910d8" ], [ 0.1787709497206704, "#3c19f0" ], [ 0.2681564245810056, "#6b1cfb" ], [ 0.3575418994413408, "#981cfd" ], [ 0.44692737430167595, "#bf1cfd" ], [ 0.5363128491620112, "#dd2bfd" ], [ 0.6256983240223464, "#f246fe" ], [ 0.7150837988826816, "#fc67fd" ], [ 0.8044692737430168, "#fe88fc" ], [ 0.8938547486033519, "#fea5fd" ], [ 0.9832402234636871, "#febefe" ], [ 1, "#fec3fe" ] ] }, "plot_bgcolor": "white", "paper_bgcolor": "white", "shapedefaults": { "line": { "width": 0 }, "opacity": 0.4, "fillcolor": "#506784" }, "annotationdefaults": { "arrowhead": 0, "arrowcolor": "#506784", "arrowwidth": 1 } }, "themeRef": "PLOTLY_WHITE" }, "clickmode": "event", "hovermode": "x", "uniformtext": { "mode": false }, "plot_bgcolor": "rgb(241, 240, 240)", "paper_bgcolor": "rgb(247, 247, 247)" } }, "height": null, "width": null, "user": { "profile_url": "https://chart-studio.plotly.com/~Yingbin", "avatar_url": "https://storage.googleapis.com/plotly-prod-profiles/97.jpg", "background_url": "https://storage.googleapis.com/plotly-prod-profiles/bg-14.jpg", "bio": "", "nickname": "", "website": "", "stream_tokens": null, "feature_set_id": null, "csrf_token": null, "date_joined": "2025-08-07 09:07:02", "mapbox_access_tokens": null, "has_password": null, "username": "Yingbin", "email": null, "is_active": null, "readonly": null, "is_dash_creator": null, "dash_created_count": null, "is_chart_creator": null, "charts_created_count": null } }, { "creation_time": "2025-08-08T02:43:42.744996Z", "comments": { "results": [], "count": 0 }, "parented": true, "embed_url": "https://chart-studio.plotly.com/~Yingbin/1.embed", "fid": "Yingbin:1", "filename": "Plot 1", "filetype": "plot", "img_url": "https://storage.googleapis.com/plotly-prod-images/Yingbin/1/9_MS0YUTG420DSDX0235K90ZEJVBAH8E.png", "image_urls": { "default": "https://storage.googleapis.com/plotly-prod-images/Yingbin/1/2_TRZP8RXXXJC9RRYHPK9A5P6RMHLGLY.png", "block-thumb": "https://storage.googleapis.com/plotly-prod-images/Yingbin/1/8_B6SGHO4CXBNGNEMGBMZYL1XZA81968.png", "list-thumb": "https://storage.googleapis.com/plotly-prod-images/Yingbin/1/9_MS0YUTG420DSDX0235K90ZEJVBAH8E.png" }, "api_urls": { "files": "https://api.plotly.com/v2/files/Yingbin:1", "plots": "https://api.plotly.com/v2/plots/Yingbin:1", "parent": "https://api.plotly.com/v2/folders/home?user=Yingbin" }, "owner": "Yingbin", "parent": -1, "preview": "", "referencers": [], "references": [], "title": "", "views": 2, "web_url": "https://chart-studio.plotly.com/~Yingbin/1/", "world_readable": true, "date_modified": "2025-08-08T02:43:42.756Z", "stars": { "results": [], "count": 0 }, "collaborators": { "results": [], "count": 0 }, "subfolder_count": null, "refresh_interval": null, "organize_view_url": "https://chart-studio.plotly.com/~Yingbin/1/", "current_user_permission": "read", "is_theme": null, "is_template": true, "autosize": true, "caption": "", "figure": { "data": [ { "fill": "none", "line": { "dash": "solid" }, "meta": { "columnNames": { "x": "A", "y": "B", "marker": { "size": "C", "color": "B" } } }, "mode": "markers+lines", "type": "scattergl", "xsrc": "Yingbin:0:97029f", "ysrc": "Yingbin:0:9ecccc", "yaxis": "y", "marker": { "line": { "width": 0 }, "meta": { "columnNames": { "size": "C", "color": "B" } }, "size": 6, "symbol": "square", "sizeref": null, "sizemode": "area", "maxdisplayed": 0 }, "opacity": 0.96, "visible": true, "hovertemplate": "" }, { "fill": "none", "meta": { "columnNames": { "x": "A", "y": "C", "marker": { "size": "C", "color": "B" } } }, "mode": "markers+lines", "type": "scatter", "xsrc": "Yingbin:0:97029f", "ysrc": "Yingbin:0:916a54", "marker": { "line": { "width": 0 }, "meta": { "columnNames": { "size": "C", "color": "B" } }, "size": 6, "symbol": "square", "sizeref": null, "sizemode": "area", "maxdisplayed": 0 }, "opacity": 1, "stackgroup": null, "hovertemplate": "" }, { "fill": "none", "meta": { "columnNames": { "x": "A", "y": "D", "marker": { "size": "C", "color": "B" } } }, "mode": "markers+lines", "type": "scatter", "xsrc": "Yingbin:0:97029f", "ysrc": "Yingbin:0:433543", "marker": { "line": { "width": 0 }, "meta": { "columnNames": { "size": "C", "color": "B" } }, "size": 6, "symbol": "square", "sizeref": null, "sizemode": "area", "maxdisplayed": 0 }, "opacity": 1, "stackgroup": null, "hovertemplate": "" } ], "frames": [], "layout": { "font": { "size": 15, "family": "Balto" }, "title": { "x": 0.52, "font": { "size": 23 }, "text": "性能对比" }, "xaxis": { "side": "bottom", "type": "linear", "range": [ -10.551583248212456, 34.44841675178753 ], "title": { "text": "信噪比(dB)" }, "anchor": "y", "domain": [ 0, 1 ], "autorange": false, "showspikes": false }, "yaxis": { "side": "left", "type": "linear", "range": [ -38.186661513419054, 15.752279069914298 ], "title": { "text": "NMSE(dB)" }, "domain": [ 0, 1 ], "autorange": false, "showspikes": false }, "legend": { "x": 0.8753299492385787, "y": 1 }, "margin": { "t": 80 }, "modebar": { "bgcolor": "rgba(249, 245, 245, 0.5)", "activecolor": "rgba(44, 42, 43, 0.7)", "orientation": "h" }, "autosize": true, "colorway": [ "#1f77b4", "#ff7f0e", "#2ca02c", "#d62728", "#9467bd", "#8c564b", "#e377c2", "#7f7f7f", "#bcbd22", "#17becf" ], "dragmode": "pan", "template": { "data": { "bar": [ { "type": "bar", "marker": { "colorbar": { "ticks": "", "outlinewidth": 0 } } } ], "table": [ { "type": "table", "cells": { "fill": { "color": "#EBF0F8" }, "line": { "color": "white" } }, "header": { "fill": { "color": "#C8D4E3" }, "line": { "color": "white" } } } ], "carpet": [ { "type": "carpet", "aaxis": { "gridcolor": "#C8D4E3", "linecolor": "#C8D4E3", "endlinecolor": "#2a3f5f", "minorgridcolor": "#C8D4E3", "startlinecolor": "#2a3f5f" }, "baxis": { "gridcolor": "#C8D4E3", "linecolor": "#C8D4E3", "endlinecolor": "#2a3f5f", "minorgridcolor": "#C8D4E3", "startlinecolor": "#2a3f5f" } } ], "mesh3d": [ { "type": "mesh3d", "colorbar": { "ticks": "", "outlinewidth": 0 } } ], "contour": [ { "type": "contour", "colorbar": { "ticks": "", "outlinewidth": 0 }, "autocolorscale": true } ], "heatmap": [ { "type": "heatmap", "colorbar": { "ticks": "", "outlinewidth": 0 }, "autocolorscale": true } ], "scatter": [ { "type": "scatter", "marker": { "colorbar": { "ticks": "", "outlinewidth": 0 } } } ], "surface": [ { "type": "surface", "colorbar": { "ticks": "", "outlinewidth": 0 } } ], "heatmapgl": [ { "type": "heatmapgl", "colorbar": { "ticks": "", "outlinewidth": 0 } } ], "histogram": [ { "type": "histogram", "marker": { "colorbar": { "ticks": "", "outlinewidth": 0 } } } ], "parcoords": [ { "line": { "colorbar": { "ticks": "", "outlinewidth": 0 } }, "type": "parcoords" } ], "scatter3d": [ { "type": "scatter3d", "marker": { "colorbar": { "ticks": "", "outlinewidth": 0 } } } ], "scattergl": [ { "type": "scattergl", "marker": { "colorbar": { "ticks": "", "outlinewidth": 0 } } } ], "choropleth": [ { "type": "choropleth", "colorbar": { "ticks": "", "outlinewidth": 0 } } ], "scattergeo": [ { "type": "scattergeo", "marker": { "colorbar": { "ticks": "", "outlinewidth": 0 } } } ], "histogram2d": [ { "type": "histogram2d", "colorbar": { "ticks": "", "outlinewidth": 0 }, "autocolorscale": true } ], "scatterpolar": [ { "type": "scatterpolar", "marker": { "colorbar": { "ticks": "", "outlinewidth": 0 } } } ], "contourcarpet": [ { "type": "contourcarpet", "colorbar": { "ticks": "", "outlinewidth": 0 } } ], "scattercarpet": [ { "type": "scattercarpet", "marker": { "colorbar": { "ticks": "", "outlinewidth": 0 } } } ], "scattermapbox": [ { "type": "scattermapbox", "marker": { "colorbar": { "ticks": "", "outlinewidth": 0 } } } ], "scatterpolargl": [ { "type": "scatterpolargl", "marker": { "colorbar": { "ticks": "", "outlinewidth": 0 } } } ], "scatterternary": [ { "type": "scatterternary", "marker": { "colorbar": { "ticks": "", "outlinewidth": 0 } } } ], "histogram2dcontour": [ { "type": "histogram2dcontour", "colorbar": { "ticks": "", "outlinewidth": 0 }, "autocolorscale": true } ] }, "layout": { "geo": { "bgcolor": "white", "showland": true, "lakecolor": "white", "landcolor": "white", "showlakes": true, "subunitcolor": "#C8D4E3" }, "font": { "color": "#2a3f5f" }, "polar": { "bgcolor": "white", "radialaxis": { "ticks": "", "gridcolor": "#EBF0F8", "linecolor": "#EBF0F8" }, "angularaxis": { "ticks": "", "gridcolor": "#EBF0F8", "linecolor": "#EBF0F8" } }, "scene": { "xaxis": { "ticks": "", "gridcolor": "#DFE8F3", "gridwidth": 2, "linecolor": "#EBF0F8", "zerolinecolor": "#EBF0F8", "showbackground": true, "backgroundcolor": "white" }, "yaxis": { "ticks": "", "gridcolor": "#DFE8F3", "gridwidth": 2, "linecolor": "#EBF0F8", "zerolinecolor": "#EBF0F8", "showbackground": true, "backgroundcolor": "white" }, "zaxis": { "ticks": "", "gridcolor": "#DFE8F3", "gridwidth": 2, "linecolor": "#EBF0F8", "zerolinecolor": "#EBF0F8", "showbackground": true, "backgroundcolor": "white" } }, "title": { "x": 0.05 }, "xaxis": { "ticks": "", "gridcolor": "#EBF0F8", "linecolor": "#EBF0F8", "automargin": true, "zerolinecolor": "#EBF0F8", "zerolinewidth": 2 }, "yaxis": { "ticks": "", "gridcolor": "#EBF0F8", "linecolor": "#EBF0F8", "automargin": true, "zerolinecolor": "#EBF0F8", "zerolinewidth": 2 }, "ternary": { "aaxis": { "ticks": "", "gridcolor": "#DFE8F3", "linecolor": "#A2B1C6" }, "baxis": { "ticks": "", "gridcolor": "#DFE8F3", "linecolor": "#A2B1C6" }, "caxis": { "ticks": "", "gridcolor": "#DFE8F3", "linecolor": "#A2B1C6" }, "bgcolor": "white" }, "colorway": [ "#636efa", "#EF553B", "#00cc96", "#ab63fa", "#19d3f3", "#e763fa", "#fecb52", "#ffa15a", "#ff6692", "#b6e880" ], "hovermode": "closest", "colorscale": { "diverging": [ [ 0, "#8e0152" ], [ 0.1, "#c51b7d" ], [ 0.2, "#de77ae" ], [ 0.3, "#f1b6da" ], [ 0.4, "#fde0ef" ], [ 0.5, "#f7f7f7" ], [ 0.6, "#e6f5d0" ], [ 0.7, "#b8e186" ], [ 0.8, "#7fbc41" ], [ 0.9, "#4d9221" ], [ 1, "#276419" ] ], "sequential": [ [ 0, "#0508b8" ], [ 0.0893854748603352, "#1910d8" ], [ 0.1787709497206704, "#3c19f0" ], [ 0.2681564245810056, "#6b1cfb" ], [ 0.3575418994413408, "#981cfd" ], [ 0.44692737430167595, "#bf1cfd" ], [ 0.5363128491620112, "#dd2bfd" ], [ 0.6256983240223464, "#f246fe" ], [ 0.7150837988826816, "#fc67fd" ], [ 0.8044692737430168, "#fe88fc" ], [ 0.8938547486033519, "#fea5fd" ], [ 0.9832402234636871, "#febefe" ], [ 1, "#fec3fe" ] ], "sequentialminus": [ [ 0, "#0508b8" ], [ 0.0893854748603352, "#1910d8" ], [ 0.1787709497206704, "#3c19f0" ], [ 0.2681564245810056, "#6b1cfb" ], [ 0.3575418994413408, "#981cfd" ], [ 0.44692737430167595, "#bf1cfd" ], [ 0.5363128491620112, "#dd2bfd" ], [ 0.6256983240223464, "#f246fe" ], [ 0.7150837988826816, "#fc67fd" ], [ 0.8044692737430168, "#fe88fc" ], [ 0.8938547486033519, "#fea5fd" ], [ 0.9832402234636871, "#febefe" ], [ 1, "#fec3fe" ] ] }, "plot_bgcolor": "white", "paper_bgcolor": "white", "shapedefaults": { "line": { "width": 0 }, "opacity": 0.4, "fillcolor": "#506784" }, "annotationdefaults": { "arrowhead": 0, "arrowcolor": "#506784", "arrowwidth": 1 } }, "themeRef": "PLOTLY_WHITE" }, "clickmode": "event", "hovermode": "x", "uniformtext": { "mode": false }, "plot_bgcolor": "rgb(241, 240, 240)", "paper_bgcolor": "rgb(247, 247, 247)" } }, "height": null, "width": null, "user": { "profile_url": "https://chart-studio.plotly.com/~Yingbin", "avatar_url": "https://storage.googleapis.com/plotly-prod-profiles/97.jpg", "background_url": "https://storage.googleapis.com/plotly-prod-profiles/bg-14.jpg", "bio": "", "nickname": "", "website": "", "stream_tokens": null, "feature_set_id": null, "csrf_token": null, "date_joined": "2025-08-07 09:07:02", "mapbox_access_tokens": null, "has_password": null, "username": "Yingbin", "email": null, "is_active": null, "readonly": null, "is_dash_creator": null, "dash_created_count": null, "is_chart_creator": null, "charts_created_count": null } }, { "creation_time": "2025-08-08T01:15:36.608381Z", "comments": { "results": [], "count": 0 }, "parented": true, "embed_url": "https://chart-studio.plotly.com/~gayeon14/1.embed", "fid": "gayeon14:1", "filename": "example", "filetype": "plot", "img_url": "https://storage.googleapis.com/plotly-prod-images/gayeon14/1/9_31ZHB20SFF3GKHK8PS6MKT57KE4IX6.png", "image_urls": { "default": "https://storage.googleapis.com/plotly-prod-images/gayeon14/1/2_MMG7UX6QJMH82OMBQROTRRJYS6RH60.png", "block-thumb": "https://storage.googleapis.com/plotly-prod-images/gayeon14/1/8_T5CKL2HUMUFHJNJJMJM7HFW0086CG1.png", "list-thumb": "https://storage.googleapis.com/plotly-prod-images/gayeon14/1/9_31ZHB20SFF3GKHK8PS6MKT57KE4IX6.png" }, "api_urls": { "files": "https://api.plotly.com/v2/files/gayeon14:1", "plots": "https://api.plotly.com/v2/plots/gayeon14:1", "parent": "https://api.plotly.com/v2/folders/home?user=gayeon14" }, "owner": "gayeon14", "parent": -1, "preview": "", "referencers": [], "references": [], "title": "", "views": 1, "web_url": "https://chart-studio.plotly.com/~gayeon14/1/", "world_readable": true, "date_modified": "2025-08-08T01:15:36.619Z", "stars": { "results": [], "count": 0 }, "collaborators": { "results": [], "count": 0 }, "subfolder_count": null, "refresh_interval": null, "organize_view_url": "https://chart-studio.plotly.com/~gayeon14/1/", "current_user_permission": "read", "is_theme": null, "is_template": null, "autosize": true, "caption": "", "figure": { "data": [ { "mode": "markers", "name": "setosa", "type": "scatter", "xsrc": "gayeon14:0:e69c9d", "ysrc": "gayeon14:0:8e469b", "xaxis": "x", "yaxis": "y", "marker": { "color": "#636efa", "symbol": "circle" }, "showlegend": true, "legendgroup": "setosa", "orientation": "v", "hovertemplate": "species=setosa<br>sepal_width=%{x}<br>sepal_length=%{y}<extra></extra>" }, { "mode": "markers", "name": "versicolor", "type": "scatter", "xsrc": "gayeon14:0:5bd293", "ysrc": "gayeon14:0:cd59b2", "xaxis": "x", "yaxis": "y", "marker": { "color": "#EF553B", "symbol": "circle" }, "showlegend": true, "legendgroup": "versicolor", "orientation": "v", "hovertemplate": "species=versicolor<br>sepal_width=%{x}<br>sepal_length=%{y}<extra></extra>" }, { "mode": "markers", "name": "virginica", "type": "scatter", "xsrc": "gayeon14:0:247fc6", "ysrc": "gayeon14:0:8bc338", "xaxis": "x", "yaxis": "y", "marker": { "color": "#00cc96", "symbol": "circle" }, "showlegend": true, "legendgroup": "virginica", "orientation": "v", "hovertemplate": "species=virginica<br>sepal_width=%{x}<br>sepal_length=%{y}<extra></extra>" } ], "layout": { "xaxis": { "title": { "text": "sepal_width" }, "anchor": "y", "domain": [ 0.0, 1.0 ] }, "yaxis": { "title": { "text": "sepal_length" }, "anchor": "x", "domain": [ 0.0, 1.0 ] }, "legend": { "title": { "text": "species" }, "tracegroupgap": 0 }, "margin": { "t": 60 }, "template": { "data": { "bar": [ { "type": "bar", "marker": { "line": { "color": "#E5ECF6", "width": 0.5 }, "pattern": { "size": 10, "fillmode": "overlay", "solidity": 0.2 } }, "error_x": { "color": "#2a3f5f" }, "error_y": { "color": "#2a3f5f" } } ], "pie": [ { "type": "pie", "automargin": true } ], "table": [ { "type": "table", "cells": { "fill": { "color": "#EBF0F8" }, "line": { "color": "white" } }, "header": { "fill": { "color": "#C8D4E3" }, "line": { "color": "white" } } } ], "carpet": [ { "type": "carpet", "aaxis": { "gridcolor": "white", "linecolor": "white", "endlinecolor": "#2a3f5f", "minorgridcolor": "white", "startlinecolor": "#2a3f5f" }, "baxis": { "gridcolor": "white", "linecolor": "white", "endlinecolor": "#2a3f5f", "minorgridcolor": "white", "startlinecolor": "#2a3f5f" } } ], "mesh3d": [ { "type": "mesh3d", "colorbar": { "ticks": "", "outlinewidth": 0 } } ], "contour": [ { "type": "contour", "colorbar": { "ticks": "", "outlinewidth": 0 }, "colorscale": [ [ 0.0, "#0d0887" ], [ 0.1111111111111111, "#46039f" ], [ 0.2222222222222222, "#7201a8" ], [ 0.3333333333333333, "#9c179e" ], [ 0.4444444444444444, "#bd3786" ], [ 0.5555555555555556, "#d8576b" ], [ 0.6666666666666666, "#ed7953" ], [ 0.7777777777777778, "#fb9f3a" ], [ 0.8888888888888888, "#fdca26" ], [ 1.0, "#f0f921" ] ] } ], "heatmap": [ { "type": "heatmap", "colorbar": { "ticks": "", "outlinewidth": 0 }, "colorscale": [ [ 0.0, "#0d0887" ], [ 0.1111111111111111, "#46039f" ], [ 0.2222222222222222, "#7201a8" ], [ 0.3333333333333333, "#9c179e" ], [ 0.4444444444444444, "#bd3786" ], [ 0.5555555555555556, "#d8576b" ], [ 0.6666666666666666, "#ed7953" ], [ 0.7777777777777778, "#fb9f3a" ], [ 0.8888888888888888, "#fdca26" ], [ 1.0, "#f0f921" ] ] } ], "scatter": [ { "type": "scatter", "fillpattern": { "size": 10, "fillmode": "overlay", "solidity": 0.2 } } ], "surface": [ { "type": "surface", "colorbar": { "ticks": "", "outlinewidth": 0 }, "colorscale": [ [ 0.0, "#0d0887" ], [ 0.1111111111111111, "#46039f" ], [ 0.2222222222222222, "#7201a8" ], [ 0.3333333333333333, "#9c179e" ], [ 0.4444444444444444, "#bd3786" ], [ 0.5555555555555556, "#d8576b" ], [ 0.6666666666666666, "#ed7953" ], [ 0.7777777777777778, "#fb9f3a" ], [ 0.8888888888888888, "#fdca26" ], [ 1.0, "#f0f921" ] ] } ], "barpolar": [ { "type": "barpolar", "marker": { "line": { "color": "#E5ECF6", "width": 0.5 }, "pattern": { "size": 10, "fillmode": "overlay", "solidity": 0.2 } } } ], "heatmapgl": [ { "type": "heatmapgl", "colorbar": { "ticks": "", "outlinewidth": 0 }, "colorscale": [ [ 0.0, "#0d0887" ], [ 0.1111111111111111, "#46039f" ], [ 0.2222222222222222, "#7201a8" ], [ 0.3333333333333333, "#9c179e" ], [ 0.4444444444444444, "#bd3786" ], [ 0.5555555555555556, "#d8576b" ], [ 0.6666666666666666, "#ed7953" ], [ 0.7777777777777778, "#fb9f3a" ], [ 0.8888888888888888, "#fdca26" ], [ 1.0, "#f0f921" ] ] } ], "histogram": [ { "type": "histogram", "marker": { "pattern": { "size": 10, "fillmode": "overlay", "solidity": 0.2 } } } ], "parcoords": [ { "line": { "colorbar": { "ticks": "", "outlinewidth": 0 } }, "type": "parcoords" } ], "scatter3d": [ { "line": { "colorbar": { "ticks": "", "outlinewidth": 0 } }, "type": "scatter3d", "marker": { "colorbar": { "ticks": "", "outlinewidth": 0 } } } ], "scattergl": [ { "type": "scattergl", "marker": { "colorbar": { "ticks": "", "outlinewidth": 0 } } } ], "choropleth": [ { "type": "choropleth", "colorbar": { "ticks": "", "outlinewidth": 0 } } ], "scattergeo": [ { "type": "scattergeo", "marker": { "colorbar": { "ticks": "", "outlinewidth": 0 } } } ], "histogram2d": [ { "type": "histogram2d", "colorbar": { "ticks": "", "outlinewidth": 0 }, "colorscale": [ [ 0.0, "#0d0887" ], [ 0.1111111111111111, "#46039f" ], [ 0.2222222222222222, "#7201a8" ], [ 0.3333333333333333, "#9c179e" ], [ 0.4444444444444444, "#bd3786" ], [ 0.5555555555555556, "#d8576b" ], [ 0.6666666666666666, "#ed7953" ], [ 0.7777777777777778, "#fb9f3a" ], [ 0.8888888888888888, "#fdca26" ], [ 1.0, "#f0f921" ] ] } ], "scatterpolar": [ { "type": "scatterpolar", "marker": { "colorbar": { "ticks": "", "outlinewidth": 0 } } } ], "contourcarpet": [ { "type": "contourcarpet", "colorbar": { "ticks": "", "outlinewidth": 0 } } ], "scattercarpet": [ { "type": "scattercarpet", "marker": { "colorbar": { "ticks": "", "outlinewidth": 0 } } } ], "scattermapbox": [ { "type": "scattermapbox", "marker": { "colorbar": { "ticks": "", "outlinewidth": 0 } } } ], "scatterpolargl": [ { "type": "scatterpolargl", "marker": { "colorbar": { "ticks": "", "outlinewidth": 0 } } } ], "scatterternary": [ { "type": "scatterternary", "marker": { "colorbar": { "ticks": "", "outlinewidth": 0 } } } ], "histogram2dcontour": [ { "type": "histogram2dcontour", "colorbar": { "ticks": "", "outlinewidth": 0 }, "colorscale": [ [ 0.0, "#0d0887" ], [ 0.1111111111111111, "#46039f" ], [ 0.2222222222222222, "#7201a8" ], [ 0.3333333333333333, "#9c179e" ], [ 0.4444444444444444, "#bd3786" ], [ 0.5555555555555556, "#d8576b" ], [ 0.6666666666666666, "#ed7953" ], [ 0.7777777777777778, "#fb9f3a" ], [ 0.8888888888888888, "#fdca26" ], [ 1.0, "#f0f921" ] ] } ] }, "layout": { "geo": { "bgcolor": "white", "showland": true, "lakecolor": "white", "landcolor": "#E5ECF6", "showlakes": true, "subunitcolor": "white" }, "font": { "color": "#2a3f5f" }, "polar": { "bgcolor": "#E5ECF6", "radialaxis": { "ticks": "", "gridcolor": "white", "linecolor": "white" }, "angularaxis": { "ticks": "", "gridcolor": "white", "linecolor": "white" } }, "scene": { "xaxis": { "ticks": "", "gridcolor": "white", "gridwidth": 2, "linecolor": "white", "zerolinecolor": "white", "showbackground": true, "backgroundcolor": "#E5ECF6" }, "yaxis": { "ticks": "", "gridcolor": "white", "gridwidth": 2, "linecolor": "white", "zerolinecolor": "white", "showbackground": true, "backgroundcolor": "#E5ECF6" }, "zaxis": { "ticks": "", "gridcolor": "white", "gridwidth": 2, "linecolor": "white", "zerolinecolor": "white", "showbackground": true, "backgroundcolor": "#E5ECF6" } }, "title": { "x": 0.05 }, "xaxis": { "ticks": "", "title": { "standoff": 15 }, "gridcolor": "white", "linecolor": "white", "automargin": true, "zerolinecolor": "white", "zerolinewidth": 2 }, "yaxis": { "ticks": "", "title": { "standoff": 15 }, "gridcolor": "white", "linecolor": "white", "automargin": true, "zerolinecolor": "white", "zerolinewidth": 2 }, "mapbox": { "style": "light" }, "ternary": { "aaxis": { "ticks": "", "gridcolor": "white", "linecolor": "white" }, "baxis": { "ticks": "", "gridcolor": "white", "linecolor": "white" }, "caxis": { "ticks": "", "gridcolor": "white", "linecolor": "white" }, "bgcolor": "#E5ECF6" }, "colorway": [ "#636efa", "#EF553B", "#00cc96", "#ab63fa", "#FFA15A", "#19d3f3", "#FF6692", "#B6E880", "#FF97FF", "#FECB52" ], "coloraxis": { "colorbar": { "ticks": "", "outlinewidth": 0 } }, "hovermode": "closest", "colorscale": { "diverging": [ [ 0, "#8e0152" ], [ 0.1, "#c51b7d" ], [ 0.2, "#de77ae" ], [ 0.3, "#f1b6da" ], [ 0.4, "#fde0ef" ], [ 0.5, "#f7f7f7" ], [ 0.6, "#e6f5d0" ], [ 0.7, "#b8e186" ], [ 0.8, "#7fbc41" ], [ 0.9, "#4d9221" ], [ 1, "#276419" ] ], "sequential": [ [ 0.0, "#0d0887" ], [ 0.1111111111111111, "#46039f" ], [ 0.2222222222222222, "#7201a8" ], [ 0.3333333333333333, "#9c179e" ], [ 0.4444444444444444, "#bd3786" ], [ 0.5555555555555556, "#d8576b" ], [ 0.6666666666666666, "#ed7953" ], [ 0.7777777777777778, "#fb9f3a" ], [ 0.8888888888888888, "#fdca26" ], [ 1.0, "#f0f921" ] ], "sequentialminus": [ [ 0.0, "#0d0887" ], [ 0.1111111111111111, "#46039f" ], [ 0.2222222222222222, "#7201a8" ], [ 0.3333333333333333, "#9c179e" ], [ 0.4444444444444444, "#bd3786" ], [ 0.5555555555555556, "#d8576b" ], [ 0.6666666666666666, "#ed7953" ], [ 0.7777777777777778, "#fb9f3a" ], [ 0.8888888888888888, "#fdca26" ], [ 1.0, "#f0f921" ] ] }, "hoverlabel": { "align": "left" }, "plot_bgcolor": "#E5ECF6", "paper_bgcolor": "white", "shapedefaults": { "line": { "color": "#2a3f5f" } }, "autotypenumbers": "strict", "annotationdefaults": { "arrowhead": 0, "arrowcolor": "#2a3f5f", "arrowwidth": 1 } } } } }, "height": null, "width": null, "user": { "profile_url": "https://chart-studio.plotly.com/~gayeon14", "avatar_url": "https://storage.googleapis.com/plotly-prod-profiles/12.jpg", "background_url": "https://storage.googleapis.com/plotly-prod-profiles/bg-8.jpg", "bio": "", "nickname": "", "website": "", "stream_tokens": null, "feature_set_id": null, "csrf_token": null, "date_joined": "2025-08-08 00:49:16", "mapbox_access_tokens": null, "has_password": null, "username": "gayeon14", "email": null, "is_active": null, "readonly": null, "is_dash_creator": null, "dash_created_count": null, "is_chart_creator": null, "charts_created_count": null } }, { "creation_time": "2025-08-07T23:06:01.051971Z", "comments": { "results": [], "count": 0 }, "parented": true, "embed_url": "https://chart-studio.plotly.com/~jos272ph/9.embed", "fid": "jos272ph:9", "filename": "Plot 9", "filetype": "plot", "img_url": "https://api.plotly.com/v2/files/jos272ph:9/image?image_name=list-thumb", "image_urls": { "default": "https://api.plotly.com/v2/files/jos272ph:9/image?image_name=default", "block-thumb": "https://api.plotly.com/v2/files/jos272ph:9/image?image_name=block-thumb", "list-thumb": "https://api.plotly.com/v2/files/jos272ph:9/image?image_name=list-thumb" }, "api_urls": { "files": "https://api.plotly.com/v2/files/jos272ph:9", "plots": "https://api.plotly.com/v2/plots/jos272ph:9", "parent": "https://api.plotly.com/v2/folders/home?user=jos272ph" }, "owner": "jos272ph", "parent": -1, "preview": "", "referencers": [], "references": [], "title": "", "views": 1, "web_url": "https://chart-studio.plotly.com/~jos272ph/9/", "world_readable": true, "date_modified": "2025-08-07T23:06:01.063Z", "stars": { "results": [], "count": 0 }, "collaborators": { "results": [], "count": 0 }, "subfolder_count": null, "refresh_interval": null, "organize_view_url": "https://chart-studio.plotly.com/~jos272ph/9/", "current_user_permission": "read", "is_theme": null, "is_template": false, "autosize": true, "caption": "", "figure": { "data": [ { "box": { "width": 0.25, "visible": true }, "meta": { "columnNames": { "x": "x", "y": "", "text": "x" } }, "mode": "markers", "name": "Actual grades", "side": "positive", "type": "violin", "xsrc": "jos272ph:7:d5a1a9", "xbins": { "size": 0 }, "jitter": 0.33, "marker": { "color": "#636efa", "symbol": "circle" }, "points": "all", "opacity": 1, "textsrc": "jos272ph:7:d5a1a9", "meanline": { "visible": true }, "pointpos": 0, "spanmode": "hard", "bandwidth": 0, "scalemode": "count", "scalegroup": "", "showlegend": true, "orientation": "h", "hovertemplate": " ", "autocolorscale": true }, { "box": { "visible": true }, "meta": { "columnNames": { "x": "A", "text": "A" } }, "name": "Normal distribution", "side": "positive", "type": "violin", "xsrc": "jos272ph:8:81d96c", "width": 0, "jitter": 0.59, "marker": { "line": { "width": 1 }, "color": "#EF553B" }, "points": "all", "textsrc": "jos272ph:8:81d96c", "meanline": { "visible": true }, "pointpos": -0.09999999999999987, "spanmode": "soft", "bandwidth": 0, "scalemode": "width", "showlegend": true } ], "frames": [], "layout": { "font": { "family": "Arial" }, "title": { "text": "Spring 2025 Crown Grades" }, "xaxis": { "type": "linear", "range": [ 69.49014567266495, 100.06426735218508 ], "title": { "text": "<br>" }, "anchor": "free", "domain": [ 0, 1 ], "showline": false, "autorange": false, "fixedrange": true, "showspikes": false, "rangeslider": { "range": [ 68.22981242373483, 100.86716757626517 ], "yaxis": { "rangemode": "match" }, "visible": true, "autorange": true }, "zerolinewidth": 11 }, "yaxis": { "type": "category", "range": [ -0.5116324789964048, 1.6 ], "title": { "text": "Click to enter Y axis title" }, "domain": [ 0, 1 ], "showgrid": true, "showline": true, "zeroline": true, "autorange": false, "fixedrange": true, "showspikes": false }, "modebar": { "orientation": "h" }, "autosize": true, "dragmode": "select", "template": { "data": { "bar": [ { "type": "bar", "marker": { "colorbar": { "ticks": "", "outlinewidth": 0 } } } ], "table": [ { "type": "table", "cells": { "fill": { "color": "#EBF0F8" }, "line": { "color": "white" } }, "header": { "fill": { "color": "#C8D4E3" }, "line": { "color": "white" } } } ], "carpet": [ { "type": "carpet", "aaxis": { "gridcolor": "#C8D4E3", "linecolor": "#C8D4E3", "endlinecolor": "#2a3f5f", "minorgridcolor": "#C8D4E3", "startlinecolor": "#2a3f5f" }, "baxis": { "gridcolor": "#C8D4E3", "linecolor": "#C8D4E3", "endlinecolor": "#2a3f5f", "minorgridcolor": "#C8D4E3", "startlinecolor": "#2a3f5f" } } ], "mesh3d": [ { "type": "mesh3d", "colorbar": { "ticks": "", "outlinewidth": 0 } } ], "contour": [ { "type": "contour", "colorbar": { "ticks": "", "outlinewidth": 0 }, "autocolorscale": true } ], "heatmap": [ { "type": "heatmap", "colorbar": { "ticks": "", "outlinewidth": 0 }, "autocolorscale": true } ], "scatter": [ { "type": "scatter", "marker": { "colorbar": { "ticks": "", "outlinewidth": 0 } } } ], "surface": [ { "type": "surface", "colorbar": { "ticks": "", "outlinewidth": 0 } } ], "heatmapgl": [ { "type": "heatmapgl", "colorbar": { "ticks": "", "outlinewidth": 0 } } ], "histogram": [ { "type": "histogram", "marker": { "colorbar": { "ticks": "", "outlinewidth": 0 } } } ], "parcoords": [ { "line": { "colorbar": { "ticks": "", "outlinewidth": 0 } }, "type": "parcoords" } ], "scatter3d": [ { "type": "scatter3d", "marker": { "colorbar": { "ticks": "", "outlinewidth": 0 } } } ], "scattergl": [ { "type": "scattergl", "marker": { "colorbar": { "ticks": "", "outlinewidth": 0 } } } ], "choropleth": [ { "type": "choropleth", "colorbar": { "ticks": "", "outlinewidth": 0 } } ], "scattergeo": [ { "type": "scattergeo", "marker": { "colorbar": { "ticks": "", "outlinewidth": 0 } } } ], "histogram2d": [ { "type": "histogram2d", "colorbar": { "ticks": "", "outlinewidth": 0 }, "autocolorscale": true } ], "scatterpolar": [ { "type": "scatterpolar", "marker": { "colorbar": { "ticks": "", "outlinewidth": 0 } } } ], "contourcarpet": [ { "type": "contourcarpet", "colorbar": { "ticks": "", "outlinewidth": 0 } } ], "scattercarpet": [ { "type": "scattercarpet", "marker": { "colorbar": { "ticks": "", "outlinewidth": 0 } } } ], "scattermapbox": [ { "type": "scattermapbox", "marker": { "colorbar": { "ticks": "", "outlinewidth": 0 } } } ], "scatterpolargl": [ { "type": "scatterpolargl", "marker": { "colorbar": { "ticks": "", "outlinewidth": 0 } } } ], "scatterternary": [ { "type": "scatterternary", "marker": { "colorbar": { "ticks": "", "outlinewidth": 0 } } } ], "histogram2dcontour": [ { "type": "histogram2dcontour", "colorbar": { "ticks": "", "outlinewidth": 0 }, "autocolorscale": true } ] }, "layout": { "geo": { "bgcolor": "white", "showland": true, "lakecolor": "white", "landcolor": "white", "showlakes": true, "subunitcolor": "#C8D4E3" }, "font": { "color": "#2a3f5f" }, "polar": { "bgcolor": "white", "radialaxis": { "ticks": "", "gridcolor": "#EBF0F8", "linecolor": "#EBF0F8" }, "angularaxis": { "ticks": "", "gridcolor": "#EBF0F8", "linecolor": "#EBF0F8" } }, "scene": { "xaxis": { "ticks": "", "gridcolor": "#DFE8F3", "gridwidth": 2, "linecolor": "#EBF0F8", "zerolinecolor": "#EBF0F8", "showbackground": true, "backgroundcolor": "white" }, "yaxis": { "ticks": "", "gridcolor": "#DFE8F3", "gridwidth": 2, "linecolor": "#EBF0F8", "zerolinecolor": "#EBF0F8", "showbackground": true, "backgroundcolor": "white" }, "zaxis": { "ticks": "", "gridcolor": "#DFE8F3", "gridwidth": 2, "linecolor": "#EBF0F8", "zerolinecolor": "#EBF0F8", "showbackground": true, "backgroundcolor": "white" } }, "title": { "x": 0.05 }, "xaxis": { "ticks": "", "gridcolor": "#EBF0F8", "linecolor": "#EBF0F8", "automargin": true, "zerolinecolor": "#EBF0F8", "zerolinewidth": 2 }, "yaxis": { "ticks": "", "gridcolor": "#EBF0F8", "linecolor": "#EBF0F8", "automargin": true, "zerolinecolor": "#EBF0F8", "zerolinewidth": 2 }, "ternary": { "aaxis": { "ticks": "", "gridcolor": "#DFE8F3", "linecolor": "#A2B1C6" }, "baxis": { "ticks": "", "gridcolor": "#DFE8F3", "linecolor": "#A2B1C6" }, "caxis": { "ticks": "", "gridcolor": "#DFE8F3", "linecolor": "#A2B1C6" }, "bgcolor": "white" }, "colorway": [ "#636efa", "#EF553B", "#00cc96", "#ab63fa", "#19d3f3", "#e763fa", "#fecb52", "#ffa15a", "#ff6692", "#b6e880" ], "hovermode": "closest", "colorscale": { "diverging": [ [ 0, "#8e0152" ], [ 0.1, "#c51b7d" ], [ 0.2, "#de77ae" ], [ 0.3, "#f1b6da" ], [ 0.4, "#fde0ef" ], [ 0.5, "#f7f7f7" ], [ 0.6, "#e6f5d0" ], [ 0.7, "#b8e186" ], [ 0.8, "#7fbc41" ], [ 0.9, "#4d9221" ], [ 1, "#276419" ] ], "sequential": [ [ 0, "#0508b8" ], [ 0.0893854748603352, "#1910d8" ], [ 0.1787709497206704, "#3c19f0" ], [ 0.2681564245810056, "#6b1cfb" ], [ 0.3575418994413408, "#981cfd" ], [ 0.44692737430167595, "#bf1cfd" ], [ 0.5363128491620112, "#dd2bfd" ], [ 0.6256983240223464, "#f246fe" ], [ 0.7150837988826816, "#fc67fd" ], [ 0.8044692737430168, "#fe88fc" ], [ 0.8938547486033519, "#fea5fd" ], [ 0.9832402234636871, "#febefe" ], [ 1, "#fec3fe" ] ], "sequentialminus": [ [ 0, "#0508b8" ], [ 0.0893854748603352, "#1910d8" ], [ 0.1787709497206704, "#3c19f0" ], [ 0.2681564245810056, "#6b1cfb" ], [ 0.3575418994413408, "#981cfd" ], [ 0.44692737430167595, "#bf1cfd" ], [ 0.5363128491620112, "#dd2bfd" ], [ 0.6256983240223464, "#f246fe" ], [ 0.7150837988826816, "#fc67fd" ], [ 0.8044692737430168, "#fe88fc" ], [ 0.8938547486033519, "#fea5fd" ], [ 0.9832402234636871, "#febefe" ], [ 1, "#fec3fe" ] ] }, "plot_bgcolor": "white", "paper_bgcolor": "white", "shapedefaults": { "line": { "width": 0 }, "opacity": 0.4, "fillcolor": "#506784" }, "annotationdefaults": { "arrowhead": 0, "arrowcolor": "#506784", "arrowwidth": 1 } }, "themeRef": "PLOTLY_WHITE" }, "violingap": 0, "violinmode": "overlay", "violingroupgap": 0 } }, "height": null, "width": null, "user": { "profile_url": "https://chart-studio.plotly.com/~jos272ph", "avatar_url": "https://storage.googleapis.com/plotly-prod-profiles/33.jpg", "background_url": "https://storage.googleapis.com/plotly-prod-profiles/bg-0.jpg", "bio": "", "nickname": "", "website": "", "stream_tokens": null, "feature_set_id": null, "csrf_token": null, "date_joined": "2025-05-15 01:25:23", "mapbox_access_tokens": null, "has_password": null, "username": "jos272ph", "email": null, "is_active": null, "readonly": null, "is_dash_creator": null, "dash_created_count": null, "is_chart_creator": null, "charts_created_count": null } }, { "creation_time": "2025-08-07T22:14:48.078863Z", "comments": { "results": [], "count": 0 }, "parented": true, "embed_url": "https://chart-studio.plotly.com/~Charliesakeepa/3.embed", "fid": "Charliesakeepa:3", "filename": "Balanced Beam Plot Graph", "filetype": "plot", "img_url": "https://storage.googleapis.com/plotly-prod-images/Charliesakeepa/3/9_PKC9WBWK66JL5COHF7C9CPR4F3O36U.png", "image_urls": { "default": "https://storage.googleapis.com/plotly-prod-images/Charliesakeepa/3/2_JD4A6E3SXWKSRHRG95UAIUKWECN3SI.png", "block-thumb": "https://storage.googleapis.com/plotly-prod-images/Charliesakeepa/3/8_11DA5K6WT23GWRJK04ICMSB5D7FLJ1.png", "list-thumb": "https://storage.googleapis.com/plotly-prod-images/Charliesakeepa/3/9_PKC9WBWK66JL5COHF7C9CPR4F3O36U.png" }, "api_urls": { "files": "https://api.plotly.com/v2/files/Charliesakeepa:3", "plots": "https://api.plotly.com/v2/plots/Charliesakeepa:3", "parent": "https://api.plotly.com/v2/folders/home?user=Charliesakeepa" }, "owner": "Charliesakeepa", "parent": -1, "preview": "", "referencers": [], "references": [], "title": "", "views": 0, "web_url": "https://chart-studio.plotly.com/~Charliesakeepa/3/", "world_readable": true, "date_modified": "2025-08-17T23:05:24.155Z", "stars": { "results": [], "count": 0 }, "collaborators": { "results": [], "count": 0 }, "subfolder_count": null, "refresh_interval": null, "organize_view_url": "https://chart-studio.plotly.com/~Charliesakeepa/3/", "current_user_permission": "read", "is_theme": null, "is_template": false, "autosize": true, "caption": "", "figure": { "data": [ { "uid": "0af123", "meta": { "columnNames": { "x": "1/d (1/m)", "y": "Mass m (kg)" } }, "mode": "markers", "name": "Trace", "type": "scatter", "xsrc": "Charliesakeepa:2:f29871", "ysrc": "Charliesakeepa:2:de0ef9", "marker": { "color": "rgb(207, 59, 239)" }, "error_x": { "visible": true, "symmetric": true }, "error_y": { "visible": true, "symmetric": true, "thickness": 1 } }, { "uid": "57f3ca", "line": { "color": "rgb(183, 59, 239)" }, "name": "Line of best fit", "transforms": [ { "rms": "", "type": "fit", "inputUid": "0af123", "regressor": "x", "parameters": [ { "hold": false, "name": "m", "error": 0.0005780373599686489, "value": 0.05757573873875794 }, { "hold": false, "name": "b", "error": 0.002491860086391294, "value": -0.037920802006950236 } ], "regressand": "y", "correlation": "", "fitfunction": "m*x + b", "inputxrange": [], "outputxrange": [], "interpolation": 50 } ] }, { "uid": "dd7488", "line": { "color": "rgb(84, 157, 167)" }, "name": "Line of worst fit", "transforms": [ { "rms": "", "type": "fit", "inputUid": "0af123", "regressor": "x", "parameters": [ { "hold": true, "name": "m", "error": 0.0005780373599696844, "value": 0.062 }, { "hold": true, "name": "b", "error": 0.0024918600863950515, "value": -0.042 } ], "regressand": "y", "correlation": "", "fitfunction": "m*x + b", "inputxrange": [], "outputxrange": [], "interpolation": 50 } ] } ], "frames": [], "layout": { "title": { "text": "The Relationship Between the Balanced Mass m (kg) and 1/Balanced Distance d (1/m)" }, "xaxis": { "type": "linear", "range": [ 1.938539324677778, 6.709117125122221 ], "title": { "text": "1/d (1/m)" }, "autorange": false }, "yaxis": { "type": "linear", "range": [ 0.07666666666666669, 0.34333333333333327 ], "title": { "text": "Mass m (kg)" }, "autorange": false }, "autosize": true, "dragmode": "pan", "template": { "data": { "bar": [ { "type": "bar", "marker": { "colorbar": { "ticks": "", "outlinewidth": 0 } } } ], "table": [ { "type": "table", "cells": { "fill": { "color": "#EBF0F8" }, "line": { "color": "white" } }, "header": { "fill": { "color": "#C8D4E3" }, "line": { "color": "white" } } } ], "carpet": [ { "type": "carpet", "aaxis": { "gridcolor": "#C8D4E3", "linecolor": "#C8D4E3", "endlinecolor": "#2a3f5f", "minorgridcolor": "#C8D4E3", "startlinecolor": "#2a3f5f" }, "baxis": { "gridcolor": "#C8D4E3", "linecolor": "#C8D4E3", "endlinecolor": "#2a3f5f", "minorgridcolor": "#C8D4E3", "startlinecolor": "#2a3f5f" } } ], "mesh3d": [ { "type": "mesh3d", "colorbar": { "ticks": "", "outlinewidth": 0 } } ], "contour": [ { "type": "contour", "colorbar": { "ticks": "", "outlinewidth": 0 }, "autocolorscale": true } ], "heatmap": [ { "type": "heatmap", "colorbar": { "ticks": "", "outlinewidth": 0 }, "autocolorscale": true } ], "scatter": [ { "type": "scatter", "marker": { "colorbar": { "ticks": "", "outlinewidth": 0 } } } ], "surface": [ { "type": "surface", "colorbar": { "ticks": "", "outlinewidth": 0 } } ], "heatmapgl": [ { "type": "heatmapgl", "colorbar": { "ticks": "", "outlinewidth": 0 } } ], "histogram": [ { "type": "histogram", "marker": { "colorbar": { "ticks": "", "outlinewidth": 0 } } } ], "parcoords": [ { "line": { "colorbar": { "ticks": "", "outlinewidth": 0 } }, "type": "parcoords" } ], "scatter3d": [ { "type": "scatter3d", "marker": { "colorbar": { "ticks": "", "outlinewidth": 0 } } } ], "scattergl": [ { "type": "scattergl", "marker": { "colorbar": { "ticks": "", "outlinewidth": 0 } } } ], "choropleth": [ { "type": "choropleth", "colorbar": { "ticks": "", "outlinewidth": 0 } } ], "scattergeo": [ { "type": "scattergeo", "marker": { "colorbar": { "ticks": "", "outlinewidth": 0 } } } ], "histogram2d": [ { "type": "histogram2d", "colorbar": { "ticks": "", "outlinewidth": 0 }, "autocolorscale": true } ], "scatterpolar": [ { "type": "scatterpolar", "marker": { "colorbar": { "ticks": "", "outlinewidth": 0 } } } ], "contourcarpet": [ { "type": "contourcarpet", "colorbar": { "ticks": "", "outlinewidth": 0 } } ], "scattercarpet": [ { "type": "scattercarpet", "marker": { "colorbar": { "ticks": "", "outlinewidth": 0 } } } ], "scattermapbox": [ { "type": "scattermapbox", "marker": { "colorbar": { "ticks": "", "outlinewidth": 0 } } } ], "scatterpolargl": [ { "type": "scatterpolargl", "marker": { "colorbar": { "ticks": "", "outlinewidth": 0 } } } ], "scatterternary": [ { "type": "scatterternary", "marker": { "colorbar": { "ticks": "", "outlinewidth": 0 } } } ], "histogram2dcontour": [ { "type": "histogram2dcontour", "colorbar": { "ticks": "", "outlinewidth": 0 }, "autocolorscale": true } ] }, "layout": { "geo": { "bgcolor": "white", "showland": true, "lakecolor": "white", "landcolor": "white", "showlakes": true, "subunitcolor": "#C8D4E3" }, "font": { "color": "#2a3f5f" }, "polar": { "bgcolor": "white", "radialaxis": { "ticks": "", "gridcolor": "#EBF0F8", "linecolor": "#EBF0F8" }, "angularaxis": { "ticks": "", "gridcolor": "#EBF0F8", "linecolor": "#EBF0F8" } }, "scene": { "xaxis": { "ticks": "", "gridcolor": "#DFE8F3", "gridwidth": 2, "linecolor": "#EBF0F8", "zerolinecolor": "#EBF0F8", "showbackground": true, "backgroundcolor": "white" }, "yaxis": { "ticks": "", "gridcolor": "#DFE8F3", "gridwidth": 2, "linecolor": "#EBF0F8", "zerolinecolor": "#EBF0F8", "showbackground": true, "backgroundcolor": "white" }, "zaxis": { "ticks": "", "gridcolor": "#DFE8F3", "gridwidth": 2, "linecolor": "#EBF0F8", "zerolinecolor": "#EBF0F8", "showbackground": true, "backgroundcolor": "white" } }, "title": { "x": 0.05 }, "xaxis": { "ticks": "", "gridcolor": "#EBF0F8", "linecolor": "#EBF0F8", "automargin": true, "zerolinecolor": "#EBF0F8", "zerolinewidth": 2 }, "yaxis": { "ticks": "", "gridcolor": "#EBF0F8", "linecolor": "#EBF0F8", "automargin": true, "zerolinecolor": "#EBF0F8", "zerolinewidth": 2 }, "ternary": { "aaxis": { "ticks": "", "gridcolor": "#DFE8F3", "linecolor": "#A2B1C6" }, "baxis": { "ticks": "", "gridcolor": "#DFE8F3", "linecolor": "#A2B1C6" }, "caxis": { "ticks": "", "gridcolor": "#DFE8F3", "linecolor": "#A2B1C6" }, "bgcolor": "white" }, "colorway": [ "#636efa", "#EF553B", "#00cc96", "#ab63fa", "#19d3f3", "#e763fa", "#fecb52", "#ffa15a", "#ff6692", "#b6e880" ], "hovermode": "closest", "colorscale": { "diverging": [ [ 0, "#8e0152" ], [ 0.1, "#c51b7d" ], [ 0.2, "#de77ae" ], [ 0.3, "#f1b6da" ], [ 0.4, "#fde0ef" ], [ 0.5, "#f7f7f7" ], [ 0.6, "#e6f5d0" ], [ 0.7, "#b8e186" ], [ 0.8, "#7fbc41" ], [ 0.9, "#4d9221" ], [ 1, "#276419" ] ], "sequential": [ [ 0, "#0508b8" ], [ 0.0893854748603352, "#1910d8" ], [ 0.1787709497206704, "#3c19f0" ], [ 0.2681564245810056, "#6b1cfb" ], [ 0.3575418994413408, "#981cfd" ], [ 0.44692737430167595, "#bf1cfd" ], [ 0.5363128491620112, "#dd2bfd" ], [ 0.6256983240223464, "#f246fe" ], [ 0.7150837988826816, "#fc67fd" ], [ 0.8044692737430168, "#fe88fc" ], [ 0.8938547486033519, "#fea5fd" ], [ 0.9832402234636871, "#febefe" ], [ 1, "#fec3fe" ] ], "sequentialminus": [ [ 0, "#0508b8" ], [ 0.0893854748603352, "#1910d8" ], [ 0.1787709497206704, "#3c19f0" ], [ 0.2681564245810056, "#6b1cfb" ], [ 0.3575418994413408, "#981cfd" ], [ 0.44692737430167595, "#bf1cfd" ], [ 0.5363128491620112, "#dd2bfd" ], [ 0.6256983240223464, "#f246fe" ], [ 0.7150837988826816, "#fc67fd" ], [ 0.8044692737430168, "#fe88fc" ], [ 0.8938547486033519, "#fea5fd" ], [ 0.9832402234636871, "#febefe" ], [ 1, "#fec3fe" ] ] }, "plot_bgcolor": "white", "paper_bgcolor": "white", "shapedefaults": { "line": { "width": 0 }, "opacity": 0.4, "fillcolor": "#506784" }, "annotationdefaults": { "arrowhead": 0, "arrowcolor": "#506784", "arrowwidth": 1 } }, "themeRef": "PLOTLY_WHITE" } } }, "height": null, "width": null, "user": { "profile_url": "https://chart-studio.plotly.com/~Charliesakeepa", "avatar_url": "https://storage.googleapis.com/plotly-prod-profiles/54.jpg", "background_url": "https://storage.googleapis.com/plotly-prod-profiles/bg-6.jpg", "bio": "", "nickname": "", "website": "", "stream_tokens": null, "feature_set_id": null, "csrf_token": null, "date_joined": "2025-08-07 21:26:14", "mapbox_access_tokens": null, "has_password": null, "username": "Charliesakeepa", "email": null, "is_active": null, "readonly": null, "is_dash_creator": null, "dash_created_count": null, "is_chart_creator": null, "charts_created_count": null } }, { "creation_time": "2025-08-07T21:27:20.575560Z", "comments": { "results": [], "count": 0 }, "parented": true, "embed_url": "https://chart-studio.plotly.com/~Charliesakeepa/1.embed", "fid": "Charliesakeepa:1", "filename": "Rolling Ball Plot Graph", "filetype": "plot", "img_url": "https://storage.googleapis.com/plotly-prod-images/Charliesakeepa/1/9_55SVW5ZHETF107LMHVB3D0T7UF28A8.png", "image_urls": { "default": "https://storage.googleapis.com/plotly-prod-images/Charliesakeepa/1/2_42IX47LPJIRC5RGY4JIDH3J6WKPK4C.png", "block-thumb": "https://storage.googleapis.com/plotly-prod-images/Charliesakeepa/1/8_BDNMCY18Z73GU47BQPY5LMYAUGBUA0.png", "list-thumb": "https://storage.googleapis.com/plotly-prod-images/Charliesakeepa/1/9_55SVW5ZHETF107LMHVB3D0T7UF28A8.png" }, "api_urls": { "files": "https://api.plotly.com/v2/files/Charliesakeepa:1", "plots": "https://api.plotly.com/v2/plots/Charliesakeepa:1", "parent": "https://api.plotly.com/v2/folders/home?user=Charliesakeepa" }, "owner": "Charliesakeepa", "parent": -1, "preview": "", "referencers": [], "references": [], "title": "", "views": 0, "web_url": "https://chart-studio.plotly.com/~Charliesakeepa/1/", "world_readable": true, "date_modified": "2025-08-14T21:27:25.899Z", "stars": { "results": [], "count": 0 }, "collaborators": { "results": [], "count": 0 }, "subfolder_count": null, "refresh_interval": null, "organize_view_url": "https://chart-studio.plotly.com/~Charliesakeepa/1/", "current_user_permission": "read", "is_theme": null, "is_template": false, "autosize": true, "caption": "", "figure": { "data": [ { "uid": "5bcb89", "meta": { "columnNames": { "x": "1/T^2 (1/s^2)", "y": "Height d (m)" } }, "mode": "markers", "name": "Trace", "type": "scatter", "xsrc": "Charliesakeepa:0:1a7051", "ysrc": "Charliesakeepa:0:b00e29", "error_x": { "type": "percent", "visible": true, "symmetric": true }, "error_y": { "visible": true, "symmetric": true, "thickness": 1 }, "stackgroup": null }, { "uid": "b9b945", "line": { "color": "rgb(193, 99, 250)" }, "name": "Line of best fit", "transforms": [ { "rms": "", "type": "fit", "inputUid": "5bcb89", "regressor": "x", "parameters": [ { "hold": false, "name": "m", "error": 0.015360660632271763, "value": 0.37957338272597 }, { "hold": false, "name": "b", "error": 0.002722320624172424, "value": -0.0010675138819916845 } ], "regressand": "y", "correlation": "", "fitfunction": "m*x + b", "inputxrange": [], "outputxrange": [], "interpolation": 50 } ] }, { "uid": "c91669", "line": { "color": "rgb(121, 175, 203)" }, "name": "Line of worst fit", "transforms": [ { "rms": "", "type": "fit", "inputUid": "5bcb89", "regressor": "x", "parameters": [ { "hold": true, "name": "m", "error": 0.015360660632030983, "value": 0.42 }, { "hold": true, "name": "b", "error": 0.002722320624144666, "value": -0.005 } ], "regressand": "y", "correlation": "", "fitfunction": "m*x + b", "inputxrange": [], "outputxrange": [], "interpolation": 50 } ] } ], "frames": [], "layout": { "title": { "text": "The Relationship Between the Height d (m) of the Slope and 1/Time squared (1/s^2)" }, "xaxis": { "type": "linear", "range": [ 0.03986724076811111, 0.3133136210858889 ], "title": { "text": "1/T^2 (1/s^2)" }, "autorange": true }, "yaxis": { "type": "linear", "range": [ 0.01288888888888889, 0.11511111111111111 ], "title": { "text": "Height d (m)" }, "autorange": true }, "autosize": true, "dragmode": "pan", "template": { "data": { "bar": [ { "type": "bar", "marker": { "colorbar": { "ticks": "", "outlinewidth": 0 } } } ], "table": [ { "type": "table", "cells": { "fill": { "color": "#EBF0F8" }, "line": { "color": "white" } }, "header": { "fill": { "color": "#C8D4E3" }, "line": { "color": "white" } } } ], "carpet": [ { "type": "carpet", "aaxis": { "gridcolor": "#C8D4E3", "linecolor": "#C8D4E3", "endlinecolor": "#2a3f5f", "minorgridcolor": "#C8D4E3", "startlinecolor": "#2a3f5f" }, "baxis": { "gridcolor": "#C8D4E3", "linecolor": "#C8D4E3", "endlinecolor": "#2a3f5f", "minorgridcolor": "#C8D4E3", "startlinecolor": "#2a3f5f" } } ], "mesh3d": [ { "type": "mesh3d", "colorbar": { "ticks": "", "outlinewidth": 0 } } ], "contour": [ { "type": "contour", "colorbar": { "ticks": "", "outlinewidth": 0 }, "autocolorscale": true } ], "heatmap": [ { "type": "heatmap", "colorbar": { "ticks": "", "outlinewidth": 0 }, "autocolorscale": true } ], "scatter": [ { "type": "scatter", "marker": { "colorbar": { "ticks": "", "outlinewidth": 0 } } } ], "surface": [ { "type": "surface", "colorbar": { "ticks": "", "outlinewidth": 0 } } ], "heatmapgl": [ { "type": "heatmapgl", "colorbar": { "ticks": "", "outlinewidth": 0 } } ], "histogram": [ { "type": "histogram", "marker": { "colorbar": { "ticks": "", "outlinewidth": 0 } } } ], "parcoords": [ { "line": { "colorbar": { "ticks": "", "outlinewidth": 0 } }, "type": "parcoords" } ], "scatter3d": [ { "type": "scatter3d", "marker": { "colorbar": { "ticks": "", "outlinewidth": 0 } } } ], "scattergl": [ { "type": "scattergl", "marker": { "colorbar": { "ticks": "", "outlinewidth": 0 } } } ], "choropleth": [ { "type": "choropleth", "colorbar": { "ticks": "", "outlinewidth": 0 } } ], "scattergeo": [ { "type": "scattergeo", "marker": { "colorbar": { "ticks": "", "outlinewidth": 0 } } } ], "histogram2d": [ { "type": "histogram2d", "colorbar": { "ticks": "", "outlinewidth": 0 }, "autocolorscale": true } ], "scatterpolar": [ { "type": "scatterpolar", "marker": { "colorbar": { "ticks": "", "outlinewidth": 0 } } } ], "contourcarpet": [ { "type": "contourcarpet", "colorbar": { "ticks": "", "outlinewidth": 0 } } ], "scattercarpet": [ { "type": "scattercarpet", "marker": { "colorbar": { "ticks": "", "outlinewidth": 0 } } } ], "scattermapbox": [ { "type": "scattermapbox", "marker": { "colorbar": { "ticks": "", "outlinewidth": 0 } } } ], "scatterpolargl": [ { "type": "scatterpolargl", "marker": { "colorbar": { "ticks": "", "outlinewidth": 0 } } } ], "scatterternary": [ { "type": "scatterternary", "marker": { "colorbar": { "ticks": "", "outlinewidth": 0 } } } ], "histogram2dcontour": [ { "type": "histogram2dcontour", "colorbar": { "ticks": "", "outlinewidth": 0 }, "autocolorscale": true } ] }, "layout": { "geo": { "bgcolor": "white", "showland": true, "lakecolor": "white", "landcolor": "white", "showlakes": true, "subunitcolor": "#C8D4E3" }, "font": { "color": "#2a3f5f" }, "polar": { "bgcolor": "white", "radialaxis": { "ticks": "", "gridcolor": "#EBF0F8", "linecolor": "#EBF0F8" }, "angularaxis": { "ticks": "", "gridcolor": "#EBF0F8", "linecolor": "#EBF0F8" } }, "scene": { "xaxis": { "ticks": "", "gridcolor": "#DFE8F3", "gridwidth": 2, "linecolor": "#EBF0F8", "zerolinecolor": "#EBF0F8", "showbackground": true, "backgroundcolor": "white" }, "yaxis": { "ticks": "", "gridcolor": "#DFE8F3", "gridwidth": 2, "linecolor": "#EBF0F8", "zerolinecolor": "#EBF0F8", "showbackground": true, "backgroundcolor": "white" }, "zaxis": { "ticks": "", "gridcolor": "#DFE8F3", "gridwidth": 2, "linecolor": "#EBF0F8", "zerolinecolor": "#EBF0F8", "showbackground": true, "backgroundcolor": "white" } }, "title": { "x": 0.05 }, "xaxis": { "ticks": "", "gridcolor": "#EBF0F8", "linecolor": "#EBF0F8", "automargin": true, "zerolinecolor": "#EBF0F8", "zerolinewidth": 2 }, "yaxis": { "ticks": "", "gridcolor": "#EBF0F8", "linecolor": "#EBF0F8", "automargin": true, "zerolinecolor": "#EBF0F8", "zerolinewidth": 2 }, "ternary": { "aaxis": { "ticks": "", "gridcolor": "#DFE8F3", "linecolor": "#A2B1C6" }, "baxis": { "ticks": "", "gridcolor": "#DFE8F3", "linecolor": "#A2B1C6" }, "caxis": { "ticks": "", "gridcolor": "#DFE8F3", "linecolor": "#A2B1C6" }, "bgcolor": "white" }, "colorway": [ "#636efa", "#EF553B", "#00cc96", "#ab63fa", "#19d3f3", "#e763fa", "#fecb52", "#ffa15a", "#ff6692", "#b6e880" ], "hovermode": "closest", "colorscale": { "diverging": [ [ 0, "#8e0152" ], [ 0.1, "#c51b7d" ], [ 0.2, "#de77ae" ], [ 0.3, "#f1b6da" ], [ 0.4, "#fde0ef" ], [ 0.5, "#f7f7f7" ], [ 0.6, "#e6f5d0" ], [ 0.7, "#b8e186" ], [ 0.8, "#7fbc41" ], [ 0.9, "#4d9221" ], [ 1, "#276419" ] ], "sequential": [ [ 0, "#0508b8" ], [ 0.0893854748603352, "#1910d8" ], [ 0.1787709497206704, "#3c19f0" ], [ 0.2681564245810056, "#6b1cfb" ], [ 0.3575418994413408, "#981cfd" ], [ 0.44692737430167595, "#bf1cfd" ], [ 0.5363128491620112, "#dd2bfd" ], [ 0.6256983240223464, "#f246fe" ], [ 0.7150837988826816, "#fc67fd" ], [ 0.8044692737430168, "#fe88fc" ], [ 0.8938547486033519, "#fea5fd" ], [ 0.9832402234636871, "#febefe" ], [ 1, "#fec3fe" ] ], "sequentialminus": [ [ 0, "#0508b8" ], [ 0.0893854748603352, "#1910d8" ], [ 0.1787709497206704, "#3c19f0" ], [ 0.2681564245810056, "#6b1cfb" ], [ 0.3575418994413408, "#981cfd" ], [ 0.44692737430167595, "#bf1cfd" ], [ 0.5363128491620112, "#dd2bfd" ], [ 0.6256983240223464, "#f246fe" ], [ 0.7150837988826816, "#fc67fd" ], [ 0.8044692737430168, "#fe88fc" ], [ 0.8938547486033519, "#fea5fd" ], [ 0.9832402234636871, "#febefe" ], [ 1, "#fec3fe" ] ] }, "plot_bgcolor": "white", "paper_bgcolor": "white", "shapedefaults": { "line": { "width": 0 }, "opacity": 0.4, "fillcolor": "#506784" }, "annotationdefaults": { "arrowhead": 0, "arrowcolor": "#506784", "arrowwidth": 1 } }, "themeRef": "PLOTLY_WHITE" }, "showlegend": true } }, "height": null, "width": null, "user": { "profile_url": "https://chart-studio.plotly.com/~Charliesakeepa", "avatar_url": "https://storage.googleapis.com/plotly-prod-profiles/54.jpg", "background_url": "https://storage.googleapis.com/plotly-prod-profiles/bg-6.jpg", "bio": "", "nickname": "", "website": "", "stream_tokens": null, "feature_set_id": null, "csrf_token": null, "date_joined": "2025-08-07 21:26:14", "mapbox_access_tokens": null, "has_password": null, "username": "Charliesakeepa", "email": null, "is_active": null, "readonly": null, "is_dash_creator": null, "dash_created_count": null, "is_chart_creator": null, "charts_created_count": null } }, { "creation_time": "2025-08-07T21:02:13.639380Z", "comments": { "results": [], "count": 0 }, "parented": true, "embed_url": "https://chart-studio.plotly.com/~Chrisampon/2.embed", "fid": "Chrisampon:2", "filename": "Plot 2", "filetype": "plot", "img_url": "https://storage.googleapis.com/plotly-prod-images/Chrisampon/2/9_PU5V8V0GCTDJK5E9C4BOP3RCDZTGVR.png", "image_urls": { "default": "https://storage.googleapis.com/plotly-prod-images/Chrisampon/2/2_RPLQG0S2NX1WXDURKZL5Y7F1QMVSLU.png", "block-thumb": "https://storage.googleapis.com/plotly-prod-images/Chrisampon/2/8_EWPRFXMEE6FWRS0PIMW8YK23OIAOJ2.png", "list-thumb": "https://storage.googleapis.com/plotly-prod-images/Chrisampon/2/9_PU5V8V0GCTDJK5E9C4BOP3RCDZTGVR.png" }, "api_urls": { "files": "https://api.plotly.com/v2/files/Chrisampon:2", "plots": "https://api.plotly.com/v2/plots/Chrisampon:2", "parent": "https://api.plotly.com/v2/folders/home?user=Chrisampon" }, "owner": "Chrisampon", "parent": -1, "preview": "", "referencers": [], "references": [], "title": "", "views": 0, "web_url": "https://chart-studio.plotly.com/~Chrisampon/2/", "world_readable": true, "date_modified": "2025-08-07T21:02:13.656Z", "stars": { "results": [], "count": 0 }, "collaborators": { "results": [], "count": 0 }, "subfolder_count": null, "refresh_interval": null, "organize_view_url": "https://chart-studio.plotly.com/~Chrisampon/2/", "current_user_permission": "read", "is_theme": null, "is_template": false, "autosize": true, "caption": "", "figure": { "data": [ { "meta": { "columnNames": { "ids": "", "labels": "", "values": "ML_Technique", "parents": "ML_Technique" } }, "mode": "markers", "type": "treemap", "valuessrc": "Chrisampon:1:500028", "parentssrc": "Chrisampon:1:500028" } ], "frames": [], "layout": { "title": { "text": "Treemap for Movie Gross in 2018" }, "width": 700, "xaxis": { "range": [ 0, 400 ], "autorange": true }, "yaxis": { "range": [ 0, 400 ], "autorange": true }, "height": 700, "shapes": [ { "x0": 0, "x1": 46.92684285018214, "y0": 0, "y1": 18.254635352286773, "line": { "width": 0 }, "type": "rect", "opacity": 0.4, "fillcolor": "rgb(165,0,38)" }, { "x0": 0, "x1": 46.92684285018214, "y0": 18.254635352286773, "y1": 81.5822002472188, "line": { "width": 0 }, "type": "rect", "opacity": 0.4, "fillcolor": "rgb(215,48,39)" }, { "x0": 0, "x1": 46.92684285018214, "y0": 81.5822002472188, "y1": 168.7416563658838, "line": { "width": 0 }, "type": "rect", "opacity": 0.4, "fillcolor": "rgb(244,109,67)" }, { "x0": 0, "x1": 46.92684285018214, "y0": 168.7416563658838, "y1": 263.53522867737945, "line": { "width": 0 }, "type": "rect", "opacity": 0.4, "fillcolor": "rgb(253,174,97)" }, { "x0": 0, "x1": 46.92684285018214, "y0": 263.53522867737945, "y1": 400, "line": { "width": 0 }, "type": "rect", "opacity": 0.4, "fillcolor": "rgb(254,224,144)" }, { "x0": 46.92684285018214, "x1": 131.48307831514967, "y0": 0, "y1": 132.2617318674386, "line": { "width": 0 }, "type": "rect", "opacity": 0.4, "fillcolor": "rgb(224,243,248)" }, { "x0": 131.48307831514967, "x1": 248.2899742114027, "y0": 0, "y1": 132.2617318674386, "line": { "width": 0 }, "type": "rect", "opacity": 0.4, "fillcolor": "rgb(171,217,233)" }, { "x0": 248.2899742114027, "x1": 400, "y0": 0, "y1": 132.2617318674386, "line": { "width": 0 }, "type": "rect", "opacity": 0.4, "fillcolor": "rgb(116,173,209)" }, { "x0": 46.92684285018214, "x1": 157.32914987550782, "y0": 132.2617318674386, "y1": 400, "line": { "width": 0 }, "type": "rect", "opacity": 0.4, "fillcolor": "rgb(69,117,180)" }, { "x0": 157.32914987550782, "x1": 400, "y0": 132.2617318674386, "y1": 400, "line": { "width": 0 }, "type": "rect", "opacity": 0.4, "fillcolor": "rgb(49,54,149)" } ], "hovermode": "closest" } }, "height": 700, "width": 700, "user": { "profile_url": "https://chart-studio.plotly.com/~Chrisampon", "avatar_url": "https://storage.googleapis.com/plotly-prod-profiles/29.jpg", "background_url": "https://storage.googleapis.com/plotly-prod-profiles/bg-0.jpg", "bio": "", "nickname": "", "website": "", "stream_tokens": null, "feature_set_id": null, "csrf_token": null, "date_joined": "2025-08-07 20:29:36", "mapbox_access_tokens": null, "has_password": null, "username": "Chrisampon", "email": null, "is_active": null, "readonly": null, "is_dash_creator": null, "dash_created_count": null, "is_chart_creator": null, "charts_created_count": null } }, { "creation_time": "2025-08-07T19:55:24.132043Z", "comments": { "results": [], "count": 0 }, "parented": true, "embed_url": "https://chart-studio.plotly.com/~jdayie/1.embed", "fid": "jdayie:1", "filename": "V207I DPV", "filetype": "plot", "img_url": "https://storage.googleapis.com/plotly-prod-images/jdayie/1/9_NO7L8D5L9MZMB63LDZ153H7RB9RANM.png", "image_urls": { "default": "https://storage.googleapis.com/plotly-prod-images/jdayie/1/2_GLKEJ222YUZJL1XE0B5P13SMPYOCOS.png", "block-thumb": "https://storage.googleapis.com/plotly-prod-images/jdayie/1/8_GKZ4RM3S850UINVKEQ1HJ56VKGWEKN.png", "list-thumb": "https://storage.googleapis.com/plotly-prod-images/jdayie/1/9_NO7L8D5L9MZMB63LDZ153H7RB9RANM.png" }, "api_urls": { "files": "https://api.plotly.com/v2/files/jdayie:1", "plots": "https://api.plotly.com/v2/plots/jdayie:1", "parent": "https://api.plotly.com/v2/folders/home?user=jdayie" }, "owner": "jdayie", "parent": -1, "preview": "", "referencers": [], "references": [], "title": "", "views": 0, "web_url": "https://chart-studio.plotly.com/~jdayie/1/", "world_readable": true, "date_modified": "2025-08-09T02:43:01.123Z", "stars": { "results": [], "count": 0 }, "collaborators": { "results": [], "count": 0 }, "subfolder_count": null, "refresh_interval": null, "organize_view_url": "https://chart-studio.plotly.com/~jdayie/1/", "current_user_permission": "read", "is_theme": null, "is_template": false, "autosize": true, "caption": "", "figure": { "data": [ { "line": { "color": "rgb(207, 29, 29)" }, "meta": { "columnNames": { "x": "A", "y": "B" } }, "mode": "lines", "name": "V207I, Consumed LB", "type": "scatter", "xsrc": "jdayie:0:7b973f", "ysrc": "jdayie:0:e3411b" }, { "fill": "none", "line": { "dash": "dot", "color": "rgb(184, 184, 184)", "shape": "linear", "width": 1 }, "meta": { "columnNames": { "x": "A", "y": "C" } }, "mode": "lines", "name": "100 μM PCA Standard, Unconsumed LB", "type": "scatter", "xsrc": "jdayie:0:7b973f", "ysrc": "jdayie:0:8156c4", "stackgroup": null, "connectgaps": false } ], "frames": [], "layout": { "font": { "size": 18, "family": "Open Sans" }, "title": { "x": 0.45, "text": "<b>PhzS V207I DPV</b>" }, "xaxis": { "side": "bottom", "range": [ -0.584, 0 ], "ticks": "outside", "title": { "text": "<b>Potential (V)</b>" }, "ticklen": 3, "showgrid": false, "showline": true, "zeroline": false, "autorange": true, "linecolor": "rgb(0, 0, 0)", "tickangle": "auto", "exponentformat": "E" }, "yaxis": { "range": [ -1.0264583333333333e-05, -2.7291666666666667e-07 ], "ticks": "outside", "title": { "text": "<b>Differential Current (A)</b>" }, "ticklen": 3, "showgrid": false, "showline": true, "autorange": true, "linecolor": "rgb(0, 0, 0)", "tickangle": "auto", "exponentformat": "E" }, "images": [ { "x": 0.5, "y": 0.5, "sizex": 0.1, "sizey": 0.1 } ], "legend": { "x": 0.05259478563951979, "y": 1.1296296296296295, "title": { "text": "<br>" } }, "shapes": [], "autosize": true, "template": { "data": { "bar": [ { "type": "bar", "marker": { "colorbar": { "ticks": "", "outlinewidth": 0 } } } ], "table": [ { "type": "table", "cells": { "fill": { "color": "#EBF0F8" }, "line": { "color": "white" } }, "header": { "fill": { "color": "#C8D4E3" }, "line": { "color": "white" } } } ], "carpet": [ { "type": "carpet", "aaxis": { "gridcolor": "#C8D4E3", "linecolor": "#C8D4E3", "endlinecolor": "#2a3f5f", "minorgridcolor": "#C8D4E3", "startlinecolor": "#2a3f5f" }, "baxis": { "gridcolor": "#C8D4E3", "linecolor": "#C8D4E3", "endlinecolor": "#2a3f5f", "minorgridcolor": "#C8D4E3", "startlinecolor": "#2a3f5f" } } ], "mesh3d": [ { "type": "mesh3d", "colorbar": { "ticks": "", "outlinewidth": 0 } } ], "contour": [ { "type": "contour", "colorbar": { "ticks": "", "outlinewidth": 0 }, "autocolorscale": true } ], "heatmap": [ { "type": "heatmap", "colorbar": { "ticks": "", "outlinewidth": 0 }, "autocolorscale": true } ], "scatter": [ { "type": "scatter", "marker": { "colorbar": { "ticks": "", "outlinewidth": 0 } } } ], "surface": [ { "type": "surface", "colorbar": { "ticks": "", "outlinewidth": 0 } } ], "heatmapgl": [ { "type": "heatmapgl", "colorbar": { "ticks": "", "outlinewidth": 0 } } ], "histogram": [ { "type": "histogram", "marker": { "colorbar": { "ticks": "", "outlinewidth": 0 } } } ], "parcoords": [ { "line": { "colorbar": { "ticks": "", "outlinewidth": 0 } }, "type": "parcoords" } ], "scatter3d": [ { "type": "scatter3d", "marker": { "colorbar": { "ticks": "", "outlinewidth": 0 } } } ], "scattergl": [ { "type": "scattergl", "marker": { "colorbar": { "ticks": "", "outlinewidth": 0 } } } ], "choropleth": [ { "type": "choropleth", "colorbar": { "ticks": "", "outlinewidth": 0 } } ], "scattergeo": [ { "type": "scattergeo", "marker": { "colorbar": { "ticks": "", "outlinewidth": 0 } } } ], "histogram2d": [ { "type": "histogram2d", "colorbar": { "ticks": "", "outlinewidth": 0 }, "autocolorscale": true } ], "scatterpolar": [ { "type": "scatterpolar", "marker": { "colorbar": { "ticks": "", "outlinewidth": 0 } } } ], "contourcarpet": [ { "type": "contourcarpet", "colorbar": { "ticks": "", "outlinewidth": 0 } } ], "scattercarpet": [ { "type": "scattercarpet", "marker": { "colorbar": { "ticks": "", "outlinewidth": 0 } } } ], "scattermapbox": [ { "type": "scattermapbox", "marker": { "colorbar": { "ticks": "", "outlinewidth": 0 } } } ], "scatterpolargl": [ { "type": "scatterpolargl", "marker": { "colorbar": { "ticks": "", "outlinewidth": 0 } } } ], "scatterternary": [ { "type": "scatterternary", "marker": { "colorbar": { "ticks": "", "outlinewidth": 0 } } } ], "histogram2dcontour": [ { "type": "histogram2dcontour", "colorbar": { "ticks": "", "outlinewidth": 0 }, "autocolorscale": true } ] }, "layout": { "geo": { "bgcolor": "white", "showland": true, "lakecolor": "white", "landcolor": "white", "showlakes": true, "subunitcolor": "#C8D4E3" }, "font": { "color": "#2a3f5f" }, "polar": { "bgcolor": "white", "radialaxis": { "ticks": "", "gridcolor": "#EBF0F8", "linecolor": "#EBF0F8" }, "angularaxis": { "ticks": "", "gridcolor": "#EBF0F8", "linecolor": "#EBF0F8" } }, "scene": { "xaxis": { "ticks": "", "gridcolor": "#DFE8F3", "gridwidth": 2, "linecolor": "#EBF0F8", "zerolinecolor": "#EBF0F8", "showbackground": true, "backgroundcolor": "white" }, "yaxis": { "ticks": "", "gridcolor": "#DFE8F3", "gridwidth": 2, "linecolor": "#EBF0F8", "zerolinecolor": "#EBF0F8", "showbackground": true, "backgroundcolor": "white" }, "zaxis": { "ticks": "", "gridcolor": "#DFE8F3", "gridwidth": 2, "linecolor": "#EBF0F8", "zerolinecolor": "#EBF0F8", "showbackground": true, "backgroundcolor": "white" } }, "title": { "x": 0.05 }, "xaxis": { "ticks": "", "gridcolor": "#EBF0F8", "linecolor": "#EBF0F8", "automargin": true, "zerolinecolor": "#EBF0F8", "zerolinewidth": 2 }, "yaxis": { "ticks": "", "gridcolor": "#EBF0F8", "linecolor": "#EBF0F8", "automargin": true, "zerolinecolor": "#EBF0F8", "zerolinewidth": 2 }, "ternary": { "aaxis": { "ticks": "", "gridcolor": "#DFE8F3", "linecolor": "#A2B1C6" }, "baxis": { "ticks": "", "gridcolor": "#DFE8F3", "linecolor": "#A2B1C6" }, "caxis": { "ticks": "", "gridcolor": "#DFE8F3", "linecolor": "#A2B1C6" }, "bgcolor": "white" }, "colorway": [ "#636efa", "#EF553B", "#00cc96", "#ab63fa", "#19d3f3", "#e763fa", "#fecb52", "#ffa15a", "#ff6692", "#b6e880" ], "hovermode": "closest", "colorscale": { "diverging": [ [ 0, "#8e0152" ], [ 0.1, "#c51b7d" ], [ 0.2, "#de77ae" ], [ 0.3, "#f1b6da" ], [ 0.4, "#fde0ef" ], [ 0.5, "#f7f7f7" ], [ 0.6, "#e6f5d0" ], [ 0.7, "#b8e186" ], [ 0.8, "#7fbc41" ], [ 0.9, "#4d9221" ], [ 1, "#276419" ] ], "sequential": [ [ 0, "#0508b8" ], [ 0.0893854748603352, "#1910d8" ], [ 0.1787709497206704, "#3c19f0" ], [ 0.2681564245810056, "#6b1cfb" ], [ 0.3575418994413408, "#981cfd" ], [ 0.44692737430167595, "#bf1cfd" ], [ 0.5363128491620112, "#dd2bfd" ], [ 0.6256983240223464, "#f246fe" ], [ 0.7150837988826816, "#fc67fd" ], [ 0.8044692737430168, "#fe88fc" ], [ 0.8938547486033519, "#fea5fd" ], [ 0.9832402234636871, "#febefe" ], [ 1, "#fec3fe" ] ], "sequentialminus": [ [ 0, "#0508b8" ], [ 0.0893854748603352, "#1910d8" ], [ 0.1787709497206704, "#3c19f0" ], [ 0.2681564245810056, "#6b1cfb" ], [ 0.3575418994413408, "#981cfd" ], [ 0.44692737430167595, "#bf1cfd" ], [ 0.5363128491620112, "#dd2bfd" ], [ 0.6256983240223464, "#f246fe" ], [ 0.7150837988826816, "#fc67fd" ], [ 0.8044692737430168, "#fe88fc" ], [ 0.8938547486033519, "#fea5fd" ], [ 0.9832402234636871, "#febefe" ], [ 1, "#fec3fe" ] ] }, "plot_bgcolor": "white", "paper_bgcolor": "white", "shapedefaults": { "line": { "width": 0 }, "opacity": 0.4, "fillcolor": "#506784" }, "annotationdefaults": { "arrowhead": 0, "arrowcolor": "#506784", "arrowwidth": 1 } }, "themeRef": "PLOTLY_WHITE" }, "clickmode": "event", "showlegend": true, "annotations": [], "uniformtext": { "mode": false } } }, "height": null, "width": null, "user": { "profile_url": "https://chart-studio.plotly.com/~jdayie", "avatar_url": "https://storage.googleapis.com/plotly-prod-profiles/72.jpg", "background_url": "https://storage.googleapis.com/plotly-prod-profiles/bg-4.jpg", "bio": "", "nickname": "", "website": "", "stream_tokens": null, "feature_set_id": null, "csrf_token": null, "date_joined": "2025-08-07 18:33:11", "mapbox_access_tokens": null, "has_password": null, "username": "jdayie", "email": null, "is_active": null, "readonly": null, "is_dash_creator": null, "dash_created_count": null, "is_chart_creator": null, "charts_created_count": null } }, { "creation_time": "2025-08-07T19:44:02.124151Z", "comments": { "results": [], "count": 0 }, "parented": true, "embed_url": "https://chart-studio.plotly.com/~ThadLee/238.embed", "fid": "ThadLee:238", "filename": "uv4", "filetype": "plot", "img_url": "https://api.plotly.com/v2/files/ThadLee:238/image?image_name=list-thumb", "image_urls": { "default": "https://api.plotly.com/v2/files/ThadLee:238/image?image_name=default", "block-thumb": "https://storage.googleapis.com/plotly-prod-images/ThadLee/238/8_EYI76Q3Y4D04WBECCV5YM4XPRK8ETB.png", "list-thumb": "https://api.plotly.com/v2/files/ThadLee:238/image?image_name=list-thumb" }, "api_urls": { "files": "https://api.plotly.com/v2/files/ThadLee:238", "plots": "https://api.plotly.com/v2/plots/ThadLee:238", "parent": "https://api.plotly.com/v2/folders/home?user=ThadLee" }, "owner": "ThadLee", "parent": -1, "preview": "", "referencers": [], "references": [], "title": "", "views": 0, "web_url": "https://chart-studio.plotly.com/~ThadLee/238/", "world_readable": true, "date_modified": "2025-08-18T12:46:14.769Z", "stars": { "results": [], "count": 0 }, "collaborators": { "results": [], "count": 0 }, "subfolder_count": null, "refresh_interval": null, "organize_view_url": "https://chart-studio.plotly.com/~ThadLee/238/", "current_user_permission": "read", "is_theme": null, "is_template": false, "autosize": true, "caption": "", "figure": { "data": [ { "line": { "width": 1 }, "meta": { "columnNames": { "x": "A", "y": "B" } }, "mode": "lines", "name": "MB<sub>initial</sub>", "type": "scatter", "xsrc": "ThadLee:237:cc771d", "ysrc": "ThadLee:237:eb4c4a" }, { "line": { "width": 1 }, "meta": { "columnNames": { "x": "A", "y": "C" } }, "mode": "lines", "name": "MB<sub>dark(eq)</sub>", "type": "scatter", "xsrc": "ThadLee:237:cc771d", "ysrc": "ThadLee:237:9a0d89", "visible": true, "stackgroup": null }, { "line": { "width": 1 }, "meta": { "columnNames": { "x": "A", "y": "D" } }, "mode": "lines", "name": "30 min", "type": "scatter", "xsrc": "ThadLee:237:cc771d", "ysrc": "ThadLee:237:a713ab", "visible": true, "stackgroup": null }, { "line": { "width": 1 }, "meta": { "columnNames": { "x": "A", "y": "E" } }, "mode": "lines", "name": "60 min", "type": "scatter", "xsrc": "ThadLee:237:cc771d", "ysrc": "ThadLee:237:2014f9", "stackgroup": null }, { "line": { "width": 1 }, "meta": { "columnNames": { "x": "A", "y": "F" } }, "mode": "lines", "name": "90 min", "type": "scatter", "xsrc": "ThadLee:237:cc771d", "ysrc": "ThadLee:237:c05c2d", "stackgroup": null }, { "line": { "width": 1 }, "meta": { "columnNames": { "x": "A", "y": "G" } }, "mode": "lines", "name": "120 min", "type": "scatter", "xsrc": "ThadLee:237:cc771d", "ysrc": "ThadLee:237:0f4d8d", "stackgroup": null }, { "line": { "width": 1 }, "meta": { "columnNames": { "x": "A", "y": "H" } }, "mode": "lines", "name": "150 min", "type": "scatter", "xsrc": "ThadLee:237:cc771d", "ysrc": "ThadLee:237:2d35bd", "stackgroup": null }, { "line": { "width": 1 }, "meta": { "columnNames": { "x": "A", "y": "I" } }, "mode": "lines", "name": "180 min", "type": "scatter", "xsrc": "ThadLee:237:cc771d", "ysrc": "ThadLee:237:7d06d4", "opacity": 0, "showlegend": false, "stackgroup": null }, { "line": { "width": 1 }, "meta": { "columnNames": { "x": "A", "y": "J" } }, "mode": "lines", "name": "210 min", "type": "scatter", "xsrc": "ThadLee:237:cc771d", "ysrc": "ThadLee:237:01b377", "opacity": 0, "showlegend": false, "stackgroup": null }, { "line": { "color": "rgb(255, 161, 90)", "width": 1 }, "meta": { "columnNames": { "x": "A", "y": "K" } }, "mode": "lines", "name": "180 min", "type": "scatter", "xsrc": "ThadLee:237:cc771d", "ysrc": "ThadLee:237:0ffdd7", "opacity": 1, "visible": true, "showlegend": true, "stackgroup": null }, { "mode": "lines", "type": "scatter", "xaxis": "x2", "yaxis": "y2", "stackgroup": null } ], "frames": [], "layout": { "xaxis": { "side": "bottom", "type": "linear", "range": [ 400, 900 ], "ticks": "outside", "title": { "font": { "size": 20 }, "text": "Wavelength (nm) " }, "domain": [ 0, 0.375 ], "mirror": false, "showgrid": false, "showline": true, "tickfont": { "size": 16 }, "zeroline": true, "autorange": false, "gridcolor": "rgb(1, 10, 25)", "linecolor": "rgb(1, 7, 17)", "zerolinecolor": "rgb(0, 6, 15)", "zerolinewidth": 1 }, "yaxis": { "type": "linear", "range": [ 0, 2.4493507777777777 ], "ticks": "inside", "title": { "font": { "size": 20 }, "text": "Absorbance (a.u.)" }, "domain": [ 0, 1 ], "mirror": false, "showgrid": false, "showline": true, "zeroline": true, "autorange": false, "linecolor": "rgb(1, 7, 17)", "zerolinecolor": "rgb(0, 6, 15)", "zerolinewidth": 1, "showticklabels": false }, "legend": { "x": 0.22630554513640253, "y": 0.9638157894736842, "title": { "font": { "size": 1 }, "text": "<br>" }, "valign": "top", "itemsizing": "trace", "borderwidth": 0, "orientation": "v" }, "xaxis2": { "side": "top", "range": [ -1, 6 ], "showgrid": false, "showline": true, "zeroline": false, "autorange": false, "linecolor": "rgb(0, 3, 7)", "overlaying": "x", "showticklabels": false }, "yaxis2": { "side": "right", "range": [ -1, 4 ], "showgrid": false, "showline": true, "zeroline": false, "autorange": true, "linecolor": "rgb(0, 3, 7)", "overlaying": "y", "showticklabels": false }, "autosize": true, "template": { "data": { "bar": [ { "type": "bar", "marker": { "colorbar": { "ticks": "", "outlinewidth": 0 } } } ], "table": [ { "type": "table", "cells": { "fill": { "color": "#EBF0F8" }, "line": { "color": "white" } }, "header": { "fill": { "color": "#C8D4E3" }, "line": { "color": "white" } } } ], "carpet": [ { "type": "carpet", "aaxis": { "gridcolor": "#C8D4E3", "linecolor": "#C8D4E3", "endlinecolor": "#2a3f5f", "minorgridcolor": "#C8D4E3", "startlinecolor": "#2a3f5f" }, "baxis": { "gridcolor": "#C8D4E3", "linecolor": "#C8D4E3", "endlinecolor": "#2a3f5f", "minorgridcolor": "#C8D4E3", "startlinecolor": "#2a3f5f" } } ], "mesh3d": [ { "type": "mesh3d", "colorbar": { "ticks": "", "outlinewidth": 0 } } ], "contour": [ { "type": "contour", "colorbar": { "ticks": "", "outlinewidth": 0 }, "autocolorscale": true } ], "heatmap": [ { "type": "heatmap", "colorbar": { "ticks": "", "outlinewidth": 0 }, "autocolorscale": true } ], "scatter": [ { "type": "scatter", "marker": { "colorbar": { "ticks": "", "outlinewidth": 0 } } } ], "surface": [ { "type": "surface", "colorbar": { "ticks": "", "outlinewidth": 0 } } ], "heatmapgl": [ { "type": "heatmapgl", "colorbar": { "ticks": "", "outlinewidth": 0 } } ], "histogram": [ { "type": "histogram", "marker": { "colorbar": { "ticks": "", "outlinewidth": 0 } } } ], "parcoords": [ { "line": { "colorbar": { "ticks": "", "outlinewidth": 0 } }, "type": "parcoords" } ], "scatter3d": [ { "type": "scatter3d", "marker": { "colorbar": { "ticks": "", "outlinewidth": 0 } } } ], "scattergl": [ { "type": "scattergl", "marker": { "colorbar": { "ticks": "", "outlinewidth": 0 } } } ], "choropleth": [ { "type": "choropleth", "colorbar": { "ticks": "", "outlinewidth": 0 } } ], "scattergeo": [ { "type": "scattergeo", "marker": { "colorbar": { "ticks": "", "outlinewidth": 0 } } } ], "histogram2d": [ { "type": "histogram2d", "colorbar": { "ticks": "", "outlinewidth": 0 }, "autocolorscale": true } ], "scatterpolar": [ { "type": "scatterpolar", "marker": { "colorbar": { "ticks": "", "outlinewidth": 0 } } } ], "contourcarpet": [ { "type": "contourcarpet", "colorbar": { "ticks": "", "outlinewidth": 0 } } ], "scattercarpet": [ { "type": "scattercarpet", "marker": { "colorbar": { "ticks": "", "outlinewidth": 0 } } } ], "scattermapbox": [ { "type": "scattermapbox", "marker": { "colorbar": { "ticks": "", "outlinewidth": 0 } } } ], "scatterpolargl": [ { "type": "scatterpolargl", "marker": { "colorbar": { "ticks": "", "outlinewidth": 0 } } } ], "scatterternary": [ { "type": "scatterternary", "marker": { "colorbar": { "ticks": "", "outlinewidth": 0 } } } ], "histogram2dcontour": [ { "type": "histogram2dcontour", "colorbar": { "ticks": "", "outlinewidth": 0 }, "autocolorscale": true } ] }, "layout": { "geo": { "bgcolor": "white", "showland": true, "lakecolor": "white", "landcolor": "white", "showlakes": true, "subunitcolor": "#C8D4E3" }, "font": { "color": "#2a3f5f" }, "polar": { "bgcolor": "white", "radialaxis": { "ticks": "", "gridcolor": "#EBF0F8", "linecolor": "#EBF0F8" }, "angularaxis": { "ticks": "", "gridcolor": "#EBF0F8", "linecolor": "#EBF0F8" } }, "scene": { "xaxis": { "ticks": "", "gridcolor": "#DFE8F3", "gridwidth": 2, "linecolor": "#EBF0F8", "zerolinecolor": "#EBF0F8", "showbackground": true, "backgroundcolor": "white" }, "yaxis": { "ticks": "", "gridcolor": "#DFE8F3", "gridwidth": 2, "linecolor": "#EBF0F8", "zerolinecolor": "#EBF0F8", "showbackground": true, "backgroundcolor": "white" }, "zaxis": { "ticks": "", "gridcolor": "#DFE8F3", "gridwidth": 2, "linecolor": "#EBF0F8", "zerolinecolor": "#EBF0F8", "showbackground": true, "backgroundcolor": "white" } }, "title": { "x": 0.05 }, "xaxis": { "ticks": "", "gridcolor": "#EBF0F8", "linecolor": "#EBF0F8", "automargin": true, "zerolinecolor": "#EBF0F8", "zerolinewidth": 2 }, "yaxis": { "ticks": "", "gridcolor": "#EBF0F8", "linecolor": "#EBF0F8", "automargin": true, "zerolinecolor": "#EBF0F8", "zerolinewidth": 2 }, "ternary": { "aaxis": { "ticks": "", "gridcolor": "#DFE8F3", "linecolor": "#A2B1C6" }, "baxis": { "ticks": "", "gridcolor": "#DFE8F3", "linecolor": "#A2B1C6" }, "caxis": { "ticks": "", "gridcolor": "#DFE8F3", "linecolor": "#A2B1C6" }, "bgcolor": "white" }, "colorway": [ "#636efa", "#EF553B", "#00cc96", "#ab63fa", "#19d3f3", "#e763fa", "#fecb52", "#ffa15a", "#ff6692", "#b6e880" ], "hovermode": "closest", "colorscale": { "diverging": [ [ 0, "#8e0152" ], [ 0.1, "#c51b7d" ], [ 0.2, "#de77ae" ], [ 0.3, "#f1b6da" ], [ 0.4, "#fde0ef" ], [ 0.5, "#f7f7f7" ], [ 0.6, "#e6f5d0" ], [ 0.7, "#b8e186" ], [ 0.8, "#7fbc41" ], [ 0.9, "#4d9221" ], [ 1, "#276419" ] ], "sequential": [ [ 0, "#0508b8" ], [ 0.0893854748603352, "#1910d8" ], [ 0.1787709497206704, "#3c19f0" ], [ 0.2681564245810056, "#6b1cfb" ], [ 0.3575418994413408, "#981cfd" ], [ 0.44692737430167595, "#bf1cfd" ], [ 0.5363128491620112, "#dd2bfd" ], [ 0.6256983240223464, "#f246fe" ], [ 0.7150837988826816, "#fc67fd" ], [ 0.8044692737430168, "#fe88fc" ], [ 0.8938547486033519, "#fea5fd" ], [ 0.9832402234636871, "#febefe" ], [ 1, "#fec3fe" ] ], "sequentialminus": [ [ 0, "#0508b8" ], [ 0.0893854748603352, "#1910d8" ], [ 0.1787709497206704, "#3c19f0" ], [ 0.2681564245810056, "#6b1cfb" ], [ 0.3575418994413408, "#981cfd" ], [ 0.44692737430167595, "#bf1cfd" ], [ 0.5363128491620112, "#dd2bfd" ], [ 0.6256983240223464, "#f246fe" ], [ 0.7150837988826816, "#fc67fd" ], [ 0.8044692737430168, "#fe88fc" ], [ 0.8938547486033519, "#fea5fd" ], [ 0.9832402234636871, "#febefe" ], [ 1, "#fec3fe" ] ] }, "plot_bgcolor": "white", "paper_bgcolor": "white", "shapedefaults": { "line": { "width": 0 }, "opacity": 0.4, "fillcolor": "#506784" }, "annotationdefaults": { "arrowhead": 0, "arrowcolor": "#506784", "arrowwidth": 1 } }, "themeRef": "PLOTLY_WHITE" } } }, "height": null, "width": null, "user": { "profile_url": "https://chart-studio.plotly.com/~ThadLee", "avatar_url": "https://storage.googleapis.com/plotly-prod-profiles/14.jpg", "background_url": "https://storage.googleapis.com/plotly-prod-profiles/bg-7.jpg", "bio": "", "nickname": "", "website": "", "stream_tokens": null, "feature_set_id": null, "csrf_token": null, "date_joined": "2023-08-26 05:56:46", "mapbox_access_tokens": null, "has_password": null, "username": "ThadLee", "email": null, "is_active": null, "readonly": null, "is_dash_creator": null, "dash_created_count": null, "is_chart_creator": null, "charts_created_count": null } }, { "creation_time": "2025-08-07T19:43:53.335764Z", "comments": { "results": [], "count": 0 }, "parented": true, "embed_url": "https://chart-studio.plotly.com/~ThadLee/236.embed", "fid": "ThadLee:236", "filename": "uv3", "filetype": "plot", "img_url": "https://api.plotly.com/v2/files/ThadLee:236/image?image_name=list-thumb", "image_urls": { "default": "https://api.plotly.com/v2/files/ThadLee:236/image?image_name=default", "block-thumb": "https://storage.googleapis.com/plotly-prod-images/ThadLee/236/8_M7SW7Z3LMQZF1GLKMPOZXQXTVFJM60.png", "list-thumb": "https://api.plotly.com/v2/files/ThadLee:236/image?image_name=list-thumb" }, "api_urls": { "files": "https://api.plotly.com/v2/files/ThadLee:236", "plots": "https://api.plotly.com/v2/plots/ThadLee:236", "parent": "https://api.plotly.com/v2/folders/home?user=ThadLee" }, "owner": "ThadLee", "parent": -1, "preview": "", "referencers": [], "references": [], "title": "", "views": 0, "web_url": "https://chart-studio.plotly.com/~ThadLee/236/", "world_readable": true, "date_modified": "2025-08-18T12:42:06.706Z", "stars": { "results": [], "count": 0 }, "collaborators": { "results": [], "count": 0 }, "subfolder_count": null, "refresh_interval": null, "organize_view_url": "https://chart-studio.plotly.com/~ThadLee/236/", "current_user_permission": "read", "is_theme": null, "is_template": false, "autosize": true, "caption": "", "figure": { "data": [ { "line": { "width": 1 }, "meta": { "columnNames": { "x": "A", "y": "B" } }, "mode": "lines", "name": "MB<sub>initial</sub>", "type": "scatter", "xsrc": "ThadLee:235:07c0a1", "ysrc": "ThadLee:235:9562a4" }, { "line": { "width": 1 }, "meta": { "columnNames": { "x": "A", "y": "C" } }, "mode": "lines", "name": "MB<sub>dark(eq)</sub>", "type": "scatter", "xsrc": "ThadLee:235:07c0a1", "ysrc": "ThadLee:235:accb93", "visible": true, "stackgroup": null }, { "line": { "width": 1 }, "meta": { "columnNames": { "x": "A", "y": "D" } }, "mode": "lines", "name": "30 min", "type": "scatter", "xsrc": "ThadLee:235:07c0a1", "ysrc": "ThadLee:235:7adc7b", "visible": true, "stackgroup": null }, { "line": { "width": 1 }, "meta": { "columnNames": { "x": "A", "y": "E" } }, "mode": "lines", "name": "60 min", "type": "scatter", "xsrc": "ThadLee:235:07c0a1", "ysrc": "ThadLee:235:e07342", "stackgroup": null }, { "line": { "width": 1 }, "meta": { "columnNames": { "x": "A", "y": "F" } }, "mode": "lines", "name": "90 min", "type": "scatter", "xsrc": "ThadLee:235:07c0a1", "ysrc": "ThadLee:235:2bdcb3", "stackgroup": null }, { "line": { "width": 1 }, "meta": { "columnNames": { "x": "A", "y": "G" } }, "mode": "lines", "name": "120 min", "type": "scatter", "xsrc": "ThadLee:235:07c0a1", "ysrc": "ThadLee:235:f85062", "stackgroup": null }, { "line": { "width": 1 }, "meta": { "columnNames": { "x": "A", "y": "H" } }, "mode": "lines", "name": "150 min", "type": "scatter", "xsrc": "ThadLee:235:07c0a1", "ysrc": "ThadLee:235:ab13a2", "stackgroup": null }, { "line": { "width": 1 }, "meta": { "columnNames": { "x": "A", "y": "I" } }, "mode": "lines", "name": "180 min", "type": "scatter", "xsrc": "ThadLee:235:07c0a1", "ysrc": "ThadLee:235:779577", "stackgroup": null }, { "line": { "width": 1 }, "meta": { "columnNames": { "x": "A", "y": "J" } }, "mode": "lines", "name": "210 min", "type": "scatter", "xsrc": "ThadLee:235:07c0a1", "ysrc": "ThadLee:235:c94d61", "opacity": 0, "showlegend": false, "stackgroup": null }, { "line": { "width": 1 }, "meta": { "columnNames": { "x": "A", "y": "K" } }, "mode": "lines", "name": "240 min", "type": "scatter", "xsrc": "ThadLee:235:07c0a1", "ysrc": "ThadLee:235:b09bdd", "opacity": 0, "visible": true, "showlegend": false, "stackgroup": null }, { "mode": "lines", "type": "scatter", "xaxis": "x2", "yaxis": "y2", "stackgroup": null } ], "frames": [], "layout": { "xaxis": { "side": "bottom", "type": "linear", "range": [ 400, 900 ], "ticks": "outside", "title": { "font": { "size": 20 }, "text": "Wavelength (nm) " }, "domain": [ 0, 0.375 ], "mirror": false, "showgrid": false, "showline": true, "tickfont": { "size": 16 }, "zeroline": true, "autorange": false, "gridcolor": "rgb(1, 10, 25)", "linecolor": "rgb(1, 7, 17)", "zerolinecolor": "rgb(0, 6, 15)", "zerolinewidth": 1 }, "yaxis": { "type": "linear", "range": [ 0, 2.4493507777777777 ], "ticks": "inside", "title": { "font": { "size": 20 }, "text": "Absorbance (a.u.)" }, "domain": [ 0, 1 ], "mirror": false, "showgrid": false, "showline": true, "zeroline": true, "autorange": false, "linecolor": "rgb(1, 7, 17)", "zerolinecolor": "rgb(0, 6, 15)", "zerolinewidth": 1, "showticklabels": false }, "legend": { "x": 0.22630554513640253, "y": 0.9638157894736842, "title": { "font": { "size": 1 }, "text": "<br>" }, "valign": "top", "itemsizing": "trace", "borderwidth": 0, "orientation": "v" }, "xaxis2": { "side": "top", "range": [ -1, 6 ], "showgrid": false, "showline": true, "zeroline": false, "autorange": false, "linecolor": "rgb(0, 3, 7)", "overlaying": "x", "showticklabels": false }, "yaxis2": { "side": "right", "range": [ -1, 4 ], "showgrid": false, "showline": true, "zeroline": false, "autorange": true, "linecolor": "rgb(0, 3, 7)", "overlaying": "y", "showticklabels": false }, "autosize": true, "template": { "data": { "bar": [ { "type": "bar", "marker": { "colorbar": { "ticks": "", "outlinewidth": 0 } } } ], "table": [ { "type": "table", "cells": { "fill": { "color": "#EBF0F8" }, "line": { "color": "white" } }, "header": { "fill": { "color": "#C8D4E3" }, "line": { "color": "white" } } } ], "carpet": [ { "type": "carpet", "aaxis": { "gridcolor": "#C8D4E3", "linecolor": "#C8D4E3", "endlinecolor": "#2a3f5f", "minorgridcolor": "#C8D4E3", "startlinecolor": "#2a3f5f" }, "baxis": { "gridcolor": "#C8D4E3", "linecolor": "#C8D4E3", "endlinecolor": "#2a3f5f", "minorgridcolor": "#C8D4E3", "startlinecolor": "#2a3f5f" } } ], "mesh3d": [ { "type": "mesh3d", "colorbar": { "ticks": "", "outlinewidth": 0 } } ], "contour": [ { "type": "contour", "colorbar": { "ticks": "", "outlinewidth": 0 }, "autocolorscale": true } ], "heatmap": [ { "type": "heatmap", "colorbar": { "ticks": "", "outlinewidth": 0 }, "autocolorscale": true } ], "scatter": [ { "type": "scatter", "marker": { "colorbar": { "ticks": "", "outlinewidth": 0 } } } ], "surface": [ { "type": "surface", "colorbar": { "ticks": "", "outlinewidth": 0 } } ], "heatmapgl": [ { "type": "heatmapgl", "colorbar": { "ticks": "", "outlinewidth": 0 } } ], "histogram": [ { "type": "histogram", "marker": { "colorbar": { "ticks": "", "outlinewidth": 0 } } } ], "parcoords": [ { "line": { "colorbar": { "ticks": "", "outlinewidth": 0 } }, "type": "parcoords" } ], "scatter3d": [ { "type": "scatter3d", "marker": { "colorbar": { "ticks": "", "outlinewidth": 0 } } } ], "scattergl": [ { "type": "scattergl", "marker": { "colorbar": { "ticks": "", "outlinewidth": 0 } } } ], "choropleth": [ { "type": "choropleth", "colorbar": { "ticks": "", "outlinewidth": 0 } } ], "scattergeo": [ { "type": "scattergeo", "marker": { "colorbar": { "ticks": "", "outlinewidth": 0 } } } ], "histogram2d": [ { "type": "histogram2d", "colorbar": { "ticks": "", "outlinewidth": 0 }, "autocolorscale": true } ], "scatterpolar": [ { "type": "scatterpolar", "marker": { "colorbar": { "ticks": "", "outlinewidth": 0 } } } ], "contourcarpet": [ { "type": "contourcarpet", "colorbar": { "ticks": "", "outlinewidth": 0 } } ], "scattercarpet": [ { "type": "scattercarpet", "marker": { "colorbar": { "ticks": "", "outlinewidth": 0 } } } ], "scattermapbox": [ { "type": "scattermapbox", "marker": { "colorbar": { "ticks": "", "outlinewidth": 0 } } } ], "scatterpolargl": [ { "type": "scatterpolargl", "marker": { "colorbar": { "ticks": "", "outlinewidth": 0 } } } ], "scatterternary": [ { "type": "scatterternary", "marker": { "colorbar": { "ticks": "", "outlinewidth": 0 } } } ], "histogram2dcontour": [ { "type": "histogram2dcontour", "colorbar": { "ticks": "", "outlinewidth": 0 }, "autocolorscale": true } ] }, "layout": { "geo": { "bgcolor": "white", "showland": true, "lakecolor": "white", "landcolor": "white", "showlakes": true, "subunitcolor": "#C8D4E3" }, "font": { "color": "#2a3f5f" }, "polar": { "bgcolor": "white", "radialaxis": { "ticks": "", "gridcolor": "#EBF0F8", "linecolor": "#EBF0F8" }, "angularaxis": { "ticks": "", "gridcolor": "#EBF0F8", "linecolor": "#EBF0F8" } }, "scene": { "xaxis": { "ticks": "", "gridcolor": "#DFE8F3", "gridwidth": 2, "linecolor": "#EBF0F8", "zerolinecolor": "#EBF0F8", "showbackground": true, "backgroundcolor": "white" }, "yaxis": { "ticks": "", "gridcolor": "#DFE8F3", "gridwidth": 2, "linecolor": "#EBF0F8", "zerolinecolor": "#EBF0F8", "showbackground": true, "backgroundcolor": "white" }, "zaxis": { "ticks": "", "gridcolor": "#DFE8F3", "gridwidth": 2, "linecolor": "#EBF0F8", "zerolinecolor": "#EBF0F8", "showbackground": true, "backgroundcolor": "white" } }, "title": { "x": 0.05 }, "xaxis": { "ticks": "", "gridcolor": "#EBF0F8", "linecolor": "#EBF0F8", "automargin": true, "zerolinecolor": "#EBF0F8", "zerolinewidth": 2 }, "yaxis": { "ticks": "", "gridcolor": "#EBF0F8", "linecolor": "#EBF0F8", "automargin": true, "zerolinecolor": "#EBF0F8", "zerolinewidth": 2 }, "ternary": { "aaxis": { "ticks": "", "gridcolor": "#DFE8F3", "linecolor": "#A2B1C6" }, "baxis": { "ticks": "", "gridcolor": "#DFE8F3", "linecolor": "#A2B1C6" }, "caxis": { "ticks": "", "gridcolor": "#DFE8F3", "linecolor": "#A2B1C6" }, "bgcolor": "white" }, "colorway": [ "#636efa", "#EF553B", "#00cc96", "#ab63fa", "#19d3f3", "#e763fa", "#fecb52", "#ffa15a", "#ff6692", "#b6e880" ], "hovermode": "closest", "colorscale": { "diverging": [ [ 0, "#8e0152" ], [ 0.1, "#c51b7d" ], [ 0.2, "#de77ae" ], [ 0.3, "#f1b6da" ], [ 0.4, "#fde0ef" ], [ 0.5, "#f7f7f7" ], [ 0.6, "#e6f5d0" ], [ 0.7, "#b8e186" ], [ 0.8, "#7fbc41" ], [ 0.9, "#4d9221" ], [ 1, "#276419" ] ], "sequential": [ [ 0, "#0508b8" ], [ 0.0893854748603352, "#1910d8" ], [ 0.1787709497206704, "#3c19f0" ], [ 0.2681564245810056, "#6b1cfb" ], [ 0.3575418994413408, "#981cfd" ], [ 0.44692737430167595, "#bf1cfd" ], [ 0.5363128491620112, "#dd2bfd" ], [ 0.6256983240223464, "#f246fe" ], [ 0.7150837988826816, "#fc67fd" ], [ 0.8044692737430168, "#fe88fc" ], [ 0.8938547486033519, "#fea5fd" ], [ 0.9832402234636871, "#febefe" ], [ 1, "#fec3fe" ] ], "sequentialminus": [ [ 0, "#0508b8" ], [ 0.0893854748603352, "#1910d8" ], [ 0.1787709497206704, "#3c19f0" ], [ 0.2681564245810056, "#6b1cfb" ], [ 0.3575418994413408, "#981cfd" ], [ 0.44692737430167595, "#bf1cfd" ], [ 0.5363128491620112, "#dd2bfd" ], [ 0.6256983240223464, "#f246fe" ], [ 0.7150837988826816, "#fc67fd" ], [ 0.8044692737430168, "#fe88fc" ], [ 0.8938547486033519, "#fea5fd" ], [ 0.9832402234636871, "#febefe" ], [ 1, "#fec3fe" ] ] }, "plot_bgcolor": "white", "paper_bgcolor": "white", "shapedefaults": { "line": { "width": 0 }, "opacity": 0.4, "fillcolor": "#506784" }, "annotationdefaults": { "arrowhead": 0, "arrowcolor": "#506784", "arrowwidth": 1 } }, "themeRef": "PLOTLY_WHITE" } } }, "height": null, "width": null, "user": { "profile_url": "https://chart-studio.plotly.com/~ThadLee", "avatar_url": "https://storage.googleapis.com/plotly-prod-profiles/14.jpg", "background_url": "https://storage.googleapis.com/plotly-prod-profiles/bg-7.jpg", "bio": "", "nickname": "", "website": "", "stream_tokens": null, "feature_set_id": null, "csrf_token": null, "date_joined": "2023-08-26 05:56:46", "mapbox_access_tokens": null, "has_password": null, "username": "ThadLee", "email": null, "is_active": null, "readonly": null, "is_dash_creator": null, "dash_created_count": null, "is_chart_creator": null, "charts_created_count": null } } ] }
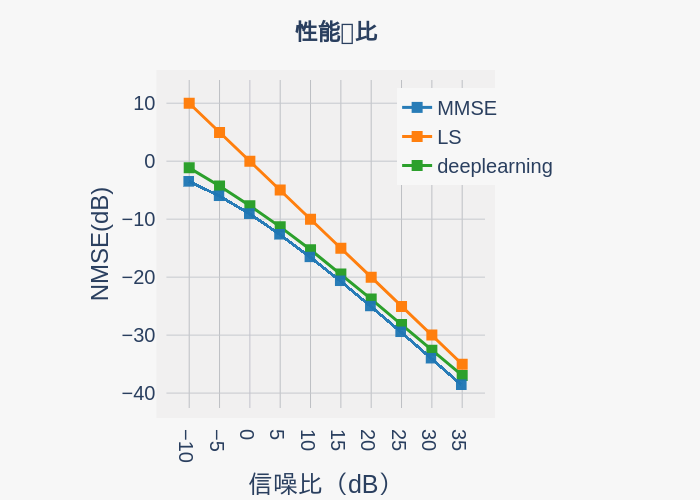