Plots List
Plots
This endpoint handles manipulation of Plotly plot files.
Reference
Authorization
Any user with or without a Plotly account may view public plots. For private plots, see authentication.
Actions
list
Listing all public plots can be done via a GET request to this endpoint.
By default, plots will be listed in order of date created. The order_by
query parameter is accepted at this endpoint. Currently, only ordering by
views is supported. It is possible to filter the plots by quality
with min_quality or max_quality as query parameter.
Example:
// GET https://api.plotly.com/v2/plots/ ---> 200

// GET https://api.plotly.com/v2/plots/?order_by=-views ---> 200

// GET https://api.plotly.com/v2/plots/?min_quality=5 ---> 200

// GET https://api.plotly.com/v2/plots/?max_quality=5 ---> 200
feed
Listing all handpicked feed plots can be done via a GET request to this endpoint. By default, plots will be listed in a random order.
Example:
// GET https://api.plotly.com/v2/plots/feed ---> 200
create
You can create new plot resources here. The only required field is 'figure'. Currently, the figure is restricted to only contain references to grid data. That is, this will fail if raw data arrays are passed in. To create and manipulate underlying grids for plots, see the grids endpoint.
Example:
// This fails because a figure field is required.
// POST https://api.plotly.com/v2/plots ---> 400 Bad Request
{}

// This fails because the figure has raw data
//POST https://api.plotly.com/v2/plots ---> 400 Bad Request
{
    "figure": {"data": [{"y": ['this', 'is', 'raw', 'data']}]}
}

// This succeeds because the figure has src keys, not raw data.
//POST https://api.plotly.com/v2/plots ---> 200 OK
{
    "figure": {"data": [{"ysrc": "sven:88:u8nd62"}]}
}
When creating a grid, you can optionally specify a source_fid to specify where a plot has come from:
- source_fid: the fid of a plot that was copied (and presumably edited) to produce this one
detail
There is a lot of meta information stored about plot files including filename, title, share_url, and content_url to name a few.
This information can only be reached with a GET to this endpoint.
Example:
// GET https://api.plotly.com/v2/plots/iheartgraphs:90
content
The contents of a plot can be downloaded via the content resource. The plot
content contains referenced grid/column data by default. If you wish to
return the raw grid/column data, the inline_data=true query must be included
in the request url. The Content-Type header will be appropriately set for the
response body.
Alternatively, you can set ?map_data=unreadable to append a mapping of
sources to data that belongs to grids which are unreadable for the
requestor. This is useful when you have read access to another users plot,
but that plot contains grid references which you don't have access to.
Examples:
// Returns referenced grid/column data
// GET https://api.plotly.com/v2/plots/iheartgraphs:90/content ---> 200 OK

// Returns full grid/column data
// GET https://api.plotly.com/v2/plots/iheartgraphs:90/content?inline_data=true ---> 200 OK

// Returns full grid/column data when requestor doesn't have permission
// to read the referenced grid.
// GET https://api.plotly.com/v2/plots/iheartgraphs:90/content?map_data=unreadable ---> 200 OK
GET /v2/plots?cursor=cD0yMDI1LTA4LTAxKzE5JTNBMDclM0E0MS4wMDQ0MTIlMkIwMCUzQTAw&format=api
{ "next": "https://api.plotly.com/v2/plots?cursor=cD0yMDI1LTA4LTAxKzE1JTNBNDQlM0ExOC40NzU5NDQlMkIwMCUzQTAw&format=api", "previous": "https://api.plotly.com/v2/plots?cursor=cj0xJnA9MjAyNS0wOC0wMSsxOCUzQTU5JTNBMjAuNzY2MTIzJTJCMDAlM0EwMA%3D%3D&format=api", "results": [ { "creation_time": "2025-08-01T18:59:20.766123Z", "comments": { "results": [], "count": 0 }, "parented": true, "embed_url": "https://chart-studio.plotly.com/~g.isa15/27.embed", "fid": "g.isa15:27", "filename": "Plot 27", "filetype": "plot", "img_url": "https://storage.googleapis.com/plotly-prod-images/g.isa15/27/9_UIC0JE93AW6RY7140WM8PD4IPY719X.png", "image_urls": { "default": "https://storage.googleapis.com/plotly-prod-images/g.isa15/27/2_YSI7GBNRWW9BC30VS5HLYP2AG6HJ46.png", "block-thumb": "https://storage.googleapis.com/plotly-prod-images/g.isa15/27/8_P74L4DCFN2XZS8WT6Q3850UP6P8KMV.png", "list-thumb": "https://storage.googleapis.com/plotly-prod-images/g.isa15/27/9_UIC0JE93AW6RY7140WM8PD4IPY719X.png" }, "api_urls": { "files": "https://api.plotly.com/v2/files/g.isa15:27", "plots": "https://api.plotly.com/v2/plots/g.isa15:27", "parent": "https://api.plotly.com/v2/folders/home?user=g.isa15" }, "owner": "g.isa15", "parent": -1, "preview": "", "referencers": [], "references": [], "title": "", "views": 0, "web_url": "https://chart-studio.plotly.com/~g.isa15/27/", "world_readable": true, "date_modified": "2025-08-01T18:59:20.778Z", "stars": { "results": [], "count": 0 }, "collaborators": { "results": [], "count": 0 }, "subfolder_count": null, "refresh_interval": null, "organize_view_url": "https://chart-studio.plotly.com/~g.isa15/27/", "current_user_permission": "read", "is_theme": null, "is_template": false, "autosize": true, "caption": "", "figure": { "data": [ { "meta": { "columnNames": { "x": "A", "y": "B" } }, "mode": "lines", "type": "scatter", "xsrc": "g.isa15:26:7d461d", "ysrc": "g.isa15:26:941c3e" } ], "frames": [], "layout": { "title": { "text": "Spirulina Relative Absorbance" }, "xaxis": { "type": "linear", "range": [ 400, 760 ], "title": { "text": "Wavelength (nm)" }, "autorange": true }, "yaxis": { "type": "linear", "range": [ -5.612184072485, 105.558536003815 ], "title": { "text": "Relative Absorbance (%)" }, "autorange": true }, "autosize": true, "template": { "data": { "bar": [ { "type": "bar", "marker": { "colorbar": { "ticks": "", "outlinewidth": 0 } } } ], "table": [ { "type": "table", "cells": { "fill": { "color": "#EBF0F8" }, "line": { "color": "white" } }, "header": { "fill": { "color": "#C8D4E3" }, "line": { "color": "white" } } } ], "carpet": [ { "type": "carpet", "aaxis": { "gridcolor": "#C8D4E3", "linecolor": "#C8D4E3", "endlinecolor": "#2a3f5f", "minorgridcolor": "#C8D4E3", "startlinecolor": "#2a3f5f" }, "baxis": { "gridcolor": "#C8D4E3", "linecolor": "#C8D4E3", "endlinecolor": "#2a3f5f", "minorgridcolor": "#C8D4E3", "startlinecolor": "#2a3f5f" } } ], "mesh3d": [ { "type": "mesh3d", "colorbar": { "ticks": "", "outlinewidth": 0 } } ], "contour": [ { "type": "contour", "colorbar": { "ticks": "", "outlinewidth": 0 }, "autocolorscale": true } ], "heatmap": [ { "type": "heatmap", "colorbar": { "ticks": "", "outlinewidth": 0 }, "autocolorscale": true } ], "scatter": [ { "type": "scatter", "marker": { "colorbar": { "ticks": "", "outlinewidth": 0 } } } ], "surface": [ { "type": "surface", "colorbar": { "ticks": "", "outlinewidth": 0 } } ], "heatmapgl": [ { "type": "heatmapgl", "colorbar": { "ticks": "", "outlinewidth": 0 } } ], "histogram": [ { "type": "histogram", "marker": { "colorbar": { "ticks": "", "outlinewidth": 0 } } } ], "parcoords": [ { "line": { "colorbar": { "ticks": "", "outlinewidth": 0 } }, "type": "parcoords" } ], "scatter3d": [ { "type": "scatter3d", "marker": { "colorbar": { "ticks": "", "outlinewidth": 0 } } } ], "scattergl": [ { "type": "scattergl", "marker": { "colorbar": { "ticks": "", "outlinewidth": 0 } } } ], "choropleth": [ { "type": "choropleth", "colorbar": { "ticks": "", "outlinewidth": 0 } } ], "scattergeo": [ { "type": "scattergeo", "marker": { "colorbar": { "ticks": "", "outlinewidth": 0 } } } ], "histogram2d": [ { "type": "histogram2d", "colorbar": { "ticks": "", "outlinewidth": 0 }, "autocolorscale": true } ], "scatterpolar": [ { "type": "scatterpolar", "marker": { "colorbar": { "ticks": "", "outlinewidth": 0 } } } ], "contourcarpet": [ { "type": "contourcarpet", "colorbar": { "ticks": "", "outlinewidth": 0 } } ], "scattercarpet": [ { "type": "scattercarpet", "marker": { "colorbar": { "ticks": "", "outlinewidth": 0 } } } ], "scattermapbox": [ { "type": "scattermapbox", "marker": { "colorbar": { "ticks": "", "outlinewidth": 0 } } } ], "scatterpolargl": [ { "type": "scatterpolargl", "marker": { "colorbar": { "ticks": "", "outlinewidth": 0 } } } ], "scatterternary": [ { "type": "scatterternary", "marker": { "colorbar": { "ticks": "", "outlinewidth": 0 } } } ], "histogram2dcontour": [ { "type": "histogram2dcontour", "colorbar": { "ticks": "", "outlinewidth": 0 }, "autocolorscale": true } ] }, "layout": { "geo": { "bgcolor": "white", "showland": true, "lakecolor": "white", "landcolor": "white", "showlakes": true, "subunitcolor": "#C8D4E3" }, "font": { "color": "#2a3f5f" }, "polar": { "bgcolor": "white", "radialaxis": { "ticks": "", "gridcolor": "#EBF0F8", "linecolor": "#EBF0F8" }, "angularaxis": { "ticks": "", "gridcolor": "#EBF0F8", "linecolor": "#EBF0F8" } }, "scene": { "xaxis": { "ticks": "", "gridcolor": "#DFE8F3", "gridwidth": 2, "linecolor": "#EBF0F8", "zerolinecolor": "#EBF0F8", "showbackground": true, "backgroundcolor": "white" }, "yaxis": { "ticks": "", "gridcolor": "#DFE8F3", "gridwidth": 2, "linecolor": "#EBF0F8", "zerolinecolor": "#EBF0F8", "showbackground": true, "backgroundcolor": "white" }, "zaxis": { "ticks": "", "gridcolor": "#DFE8F3", "gridwidth": 2, "linecolor": "#EBF0F8", "zerolinecolor": "#EBF0F8", "showbackground": true, "backgroundcolor": "white" } }, "title": { "x": 0.05 }, "xaxis": { "ticks": "", "gridcolor": "#EBF0F8", "linecolor": "#EBF0F8", "automargin": true, "zerolinecolor": "#EBF0F8", "zerolinewidth": 2 }, "yaxis": { "ticks": "", "gridcolor": "#EBF0F8", "linecolor": "#EBF0F8", "automargin": true, "zerolinecolor": "#EBF0F8", "zerolinewidth": 2 }, "ternary": { "aaxis": { "ticks": "", "gridcolor": "#DFE8F3", "linecolor": "#A2B1C6" }, "baxis": { "ticks": "", "gridcolor": "#DFE8F3", "linecolor": "#A2B1C6" }, "caxis": { "ticks": "", "gridcolor": "#DFE8F3", "linecolor": "#A2B1C6" }, "bgcolor": "white" }, "colorway": [ "#636efa", "#EF553B", "#00cc96", "#ab63fa", "#19d3f3", "#e763fa", "#fecb52", "#ffa15a", "#ff6692", "#b6e880" ], "hovermode": "closest", "colorscale": { "diverging": [ [ 0, "#8e0152" ], [ 0.1, "#c51b7d" ], [ 0.2, "#de77ae" ], [ 0.3, "#f1b6da" ], [ 0.4, "#fde0ef" ], [ 0.5, "#f7f7f7" ], [ 0.6, "#e6f5d0" ], [ 0.7, "#b8e186" ], [ 0.8, "#7fbc41" ], [ 0.9, "#4d9221" ], [ 1, "#276419" ] ], "sequential": [ [ 0, "#0508b8" ], [ 0.0893854748603352, "#1910d8" ], [ 0.1787709497206704, "#3c19f0" ], [ 0.2681564245810056, "#6b1cfb" ], [ 0.3575418994413408, "#981cfd" ], [ 0.44692737430167595, "#bf1cfd" ], [ 0.5363128491620112, "#dd2bfd" ], [ 0.6256983240223464, "#f246fe" ], [ 0.7150837988826816, "#fc67fd" ], [ 0.8044692737430168, "#fe88fc" ], [ 0.8938547486033519, "#fea5fd" ], [ 0.9832402234636871, "#febefe" ], [ 1, "#fec3fe" ] ], "sequentialminus": [ [ 0, "#0508b8" ], [ 0.0893854748603352, "#1910d8" ], [ 0.1787709497206704, "#3c19f0" ], [ 0.2681564245810056, "#6b1cfb" ], [ 0.3575418994413408, "#981cfd" ], [ 0.44692737430167595, "#bf1cfd" ], [ 0.5363128491620112, "#dd2bfd" ], [ 0.6256983240223464, "#f246fe" ], [ 0.7150837988826816, "#fc67fd" ], [ 0.8044692737430168, "#fe88fc" ], [ 0.8938547486033519, "#fea5fd" ], [ 0.9832402234636871, "#febefe" ], [ 1, "#fec3fe" ] ] }, "plot_bgcolor": "white", "paper_bgcolor": "white", "shapedefaults": { "line": { "width": 0 }, "opacity": 0.4, "fillcolor": "#506784" }, "annotationdefaults": { "arrowhead": 0, "arrowcolor": "#506784", "arrowwidth": 1 } }, "themeRef": "PLOTLY_WHITE" } } }, "height": null, "width": null, "user": { "profile_url": "https://chart-studio.plotly.com/~g.isa15", "avatar_url": "https://storage.googleapis.com/plotly-prod-profiles/21.jpg", "background_url": "https://storage.googleapis.com/plotly-prod-profiles/bg-1.jpg", "bio": "", "nickname": "", "website": "", "stream_tokens": null, "feature_set_id": null, "csrf_token": null, "date_joined": "2025-07-15 04:16:37", "mapbox_access_tokens": null, "has_password": null, "username": "g.isa15", "email": null, "is_active": null, "readonly": null, "is_dash_creator": null, "dash_created_count": null, "is_chart_creator": null, "charts_created_count": null } }, { "creation_time": "2025-08-01T18:55:28.542654Z", "comments": { "results": [], "count": 0 }, "parented": true, "embed_url": "https://chart-studio.plotly.com/~g.isa15/25.embed", "fid": "g.isa15:25", "filename": "Plot 25", "filetype": "plot", "img_url": "https://storage.googleapis.com/plotly-prod-images/g.isa15/25/9_J2IT12PK5N1NHX5Y7X2ZPNJZ3OY4ZK.png", "image_urls": { "default": "https://storage.googleapis.com/plotly-prod-images/g.isa15/25/2_77FG3Z1QQNFQO2J06YUO422QMKTK5E.png", "block-thumb": "https://storage.googleapis.com/plotly-prod-images/g.isa15/25/8_LPE5VDB8LL1F3X402ERD5L9PY7V808.png", "list-thumb": "https://storage.googleapis.com/plotly-prod-images/g.isa15/25/9_J2IT12PK5N1NHX5Y7X2ZPNJZ3OY4ZK.png" }, "api_urls": { "files": "https://api.plotly.com/v2/files/g.isa15:25", "plots": "https://api.plotly.com/v2/plots/g.isa15:25", "parent": "https://api.plotly.com/v2/folders/home?user=g.isa15" }, "owner": "g.isa15", "parent": -1, "preview": "", "referencers": [], "references": [], "title": "", "views": 1, "web_url": "https://chart-studio.plotly.com/~g.isa15/25/", "world_readable": true, "date_modified": "2025-08-01T18:59:56.878Z", "stars": { "results": [], "count": 0 }, "collaborators": { "results": [], "count": 0 }, "subfolder_count": null, "refresh_interval": null, "organize_view_url": "https://chart-studio.plotly.com/~g.isa15/25/", "current_user_permission": "read", "is_theme": null, "is_template": false, "autosize": true, "caption": "", "figure": { "data": [ { "meta": { "columnNames": { "x": "A", "y": "B" } }, "mode": "lines", "type": "scatter", "xsrc": "g.isa15:24:d45d90", "ysrc": "g.isa15:24:d5da5c" } ], "frames": [], "layout": { "title": { "text": "Geramium Relative Absorbance" }, "xaxis": { "type": "linear", "range": [ 400, 760 ], "title": { "text": "Wavelength (nm)" }, "autorange": true }, "yaxis": { "type": "linear", "range": [ -5.093099671377777, 105.53121577217777 ], "title": { "text": "Relative Absorbance (%)" }, "autorange": true }, "autosize": true, "template": { "data": { "bar": [ { "type": "bar", "marker": { "colorbar": { "ticks": "", "outlinewidth": 0 } } } ], "table": [ { "type": "table", "cells": { "fill": { "color": "#EBF0F8" }, "line": { "color": "white" } }, "header": { "fill": { "color": "#C8D4E3" }, "line": { "color": "white" } } } ], "carpet": [ { "type": "carpet", "aaxis": { "gridcolor": "#C8D4E3", "linecolor": "#C8D4E3", "endlinecolor": "#2a3f5f", "minorgridcolor": "#C8D4E3", "startlinecolor": "#2a3f5f" }, "baxis": { "gridcolor": "#C8D4E3", "linecolor": "#C8D4E3", "endlinecolor": "#2a3f5f", "minorgridcolor": "#C8D4E3", "startlinecolor": "#2a3f5f" } } ], "mesh3d": [ { "type": "mesh3d", "colorbar": { "ticks": "", "outlinewidth": 0 } } ], "contour": [ { "type": "contour", "colorbar": { "ticks": "", "outlinewidth": 0 }, "autocolorscale": true } ], "heatmap": [ { "type": "heatmap", "colorbar": { "ticks": "", "outlinewidth": 0 }, "autocolorscale": true } ], "scatter": [ { "type": "scatter", "marker": { "colorbar": { "ticks": "", "outlinewidth": 0 } } } ], "surface": [ { "type": "surface", "colorbar": { "ticks": "", "outlinewidth": 0 } } ], "heatmapgl": [ { "type": "heatmapgl", "colorbar": { "ticks": "", "outlinewidth": 0 } } ], "histogram": [ { "type": "histogram", "marker": { "colorbar": { "ticks": "", "outlinewidth": 0 } } } ], "parcoords": [ { "line": { "colorbar": { "ticks": "", "outlinewidth": 0 } }, "type": "parcoords" } ], "scatter3d": [ { "type": "scatter3d", "marker": { "colorbar": { "ticks": "", "outlinewidth": 0 } } } ], "scattergl": [ { "type": "scattergl", "marker": { "colorbar": { "ticks": "", "outlinewidth": 0 } } } ], "choropleth": [ { "type": "choropleth", "colorbar": { "ticks": "", "outlinewidth": 0 } } ], "scattergeo": [ { "type": "scattergeo", "marker": { "colorbar": { "ticks": "", "outlinewidth": 0 } } } ], "histogram2d": [ { "type": "histogram2d", "colorbar": { "ticks": "", "outlinewidth": 0 }, "autocolorscale": true } ], "scatterpolar": [ { "type": "scatterpolar", "marker": { "colorbar": { "ticks": "", "outlinewidth": 0 } } } ], "contourcarpet": [ { "type": "contourcarpet", "colorbar": { "ticks": "", "outlinewidth": 0 } } ], "scattercarpet": [ { "type": "scattercarpet", "marker": { "colorbar": { "ticks": "", "outlinewidth": 0 } } } ], "scattermapbox": [ { "type": "scattermapbox", "marker": { "colorbar": { "ticks": "", "outlinewidth": 0 } } } ], "scatterpolargl": [ { "type": "scatterpolargl", "marker": { "colorbar": { "ticks": "", "outlinewidth": 0 } } } ], "scatterternary": [ { "type": "scatterternary", "marker": { "colorbar": { "ticks": "", "outlinewidth": 0 } } } ], "histogram2dcontour": [ { "type": "histogram2dcontour", "colorbar": { "ticks": "", "outlinewidth": 0 }, "autocolorscale": true } ] }, "layout": { "geo": { "bgcolor": "white", "showland": true, "lakecolor": "white", "landcolor": "white", "showlakes": true, "subunitcolor": "#C8D4E3" }, "font": { "color": "#2a3f5f" }, "polar": { "bgcolor": "white", "radialaxis": { "ticks": "", "gridcolor": "#EBF0F8", "linecolor": "#EBF0F8" }, "angularaxis": { "ticks": "", "gridcolor": "#EBF0F8", "linecolor": "#EBF0F8" } }, "scene": { "xaxis": { "ticks": "", "gridcolor": "#DFE8F3", "gridwidth": 2, "linecolor": "#EBF0F8", "zerolinecolor": "#EBF0F8", "showbackground": true, "backgroundcolor": "white" }, "yaxis": { "ticks": "", "gridcolor": "#DFE8F3", "gridwidth": 2, "linecolor": "#EBF0F8", "zerolinecolor": "#EBF0F8", "showbackground": true, "backgroundcolor": "white" }, "zaxis": { "ticks": "", "gridcolor": "#DFE8F3", "gridwidth": 2, "linecolor": "#EBF0F8", "zerolinecolor": "#EBF0F8", "showbackground": true, "backgroundcolor": "white" } }, "title": { "x": 0.05 }, "xaxis": { "ticks": "", "gridcolor": "#EBF0F8", "linecolor": "#EBF0F8", "automargin": true, "zerolinecolor": "#EBF0F8", "zerolinewidth": 2 }, "yaxis": { "ticks": "", "gridcolor": "#EBF0F8", "linecolor": "#EBF0F8", "automargin": true, "zerolinecolor": "#EBF0F8", "zerolinewidth": 2 }, "ternary": { "aaxis": { "ticks": "", "gridcolor": "#DFE8F3", "linecolor": "#A2B1C6" }, "baxis": { "ticks": "", "gridcolor": "#DFE8F3", "linecolor": "#A2B1C6" }, "caxis": { "ticks": "", "gridcolor": "#DFE8F3", "linecolor": "#A2B1C6" }, "bgcolor": "white" }, "colorway": [ "#636efa", "#EF553B", "#00cc96", "#ab63fa", "#19d3f3", "#e763fa", "#fecb52", "#ffa15a", "#ff6692", "#b6e880" ], "hovermode": "closest", "colorscale": { "diverging": [ [ 0, "#8e0152" ], [ 0.1, "#c51b7d" ], [ 0.2, "#de77ae" ], [ 0.3, "#f1b6da" ], [ 0.4, "#fde0ef" ], [ 0.5, "#f7f7f7" ], [ 0.6, "#e6f5d0" ], [ 0.7, "#b8e186" ], [ 0.8, "#7fbc41" ], [ 0.9, "#4d9221" ], [ 1, "#276419" ] ], "sequential": [ [ 0, "#0508b8" ], [ 0.0893854748603352, "#1910d8" ], [ 0.1787709497206704, "#3c19f0" ], [ 0.2681564245810056, "#6b1cfb" ], [ 0.3575418994413408, "#981cfd" ], [ 0.44692737430167595, "#bf1cfd" ], [ 0.5363128491620112, "#dd2bfd" ], [ 0.6256983240223464, "#f246fe" ], [ 0.7150837988826816, "#fc67fd" ], [ 0.8044692737430168, "#fe88fc" ], [ 0.8938547486033519, "#fea5fd" ], [ 0.9832402234636871, "#febefe" ], [ 1, "#fec3fe" ] ], "sequentialminus": [ [ 0, "#0508b8" ], [ 0.0893854748603352, "#1910d8" ], [ 0.1787709497206704, "#3c19f0" ], [ 0.2681564245810056, "#6b1cfb" ], [ 0.3575418994413408, "#981cfd" ], [ 0.44692737430167595, "#bf1cfd" ], [ 0.5363128491620112, "#dd2bfd" ], [ 0.6256983240223464, "#f246fe" ], [ 0.7150837988826816, "#fc67fd" ], [ 0.8044692737430168, "#fe88fc" ], [ 0.8938547486033519, "#fea5fd" ], [ 0.9832402234636871, "#febefe" ], [ 1, "#fec3fe" ] ] }, "plot_bgcolor": "white", "paper_bgcolor": "white", "shapedefaults": { "line": { "width": 0 }, "opacity": 0.4, "fillcolor": "#506784" }, "annotationdefaults": { "arrowhead": 0, "arrowcolor": "#506784", "arrowwidth": 1 } }, "themeRef": "PLOTLY_WHITE" } } }, "height": null, "width": null, "user": { "profile_url": "https://chart-studio.plotly.com/~g.isa15", "avatar_url": "https://storage.googleapis.com/plotly-prod-profiles/21.jpg", "background_url": "https://storage.googleapis.com/plotly-prod-profiles/bg-1.jpg", "bio": "", "nickname": "", "website": "", "stream_tokens": null, "feature_set_id": null, "csrf_token": null, "date_joined": "2025-07-15 04:16:37", "mapbox_access_tokens": null, "has_password": null, "username": "g.isa15", "email": null, "is_active": null, "readonly": null, "is_dash_creator": null, "dash_created_count": null, "is_chart_creator": null, "charts_created_count": null } }, { "creation_time": "2025-08-01T18:47:46.149454Z", "comments": { "results": [], "count": 0 }, "parented": true, "embed_url": "https://chart-studio.plotly.com/~gonzalogdiez/2674.embed", "fid": "gonzalogdiez:2674", "filename": "fig2EFN", "filetype": "plot", "img_url": "https://api.plotly.com/v2/files/gonzalogdiez:2674/image?image_name=list-thumb", "image_urls": { "default": "https://api.plotly.com/v2/files/gonzalogdiez:2674/image?image_name=default", "block-thumb": "https://api.plotly.com/v2/files/gonzalogdiez:2674/image?image_name=block-thumb", "list-thumb": "https://api.plotly.com/v2/files/gonzalogdiez:2674/image?image_name=list-thumb" }, "api_urls": { "files": "https://api.plotly.com/v2/files/gonzalogdiez:2674", "plots": "https://api.plotly.com/v2/plots/gonzalogdiez:2674", "parent": "https://api.plotly.com/v2/folders/home?user=gonzalogdiez" }, "owner": "gonzalogdiez", "parent": -1, "preview": "", "referencers": [], "references": [], "title": "", "views": 25, "web_url": "https://chart-studio.plotly.com/~gonzalogdiez/2674/", "world_readable": true, "date_modified": "2025-08-27T20:27:34.428Z", "stars": { "results": [], "count": 0 }, "collaborators": { "results": [], "count": 0 }, "subfolder_count": null, "refresh_interval": null, "organize_view_url": "https://chart-studio.plotly.com/~gonzalogdiez/2674/", "current_user_permission": "read", "is_theme": null, "is_template": null, "autosize": true, "caption": "", "figure": { "data": [ { "line": { "color": "green" }, "mode": "lines", "name": "Truck, Truck Trailer and RV Leasing", "type": "scatter", "xsrc": "gonzalogdiez:2708:2bd2b7", "ysrc": "gonzalogdiez:2708:bee0b2" }, { "line": { "dash": "dot", "color": "green" }, "mode": "lines", "name": "forecast", "type": "scatter", "xsrc": "gonzalogdiez:2708:3f348b", "ysrc": "gonzalogdiez:2708:e677d9" }, { "line": { "color": "purple" }, "mode": "lines", "name": "Truck, Truck Trailer and RV Rental", "type": "scatter", "xsrc": "gonzalogdiez:2708:9fc40f", "ysrc": "gonzalogdiez:2708:9d873e" }, { "line": { "dash": "dot", "color": "purple" }, "mode": "lines", "name": "forecast", "type": "scatter", "xsrc": "gonzalogdiez:2708:1b6b00", "ysrc": "gonzalogdiez:2708:3ccef4" } ], "layout": { "xaxis": { "range": [ "2017-01-01", "2026-07-31T00:00:00" ], "title": { "text": "Date" }, "rangeslider": { "visible": true }, "rangeselector": { "buttons": [ { "step": "year", "count": 5, "label": "5Y", "stepmode": "backward" }, { "step": "year", "count": 1, "label": "1Y", "stepmode": "backward" }, { "step": "all" } ] } }, "yaxis": { "title": { "text": "Index Value" } }, "legend": { "x": 1, "y": 1.02, "xanchor": "right", "yanchor": "bottom", "orientation": "h" }, "template": { "data": { "bar": [ { "type": "bar", "marker": { "line": { "color": "#E5ECF6", "width": 0.5 }, "pattern": { "size": 10, "fillmode": "overlay", "solidity": 0.2 } }, "error_x": { "color": "#2a3f5f" }, "error_y": { "color": "#2a3f5f" } } ], "pie": [ { "type": "pie", "automargin": true } ], "table": [ { "type": "table", "cells": { "fill": { "color": "#EBF0F8" }, "line": { "color": "white" } }, "header": { "fill": { "color": "#C8D4E3" }, "line": { "color": "white" } } } ], "carpet": [ { "type": "carpet", "aaxis": { "gridcolor": "white", "linecolor": "white", "endlinecolor": "#2a3f5f", "minorgridcolor": "white", "startlinecolor": "#2a3f5f" }, "baxis": { "gridcolor": "white", "linecolor": "white", "endlinecolor": "#2a3f5f", "minorgridcolor": "white", "startlinecolor": "#2a3f5f" } } ], "mesh3d": [ { "type": "mesh3d", "colorbar": { "ticks": "", "outlinewidth": 0 } } ], "contour": [ { "type": "contour", "colorbar": { "ticks": "", "outlinewidth": 0 }, "colorscale": [ [ 0.0, "#0d0887" ], [ 0.1111111111111111, "#46039f" ], [ 0.2222222222222222, "#7201a8" ], [ 0.3333333333333333, "#9c179e" ], [ 0.4444444444444444, "#bd3786" ], [ 0.5555555555555556, "#d8576b" ], [ 0.6666666666666666, "#ed7953" ], [ 0.7777777777777778, "#fb9f3a" ], [ 0.8888888888888888, "#fdca26" ], [ 1.0, "#f0f921" ] ] } ], "heatmap": [ { "type": "heatmap", "colorbar": { "ticks": "", "outlinewidth": 0 }, "colorscale": [ [ 0.0, "#0d0887" ], [ 0.1111111111111111, "#46039f" ], [ 0.2222222222222222, "#7201a8" ], [ 0.3333333333333333, "#9c179e" ], [ 0.4444444444444444, "#bd3786" ], [ 0.5555555555555556, "#d8576b" ], [ 0.6666666666666666, "#ed7953" ], [ 0.7777777777777778, "#fb9f3a" ], [ 0.8888888888888888, "#fdca26" ], [ 1.0, "#f0f921" ] ] } ], "scatter": [ { "type": "scatter", "fillpattern": { "size": 10, "fillmode": "overlay", "solidity": 0.2 } } ], "surface": [ { "type": "surface", "colorbar": { "ticks": "", "outlinewidth": 0 }, "colorscale": [ [ 0.0, "#0d0887" ], [ 0.1111111111111111, "#46039f" ], [ 0.2222222222222222, "#7201a8" ], [ 0.3333333333333333, "#9c179e" ], [ 0.4444444444444444, "#bd3786" ], [ 0.5555555555555556, "#d8576b" ], [ 0.6666666666666666, "#ed7953" ], [ 0.7777777777777778, "#fb9f3a" ], [ 0.8888888888888888, "#fdca26" ], [ 1.0, "#f0f921" ] ] } ], "barpolar": [ { "type": "barpolar", "marker": { "line": { "color": "#E5ECF6", "width": 0.5 }, "pattern": { "size": 10, "fillmode": "overlay", "solidity": 0.2 } } } ], "heatmapgl": [ { "type": "heatmapgl", "colorbar": { "ticks": "", "outlinewidth": 0 }, "colorscale": [ [ 0.0, "#0d0887" ], [ 0.1111111111111111, "#46039f" ], [ 0.2222222222222222, "#7201a8" ], [ 0.3333333333333333, "#9c179e" ], [ 0.4444444444444444, "#bd3786" ], [ 0.5555555555555556, "#d8576b" ], [ 0.6666666666666666, "#ed7953" ], [ 0.7777777777777778, "#fb9f3a" ], [ 0.8888888888888888, "#fdca26" ], [ 1.0, "#f0f921" ] ] } ], "histogram": [ { "type": "histogram", "marker": { "pattern": { "size": 10, "fillmode": "overlay", "solidity": 0.2 } } } ], "parcoords": [ { "line": { "colorbar": { "ticks": "", "outlinewidth": 0 } }, "type": "parcoords" } ], "scatter3d": [ { "line": { "colorbar": { "ticks": "", "outlinewidth": 0 } }, "type": "scatter3d", "marker": { "colorbar": { "ticks": "", "outlinewidth": 0 } } } ], "scattergl": [ { "type": "scattergl", "marker": { "colorbar": { "ticks": "", "outlinewidth": 0 } } } ], "choropleth": [ { "type": "choropleth", "colorbar": { "ticks": "", "outlinewidth": 0 } } ], "scattergeo": [ { "type": "scattergeo", "marker": { "colorbar": { "ticks": "", "outlinewidth": 0 } } } ], "histogram2d": [ { "type": "histogram2d", "colorbar": { "ticks": "", "outlinewidth": 0 }, "colorscale": [ [ 0.0, "#0d0887" ], [ 0.1111111111111111, "#46039f" ], [ 0.2222222222222222, "#7201a8" ], [ 0.3333333333333333, "#9c179e" ], [ 0.4444444444444444, "#bd3786" ], [ 0.5555555555555556, "#d8576b" ], [ 0.6666666666666666, "#ed7953" ], [ 0.7777777777777778, "#fb9f3a" ], [ 0.8888888888888888, "#fdca26" ], [ 1.0, "#f0f921" ] ] } ], "scatterpolar": [ { "type": "scatterpolar", "marker": { "colorbar": { "ticks": "", "outlinewidth": 0 } } } ], "contourcarpet": [ { "type": "contourcarpet", "colorbar": { "ticks": "", "outlinewidth": 0 } } ], "scattercarpet": [ { "type": "scattercarpet", "marker": { "colorbar": { "ticks": "", "outlinewidth": 0 } } } ], "scattermapbox": [ { "type": "scattermapbox", "marker": { "colorbar": { "ticks": "", "outlinewidth": 0 } } } ], "scatterpolargl": [ { "type": "scatterpolargl", "marker": { "colorbar": { "ticks": "", "outlinewidth": 0 } } } ], "scatterternary": [ { "type": "scatterternary", "marker": { "colorbar": { "ticks": "", "outlinewidth": 0 } } } ], "histogram2dcontour": [ { "type": "histogram2dcontour", "colorbar": { "ticks": "", "outlinewidth": 0 }, "colorscale": [ [ 0.0, "#0d0887" ], [ 0.1111111111111111, "#46039f" ], [ 0.2222222222222222, "#7201a8" ], [ 0.3333333333333333, "#9c179e" ], [ 0.4444444444444444, "#bd3786" ], [ 0.5555555555555556, "#d8576b" ], [ 0.6666666666666666, "#ed7953" ], [ 0.7777777777777778, "#fb9f3a" ], [ 0.8888888888888888, "#fdca26" ], [ 1.0, "#f0f921" ] ] } ] }, "layout": { "geo": { "bgcolor": "white", "showland": true, "lakecolor": "white", "landcolor": "#E5ECF6", "showlakes": true, "subunitcolor": "white" }, "font": { "color": "#2a3f5f" }, "polar": { "bgcolor": "#E5ECF6", "radialaxis": { "ticks": "", "gridcolor": "white", "linecolor": "white" }, "angularaxis": { "ticks": "", "gridcolor": "white", "linecolor": "white" } }, "scene": { "xaxis": { "ticks": "", "gridcolor": "white", "gridwidth": 2, "linecolor": "white", "zerolinecolor": "white", "showbackground": true, "backgroundcolor": "#E5ECF6" }, "yaxis": { "ticks": "", "gridcolor": "white", "gridwidth": 2, "linecolor": "white", "zerolinecolor": "white", "showbackground": true, "backgroundcolor": "#E5ECF6" }, "zaxis": { "ticks": "", "gridcolor": "white", "gridwidth": 2, "linecolor": "white", "zerolinecolor": "white", "showbackground": true, "backgroundcolor": "#E5ECF6" } }, "title": { "x": 0.05 }, "xaxis": { "ticks": "", "title": { "standoff": 15 }, "gridcolor": "white", "linecolor": "white", "automargin": true, "zerolinecolor": "white", "zerolinewidth": 2 }, "yaxis": { "ticks": "", "title": { "standoff": 15 }, "gridcolor": "white", "linecolor": "white", "automargin": true, "zerolinecolor": "white", "zerolinewidth": 2 }, "mapbox": { "style": "light" }, "ternary": { "aaxis": { "ticks": "", "gridcolor": "white", "linecolor": "white" }, "baxis": { "ticks": "", "gridcolor": "white", "linecolor": "white" }, "caxis": { "ticks": "", "gridcolor": "white", "linecolor": "white" }, "bgcolor": "#E5ECF6" }, "colorway": [ "#636efa", "#EF553B", "#00cc96", "#ab63fa", "#FFA15A", "#19d3f3", "#FF6692", "#B6E880", "#FF97FF", "#FECB52" ], "coloraxis": { "colorbar": { "ticks": "", "outlinewidth": 0 } }, "hovermode": "closest", "colorscale": { "diverging": [ [ 0, "#8e0152" ], [ 0.1, "#c51b7d" ], [ 0.2, "#de77ae" ], [ 0.3, "#f1b6da" ], [ 0.4, "#fde0ef" ], [ 0.5, "#f7f7f7" ], [ 0.6, "#e6f5d0" ], [ 0.7, "#b8e186" ], [ 0.8, "#7fbc41" ], [ 0.9, "#4d9221" ], [ 1, "#276419" ] ], "sequential": [ [ 0.0, "#0d0887" ], [ 0.1111111111111111, "#46039f" ], [ 0.2222222222222222, "#7201a8" ], [ 0.3333333333333333, "#9c179e" ], [ 0.4444444444444444, "#bd3786" ], [ 0.5555555555555556, "#d8576b" ], [ 0.6666666666666666, "#ed7953" ], [ 0.7777777777777778, "#fb9f3a" ], [ 0.8888888888888888, "#fdca26" ], [ 1.0, "#f0f921" ] ], "sequentialminus": [ [ 0.0, "#0d0887" ], [ 0.1111111111111111, "#46039f" ], [ 0.2222222222222222, "#7201a8" ], [ 0.3333333333333333, "#9c179e" ], [ 0.4444444444444444, "#bd3786" ], [ 0.5555555555555556, "#d8576b" ], [ 0.6666666666666666, "#ed7953" ], [ 0.7777777777777778, "#fb9f3a" ], [ 0.8888888888888888, "#fdca26" ], [ 1.0, "#f0f921" ] ] }, "hoverlabel": { "align": "left" }, "plot_bgcolor": "#E5ECF6", "paper_bgcolor": "white", "shapedefaults": { "line": { "color": "#2a3f5f" } }, "autotypenumbers": "strict", "annotationdefaults": { "arrowhead": 0, "arrowcolor": "#2a3f5f", "arrowwidth": 1 } } } } }, "height": null, "width": null, "user": { "profile_url": "https://chart-studio.plotly.com/~gonzalogdiez", "avatar_url": "https://storage.googleapis.com/plotly-prod-profiles/99.jpg", "background_url": "https://storage.googleapis.com/plotly-prod-profiles/bg-0.jpg", "bio": "", "nickname": "", "website": "", "stream_tokens": null, "feature_set_id": null, "csrf_token": null, "date_joined": "2024-06-18 13:29:38", "mapbox_access_tokens": null, "has_password": null, "username": "gonzalogdiez", "email": null, "is_active": null, "readonly": null, "is_dash_creator": null, "dash_created_count": null, "is_chart_creator": null, "charts_created_count": null } }, { "creation_time": "2025-08-01T18:47:42.772113Z", "comments": { "results": [], "count": 0 }, "parented": true, "embed_url": "https://chart-studio.plotly.com/~gonzalogdiez/2672.embed", "fid": "gonzalogdiez:2672", "filename": "fig1EFN", "filetype": "plot", "img_url": "https://api.plotly.com/v2/files/gonzalogdiez:2672/image?image_name=list-thumb", "image_urls": { "default": "https://api.plotly.com/v2/files/gonzalogdiez:2672/image?image_name=default", "block-thumb": "https://api.plotly.com/v2/files/gonzalogdiez:2672/image?image_name=block-thumb", "list-thumb": "https://api.plotly.com/v2/files/gonzalogdiez:2672/image?image_name=list-thumb" }, "api_urls": { "files": "https://api.plotly.com/v2/files/gonzalogdiez:2672", "plots": "https://api.plotly.com/v2/plots/gonzalogdiez:2672", "parent": "https://api.plotly.com/v2/folders/home?user=gonzalogdiez" }, "owner": "gonzalogdiez", "parent": -1, "preview": "", "referencers": [], "references": [], "title": "", "views": 24, "web_url": "https://chart-studio.plotly.com/~gonzalogdiez/2672/", "world_readable": true, "date_modified": "2025-08-27T20:27:30.784Z", "stars": { "results": [], "count": 0 }, "collaborators": { "results": [], "count": 0 }, "subfolder_count": null, "refresh_interval": null, "organize_view_url": "https://chart-studio.plotly.com/~gonzalogdiez/2672/", "current_user_permission": "read", "is_theme": null, "is_template": null, "autosize": true, "caption": "", "figure": { "data": [ { "line": { "color": "red" }, "mode": "lines", "name": "Construction, Mining, and Forestry Machinery and Equipment Rental and Leasing", "type": "scatter", "xsrc": "gonzalogdiez:2707:34a768", "ysrc": "gonzalogdiez:2707:88db9e" }, { "line": { "dash": "dot", "color": "red" }, "mode": "lines", "name": "forecast", "type": "scatter", "xsrc": "gonzalogdiez:2707:23e3d8", "ysrc": "gonzalogdiez:2707:25b9ad" } ], "layout": { "xaxis": { "range": [ "2017-01-01", "2026-07-31T00:00:00" ], "title": { "text": "Date" }, "rangeslider": { "visible": true }, "rangeselector": { "buttons": [ { "step": "year", "count": 5, "label": "5Y", "stepmode": "backward" }, { "step": "year", "count": 1, "label": "1Y", "stepmode": "backward" }, { "step": "all" } ] } }, "yaxis": { "title": { "text": "Index Value" } }, "legend": { "x": 1, "y": 1.02, "xanchor": "right", "yanchor": "bottom", "orientation": "h" }, "template": { "data": { "bar": [ { "type": "bar", "marker": { "line": { "color": "#E5ECF6", "width": 0.5 }, "pattern": { "size": 10, "fillmode": "overlay", "solidity": 0.2 } }, "error_x": { "color": "#2a3f5f" }, "error_y": { "color": "#2a3f5f" } } ], "pie": [ { "type": "pie", "automargin": true } ], "table": [ { "type": "table", "cells": { "fill": { "color": "#EBF0F8" }, "line": { "color": "white" } }, "header": { "fill": { "color": "#C8D4E3" }, "line": { "color": "white" } } } ], "carpet": [ { "type": "carpet", "aaxis": { "gridcolor": "white", "linecolor": "white", "endlinecolor": "#2a3f5f", "minorgridcolor": "white", "startlinecolor": "#2a3f5f" }, "baxis": { "gridcolor": "white", "linecolor": "white", "endlinecolor": "#2a3f5f", "minorgridcolor": "white", "startlinecolor": "#2a3f5f" } } ], "mesh3d": [ { "type": "mesh3d", "colorbar": { "ticks": "", "outlinewidth": 0 } } ], "contour": [ { "type": "contour", "colorbar": { "ticks": "", "outlinewidth": 0 }, "colorscale": [ [ 0.0, "#0d0887" ], [ 0.1111111111111111, "#46039f" ], [ 0.2222222222222222, "#7201a8" ], [ 0.3333333333333333, "#9c179e" ], [ 0.4444444444444444, "#bd3786" ], [ 0.5555555555555556, "#d8576b" ], [ 0.6666666666666666, "#ed7953" ], [ 0.7777777777777778, "#fb9f3a" ], [ 0.8888888888888888, "#fdca26" ], [ 1.0, "#f0f921" ] ] } ], "heatmap": [ { "type": "heatmap", "colorbar": { "ticks": "", "outlinewidth": 0 }, "colorscale": [ [ 0.0, "#0d0887" ], [ 0.1111111111111111, "#46039f" ], [ 0.2222222222222222, "#7201a8" ], [ 0.3333333333333333, "#9c179e" ], [ 0.4444444444444444, "#bd3786" ], [ 0.5555555555555556, "#d8576b" ], [ 0.6666666666666666, "#ed7953" ], [ 0.7777777777777778, "#fb9f3a" ], [ 0.8888888888888888, "#fdca26" ], [ 1.0, "#f0f921" ] ] } ], "scatter": [ { "type": "scatter", "fillpattern": { "size": 10, "fillmode": "overlay", "solidity": 0.2 } } ], "surface": [ { "type": "surface", "colorbar": { "ticks": "", "outlinewidth": 0 }, "colorscale": [ [ 0.0, "#0d0887" ], [ 0.1111111111111111, "#46039f" ], [ 0.2222222222222222, "#7201a8" ], [ 0.3333333333333333, "#9c179e" ], [ 0.4444444444444444, "#bd3786" ], [ 0.5555555555555556, "#d8576b" ], [ 0.6666666666666666, "#ed7953" ], [ 0.7777777777777778, "#fb9f3a" ], [ 0.8888888888888888, "#fdca26" ], [ 1.0, "#f0f921" ] ] } ], "barpolar": [ { "type": "barpolar", "marker": { "line": { "color": "#E5ECF6", "width": 0.5 }, "pattern": { "size": 10, "fillmode": "overlay", "solidity": 0.2 } } } ], "heatmapgl": [ { "type": "heatmapgl", "colorbar": { "ticks": "", "outlinewidth": 0 }, "colorscale": [ [ 0.0, "#0d0887" ], [ 0.1111111111111111, "#46039f" ], [ 0.2222222222222222, "#7201a8" ], [ 0.3333333333333333, "#9c179e" ], [ 0.4444444444444444, "#bd3786" ], [ 0.5555555555555556, "#d8576b" ], [ 0.6666666666666666, "#ed7953" ], [ 0.7777777777777778, "#fb9f3a" ], [ 0.8888888888888888, "#fdca26" ], [ 1.0, "#f0f921" ] ] } ], "histogram": [ { "type": "histogram", "marker": { "pattern": { "size": 10, "fillmode": "overlay", "solidity": 0.2 } } } ], "parcoords": [ { "line": { "colorbar": { "ticks": "", "outlinewidth": 0 } }, "type": "parcoords" } ], "scatter3d": [ { "line": { "colorbar": { "ticks": "", "outlinewidth": 0 } }, "type": "scatter3d", "marker": { "colorbar": { "ticks": "", "outlinewidth": 0 } } } ], "scattergl": [ { "type": "scattergl", "marker": { "colorbar": { "ticks": "", "outlinewidth": 0 } } } ], "choropleth": [ { "type": "choropleth", "colorbar": { "ticks": "", "outlinewidth": 0 } } ], "scattergeo": [ { "type": "scattergeo", "marker": { "colorbar": { "ticks": "", "outlinewidth": 0 } } } ], "histogram2d": [ { "type": "histogram2d", "colorbar": { "ticks": "", "outlinewidth": 0 }, "colorscale": [ [ 0.0, "#0d0887" ], [ 0.1111111111111111, "#46039f" ], [ 0.2222222222222222, "#7201a8" ], [ 0.3333333333333333, "#9c179e" ], [ 0.4444444444444444, "#bd3786" ], [ 0.5555555555555556, "#d8576b" ], [ 0.6666666666666666, "#ed7953" ], [ 0.7777777777777778, "#fb9f3a" ], [ 0.8888888888888888, "#fdca26" ], [ 1.0, "#f0f921" ] ] } ], "scatterpolar": [ { "type": "scatterpolar", "marker": { "colorbar": { "ticks": "", "outlinewidth": 0 } } } ], "contourcarpet": [ { "type": "contourcarpet", "colorbar": { "ticks": "", "outlinewidth": 0 } } ], "scattercarpet": [ { "type": "scattercarpet", "marker": { "colorbar": { "ticks": "", "outlinewidth": 0 } } } ], "scattermapbox": [ { "type": "scattermapbox", "marker": { "colorbar": { "ticks": "", "outlinewidth": 0 } } } ], "scatterpolargl": [ { "type": "scatterpolargl", "marker": { "colorbar": { "ticks": "", "outlinewidth": 0 } } } ], "scatterternary": [ { "type": "scatterternary", "marker": { "colorbar": { "ticks": "", "outlinewidth": 0 } } } ], "histogram2dcontour": [ { "type": "histogram2dcontour", "colorbar": { "ticks": "", "outlinewidth": 0 }, "colorscale": [ [ 0.0, "#0d0887" ], [ 0.1111111111111111, "#46039f" ], [ 0.2222222222222222, "#7201a8" ], [ 0.3333333333333333, "#9c179e" ], [ 0.4444444444444444, "#bd3786" ], [ 0.5555555555555556, "#d8576b" ], [ 0.6666666666666666, "#ed7953" ], [ 0.7777777777777778, "#fb9f3a" ], [ 0.8888888888888888, "#fdca26" ], [ 1.0, "#f0f921" ] ] } ] }, "layout": { "geo": { "bgcolor": "white", "showland": true, "lakecolor": "white", "landcolor": "#E5ECF6", "showlakes": true, "subunitcolor": "white" }, "font": { "color": "#2a3f5f" }, "polar": { "bgcolor": "#E5ECF6", "radialaxis": { "ticks": "", "gridcolor": "white", "linecolor": "white" }, "angularaxis": { "ticks": "", "gridcolor": "white", "linecolor": "white" } }, "scene": { "xaxis": { "ticks": "", "gridcolor": "white", "gridwidth": 2, "linecolor": "white", "zerolinecolor": "white", "showbackground": true, "backgroundcolor": "#E5ECF6" }, "yaxis": { "ticks": "", "gridcolor": "white", "gridwidth": 2, "linecolor": "white", "zerolinecolor": "white", "showbackground": true, "backgroundcolor": "#E5ECF6" }, "zaxis": { "ticks": "", "gridcolor": "white", "gridwidth": 2, "linecolor": "white", "zerolinecolor": "white", "showbackground": true, "backgroundcolor": "#E5ECF6" } }, "title": { "x": 0.05 }, "xaxis": { "ticks": "", "title": { "standoff": 15 }, "gridcolor": "white", "linecolor": "white", "automargin": true, "zerolinecolor": "white", "zerolinewidth": 2 }, "yaxis": { "ticks": "", "title": { "standoff": 15 }, "gridcolor": "white", "linecolor": "white", "automargin": true, "zerolinecolor": "white", "zerolinewidth": 2 }, "mapbox": { "style": "light" }, "ternary": { "aaxis": { "ticks": "", "gridcolor": "white", "linecolor": "white" }, "baxis": { "ticks": "", "gridcolor": "white", "linecolor": "white" }, "caxis": { "ticks": "", "gridcolor": "white", "linecolor": "white" }, "bgcolor": "#E5ECF6" }, "colorway": [ "#636efa", "#EF553B", "#00cc96", "#ab63fa", "#FFA15A", "#19d3f3", "#FF6692", "#B6E880", "#FF97FF", "#FECB52" ], "coloraxis": { "colorbar": { "ticks": "", "outlinewidth": 0 } }, "hovermode": "closest", "colorscale": { "diverging": [ [ 0, "#8e0152" ], [ 0.1, "#c51b7d" ], [ 0.2, "#de77ae" ], [ 0.3, "#f1b6da" ], [ 0.4, "#fde0ef" ], [ 0.5, "#f7f7f7" ], [ 0.6, "#e6f5d0" ], [ 0.7, "#b8e186" ], [ 0.8, "#7fbc41" ], [ 0.9, "#4d9221" ], [ 1, "#276419" ] ], "sequential": [ [ 0.0, "#0d0887" ], [ 0.1111111111111111, "#46039f" ], [ 0.2222222222222222, "#7201a8" ], [ 0.3333333333333333, "#9c179e" ], [ 0.4444444444444444, "#bd3786" ], [ 0.5555555555555556, "#d8576b" ], [ 0.6666666666666666, "#ed7953" ], [ 0.7777777777777778, "#fb9f3a" ], [ 0.8888888888888888, "#fdca26" ], [ 1.0, "#f0f921" ] ], "sequentialminus": [ [ 0.0, "#0d0887" ], [ 0.1111111111111111, "#46039f" ], [ 0.2222222222222222, "#7201a8" ], [ 0.3333333333333333, "#9c179e" ], [ 0.4444444444444444, "#bd3786" ], [ 0.5555555555555556, "#d8576b" ], [ 0.6666666666666666, "#ed7953" ], [ 0.7777777777777778, "#fb9f3a" ], [ 0.8888888888888888, "#fdca26" ], [ 1.0, "#f0f921" ] ] }, "hoverlabel": { "align": "left" }, "plot_bgcolor": "#E5ECF6", "paper_bgcolor": "white", "shapedefaults": { "line": { "color": "#2a3f5f" } }, "autotypenumbers": "strict", "annotationdefaults": { "arrowhead": 0, "arrowcolor": "#2a3f5f", "arrowwidth": 1 } } } } }, "height": null, "width": null, "user": { "profile_url": "https://chart-studio.plotly.com/~gonzalogdiez", "avatar_url": "https://storage.googleapis.com/plotly-prod-profiles/99.jpg", "background_url": "https://storage.googleapis.com/plotly-prod-profiles/bg-0.jpg", "bio": "", "nickname": "", "website": "", "stream_tokens": null, "feature_set_id": null, "csrf_token": null, "date_joined": "2024-06-18 13:29:38", "mapbox_access_tokens": null, "has_password": null, "username": "gonzalogdiez", "email": null, "is_active": null, "readonly": null, "is_dash_creator": null, "dash_created_count": null, "is_chart_creator": null, "charts_created_count": null } }, { "creation_time": "2025-08-01T17:23:53.944317Z", "comments": { "results": [], "count": 0 }, "parented": true, "embed_url": "https://chart-studio.plotly.com/~jaevic/21.embed", "fid": "jaevic:21", "filename": "Plot 21", "filetype": "plot", "img_url": "https://storage.googleapis.com/plotly-prod-images/jaevic/21/9_H3VQZ22M2NWAGRCP5HDW6WH2X5X4R0.png", "image_urls": { "default": "https://storage.googleapis.com/plotly-prod-images/jaevic/21/2_OUNW2LK2VPOXHYDCEZBZNLQ33MTOL9.png", "block-thumb": "https://storage.googleapis.com/plotly-prod-images/jaevic/21/8_7VYZC49QPRNMERQ3Q3ZTH50YNXW75U.png", "list-thumb": "https://storage.googleapis.com/plotly-prod-images/jaevic/21/9_H3VQZ22M2NWAGRCP5HDW6WH2X5X4R0.png" }, "api_urls": { "files": "https://api.plotly.com/v2/files/jaevic:21", "plots": "https://api.plotly.com/v2/plots/jaevic:21", "parent": "https://api.plotly.com/v2/folders/home?user=jaevic" }, "owner": "jaevic", "parent": -1, "preview": "", "referencers": [], "references": [], "title": "", "views": 1, "web_url": "https://chart-studio.plotly.com/~jaevic/21/", "world_readable": true, "date_modified": "2025-08-01T17:23:53.958Z", "stars": { "results": [], "count": 0 }, "collaborators": { "results": [], "count": 0 }, "subfolder_count": null, "refresh_interval": null, "organize_view_url": "https://chart-studio.plotly.com/~jaevic/21/", "current_user_permission": "read", "is_theme": null, "is_template": false, "autosize": true, "caption": "", "figure": { "data": [ { "meta": { "columnNames": { "x": "Wavelength (NM)", "y": "Geranium % of Max" } }, "mode": "lines", "type": "scatter", "xsrc": "jaevic:20:e1456f", "ysrc": "jaevic:20:09c192" } ], "frames": [], "layout": { "title": { "text": "Relative Absorbance Spectrum of Geranium Pigments (% of Maximum Absorbance)”\n" }, "xaxis": { "type": "linear", "range": [ 400, 700 ], "title": { "text": "Wavelength (NM)" }, "autorange": true }, "yaxis": { "type": "linear", "range": [ -1.0166666666666684, 105.31666666666666 ], "title": { "text": "Geranium % of Max " }, "autorange": true }, "autosize": true, "template": { "data": { "bar": [ { "type": "bar", "marker": { "colorbar": { "ticks": "", "outlinewidth": 0 } } } ], "table": [ { "type": "table", "cells": { "fill": { "color": "#EBF0F8" }, "line": { "color": "white" } }, "header": { "fill": { "color": "#C8D4E3" }, "line": { "color": "white" } } } ], "carpet": [ { "type": "carpet", "aaxis": { "gridcolor": "#C8D4E3", "linecolor": "#C8D4E3", "endlinecolor": "#2a3f5f", "minorgridcolor": "#C8D4E3", "startlinecolor": "#2a3f5f" }, "baxis": { "gridcolor": "#C8D4E3", "linecolor": "#C8D4E3", "endlinecolor": "#2a3f5f", "minorgridcolor": "#C8D4E3", "startlinecolor": "#2a3f5f" } } ], "mesh3d": [ { "type": "mesh3d", "colorbar": { "ticks": "", "outlinewidth": 0 } } ], "contour": [ { "type": "contour", "colorbar": { "ticks": "", "outlinewidth": 0 }, "autocolorscale": true } ], "heatmap": [ { "type": "heatmap", "colorbar": { "ticks": "", "outlinewidth": 0 }, "autocolorscale": true } ], "scatter": [ { "type": "scatter", "marker": { "colorbar": { "ticks": "", "outlinewidth": 0 } } } ], "surface": [ { "type": "surface", "colorbar": { "ticks": "", "outlinewidth": 0 } } ], "heatmapgl": [ { "type": "heatmapgl", "colorbar": { "ticks": "", "outlinewidth": 0 } } ], "histogram": [ { "type": "histogram", "marker": { "colorbar": { "ticks": "", "outlinewidth": 0 } } } ], "parcoords": [ { "line": { "colorbar": { "ticks": "", "outlinewidth": 0 } }, "type": "parcoords" } ], "scatter3d": [ { "type": "scatter3d", "marker": { "colorbar": { "ticks": "", "outlinewidth": 0 } } } ], "scattergl": [ { "type": "scattergl", "marker": { "colorbar": { "ticks": "", "outlinewidth": 0 } } } ], "choropleth": [ { "type": "choropleth", "colorbar": { "ticks": "", "outlinewidth": 0 } } ], "scattergeo": [ { "type": "scattergeo", "marker": { "colorbar": { "ticks": "", "outlinewidth": 0 } } } ], "histogram2d": [ { "type": "histogram2d", "colorbar": { "ticks": "", "outlinewidth": 0 }, "autocolorscale": true } ], "scatterpolar": [ { "type": "scatterpolar", "marker": { "colorbar": { "ticks": "", "outlinewidth": 0 } } } ], "contourcarpet": [ { "type": "contourcarpet", "colorbar": { "ticks": "", "outlinewidth": 0 } } ], "scattercarpet": [ { "type": "scattercarpet", "marker": { "colorbar": { "ticks": "", "outlinewidth": 0 } } } ], "scattermapbox": [ { "type": "scattermapbox", "marker": { "colorbar": { "ticks": "", "outlinewidth": 0 } } } ], "scatterpolargl": [ { "type": "scatterpolargl", "marker": { "colorbar": { "ticks": "", "outlinewidth": 0 } } } ], "scatterternary": [ { "type": "scatterternary", "marker": { "colorbar": { "ticks": "", "outlinewidth": 0 } } } ], "histogram2dcontour": [ { "type": "histogram2dcontour", "colorbar": { "ticks": "", "outlinewidth": 0 }, "autocolorscale": true } ] }, "layout": { "geo": { "bgcolor": "white", "showland": true, "lakecolor": "white", "landcolor": "white", "showlakes": true, "subunitcolor": "#C8D4E3" }, "font": { "color": "#2a3f5f" }, "polar": { "bgcolor": "white", "radialaxis": { "ticks": "", "gridcolor": "#EBF0F8", "linecolor": "#EBF0F8" }, "angularaxis": { "ticks": "", "gridcolor": "#EBF0F8", "linecolor": "#EBF0F8" } }, "scene": { "xaxis": { "ticks": "", "gridcolor": "#DFE8F3", "gridwidth": 2, "linecolor": "#EBF0F8", "zerolinecolor": "#EBF0F8", "showbackground": true, "backgroundcolor": "white" }, "yaxis": { "ticks": "", "gridcolor": "#DFE8F3", "gridwidth": 2, "linecolor": "#EBF0F8", "zerolinecolor": "#EBF0F8", "showbackground": true, "backgroundcolor": "white" }, "zaxis": { "ticks": "", "gridcolor": "#DFE8F3", "gridwidth": 2, "linecolor": "#EBF0F8", "zerolinecolor": "#EBF0F8", "showbackground": true, "backgroundcolor": "white" } }, "title": { "x": 0.05 }, "xaxis": { "ticks": "", "gridcolor": "#EBF0F8", "linecolor": "#EBF0F8", "automargin": true, "zerolinecolor": "#EBF0F8", "zerolinewidth": 2 }, "yaxis": { "ticks": "", "gridcolor": "#EBF0F8", "linecolor": "#EBF0F8", "automargin": true, "zerolinecolor": "#EBF0F8", "zerolinewidth": 2 }, "ternary": { "aaxis": { "ticks": "", "gridcolor": "#DFE8F3", "linecolor": "#A2B1C6" }, "baxis": { "ticks": "", "gridcolor": "#DFE8F3", "linecolor": "#A2B1C6" }, "caxis": { "ticks": "", "gridcolor": "#DFE8F3", "linecolor": "#A2B1C6" }, "bgcolor": "white" }, "colorway": [ "#636efa", "#EF553B", "#00cc96", "#ab63fa", "#19d3f3", "#e763fa", "#fecb52", "#ffa15a", "#ff6692", "#b6e880" ], "hovermode": "closest", "colorscale": { "diverging": [ [ 0, "#8e0152" ], [ 0.1, "#c51b7d" ], [ 0.2, "#de77ae" ], [ 0.3, "#f1b6da" ], [ 0.4, "#fde0ef" ], [ 0.5, "#f7f7f7" ], [ 0.6, "#e6f5d0" ], [ 0.7, "#b8e186" ], [ 0.8, "#7fbc41" ], [ 0.9, "#4d9221" ], [ 1, "#276419" ] ], "sequential": [ [ 0, "#0508b8" ], [ 0.0893854748603352, "#1910d8" ], [ 0.1787709497206704, "#3c19f0" ], [ 0.2681564245810056, "#6b1cfb" ], [ 0.3575418994413408, "#981cfd" ], [ 0.44692737430167595, "#bf1cfd" ], [ 0.5363128491620112, "#dd2bfd" ], [ 0.6256983240223464, "#f246fe" ], [ 0.7150837988826816, "#fc67fd" ], [ 0.8044692737430168, "#fe88fc" ], [ 0.8938547486033519, "#fea5fd" ], [ 0.9832402234636871, "#febefe" ], [ 1, "#fec3fe" ] ], "sequentialminus": [ [ 0, "#0508b8" ], [ 0.0893854748603352, "#1910d8" ], [ 0.1787709497206704, "#3c19f0" ], [ 0.2681564245810056, "#6b1cfb" ], [ 0.3575418994413408, "#981cfd" ], [ 0.44692737430167595, "#bf1cfd" ], [ 0.5363128491620112, "#dd2bfd" ], [ 0.6256983240223464, "#f246fe" ], [ 0.7150837988826816, "#fc67fd" ], [ 0.8044692737430168, "#fe88fc" ], [ 0.8938547486033519, "#fea5fd" ], [ 0.9832402234636871, "#febefe" ], [ 1, "#fec3fe" ] ] }, "plot_bgcolor": "white", "paper_bgcolor": "white", "shapedefaults": { "line": { "width": 0 }, "opacity": 0.4, "fillcolor": "#506784" }, "annotationdefaults": { "arrowhead": 0, "arrowcolor": "#506784", "arrowwidth": 1 } }, "themeRef": "PLOTLY_WHITE" } } }, "height": null, "width": null, "user": { "profile_url": "https://chart-studio.plotly.com/~jaevic", "avatar_url": "https://storage.googleapis.com/plotly-prod-profiles/11.jpg", "background_url": "https://storage.googleapis.com/plotly-prod-profiles/bg-4.jpg", "bio": "", "nickname": "", "website": "", "stream_tokens": null, "feature_set_id": null, "csrf_token": null, "date_joined": "2025-07-19 16:38:56", "mapbox_access_tokens": null, "has_password": null, "username": "jaevic", "email": null, "is_active": null, "readonly": null, "is_dash_creator": null, "dash_created_count": null, "is_chart_creator": null, "charts_created_count": null } }, { "creation_time": "2025-08-01T17:18:34.853521Z", "comments": { "results": [], "count": 0 }, "parented": true, "embed_url": "https://chart-studio.plotly.com/~jaevic/19.embed", "fid": "jaevic:19", "filename": "Plot 19", "filetype": "plot", "img_url": "https://api.plotly.com/v2/files/jaevic:19/image?image_name=list-thumb", "image_urls": { "default": "https://storage.googleapis.com/plotly-prod-images/jaevic/19/2_3HTH58296NWYXK22NZQC22FJVBNJ91.png", "block-thumb": "https://storage.googleapis.com/plotly-prod-images/jaevic/19/8_OL1X2X7083BCSKFLZTTJKQRXY17FV6.png", "list-thumb": "https://api.plotly.com/v2/files/jaevic:19/image?image_name=list-thumb" }, "api_urls": { "files": "https://api.plotly.com/v2/files/jaevic:19", "plots": "https://api.plotly.com/v2/plots/jaevic:19", "parent": "https://api.plotly.com/v2/folders/home?user=jaevic" }, "owner": "jaevic", "parent": -1, "preview": "", "referencers": [], "references": [], "title": "", "views": 0, "web_url": "https://chart-studio.plotly.com/~jaevic/19/", "world_readable": true, "date_modified": "2025-08-01T17:18:34.868Z", "stars": { "results": [], "count": 0 }, "collaborators": { "results": [], "count": 0 }, "subfolder_count": null, "refresh_interval": null, "organize_view_url": "https://chart-studio.plotly.com/~jaevic/19/", "current_user_permission": "read", "is_theme": null, "is_template": false, "autosize": true, "caption": "", "figure": { "data": [ { "meta": { "columnNames": { "x": "Wavelength (NM)", "y": "Spirulina % of Max" } }, "mode": "lines", "type": "scatter", "xsrc": "jaevic:18:cb1f22", "ysrc": "jaevic:18:251e2c" } ], "frames": [], "layout": { "title": { "text": "Relative Absorbance Spectrum of Spirulina Pigments (% of Maximum Absorbance)" }, "xaxis": { "type": "linear", "range": [ 400, 700 ], "title": { "text": "Wavelength (NM) " }, "autorange": true }, "yaxis": { "type": "linear", "range": [ 4.049999999999999, 105.05 ], "title": { "text": "Spirulina % of Max " }, "autorange": true }, "autosize": true, "template": { "data": { "bar": [ { "type": "bar", "marker": { "colorbar": { "ticks": "", "outlinewidth": 0 } } } ], "table": [ { "type": "table", "cells": { "fill": { "color": "#EBF0F8" }, "line": { "color": "white" } }, "header": { "fill": { "color": "#C8D4E3" }, "line": { "color": "white" } } } ], "carpet": [ { "type": "carpet", "aaxis": { "gridcolor": "#C8D4E3", "linecolor": "#C8D4E3", "endlinecolor": "#2a3f5f", "minorgridcolor": "#C8D4E3", "startlinecolor": "#2a3f5f" }, "baxis": { "gridcolor": "#C8D4E3", "linecolor": "#C8D4E3", "endlinecolor": "#2a3f5f", "minorgridcolor": "#C8D4E3", "startlinecolor": "#2a3f5f" } } ], "mesh3d": [ { "type": "mesh3d", "colorbar": { "ticks": "", "outlinewidth": 0 } } ], "contour": [ { "type": "contour", "colorbar": { "ticks": "", "outlinewidth": 0 }, "autocolorscale": true } ], "heatmap": [ { "type": "heatmap", "colorbar": { "ticks": "", "outlinewidth": 0 }, "autocolorscale": true } ], "scatter": [ { "type": "scatter", "marker": { "colorbar": { "ticks": "", "outlinewidth": 0 } } } ], "surface": [ { "type": "surface", "colorbar": { "ticks": "", "outlinewidth": 0 } } ], "heatmapgl": [ { "type": "heatmapgl", "colorbar": { "ticks": "", "outlinewidth": 0 } } ], "histogram": [ { "type": "histogram", "marker": { "colorbar": { "ticks": "", "outlinewidth": 0 } } } ], "parcoords": [ { "line": { "colorbar": { "ticks": "", "outlinewidth": 0 } }, "type": "parcoords" } ], "scatter3d": [ { "type": "scatter3d", "marker": { "colorbar": { "ticks": "", "outlinewidth": 0 } } } ], "scattergl": [ { "type": "scattergl", "marker": { "colorbar": { "ticks": "", "outlinewidth": 0 } } } ], "choropleth": [ { "type": "choropleth", "colorbar": { "ticks": "", "outlinewidth": 0 } } ], "scattergeo": [ { "type": "scattergeo", "marker": { "colorbar": { "ticks": "", "outlinewidth": 0 } } } ], "histogram2d": [ { "type": "histogram2d", "colorbar": { "ticks": "", "outlinewidth": 0 }, "autocolorscale": true } ], "scatterpolar": [ { "type": "scatterpolar", "marker": { "colorbar": { "ticks": "", "outlinewidth": 0 } } } ], "contourcarpet": [ { "type": "contourcarpet", "colorbar": { "ticks": "", "outlinewidth": 0 } } ], "scattercarpet": [ { "type": "scattercarpet", "marker": { "colorbar": { "ticks": "", "outlinewidth": 0 } } } ], "scattermapbox": [ { "type": "scattermapbox", "marker": { "colorbar": { "ticks": "", "outlinewidth": 0 } } } ], "scatterpolargl": [ { "type": "scatterpolargl", "marker": { "colorbar": { "ticks": "", "outlinewidth": 0 } } } ], "scatterternary": [ { "type": "scatterternary", "marker": { "colorbar": { "ticks": "", "outlinewidth": 0 } } } ], "histogram2dcontour": [ { "type": "histogram2dcontour", "colorbar": { "ticks": "", "outlinewidth": 0 }, "autocolorscale": true } ] }, "layout": { "geo": { "bgcolor": "white", "showland": true, "lakecolor": "white", "landcolor": "white", "showlakes": true, "subunitcolor": "#C8D4E3" }, "font": { "color": "#2a3f5f" }, "polar": { "bgcolor": "white", "radialaxis": { "ticks": "", "gridcolor": "#EBF0F8", "linecolor": "#EBF0F8" }, "angularaxis": { "ticks": "", "gridcolor": "#EBF0F8", "linecolor": "#EBF0F8" } }, "scene": { "xaxis": { "ticks": "", "gridcolor": "#DFE8F3", "gridwidth": 2, "linecolor": "#EBF0F8", "zerolinecolor": "#EBF0F8", "showbackground": true, "backgroundcolor": "white" }, "yaxis": { "ticks": "", "gridcolor": "#DFE8F3", "gridwidth": 2, "linecolor": "#EBF0F8", "zerolinecolor": "#EBF0F8", "showbackground": true, "backgroundcolor": "white" }, "zaxis": { "ticks": "", "gridcolor": "#DFE8F3", "gridwidth": 2, "linecolor": "#EBF0F8", "zerolinecolor": "#EBF0F8", "showbackground": true, "backgroundcolor": "white" } }, "title": { "x": 0.05 }, "xaxis": { "ticks": "", "gridcolor": "#EBF0F8", "linecolor": "#EBF0F8", "automargin": true, "zerolinecolor": "#EBF0F8", "zerolinewidth": 2 }, "yaxis": { "ticks": "", "gridcolor": "#EBF0F8", "linecolor": "#EBF0F8", "automargin": true, "zerolinecolor": "#EBF0F8", "zerolinewidth": 2 }, "ternary": { "aaxis": { "ticks": "", "gridcolor": "#DFE8F3", "linecolor": "#A2B1C6" }, "baxis": { "ticks": "", "gridcolor": "#DFE8F3", "linecolor": "#A2B1C6" }, "caxis": { "ticks": "", "gridcolor": "#DFE8F3", "linecolor": "#A2B1C6" }, "bgcolor": "white" }, "colorway": [ "#636efa", "#EF553B", "#00cc96", "#ab63fa", "#19d3f3", "#e763fa", "#fecb52", "#ffa15a", "#ff6692", "#b6e880" ], "hovermode": "closest", "colorscale": { "diverging": [ [ 0, "#8e0152" ], [ 0.1, "#c51b7d" ], [ 0.2, "#de77ae" ], [ 0.3, "#f1b6da" ], [ 0.4, "#fde0ef" ], [ 0.5, "#f7f7f7" ], [ 0.6, "#e6f5d0" ], [ 0.7, "#b8e186" ], [ 0.8, "#7fbc41" ], [ 0.9, "#4d9221" ], [ 1, "#276419" ] ], "sequential": [ [ 0, "#0508b8" ], [ 0.0893854748603352, "#1910d8" ], [ 0.1787709497206704, "#3c19f0" ], [ 0.2681564245810056, "#6b1cfb" ], [ 0.3575418994413408, "#981cfd" ], [ 0.44692737430167595, "#bf1cfd" ], [ 0.5363128491620112, "#dd2bfd" ], [ 0.6256983240223464, "#f246fe" ], [ 0.7150837988826816, "#fc67fd" ], [ 0.8044692737430168, "#fe88fc" ], [ 0.8938547486033519, "#fea5fd" ], [ 0.9832402234636871, "#febefe" ], [ 1, "#fec3fe" ] ], "sequentialminus": [ [ 0, "#0508b8" ], [ 0.0893854748603352, "#1910d8" ], [ 0.1787709497206704, "#3c19f0" ], [ 0.2681564245810056, "#6b1cfb" ], [ 0.3575418994413408, "#981cfd" ], [ 0.44692737430167595, "#bf1cfd" ], [ 0.5363128491620112, "#dd2bfd" ], [ 0.6256983240223464, "#f246fe" ], [ 0.7150837988826816, "#fc67fd" ], [ 0.8044692737430168, "#fe88fc" ], [ 0.8938547486033519, "#fea5fd" ], [ 0.9832402234636871, "#febefe" ], [ 1, "#fec3fe" ] ] }, "plot_bgcolor": "white", "paper_bgcolor": "white", "shapedefaults": { "line": { "width": 0 }, "opacity": 0.4, "fillcolor": "#506784" }, "annotationdefaults": { "arrowhead": 0, "arrowcolor": "#506784", "arrowwidth": 1 } }, "themeRef": "PLOTLY_WHITE" } } }, "height": null, "width": null, "user": { "profile_url": "https://chart-studio.plotly.com/~jaevic", "avatar_url": "https://storage.googleapis.com/plotly-prod-profiles/11.jpg", "background_url": "https://storage.googleapis.com/plotly-prod-profiles/bg-4.jpg", "bio": "", "nickname": "", "website": "", "stream_tokens": null, "feature_set_id": null, "csrf_token": null, "date_joined": "2025-07-19 16:38:56", "mapbox_access_tokens": null, "has_password": null, "username": "jaevic", "email": null, "is_active": null, "readonly": null, "is_dash_creator": null, "dash_created_count": null, "is_chart_creator": null, "charts_created_count": null } }, { "creation_time": "2025-08-01T17:18:13.911529Z", "comments": { "results": [], "count": 0 }, "parented": true, "embed_url": "https://chart-studio.plotly.com/~ddsmghorab/1.embed", "fid": "ddsmghorab:1", "filename": "Plot 1", "filetype": "plot", "img_url": "https://api.plotly.com/v2/files/ddsmghorab:1/image?image_name=list-thumb", "image_urls": { "default": "https://storage.googleapis.com/plotly-prod-images/ddsmghorab/1/2_EPBLRNR5E4JG24UZX3RTNPEAOZFISV.png", "block-thumb": "https://storage.googleapis.com/plotly-prod-images/ddsmghorab/1/8_LU5YYF6QR1OPVC6HPMF8N0AP15TQG6.png", "list-thumb": "https://api.plotly.com/v2/files/ddsmghorab:1/image?image_name=list-thumb" }, "api_urls": { "files": "https://api.plotly.com/v2/files/ddsmghorab:1", "plots": "https://api.plotly.com/v2/plots/ddsmghorab:1", "parent": "https://api.plotly.com/v2/folders/home?user=ddsmghorab" }, "owner": "ddsmghorab", "parent": -1, "preview": "", "referencers": [], "references": [], "title": "", "views": 0, "web_url": "https://chart-studio.plotly.com/~ddsmghorab/1/", "world_readable": true, "date_modified": "2025-08-01T17:18:13.923Z", "stars": { "results": [], "count": 0 }, "collaborators": { "results": [], "count": 0 }, "subfolder_count": null, "refresh_interval": null, "organize_view_url": "https://chart-studio.plotly.com/~ddsmghorab/1/", "current_user_permission": "read", "is_theme": null, "is_template": false, "autosize": true, "caption": "", "figure": { "data": [ { "line": { "width": 2 }, "meta": { "columnNames": { "y": "Intergonial", "text": "Intercondylar" } }, "mode": "markers", "name": "<b>Intercondylar deviation (mm)</b>", "type": "box", "ysrc": "ddsmghorab:0:baf677", "boxmean": true, "hoveron": "boxes+points", "notched": false, "opacity": 1, "textsrc": "ddsmghorab:0:4fa597", "boxpoints": false, "orientation": "v" }, { "meta": { "columnNames": { "y": "Intergonial" } }, "name": "<b>Intergonial deviation (mm)</b>", "type": "box", "ysrc": "ddsmghorab:0:baf677", "boxmean": true, "boxpoints": false }, { "meta": { "columnNames": { "y": "AP" } }, "name": "<b>AP deviation (mm)</b>", "type": "box", "ysrc": "ddsmghorab:0:cae01e", "boxmean": true, "boxpoints": false }, { "meta": { "columnNames": { "y": "OverallMean" } }, "name": "<b>Overall mean deviation (mm)</b>", "type": "box", "ysrc": "ddsmghorab:0:8c45ba", "boxmean": true, "boxpoints": false }, { "meta": { "columnNames": { "y": "RMSE" } }, "name": "<b>RMSE (mm)</b>", "type": "box", "ysrc": "ddsmghorab:0:625cba", "boxmean": true, "boxpoints": false }, { "meta": { "columnNames": { "y": "GonialAngle" } }, "name": "<b>Gonial angle deviation (degrees)</b>", "type": "box", "ysrc": "ddsmghorab:0:29c6c0", "boxmean": true, "boxpoints": false } ], "frames": [], "layout": { "font": { "size": 12, "family": "Roboto" }, "title": { "text": "<br>" }, "xaxis": { "side": "bottom", "type": "category", "range": [ -1.0188172043010753, 6.018817204301075 ], "ticks": "", "tickson": "labels", "showgrid": true, "showline": false, "zeroline": false, "autorange": true, "gridwidth": 1, "automargin": true, "rangeslider": { "range": [ -0.5, 5.5 ], "yaxis": {}, "visible": false, "autorange": true }, "zerolinecolor": "rgb(5, 4, 4)", "zerolinewidth": 14, "showticklabels": true }, "yaxis": { "type": "linear", "range": [ -0.07, 3.07 ], "title": { "font": { "size": 18 }, "text": "<b>Deviation</b>" }, "autorange": true }, "shapes": [ { "x0": -1, "x1": 6, "y0": 2, "y1": 2, "line": { "dash": "solid", "color": "rgb(240, 14, 14)", "width": 4 }, "type": "line", "opacity": 1, "fillcolor": "#7f7f7f" }, { "x0": 4.5, "x1": 4.5, "y0": 0, "y1": 3, "line": { "dash": "dashdot", "color": "#444444", "width": 7 }, "type": "line", "xref": "x", "opacity": 0.39, "fillcolor": "#7f7f7f" } ], "boxmode": "overlay", "modebar": { "orientation": "h" }, "autosize": true, "dragmode": "zoom", "template": { "data": { "bar": [ { "type": "bar", "marker": { "colorbar": { "ticks": "outside", "ticklen": 8, "tickcolor": "rgb(36,36,36)", "tickwidth": 2, "outlinewidth": 0 } } } ], "table": [ { "type": "table", "cells": { "fill": { "color": "rgb(231,231,240)" }, "line": { "color": "white" } }, "header": { "fill": { "color": "rgb(183,183,191)" }, "line": { "color": "white" } } } ], "carpet": [ { "type": "carpet", "aaxis": { "gridcolor": "white", "linecolor": "white", "endlinecolor": "rgb(36,36,36)", "minorgridcolor": "white", "startlinecolor": "rgb(36,36,36)" }, "baxis": { "gridcolor": "white", "linecolor": "white", "endlinecolor": "rgb(36,36,36)", "minorgridcolor": "white", "startlinecolor": "rgb(36,36,36)" } } ], "mesh3d": [ { "type": "mesh3d", "colorbar": { "ticks": "outside", "ticklen": 8, "tickcolor": "rgb(36,36,36)", "tickwidth": 2, "outlinewidth": 0 } } ], "contour": [ { "type": "contour", "colorbar": { "ticks": "outside", "ticklen": 8, "tickcolor": "rgb(36,36,36)", "tickwidth": 2, "outlinewidth": 0 }, "autocolorscale": true } ], "heatmap": [ { "type": "heatmap", "colorbar": { "ticks": "outside", "ticklen": 8, "tickcolor": "rgb(36,36,36)", "tickwidth": 2, "outlinewidth": 0 }, "autocolorscale": true } ], "scatter": [ { "type": "scatter", "marker": { "colorbar": { "ticks": "outside", "ticklen": 8, "tickcolor": "rgb(36,36,36)", "tickwidth": 2, "outlinewidth": 0 } } } ], "surface": [ { "type": "surface", "colorbar": { "ticks": "outside", "ticklen": 8, "tickcolor": "rgb(36,36,36)", "tickwidth": 2, "outlinewidth": 0 } } ], "heatmapgl": [ { "type": "heatmapgl", "colorbar": { "ticks": "outside", "ticklen": 8, "tickcolor": "rgb(36,36,36)", "tickwidth": 2, "outlinewidth": 0 } } ], "histogram": [ { "type": "histogram", "marker": { "colorbar": { "ticks": "outside", "ticklen": 8, "tickcolor": "rgb(36,36,36)", "tickwidth": 2, "outlinewidth": 0 } } } ], "parcoords": [ { "line": { "colorbar": { "ticks": "outside", "ticklen": 8, "tickcolor": "rgb(36,36,36)", "tickwidth": 2, "outlinewidth": 0 } }, "type": "parcoords" } ], "scatter3d": [ { "type": "scatter3d", "marker": { "colorbar": { "ticks": "outside", "ticklen": 8, "tickcolor": "rgb(36,36,36)", "tickwidth": 2, "outlinewidth": 0 } } } ], "scattergl": [ { "type": "scattergl", "marker": { "colorbar": { "ticks": "outside", "ticklen": 8, "tickcolor": "rgb(36,36,36)", "tickwidth": 2, "outlinewidth": 0 } } } ], "choropleth": [ { "type": "choropleth", "colorbar": { "ticks": "outside", "ticklen": 8, "tickcolor": "rgb(36,36,36)", "tickwidth": 2, "outlinewidth": 0 } } ], "scattergeo": [ { "type": "scattergeo", "marker": { "colorbar": { "ticks": "outside", "ticklen": 8, "tickcolor": "rgb(36,36,36)", "tickwidth": 2, "outlinewidth": 0 } } } ], "histogram2d": [ { "type": "histogram2d", "colorbar": { "ticks": "outside", "ticklen": 8, "tickcolor": "rgb(36,36,36)", "tickwidth": 2, "outlinewidth": 0 }, "autocolorscale": true } ], "scatterpolar": [ { "type": "scatterpolar", "marker": { "colorbar": { "ticks": "outside", "ticklen": 8, "tickcolor": "rgb(36,36,36)", "tickwidth": 2, "outlinewidth": 0 } } } ], "contourcarpet": [ { "type": "contourcarpet", "colorbar": { "ticks": "outside", "ticklen": 8, "tickcolor": "rgb(36,36,36)", "tickwidth": 2, "outlinewidth": 0 } } ], "scattercarpet": [ { "type": "scattercarpet", "marker": { "colorbar": { "ticks": "outside", "ticklen": 8, "tickcolor": "rgb(36,36,36)", "tickwidth": 2, "outlinewidth": 0 } } } ], "scattermapbox": [ { "type": "scattermapbox", "marker": { "colorbar": { "ticks": "outside", "ticklen": 8, "tickcolor": "rgb(36,36,36)", "tickwidth": 2, "outlinewidth": 0 } } } ], "scatterpolargl": [ { "type": "scatterpolargl", "marker": { "colorbar": { "ticks": "outside", "ticklen": 8, "tickcolor": "rgb(36,36,36)", "tickwidth": 2, "outlinewidth": 0 } } } ], "scatterternary": [ { "type": "scatterternary", "marker": { "colorbar": { "ticks": "outside", "ticklen": 8, "tickcolor": "rgb(36,36,36)", "tickwidth": 2, "outlinewidth": 0 } } } ], "histogram2dcontour": [ { "type": "histogram2dcontour", "colorbar": { "ticks": "outside", "ticklen": 8, "tickcolor": "rgb(36,36,36)", "tickwidth": 2, "outlinewidth": 0 }, "autocolorscale": true } ] }, "layout": { "geo": { "bgcolor": "white", "showland": true, "lakecolor": "white", "landcolor": "rgb(234,234,242)", "showlakes": true, "subunitcolor": "white" }, "font": { "color": "rgb(36,36,36)" }, "polar": { "bgcolor": "rgb(234,234,242)", "radialaxis": { "ticks": "", "showgrid": true, "gridcolor": "white", "linecolor": "white" }, "angularaxis": { "ticks": "", "showgrid": true, "gridcolor": "white", "linecolor": "white" } }, "scene": { "xaxis": { "ticks": "", "showgrid": true, "gridcolor": "white", "gridwidth": 2, "linecolor": "white", "zerolinecolor": "white", "showbackground": true, "backgroundcolor": "rgb(234,234,242)" }, "yaxis": { "ticks": "", "showgrid": true, "gridcolor": "white", "gridwidth": 2, "linecolor": "white", "zerolinecolor": "white", "showbackground": true, "backgroundcolor": "rgb(234,234,242)" }, "zaxis": { "ticks": "", "showgrid": true, "gridcolor": "white", "gridwidth": 2, "linecolor": "white", "zerolinecolor": "white", "showbackground": true, "backgroundcolor": "rgb(234,234,242)" } }, "xaxis": { "ticks": "", "showgrid": true, "gridcolor": "white", "linecolor": "white", "automargin": true, "zerolinecolor": "white" }, "yaxis": { "ticks": "", "showgrid": true, "gridcolor": "white", "linecolor": "white", "automargin": true, "zerolinecolor": "white" }, "ternary": { "aaxis": { "ticks": "", "showgrid": true, "gridcolor": "white", "linecolor": "white" }, "baxis": { "ticks": "", "showgrid": true, "gridcolor": "white", "linecolor": "white" }, "caxis": { "ticks": "", "showgrid": true, "gridcolor": "white", "linecolor": "white" }, "bgcolor": "rgb(234,234,242)" }, "colorway": [ "rgb(76,114,176)", "rgb(221,132,82)", "rgb(85,168,104)", "rgb(196,78,82)", "rgb(129,114,179)", "rgb(147,120,96)", "rgb(218,139,195)", "rgb(140,140,140)", "rgb(204,185,116)", "rgb(100,181,205)" ], "hovermode": "closest", "colorscale": { "diverging": [ [ 0, "#67001f" ], [ 0.1, "#b2182b" ], [ 0.2, "#d6604d" ], [ 0.3, "#f4a582" ], [ 0.4, "#fddbc7" ], [ 0.5, "#f7f7f7" ], [ 0.6, "#d1e5f0" ], [ 0.7, "#92c5de" ], [ 0.8, "#4393c3" ], [ 0.9, "#2166ac" ], [ 1, "#053061" ] ], "sequential": [ [ 0, "rgb(2,4,25)" ], [ 0.06274509803921569, "rgb(24,15,41)" ], [ 0.12549019607843137, "rgb(47,23,57)" ], [ 0.18823529411764706, "rgb(71,28,72)" ], [ 0.25098039215686274, "rgb(97,30,82)" ], [ 0.3137254901960784, "rgb(123,30,89)" ], [ 0.3764705882352941, "rgb(150,27,91)" ], [ 0.4392156862745098, "rgb(177,22,88)" ], [ 0.5019607843137255, "rgb(203,26,79)" ], [ 0.5647058823529412, "rgb(223,47,67)" ], [ 0.6274509803921569, "rgb(236,76,61)" ], [ 0.6901960784313725, "rgb(242,107,73)" ], [ 0.7529411764705882, "rgb(244,135,95)" ], [ 0.8156862745098039, "rgb(245,162,122)" ], [ 0.8784313725490196, "rgb(246,188,153)" ], [ 0.9411764705882353, "rgb(247,212,187)" ], [ 1, "rgb(250,234,220)" ] ], "sequentialminus": [ [ 0, "rgb(2,4,25)" ], [ 0.06274509803921569, "rgb(24,15,41)" ], [ 0.12549019607843137, "rgb(47,23,57)" ], [ 0.18823529411764706, "rgb(71,28,72)" ], [ 0.25098039215686274, "rgb(97,30,82)" ], [ 0.3137254901960784, "rgb(123,30,89)" ], [ 0.3764705882352941, "rgb(150,27,91)" ], [ 0.4392156862745098, "rgb(177,22,88)" ], [ 0.5019607843137255, "rgb(203,26,79)" ], [ 0.5647058823529412, "rgb(223,47,67)" ], [ 0.6274509803921569, "rgb(236,76,61)" ], [ 0.6901960784313725, "rgb(242,107,73)" ], [ 0.7529411764705882, "rgb(244,135,95)" ], [ 0.8156862745098039, "rgb(245,162,122)" ], [ 0.8784313725490196, "rgb(246,188,153)" ], [ 0.9411764705882353, "rgb(247,212,187)" ], [ 1, "rgb(250,234,220)" ] ] }, "plot_bgcolor": "rgb(234,234,242)", "paper_bgcolor": "white", "shapedefaults": { "line": { "width": 0 }, "opacity": 0.5, "fillcolor": "rgb(67,103,167)" }, "annotationdefaults": { "arrowcolor": "rgb(67,103,167)" } }, "themeRef": "SEABORN" }, "hoverlabel": { "font": { "size": 13 } }, "annotations": [ { "x": 0.14, "y": 0.83, "font": { "size": 14 }, "text": "<b>2.16</b>", "xref": "paper", "yref": "paper", "align": "center", "axref": "x", "ayref": "y", "xanchor": "center", "yanchor": "auto", "showarrow": false }, { "x": 0.29, "y": 0.81, "font": { "size": 14 }, "text": "<b>2.24</b>", "xref": "paper", "yref": "paper", "xanchor": "center", "showarrow": false }, { "x": 0.43, "y": 0.41, "font": { "size": 14 }, "text": "<b>1.6</b>", "xref": "paper", "yref": "paper", "showarrow": false }, { "x": 0.57, "y": 0.59, "font": { "size": 14 }, "text": "<b>1.92</b>", "xref": "paper", "yref": "paper", "showarrow": false }, { "x": 0.73, "y": 0.71, "font": { "size": 14 }, "text": "<b>2.11</b>", "xref": "paper", "yref": "paper", "showarrow": false }, { "x": 0.87, "y": 0.53, "font": { "size": 14 }, "text": "<b>1.66</b>", "xref": "paper", "yref": "paper", "showarrow": false } ], "paper_bgcolor": "rgb(252, 252, 252)" } }, "height": null, "width": null, "user": { "profile_url": "https://chart-studio.plotly.com/~ddsmghorab", "avatar_url": "https://storage.googleapis.com/plotly-prod-profiles/4.jpg", "background_url": "https://storage.googleapis.com/plotly-prod-profiles/bg-9.jpg", "bio": "", "nickname": "", "website": "", "stream_tokens": null, "feature_set_id": null, "csrf_token": null, "date_joined": "2025-08-01 16:14:57", "mapbox_access_tokens": null, "has_password": null, "username": "ddsmghorab", "email": null, "is_active": null, "readonly": null, "is_dash_creator": null, "dash_created_count": null, "is_chart_creator": null, "charts_created_count": null } }, { "creation_time": "2025-08-01T17:01:38.636148Z", "comments": { "results": [], "count": 0 }, "parented": true, "embed_url": "https://chart-studio.plotly.com/~benthor_/12.embed", "fid": "benthor_:12", "filename": "phd-thesis-vr", "filetype": "plot", "img_url": "https://api.plotly.com/v2/files/benthor_:12/image?image_name=list-thumb", "image_urls": { "default": "https://api.plotly.com/v2/files/benthor_:12/image?image_name=default", "block-thumb": "https://api.plotly.com/v2/files/benthor_:12/image?image_name=block-thumb", "list-thumb": "https://api.plotly.com/v2/files/benthor_:12/image?image_name=list-thumb" }, "api_urls": { "files": "https://api.plotly.com/v2/files/benthor_:12", "plots": "https://api.plotly.com/v2/plots/benthor_:12", "parent": "https://api.plotly.com/v2/folders/home?user=benthor_" }, "owner": "benthor_", "parent": -1, "preview": "", "referencers": [], "references": [], "title": "", "views": 2, "web_url": "https://chart-studio.plotly.com/~benthor_/12/", "world_readable": true, "date_modified": "2025-09-02T07:07:29.284Z", "stars": { "results": [], "count": 0 }, "collaborators": { "results": [], "count": 0 }, "subfolder_count": null, "refresh_interval": null, "organize_view_url": "https://chart-studio.plotly.com/~benthor_/12/", "current_user_permission": "read", "is_theme": null, "is_template": false, "autosize": true, "caption": "", "figure": { "data": [ { "line": { "color": "rgb(100, 100, 100)", "width": 14 }, "meta": { "columnNames": { "x": "A", "y": "B" } }, "mode": "markers+lines", "type": "scatter", "xsrc": "benthor_:11:05a0fa", "ysrc": "benthor_:11:ff6352", "marker": { "line": { "width": 0 }, "size": 42, "color": "rgb(0, 0, 0)", "opacity": 1 }, "connectgaps": false } ], "frames": [], "layout": { "font": { "size": 20, "color": "rgb(0, 0, 0)", "family": "Times New Roman" }, "xaxis": { "side": "bottom", "type": "linear", "dtick": 2, "range": [ 2004.1, 2024.9 ], "tick0": 2006, "ticks": "inside", "title": { "font": { "size": 64 }, "text": "Year" }, "nticks": 7, "ticklen": 44, "showgrid": true, "showline": false, "tickfont": { "size": 54 }, "tickmode": "linear", "zeroline": false, "autorange": false, "gridcolor": "rgb(238, 238, 238)", "gridwidth": 2, "linewidth": 6, "tickangle": 45, "tickwidth": 4, "automargin": true, "fixedrange": true, "tickformat": "", "tickprefix": "", "rangeslider": { "range": [ 2003.6028722879685, 2025.3971277120315 ], "yaxis": {}, "visible": false, "autorange": true }, "zerolinecolor": "rgb(179, 179, 179)", "zerolinewidth": 3, "showticklabels": true, "separatethousands": false }, "yaxis": { "side": "left", "type": "linear", "dtick": 3000, "range": [ -518, 16800 ], "tick0": 0, "ticks": "inside", "title": { "font": { "size": 64 }, "text": "Number of Publications" }, "nticks": 9, "ticklen": 35, "showgrid": true, "showline": false, "tickfont": { "size": 54 }, "tickmode": "linear", "zeroline": true, "autorange": false, "gridcolor": "rgb(224, 224, 224)", "gridwidth": 4, "tickangle": "auto", "tickwidth": 4, "fixedrange": true, "showspikes": false, "zerolinecolor": "rgb(0, 0, 0)", "zerolinewidth": 4, "showticklabels": true, "spikethickness": 16 }, "margin": { "l": 110 }, "modebar": { "activecolor": "rgba(0, 0, 0, 0.7)" }, "autosize": true, "template": { "data": { "bar": [ { "type": "bar", "marker": { "colorbar": { "ticks": "", "outlinewidth": 0 } } } ], "table": [ { "type": "table", "cells": { "fill": { "color": "#EBF0F8" }, "line": { "color": "white" } }, "header": { "fill": { "color": "#C8D4E3" }, "line": { "color": "white" } } } ], "carpet": [ { "type": "carpet", "aaxis": { "gridcolor": "#C8D4E3", "linecolor": "#C8D4E3", "endlinecolor": "#2a3f5f", "minorgridcolor": "#C8D4E3", "startlinecolor": "#2a3f5f" }, "baxis": { "gridcolor": "#C8D4E3", "linecolor": "#C8D4E3", "endlinecolor": "#2a3f5f", "minorgridcolor": "#C8D4E3", "startlinecolor": "#2a3f5f" } } ], "mesh3d": [ { "type": "mesh3d", "colorbar": { "ticks": "", "outlinewidth": 0 } } ], "contour": [ { "type": "contour", "colorbar": { "ticks": "", "outlinewidth": 0 }, "autocolorscale": true } ], "heatmap": [ { "type": "heatmap", "colorbar": { "ticks": "", "outlinewidth": 0 }, "autocolorscale": true } ], "scatter": [ { "type": "scatter", "marker": { "colorbar": { "ticks": "", "outlinewidth": 0 } } } ], "surface": [ { "type": "surface", "colorbar": { "ticks": "", "outlinewidth": 0 } } ], "heatmapgl": [ { "type": "heatmapgl", "colorbar": { "ticks": "", "outlinewidth": 0 } } ], "histogram": [ { "type": "histogram", "marker": { "colorbar": { "ticks": "", "outlinewidth": 0 } } } ], "parcoords": [ { "line": { "colorbar": { "ticks": "", "outlinewidth": 0 } }, "type": "parcoords" } ], "scatter3d": [ { "type": "scatter3d", "marker": { "colorbar": { "ticks": "", "outlinewidth": 0 } } } ], "scattergl": [ { "type": "scattergl", "marker": { "colorbar": { "ticks": "", "outlinewidth": 0 } } } ], "choropleth": [ { "type": "choropleth", "colorbar": { "ticks": "", "outlinewidth": 0 } } ], "scattergeo": [ { "type": "scattergeo", "marker": { "colorbar": { "ticks": "", "outlinewidth": 0 } } } ], "histogram2d": [ { "type": "histogram2d", "colorbar": { "ticks": "", "outlinewidth": 0 }, "autocolorscale": true } ], "scatterpolar": [ { "type": "scatterpolar", "marker": { "colorbar": { "ticks": "", "outlinewidth": 0 } } } ], "contourcarpet": [ { "type": "contourcarpet", "colorbar": { "ticks": "", "outlinewidth": 0 } } ], "scattercarpet": [ { "type": "scattercarpet", "marker": { "colorbar": { "ticks": "", "outlinewidth": 0 } } } ], "scattermapbox": [ { "type": "scattermapbox", "marker": { "colorbar": { "ticks": "", "outlinewidth": 0 } } } ], "scatterpolargl": [ { "type": "scatterpolargl", "marker": { "colorbar": { "ticks": "", "outlinewidth": 0 } } } ], "scatterternary": [ { "type": "scatterternary", "marker": { "colorbar": { "ticks": "", "outlinewidth": 0 } } } ], "histogram2dcontour": [ { "type": "histogram2dcontour", "colorbar": { "ticks": "", "outlinewidth": 0 }, "autocolorscale": true } ] }, "layout": { "geo": { "bgcolor": "white", "showland": true, "lakecolor": "white", "landcolor": "white", "showlakes": true, "subunitcolor": "#C8D4E3" }, "font": { "color": "#2a3f5f" }, "polar": { "bgcolor": "white", "radialaxis": { "ticks": "", "gridcolor": "#EBF0F8", "linecolor": "#EBF0F8" }, "angularaxis": { "ticks": "", "gridcolor": "#EBF0F8", "linecolor": "#EBF0F8" } }, "scene": { "xaxis": { "ticks": "", "gridcolor": "#DFE8F3", "gridwidth": 2, "linecolor": "#EBF0F8", "zerolinecolor": "#EBF0F8", "showbackground": true, "backgroundcolor": "white" }, "yaxis": { "ticks": "", "gridcolor": "#DFE8F3", "gridwidth": 2, "linecolor": "#EBF0F8", "zerolinecolor": "#EBF0F8", "showbackground": true, "backgroundcolor": "white" }, "zaxis": { "ticks": "", "gridcolor": "#DFE8F3", "gridwidth": 2, "linecolor": "#EBF0F8", "zerolinecolor": "#EBF0F8", "showbackground": true, "backgroundcolor": "white" } }, "title": { "x": 0.05 }, "xaxis": { "ticks": "", "gridcolor": "#EBF0F8", "linecolor": "#EBF0F8", "automargin": true, "zerolinecolor": "#EBF0F8", "zerolinewidth": 2 }, "yaxis": { "ticks": "", "gridcolor": "#EBF0F8", "linecolor": "#EBF0F8", "automargin": true, "zerolinecolor": "#EBF0F8", "zerolinewidth": 2 }, "ternary": { "aaxis": { "ticks": "", "gridcolor": "#DFE8F3", "linecolor": "#A2B1C6" }, "baxis": { "ticks": "", "gridcolor": "#DFE8F3", "linecolor": "#A2B1C6" }, "caxis": { "ticks": "", "gridcolor": "#DFE8F3", "linecolor": "#A2B1C6" }, "bgcolor": "white" }, "colorway": [ "#636efa", "#EF553B", "#00cc96", "#ab63fa", "#19d3f3", "#e763fa", "#fecb52", "#ffa15a", "#ff6692", "#b6e880" ], "hovermode": "closest", "colorscale": { "diverging": [ [ 0, "#8e0152" ], [ 0.1, "#c51b7d" ], [ 0.2, "#de77ae" ], [ 0.3, "#f1b6da" ], [ 0.4, "#fde0ef" ], [ 0.5, "#f7f7f7" ], [ 0.6, "#e6f5d0" ], [ 0.7, "#b8e186" ], [ 0.8, "#7fbc41" ], [ 0.9, "#4d9221" ], [ 1, "#276419" ] ], "sequential": [ [ 0, "#0508b8" ], [ 0.0893854748603352, "#1910d8" ], [ 0.1787709497206704, "#3c19f0" ], [ 0.2681564245810056, "#6b1cfb" ], [ 0.3575418994413408, "#981cfd" ], [ 0.44692737430167595, "#bf1cfd" ], [ 0.5363128491620112, "#dd2bfd" ], [ 0.6256983240223464, "#f246fe" ], [ 0.7150837988826816, "#fc67fd" ], [ 0.8044692737430168, "#fe88fc" ], [ 0.8938547486033519, "#fea5fd" ], [ 0.9832402234636871, "#febefe" ], [ 1, "#fec3fe" ] ], "sequentialminus": [ [ 0, "#0508b8" ], [ 0.0893854748603352, "#1910d8" ], [ 0.1787709497206704, "#3c19f0" ], [ 0.2681564245810056, "#6b1cfb" ], [ 0.3575418994413408, "#981cfd" ], [ 0.44692737430167595, "#bf1cfd" ], [ 0.5363128491620112, "#dd2bfd" ], [ 0.6256983240223464, "#f246fe" ], [ 0.7150837988826816, "#fc67fd" ], [ 0.8044692737430168, "#fe88fc" ], [ 0.8938547486033519, "#fea5fd" ], [ 0.9832402234636871, "#febefe" ], [ 1, "#fec3fe" ] ] }, "plot_bgcolor": "white", "paper_bgcolor": "white", "shapedefaults": { "line": { "width": 0 }, "opacity": 0.4, "fillcolor": "#506784" }, "annotationdefaults": { "arrowhead": 0, "arrowcolor": "#506784", "arrowwidth": 1 } }, "themeRef": "PLOTLY_WHITE" }, "hoverlabel": { "font": { "family": "Times New Roman" } }, "separators": ", " } }, "height": null, "width": null, "user": { "profile_url": "https://chart-studio.plotly.com/~benthor_", "avatar_url": "https://storage.googleapis.com/plotly-prod-profiles/34.jpg", "background_url": "https://storage.googleapis.com/plotly-prod-profiles/bg-13.jpg", "bio": "", "nickname": "", "website": "", "stream_tokens": null, "feature_set_id": null, "csrf_token": null, "date_joined": "2023-05-15 17:51:29", "mapbox_access_tokens": null, "has_password": null, "username": "benthor_", "email": null, "is_active": null, "readonly": null, "is_dash_creator": null, "dash_created_count": null, "is_chart_creator": null, "charts_created_count": null } }, { "creation_time": "2025-08-01T16:09:41.530355Z", "comments": { "results": [], "count": 0 }, "parented": true, "embed_url": "https://chart-studio.plotly.com/~parmend/150.embed", "fid": "parmend:150", "filename": "Samples_all", "filetype": "plot", "img_url": "https://api.plotly.com/v2/files/parmend:150/image?image_name=list-thumb", "image_urls": { "default": "https://storage.googleapis.com/plotly-prod-images/parmend/150/2_506S717H9AJPW7EXFOAKL1LSGR0LHD.png", "block-thumb": "https://storage.googleapis.com/plotly-prod-images/parmend/150/8_9RR2MJ8ZGRT3LMLWRLVEPEHJ62S2QX.png", "list-thumb": "https://api.plotly.com/v2/files/parmend:150/image?image_name=list-thumb" }, "api_urls": { "files": "https://api.plotly.com/v2/files/parmend:150", "plots": "https://api.plotly.com/v2/plots/parmend:150", "parent": "https://api.plotly.com/v2/folders/home?user=parmend" }, "owner": "parmend", "parent": -1, "preview": "", "referencers": [], "references": [], "title": "", "views": 0, "web_url": "https://chart-studio.plotly.com/~parmend/150/", "world_readable": true, "date_modified": "2025-08-01T16:09:41.541Z", "stars": { "results": [], "count": 0 }, "collaborators": { "results": [], "count": 0 }, "subfolder_count": null, "refresh_interval": null, "organize_view_url": "https://chart-studio.plotly.com/~parmend/150/", "current_user_permission": "read", "is_theme": null, "is_template": false, "autosize": true, "caption": "", "figure": { "data": [ { "meta": { "columnNames": { "x": "B", "y": "C" } }, "mode": "lines", "name": "103", "type": "scatter", "xsrc": "parmend:149:34af54", "ysrc": "parmend:149:21e9bd", "visible": true }, { "meta": { "columnNames": { "x": "E", "y": "F" } }, "mode": "lines", "name": "104", "type": "scatter", "xsrc": "parmend:149:050d9c", "ysrc": "parmend:149:f5d1e4", "stackgroup": null }, { "meta": { "columnNames": { "x": "H", "y": "I" } }, "mode": "lines", "name": "107", "type": "scatter", "xsrc": "parmend:149:7368ad", "ysrc": "parmend:149:103b0a", "stackgroup": null }, { "meta": { "columnNames": { "x": "K", "y": "L" } }, "mode": "lines", "name": "108", "type": "scatter", "xsrc": "parmend:149:1b78e4", "ysrc": "parmend:149:a36031", "stackgroup": null }, { "meta": { "columnNames": { "x": "N", "y": "O" } }, "mode": "lines", "name": "109", "type": "scatter", "xsrc": "parmend:149:b771b5", "ysrc": "parmend:149:e9d7cb", "stackgroup": null }, { "meta": { "columnNames": { "x": "Q", "y": "R" } }, "mode": "lines", "name": "110", "type": "scatter", "xsrc": "parmend:149:7875d3", "ysrc": "parmend:149:4cb202", "stackgroup": null }, { "meta": { "columnNames": { "x": "T", "y": "U" } }, "mode": "lines", "name": "111", "type": "scatter", "xsrc": "parmend:149:5991f3", "ysrc": "parmend:149:61a656", "stackgroup": null }, { "meta": { "columnNames": { "x": "W", "y": "X" } }, "mode": "lines", "name": "112", "type": "scatter", "xsrc": "parmend:149:a0e68f", "ysrc": "parmend:149:6d0500", "visible": true, "stackgroup": null }, { "meta": { "columnNames": { "x": "Z", "y": "AA" } }, "mode": "lines", "name": "113", "type": "scatter", "xsrc": "parmend:149:0e1160", "ysrc": "parmend:149:ca156b", "visible": true, "stackgroup": null } ], "frames": [], "layout": { "xaxis": { "type": "date", "range": [ "2025-07-31 15:56", "2025-08-01 15:58" ], "autorange": true }, "yaxis": { "type": "linear", "range": [ -38.16666666666667, 1265.1666666666667 ], "autorange": true }, "autosize": true, "template": { "data": { "bar": [ { "type": "bar", "marker": { "colorbar": { "ticks": "", "outlinewidth": 0 } } } ], "table": [ { "type": "table", "cells": { "fill": { "color": "#EBF0F8" }, "line": { "color": "white" } }, "header": { "fill": { "color": "#C8D4E3" }, "line": { "color": "white" } } } ], "carpet": [ { "type": "carpet", "aaxis": { "gridcolor": "#C8D4E3", "linecolor": "#C8D4E3", "endlinecolor": "#2a3f5f", "minorgridcolor": "#C8D4E3", "startlinecolor": "#2a3f5f" }, "baxis": { "gridcolor": "#C8D4E3", "linecolor": "#C8D4E3", "endlinecolor": "#2a3f5f", "minorgridcolor": "#C8D4E3", "startlinecolor": "#2a3f5f" } } ], "mesh3d": [ { "type": "mesh3d", "colorbar": { "ticks": "", "outlinewidth": 0 } } ], "contour": [ { "type": "contour", "colorbar": { "ticks": "", "outlinewidth": 0 }, "autocolorscale": true } ], "heatmap": [ { "type": "heatmap", "colorbar": { "ticks": "", "outlinewidth": 0 }, "autocolorscale": true } ], "scatter": [ { "type": "scatter", "marker": { "colorbar": { "ticks": "", "outlinewidth": 0 } } } ], "surface": [ { "type": "surface", "colorbar": { "ticks": "", "outlinewidth": 0 } } ], "heatmapgl": [ { "type": "heatmapgl", "colorbar": { "ticks": "", "outlinewidth": 0 } } ], "histogram": [ { "type": "histogram", "marker": { "colorbar": { "ticks": "", "outlinewidth": 0 } } } ], "parcoords": [ { "line": { "colorbar": { "ticks": "", "outlinewidth": 0 } }, "type": "parcoords" } ], "scatter3d": [ { "type": "scatter3d", "marker": { "colorbar": { "ticks": "", "outlinewidth": 0 } } } ], "scattergl": [ { "type": "scattergl", "marker": { "colorbar": { "ticks": "", "outlinewidth": 0 } } } ], "choropleth": [ { "type": "choropleth", "colorbar": { "ticks": "", "outlinewidth": 0 } } ], "scattergeo": [ { "type": "scattergeo", "marker": { "colorbar": { "ticks": "", "outlinewidth": 0 } } } ], "histogram2d": [ { "type": "histogram2d", "colorbar": { "ticks": "", "outlinewidth": 0 }, "autocolorscale": true } ], "scatterpolar": [ { "type": "scatterpolar", "marker": { "colorbar": { "ticks": "", "outlinewidth": 0 } } } ], "contourcarpet": [ { "type": "contourcarpet", "colorbar": { "ticks": "", "outlinewidth": 0 } } ], "scattercarpet": [ { "type": "scattercarpet", "marker": { "colorbar": { "ticks": "", "outlinewidth": 0 } } } ], "scattermapbox": [ { "type": "scattermapbox", "marker": { "colorbar": { "ticks": "", "outlinewidth": 0 } } } ], "scatterpolargl": [ { "type": "scatterpolargl", "marker": { "colorbar": { "ticks": "", "outlinewidth": 0 } } } ], "scatterternary": [ { "type": "scatterternary", "marker": { "colorbar": { "ticks": "", "outlinewidth": 0 } } } ], "histogram2dcontour": [ { "type": "histogram2dcontour", "colorbar": { "ticks": "", "outlinewidth": 0 }, "autocolorscale": true } ] }, "layout": { "geo": { "bgcolor": "white", "showland": true, "lakecolor": "white", "landcolor": "white", "showlakes": true, "subunitcolor": "#C8D4E3" }, "font": { "color": "#2a3f5f" }, "polar": { "bgcolor": "white", "radialaxis": { "ticks": "", "gridcolor": "#EBF0F8", "linecolor": "#EBF0F8" }, "angularaxis": { "ticks": "", "gridcolor": "#EBF0F8", "linecolor": "#EBF0F8" } }, "scene": { "xaxis": { "ticks": "", "gridcolor": "#DFE8F3", "gridwidth": 2, "linecolor": "#EBF0F8", "zerolinecolor": "#EBF0F8", "showbackground": true, "backgroundcolor": "white" }, "yaxis": { "ticks": "", "gridcolor": "#DFE8F3", "gridwidth": 2, "linecolor": "#EBF0F8", "zerolinecolor": "#EBF0F8", "showbackground": true, "backgroundcolor": "white" }, "zaxis": { "ticks": "", "gridcolor": "#DFE8F3", "gridwidth": 2, "linecolor": "#EBF0F8", "zerolinecolor": "#EBF0F8", "showbackground": true, "backgroundcolor": "white" } }, "title": { "x": 0.05 }, "xaxis": { "ticks": "", "gridcolor": "#EBF0F8", "linecolor": "#EBF0F8", "automargin": true, "zerolinecolor": "#EBF0F8", "zerolinewidth": 2 }, "yaxis": { "ticks": "", "gridcolor": "#EBF0F8", "linecolor": "#EBF0F8", "automargin": true, "zerolinecolor": "#EBF0F8", "zerolinewidth": 2 }, "ternary": { "aaxis": { "ticks": "", "gridcolor": "#DFE8F3", "linecolor": "#A2B1C6" }, "baxis": { "ticks": "", "gridcolor": "#DFE8F3", "linecolor": "#A2B1C6" }, "caxis": { "ticks": "", "gridcolor": "#DFE8F3", "linecolor": "#A2B1C6" }, "bgcolor": "white" }, "colorway": [ "#636efa", "#EF553B", "#00cc96", "#ab63fa", "#19d3f3", "#e763fa", "#fecb52", "#ffa15a", "#ff6692", "#b6e880" ], "hovermode": "closest", "colorscale": { "diverging": [ [ 0, "#8e0152" ], [ 0.1, "#c51b7d" ], [ 0.2, "#de77ae" ], [ 0.3, "#f1b6da" ], [ 0.4, "#fde0ef" ], [ 0.5, "#f7f7f7" ], [ 0.6, "#e6f5d0" ], [ 0.7, "#b8e186" ], [ 0.8, "#7fbc41" ], [ 0.9, "#4d9221" ], [ 1, "#276419" ] ], "sequential": [ [ 0, "#0508b8" ], [ 0.0893854748603352, "#1910d8" ], [ 0.1787709497206704, "#3c19f0" ], [ 0.2681564245810056, "#6b1cfb" ], [ 0.3575418994413408, "#981cfd" ], [ 0.44692737430167595, "#bf1cfd" ], [ 0.5363128491620112, "#dd2bfd" ], [ 0.6256983240223464, "#f246fe" ], [ 0.7150837988826816, "#fc67fd" ], [ 0.8044692737430168, "#fe88fc" ], [ 0.8938547486033519, "#fea5fd" ], [ 0.9832402234636871, "#febefe" ], [ 1, "#fec3fe" ] ], "sequentialminus": [ [ 0, "#0508b8" ], [ 0.0893854748603352, "#1910d8" ], [ 0.1787709497206704, "#3c19f0" ], [ 0.2681564245810056, "#6b1cfb" ], [ 0.3575418994413408, "#981cfd" ], [ 0.44692737430167595, "#bf1cfd" ], [ 0.5363128491620112, "#dd2bfd" ], [ 0.6256983240223464, "#f246fe" ], [ 0.7150837988826816, "#fc67fd" ], [ 0.8044692737430168, "#fe88fc" ], [ 0.8938547486033519, "#fea5fd" ], [ 0.9832402234636871, "#febefe" ], [ 1, "#fec3fe" ] ] }, "plot_bgcolor": "white", "paper_bgcolor": "white", "shapedefaults": { "line": { "width": 0 }, "opacity": 0.4, "fillcolor": "#506784" }, "annotationdefaults": { "arrowhead": 0, "arrowcolor": "#506784", "arrowwidth": 1 } }, "themeRef": "PLOTLY_WHITE" } } }, "height": null, "width": null, "user": { "profile_url": "https://chart-studio.plotly.com/~parmend", "avatar_url": "https://storage.googleapis.com/plotly-prod-profiles/91.jpg", "background_url": "https://storage.googleapis.com/plotly-prod-profiles/bg-8.jpg", "bio": "", "nickname": "", "website": "", "stream_tokens": null, "feature_set_id": null, "csrf_token": null, "date_joined": "2022-11-13 14:05:14", "mapbox_access_tokens": null, "has_password": null, "username": "parmend", "email": null, "is_active": null, "readonly": null, "is_dash_creator": null, "dash_created_count": null, "is_chart_creator": null, "charts_created_count": null } }, { "creation_time": "2025-08-01T15:44:18.475944Z", "comments": { "results": [], "count": 0 }, "parented": true, "embed_url": "https://chart-studio.plotly.com/~parmend/148.embed", "fid": "parmend:148", "filename": "Check_Samples", "filetype": "plot", "img_url": "https://storage.googleapis.com/plotly-prod-images/parmend/148/9_DTPH5C412VR1ZRFYF3EXXXY6A9R7VF.png", "image_urls": { "default": "https://storage.googleapis.com/plotly-prod-images/parmend/148/2_WZ8OEOXEF81QX8EFYOOTFMJRMEKSXV.png", "block-thumb": "https://storage.googleapis.com/plotly-prod-images/parmend/148/8_ZUINMTTROAWX5CZ9VJCJW8O2QNL1E4.png", "list-thumb": "https://storage.googleapis.com/plotly-prod-images/parmend/148/9_DTPH5C412VR1ZRFYF3EXXXY6A9R7VF.png" }, "api_urls": { "files": "https://api.plotly.com/v2/files/parmend:148", "plots": "https://api.plotly.com/v2/plots/parmend:148", "parent": "https://api.plotly.com/v2/folders/home?user=parmend" }, "owner": "parmend", "parent": -1, "preview": "", "referencers": [], "references": [], "title": "", "views": 0, "web_url": "https://chart-studio.plotly.com/~parmend/148/", "world_readable": true, "date_modified": "2025-08-01T15:44:18.486Z", "stars": { "results": [], "count": 0 }, "collaborators": { "results": [], "count": 0 }, "subfolder_count": null, "refresh_interval": null, "organize_view_url": "https://chart-studio.plotly.com/~parmend/148/", "current_user_permission": "read", "is_theme": null, "is_template": false, "autosize": true, "caption": "", "figure": { "data": [ { "meta": { "columnNames": { "x": "A", "y": "B" } }, "mode": "lines", "name": "Unique Samples", "type": "scatter", "xsrc": "parmend:147:b9d7e5", "ysrc": "parmend:147:cd549b", "visible": true }, { "meta": { "columnNames": { "x": "A", "y": "C" } }, "mode": "lines", "name": "Connection", "type": "scatter", "xsrc": "parmend:147:b9d7e5", "ysrc": "parmend:147:5d23cb", "visible": true, "stackgroup": null }, { "meta": { "columnNames": { "x": "A", "y": "D" } }, "mode": "lines", "name": "All Samples", "type": "scatter", "xsrc": "parmend:147:b9d7e5", "ysrc": "parmend:147:21a6f2", "visible": true, "stackgroup": null } ], "frames": [], "layout": { "xaxis": { "type": "date", "range": [ "2025-07-31 19:46", "2025-08-01 14:50" ], "autorange": false }, "yaxis": { "type": "linear", "range": [ -231.94444444444437, 4406.944444444444 ], "autorange": true }, "autosize": true, "template": { "data": { "bar": [ { "type": "bar", "marker": { "colorbar": { "ticks": "", "outlinewidth": 0 } } } ], "table": [ { "type": "table", "cells": { "fill": { "color": "#EBF0F8" }, "line": { "color": "white" } }, "header": { "fill": { "color": "#C8D4E3" }, "line": { "color": "white" } } } ], "carpet": [ { "type": "carpet", "aaxis": { "gridcolor": "#C8D4E3", "linecolor": "#C8D4E3", "endlinecolor": "#2a3f5f", "minorgridcolor": "#C8D4E3", "startlinecolor": "#2a3f5f" }, "baxis": { "gridcolor": "#C8D4E3", "linecolor": "#C8D4E3", "endlinecolor": "#2a3f5f", "minorgridcolor": "#C8D4E3", "startlinecolor": "#2a3f5f" } } ], "mesh3d": [ { "type": "mesh3d", "colorbar": { "ticks": "", "outlinewidth": 0 } } ], "contour": [ { "type": "contour", "colorbar": { "ticks": "", "outlinewidth": 0 }, "autocolorscale": true } ], "heatmap": [ { "type": "heatmap", "colorbar": { "ticks": "", "outlinewidth": 0 }, "autocolorscale": true } ], "scatter": [ { "type": "scatter", "marker": { "colorbar": { "ticks": "", "outlinewidth": 0 } } } ], "surface": [ { "type": "surface", "colorbar": { "ticks": "", "outlinewidth": 0 } } ], "heatmapgl": [ { "type": "heatmapgl", "colorbar": { "ticks": "", "outlinewidth": 0 } } ], "histogram": [ { "type": "histogram", "marker": { "colorbar": { "ticks": "", "outlinewidth": 0 } } } ], "parcoords": [ { "line": { "colorbar": { "ticks": "", "outlinewidth": 0 } }, "type": "parcoords" } ], "scatter3d": [ { "type": "scatter3d", "marker": { "colorbar": { "ticks": "", "outlinewidth": 0 } } } ], "scattergl": [ { "type": "scattergl", "marker": { "colorbar": { "ticks": "", "outlinewidth": 0 } } } ], "choropleth": [ { "type": "choropleth", "colorbar": { "ticks": "", "outlinewidth": 0 } } ], "scattergeo": [ { "type": "scattergeo", "marker": { "colorbar": { "ticks": "", "outlinewidth": 0 } } } ], "histogram2d": [ { "type": "histogram2d", "colorbar": { "ticks": "", "outlinewidth": 0 }, "autocolorscale": true } ], "scatterpolar": [ { "type": "scatterpolar", "marker": { "colorbar": { "ticks": "", "outlinewidth": 0 } } } ], "contourcarpet": [ { "type": "contourcarpet", "colorbar": { "ticks": "", "outlinewidth": 0 } } ], "scattercarpet": [ { "type": "scattercarpet", "marker": { "colorbar": { "ticks": "", "outlinewidth": 0 } } } ], "scattermapbox": [ { "type": "scattermapbox", "marker": { "colorbar": { "ticks": "", "outlinewidth": 0 } } } ], "scatterpolargl": [ { "type": "scatterpolargl", "marker": { "colorbar": { "ticks": "", "outlinewidth": 0 } } } ], "scatterternary": [ { "type": "scatterternary", "marker": { "colorbar": { "ticks": "", "outlinewidth": 0 } } } ], "histogram2dcontour": [ { "type": "histogram2dcontour", "colorbar": { "ticks": "", "outlinewidth": 0 }, "autocolorscale": true } ] }, "layout": { "geo": { "bgcolor": "white", "showland": true, "lakecolor": "white", "landcolor": "white", "showlakes": true, "subunitcolor": "#C8D4E3" }, "font": { "color": "#2a3f5f" }, "polar": { "bgcolor": "white", "radialaxis": { "ticks": "", "gridcolor": "#EBF0F8", "linecolor": "#EBF0F8" }, "angularaxis": { "ticks": "", "gridcolor": "#EBF0F8", "linecolor": "#EBF0F8" } }, "scene": { "xaxis": { "ticks": "", "gridcolor": "#DFE8F3", "gridwidth": 2, "linecolor": "#EBF0F8", "zerolinecolor": "#EBF0F8", "showbackground": true, "backgroundcolor": "white" }, "yaxis": { "ticks": "", "gridcolor": "#DFE8F3", "gridwidth": 2, "linecolor": "#EBF0F8", "zerolinecolor": "#EBF0F8", "showbackground": true, "backgroundcolor": "white" }, "zaxis": { "ticks": "", "gridcolor": "#DFE8F3", "gridwidth": 2, "linecolor": "#EBF0F8", "zerolinecolor": "#EBF0F8", "showbackground": true, "backgroundcolor": "white" } }, "title": { "x": 0.05 }, "xaxis": { "ticks": "", "gridcolor": "#EBF0F8", "linecolor": "#EBF0F8", "automargin": true, "zerolinecolor": "#EBF0F8", "zerolinewidth": 2 }, "yaxis": { "ticks": "", "gridcolor": "#EBF0F8", "linecolor": "#EBF0F8", "automargin": true, "zerolinecolor": "#EBF0F8", "zerolinewidth": 2 }, "ternary": { "aaxis": { "ticks": "", "gridcolor": "#DFE8F3", "linecolor": "#A2B1C6" }, "baxis": { "ticks": "", "gridcolor": "#DFE8F3", "linecolor": "#A2B1C6" }, "caxis": { "ticks": "", "gridcolor": "#DFE8F3", "linecolor": "#A2B1C6" }, "bgcolor": "white" }, "colorway": [ "#636efa", "#EF553B", "#00cc96", "#ab63fa", "#19d3f3", "#e763fa", "#fecb52", "#ffa15a", "#ff6692", "#b6e880" ], "hovermode": "closest", "colorscale": { "diverging": [ [ 0, "#8e0152" ], [ 0.1, "#c51b7d" ], [ 0.2, "#de77ae" ], [ 0.3, "#f1b6da" ], [ 0.4, "#fde0ef" ], [ 0.5, "#f7f7f7" ], [ 0.6, "#e6f5d0" ], [ 0.7, "#b8e186" ], [ 0.8, "#7fbc41" ], [ 0.9, "#4d9221" ], [ 1, "#276419" ] ], "sequential": [ [ 0, "#0508b8" ], [ 0.0893854748603352, "#1910d8" ], [ 0.1787709497206704, "#3c19f0" ], [ 0.2681564245810056, "#6b1cfb" ], [ 0.3575418994413408, "#981cfd" ], [ 0.44692737430167595, "#bf1cfd" ], [ 0.5363128491620112, "#dd2bfd" ], [ 0.6256983240223464, "#f246fe" ], [ 0.7150837988826816, "#fc67fd" ], [ 0.8044692737430168, "#fe88fc" ], [ 0.8938547486033519, "#fea5fd" ], [ 0.9832402234636871, "#febefe" ], [ 1, "#fec3fe" ] ], "sequentialminus": [ [ 0, "#0508b8" ], [ 0.0893854748603352, "#1910d8" ], [ 0.1787709497206704, "#3c19f0" ], [ 0.2681564245810056, "#6b1cfb" ], [ 0.3575418994413408, "#981cfd" ], [ 0.44692737430167595, "#bf1cfd" ], [ 0.5363128491620112, "#dd2bfd" ], [ 0.6256983240223464, "#f246fe" ], [ 0.7150837988826816, "#fc67fd" ], [ 0.8044692737430168, "#fe88fc" ], [ 0.8938547486033519, "#fea5fd" ], [ 0.9832402234636871, "#febefe" ], [ 1, "#fec3fe" ] ] }, "plot_bgcolor": "white", "paper_bgcolor": "white", "shapedefaults": { "line": { "width": 0 }, "opacity": 0.4, "fillcolor": "#506784" }, "annotationdefaults": { "arrowhead": 0, "arrowcolor": "#506784", "arrowwidth": 1 } }, "themeRef": "PLOTLY_WHITE" } } }, "height": null, "width": null, "user": { "profile_url": "https://chart-studio.plotly.com/~parmend", "avatar_url": "https://storage.googleapis.com/plotly-prod-profiles/91.jpg", "background_url": "https://storage.googleapis.com/plotly-prod-profiles/bg-8.jpg", "bio": "", "nickname": "", "website": "", "stream_tokens": null, "feature_set_id": null, "csrf_token": null, "date_joined": "2022-11-13 14:05:14", "mapbox_access_tokens": null, "has_password": null, "username": "parmend", "email": null, "is_active": null, "readonly": null, "is_dash_creator": null, "dash_created_count": null, "is_chart_creator": null, "charts_created_count": null } } ] }
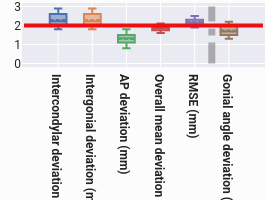