Plots List
Plots
This endpoint handles manipulation of Plotly plot files.
Reference
Authorization
Any user with or without a Plotly account may view public plots. For private plots, see authentication.
Actions
list
Listing all public plots can be done via a GET request to this endpoint.
By default, plots will be listed in order of date created. The order_by
query parameter is accepted at this endpoint. Currently, only ordering by
views is supported. It is possible to filter the plots by quality
with min_quality or max_quality as query parameter.
Example:
// GET https://api.plotly.com/v2/plots/ ---> 200

// GET https://api.plotly.com/v2/plots/?order_by=-views ---> 200

// GET https://api.plotly.com/v2/plots/?min_quality=5 ---> 200

// GET https://api.plotly.com/v2/plots/?max_quality=5 ---> 200
feed
Listing all handpicked feed plots can be done via a GET request to this endpoint. By default, plots will be listed in a random order.
Example:
// GET https://api.plotly.com/v2/plots/feed ---> 200
create
You can create new plot resources here. The only required field is 'figure'. Currently, the figure is restricted to only contain references to grid data. That is, this will fail if raw data arrays are passed in. To create and manipulate underlying grids for plots, see the grids endpoint.
Example:
// This fails because a figure field is required.
// POST https://api.plotly.com/v2/plots ---> 400 Bad Request
{}

// This fails because the figure has raw data
//POST https://api.plotly.com/v2/plots ---> 400 Bad Request
{
    "figure": {"data": [{"y": ['this', 'is', 'raw', 'data']}]}
}

// This succeeds because the figure has src keys, not raw data.
//POST https://api.plotly.com/v2/plots ---> 200 OK
{
    "figure": {"data": [{"ysrc": "sven:88:u8nd62"}]}
}
When creating a grid, you can optionally specify a source_fid to specify where a plot has come from:
- source_fid: the fid of a plot that was copied (and presumably edited) to produce this one
detail
There is a lot of meta information stored about plot files including filename, title, share_url, and content_url to name a few.
This information can only be reached with a GET to this endpoint.
Example:
// GET https://api.plotly.com/v2/plots/iheartgraphs:90
content
The contents of a plot can be downloaded via the content resource. The plot
content contains referenced grid/column data by default. If you wish to
return the raw grid/column data, the inline_data=true query must be included
in the request url. The Content-Type header will be appropriately set for the
response body.
Alternatively, you can set ?map_data=unreadable to append a mapping of
sources to data that belongs to grids which are unreadable for the
requestor. This is useful when you have read access to another users plot,
but that plot contains grid references which you don't have access to.
Examples:
// Returns referenced grid/column data
// GET https://api.plotly.com/v2/plots/iheartgraphs:90/content ---> 200 OK

// Returns full grid/column data
// GET https://api.plotly.com/v2/plots/iheartgraphs:90/content?inline_data=true ---> 200 OK

// Returns full grid/column data when requestor doesn't have permission
// to read the referenced grid.
// GET https://api.plotly.com/v2/plots/iheartgraphs:90/content?map_data=unreadable ---> 200 OK
GET /v2/plots?cursor=cD0yMDI1LTA4LTAyKzE4JTNBMzAlM0EwMy4wOTQxNDclMkIwMCUzQTAw&format=api
{ "next": "https://api.plotly.com/v2/plots?cursor=cD0yMDI1LTA4LTAxKzIzJTNBNDUlM0E1NC41NTk1MzQlMkIwMCUzQTAw&format=api", "previous": "https://api.plotly.com/v2/plots?cursor=cj0xJnA9MjAyNS0wOC0wMisxOCUzQTI1JTNBMzQuODA3ODU1JTJCMDAlM0EwMA%3D%3D&format=api", "results": [ { "creation_time": "2025-08-02T18:25:34.807855Z", "comments": { "results": [], "count": 0 }, "parented": true, "embed_url": "https://chart-studio.plotly.com/~ATrav/31.embed", "fid": "ATrav:31", "filename": "number array", "filetype": "plot", "img_url": "https://storage.googleapis.com/plotly-prod-images/ATrav/31/9_YVSGIZUF9WGT2IPA03OLIFNNZ9J6D7.png", "image_urls": { "default": "https://storage.googleapis.com/plotly-prod-images/ATrav/31/2_60MIWZ7WT3DHC0H5F43510P5RLXFDG.png", "block-thumb": "https://storage.googleapis.com/plotly-prod-images/ATrav/31/8_UN1XBJB67KOVZXL8W5L25BJBHK9L81.png", "list-thumb": "https://storage.googleapis.com/plotly-prod-images/ATrav/31/9_YVSGIZUF9WGT2IPA03OLIFNNZ9J6D7.png" }, "api_urls": { "files": "https://api.plotly.com/v2/files/ATrav:31", "plots": "https://api.plotly.com/v2/plots/ATrav:31", "parent": "https://api.plotly.com/v2/folders/home?user=ATrav" }, "owner": "ATrav", "parent": -1, "preview": "", "referencers": [], "references": [], "title": "", "views": 0, "web_url": "https://chart-studio.plotly.com/~ATrav/31/", "world_readable": true, "date_modified": "2025-08-02T18:25:34.818Z", "stars": { "results": [], "count": 0 }, "collaborators": { "results": [], "count": 0 }, "subfolder_count": null, "refresh_interval": null, "organize_view_url": "https://chart-studio.plotly.com/~ATrav/31/", "current_user_permission": "read", "is_theme": null, "is_template": false, "autosize": true, "caption": "", "figure": { "data": [ { "meta": { "columnNames": { "x": "TR name", "y": "H", "marker": { "size": "Number of arrays" } } }, "mode": "markers", "name": "<i>R.muscosa</i>", "type": "scatter", "xsrc": "ATrav:21:45e301", "ysrc": "ATrav:21:53ca0e", "jitter": 0.55, "marker": { "meta": { "columnNames": { "size": "Number of arrays" } }, "opacity": 0.7, "sizeref": 7.872380927999997, "sizesrc": "ATrav:21:a964bc", "sizemode": "area" }, "error_x": { "type": "percent", "color": "#636efa", "value": 10, "width": 4, "visible": false, "symmetric": true, "thickness": 2 }, "hoveron": "points", "opacity": 0.67, "bandwidth": 0, "selectedpoints": [ 0, 1, 2, 3, 4, 5, 6, 7, 8, 10, 12, 13, 14, 15, 16, 17, 18, 20, 21, 22, 24, 27, 29, 30, 31, 33, 34, 35, 37, 39, 40, 41, 42, 43, 44, 46, 48, 49, 52, 55, 56, 58, 60, 61, 62, 63, 65, 66, 68, 71, 72, 74, 75, 76, 78, 79, 80, 81, 82, 83, 84, 85, 86, 89, 91, 92, 97, 98, 99, 100, 102, 105, 106, 107, 108, 109, 110, 111, 116, 117, 119, 120, 123, 124, 127, 131, 132, 134, 136, 138, 139, 141, 143, 144, 145, 147, 149, 150, 151, 154, 155, 156, 157, 158, 159, 160, 163, 175, 176, 177, 178, 179, 181, 182, 187, 191, 193, 198, 200, 202, 203, 204, 205, 208, 209, 210, 213, 215, 222, 223, 226, 228, 229, 236, 240, 243, 250, 254, 256, 259, 261, 262, 269, 270, 273, 276, 277, 278, 283, 285, 287, 288, 289, 302, 303, 310, 311, 313, 316, 317, 318, 319, 327, 330, 331, 332, 342, 345, 346, 348, 351, 353, 360, 361, 362, 363, 377, 380, 390, 399, 402, 405, 407, 411, 413, 416, 418, 427, 430, 437, 438, 442, 446, 449, 452, 457, 464, 465, 470, 487, 490, 503, 514, 523, 525, 527, 528, 529, 534, 540, 547, 552, 554, 555, 557, 580, 583, 586, 593, 604, 609, 615, 618, 640, 652, 653, 656, 657, 666, 672, 677, 684, 685, 687, 690, 699 ] }, { "meta": { "columnNames": { "x": "TR name", "y": "H", "marker": { "size": "Number of arrays" } } }, "mode": "markers", "name": "<i>P.lessonae</i>", "type": "scatter", "xsrc": "ATrav:26:b1a330", "ysrc": "ATrav:26:17c621", "jitter": 0.59, "marker": { "meta": { "columnNames": { "size": "Number of arrays" } }, "opacity": 0.7, "sizeref": 0.5456790123456791, "sizesrc": "ATrav:26:95879f", "sizemode": "area" }, "opacity": 0.67, "bandwidth": 0, "selectedpoints": [] }, { "meta": { "columnNames": { "x": "TR name", "y": "H", "marker": { "size": "Number of arrays" } } }, "mode": "markers", "name": "<i>L.septentrionalis</i>", "type": "scatter", "xsrc": "ATrav:25:657427", "ysrc": "ATrav:25:ac2c61", "jitter": 0.55, "marker": { "meta": { "columnNames": { "size": "Number of arrays" } }, "opacity": 0.7, "sizeref": 0.045925925925925926, "sizesrc": "ATrav:25:1fc567", "sizemode": "area" }, "opacity": 0.67, "bandwidth": 0, "selectedpoints": [] }, { "meta": { "columnNames": { "x": "TR name", "y": "H", "marker": { "size": "Number of arrays" } } }, "mode": "markers", "name": "<i>L.pipiens</i>", "type": "scatter", "xsrc": "ATrav:24:4d7c21", "ysrc": "ATrav:24:d3c4ee", "jitter": 0.59, "marker": { "meta": { "columnNames": { "size": "Number of arrays" } }, "opacity": 0.7, "sizeref": 0.02074074074074074, "sizesrc": "ATrav:24:761081", "sizemode": "area" }, "opacity": 0.67, "bandwidth": 0, "selectedpoints": [] }, { "meta": { "columnNames": { "x": "TR name", "y": "I", "text": "", "marker": { "size": "Number of arrays", "color": "Number of arrays" } } }, "mode": "markers", "name": "<i>A.catesbeiana</i>", "type": "scatter", "xsrc": "ATrav:27:bfe106", "ysrc": "ATrav:27:034350", "jitter": 0.59, "marker": { "meta": { "columnNames": { "size": "Number of arrays", "color": "Number of arrays" } }, "color": "#1f77b4", "opacity": 0.7, "sizeref": 0.046419753086419754, "sizesrc": "ATrav:22:967dfa", "sizemode": "area" }, "opacity": 0.67, "pointpos": 0, "bandwidth": 0, "selectedpoints": [] }, { "meta": { "columnNames": { "x": "TR name", "y": "H", "marker": { "size": "Number of arrays" } } }, "mode": "markers", "name": "<i>L.sylvaticus</i>", "type": "scatter", "xsrc": "ATrav:23:27b616", "ysrc": "ATrav:23:d678fd", "jitter": 0.59, "marker": { "meta": { "columnNames": { "size": "Number of arrays" } }, "opacity": 0.7, "sizeref": 0.21382716049382716, "sizesrc": "ATrav:23:e3592f", "sizemode": "area" }, "opacity": 0.67, "bandwidth": 0, "selectedpoints": [] }, { "meta": { "columnNames": { "x": "TR name", "y": "I", "marker": { "size": "Number of arrays" } } }, "mode": "markers", "name": "<i>R.temporaria</i>", "side": "both", "type": "scatter", "xsrc": "ATrav:20:9ad86a", "ysrc": "ATrav:20:9c3671", "jitter": 0.59, "marker": { "meta": { "columnNames": { "size": "Number of arrays" } }, "opacity": 0.7, "sizeref": 0.030617283950617285, "sizesrc": "ATrav:20:e2b9dc", "sizemode": "area" }, "opacity": 0.67, "pointpos": 0, "spanmode": "soft", "bandwidth": 0, "showlegend": true, "selectedpoints": [] }, { "meta": { "columnNames": { "x": "TR name", "y": "I", "marker": { "size": "Number of arrays" } } }, "mode": "markers", "name": "<i>R.kukunoris</i>", "type": "scatter", "xsrc": "ATrav:22:6921b3", "ysrc": "ATrav:22:89a893", "jitter": 0.59, "marker": { "meta": { "columnNames": { "size": "Number of arrays" } }, "opacity": 0.7, "sizeref": 0.046419753086419754, "sizesrc": "ATrav:22:967dfa", "sizemode": "area" }, "opacity": 0.67, "pointpos": 0, "bandwidth": 0, "selectedpoints": [] }, { "meta": { "columnNames": { "x": "TR name", "y": "H", "marker": { "size": "Number of arrays" } } }, "mode": "markers", "name": "<i>S.parvus</i>", "type": "scatter", "xsrc": "ATrav:28:890c54", "ysrc": "ATrav:28:5b68c3", "jitter": 0.59, "marker": { "meta": { "columnNames": { "size": "Number of arrays" } }, "opacity": 0.7, "sizeref": 0.015308641975308642, "sizesrc": "ATrav:28:1561bb", "sizemode": "area" }, "opacity": 0.67, "bandwidth": 0, "orientation": "v", "selectedpoints": [] } ], "frames": [], "layout": { "xaxis": { "side": "bottom", "type": "category", "range": [ 1954.344416987357, 7779.049752583216 ], "anchor": "free", "autorange": false }, "yaxis": { "side": "left", "type": "linear", "range": [ 0.05325591131030072, 0.7634725083179786 ], "autorange": false }, "autosize": true, "dragmode": "select", "template": { "data": { "bar": [ { "type": "bar", "marker": { "colorbar": { "ticks": "", "outlinewidth": 0 } } } ], "table": [ { "type": "table", "cells": { "fill": { "color": "#EBF0F8" }, "line": { "color": "white" } }, "header": { "fill": { "color": "#C8D4E3" }, "line": { "color": "white" } } } ], "carpet": [ { "type": "carpet", "aaxis": { "gridcolor": "#C8D4E3", "linecolor": "#C8D4E3", "endlinecolor": "#2a3f5f", "minorgridcolor": "#C8D4E3", "startlinecolor": "#2a3f5f" }, "baxis": { "gridcolor": "#C8D4E3", "linecolor": "#C8D4E3", "endlinecolor": "#2a3f5f", "minorgridcolor": "#C8D4E3", "startlinecolor": "#2a3f5f" } } ], "mesh3d": [ { "type": "mesh3d", "colorbar": { "ticks": "", "outlinewidth": 0 } } ], "contour": [ { "type": "contour", "colorbar": { "ticks": "", "outlinewidth": 0 }, "autocolorscale": true } ], "heatmap": [ { "type": "heatmap", "colorbar": { "ticks": "", "outlinewidth": 0 }, "autocolorscale": true } ], "scatter": [ { "type": "scatter", "marker": { "colorbar": { "ticks": "", "outlinewidth": 0 } } } ], "surface": [ { "type": "surface", "colorbar": { "ticks": "", "outlinewidth": 0 } } ], "heatmapgl": [ { "type": "heatmapgl", "colorbar": { "ticks": "", "outlinewidth": 0 } } ], "histogram": [ { "type": "histogram", "marker": { "colorbar": { "ticks": "", "outlinewidth": 0 } } } ], "parcoords": [ { "line": { "colorbar": { "ticks": "", "outlinewidth": 0 } }, "type": "parcoords" } ], "scatter3d": [ { "type": "scatter3d", "marker": { "colorbar": { "ticks": "", "outlinewidth": 0 } } } ], "scattergl": [ { "type": "scattergl", "marker": { "colorbar": { "ticks": "", "outlinewidth": 0 } } } ], "choropleth": [ { "type": "choropleth", "colorbar": { "ticks": "", "outlinewidth": 0 } } ], "scattergeo": [ { "type": "scattergeo", "marker": { "colorbar": { "ticks": "", "outlinewidth": 0 } } } ], "histogram2d": [ { "type": "histogram2d", "colorbar": { "ticks": "", "outlinewidth": 0 }, "autocolorscale": true } ], "scatterpolar": [ { "type": "scatterpolar", "marker": { "colorbar": { "ticks": "", "outlinewidth": 0 } } } ], "contourcarpet": [ { "type": "contourcarpet", "colorbar": { "ticks": "", "outlinewidth": 0 } } ], "scattercarpet": [ { "type": "scattercarpet", "marker": { "colorbar": { "ticks": "", "outlinewidth": 0 } } } ], "scattermapbox": [ { "type": "scattermapbox", "marker": { "colorbar": { "ticks": "", "outlinewidth": 0 } } } ], "scatterpolargl": [ { "type": "scatterpolargl", "marker": { "colorbar": { "ticks": "", "outlinewidth": 0 } } } ], "scatterternary": [ { "type": "scatterternary", "marker": { "colorbar": { "ticks": "", "outlinewidth": 0 } } } ], "histogram2dcontour": [ { "type": "histogram2dcontour", "colorbar": { "ticks": "", "outlinewidth": 0 }, "autocolorscale": true } ] }, "layout": { "geo": { "bgcolor": "white", "showland": true, "lakecolor": "white", "landcolor": "white", "showlakes": true, "subunitcolor": "#C8D4E3" }, "font": { "color": "#2a3f5f" }, "polar": { "bgcolor": "white", "radialaxis": { "ticks": "", "gridcolor": "#EBF0F8", "linecolor": "#EBF0F8" }, "angularaxis": { "ticks": "", "gridcolor": "#EBF0F8", "linecolor": "#EBF0F8" } }, "scene": { "xaxis": { "ticks": "", "gridcolor": "#DFE8F3", "gridwidth": 2, "linecolor": "#EBF0F8", "zerolinecolor": "#EBF0F8", "showbackground": true, "backgroundcolor": "white" }, "yaxis": { "ticks": "", "gridcolor": "#DFE8F3", "gridwidth": 2, "linecolor": "#EBF0F8", "zerolinecolor": "#EBF0F8", "showbackground": true, "backgroundcolor": "white" }, "zaxis": { "ticks": "", "gridcolor": "#DFE8F3", "gridwidth": 2, "linecolor": "#EBF0F8", "zerolinecolor": "#EBF0F8", "showbackground": true, "backgroundcolor": "white" } }, "title": { "x": 0.05 }, "xaxis": { "ticks": "", "gridcolor": "#EBF0F8", "linecolor": "#EBF0F8", "automargin": true, "zerolinecolor": "#EBF0F8", "zerolinewidth": 2 }, "yaxis": { "ticks": "", "gridcolor": "#EBF0F8", "linecolor": "#EBF0F8", "automargin": true, "zerolinecolor": "#EBF0F8", "zerolinewidth": 2 }, "ternary": { "aaxis": { "ticks": "", "gridcolor": "#DFE8F3", "linecolor": "#A2B1C6" }, "baxis": { "ticks": "", "gridcolor": "#DFE8F3", "linecolor": "#A2B1C6" }, "caxis": { "ticks": "", "gridcolor": "#DFE8F3", "linecolor": "#A2B1C6" }, "bgcolor": "white" }, "colorway": [ "#636efa", "#EF553B", "#00cc96", "#ab63fa", "#19d3f3", "#e763fa", "#fecb52", "#ffa15a", "#ff6692", "#b6e880" ], "hovermode": "closest", "colorscale": { "diverging": [ [ 0, "#8e0152" ], [ 0.1, "#c51b7d" ], [ 0.2, "#de77ae" ], [ 0.3, "#f1b6da" ], [ 0.4, "#fde0ef" ], [ 0.5, "#f7f7f7" ], [ 0.6, "#e6f5d0" ], [ 0.7, "#b8e186" ], [ 0.8, "#7fbc41" ], [ 0.9, "#4d9221" ], [ 1, "#276419" ] ], "sequential": [ [ 0, "#0508b8" ], [ 0.0893854748603352, "#1910d8" ], [ 0.1787709497206704, "#3c19f0" ], [ 0.2681564245810056, "#6b1cfb" ], [ 0.3575418994413408, "#981cfd" ], [ 0.44692737430167595, "#bf1cfd" ], [ 0.5363128491620112, "#dd2bfd" ], [ 0.6256983240223464, "#f246fe" ], [ 0.7150837988826816, "#fc67fd" ], [ 0.8044692737430168, "#fe88fc" ], [ 0.8938547486033519, "#fea5fd" ], [ 0.9832402234636871, "#febefe" ], [ 1, "#fec3fe" ] ], "sequentialminus": [ [ 0, "#0508b8" ], [ 0.0893854748603352, "#1910d8" ], [ 0.1787709497206704, "#3c19f0" ], [ 0.2681564245810056, "#6b1cfb" ], [ 0.3575418994413408, "#981cfd" ], [ 0.44692737430167595, "#bf1cfd" ], [ 0.5363128491620112, "#dd2bfd" ], [ 0.6256983240223464, "#f246fe" ], [ 0.7150837988826816, "#fc67fd" ], [ 0.8044692737430168, "#fe88fc" ], [ 0.8938547486033519, "#fea5fd" ], [ 0.9832402234636871, "#febefe" ], [ 1, "#fec3fe" ] ] }, "plot_bgcolor": "white", "paper_bgcolor": "white", "shapedefaults": { "line": { "width": 0 }, "opacity": 0.4, "fillcolor": "#506784" }, "annotationdefaults": { "arrowhead": 0, "arrowcolor": "#506784", "arrowwidth": 1 } }, "themeRef": "PLOTLY_WHITE" }, "violingap": 0.56 } }, "height": null, "width": null, "user": { "profile_url": "https://chart-studio.plotly.com/~ATrav", "avatar_url": "https://storage.googleapis.com/plotly-prod-profiles/89.jpg", "background_url": "https://storage.googleapis.com/plotly-prod-profiles/bg-7.jpg", "bio": "", "nickname": "", "website": "", "stream_tokens": null, "feature_set_id": null, "csrf_token": null, "date_joined": "2025-07-26 09:57:47", "mapbox_access_tokens": null, "has_password": null, "username": "ATrav", "email": null, "is_active": null, "readonly": null, "is_dash_creator": null, "dash_created_count": null, "is_chart_creator": null, "charts_created_count": null } }, { "creation_time": "2025-08-02T18:12:48.816170Z", "comments": { "results": [], "count": 0 }, "parented": true, "embed_url": "https://chart-studio.plotly.com/~ATrav/30.embed", "fid": "ATrav:30", "filename": "Plot 30", "filetype": "plot", "img_url": "https://storage.googleapis.com/plotly-prod-images/ATrav/30/9_HYFEC4PFG03LOG0H88W347061L8L1O.png", "image_urls": { "default": "https://storage.googleapis.com/plotly-prod-images/ATrav/30/2_CNP0GFDUO9LPV49A0G8VBVW0AKB0GC.png", "block-thumb": "https://storage.googleapis.com/plotly-prod-images/ATrav/30/8_WGRUX3TWG3XBSWEWP9SNBO42PMINNJ.png", "list-thumb": "https://storage.googleapis.com/plotly-prod-images/ATrav/30/9_HYFEC4PFG03LOG0H88W347061L8L1O.png" }, "api_urls": { "files": "https://api.plotly.com/v2/files/ATrav:30", "plots": "https://api.plotly.com/v2/plots/ATrav:30", "parent": "https://api.plotly.com/v2/folders/home?user=ATrav" }, "owner": "ATrav", "parent": -1, "preview": "", "referencers": [], "references": [], "title": "", "views": 1, "web_url": "https://chart-studio.plotly.com/~ATrav/30/", "world_readable": true, "date_modified": "2025-08-02T18:12:48.828Z", "stars": { "results": [], "count": 0 }, "collaborators": { "results": [], "count": 0 }, "subfolder_count": null, "refresh_interval": null, "organize_view_url": "https://chart-studio.plotly.com/~ATrav/30/", "current_user_permission": "read", "is_theme": null, "is_template": false, "autosize": true, "caption": "", "figure": { "data": [ { "meta": { "columnNames": { "x": "TR name", "y": "H", "marker": { "size": "Number of arrays" } } }, "mode": "markers", "name": "<i>R.muscosa</i>", "type": "scatter", "xsrc": "ATrav:21:45e301", "ysrc": "ATrav:21:53ca0e", "jitter": 0.55, "marker": { "meta": { "columnNames": { "size": "Number of arrays" } }, "opacity": 0.7, "sizeref": 7.872380927999997, "sizesrc": "ATrav:21:a964bc", "sizemode": "area" }, "error_x": { "type": "percent", "color": "#636efa", "value": 10, "width": 4, "visible": false, "symmetric": true, "thickness": 2 }, "hoveron": "points", "opacity": 0.67, "bandwidth": 0, "selectedpoints": [ 0, 1, 2, 3, 4, 5, 6, 7, 8, 10, 12, 13, 14, 15, 16, 17, 18, 20, 21, 22, 24, 27, 29, 30, 31, 33, 34, 35, 37, 39, 40, 41, 42, 43, 44, 46, 48, 49, 52, 55, 56, 58, 60, 61, 62, 63, 65, 66, 68, 71, 72, 74, 75, 76, 78, 79, 80, 81, 82, 83, 84, 85, 86, 89, 91, 92, 97, 98, 99, 100, 102, 105, 106, 107, 108, 109, 110, 111, 116, 117, 119, 120, 123, 124, 127, 131, 132, 134, 136, 138, 139, 141, 143, 144, 145, 147, 149, 150, 151, 154, 155, 156, 157, 158, 159, 160, 163, 175, 176, 177, 178, 179, 181, 182, 187, 191, 193, 198, 200, 202, 203, 204, 205, 208, 209, 210, 213, 215, 222, 223, 226, 228, 229, 236, 240, 243, 250, 254, 256, 259, 261, 262, 269, 270, 273, 276, 277, 278, 283, 285, 287, 288, 289, 302, 303, 310, 311, 313, 316, 317, 318, 319, 327, 330, 331, 332, 342, 345, 346, 348, 351, 353, 360, 361, 362, 363, 377, 380, 390, 399, 402, 405, 407, 411, 413, 416, 418, 427, 430, 437, 438, 442, 446, 449, 452, 457, 464, 465, 470, 487, 490, 503, 514, 523, 525, 527, 528, 529, 534, 540, 547, 552, 554, 555, 557, 580, 583, 586, 593, 604, 609, 615, 618, 640, 652, 653, 656, 657, 666, 672, 677, 684, 685, 687, 690, 699 ] }, { "meta": { "columnNames": { "x": "TR name", "y": "H", "marker": { "size": "Number of arrays" } } }, "mode": "markers", "name": "<i>P.lessonae</i>", "type": "scatter", "xsrc": "ATrav:26:b1a330", "ysrc": "ATrav:26:17c621", "jitter": 0.59, "marker": { "meta": { "columnNames": { "size": "Number of arrays" } }, "opacity": 0.7, "sizeref": 0.5456790123456791, "sizesrc": "ATrav:26:95879f", "sizemode": "area" }, "opacity": 0.67, "bandwidth": 0, "selectedpoints": [] }, { "meta": { "columnNames": { "x": "TR name", "y": "H", "marker": { "size": "Number of arrays" } } }, "mode": "markers", "name": "<i>L.septentrionalis</i>", "type": "scatter", "xsrc": "ATrav:25:657427", "ysrc": "ATrav:25:ac2c61", "jitter": 0.55, "marker": { "meta": { "columnNames": { "size": "Number of arrays" } }, "opacity": 0.7, "sizeref": 0.045925925925925926, "sizesrc": "ATrav:25:1fc567", "sizemode": "area" }, "opacity": 0.67, "bandwidth": 0, "selectedpoints": [] }, { "meta": { "columnNames": { "x": "TR name", "y": "H", "marker": { "size": "Number of arrays" } } }, "mode": "markers", "name": "<i>L.pipiens</i>", "type": "scatter", "xsrc": "ATrav:24:4d7c21", "ysrc": "ATrav:24:d3c4ee", "jitter": 0.59, "marker": { "meta": { "columnNames": { "size": "Number of arrays" } }, "opacity": 0.7, "sizeref": 0.02074074074074074, "sizesrc": "ATrav:24:761081", "sizemode": "area" }, "opacity": 0.67, "bandwidth": 0, "selectedpoints": [] }, { "meta": { "columnNames": { "x": "TR name", "y": "I", "marker": { "color": "Number of arrays" } } }, "mode": "markers", "name": "<i>A.catesbeiana</i>", "type": "scatter", "xsrc": "ATrav:27:bfe106", "ysrc": "ATrav:27:034350", "jitter": 0.59, "marker": { "meta": { "columnNames": { "color": "Number of arrays" } }, "opacity": 0.7, "colorsrc": "ATrav:27:c01050" }, "opacity": 0.67, "pointpos": 0, "bandwidth": 0, "selectedpoints": [] }, { "meta": { "columnNames": { "x": "TR name", "y": "H" } }, "mode": "markers", "name": "<i>L.sylvaticus</i>", "type": "scatter", "xsrc": "ATrav:23:27b616", "ysrc": "ATrav:23:d678fd", "jitter": 0.59, "marker": { "opacity": 0.7 }, "opacity": 0.67, "bandwidth": 0, "selectedpoints": [] }, { "meta": { "columnNames": { "x": "TR name", "y": "I" } }, "mode": "markers", "name": "<i>R.temporaria</i>", "side": "both", "type": "scatter", "xsrc": "ATrav:20:9ad86a", "ysrc": "ATrav:20:9c3671", "jitter": 0.59, "marker": { "opacity": 0.7 }, "opacity": 0.67, "pointpos": 0, "spanmode": "soft", "bandwidth": 0, "showlegend": true, "selectedpoints": [] }, { "meta": { "columnNames": { "x": "TR name", "y": "I" } }, "mode": "markers", "name": "<i>R.kukunoris</i>", "type": "scatter", "xsrc": "ATrav:22:6921b3", "ysrc": "ATrav:22:89a893", "jitter": 0.59, "marker": { "opacity": 0.7 }, "opacity": 0.67, "pointpos": 0, "bandwidth": 0, "selectedpoints": [] }, { "meta": { "columnNames": { "x": "TR name", "y": "H" } }, "mode": "markers", "name": "<i>S.parvus</i>", "type": "scatter", "xsrc": "ATrav:28:890c54", "ysrc": "ATrav:28:5b68c3", "jitter": 0.59, "marker": { "opacity": 0.7 }, "opacity": 0.67, "bandwidth": 0, "orientation": "v", "selectedpoints": [] } ], "frames": [], "layout": { "xaxis": { "side": "bottom", "type": "category", "range": [ 1954.344416987357, 7779.049752583216 ], "anchor": "free", "autorange": false }, "yaxis": { "side": "left", "type": "linear", "range": [ 0.05325591131030072, 0.7634725083179786 ], "autorange": false }, "autosize": true, "dragmode": "select", "template": { "data": { "bar": [ { "type": "bar", "marker": { "colorbar": { "ticks": "", "outlinewidth": 0 } } } ], "table": [ { "type": "table", "cells": { "fill": { "color": "#EBF0F8" }, "line": { "color": "white" } }, "header": { "fill": { "color": "#C8D4E3" }, "line": { "color": "white" } } } ], "carpet": [ { "type": "carpet", "aaxis": { "gridcolor": "#C8D4E3", "linecolor": "#C8D4E3", "endlinecolor": "#2a3f5f", "minorgridcolor": "#C8D4E3", "startlinecolor": "#2a3f5f" }, "baxis": { "gridcolor": "#C8D4E3", "linecolor": "#C8D4E3", "endlinecolor": "#2a3f5f", "minorgridcolor": "#C8D4E3", "startlinecolor": "#2a3f5f" } } ], "mesh3d": [ { "type": "mesh3d", "colorbar": { "ticks": "", "outlinewidth": 0 } } ], "contour": [ { "type": "contour", "colorbar": { "ticks": "", "outlinewidth": 0 }, "autocolorscale": true } ], "heatmap": [ { "type": "heatmap", "colorbar": { "ticks": "", "outlinewidth": 0 }, "autocolorscale": true } ], "scatter": [ { "type": "scatter", "marker": { "colorbar": { "ticks": "", "outlinewidth": 0 } } } ], "surface": [ { "type": "surface", "colorbar": { "ticks": "", "outlinewidth": 0 } } ], "heatmapgl": [ { "type": "heatmapgl", "colorbar": { "ticks": "", "outlinewidth": 0 } } ], "histogram": [ { "type": "histogram", "marker": { "colorbar": { "ticks": "", "outlinewidth": 0 } } } ], "parcoords": [ { "line": { "colorbar": { "ticks": "", "outlinewidth": 0 } }, "type": "parcoords" } ], "scatter3d": [ { "type": "scatter3d", "marker": { "colorbar": { "ticks": "", "outlinewidth": 0 } } } ], "scattergl": [ { "type": "scattergl", "marker": { "colorbar": { "ticks": "", "outlinewidth": 0 } } } ], "choropleth": [ { "type": "choropleth", "colorbar": { "ticks": "", "outlinewidth": 0 } } ], "scattergeo": [ { "type": "scattergeo", "marker": { "colorbar": { "ticks": "", "outlinewidth": 0 } } } ], "histogram2d": [ { "type": "histogram2d", "colorbar": { "ticks": "", "outlinewidth": 0 }, "autocolorscale": true } ], "scatterpolar": [ { "type": "scatterpolar", "marker": { "colorbar": { "ticks": "", "outlinewidth": 0 } } } ], "contourcarpet": [ { "type": "contourcarpet", "colorbar": { "ticks": "", "outlinewidth": 0 } } ], "scattercarpet": [ { "type": "scattercarpet", "marker": { "colorbar": { "ticks": "", "outlinewidth": 0 } } } ], "scattermapbox": [ { "type": "scattermapbox", "marker": { "colorbar": { "ticks": "", "outlinewidth": 0 } } } ], "scatterpolargl": [ { "type": "scatterpolargl", "marker": { "colorbar": { "ticks": "", "outlinewidth": 0 } } } ], "scatterternary": [ { "type": "scatterternary", "marker": { "colorbar": { "ticks": "", "outlinewidth": 0 } } } ], "histogram2dcontour": [ { "type": "histogram2dcontour", "colorbar": { "ticks": "", "outlinewidth": 0 }, "autocolorscale": true } ] }, "layout": { "geo": { "bgcolor": "white", "showland": true, "lakecolor": "white", "landcolor": "white", "showlakes": true, "subunitcolor": "#C8D4E3" }, "font": { "color": "#2a3f5f" }, "polar": { "bgcolor": "white", "radialaxis": { "ticks": "", "gridcolor": "#EBF0F8", "linecolor": "#EBF0F8" }, "angularaxis": { "ticks": "", "gridcolor": "#EBF0F8", "linecolor": "#EBF0F8" } }, "scene": { "xaxis": { "ticks": "", "gridcolor": "#DFE8F3", "gridwidth": 2, "linecolor": "#EBF0F8", "zerolinecolor": "#EBF0F8", "showbackground": true, "backgroundcolor": "white" }, "yaxis": { "ticks": "", "gridcolor": "#DFE8F3", "gridwidth": 2, "linecolor": "#EBF0F8", "zerolinecolor": "#EBF0F8", "showbackground": true, "backgroundcolor": "white" }, "zaxis": { "ticks": "", "gridcolor": "#DFE8F3", "gridwidth": 2, "linecolor": "#EBF0F8", "zerolinecolor": "#EBF0F8", "showbackground": true, "backgroundcolor": "white" } }, "title": { "x": 0.05 }, "xaxis": { "ticks": "", "gridcolor": "#EBF0F8", "linecolor": "#EBF0F8", "automargin": true, "zerolinecolor": "#EBF0F8", "zerolinewidth": 2 }, "yaxis": { "ticks": "", "gridcolor": "#EBF0F8", "linecolor": "#EBF0F8", "automargin": true, "zerolinecolor": "#EBF0F8", "zerolinewidth": 2 }, "ternary": { "aaxis": { "ticks": "", "gridcolor": "#DFE8F3", "linecolor": "#A2B1C6" }, "baxis": { "ticks": "", "gridcolor": "#DFE8F3", "linecolor": "#A2B1C6" }, "caxis": { "ticks": "", "gridcolor": "#DFE8F3", "linecolor": "#A2B1C6" }, "bgcolor": "white" }, "colorway": [ "#636efa", "#EF553B", "#00cc96", "#ab63fa", "#19d3f3", "#e763fa", "#fecb52", "#ffa15a", "#ff6692", "#b6e880" ], "hovermode": "closest", "colorscale": { "diverging": [ [ 0, "#8e0152" ], [ 0.1, "#c51b7d" ], [ 0.2, "#de77ae" ], [ 0.3, "#f1b6da" ], [ 0.4, "#fde0ef" ], [ 0.5, "#f7f7f7" ], [ 0.6, "#e6f5d0" ], [ 0.7, "#b8e186" ], [ 0.8, "#7fbc41" ], [ 0.9, "#4d9221" ], [ 1, "#276419" ] ], "sequential": [ [ 0, "#0508b8" ], [ 0.0893854748603352, "#1910d8" ], [ 0.1787709497206704, "#3c19f0" ], [ 0.2681564245810056, "#6b1cfb" ], [ 0.3575418994413408, "#981cfd" ], [ 0.44692737430167595, "#bf1cfd" ], [ 0.5363128491620112, "#dd2bfd" ], [ 0.6256983240223464, "#f246fe" ], [ 0.7150837988826816, "#fc67fd" ], [ 0.8044692737430168, "#fe88fc" ], [ 0.8938547486033519, "#fea5fd" ], [ 0.9832402234636871, "#febefe" ], [ 1, "#fec3fe" ] ], "sequentialminus": [ [ 0, "#0508b8" ], [ 0.0893854748603352, "#1910d8" ], [ 0.1787709497206704, "#3c19f0" ], [ 0.2681564245810056, "#6b1cfb" ], [ 0.3575418994413408, "#981cfd" ], [ 0.44692737430167595, "#bf1cfd" ], [ 0.5363128491620112, "#dd2bfd" ], [ 0.6256983240223464, "#f246fe" ], [ 0.7150837988826816, "#fc67fd" ], [ 0.8044692737430168, "#fe88fc" ], [ 0.8938547486033519, "#fea5fd" ], [ 0.9832402234636871, "#febefe" ], [ 1, "#fec3fe" ] ] }, "plot_bgcolor": "white", "paper_bgcolor": "white", "shapedefaults": { "line": { "width": 0 }, "opacity": 0.4, "fillcolor": "#506784" }, "annotationdefaults": { "arrowhead": 0, "arrowcolor": "#506784", "arrowwidth": 1 } }, "themeRef": "PLOTLY_WHITE" }, "violingap": 0.56 } }, "height": null, "width": null, "user": { "profile_url": "https://chart-studio.plotly.com/~ATrav", "avatar_url": "https://storage.googleapis.com/plotly-prod-profiles/89.jpg", "background_url": "https://storage.googleapis.com/plotly-prod-profiles/bg-7.jpg", "bio": "", "nickname": "", "website": "", "stream_tokens": null, "feature_set_id": null, "csrf_token": null, "date_joined": "2025-07-26 09:57:47", "mapbox_access_tokens": null, "has_password": null, "username": "ATrav", "email": null, "is_active": null, "readonly": null, "is_dash_creator": null, "dash_created_count": null, "is_chart_creator": null, "charts_created_count": null } }, { "creation_time": "2025-08-02T16:51:11.881206Z", "comments": { "results": [], "count": 0 }, "parented": true, "embed_url": "https://chart-studio.plotly.com/~ATrav/29.embed", "fid": "ATrav:29", "filename": "Plot 29", "filetype": "plot", "img_url": "https://storage.googleapis.com/plotly-prod-images/ATrav/29/9_8G994D49DF8G1Z9XISAF03JE83CFWJ.png", "image_urls": { "default": "https://storage.googleapis.com/plotly-prod-images/ATrav/29/2_XONA3Z6GUCFMEYW9832E283UCSUN6X.png", "block-thumb": "https://storage.googleapis.com/plotly-prod-images/ATrav/29/8_LM3FWB4NL8SH9Y4KKY17I1SW37OTU7.png", "list-thumb": "https://storage.googleapis.com/plotly-prod-images/ATrav/29/9_8G994D49DF8G1Z9XISAF03JE83CFWJ.png" }, "api_urls": { "files": "https://api.plotly.com/v2/files/ATrav:29", "plots": "https://api.plotly.com/v2/plots/ATrav:29", "parent": "https://api.plotly.com/v2/folders/home?user=ATrav" }, "owner": "ATrav", "parent": -1, "preview": "", "referencers": [], "references": [], "title": "", "views": 1, "web_url": "https://chart-studio.plotly.com/~ATrav/29/", "world_readable": true, "date_modified": "2025-08-02T16:51:11.893Z", "stars": { "results": [], "count": 0 }, "collaborators": { "results": [], "count": 0 }, "subfolder_count": null, "refresh_interval": null, "organize_view_url": "https://chart-studio.plotly.com/~ATrav/29/", "current_user_permission": "read", "is_theme": null, "is_template": false, "autosize": true, "caption": "", "figure": { "data": [ { "meta": { "columnNames": { "y": "H" } }, "name": "<i>R.muscosa</i>", "type": "violin", "ysrc": "ATrav:21:53ca0e", "jitter": 0.55, "bandwidth": 0 }, { "meta": { "columnNames": { "y": "H" } }, "name": "<i>P.lessonae</i>", "type": "violin", "ysrc": "ATrav:26:17c621", "jitter": 0.59, "bandwidth": 0 }, { "meta": { "columnNames": { "y": "H" } }, "name": "<i>L.septentrionalis</i>", "type": "violin", "ysrc": "ATrav:25:ac2c61", "jitter": 0.55, "bandwidth": 0 }, { "meta": { "columnNames": { "y": "H" } }, "name": "<i>L.pipiens</i>", "type": "violin", "ysrc": "ATrav:24:d3c4ee", "jitter": 0.59, "bandwidth": 0 }, { "meta": { "columnNames": { "y": "I" } }, "name": "<i>A.catesbeiana</i>", "type": "violin", "ysrc": "ATrav:27:034350", "jitter": 0.59, "pointpos": 0, "bandwidth": 0 }, { "meta": { "columnNames": { "y": "H" } }, "name": "<i>L.sylvaticus</i>", "type": "violin", "ysrc": "ATrav:23:d678fd", "jitter": 0.59, "bandwidth": 0 }, { "meta": { "columnNames": { "x": "", "y": "I" } }, "mode": "markers", "name": "<i>R.temporaria</i>", "side": "both", "type": "violin", "ysrc": "ATrav:20:9c3671", "jitter": 0.59, "pointpos": 0, "spanmode": "soft", "bandwidth": 0, "showlegend": true }, { "meta": { "columnNames": { "x": "", "y": "I" } }, "mode": "markers", "name": "<i>R.kukunoris</i>", "type": "violin", "ysrc": "ATrav:22:89a893", "jitter": 0.59, "pointpos": 0, "bandwidth": 0, "stackgroup": null }, { "meta": { "columnNames": { "y": "H" } }, "name": "<i>S.parvus</i>", "type": "violin", "ysrc": "ATrav:28:5b68c3", "jitter": 0.59, "bandwidth": 0, "orientation": "v" } ], "frames": [], "layout": { "xaxis": { "type": "category", "range": [ -0.5, 8.5 ], "autorange": true }, "yaxis": { "type": "linear", "range": [ -0.2115568556345478, 1.2371909506345478 ], "autorange": true }, "autosize": true, "template": { "data": { "bar": [ { "type": "bar", "marker": { "colorbar": { "ticks": "", "outlinewidth": 0 } } } ], "table": [ { "type": "table", "cells": { "fill": { "color": "#EBF0F8" }, "line": { "color": "white" } }, "header": { "fill": { "color": "#C8D4E3" }, "line": { "color": "white" } } } ], "carpet": [ { "type": "carpet", "aaxis": { "gridcolor": "#C8D4E3", "linecolor": "#C8D4E3", "endlinecolor": "#2a3f5f", "minorgridcolor": "#C8D4E3", "startlinecolor": "#2a3f5f" }, "baxis": { "gridcolor": "#C8D4E3", "linecolor": "#C8D4E3", "endlinecolor": "#2a3f5f", "minorgridcolor": "#C8D4E3", "startlinecolor": "#2a3f5f" } } ], "mesh3d": [ { "type": "mesh3d", "colorbar": { "ticks": "", "outlinewidth": 0 } } ], "contour": [ { "type": "contour", "colorbar": { "ticks": "", "outlinewidth": 0 }, "autocolorscale": true } ], "heatmap": [ { "type": "heatmap", "colorbar": { "ticks": "", "outlinewidth": 0 }, "autocolorscale": true } ], "scatter": [ { "type": "scatter", "marker": { "colorbar": { "ticks": "", "outlinewidth": 0 } } } ], "surface": [ { "type": "surface", "colorbar": { "ticks": "", "outlinewidth": 0 } } ], "heatmapgl": [ { "type": "heatmapgl", "colorbar": { "ticks": "", "outlinewidth": 0 } } ], "histogram": [ { "type": "histogram", "marker": { "colorbar": { "ticks": "", "outlinewidth": 0 } } } ], "parcoords": [ { "line": { "colorbar": { "ticks": "", "outlinewidth": 0 } }, "type": "parcoords" } ], "scatter3d": [ { "type": "scatter3d", "marker": { "colorbar": { "ticks": "", "outlinewidth": 0 } } } ], "scattergl": [ { "type": "scattergl", "marker": { "colorbar": { "ticks": "", "outlinewidth": 0 } } } ], "choropleth": [ { "type": "choropleth", "colorbar": { "ticks": "", "outlinewidth": 0 } } ], "scattergeo": [ { "type": "scattergeo", "marker": { "colorbar": { "ticks": "", "outlinewidth": 0 } } } ], "histogram2d": [ { "type": "histogram2d", "colorbar": { "ticks": "", "outlinewidth": 0 }, "autocolorscale": true } ], "scatterpolar": [ { "type": "scatterpolar", "marker": { "colorbar": { "ticks": "", "outlinewidth": 0 } } } ], "contourcarpet": [ { "type": "contourcarpet", "colorbar": { "ticks": "", "outlinewidth": 0 } } ], "scattercarpet": [ { "type": "scattercarpet", "marker": { "colorbar": { "ticks": "", "outlinewidth": 0 } } } ], "scattermapbox": [ { "type": "scattermapbox", "marker": { "colorbar": { "ticks": "", "outlinewidth": 0 } } } ], "scatterpolargl": [ { "type": "scatterpolargl", "marker": { "colorbar": { "ticks": "", "outlinewidth": 0 } } } ], "scatterternary": [ { "type": "scatterternary", "marker": { "colorbar": { "ticks": "", "outlinewidth": 0 } } } ], "histogram2dcontour": [ { "type": "histogram2dcontour", "colorbar": { "ticks": "", "outlinewidth": 0 }, "autocolorscale": true } ] }, "layout": { "geo": { "bgcolor": "white", "showland": true, "lakecolor": "white", "landcolor": "white", "showlakes": true, "subunitcolor": "#C8D4E3" }, "font": { "color": "#2a3f5f" }, "polar": { "bgcolor": "white", "radialaxis": { "ticks": "", "gridcolor": "#EBF0F8", "linecolor": "#EBF0F8" }, "angularaxis": { "ticks": "", "gridcolor": "#EBF0F8", "linecolor": "#EBF0F8" } }, "scene": { "xaxis": { "ticks": "", "gridcolor": "#DFE8F3", "gridwidth": 2, "linecolor": "#EBF0F8", "zerolinecolor": "#EBF0F8", "showbackground": true, "backgroundcolor": "white" }, "yaxis": { "ticks": "", "gridcolor": "#DFE8F3", "gridwidth": 2, "linecolor": "#EBF0F8", "zerolinecolor": "#EBF0F8", "showbackground": true, "backgroundcolor": "white" }, "zaxis": { "ticks": "", "gridcolor": "#DFE8F3", "gridwidth": 2, "linecolor": "#EBF0F8", "zerolinecolor": "#EBF0F8", "showbackground": true, "backgroundcolor": "white" } }, "title": { "x": 0.05 }, "xaxis": { "ticks": "", "gridcolor": "#EBF0F8", "linecolor": "#EBF0F8", "automargin": true, "zerolinecolor": "#EBF0F8", "zerolinewidth": 2 }, "yaxis": { "ticks": "", "gridcolor": "#EBF0F8", "linecolor": "#EBF0F8", "automargin": true, "zerolinecolor": "#EBF0F8", "zerolinewidth": 2 }, "ternary": { "aaxis": { "ticks": "", "gridcolor": "#DFE8F3", "linecolor": "#A2B1C6" }, "baxis": { "ticks": "", "gridcolor": "#DFE8F3", "linecolor": "#A2B1C6" }, "caxis": { "ticks": "", "gridcolor": "#DFE8F3", "linecolor": "#A2B1C6" }, "bgcolor": "white" }, "colorway": [ "#636efa", "#EF553B", "#00cc96", "#ab63fa", "#19d3f3", "#e763fa", "#fecb52", "#ffa15a", "#ff6692", "#b6e880" ], "hovermode": "closest", "colorscale": { "diverging": [ [ 0, "#8e0152" ], [ 0.1, "#c51b7d" ], [ 0.2, "#de77ae" ], [ 0.3, "#f1b6da" ], [ 0.4, "#fde0ef" ], [ 0.5, "#f7f7f7" ], [ 0.6, "#e6f5d0" ], [ 0.7, "#b8e186" ], [ 0.8, "#7fbc41" ], [ 0.9, "#4d9221" ], [ 1, "#276419" ] ], "sequential": [ [ 0, "#0508b8" ], [ 0.0893854748603352, "#1910d8" ], [ 0.1787709497206704, "#3c19f0" ], [ 0.2681564245810056, "#6b1cfb" ], [ 0.3575418994413408, "#981cfd" ], [ 0.44692737430167595, "#bf1cfd" ], [ 0.5363128491620112, "#dd2bfd" ], [ 0.6256983240223464, "#f246fe" ], [ 0.7150837988826816, "#fc67fd" ], [ 0.8044692737430168, "#fe88fc" ], [ 0.8938547486033519, "#fea5fd" ], [ 0.9832402234636871, "#febefe" ], [ 1, "#fec3fe" ] ], "sequentialminus": [ [ 0, "#0508b8" ], [ 0.0893854748603352, "#1910d8" ], [ 0.1787709497206704, "#3c19f0" ], [ 0.2681564245810056, "#6b1cfb" ], [ 0.3575418994413408, "#981cfd" ], [ 0.44692737430167595, "#bf1cfd" ], [ 0.5363128491620112, "#dd2bfd" ], [ 0.6256983240223464, "#f246fe" ], [ 0.7150837988826816, "#fc67fd" ], [ 0.8044692737430168, "#fe88fc" ], [ 0.8938547486033519, "#fea5fd" ], [ 0.9832402234636871, "#febefe" ], [ 1, "#fec3fe" ] ] }, "plot_bgcolor": "white", "paper_bgcolor": "white", "shapedefaults": { "line": { "width": 0 }, "opacity": 0.4, "fillcolor": "#506784" }, "annotationdefaults": { "arrowhead": 0, "arrowcolor": "#506784", "arrowwidth": 1 } }, "themeRef": "PLOTLY_WHITE" }, "violingap": 0.56 } }, "height": null, "width": null, "user": { "profile_url": "https://chart-studio.plotly.com/~ATrav", "avatar_url": "https://storage.googleapis.com/plotly-prod-profiles/89.jpg", "background_url": "https://storage.googleapis.com/plotly-prod-profiles/bg-7.jpg", "bio": "", "nickname": "", "website": "", "stream_tokens": null, "feature_set_id": null, "csrf_token": null, "date_joined": "2025-07-26 09:57:47", "mapbox_access_tokens": null, "has_password": null, "username": "ATrav", "email": null, "is_active": null, "readonly": null, "is_dash_creator": null, "dash_created_count": null, "is_chart_creator": null, "charts_created_count": null } }, { "creation_time": "2025-08-02T13:32:43.775235Z", "comments": { "results": [], "count": 0 }, "parented": true, "embed_url": "https://chart-studio.plotly.com/~JohnJohnDoeDoe/7.embed", "fid": "JohnJohnDoeDoe:7", "filename": "Raw Data", "filetype": "plot", "img_url": "https://storage.googleapis.com/plotly-prod-images/JohnJohnDoeDoe/7/9_N55NY1RNUI3L8L8INPLV34L76SGFHU.png", "image_urls": { "default": "https://storage.googleapis.com/plotly-prod-images/JohnJohnDoeDoe/7/2_UNVOQRM41QRW07IKKDAMO1EWZZV305.png", "block-thumb": "https://storage.googleapis.com/plotly-prod-images/JohnJohnDoeDoe/7/8_UX0ZZZDRNWT12I0NEWXC0KDAUF0SVX.png", "list-thumb": "https://storage.googleapis.com/plotly-prod-images/JohnJohnDoeDoe/7/9_N55NY1RNUI3L8L8INPLV34L76SGFHU.png" }, "api_urls": { "files": "https://api.plotly.com/v2/files/JohnJohnDoeDoe:7", "plots": "https://api.plotly.com/v2/plots/JohnJohnDoeDoe:7", "parent": "https://api.plotly.com/v2/folders/home?user=JohnJohnDoeDoe" }, "owner": "JohnJohnDoeDoe", "parent": -1, "preview": "", "referencers": [], "references": [], "title": "", "views": 1, "web_url": "https://chart-studio.plotly.com/~JohnJohnDoeDoe/7/", "world_readable": true, "date_modified": "2025-08-02T13:32:43.784Z", "stars": { "results": [], "count": 0 }, "collaborators": { "results": [], "count": 0 }, "subfolder_count": null, "refresh_interval": null, "organize_view_url": "https://chart-studio.plotly.com/~JohnJohnDoeDoe/7/", "current_user_permission": "read", "is_theme": null, "is_template": false, "autosize": true, "caption": "", "figure": { "data": [ { "meta": { "columnNames": { "x": "A", "y": "B" } }, "mode": "markers", "name": "0° Incidence", "type": "scatter", "xsrc": "JohnJohnDoeDoe:6:41730a", "ysrc": "JohnJohnDoeDoe:6:104bc1", "marker": { "size": 4 } }, { "meta": { "columnNames": { "x": "A", "y": "C" } }, "mode": "markers", "name": "15° Incidence", "type": "scatter", "xsrc": "JohnJohnDoeDoe:6:41730a", "ysrc": "JohnJohnDoeDoe:6:2531af", "marker": { "size": 4 }, "stackgroup": null }, { "meta": { "columnNames": { "x": "A", "y": "D" } }, "mode": "markers", "name": "30° Incidence", "type": "scatter", "xsrc": "JohnJohnDoeDoe:6:41730a", "ysrc": "JohnJohnDoeDoe:6:3f7619", "marker": { "size": 4 }, "stackgroup": null }, { "meta": { "columnNames": { "x": "A", "y": "E" } }, "mode": "markers", "name": "37.5° Incidence", "type": "scatter", "xsrc": "JohnJohnDoeDoe:6:41730a", "ysrc": "JohnJohnDoeDoe:6:a662cb", "marker": { "size": 4 }, "stackgroup": null }, { "meta": { "columnNames": { "x": "A", "y": "F" } }, "mode": "markers", "name": "45° Incidence", "type": "scatter", "xsrc": "JohnJohnDoeDoe:6:41730a", "ysrc": "JohnJohnDoeDoe:6:93cd3c", "marker": { "size": 4 }, "stackgroup": null } ], "frames": [], "layout": { "title": { "text": "$\\text{Raw Reflectance Spectra for all Angles of Incidence } θ_i$" }, "xaxis": { "type": "linear", "range": [ 381.6658329164582, 718.3341670835417 ], "title": { "text": "$\\text{Wavelength } λ \\text{ / nm}$" }, "autorange": true }, "yaxis": { "type": "linear", "range": [ 0, 15.211691760890337 ], "title": { "text": "$\\text{Raw Reflectance } R \\text{ / %}$" }, "autorange": false }, "autosize": true, "template": { "data": { "bar": [ { "type": "bar", "marker": { "colorbar": { "ticks": "", "outlinewidth": 0 } } } ], "table": [ { "type": "table", "cells": { "fill": { "color": "#EBF0F8" }, "line": { "color": "white" } }, "header": { "fill": { "color": "#C8D4E3" }, "line": { "color": "white" } } } ], "carpet": [ { "type": "carpet", "aaxis": { "gridcolor": "#C8D4E3", "linecolor": "#C8D4E3", "endlinecolor": "#2a3f5f", "minorgridcolor": "#C8D4E3", "startlinecolor": "#2a3f5f" }, "baxis": { "gridcolor": "#C8D4E3", "linecolor": "#C8D4E3", "endlinecolor": "#2a3f5f", "minorgridcolor": "#C8D4E3", "startlinecolor": "#2a3f5f" } } ], "mesh3d": [ { "type": "mesh3d", "colorbar": { "ticks": "", "outlinewidth": 0 } } ], "contour": [ { "type": "contour", "colorbar": { "ticks": "", "outlinewidth": 0 }, "autocolorscale": true } ], "heatmap": [ { "type": "heatmap", "colorbar": { "ticks": "", "outlinewidth": 0 }, "autocolorscale": true } ], "scatter": [ { "type": "scatter", "marker": { "colorbar": { "ticks": "", "outlinewidth": 0 } } } ], "surface": [ { "type": "surface", "colorbar": { "ticks": "", "outlinewidth": 0 } } ], "heatmapgl": [ { "type": "heatmapgl", "colorbar": { "ticks": "", "outlinewidth": 0 } } ], "histogram": [ { "type": "histogram", "marker": { "colorbar": { "ticks": "", "outlinewidth": 0 } } } ], "parcoords": [ { "line": { "colorbar": { "ticks": "", "outlinewidth": 0 } }, "type": "parcoords" } ], "scatter3d": [ { "type": "scatter3d", "marker": { "colorbar": { "ticks": "", "outlinewidth": 0 } } } ], "scattergl": [ { "type": "scattergl", "marker": { "colorbar": { "ticks": "", "outlinewidth": 0 } } } ], "choropleth": [ { "type": "choropleth", "colorbar": { "ticks": "", "outlinewidth": 0 } } ], "scattergeo": [ { "type": "scattergeo", "marker": { "colorbar": { "ticks": "", "outlinewidth": 0 } } } ], "histogram2d": [ { "type": "histogram2d", "colorbar": { "ticks": "", "outlinewidth": 0 }, "autocolorscale": true } ], "scatterpolar": [ { "type": "scatterpolar", "marker": { "colorbar": { "ticks": "", "outlinewidth": 0 } } } ], "contourcarpet": [ { "type": "contourcarpet", "colorbar": { "ticks": "", "outlinewidth": 0 } } ], "scattercarpet": [ { "type": "scattercarpet", "marker": { "colorbar": { "ticks": "", "outlinewidth": 0 } } } ], "scattermapbox": [ { "type": "scattermapbox", "marker": { "colorbar": { "ticks": "", "outlinewidth": 0 } } } ], "scatterpolargl": [ { "type": "scatterpolargl", "marker": { "colorbar": { "ticks": "", "outlinewidth": 0 } } } ], "scatterternary": [ { "type": "scatterternary", "marker": { "colorbar": { "ticks": "", "outlinewidth": 0 } } } ], "histogram2dcontour": [ { "type": "histogram2dcontour", "colorbar": { "ticks": "", "outlinewidth": 0 }, "autocolorscale": true } ] }, "layout": { "geo": { "bgcolor": "white", "showland": true, "lakecolor": "white", "landcolor": "white", "showlakes": true, "subunitcolor": "#C8D4E3" }, "font": { "color": "#2a3f5f" }, "polar": { "bgcolor": "white", "radialaxis": { "ticks": "", "gridcolor": "#EBF0F8", "linecolor": "#EBF0F8" }, "angularaxis": { "ticks": "", "gridcolor": "#EBF0F8", "linecolor": "#EBF0F8" } }, "scene": { "xaxis": { "ticks": "", "gridcolor": "#DFE8F3", "gridwidth": 2, "linecolor": "#EBF0F8", "zerolinecolor": "#EBF0F8", "showbackground": true, "backgroundcolor": "white" }, "yaxis": { "ticks": "", "gridcolor": "#DFE8F3", "gridwidth": 2, "linecolor": "#EBF0F8", "zerolinecolor": "#EBF0F8", "showbackground": true, "backgroundcolor": "white" }, "zaxis": { "ticks": "", "gridcolor": "#DFE8F3", "gridwidth": 2, "linecolor": "#EBF0F8", "zerolinecolor": "#EBF0F8", "showbackground": true, "backgroundcolor": "white" } }, "title": { "x": 0.05 }, "xaxis": { "ticks": "", "gridcolor": "#EBF0F8", "linecolor": "#EBF0F8", "automargin": true, "zerolinecolor": "#EBF0F8", "zerolinewidth": 2 }, "yaxis": { "ticks": "", "gridcolor": "#EBF0F8", "linecolor": "#EBF0F8", "automargin": true, "zerolinecolor": "#EBF0F8", "zerolinewidth": 2 }, "ternary": { "aaxis": { "ticks": "", "gridcolor": "#DFE8F3", "linecolor": "#A2B1C6" }, "baxis": { "ticks": "", "gridcolor": "#DFE8F3", "linecolor": "#A2B1C6" }, "caxis": { "ticks": "", "gridcolor": "#DFE8F3", "linecolor": "#A2B1C6" }, "bgcolor": "white" }, "colorway": [ "#636efa", "#EF553B", "#00cc96", "#ab63fa", "#19d3f3", "#e763fa", "#fecb52", "#ffa15a", "#ff6692", "#b6e880" ], "hovermode": "closest", "colorscale": { "diverging": [ [ 0, "#8e0152" ], [ 0.1, "#c51b7d" ], [ 0.2, "#de77ae" ], [ 0.3, "#f1b6da" ], [ 0.4, "#fde0ef" ], [ 0.5, "#f7f7f7" ], [ 0.6, "#e6f5d0" ], [ 0.7, "#b8e186" ], [ 0.8, "#7fbc41" ], [ 0.9, "#4d9221" ], [ 1, "#276419" ] ], "sequential": [ [ 0, "#0508b8" ], [ 0.0893854748603352, "#1910d8" ], [ 0.1787709497206704, "#3c19f0" ], [ 0.2681564245810056, "#6b1cfb" ], [ 0.3575418994413408, "#981cfd" ], [ 0.44692737430167595, "#bf1cfd" ], [ 0.5363128491620112, "#dd2bfd" ], [ 0.6256983240223464, "#f246fe" ], [ 0.7150837988826816, "#fc67fd" ], [ 0.8044692737430168, "#fe88fc" ], [ 0.8938547486033519, "#fea5fd" ], [ 0.9832402234636871, "#febefe" ], [ 1, "#fec3fe" ] ], "sequentialminus": [ [ 0, "#0508b8" ], [ 0.0893854748603352, "#1910d8" ], [ 0.1787709497206704, "#3c19f0" ], [ 0.2681564245810056, "#6b1cfb" ], [ 0.3575418994413408, "#981cfd" ], [ 0.44692737430167595, "#bf1cfd" ], [ 0.5363128491620112, "#dd2bfd" ], [ 0.6256983240223464, "#f246fe" ], [ 0.7150837988826816, "#fc67fd" ], [ 0.8044692737430168, "#fe88fc" ], [ 0.8938547486033519, "#fea5fd" ], [ 0.9832402234636871, "#febefe" ], [ 1, "#fec3fe" ] ] }, "plot_bgcolor": "white", "paper_bgcolor": "white", "shapedefaults": { "line": { "width": 0 }, "opacity": 0.4, "fillcolor": "#506784" }, "annotationdefaults": { "arrowhead": 0, "arrowcolor": "#506784", "arrowwidth": 1 } }, "themeRef": "PLOTLY_WHITE" } } }, "height": null, "width": null, "user": { "profile_url": "https://chart-studio.plotly.com/~JohnJohnDoeDoe", "avatar_url": "https://storage.googleapis.com/plotly-prod-profiles/12.jpg", "background_url": "https://storage.googleapis.com/plotly-prod-profiles/bg-3.jpg", "bio": "", "nickname": "", "website": "", "stream_tokens": null, "feature_set_id": null, "csrf_token": null, "date_joined": "2025-07-28 14:07:39", "mapbox_access_tokens": null, "has_password": null, "username": "JohnJohnDoeDoe", "email": null, "is_active": null, "readonly": null, "is_dash_creator": null, "dash_created_count": null, "is_chart_creator": null, "charts_created_count": null } }, { "creation_time": "2025-08-02T13:02:21.615408Z", "comments": { "results": [], "count": 0 }, "parented": true, "embed_url": "https://chart-studio.plotly.com/~DickyDermawan/20.embed", "fid": "DickyDermawan:20", "filename": "LF-LPF", "filetype": "plot", "img_url": "https://storage.googleapis.com/plotly-prod-images/DickyDermawan/20/9_F80JRVPG0PF5P58DZUWCEL1FC50Q9G.png", "image_urls": { "default": "https://storage.googleapis.com/plotly-prod-images/DickyDermawan/20/2_3D70YBNINLLUC0VDEHH9GIWUJ8WUUA.png", "block-thumb": "https://storage.googleapis.com/plotly-prod-images/DickyDermawan/20/8_WKTFDY6GBON4JBJBIHEC6Z5AGVS8DI.png", "list-thumb": "https://storage.googleapis.com/plotly-prod-images/DickyDermawan/20/9_F80JRVPG0PF5P58DZUWCEL1FC50Q9G.png" }, "api_urls": { "files": "https://api.plotly.com/v2/files/DickyDermawan:20", "plots": "https://api.plotly.com/v2/plots/DickyDermawan:20", "parent": "https://api.plotly.com/v2/folders/home?user=DickyDermawan" }, "owner": "DickyDermawan", "parent": -1, "preview": "", "referencers": [], "references": [], "title": "", "views": 0, "web_url": "https://chart-studio.plotly.com/~DickyDermawan/20/", "world_readable": true, "date_modified": "2025-08-02T13:10:07.677Z", "stars": { "results": [], "count": 0 }, "collaborators": { "results": [], "count": 0 }, "subfolder_count": null, "refresh_interval": null, "organize_view_url": "https://chart-studio.plotly.com/~DickyDermawan/20/", "current_user_permission": "read", "is_theme": null, "is_template": false, "autosize": true, "caption": "", "figure": { "data": [ { "line": { "color": "rgb(255, 127, 14)" }, "meta": { "columnNames": { "x": "3.972642e+002", "y": "0.000000e+000" } }, "mode": "lines", "name": "Phenol-Formaldehyde (Control)", "type": "scatter", "xsrc": "DickyDermawan:18:0728ca", "ysrc": "DickyDermawan:18:2f6607" }, { "line": { "color": "rgb(31, 119, 180)" }, "meta": { "columnNames": { "x": "3.972642e+002", "y": "0.000000e+000" } }, "mode": "lines", "name": "25% Lignin Substituted Phenol-Formaldehyde Resin (25% LPF)", "type": "scatter", "xsrc": "DickyDermawan:19:6f22fa", "ysrc": "DickyDermawan:19:c03d75", "opacity": 1, "stackgroup": null } ], "frames": [], "layout": { "font": { "size": 16 }, "xaxis": { "type": "linear", "dtick": 400, "range": [ 4000, 400 ], "ticks": "outside", "title": { "font": { "size": 16 }, "text": "Wave number, cm<sup>-1</sup>" }, "mirror": "ticks", "showgrid": true, "showline": true, "tickmode": "linear", "zeroline": false, "autorange": false, "gridwidth": 1, "linecolor": "rgb(42, 63, 95)", "linewidth": 2, "showspikes": true }, "yaxis": { "side": "left", "type": "linear", "dtick": 20, "range": [ 20, 100 ], "tick0": 0, "ticks": "outside", "title": { "font": { "size": 16 }, "text": "%Transmittance" }, "mirror": "ticks", "showgrid": true, "showline": true, "tickmode": "linear", "zeroline": false, "autorange": false, "gridwidth": 1, "linecolor": "rgb(42, 63, 95)", "linewidth": 2 }, "legend": { "x": 0.024444444444444446, "y": 0.1362530413625304 }, "autosize": false, "colorway": [ "#1f77b4", "#ff7f0e", "#2ca02c", "#d62728", "#9467bd", "#8c564b", "#e377c2", "#7f7f7f", "#bcbd22", "#17becf" ], "template": { "data": { "bar": [ { "type": "bar", "marker": { "colorbar": { "ticks": "", "outlinewidth": 0 } } } ], "table": [ { "type": "table", "cells": { "fill": { "color": "#EBF0F8" }, "line": { "color": "white" } }, "header": { "fill": { "color": "#C8D4E3" }, "line": { "color": "white" } } } ], "carpet": [ { "type": "carpet", "aaxis": { "gridcolor": "#C8D4E3", "linecolor": "#C8D4E3", "endlinecolor": "#2a3f5f", "minorgridcolor": "#C8D4E3", "startlinecolor": "#2a3f5f" }, "baxis": { "gridcolor": "#C8D4E3", "linecolor": "#C8D4E3", "endlinecolor": "#2a3f5f", "minorgridcolor": "#C8D4E3", "startlinecolor": "#2a3f5f" } } ], "mesh3d": [ { "type": "mesh3d", "colorbar": { "ticks": "", "outlinewidth": 0 } } ], "contour": [ { "type": "contour", "colorbar": { "ticks": "", "outlinewidth": 0 }, "autocolorscale": true } ], "heatmap": [ { "type": "heatmap", "colorbar": { "ticks": "", "outlinewidth": 0 }, "autocolorscale": true } ], "scatter": [ { "type": "scatter", "marker": { "colorbar": { "ticks": "", "outlinewidth": 0 } } } ], "surface": [ { "type": "surface", "colorbar": { "ticks": "", "outlinewidth": 0 } } ], "heatmapgl": [ { "type": "heatmapgl", "colorbar": { "ticks": "", "outlinewidth": 0 } } ], "histogram": [ { "type": "histogram", "marker": { "colorbar": { "ticks": "", "outlinewidth": 0 } } } ], "parcoords": [ { "line": { "colorbar": { "ticks": "", "outlinewidth": 0 } }, "type": "parcoords" } ], "scatter3d": [ { "type": "scatter3d", "marker": { "colorbar": { "ticks": "", "outlinewidth": 0 } } } ], "scattergl": [ { "type": "scattergl", "marker": { "colorbar": { "ticks": "", "outlinewidth": 0 } } } ], "choropleth": [ { "type": "choropleth", "colorbar": { "ticks": "", "outlinewidth": 0 } } ], "scattergeo": [ { "type": "scattergeo", "marker": { "colorbar": { "ticks": "", "outlinewidth": 0 } } } ], "histogram2d": [ { "type": "histogram2d", "colorbar": { "ticks": "", "outlinewidth": 0 }, "autocolorscale": true } ], "scatterpolar": [ { "type": "scatterpolar", "marker": { "colorbar": { "ticks": "", "outlinewidth": 0 } } } ], "contourcarpet": [ { "type": "contourcarpet", "colorbar": { "ticks": "", "outlinewidth": 0 } } ], "scattercarpet": [ { "type": "scattercarpet", "marker": { "colorbar": { "ticks": "", "outlinewidth": 0 } } } ], "scattermapbox": [ { "type": "scattermapbox", "marker": { "colorbar": { "ticks": "", "outlinewidth": 0 } } } ], "scatterpolargl": [ { "type": "scatterpolargl", "marker": { "colorbar": { "ticks": "", "outlinewidth": 0 } } } ], "scatterternary": [ { "type": "scatterternary", "marker": { "colorbar": { "ticks": "", "outlinewidth": 0 } } } ], "histogram2dcontour": [ { "type": "histogram2dcontour", "colorbar": { "ticks": "", "outlinewidth": 0 }, "autocolorscale": true } ] }, "layout": { "geo": { "bgcolor": "white", "showland": true, "lakecolor": "white", "landcolor": "white", "showlakes": true, "subunitcolor": "#C8D4E3" }, "font": { "color": "#2a3f5f" }, "polar": { "bgcolor": "white", "radialaxis": { "ticks": "", "gridcolor": "#EBF0F8", "linecolor": "#EBF0F8" }, "angularaxis": { "ticks": "", "gridcolor": "#EBF0F8", "linecolor": "#EBF0F8" } }, "scene": { "xaxis": { "ticks": "", "gridcolor": "#DFE8F3", "gridwidth": 2, "linecolor": "#EBF0F8", "zerolinecolor": "#EBF0F8", "showbackground": true, "backgroundcolor": "white" }, "yaxis": { "ticks": "", "gridcolor": "#DFE8F3", "gridwidth": 2, "linecolor": "#EBF0F8", "zerolinecolor": "#EBF0F8", "showbackground": true, "backgroundcolor": "white" }, "zaxis": { "ticks": "", "gridcolor": "#DFE8F3", "gridwidth": 2, "linecolor": "#EBF0F8", "zerolinecolor": "#EBF0F8", "showbackground": true, "backgroundcolor": "white" } }, "title": { "x": 0.05 }, "xaxis": { "ticks": "", "gridcolor": "#EBF0F8", "linecolor": "#EBF0F8", "automargin": true, "zerolinecolor": "#EBF0F8", "zerolinewidth": 2 }, "yaxis": { "ticks": "", "gridcolor": "#EBF0F8", "linecolor": "#EBF0F8", "automargin": true, "zerolinecolor": "#EBF0F8", "zerolinewidth": 2 }, "ternary": { "aaxis": { "ticks": "", "gridcolor": "#DFE8F3", "linecolor": "#A2B1C6" }, "baxis": { "ticks": "", "gridcolor": "#DFE8F3", "linecolor": "#A2B1C6" }, "caxis": { "ticks": "", "gridcolor": "#DFE8F3", "linecolor": "#A2B1C6" }, "bgcolor": "white" }, "colorway": [ "#636efa", "#EF553B", "#00cc96", "#ab63fa", "#19d3f3", "#e763fa", "#fecb52", "#ffa15a", "#ff6692", "#b6e880" ], "hovermode": "closest", "colorscale": { "diverging": [ [ 0, "#8e0152" ], [ 0.1, "#c51b7d" ], [ 0.2, "#de77ae" ], [ 0.3, "#f1b6da" ], [ 0.4, "#fde0ef" ], [ 0.5, "#f7f7f7" ], [ 0.6, "#e6f5d0" ], [ 0.7, "#b8e186" ], [ 0.8, "#7fbc41" ], [ 0.9, "#4d9221" ], [ 1, "#276419" ] ], "sequential": [ [ 0, "#0508b8" ], [ 0.0893854748603352, "#1910d8" ], [ 0.1787709497206704, "#3c19f0" ], [ 0.2681564245810056, "#6b1cfb" ], [ 0.3575418994413408, "#981cfd" ], [ 0.44692737430167595, "#bf1cfd" ], [ 0.5363128491620112, "#dd2bfd" ], [ 0.6256983240223464, "#f246fe" ], [ 0.7150837988826816, "#fc67fd" ], [ 0.8044692737430168, "#fe88fc" ], [ 0.8938547486033519, "#fea5fd" ], [ 0.9832402234636871, "#febefe" ], [ 1, "#fec3fe" ] ], "sequentialminus": [ [ 0, "#0508b8" ], [ 0.0893854748603352, "#1910d8" ], [ 0.1787709497206704, "#3c19f0" ], [ 0.2681564245810056, "#6b1cfb" ], [ 0.3575418994413408, "#981cfd" ], [ 0.44692737430167595, "#bf1cfd" ], [ 0.5363128491620112, "#dd2bfd" ], [ 0.6256983240223464, "#f246fe" ], [ 0.7150837988826816, "#fc67fd" ], [ 0.8044692737430168, "#fe88fc" ], [ 0.8938547486033519, "#fea5fd" ], [ 0.9832402234636871, "#febefe" ], [ 1, "#fec3fe" ] ] }, "plot_bgcolor": "white", "paper_bgcolor": "white", "shapedefaults": { "line": { "width": 0 }, "opacity": 0.4, "fillcolor": "#506784" }, "annotationdefaults": { "arrowhead": 0, "arrowcolor": "#506784", "arrowwidth": 1 } }, "themeRef": "PLOTLY_WHITE" } } }, "height": null, "width": null, "user": { "profile_url": "https://chart-studio.plotly.com/~DickyDermawan", "avatar_url": "https://storage.googleapis.com/plotly-prod-profiles/84.jpg", "background_url": "https://storage.googleapis.com/plotly-prod-profiles/bg-6.jpg", "bio": "", "nickname": "", "website": "", "stream_tokens": null, "feature_set_id": null, "csrf_token": null, "date_joined": "2025-07-26 02:20:04", "mapbox_access_tokens": null, "has_password": null, "username": "DickyDermawan", "email": null, "is_active": null, "readonly": null, "is_dash_creator": null, "dash_created_count": null, "is_chart_creator": null, "charts_created_count": null } }, { "creation_time": "2025-08-02T10:12:17.058419Z", "comments": { "results": [], "count": 0 }, "parented": true, "embed_url": "https://chart-studio.plotly.com/~gerhardhattingh/22.embed", "fid": "gerhardhattingh:22", "filename": "GanntPlot02", "filetype": "plot", "img_url": "https://api.plotly.com/v2/files/gerhardhattingh:22/image?image_name=list-thumb", "image_urls": { "default": "https://storage.googleapis.com/plotly-prod-images/gerhardhattingh/22/2_BAFWGMP1F15TZM7GJB5B3R6KTTQDYW.png", "block-thumb": "https://storage.googleapis.com/plotly-prod-images/gerhardhattingh/22/8_17RVOPNTT5STWH7X65DX8HFM52WCQQ.png", "list-thumb": "https://api.plotly.com/v2/files/gerhardhattingh:22/image?image_name=list-thumb" }, "api_urls": { "files": "https://api.plotly.com/v2/files/gerhardhattingh:22", "plots": "https://api.plotly.com/v2/plots/gerhardhattingh:22", "parent": "https://api.plotly.com/v2/folders/home?user=gerhardhattingh" }, "owner": "gerhardhattingh", "parent": -1, "preview": "", "referencers": [], "references": [], "title": "", "views": 1, "web_url": "https://chart-studio.plotly.com/~gerhardhattingh/22/", "world_readable": true, "date_modified": "2025-08-02T18:20:05.108Z", "stars": { "results": [], "count": 0 }, "collaborators": { "results": [], "count": 0 }, "subfolder_count": null, "refresh_interval": null, "organize_view_url": "https://chart-studio.plotly.com/~gerhardhattingh/22/", "current_user_permission": "read", "is_theme": null, "is_template": false, "autosize": true, "caption": "", "figure": { "data": [ { "uid": "4c99571f-99bf-11e8-b350-509a4cb4e5a7", "meta": { "columnNames": { "x": "A", "y": "" } }, "mode": "lines+markers", "name": "<br>", "type": "scatter", "xsrc": "gerhardhattingh:21:b3d75e", "marker": { "size": 1, "color": "rgb(0, 0, 255)" }, "visible": true, "hoverinfo": "none", "showlegend": true } ], "frames": [], "layout": { "font": { "family": "Arial" }, "title": { "text": "Gantt Chart" }, "width": 900, "xaxis": { "type": "date", "range": [ "2017-12-31 20:00", "2018-01-01 00:30" ], "ticks": "", "title": { "font": { "family": "Arial" } }, "domain": [ 0, 1 ], "showgrid": true, "tickfont": { "family": "Arial" }, "zeroline": false, "autorange": false, "fixedrange": true, "showspikes": false, "tickformat": "%H:%M", "rangeselector": { "buttons": [ { "step": "day", "count": 7, "label": "1w", "stepmode": "backward" }, { "step": "month", "count": 1, "label": "1m", "stepmode": "backward" }, { "step": "month", "count": 6, "label": "6m", "stepmode": "backward" }, { "step": "year", "count": 1, "label": "YTD", "stepmode": "todate" }, { "step": "year", "count": 1, "label": "1y", "stepmode": "backward" }, { "step": "all" } ], "visible": false }, "showticklabels": true }, "yaxis": { "range": [ -1.2476190476190476, 6.752380952380952 ], "ticks": "", "title": { "font": { "family": "Arial" }, "text": "Click to enter Y axis title" }, "anchor": "x", "domain": [ 0, 1 ], "showgrid": true, "tickfont": { "size": 14, "family": "Arial" }, "ticktext": [ "M5", "M3", "M4", "M2", "M1", "M0" ], "tickvals": [ 0, 1, 2, 3, 4, 5 ], "zeroline": false, "autorange": false, "fixedrange": true, "tickformat": "" }, "height": 600, "images": [], "shapes": [ { "x0": "2017-12-31 20:00:00", "x1": "2017-12-31 23:10:00", "y0": 4.8, "y1": 5.2, "line": { "width": 0 }, "type": "rect", "xref": "x", "yref": "y", "opacity": 1, "visible": true, "fillcolor": "rgb(7, 94, 30)" }, { "x0": "2017-12-31 20:00:00", "x1": "2017-12-31 22:10:00", "y0": 4.7, "y1": 4.8, "line": { "color": "#444444", "width": 1 }, "type": "rect", "xref": "x", "opacity": 1, "visible": true, "fillcolor": "rgb(242, 158, 19)" }, { "x0": "2017-12-31 23:10:00", "x1": "2017-12-31 23:18:00", "y0": 3.8, "y1": 4.2, "line": { "width": 0 }, "type": "rect", "xref": "x", "yref": "y", "opacity": 1, "visible": true, "fillcolor": "rgb(255, 0, 0)" }, { "x0": "2017-12-31 23:10:00", "x1": "2017-12-31 23:14:00", "y0": 2.8, "y1": 3.2, "line": { "width": 0 }, "type": "rect", "xref": "x", "yref": "y", "opacity": 1, "visible": true, "fillcolor": "rgb(255, 0, 0)" }, { "x0": "2017-12-31 23:18:00", "x1": "2017-12-31 23:25:00", "y0": 1.7999999999999998, "y1": 2.2, "line": { "width": 0 }, "type": "rect", "xref": "x", "yref": "y", "opacity": 1, "visible": true, "fillcolor": "rgb(255, 0, 0)" }, { "x0": "2017-12-31 23:18:00", "x1": "2017-12-31 23:22:00", "y0": 3.8, "y1": 4.2, "line": { "width": 0 }, "type": "rect", "xref": "x", "yref": "y", "opacity": 1, "visible": true, "fillcolor": "rgb(255, 0, 0)" }, { "x0": "2017-12-31 23:15:00", "x1": "2017-12-31 23:31:00", "y0": 4.8, "y1": 5.2, "line": { "width": 0 }, "type": "rect", "xref": "x", "yref": "y", "opacity": 1, "visible": true, "fillcolor": "rgb(255, 0, 0)" }, { "x0": "2017-12-31 23:31:00", "x1": "2017-12-31 23:34:00", "y0": 0.8, "y1": 1.2, "line": { "width": 0 }, "type": "rect", "xref": "x", "yref": "y", "opacity": 1, "visible": true, "fillcolor": "rgb(255, 0, 0)" }, { "x0": "2017-12-31 23:34:00", "x1": "2017-12-31 23:40:00", "y0": 0.8, "y1": 1.2, "line": { "width": 0 }, "type": "rect", "xref": "x", "yref": "y", "opacity": 1, "visible": true, "fillcolor": "rgb(0, 255, 0)" }, { "x0": "2017-12-31 23:35:00", "x1": "2018-01-01 23:38:00", "y0": 4.8, "y1": 5.2, "line": { "width": 0 }, "type": "rect", "xref": "x", "yref": "y", "opacity": 1, "visible": true, "fillcolor": "rgb(0, 255, 0)" }, { "x0": "2017-12-31 23:52:00", "x1": "2017-12-31 23:57:00", "y0": 1.8, "y1": 2.2, "line": { "width": 0 }, "type": "rect", "xref": "x", "yref": "y", "opacity": 1, "visible": true, "fillcolor": "rgb(0, 255, 0)" }, { "x0": "2017-12-31 23:38:00", "x1": "2017-12-31 23:52:00", "y0": 1.8, "y1": 2.2, "line": { "width": 0 }, "type": "rect", "xref": "x", "yref": "y", "opacity": 1, "visible": true, "fillcolor": "rgb(0, 255, 0)" }, { "x0": "2017-12-31 23:38:00", "x1": "2017-12-31 23:47:00", "y0": 3.8, "y1": 4.2, "line": { "width": 0 }, "type": "rect", "xref": "x", "yref": "y", "opacity": 1, "visible": true, "fillcolor": "rgb(0, 255, 0)" }, { "x0": "2017-12-31 23:57:00", "x1": "2017-12-31 23:59:00", "y0": 3.8, "y1": 4.2, "line": { "width": 0 }, "type": "rect", "xref": "x", "yref": "y", "opacity": 1, "visible": true, "fillcolor": "rgb(0, 255, 0)" }, { "x0": "2017-12-31 23:00:00", "x1": "2017-12-31 23:02:00", "y0": 2.8, "y1": 3.2, "line": { "width": 0 }, "type": "rect", "xref": "x", "yref": "y", "opacity": 1, "visible": true, "fillcolor": "rgb(0, 0, 255)" }, { "x0": "2017-12-31 23:00:00", "x1": "2017-12-31 23:04:00", "y0": -0.2, "y1": 0.2, "line": { "width": 0 }, "type": "rect", "xref": "x", "yref": "y", "opacity": 1, "visible": true, "fillcolor": "rgb(0, 0, 255)" }, { "x0": "2017-12-31 23:02:00", "x1": "2017-12-31 23:05:00", "y0": 3.8, "y1": 4.2, "line": { "width": 0 }, "type": "rect", "xref": "x", "yref": "y", "opacity": 1, "visible": true, "fillcolor": "rgb(0, 0, 255)" }, { "x0": "2017-12-31 23:04:00", "x1": "2017-12-31 23:06:00", "y0": 2.8, "y1": 3.2, "line": { "width": 0 }, "type": "rect", "xref": "x", "yref": "y", "opacity": 1, "visible": true, "fillcolor": "rgb(0, 0, 255)" }, { "x0": "2017-12-31 23:05:00", "x1": "2017-12-31 23:11:00", "y0": 1.8, "y1": 2.2, "line": { "width": 0 }, "type": "rect", "xref": "x", "yref": "y", "opacity": 1, "visible": true, "fillcolor": "rgb(0, 0, 255)" }, { "x0": "2017-12-31 23:06:00", "x1": "2017-12-31 23:10:00", "y0": 0.8, "y1": 1.2, "line": { "width": 0 }, "type": "rect", "xref": "x", "yref": "y", "opacity": 1, "visible": true, "fillcolor": "rgb(0, 0, 255)" }, { "x0": "2017-12-31 23:11:00", "x1": "2017-12-31 23:13:00", "y0": 4.8, "y1": 5.2, "line": { "width": 0 }, "type": "rect", "xref": "x", "yref": "y", "opacity": 1, "visible": true, "fillcolor": "rgb(0, 0, 255)" }, { "x0": "2017-12-31 23:13:00", "x1": "2017-12-31 23:16:00", "y0": -0.2, "y1": 0.2, "line": { "width": 0 }, "type": "rect", "xref": "x", "yref": "y", "opacity": 1, "visible": true, "fillcolor": "rgb(0, 0, 255)" } ], "dragmode": "pan", "hovermode": "closest", "hoverlabel": { "font": { "family": "Arial" } }, "showlegend": false, "annotations": [ { "x": "2017-12-31 20:00:51.0081", "y": 5, "font": { "size": 10, "color": "rgb(255, 255, 255)", "family": "Arial" }, "text": "F1028A", "align": "center", "xanchor": "left", "showarrow": false } ] } }, "height": 600, "width": 900, "user": { "profile_url": "https://chart-studio.plotly.com/~gerhardhattingh", "avatar_url": "https://storage.googleapis.com/plotly-prod-profiles/31.jpg", "background_url": "https://storage.googleapis.com/plotly-prod-profiles/bg-6.jpg", "bio": "", "nickname": "", "website": "", "stream_tokens": null, "feature_set_id": null, "csrf_token": null, "date_joined": "2024-05-07 20:57:47", "mapbox_access_tokens": null, "has_password": null, "username": "gerhardhattingh", "email": null, "is_active": null, "readonly": null, "is_dash_creator": null, "dash_created_count": null, "is_chart_creator": null, "charts_created_count": null } }, { "creation_time": "2025-08-02T06:06:31.912044Z", "comments": { "results": [], "count": 0 }, "parented": true, "embed_url": "https://chart-studio.plotly.com/~stegano/3.embed", "fid": "stegano:3", "filename": "Plot 3", "filetype": "plot", "img_url": "https://api.plotly.com/v2/files/stegano:3/image?image_name=list-thumb", "image_urls": { "default": "https://storage.googleapis.com/plotly-prod-images/stegano/3/2_1837JJEEK8ZLAQUXSUO4W3CRZVSELV.png", "block-thumb": "https://storage.googleapis.com/plotly-prod-images/stegano/3/8_C68R235L6TZ483IZ31Q7HPBQ68Q5TT.png", "list-thumb": "https://api.plotly.com/v2/files/stegano:3/image?image_name=list-thumb" }, "api_urls": { "files": "https://api.plotly.com/v2/files/stegano:3", "plots": "https://api.plotly.com/v2/plots/stegano:3", "parent": "https://api.plotly.com/v2/folders/home?user=stegano" }, "owner": "stegano", "parent": -1, "preview": "", "referencers": [], "references": [], "title": "", "views": 0, "web_url": "https://chart-studio.plotly.com/~stegano/3/", "world_readable": true, "date_modified": "2025-08-02T06:06:31.923Z", "stars": { "results": [], "count": 0 }, "collaborators": { "results": [], "count": 0 }, "subfolder_count": null, "refresh_interval": null, "organize_view_url": "https://chart-studio.plotly.com/~stegano/3/", "current_user_permission": "read", "is_theme": null, "is_template": false, "autosize": true, "caption": "", "figure": { "data": [ { "meta": { "columnNames": { "x": "A", "y": "B" } }, "mode": "lines", "type": "scatter", "xsrc": "stegano:2:9842e2", "ysrc": "stegano:2:a4b1af" } ], "frames": [], "layout": { "xaxis": { "type": "linear", "range": [ 1, 7 ], "autorange": true }, "yaxis": { "type": "linear", "range": [ 0.7222222222222222, 6.277777777777778 ], "autorange": true }, "autosize": true, "template": { "data": { "bar": [ { "type": "bar", "marker": { "colorbar": { "ticks": "", "outlinewidth": 0 } } } ], "table": [ { "type": "table", "cells": { "fill": { "color": "#EBF0F8" }, "line": { "color": "white" } }, "header": { "fill": { "color": "#C8D4E3" }, "line": { "color": "white" } } } ], "carpet": [ { "type": "carpet", "aaxis": { "gridcolor": "#C8D4E3", "linecolor": "#C8D4E3", "endlinecolor": "#2a3f5f", "minorgridcolor": "#C8D4E3", "startlinecolor": "#2a3f5f" }, "baxis": { "gridcolor": "#C8D4E3", "linecolor": "#C8D4E3", "endlinecolor": "#2a3f5f", "minorgridcolor": "#C8D4E3", "startlinecolor": "#2a3f5f" } } ], "mesh3d": [ { "type": "mesh3d", "colorbar": { "ticks": "", "outlinewidth": 0 } } ], "contour": [ { "type": "contour", "colorbar": { "ticks": "", "outlinewidth": 0 }, "autocolorscale": true } ], "heatmap": [ { "type": "heatmap", "colorbar": { "ticks": "", "outlinewidth": 0 }, "autocolorscale": true } ], "scatter": [ { "type": "scatter", "marker": { "colorbar": { "ticks": "", "outlinewidth": 0 } } } ], "surface": [ { "type": "surface", "colorbar": { "ticks": "", "outlinewidth": 0 } } ], "heatmapgl": [ { "type": "heatmapgl", "colorbar": { "ticks": "", "outlinewidth": 0 } } ], "histogram": [ { "type": "histogram", "marker": { "colorbar": { "ticks": "", "outlinewidth": 0 } } } ], "parcoords": [ { "line": { "colorbar": { "ticks": "", "outlinewidth": 0 } }, "type": "parcoords" } ], "scatter3d": [ { "type": "scatter3d", "marker": { "colorbar": { "ticks": "", "outlinewidth": 0 } } } ], "scattergl": [ { "type": "scattergl", "marker": { "colorbar": { "ticks": "", "outlinewidth": 0 } } } ], "choropleth": [ { "type": "choropleth", "colorbar": { "ticks": "", "outlinewidth": 0 } } ], "scattergeo": [ { "type": "scattergeo", "marker": { "colorbar": { "ticks": "", "outlinewidth": 0 } } } ], "histogram2d": [ { "type": "histogram2d", "colorbar": { "ticks": "", "outlinewidth": 0 }, "autocolorscale": true } ], "scatterpolar": [ { "type": "scatterpolar", "marker": { "colorbar": { "ticks": "", "outlinewidth": 0 } } } ], "contourcarpet": [ { "type": "contourcarpet", "colorbar": { "ticks": "", "outlinewidth": 0 } } ], "scattercarpet": [ { "type": "scattercarpet", "marker": { "colorbar": { "ticks": "", "outlinewidth": 0 } } } ], "scattermapbox": [ { "type": "scattermapbox", "marker": { "colorbar": { "ticks": "", "outlinewidth": 0 } } } ], "scatterpolargl": [ { "type": "scatterpolargl", "marker": { "colorbar": { "ticks": "", "outlinewidth": 0 } } } ], "scatterternary": [ { "type": "scatterternary", "marker": { "colorbar": { "ticks": "", "outlinewidth": 0 } } } ], "histogram2dcontour": [ { "type": "histogram2dcontour", "colorbar": { "ticks": "", "outlinewidth": 0 }, "autocolorscale": true } ] }, "layout": { "geo": { "bgcolor": "white", "showland": true, "lakecolor": "white", "landcolor": "white", "showlakes": true, "subunitcolor": "#C8D4E3" }, "font": { "color": "#2a3f5f" }, "polar": { "bgcolor": "white", "radialaxis": { "ticks": "", "gridcolor": "#EBF0F8", "linecolor": "#EBF0F8" }, "angularaxis": { "ticks": "", "gridcolor": "#EBF0F8", "linecolor": "#EBF0F8" } }, "scene": { "xaxis": { "ticks": "", "gridcolor": "#DFE8F3", "gridwidth": 2, "linecolor": "#EBF0F8", "zerolinecolor": "#EBF0F8", "showbackground": true, "backgroundcolor": "white" }, "yaxis": { "ticks": "", "gridcolor": "#DFE8F3", "gridwidth": 2, "linecolor": "#EBF0F8", "zerolinecolor": "#EBF0F8", "showbackground": true, "backgroundcolor": "white" }, "zaxis": { "ticks": "", "gridcolor": "#DFE8F3", "gridwidth": 2, "linecolor": "#EBF0F8", "zerolinecolor": "#EBF0F8", "showbackground": true, "backgroundcolor": "white" } }, "title": { "x": 0.05 }, "xaxis": { "ticks": "", "gridcolor": "#EBF0F8", "linecolor": "#EBF0F8", "automargin": true, "zerolinecolor": "#EBF0F8", "zerolinewidth": 2 }, "yaxis": { "ticks": "", "gridcolor": "#EBF0F8", "linecolor": "#EBF0F8", "automargin": true, "zerolinecolor": "#EBF0F8", "zerolinewidth": 2 }, "ternary": { "aaxis": { "ticks": "", "gridcolor": "#DFE8F3", "linecolor": "#A2B1C6" }, "baxis": { "ticks": "", "gridcolor": "#DFE8F3", "linecolor": "#A2B1C6" }, "caxis": { "ticks": "", "gridcolor": "#DFE8F3", "linecolor": "#A2B1C6" }, "bgcolor": "white" }, "colorway": [ "#636efa", "#EF553B", "#00cc96", "#ab63fa", "#19d3f3", "#e763fa", "#fecb52", "#ffa15a", "#ff6692", "#b6e880" ], "hovermode": "closest", "colorscale": { "diverging": [ [ 0, "#8e0152" ], [ 0.1, "#c51b7d" ], [ 0.2, "#de77ae" ], [ 0.3, "#f1b6da" ], [ 0.4, "#fde0ef" ], [ 0.5, "#f7f7f7" ], [ 0.6, "#e6f5d0" ], [ 0.7, "#b8e186" ], [ 0.8, "#7fbc41" ], [ 0.9, "#4d9221" ], [ 1, "#276419" ] ], "sequential": [ [ 0, "#0508b8" ], [ 0.0893854748603352, "#1910d8" ], [ 0.1787709497206704, "#3c19f0" ], [ 0.2681564245810056, "#6b1cfb" ], [ 0.3575418994413408, "#981cfd" ], [ 0.44692737430167595, "#bf1cfd" ], [ 0.5363128491620112, "#dd2bfd" ], [ 0.6256983240223464, "#f246fe" ], [ 0.7150837988826816, "#fc67fd" ], [ 0.8044692737430168, "#fe88fc" ], [ 0.8938547486033519, "#fea5fd" ], [ 0.9832402234636871, "#febefe" ], [ 1, "#fec3fe" ] ], "sequentialminus": [ [ 0, "#0508b8" ], [ 0.0893854748603352, "#1910d8" ], [ 0.1787709497206704, "#3c19f0" ], [ 0.2681564245810056, "#6b1cfb" ], [ 0.3575418994413408, "#981cfd" ], [ 0.44692737430167595, "#bf1cfd" ], [ 0.5363128491620112, "#dd2bfd" ], [ 0.6256983240223464, "#f246fe" ], [ 0.7150837988826816, "#fc67fd" ], [ 0.8044692737430168, "#fe88fc" ], [ 0.8938547486033519, "#fea5fd" ], [ 0.9832402234636871, "#febefe" ], [ 1, "#fec3fe" ] ] }, "plot_bgcolor": "white", "paper_bgcolor": "white", "shapedefaults": { "line": { "width": 0 }, "opacity": 0.4, "fillcolor": "#506784" }, "annotationdefaults": { "arrowhead": 0, "arrowcolor": "#506784", "arrowwidth": 1 } }, "themeRef": "PLOTLY_WHITE" } } }, "height": null, "width": null, "user": { "profile_url": "https://chart-studio.plotly.com/~stegano", "avatar_url": "https://storage.googleapis.com/plotly-prod-profiles/14.jpg", "background_url": "https://storage.googleapis.com/plotly-prod-profiles/bg-0.jpg", "bio": "", "nickname": "", "website": "", "stream_tokens": null, "feature_set_id": null, "csrf_token": null, "date_joined": "2025-08-02 06:01:17", "mapbox_access_tokens": null, "has_password": null, "username": "stegano", "email": null, "is_active": null, "readonly": null, "is_dash_creator": null, "dash_created_count": null, "is_chart_creator": null, "charts_created_count": null } }, { "creation_time": "2025-08-02T06:01:56.315734Z", "comments": { "results": [], "count": 0 }, "parented": true, "embed_url": "https://chart-studio.plotly.com/~stegano/1.embed", "fid": "stegano:1", "filename": "Plot 1", "filetype": "plot", "img_url": "https://api.plotly.com/v2/files/stegano:1/image?image_name=list-thumb", "image_urls": { "default": "https://storage.googleapis.com/plotly-prod-images/stegano/1/2_TWT2EDCWSI1MZ47MJX0P3QJPIHR8SN.png", "block-thumb": "https://storage.googleapis.com/plotly-prod-images/stegano/1/8_6KKIGDYR1Y2LTKSAM8K87EGZJKPEMK.png", "list-thumb": "https://api.plotly.com/v2/files/stegano:1/image?image_name=list-thumb" }, "api_urls": { "files": "https://api.plotly.com/v2/files/stegano:1", "plots": "https://api.plotly.com/v2/plots/stegano:1", "parent": "https://api.plotly.com/v2/folders/home?user=stegano" }, "owner": "stegano", "parent": -1, "preview": "", "referencers": [], "references": [], "title": "", "views": 0, "web_url": "https://chart-studio.plotly.com/~stegano/1/", "world_readable": true, "date_modified": "2025-08-02T06:02:51.234Z", "stars": { "results": [], "count": 0 }, "collaborators": { "results": [], "count": 0 }, "subfolder_count": null, "refresh_interval": null, "organize_view_url": "https://chart-studio.plotly.com/~stegano/1/", "current_user_permission": "read", "is_theme": null, "is_template": false, "autosize": true, "caption": "", "figure": { "data": [ { "meta": { "columnNames": { "x": "A", "y": "B" } }, "mode": "lines", "type": "scatter", "xsrc": "stegano:0:5744f0", "ysrc": "stegano:0:970ce8" } ], "frames": [], "layout": { "title": { "text": "Test" }, "xaxis": { "type": "category", "range": [ -1.9375000000000002, -1.9375000000000002 ], "autorange": false }, "yaxis": { "type": "category", "range": [ 0.9932476943346509, 0.9932476943346509 ], "autorange": false }, "autosize": true, "dragmode": "zoom", "template": { "data": { "bar": [ { "type": "bar", "marker": { "colorbar": { "ticks": "", "outlinewidth": 0 } } } ], "table": [ { "type": "table", "cells": { "fill": { "color": "#EBF0F8" }, "line": { "color": "white" } }, "header": { "fill": { "color": "#C8D4E3" }, "line": { "color": "white" } } } ], "carpet": [ { "type": "carpet", "aaxis": { "gridcolor": "#C8D4E3", "linecolor": "#C8D4E3", "endlinecolor": "#2a3f5f", "minorgridcolor": "#C8D4E3", "startlinecolor": "#2a3f5f" }, "baxis": { "gridcolor": "#C8D4E3", "linecolor": "#C8D4E3", "endlinecolor": "#2a3f5f", "minorgridcolor": "#C8D4E3", "startlinecolor": "#2a3f5f" } } ], "mesh3d": [ { "type": "mesh3d", "colorbar": { "ticks": "", "outlinewidth": 0 } } ], "contour": [ { "type": "contour", "colorbar": { "ticks": "", "outlinewidth": 0 }, "autocolorscale": true } ], "heatmap": [ { "type": "heatmap", "colorbar": { "ticks": "", "outlinewidth": 0 }, "autocolorscale": true } ], "scatter": [ { "type": "scatter", "marker": { "colorbar": { "ticks": "", "outlinewidth": 0 } } } ], "surface": [ { "type": "surface", "colorbar": { "ticks": "", "outlinewidth": 0 } } ], "heatmapgl": [ { "type": "heatmapgl", "colorbar": { "ticks": "", "outlinewidth": 0 } } ], "histogram": [ { "type": "histogram", "marker": { "colorbar": { "ticks": "", "outlinewidth": 0 } } } ], "parcoords": [ { "line": { "colorbar": { "ticks": "", "outlinewidth": 0 } }, "type": "parcoords" } ], "scatter3d": [ { "type": "scatter3d", "marker": { "colorbar": { "ticks": "", "outlinewidth": 0 } } } ], "scattergl": [ { "type": "scattergl", "marker": { "colorbar": { "ticks": "", "outlinewidth": 0 } } } ], "choropleth": [ { "type": "choropleth", "colorbar": { "ticks": "", "outlinewidth": 0 } } ], "scattergeo": [ { "type": "scattergeo", "marker": { "colorbar": { "ticks": "", "outlinewidth": 0 } } } ], "histogram2d": [ { "type": "histogram2d", "colorbar": { "ticks": "", "outlinewidth": 0 }, "autocolorscale": true } ], "scatterpolar": [ { "type": "scatterpolar", "marker": { "colorbar": { "ticks": "", "outlinewidth": 0 } } } ], "contourcarpet": [ { "type": "contourcarpet", "colorbar": { "ticks": "", "outlinewidth": 0 } } ], "scattercarpet": [ { "type": "scattercarpet", "marker": { "colorbar": { "ticks": "", "outlinewidth": 0 } } } ], "scattermapbox": [ { "type": "scattermapbox", "marker": { "colorbar": { "ticks": "", "outlinewidth": 0 } } } ], "scatterpolargl": [ { "type": "scatterpolargl", "marker": { "colorbar": { "ticks": "", "outlinewidth": 0 } } } ], "scatterternary": [ { "type": "scatterternary", "marker": { "colorbar": { "ticks": "", "outlinewidth": 0 } } } ], "histogram2dcontour": [ { "type": "histogram2dcontour", "colorbar": { "ticks": "", "outlinewidth": 0 }, "autocolorscale": true } ] }, "layout": { "geo": { "bgcolor": "white", "showland": true, "lakecolor": "white", "landcolor": "white", "showlakes": true, "subunitcolor": "#C8D4E3" }, "font": { "color": "#2a3f5f" }, "polar": { "bgcolor": "white", "radialaxis": { "ticks": "", "gridcolor": "#EBF0F8", "linecolor": "#EBF0F8" }, "angularaxis": { "ticks": "", "gridcolor": "#EBF0F8", "linecolor": "#EBF0F8" } }, "scene": { "xaxis": { "ticks": "", "gridcolor": "#DFE8F3", "gridwidth": 2, "linecolor": "#EBF0F8", "zerolinecolor": "#EBF0F8", "showbackground": true, "backgroundcolor": "white" }, "yaxis": { "ticks": "", "gridcolor": "#DFE8F3", "gridwidth": 2, "linecolor": "#EBF0F8", "zerolinecolor": "#EBF0F8", "showbackground": true, "backgroundcolor": "white" }, "zaxis": { "ticks": "", "gridcolor": "#DFE8F3", "gridwidth": 2, "linecolor": "#EBF0F8", "zerolinecolor": "#EBF0F8", "showbackground": true, "backgroundcolor": "white" } }, "title": { "x": 0.05 }, "xaxis": { "ticks": "", "gridcolor": "#EBF0F8", "linecolor": "#EBF0F8", "automargin": true, "zerolinecolor": "#EBF0F8", "zerolinewidth": 2 }, "yaxis": { "ticks": "", "gridcolor": "#EBF0F8", "linecolor": "#EBF0F8", "automargin": true, "zerolinecolor": "#EBF0F8", "zerolinewidth": 2 }, "ternary": { "aaxis": { "ticks": "", "gridcolor": "#DFE8F3", "linecolor": "#A2B1C6" }, "baxis": { "ticks": "", "gridcolor": "#DFE8F3", "linecolor": "#A2B1C6" }, "caxis": { "ticks": "", "gridcolor": "#DFE8F3", "linecolor": "#A2B1C6" }, "bgcolor": "white" }, "colorway": [ "#636efa", "#EF553B", "#00cc96", "#ab63fa", "#19d3f3", "#e763fa", "#fecb52", "#ffa15a", "#ff6692", "#b6e880" ], "hovermode": "closest", "colorscale": { "diverging": [ [ 0, "#8e0152" ], [ 0.1, "#c51b7d" ], [ 0.2, "#de77ae" ], [ 0.3, "#f1b6da" ], [ 0.4, "#fde0ef" ], [ 0.5, "#f7f7f7" ], [ 0.6, "#e6f5d0" ], [ 0.7, "#b8e186" ], [ 0.8, "#7fbc41" ], [ 0.9, "#4d9221" ], [ 1, "#276419" ] ], "sequential": [ [ 0, "#0508b8" ], [ 0.0893854748603352, "#1910d8" ], [ 0.1787709497206704, "#3c19f0" ], [ 0.2681564245810056, "#6b1cfb" ], [ 0.3575418994413408, "#981cfd" ], [ 0.44692737430167595, "#bf1cfd" ], [ 0.5363128491620112, "#dd2bfd" ], [ 0.6256983240223464, "#f246fe" ], [ 0.7150837988826816, "#fc67fd" ], [ 0.8044692737430168, "#fe88fc" ], [ 0.8938547486033519, "#fea5fd" ], [ 0.9832402234636871, "#febefe" ], [ 1, "#fec3fe" ] ], "sequentialminus": [ [ 0, "#0508b8" ], [ 0.0893854748603352, "#1910d8" ], [ 0.1787709497206704, "#3c19f0" ], [ 0.2681564245810056, "#6b1cfb" ], [ 0.3575418994413408, "#981cfd" ], [ 0.44692737430167595, "#bf1cfd" ], [ 0.5363128491620112, "#dd2bfd" ], [ 0.6256983240223464, "#f246fe" ], [ 0.7150837988826816, "#fc67fd" ], [ 0.8044692737430168, "#fe88fc" ], [ 0.8938547486033519, "#fea5fd" ], [ 0.9832402234636871, "#febefe" ], [ 1, "#fec3fe" ] ] }, "plot_bgcolor": "white", "paper_bgcolor": "white", "shapedefaults": { "line": { "width": 0 }, "opacity": 0.4, "fillcolor": "#506784" }, "annotationdefaults": { "arrowhead": 0, "arrowcolor": "#506784", "arrowwidth": 1 } }, "themeRef": "PLOTLY_WHITE" } } }, "height": null, "width": null, "user": { "profile_url": "https://chart-studio.plotly.com/~stegano", "avatar_url": "https://storage.googleapis.com/plotly-prod-profiles/14.jpg", "background_url": "https://storage.googleapis.com/plotly-prod-profiles/bg-0.jpg", "bio": "", "nickname": "", "website": "", "stream_tokens": null, "feature_set_id": null, "csrf_token": null, "date_joined": "2025-08-02 06:01:17", "mapbox_access_tokens": null, "has_password": null, "username": "stegano", "email": null, "is_active": null, "readonly": null, "is_dash_creator": null, "dash_created_count": null, "is_chart_creator": null, "charts_created_count": null } }, { "creation_time": "2025-08-02T02:51:46.292743Z", "comments": { "results": [], "count": 0 }, "parented": true, "embed_url": "https://chart-studio.plotly.com/~publicsaas/525.embed", "fid": "publicsaas:525", "filename": "yoy_growth_vs_rev_multiple 7.20.25", "filetype": "plot", "img_url": "https://api.plotly.com/v2/files/publicsaas:525/image?image_name=list-thumb", "image_urls": { "default": "https://storage.googleapis.com/plotly-prod-images/publicsaas/525/2_W9Q1LMSQDMZ2UNMP13UQOQOJ6TER1M.png", "block-thumb": "https://storage.googleapis.com/plotly-prod-images/publicsaas/525/8_R2EXCWQWQPZS50M3POPBHWCGMVU0SI.png", "list-thumb": "https://api.plotly.com/v2/files/publicsaas:525/image?image_name=list-thumb" }, "api_urls": { "files": "https://api.plotly.com/v2/files/publicsaas:525", "plots": "https://api.plotly.com/v2/plots/publicsaas:525", "parent": "https://api.plotly.com/v2/folders/home?user=publicsaas" }, "owner": "publicsaas", "parent": -1, "preview": "", "referencers": [], "references": [], "title": "", "views": 526, "web_url": "https://chart-studio.plotly.com/~publicsaas/525/", "world_readable": true, "date_modified": "2025-08-02T02:51:58.886Z", "stars": { "results": [], "count": 0 }, "collaborators": { "results": [], "count": 0 }, "subfolder_count": null, "refresh_interval": null, "organize_view_url": "https://chart-studio.plotly.com/~publicsaas/525/", "current_user_permission": "read", "is_theme": null, "is_template": false, "autosize": true, "caption": "", "figure": { "data": [ { "mode": "markers", "name": "Company Data", "type": "scatter", "xsrc": "publicsaas:524:781ae0", "ysrc": "publicsaas:524:45269b", "xaxis": "x", "yaxis": "y", "marker": { "color": "#636efa", "symbol": "circle", "sizeref": 0.013999999999999999, "sizesrc": "publicsaas:524:8e328d", "sizemode": "area" }, "showlegend": true, "legendgroup": "Company Data", "orientation": "v", "hovertextsrc": "publicsaas:524:f2601b", "customdatasrc": "publicsaas:524:f073bd", "hovertemplate": "<b>%{hovertext}</b><br><br>YoY Growth%=%{x}<br>Revenue Multiple=%{y}<extra></extra>" }, { "mode": "lines", "name": "Company Data", "type": "scatter", "xsrc": "publicsaas:524:151863", "ysrc": "publicsaas:524:087448", "xaxis": "x", "yaxis": "y", "marker": { "color": "#636efa", "symbol": "circle" }, "showlegend": false, "legendgroup": "Company Data", "hovertemplate": "<b>OLS trendline</b><br>Revenue Multiple = 0.234527 * YoY Growth% + 3.93278<br>R<sup>2</sup>=0.209389<br><br>YoY Growth%=%{x}<br>Revenue Multiple=%{y} <b>(trend)</b><extra></extra>" }, { "mode": "markers", "name": "Average (13.63%, 7.13x)", "type": "scatter", "xsrc": "publicsaas:524:acf56f", "ysrc": "publicsaas:524:ce4068", "xaxis": "x", "yaxis": "y", "marker": { "color": "#EF553B", "symbol": "circle", "sizeref": 0.013999999999999999, "sizesrc": "publicsaas:524:45f67f", "sizemode": "area" }, "showlegend": true, "legendgroup": "Average (13.63%, 7.13x)", "orientation": "v", "hovertextsrc": "publicsaas:524:45514a", "customdatasrc": "publicsaas:524:ff3a25", "hovertemplate": "<b>%{hovertext}</b><br><br>YoY Growth%=%{x}<br>Revenue Multiple=%{y}<extra></extra>" }, { "mode": "lines", "name": "Average (13.63%, 7.13x)", "type": "scatter", "xaxis": "x", "yaxis": "y", "marker": { "color": "#EF553B", "symbol": "circle" }, "showlegend": false, "legendgroup": "Average (13.63%, 7.13x)", "hovertemplate": "<extra></extra>" }, { "mode": "markers", "name": "Median (11.0%, 4.67x)", "type": "scatter", "xsrc": "publicsaas:524:6bec71", "ysrc": "publicsaas:524:5eee65", "xaxis": "x", "yaxis": "y", "marker": { "color": "#00cc96", "symbol": "circle", "sizeref": 0.013999999999999999, "sizesrc": "publicsaas:524:1e7e67", "sizemode": "area" }, "showlegend": true, "legendgroup": "Median (11.0%, 4.67x)", "orientation": "v", "hovertextsrc": "publicsaas:524:883383", "customdatasrc": "publicsaas:524:02c507", "hovertemplate": "<b>%{hovertext}</b><br><br>YoY Growth%=%{x}<br>Revenue Multiple=%{y}<extra></extra>" }, { "mode": "lines", "name": "Median (11.0%, 4.67x)", "type": "scatter", "xaxis": "x", "yaxis": "y", "marker": { "color": "#00cc96", "symbol": "circle" }, "showlegend": false, "legendgroup": "Median (11.0%, 4.67x)", "hovertemplate": "<extra></extra>" }, { "mode": "markers", "name": "25th Percentile (4.72%, 2.16x)", "type": "scatter", "xsrc": "publicsaas:524:d288f8", "ysrc": "publicsaas:524:dad9b5", "xaxis": "x", "yaxis": "y", "marker": { "color": "#ab63fa", "symbol": "circle", "sizeref": 0.013999999999999999, "sizesrc": "publicsaas:524:146103", "sizemode": "area" }, "showlegend": true, "legendgroup": "25th Percentile (4.72%, 2.16x)", "orientation": "v", "hovertextsrc": "publicsaas:524:031062", "customdatasrc": "publicsaas:524:6b6473", "hovertemplate": "<b>%{hovertext}</b><br><br>YoY Growth%=%{x}<br>Revenue Multiple=%{y}<extra></extra>" }, { "mode": "lines", "name": "25th Percentile (4.72%, 2.16x)", "type": "scatter", "xaxis": "x", "yaxis": "y", "marker": { "color": "#ab63fa", "symbol": "circle" }, "showlegend": false, "legendgroup": "25th Percentile (4.72%, 2.16x)", "hovertemplate": "<extra></extra>" }, { "mode": "markers", "name": "75th Percentile (19.64%, 8.87x)", "type": "scatter", "xsrc": "publicsaas:524:0323f1", "ysrc": "publicsaas:524:6e5121", "xaxis": "x", "yaxis": "y", "marker": { "color": "#FFA15A", "symbol": "circle", "sizeref": 0.013999999999999999, "sizesrc": "publicsaas:524:05e767", "sizemode": "area" }, "showlegend": true, "legendgroup": "75th Percentile (19.64%, 8.87x)", "orientation": "v", "hovertextsrc": "publicsaas:524:b36f21", "customdatasrc": "publicsaas:524:595589", "hovertemplate": "<b>%{hovertext}</b><br><br>YoY Growth%=%{x}<br>Revenue Multiple=%{y}<extra></extra>" }, { "mode": "lines", "name": "75th Percentile (19.64%, 8.87x)", "type": "scatter", "xaxis": "x", "yaxis": "y", "marker": { "color": "#FFA15A", "symbol": "circle" }, "showlegend": false, "legendgroup": "75th Percentile (19.64%, 8.87x)", "hovertemplate": "<extra></extra>" } ], "layout": { "title": { "x": 0.4, "text": "Public SaaS Company Revenue Multiples vs. YoY Growth% <br><sup>July 20th, 2025 (n = 160 companies)</sup>" }, "xaxis": { "title": { "text": "YoY Growth%<br><sup> © publicsaascompanies.com</sup>" }, "anchor": "y", "domain": [ 0.0, 1.0 ], "ticksuffix": "%", "showticksuffix": "all" }, "yaxis": { "title": { "text": "Market Cap/Annualized Revenue" }, "anchor": "x", "domain": [ 0.0, 1.0 ], "ticksuffix": "x", "showticksuffix": "all" }, "legend": { "title": { "text": "Key" }, "itemsizing": "constant", "tracegroupgap": 0 }, "margin": { "t": 60 }, "template": { "data": { "bar": [ { "type": "bar", "marker": { "line": { "color": "#E5ECF6", "width": 0.5 }, "pattern": { "size": 10, "fillmode": "overlay", "solidity": 0.2 } }, "error_x": { "color": "#2a3f5f" }, "error_y": { "color": "#2a3f5f" } } ], "pie": [ { "type": "pie", "automargin": true } ], "table": [ { "type": "table", "cells": { "fill": { "color": "#EBF0F8" }, "line": { "color": "white" } }, "header": { "fill": { "color": "#C8D4E3" }, "line": { "color": "white" } } } ], "carpet": [ { "type": "carpet", "aaxis": { "gridcolor": "white", "linecolor": "white", "endlinecolor": "#2a3f5f", "minorgridcolor": "white", "startlinecolor": "#2a3f5f" }, "baxis": { "gridcolor": "white", "linecolor": "white", "endlinecolor": "#2a3f5f", "minorgridcolor": "white", "startlinecolor": "#2a3f5f" } } ], "mesh3d": [ { "type": "mesh3d", "colorbar": { "ticks": "", "outlinewidth": 0 } } ], "contour": [ { "type": "contour", "colorbar": { "ticks": "", "outlinewidth": 0 }, "colorscale": [ [ 0.0, "#0d0887" ], [ 0.1111111111111111, "#46039f" ], [ 0.2222222222222222, "#7201a8" ], [ 0.3333333333333333, "#9c179e" ], [ 0.4444444444444444, "#bd3786" ], [ 0.5555555555555556, "#d8576b" ], [ 0.6666666666666666, "#ed7953" ], [ 0.7777777777777778, "#fb9f3a" ], [ 0.8888888888888888, "#fdca26" ], [ 1.0, "#f0f921" ] ] } ], "heatmap": [ { "type": "heatmap", "colorbar": { "ticks": "", "outlinewidth": 0 }, "colorscale": [ [ 0.0, "#0d0887" ], [ 0.1111111111111111, "#46039f" ], [ 0.2222222222222222, "#7201a8" ], [ 0.3333333333333333, "#9c179e" ], [ 0.4444444444444444, "#bd3786" ], [ 0.5555555555555556, "#d8576b" ], [ 0.6666666666666666, "#ed7953" ], [ 0.7777777777777778, "#fb9f3a" ], [ 0.8888888888888888, "#fdca26" ], [ 1.0, "#f0f921" ] ] } ], "scatter": [ { "type": "scatter", "fillpattern": { "size": 10, "fillmode": "overlay", "solidity": 0.2 } } ], "surface": [ { "type": "surface", "colorbar": { "ticks": "", "outlinewidth": 0 }, "colorscale": [ [ 0.0, "#0d0887" ], [ 0.1111111111111111, "#46039f" ], [ 0.2222222222222222, "#7201a8" ], [ 0.3333333333333333, "#9c179e" ], [ 0.4444444444444444, "#bd3786" ], [ 0.5555555555555556, "#d8576b" ], [ 0.6666666666666666, "#ed7953" ], [ 0.7777777777777778, "#fb9f3a" ], [ 0.8888888888888888, "#fdca26" ], [ 1.0, "#f0f921" ] ] } ], "barpolar": [ { "type": "barpolar", "marker": { "line": { "color": "#E5ECF6", "width": 0.5 }, "pattern": { "size": 10, "fillmode": "overlay", "solidity": 0.2 } } } ], "heatmapgl": [ { "type": "heatmapgl", "colorbar": { "ticks": "", "outlinewidth": 0 }, "colorscale": [ [ 0.0, "#0d0887" ], [ 0.1111111111111111, "#46039f" ], [ 0.2222222222222222, "#7201a8" ], [ 0.3333333333333333, "#9c179e" ], [ 0.4444444444444444, "#bd3786" ], [ 0.5555555555555556, "#d8576b" ], [ 0.6666666666666666, "#ed7953" ], [ 0.7777777777777778, "#fb9f3a" ], [ 0.8888888888888888, "#fdca26" ], [ 1.0, "#f0f921" ] ] } ], "histogram": [ { "type": "histogram", "marker": { "pattern": { "size": 10, "fillmode": "overlay", "solidity": 0.2 } } } ], "parcoords": [ { "line": { "colorbar": { "ticks": "", "outlinewidth": 0 } }, "type": "parcoords" } ], "scatter3d": [ { "line": { "colorbar": { "ticks": "", "outlinewidth": 0 } }, "type": "scatter3d", "marker": { "colorbar": { "ticks": "", "outlinewidth": 0 } } } ], "scattergl": [ { "type": "scattergl", "marker": { "colorbar": { "ticks": "", "outlinewidth": 0 } } } ], "choropleth": [ { "type": "choropleth", "colorbar": { "ticks": "", "outlinewidth": 0 } } ], "scattergeo": [ { "type": "scattergeo", "marker": { "colorbar": { "ticks": "", "outlinewidth": 0 } } } ], "histogram2d": [ { "type": "histogram2d", "colorbar": { "ticks": "", "outlinewidth": 0 }, "colorscale": [ [ 0.0, "#0d0887" ], [ 0.1111111111111111, "#46039f" ], [ 0.2222222222222222, "#7201a8" ], [ 0.3333333333333333, "#9c179e" ], [ 0.4444444444444444, "#bd3786" ], [ 0.5555555555555556, "#d8576b" ], [ 0.6666666666666666, "#ed7953" ], [ 0.7777777777777778, "#fb9f3a" ], [ 0.8888888888888888, "#fdca26" ], [ 1.0, "#f0f921" ] ] } ], "scatterpolar": [ { "type": "scatterpolar", "marker": { "colorbar": { "ticks": "", "outlinewidth": 0 } } } ], "contourcarpet": [ { "type": "contourcarpet", "colorbar": { "ticks": "", "outlinewidth": 0 } } ], "scattercarpet": [ { "type": "scattercarpet", "marker": { "colorbar": { "ticks": "", "outlinewidth": 0 } } } ], "scattermapbox": [ { "type": "scattermapbox", "marker": { "colorbar": { "ticks": "", "outlinewidth": 0 } } } ], "scatterpolargl": [ { "type": "scatterpolargl", "marker": { "colorbar": { "ticks": "", "outlinewidth": 0 } } } ], "scatterternary": [ { "type": "scatterternary", "marker": { "colorbar": { "ticks": "", "outlinewidth": 0 } } } ], "histogram2dcontour": [ { "type": "histogram2dcontour", "colorbar": { "ticks": "", "outlinewidth": 0 }, "colorscale": [ [ 0.0, "#0d0887" ], [ 0.1111111111111111, "#46039f" ], [ 0.2222222222222222, "#7201a8" ], [ 0.3333333333333333, "#9c179e" ], [ 0.4444444444444444, "#bd3786" ], [ 0.5555555555555556, "#d8576b" ], [ 0.6666666666666666, "#ed7953" ], [ 0.7777777777777778, "#fb9f3a" ], [ 0.8888888888888888, "#fdca26" ], [ 1.0, "#f0f921" ] ] } ] }, "layout": { "geo": { "bgcolor": "white", "showland": true, "lakecolor": "white", "landcolor": "#E5ECF6", "showlakes": true, "subunitcolor": "white" }, "font": { "color": "#2a3f5f" }, "polar": { "bgcolor": "#E5ECF6", "radialaxis": { "ticks": "", "gridcolor": "white", "linecolor": "white" }, "angularaxis": { "ticks": "", "gridcolor": "white", "linecolor": "white" } }, "scene": { "xaxis": { "ticks": "", "gridcolor": "white", "gridwidth": 2, "linecolor": "white", "zerolinecolor": "white", "showbackground": true, "backgroundcolor": "#E5ECF6" }, "yaxis": { "ticks": "", "gridcolor": "white", "gridwidth": 2, "linecolor": "white", "zerolinecolor": "white", "showbackground": true, "backgroundcolor": "#E5ECF6" }, "zaxis": { "ticks": "", "gridcolor": "white", "gridwidth": 2, "linecolor": "white", "zerolinecolor": "white", "showbackground": true, "backgroundcolor": "#E5ECF6" } }, "title": { "x": 0.05 }, "xaxis": { "ticks": "", "title": { "standoff": 15 }, "gridcolor": "white", "linecolor": "white", "automargin": true, "zerolinecolor": "white", "zerolinewidth": 2 }, "yaxis": { "ticks": "", "title": { "standoff": 15 }, "gridcolor": "white", "linecolor": "white", "automargin": true, "zerolinecolor": "white", "zerolinewidth": 2 }, "mapbox": { "style": "light" }, "ternary": { "aaxis": { "ticks": "", "gridcolor": "white", "linecolor": "white" }, "baxis": { "ticks": "", "gridcolor": "white", "linecolor": "white" }, "caxis": { "ticks": "", "gridcolor": "white", "linecolor": "white" }, "bgcolor": "#E5ECF6" }, "colorway": [ "#636efa", "#EF553B", "#00cc96", "#ab63fa", "#FFA15A", "#19d3f3", "#FF6692", "#B6E880", "#FF97FF", "#FECB52" ], "coloraxis": { "colorbar": { "ticks": "", "outlinewidth": 0 } }, "hovermode": "closest", "colorscale": { "diverging": [ [ 0, "#8e0152" ], [ 0.1, "#c51b7d" ], [ 0.2, "#de77ae" ], [ 0.3, "#f1b6da" ], [ 0.4, "#fde0ef" ], [ 0.5, "#f7f7f7" ], [ 0.6, "#e6f5d0" ], [ 0.7, "#b8e186" ], [ 0.8, "#7fbc41" ], [ 0.9, "#4d9221" ], [ 1, "#276419" ] ], "sequential": [ [ 0.0, "#0d0887" ], [ 0.1111111111111111, "#46039f" ], [ 0.2222222222222222, "#7201a8" ], [ 0.3333333333333333, "#9c179e" ], [ 0.4444444444444444, "#bd3786" ], [ 0.5555555555555556, "#d8576b" ], [ 0.6666666666666666, "#ed7953" ], [ 0.7777777777777778, "#fb9f3a" ], [ 0.8888888888888888, "#fdca26" ], [ 1.0, "#f0f921" ] ], "sequentialminus": [ [ 0.0, "#0d0887" ], [ 0.1111111111111111, "#46039f" ], [ 0.2222222222222222, "#7201a8" ], [ 0.3333333333333333, "#9c179e" ], [ 0.4444444444444444, "#bd3786" ], [ 0.5555555555555556, "#d8576b" ], [ 0.6666666666666666, "#ed7953" ], [ 0.7777777777777778, "#fb9f3a" ], [ 0.8888888888888888, "#fdca26" ], [ 1.0, "#f0f921" ] ] }, "hoverlabel": { "align": "left" }, "plot_bgcolor": "#E5ECF6", "paper_bgcolor": "white", "shapedefaults": { "line": { "color": "#2a3f5f" } }, "autotypenumbers": "strict", "annotationdefaults": { "arrowhead": 0, "arrowcolor": "#2a3f5f", "arrowwidth": 1 } } }, "coloraxis": { "showscale": false } } }, "height": null, "width": null, "user": { "profile_url": "https://chart-studio.plotly.com/~publicsaas", "avatar_url": "https://storage.googleapis.com/plotly-prod-profiles/29.jpg", "background_url": "https://storage.googleapis.com/plotly-prod-profiles/bg-13.jpg", "bio": "", "nickname": "", "website": "", "stream_tokens": null, "feature_set_id": null, "csrf_token": null, "date_joined": "2024-09-11 05:56:15", "mapbox_access_tokens": null, "has_password": null, "username": "publicsaas", "email": null, "is_active": null, "readonly": null, "is_dash_creator": null, "dash_created_count": null, "is_chart_creator": null, "charts_created_count": null } }, { "creation_time": "2025-08-01T23:45:54.559534Z", "comments": { "results": [], "count": 0 }, "parented": true, "embed_url": "https://chart-studio.plotly.com/~plotlypickle/2.embed", "fid": "plotlypickle:2", "filename": "Plot 2", "filetype": "plot", "img_url": "https://storage.googleapis.com/plotly-prod-images/plotlypickle/2/9_X3U17LLA2GC1VUC4J5TB75DVTEI2ZX.png", "image_urls": { "default": "https://storage.googleapis.com/plotly-prod-images/plotlypickle/2/2_MBNYNVUW4XSYB3FOLYCLSCFHRM3YOT.png", "block-thumb": "https://storage.googleapis.com/plotly-prod-images/plotlypickle/2/8_WBLFELXICIJR6BBUZ5ME29YNJ4MAVF.png", "list-thumb": "https://storage.googleapis.com/plotly-prod-images/plotlypickle/2/9_X3U17LLA2GC1VUC4J5TB75DVTEI2ZX.png" }, "api_urls": { "files": "https://api.plotly.com/v2/files/plotlypickle:2", "plots": "https://api.plotly.com/v2/plots/plotlypickle:2", "parent": "https://api.plotly.com/v2/folders/home?user=plotlypickle" }, "owner": "plotlypickle", "parent": -1, "preview": "", "referencers": [], "references": [], "title": "", "views": 0, "web_url": "https://chart-studio.plotly.com/~plotlypickle/2/", "world_readable": true, "date_modified": "2025-08-01T23:45:54.569Z", "stars": { "results": [], "count": 0 }, "collaborators": { "results": [], "count": 0 }, "subfolder_count": null, "refresh_interval": null, "organize_view_url": "https://chart-studio.plotly.com/~plotlypickle/2/", "current_user_permission": "read", "is_theme": null, "is_template": false, "autosize": true, "caption": "", "figure": { "data": [ { "meta": { "columnNames": { "x": "# StartTime = 07/26/2025 11:59:12.2024 AM", "y": "N" } }, "mode": "lines", "name": "Downstream", "type": "scatter", "xsrc": "plotlypickle:1:d9942f", "ysrc": "plotlypickle:1:6ba047" }, { "meta": { "columnNames": { "x": "# StartTime = 07/26/2025 11:59:12.2024 AM", "y": "M" } }, "mode": "lines", "name": "Upstream", "type": "scatter", "xsrc": "plotlypickle:1:d9942f", "ysrc": "plotlypickle:1:36f908", "stackgroup": null }, { "meta": { "columnNames": { "x": "# StartTime = 07/26/2025 11:59:12.2024 AM", "y": "E" } }, "mode": "lines", "name": "RPM", "type": "scatter", "xsrc": "plotlypickle:1:d9942f", "ysrc": "plotlypickle:1:56d506", "yaxis": "y2", "stackgroup": null } ], "frames": [], "layout": { "xaxis": { "type": "linear", "range": [ 0, 1320.814 ], "autorange": true }, "yaxis": { "type": "linear", "range": [ -0.05305555555555556, 1.0080555555555555 ], "autorange": true }, "yaxis2": { "side": "right", "type": "linear", "range": [ -193.70833333333334, 3680.4583333333335 ], "autorange": true, "overlaying": "y" }, "autosize": true, "template": { "data": { "bar": [ { "type": "bar", "marker": { "colorbar": { "ticks": "", "outlinewidth": 0 } } } ], "table": [ { "type": "table", "cells": { "fill": { "color": "#EBF0F8" }, "line": { "color": "white" } }, "header": { "fill": { "color": "#C8D4E3" }, "line": { "color": "white" } } } ], "carpet": [ { "type": "carpet", "aaxis": { "gridcolor": "#C8D4E3", "linecolor": "#C8D4E3", "endlinecolor": "#2a3f5f", "minorgridcolor": "#C8D4E3", "startlinecolor": "#2a3f5f" }, "baxis": { "gridcolor": "#C8D4E3", "linecolor": "#C8D4E3", "endlinecolor": "#2a3f5f", "minorgridcolor": "#C8D4E3", "startlinecolor": "#2a3f5f" } } ], "mesh3d": [ { "type": "mesh3d", "colorbar": { "ticks": "", "outlinewidth": 0 } } ], "contour": [ { "type": "contour", "colorbar": { "ticks": "", "outlinewidth": 0 }, "autocolorscale": true } ], "heatmap": [ { "type": "heatmap", "colorbar": { "ticks": "", "outlinewidth": 0 }, "autocolorscale": true } ], "scatter": [ { "type": "scatter", "marker": { "colorbar": { "ticks": "", "outlinewidth": 0 } } } ], "surface": [ { "type": "surface", "colorbar": { "ticks": "", "outlinewidth": 0 } } ], "heatmapgl": [ { "type": "heatmapgl", "colorbar": { "ticks": "", "outlinewidth": 0 } } ], "histogram": [ { "type": "histogram", "marker": { "colorbar": { "ticks": "", "outlinewidth": 0 } } } ], "parcoords": [ { "line": { "colorbar": { "ticks": "", "outlinewidth": 0 } }, "type": "parcoords" } ], "scatter3d": [ { "type": "scatter3d", "marker": { "colorbar": { "ticks": "", "outlinewidth": 0 } } } ], "scattergl": [ { "type": "scattergl", "marker": { "colorbar": { "ticks": "", "outlinewidth": 0 } } } ], "choropleth": [ { "type": "choropleth", "colorbar": { "ticks": "", "outlinewidth": 0 } } ], "scattergeo": [ { "type": "scattergeo", "marker": { "colorbar": { "ticks": "", "outlinewidth": 0 } } } ], "histogram2d": [ { "type": "histogram2d", "colorbar": { "ticks": "", "outlinewidth": 0 }, "autocolorscale": true } ], "scatterpolar": [ { "type": "scatterpolar", "marker": { "colorbar": { "ticks": "", "outlinewidth": 0 } } } ], "contourcarpet": [ { "type": "contourcarpet", "colorbar": { "ticks": "", "outlinewidth": 0 } } ], "scattercarpet": [ { "type": "scattercarpet", "marker": { "colorbar": { "ticks": "", "outlinewidth": 0 } } } ], "scattermapbox": [ { "type": "scattermapbox", "marker": { "colorbar": { "ticks": "", "outlinewidth": 0 } } } ], "scatterpolargl": [ { "type": "scatterpolargl", "marker": { "colorbar": { "ticks": "", "outlinewidth": 0 } } } ], "scatterternary": [ { "type": "scatterternary", "marker": { "colorbar": { "ticks": "", "outlinewidth": 0 } } } ], "histogram2dcontour": [ { "type": "histogram2dcontour", "colorbar": { "ticks": "", "outlinewidth": 0 }, "autocolorscale": true } ] }, "layout": { "geo": { "bgcolor": "white", "showland": true, "lakecolor": "white", "landcolor": "white", "showlakes": true, "subunitcolor": "#C8D4E3" }, "font": { "color": "#2a3f5f" }, "polar": { "bgcolor": "white", "radialaxis": { "ticks": "", "gridcolor": "#EBF0F8", "linecolor": "#EBF0F8" }, "angularaxis": { "ticks": "", "gridcolor": "#EBF0F8", "linecolor": "#EBF0F8" } }, "scene": { "xaxis": { "ticks": "", "gridcolor": "#DFE8F3", "gridwidth": 2, "linecolor": "#EBF0F8", "zerolinecolor": "#EBF0F8", "showbackground": true, "backgroundcolor": "white" }, "yaxis": { "ticks": "", "gridcolor": "#DFE8F3", "gridwidth": 2, "linecolor": "#EBF0F8", "zerolinecolor": "#EBF0F8", "showbackground": true, "backgroundcolor": "white" }, "zaxis": { "ticks": "", "gridcolor": "#DFE8F3", "gridwidth": 2, "linecolor": "#EBF0F8", "zerolinecolor": "#EBF0F8", "showbackground": true, "backgroundcolor": "white" } }, "title": { "x": 0.05 }, "xaxis": { "ticks": "", "gridcolor": "#EBF0F8", "linecolor": "#EBF0F8", "automargin": true, "zerolinecolor": "#EBF0F8", "zerolinewidth": 2 }, "yaxis": { "ticks": "", "gridcolor": "#EBF0F8", "linecolor": "#EBF0F8", "automargin": true, "zerolinecolor": "#EBF0F8", "zerolinewidth": 2 }, "ternary": { "aaxis": { "ticks": "", "gridcolor": "#DFE8F3", "linecolor": "#A2B1C6" }, "baxis": { "ticks": "", "gridcolor": "#DFE8F3", "linecolor": "#A2B1C6" }, "caxis": { "ticks": "", "gridcolor": "#DFE8F3", "linecolor": "#A2B1C6" }, "bgcolor": "white" }, "colorway": [ "#636efa", "#EF553B", "#00cc96", "#ab63fa", "#19d3f3", "#e763fa", "#fecb52", "#ffa15a", "#ff6692", "#b6e880" ], "hovermode": "closest", "colorscale": { "diverging": [ [ 0, "#8e0152" ], [ 0.1, "#c51b7d" ], [ 0.2, "#de77ae" ], [ 0.3, "#f1b6da" ], [ 0.4, "#fde0ef" ], [ 0.5, "#f7f7f7" ], [ 0.6, "#e6f5d0" ], [ 0.7, "#b8e186" ], [ 0.8, "#7fbc41" ], [ 0.9, "#4d9221" ], [ 1, "#276419" ] ], "sequential": [ [ 0, "#0508b8" ], [ 0.0893854748603352, "#1910d8" ], [ 0.1787709497206704, "#3c19f0" ], [ 0.2681564245810056, "#6b1cfb" ], [ 0.3575418994413408, "#981cfd" ], [ 0.44692737430167595, "#bf1cfd" ], [ 0.5363128491620112, "#dd2bfd" ], [ 0.6256983240223464, "#f246fe" ], [ 0.7150837988826816, "#fc67fd" ], [ 0.8044692737430168, "#fe88fc" ], [ 0.8938547486033519, "#fea5fd" ], [ 0.9832402234636871, "#febefe" ], [ 1, "#fec3fe" ] ], "sequentialminus": [ [ 0, "#0508b8" ], [ 0.0893854748603352, "#1910d8" ], [ 0.1787709497206704, "#3c19f0" ], [ 0.2681564245810056, "#6b1cfb" ], [ 0.3575418994413408, "#981cfd" ], [ 0.44692737430167595, "#bf1cfd" ], [ 0.5363128491620112, "#dd2bfd" ], [ 0.6256983240223464, "#f246fe" ], [ 0.7150837988826816, "#fc67fd" ], [ 0.8044692737430168, "#fe88fc" ], [ 0.8938547486033519, "#fea5fd" ], [ 0.9832402234636871, "#febefe" ], [ 1, "#fec3fe" ] ] }, "plot_bgcolor": "white", "paper_bgcolor": "white", "shapedefaults": { "line": { "width": 0 }, "opacity": 0.4, "fillcolor": "#506784" }, "annotationdefaults": { "arrowhead": 0, "arrowcolor": "#506784", "arrowwidth": 1 } }, "themeRef": "PLOTLY_WHITE" } } }, "height": null, "width": null, "user": { "profile_url": "https://chart-studio.plotly.com/~plotlypickle", "avatar_url": "https://storage.googleapis.com/plotly-prod-profiles/90.jpg", "background_url": "https://storage.googleapis.com/plotly-prod-profiles/bg-9.jpg", "bio": "", "nickname": "", "website": "", "stream_tokens": null, "feature_set_id": null, "csrf_token": null, "date_joined": "2025-08-01 23:41:30", "mapbox_access_tokens": null, "has_password": null, "username": "plotlypickle", "email": null, "is_active": null, "readonly": null, "is_dash_creator": null, "dash_created_count": null, "is_chart_creator": null, "charts_created_count": null } } ] }
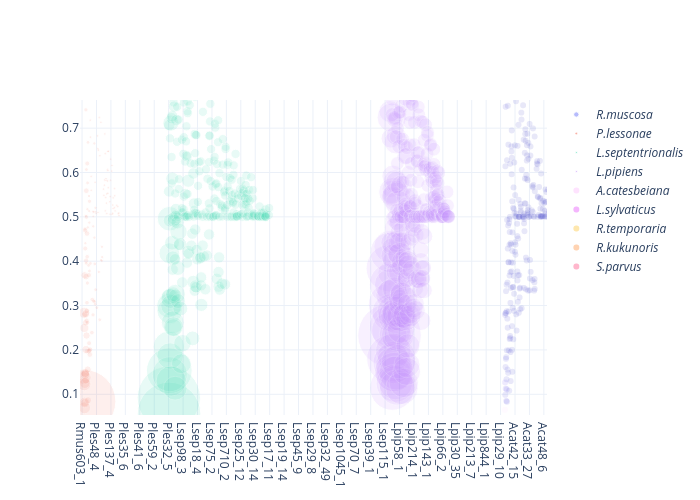
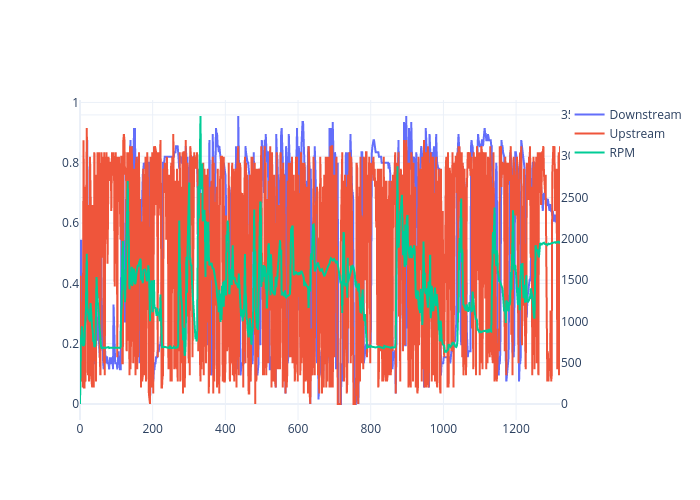