Plots List
Plots
This endpoint handles manipulation of Plotly plot files.
Reference
Authorization
Any user with or without a Plotly account may view public plots. For private plots, see authentication.
Actions
list
Listing all public plots can be done via a GET request to this endpoint.
By default, plots will be listed in order of date created. The order_by
query parameter is accepted at this endpoint. Currently, only ordering by
views is supported. It is possible to filter the plots by quality
with min_quality or max_quality as query parameter.
Example:
// GET https://api.plotly.com/v2/plots/ ---> 200

// GET https://api.plotly.com/v2/plots/?order_by=-views ---> 200

// GET https://api.plotly.com/v2/plots/?min_quality=5 ---> 200

// GET https://api.plotly.com/v2/plots/?max_quality=5 ---> 200
feed
Listing all handpicked feed plots can be done via a GET request to this endpoint. By default, plots will be listed in a random order.
Example:
// GET https://api.plotly.com/v2/plots/feed ---> 200
create
You can create new plot resources here. The only required field is 'figure'. Currently, the figure is restricted to only contain references to grid data. That is, this will fail if raw data arrays are passed in. To create and manipulate underlying grids for plots, see the grids endpoint.
Example:
// This fails because a figure field is required.
// POST https://api.plotly.com/v2/plots ---> 400 Bad Request
{}

// This fails because the figure has raw data
//POST https://api.plotly.com/v2/plots ---> 400 Bad Request
{
    "figure": {"data": [{"y": ['this', 'is', 'raw', 'data']}]}
}

// This succeeds because the figure has src keys, not raw data.
//POST https://api.plotly.com/v2/plots ---> 200 OK
{
    "figure": {"data": [{"ysrc": "sven:88:u8nd62"}]}
}
When creating a grid, you can optionally specify a source_fid to specify where a plot has come from:
- source_fid: the fid of a plot that was copied (and presumably edited) to produce this one
detail
There is a lot of meta information stored about plot files including filename, title, share_url, and content_url to name a few.
This information can only be reached with a GET to this endpoint.
Example:
// GET https://api.plotly.com/v2/plots/iheartgraphs:90
content
The contents of a plot can be downloaded via the content resource. The plot
content contains referenced grid/column data by default. If you wish to
return the raw grid/column data, the inline_data=true query must be included
in the request url. The Content-Type header will be appropriately set for the
response body.
Alternatively, you can set ?map_data=unreadable to append a mapping of
sources to data that belongs to grids which are unreadable for the
requestor. This is useful when you have read access to another users plot,
but that plot contains grid references which you don't have access to.
Examples:
// Returns referenced grid/column data
// GET https://api.plotly.com/v2/plots/iheartgraphs:90/content ---> 200 OK

// Returns full grid/column data
// GET https://api.plotly.com/v2/plots/iheartgraphs:90/content?inline_data=true ---> 200 OK

// Returns full grid/column data when requestor doesn't have permission
// to read the referenced grid.
// GET https://api.plotly.com/v2/plots/iheartgraphs:90/content?map_data=unreadable ---> 200 OK
GET /v2/plots?cursor=cD0yMDI1LTA4LTAyKzIzJTNBMzglM0EyNy41ODQ0MTglMkIwMCUzQTAw&format=api
{ "next": "https://api.plotly.com/v2/plots?cursor=cD0yMDI1LTA4LTAyKzE4JTNBMzAlM0EwMy4wOTQxNDclMkIwMCUzQTAw&format=api", "previous": "https://api.plotly.com/v2/plots?cursor=cj0xJnA9MjAyNS0wOC0wMisyMSUzQTMzJTNBMDguMjk3Mjc5JTJCMDAlM0EwMA%3D%3D&format=api", "results": [ { "creation_time": "2025-08-02T21:33:08.297279Z", "comments": { "results": [], "count": 0 }, "parented": true, "embed_url": "https://chart-studio.plotly.com/~shayna.jung/25.embed", "fid": "shayna.jung:25", "filename": "Plot 25", "filetype": "plot", "img_url": "https://api.plotly.com/v2/files/shayna.jung:25/image?image_name=list-thumb", "image_urls": { "default": "https://storage.googleapis.com/plotly-prod-images/shayna.jung/25/2_4K0SZ9OVCOG2791UI22GANNINDBB8Z.png", "block-thumb": "https://storage.googleapis.com/plotly-prod-images/shayna.jung/25/8_1UQS4F2FFRC7YYCWGC75VNUTFPFRGW.png", "list-thumb": "https://api.plotly.com/v2/files/shayna.jung:25/image?image_name=list-thumb" }, "api_urls": { "files": "https://api.plotly.com/v2/files/shayna.jung:25", "plots": "https://api.plotly.com/v2/plots/shayna.jung:25", "parent": "https://api.plotly.com/v2/folders/home?user=shayna.jung" }, "owner": "shayna.jung", "parent": -1, "preview": "", "referencers": [], "references": [], "title": "", "views": 0, "web_url": "https://chart-studio.plotly.com/~shayna.jung/25/", "world_readable": true, "date_modified": "2025-08-02T22:34:39.384Z", "stars": { "results": [], "count": 0 }, "collaborators": { "results": [], "count": 0 }, "subfolder_count": null, "refresh_interval": null, "organize_view_url": "https://chart-studio.plotly.com/~shayna.jung/25/", "current_user_permission": "read", "is_theme": null, "is_template": false, "autosize": true, "caption": "", "figure": { "data": [ { "meta": { "columnNames": { "x": "Wavelength", "y": "Spirulina (% max)" } }, "mode": "lines", "type": "scatter", "xsrc": "shayna.jung:27:66b53c", "ysrc": "shayna.jung:27:785b86" } ], "frames": [], "layout": { "title": { "text": "Change in % Maximum Absorbance of Spirulina as Wavelength Changes" }, "xaxis": { "type": "linear", "range": [ 400, 740 ], "title": { "text": "Wavelength (nm)" }, "autorange": true }, "yaxis": { "type": "linear", "range": [ -4.762756318522222, 105.51382927992222 ], "title": { "text": "% Maximum Absorbance" }, "autorange": true }, "autosize": true, "template": { "data": { "bar": [ { "type": "bar", "marker": { "colorbar": { "ticks": "", "outlinewidth": 0 } } } ], "table": [ { "type": "table", "cells": { "fill": { "color": "#EBF0F8" }, "line": { "color": "white" } }, "header": { "fill": { "color": "#C8D4E3" }, "line": { "color": "white" } } } ], "carpet": [ { "type": "carpet", "aaxis": { "gridcolor": "#C8D4E3", "linecolor": "#C8D4E3", "endlinecolor": "#2a3f5f", "minorgridcolor": "#C8D4E3", "startlinecolor": "#2a3f5f" }, "baxis": { "gridcolor": "#C8D4E3", "linecolor": "#C8D4E3", "endlinecolor": "#2a3f5f", "minorgridcolor": "#C8D4E3", "startlinecolor": "#2a3f5f" } } ], "mesh3d": [ { "type": "mesh3d", "colorbar": { "ticks": "", "outlinewidth": 0 } } ], "contour": [ { "type": "contour", "colorbar": { "ticks": "", "outlinewidth": 0 }, "autocolorscale": true } ], "heatmap": [ { "type": "heatmap", "colorbar": { "ticks": "", "outlinewidth": 0 }, "autocolorscale": true } ], "scatter": [ { "type": "scatter", "marker": { "colorbar": { "ticks": "", "outlinewidth": 0 } } } ], "surface": [ { "type": "surface", "colorbar": { "ticks": "", "outlinewidth": 0 } } ], "heatmapgl": [ { "type": "heatmapgl", "colorbar": { "ticks": "", "outlinewidth": 0 } } ], "histogram": [ { "type": "histogram", "marker": { "colorbar": { "ticks": "", "outlinewidth": 0 } } } ], "parcoords": [ { "line": { "colorbar": { "ticks": "", "outlinewidth": 0 } }, "type": "parcoords" } ], "scatter3d": [ { "type": "scatter3d", "marker": { "colorbar": { "ticks": "", "outlinewidth": 0 } } } ], "scattergl": [ { "type": "scattergl", "marker": { "colorbar": { "ticks": "", "outlinewidth": 0 } } } ], "choropleth": [ { "type": "choropleth", "colorbar": { "ticks": "", "outlinewidth": 0 } } ], "scattergeo": [ { "type": "scattergeo", "marker": { "colorbar": { "ticks": "", "outlinewidth": 0 } } } ], "histogram2d": [ { "type": "histogram2d", "colorbar": { "ticks": "", "outlinewidth": 0 }, "autocolorscale": true } ], "scatterpolar": [ { "type": "scatterpolar", "marker": { "colorbar": { "ticks": "", "outlinewidth": 0 } } } ], "contourcarpet": [ { "type": "contourcarpet", "colorbar": { "ticks": "", "outlinewidth": 0 } } ], "scattercarpet": [ { "type": "scattercarpet", "marker": { "colorbar": { "ticks": "", "outlinewidth": 0 } } } ], "scattermapbox": [ { "type": "scattermapbox", "marker": { "colorbar": { "ticks": "", "outlinewidth": 0 } } } ], "scatterpolargl": [ { "type": "scatterpolargl", "marker": { "colorbar": { "ticks": "", "outlinewidth": 0 } } } ], "scatterternary": [ { "type": "scatterternary", "marker": { "colorbar": { "ticks": "", "outlinewidth": 0 } } } ], "histogram2dcontour": [ { "type": "histogram2dcontour", "colorbar": { "ticks": "", "outlinewidth": 0 }, "autocolorscale": true } ] }, "layout": { "geo": { "bgcolor": "white", "showland": true, "lakecolor": "white", "landcolor": "white", "showlakes": true, "subunitcolor": "#C8D4E3" }, "font": { "color": "#2a3f5f" }, "polar": { "bgcolor": "white", "radialaxis": { "ticks": "", "gridcolor": "#EBF0F8", "linecolor": "#EBF0F8" }, "angularaxis": { "ticks": "", "gridcolor": "#EBF0F8", "linecolor": "#EBF0F8" } }, "scene": { "xaxis": { "ticks": "", "gridcolor": "#DFE8F3", "gridwidth": 2, "linecolor": "#EBF0F8", "zerolinecolor": "#EBF0F8", "showbackground": true, "backgroundcolor": "white" }, "yaxis": { "ticks": "", "gridcolor": "#DFE8F3", "gridwidth": 2, "linecolor": "#EBF0F8", "zerolinecolor": "#EBF0F8", "showbackground": true, "backgroundcolor": "white" }, "zaxis": { "ticks": "", "gridcolor": "#DFE8F3", "gridwidth": 2, "linecolor": "#EBF0F8", "zerolinecolor": "#EBF0F8", "showbackground": true, "backgroundcolor": "white" } }, "title": { "x": 0.05 }, "xaxis": { "ticks": "", "gridcolor": "#EBF0F8", "linecolor": "#EBF0F8", "automargin": true, "zerolinecolor": "#EBF0F8", "zerolinewidth": 2 }, "yaxis": { "ticks": "", "gridcolor": "#EBF0F8", "linecolor": "#EBF0F8", "automargin": true, "zerolinecolor": "#EBF0F8", "zerolinewidth": 2 }, "ternary": { "aaxis": { "ticks": "", "gridcolor": "#DFE8F3", "linecolor": "#A2B1C6" }, "baxis": { "ticks": "", "gridcolor": "#DFE8F3", "linecolor": "#A2B1C6" }, "caxis": { "ticks": "", "gridcolor": "#DFE8F3", "linecolor": "#A2B1C6" }, "bgcolor": "white" }, "colorway": [ "#636efa", "#EF553B", "#00cc96", "#ab63fa", "#19d3f3", "#e763fa", "#fecb52", "#ffa15a", "#ff6692", "#b6e880" ], "hovermode": "closest", "colorscale": { "diverging": [ [ 0, "#8e0152" ], [ 0.1, "#c51b7d" ], [ 0.2, "#de77ae" ], [ 0.3, "#f1b6da" ], [ 0.4, "#fde0ef" ], [ 0.5, "#f7f7f7" ], [ 0.6, "#e6f5d0" ], [ 0.7, "#b8e186" ], [ 0.8, "#7fbc41" ], [ 0.9, "#4d9221" ], [ 1, "#276419" ] ], "sequential": [ [ 0, "#0508b8" ], [ 0.0893854748603352, "#1910d8" ], [ 0.1787709497206704, "#3c19f0" ], [ 0.2681564245810056, "#6b1cfb" ], [ 0.3575418994413408, "#981cfd" ], [ 0.44692737430167595, "#bf1cfd" ], [ 0.5363128491620112, "#dd2bfd" ], [ 0.6256983240223464, "#f246fe" ], [ 0.7150837988826816, "#fc67fd" ], [ 0.8044692737430168, "#fe88fc" ], [ 0.8938547486033519, "#fea5fd" ], [ 0.9832402234636871, "#febefe" ], [ 1, "#fec3fe" ] ], "sequentialminus": [ [ 0, "#0508b8" ], [ 0.0893854748603352, "#1910d8" ], [ 0.1787709497206704, "#3c19f0" ], [ 0.2681564245810056, "#6b1cfb" ], [ 0.3575418994413408, "#981cfd" ], [ 0.44692737430167595, "#bf1cfd" ], [ 0.5363128491620112, "#dd2bfd" ], [ 0.6256983240223464, "#f246fe" ], [ 0.7150837988826816, "#fc67fd" ], [ 0.8044692737430168, "#fe88fc" ], [ 0.8938547486033519, "#fea5fd" ], [ 0.9832402234636871, "#febefe" ], [ 1, "#fec3fe" ] ] }, "plot_bgcolor": "white", "paper_bgcolor": "white", "shapedefaults": { "line": { "width": 0 }, "opacity": 0.4, "fillcolor": "#506784" }, "annotationdefaults": { "arrowhead": 0, "arrowcolor": "#506784", "arrowwidth": 1 } }, "themeRef": "PLOTLY_WHITE" } } }, "height": null, "width": null, "user": { "profile_url": "https://chart-studio.plotly.com/~shayna.jung", "avatar_url": "https://storage.googleapis.com/plotly-prod-profiles/64.jpg", "background_url": "https://storage.googleapis.com/plotly-prod-profiles/bg-8.jpg", "bio": "", "nickname": "", "website": "", "stream_tokens": null, "feature_set_id": null, "csrf_token": null, "date_joined": "2025-07-04 22:24:46", "mapbox_access_tokens": null, "has_password": null, "username": "shayna.jung", "email": null, "is_active": null, "readonly": null, "is_dash_creator": null, "dash_created_count": null, "is_chart_creator": null, "charts_created_count": null } }, { "creation_time": "2025-08-02T21:32:40.959080Z", "comments": { "results": [], "count": 0 }, "parented": true, "embed_url": "https://chart-studio.plotly.com/~shayna.jung/23.embed", "fid": "shayna.jung:23", "filename": "Plot 23", "filetype": "plot", "img_url": "https://storage.googleapis.com/plotly-prod-images/shayna.jung/23/9_BYM9S6HRO57TOVCR43C668P0OX3WM7.png", "image_urls": { "default": "https://storage.googleapis.com/plotly-prod-images/shayna.jung/23/2_9HHHY0Q5OMMQF9XSSYI264BPMW6QAE.png", "block-thumb": "https://storage.googleapis.com/plotly-prod-images/shayna.jung/23/8_7Z00GCOLT1BF4UFHPX5MS1GSB2J5L4.png", "list-thumb": "https://storage.googleapis.com/plotly-prod-images/shayna.jung/23/9_BYM9S6HRO57TOVCR43C668P0OX3WM7.png" }, "api_urls": { "files": "https://api.plotly.com/v2/files/shayna.jung:23", "plots": "https://api.plotly.com/v2/plots/shayna.jung:23", "parent": "https://api.plotly.com/v2/folders/home?user=shayna.jung" }, "owner": "shayna.jung", "parent": -1, "preview": "", "referencers": [], "references": [], "title": "", "views": 1, "web_url": "https://chart-studio.plotly.com/~shayna.jung/23/", "world_readable": true, "date_modified": "2025-08-02T22:34:46.995Z", "stars": { "results": [], "count": 0 }, "collaborators": { "results": [], "count": 0 }, "subfolder_count": null, "refresh_interval": null, "organize_view_url": "https://chart-studio.plotly.com/~shayna.jung/23/", "current_user_permission": "read", "is_theme": null, "is_template": false, "autosize": true, "caption": "", "figure": { "data": [ { "meta": { "columnNames": { "x": "Wavelength", "y": "Geranium (% max)" } }, "mode": "lines", "type": "scatter", "xsrc": "shayna.jung:26:62e374", "ysrc": "shayna.jung:26:8324a0" } ], "frames": [], "layout": { "title": { "text": "Change in % Maximum Absorbance of Geranium as Wavelength Changes" }, "xaxis": { "type": "linear", "range": [ 400, 760 ], "title": { "text": "Wavelength (nm)" }, "autorange": true }, "yaxis": { "type": "linear", "range": [ -5.093099671377778, 105.53121577217777 ], "title": { "text": "% Maximum Absorbance" }, "autorange": true }, "autosize": true, "template": { "data": { "bar": [ { "type": "bar", "marker": { "colorbar": { "ticks": "", "outlinewidth": 0 } } } ], "table": [ { "type": "table", "cells": { "fill": { "color": "#EBF0F8" }, "line": { "color": "white" } }, "header": { "fill": { "color": "#C8D4E3" }, "line": { "color": "white" } } } ], "carpet": [ { "type": "carpet", "aaxis": { "gridcolor": "#C8D4E3", "linecolor": "#C8D4E3", "endlinecolor": "#2a3f5f", "minorgridcolor": "#C8D4E3", "startlinecolor": "#2a3f5f" }, "baxis": { "gridcolor": "#C8D4E3", "linecolor": "#C8D4E3", "endlinecolor": "#2a3f5f", "minorgridcolor": "#C8D4E3", "startlinecolor": "#2a3f5f" } } ], "mesh3d": [ { "type": "mesh3d", "colorbar": { "ticks": "", "outlinewidth": 0 } } ], "contour": [ { "type": "contour", "colorbar": { "ticks": "", "outlinewidth": 0 }, "autocolorscale": true } ], "heatmap": [ { "type": "heatmap", "colorbar": { "ticks": "", "outlinewidth": 0 }, "autocolorscale": true } ], "scatter": [ { "type": "scatter", "marker": { "colorbar": { "ticks": "", "outlinewidth": 0 } } } ], "surface": [ { "type": "surface", "colorbar": { "ticks": "", "outlinewidth": 0 } } ], "heatmapgl": [ { "type": "heatmapgl", "colorbar": { "ticks": "", "outlinewidth": 0 } } ], "histogram": [ { "type": "histogram", "marker": { "colorbar": { "ticks": "", "outlinewidth": 0 } } } ], "parcoords": [ { "line": { "colorbar": { "ticks": "", "outlinewidth": 0 } }, "type": "parcoords" } ], "scatter3d": [ { "type": "scatter3d", "marker": { "colorbar": { "ticks": "", "outlinewidth": 0 } } } ], "scattergl": [ { "type": "scattergl", "marker": { "colorbar": { "ticks": "", "outlinewidth": 0 } } } ], "choropleth": [ { "type": "choropleth", "colorbar": { "ticks": "", "outlinewidth": 0 } } ], "scattergeo": [ { "type": "scattergeo", "marker": { "colorbar": { "ticks": "", "outlinewidth": 0 } } } ], "histogram2d": [ { "type": "histogram2d", "colorbar": { "ticks": "", "outlinewidth": 0 }, "autocolorscale": true } ], "scatterpolar": [ { "type": "scatterpolar", "marker": { "colorbar": { "ticks": "", "outlinewidth": 0 } } } ], "contourcarpet": [ { "type": "contourcarpet", "colorbar": { "ticks": "", "outlinewidth": 0 } } ], "scattercarpet": [ { "type": "scattercarpet", "marker": { "colorbar": { "ticks": "", "outlinewidth": 0 } } } ], "scattermapbox": [ { "type": "scattermapbox", "marker": { "colorbar": { "ticks": "", "outlinewidth": 0 } } } ], "scatterpolargl": [ { "type": "scatterpolargl", "marker": { "colorbar": { "ticks": "", "outlinewidth": 0 } } } ], "scatterternary": [ { "type": "scatterternary", "marker": { "colorbar": { "ticks": "", "outlinewidth": 0 } } } ], "histogram2dcontour": [ { "type": "histogram2dcontour", "colorbar": { "ticks": "", "outlinewidth": 0 }, "autocolorscale": true } ] }, "layout": { "geo": { "bgcolor": "white", "showland": true, "lakecolor": "white", "landcolor": "white", "showlakes": true, "subunitcolor": "#C8D4E3" }, "font": { "color": "#2a3f5f" }, "polar": { "bgcolor": "white", "radialaxis": { "ticks": "", "gridcolor": "#EBF0F8", "linecolor": "#EBF0F8" }, "angularaxis": { "ticks": "", "gridcolor": "#EBF0F8", "linecolor": "#EBF0F8" } }, "scene": { "xaxis": { "ticks": "", "gridcolor": "#DFE8F3", "gridwidth": 2, "linecolor": "#EBF0F8", "zerolinecolor": "#EBF0F8", "showbackground": true, "backgroundcolor": "white" }, "yaxis": { "ticks": "", "gridcolor": "#DFE8F3", "gridwidth": 2, "linecolor": "#EBF0F8", "zerolinecolor": "#EBF0F8", "showbackground": true, "backgroundcolor": "white" }, "zaxis": { "ticks": "", "gridcolor": "#DFE8F3", "gridwidth": 2, "linecolor": "#EBF0F8", "zerolinecolor": "#EBF0F8", "showbackground": true, "backgroundcolor": "white" } }, "title": { "x": 0.05 }, "xaxis": { "ticks": "", "gridcolor": "#EBF0F8", "linecolor": "#EBF0F8", "automargin": true, "zerolinecolor": "#EBF0F8", "zerolinewidth": 2 }, "yaxis": { "ticks": "", "gridcolor": "#EBF0F8", "linecolor": "#EBF0F8", "automargin": true, "zerolinecolor": "#EBF0F8", "zerolinewidth": 2 }, "ternary": { "aaxis": { "ticks": "", "gridcolor": "#DFE8F3", "linecolor": "#A2B1C6" }, "baxis": { "ticks": "", "gridcolor": "#DFE8F3", "linecolor": "#A2B1C6" }, "caxis": { "ticks": "", "gridcolor": "#DFE8F3", "linecolor": "#A2B1C6" }, "bgcolor": "white" }, "colorway": [ "#636efa", "#EF553B", "#00cc96", "#ab63fa", "#19d3f3", "#e763fa", "#fecb52", "#ffa15a", "#ff6692", "#b6e880" ], "hovermode": "closest", "colorscale": { "diverging": [ [ 0, "#8e0152" ], [ 0.1, "#c51b7d" ], [ 0.2, "#de77ae" ], [ 0.3, "#f1b6da" ], [ 0.4, "#fde0ef" ], [ 0.5, "#f7f7f7" ], [ 0.6, "#e6f5d0" ], [ 0.7, "#b8e186" ], [ 0.8, "#7fbc41" ], [ 0.9, "#4d9221" ], [ 1, "#276419" ] ], "sequential": [ [ 0, "#0508b8" ], [ 0.0893854748603352, "#1910d8" ], [ 0.1787709497206704, "#3c19f0" ], [ 0.2681564245810056, "#6b1cfb" ], [ 0.3575418994413408, "#981cfd" ], [ 0.44692737430167595, "#bf1cfd" ], [ 0.5363128491620112, "#dd2bfd" ], [ 0.6256983240223464, "#f246fe" ], [ 0.7150837988826816, "#fc67fd" ], [ 0.8044692737430168, "#fe88fc" ], [ 0.8938547486033519, "#fea5fd" ], [ 0.9832402234636871, "#febefe" ], [ 1, "#fec3fe" ] ], "sequentialminus": [ [ 0, "#0508b8" ], [ 0.0893854748603352, "#1910d8" ], [ 0.1787709497206704, "#3c19f0" ], [ 0.2681564245810056, "#6b1cfb" ], [ 0.3575418994413408, "#981cfd" ], [ 0.44692737430167595, "#bf1cfd" ], [ 0.5363128491620112, "#dd2bfd" ], [ 0.6256983240223464, "#f246fe" ], [ 0.7150837988826816, "#fc67fd" ], [ 0.8044692737430168, "#fe88fc" ], [ 0.8938547486033519, "#fea5fd" ], [ 0.9832402234636871, "#febefe" ], [ 1, "#fec3fe" ] ] }, "plot_bgcolor": "white", "paper_bgcolor": "white", "shapedefaults": { "line": { "width": 0 }, "opacity": 0.4, "fillcolor": "#506784" }, "annotationdefaults": { "arrowhead": 0, "arrowcolor": "#506784", "arrowwidth": 1 } }, "themeRef": "PLOTLY_WHITE" } } }, "height": null, "width": null, "user": { "profile_url": "https://chart-studio.plotly.com/~shayna.jung", "avatar_url": "https://storage.googleapis.com/plotly-prod-profiles/64.jpg", "background_url": "https://storage.googleapis.com/plotly-prod-profiles/bg-8.jpg", "bio": "", "nickname": "", "website": "", "stream_tokens": null, "feature_set_id": null, "csrf_token": null, "date_joined": "2025-07-04 22:24:46", "mapbox_access_tokens": null, "has_password": null, "username": "shayna.jung", "email": null, "is_active": null, "readonly": null, "is_dash_creator": null, "dash_created_count": null, "is_chart_creator": null, "charts_created_count": null } }, { "creation_time": "2025-08-02T20:51:56.104600Z", "comments": { "results": [], "count": 0 }, "parented": true, "embed_url": "https://chart-studio.plotly.com/~mlwhite2/7.embed", "fid": "mlwhite2:7", "filename": "averaged naive nn for Periodic Cube Bacterium, 6000 5nm molecules, s = 250nm, η = 0.2011.html", "filetype": "plot", "img_url": "https://storage.googleapis.com/plotly-prod-images/mlwhite2/7/9_80RARW1Z15FHKPYI707YGTFOAJBXBC.png", "image_urls": { "default": "https://storage.googleapis.com/plotly-prod-images/mlwhite2/7/2_D97J6QOQNHQ6EPON0WUE2QC5JUKJTL.png", "block-thumb": "https://storage.googleapis.com/plotly-prod-images/mlwhite2/7/8_RSLTLKL4UZJJS9LQ6SWYIIWXSHRAGF.png", "list-thumb": "https://storage.googleapis.com/plotly-prod-images/mlwhite2/7/9_80RARW1Z15FHKPYI707YGTFOAJBXBC.png" }, "api_urls": { "files": "https://api.plotly.com/v2/files/mlwhite2:7", "plots": "https://api.plotly.com/v2/plots/mlwhite2:7", "parent": "https://api.plotly.com/v2/folders/home?user=mlwhite2" }, "owner": "mlwhite2", "parent": -1, "preview": "", "referencers": [], "references": [], "title": "", "views": 2, "web_url": "https://chart-studio.plotly.com/~mlwhite2/7/", "world_readable": true, "date_modified": "2025-08-02T20:51:56.116Z", "stars": { "results": [], "count": 0 }, "collaborators": { "results": [], "count": 0 }, "subfolder_count": null, "refresh_interval": null, "organize_view_url": "https://chart-studio.plotly.com/~mlwhite2/7/", "current_user_permission": "read", "is_theme": null, "is_template": null, "autosize": true, "caption": "", "figure": { "data": [ { "mode": "markers", "name": "PY nn dist.", "type": "scattergl", "xsrc": "mlwhite2:6:c164ca", "ysrc": "mlwhite2:6:3317ae", "xaxis": "x", "yaxis": "y", "marker": { "color": "#636efa", "symbol": "circle" }, "showlegend": true, "legendgroup": "PY nn dist.", "hovertemplate": "color=PY nn dist.<br>x=%{x}<br>y=%{y}<extra></extra>" }, { "mode": "markers", "name": "averaged naive nn dist. ; η = 0.2011, dr = 0.5 nm", "type": "scattergl", "xsrc": "mlwhite2:6:b2b29a", "ysrc": "mlwhite2:6:257f3a", "xaxis": "x", "yaxis": "y", "marker": { "color": "#EF553B", "symbol": "circle" }, "showlegend": true, "legendgroup": "averaged naive nn dist. ; η = 0.2011, dr = 0.5 nm", "hovertemplate": "color=averaged naive nn dist. ; η = 0.2011, dr = 0.5 nm<br>x=%{x}<br>y=%{y}<extra></extra>" } ], "layout": { "xaxis": { "title": { "text": "r (nm)" }, "anchor": "y", "domain": [ 0.0, 1.0 ] }, "yaxis": { "title": { "text": "nearest neighbor distribution" }, "anchor": "x", "domain": [ 0.0, 1.0 ] }, "legend": { "title": { "text": "Legend:" }, "tracegroupgap": 0 }, "margin": { "t": 60 }, "template": { "data": { "bar": [ { "type": "bar", "marker": { "line": { "color": "#E5ECF6", "width": 0.5 }, "pattern": { "size": 10, "fillmode": "overlay", "solidity": 0.2 } }, "error_x": { "color": "#2a3f5f" }, "error_y": { "color": "#2a3f5f" } } ], "pie": [ { "type": "pie", "automargin": true } ], "table": [ { "type": "table", "cells": { "fill": { "color": "#EBF0F8" }, "line": { "color": "white" } }, "header": { "fill": { "color": "#C8D4E3" }, "line": { "color": "white" } } } ], "carpet": [ { "type": "carpet", "aaxis": { "gridcolor": "white", "linecolor": "white", "endlinecolor": "#2a3f5f", "minorgridcolor": "white", "startlinecolor": "#2a3f5f" }, "baxis": { "gridcolor": "white", "linecolor": "white", "endlinecolor": "#2a3f5f", "minorgridcolor": "white", "startlinecolor": "#2a3f5f" } } ], "mesh3d": [ { "type": "mesh3d", "colorbar": { "ticks": "", "outlinewidth": 0 } } ], "contour": [ { "type": "contour", "colorbar": { "ticks": "", "outlinewidth": 0 }, "colorscale": [ [ 0.0, "#0d0887" ], [ 0.1111111111111111, "#46039f" ], [ 0.2222222222222222, "#7201a8" ], [ 0.3333333333333333, "#9c179e" ], [ 0.4444444444444444, "#bd3786" ], [ 0.5555555555555556, "#d8576b" ], [ 0.6666666666666666, "#ed7953" ], [ 0.7777777777777778, "#fb9f3a" ], [ 0.8888888888888888, "#fdca26" ], [ 1.0, "#f0f921" ] ] } ], "heatmap": [ { "type": "heatmap", "colorbar": { "ticks": "", "outlinewidth": 0 }, "colorscale": [ [ 0.0, "#0d0887" ], [ 0.1111111111111111, "#46039f" ], [ 0.2222222222222222, "#7201a8" ], [ 0.3333333333333333, "#9c179e" ], [ 0.4444444444444444, "#bd3786" ], [ 0.5555555555555556, "#d8576b" ], [ 0.6666666666666666, "#ed7953" ], [ 0.7777777777777778, "#fb9f3a" ], [ 0.8888888888888888, "#fdca26" ], [ 1.0, "#f0f921" ] ] } ], "scatter": [ { "type": "scatter", "fillpattern": { "size": 10, "fillmode": "overlay", "solidity": 0.2 } } ], "surface": [ { "type": "surface", "colorbar": { "ticks": "", "outlinewidth": 0 }, "colorscale": [ [ 0.0, "#0d0887" ], [ 0.1111111111111111, "#46039f" ], [ 0.2222222222222222, "#7201a8" ], [ 0.3333333333333333, "#9c179e" ], [ 0.4444444444444444, "#bd3786" ], [ 0.5555555555555556, "#d8576b" ], [ 0.6666666666666666, "#ed7953" ], [ 0.7777777777777778, "#fb9f3a" ], [ 0.8888888888888888, "#fdca26" ], [ 1.0, "#f0f921" ] ] } ], "barpolar": [ { "type": "barpolar", "marker": { "line": { "color": "#E5ECF6", "width": 0.5 }, "pattern": { "size": 10, "fillmode": "overlay", "solidity": 0.2 } } } ], "heatmapgl": [ { "type": "heatmapgl", "colorbar": { "ticks": "", "outlinewidth": 0 }, "colorscale": [ [ 0.0, "#0d0887" ], [ 0.1111111111111111, "#46039f" ], [ 0.2222222222222222, "#7201a8" ], [ 0.3333333333333333, "#9c179e" ], [ 0.4444444444444444, "#bd3786" ], [ 0.5555555555555556, "#d8576b" ], [ 0.6666666666666666, "#ed7953" ], [ 0.7777777777777778, "#fb9f3a" ], [ 0.8888888888888888, "#fdca26" ], [ 1.0, "#f0f921" ] ] } ], "histogram": [ { "type": "histogram", "marker": { "pattern": { "size": 10, "fillmode": "overlay", "solidity": 0.2 } } } ], "parcoords": [ { "line": { "colorbar": { "ticks": "", "outlinewidth": 0 } }, "type": "parcoords" } ], "scatter3d": [ { "line": { "colorbar": { "ticks": "", "outlinewidth": 0 } }, "type": "scatter3d", "marker": { "colorbar": { "ticks": "", "outlinewidth": 0 } } } ], "scattergl": [ { "type": "scattergl", "marker": { "colorbar": { "ticks": "", "outlinewidth": 0 } } } ], "choropleth": [ { "type": "choropleth", "colorbar": { "ticks": "", "outlinewidth": 0 } } ], "scattergeo": [ { "type": "scattergeo", "marker": { "colorbar": { "ticks": "", "outlinewidth": 0 } } } ], "histogram2d": [ { "type": "histogram2d", "colorbar": { "ticks": "", "outlinewidth": 0 }, "colorscale": [ [ 0.0, "#0d0887" ], [ 0.1111111111111111, "#46039f" ], [ 0.2222222222222222, "#7201a8" ], [ 0.3333333333333333, "#9c179e" ], [ 0.4444444444444444, "#bd3786" ], [ 0.5555555555555556, "#d8576b" ], [ 0.6666666666666666, "#ed7953" ], [ 0.7777777777777778, "#fb9f3a" ], [ 0.8888888888888888, "#fdca26" ], [ 1.0, "#f0f921" ] ] } ], "scatterpolar": [ { "type": "scatterpolar", "marker": { "colorbar": { "ticks": "", "outlinewidth": 0 } } } ], "contourcarpet": [ { "type": "contourcarpet", "colorbar": { "ticks": "", "outlinewidth": 0 } } ], "scattercarpet": [ { "type": "scattercarpet", "marker": { "colorbar": { "ticks": "", "outlinewidth": 0 } } } ], "scattermapbox": [ { "type": "scattermapbox", "marker": { "colorbar": { "ticks": "", "outlinewidth": 0 } } } ], "scatterpolargl": [ { "type": "scatterpolargl", "marker": { "colorbar": { "ticks": "", "outlinewidth": 0 } } } ], "scatterternary": [ { "type": "scatterternary", "marker": { "colorbar": { "ticks": "", "outlinewidth": 0 } } } ], "histogram2dcontour": [ { "type": "histogram2dcontour", "colorbar": { "ticks": "", "outlinewidth": 0 }, "colorscale": [ [ 0.0, "#0d0887" ], [ 0.1111111111111111, "#46039f" ], [ 0.2222222222222222, "#7201a8" ], [ 0.3333333333333333, "#9c179e" ], [ 0.4444444444444444, "#bd3786" ], [ 0.5555555555555556, "#d8576b" ], [ 0.6666666666666666, "#ed7953" ], [ 0.7777777777777778, "#fb9f3a" ], [ 0.8888888888888888, "#fdca26" ], [ 1.0, "#f0f921" ] ] } ] }, "layout": { "geo": { "bgcolor": "white", "showland": true, "lakecolor": "white", "landcolor": "#E5ECF6", "showlakes": true, "subunitcolor": "white" }, "font": { "color": "#2a3f5f" }, "polar": { "bgcolor": "#E5ECF6", "radialaxis": { "ticks": "", "gridcolor": "white", "linecolor": "white" }, "angularaxis": { "ticks": "", "gridcolor": "white", "linecolor": "white" } }, "scene": { "xaxis": { "ticks": "", "gridcolor": "white", "gridwidth": 2, "linecolor": "white", "zerolinecolor": "white", "showbackground": true, "backgroundcolor": "#E5ECF6" }, "yaxis": { "ticks": "", "gridcolor": "white", "gridwidth": 2, "linecolor": "white", "zerolinecolor": "white", "showbackground": true, "backgroundcolor": "#E5ECF6" }, "zaxis": { "ticks": "", "gridcolor": "white", "gridwidth": 2, "linecolor": "white", "zerolinecolor": "white", "showbackground": true, "backgroundcolor": "#E5ECF6" } }, "title": { "x": 0.05 }, "xaxis": { "ticks": "", "title": { "standoff": 15 }, "gridcolor": "white", "linecolor": "white", "automargin": true, "zerolinecolor": "white", "zerolinewidth": 2 }, "yaxis": { "ticks": "", "title": { "standoff": 15 }, "gridcolor": "white", "linecolor": "white", "automargin": true, "zerolinecolor": "white", "zerolinewidth": 2 }, "mapbox": { "style": "light" }, "ternary": { "aaxis": { "ticks": "", "gridcolor": "white", "linecolor": "white" }, "baxis": { "ticks": "", "gridcolor": "white", "linecolor": "white" }, "caxis": { "ticks": "", "gridcolor": "white", "linecolor": "white" }, "bgcolor": "#E5ECF6" }, "colorway": [ "#636efa", "#EF553B", "#00cc96", "#ab63fa", "#FFA15A", "#19d3f3", "#FF6692", "#B6E880", "#FF97FF", "#FECB52" ], "coloraxis": { "colorbar": { "ticks": "", "outlinewidth": 0 } }, "hovermode": "closest", "colorscale": { "diverging": [ [ 0, "#8e0152" ], [ 0.1, "#c51b7d" ], [ 0.2, "#de77ae" ], [ 0.3, "#f1b6da" ], [ 0.4, "#fde0ef" ], [ 0.5, "#f7f7f7" ], [ 0.6, "#e6f5d0" ], [ 0.7, "#b8e186" ], [ 0.8, "#7fbc41" ], [ 0.9, "#4d9221" ], [ 1, "#276419" ] ], "sequential": [ [ 0.0, "#0d0887" ], [ 0.1111111111111111, "#46039f" ], [ 0.2222222222222222, "#7201a8" ], [ 0.3333333333333333, "#9c179e" ], [ 0.4444444444444444, "#bd3786" ], [ 0.5555555555555556, "#d8576b" ], [ 0.6666666666666666, "#ed7953" ], [ 0.7777777777777778, "#fb9f3a" ], [ 0.8888888888888888, "#fdca26" ], [ 1.0, "#f0f921" ] ], "sequentialminus": [ [ 0.0, "#0d0887" ], [ 0.1111111111111111, "#46039f" ], [ 0.2222222222222222, "#7201a8" ], [ 0.3333333333333333, "#9c179e" ], [ 0.4444444444444444, "#bd3786" ], [ 0.5555555555555556, "#d8576b" ], [ 0.6666666666666666, "#ed7953" ], [ 0.7777777777777778, "#fb9f3a" ], [ 0.8888888888888888, "#fdca26" ], [ 1.0, "#f0f921" ] ] }, "hoverlabel": { "align": "left" }, "plot_bgcolor": "#E5ECF6", "paper_bgcolor": "white", "shapedefaults": { "line": { "color": "#2a3f5f" } }, "autotypenumbers": "strict", "annotationdefaults": { "arrowhead": 0, "arrowcolor": "#2a3f5f", "arrowwidth": 1 } } } } }, "height": null, "width": null, "user": { "profile_url": "https://chart-studio.plotly.com/~mlwhite2", "avatar_url": "https://storage.googleapis.com/plotly-prod-profiles/42.jpg", "background_url": "https://storage.googleapis.com/plotly-prod-profiles/bg-10.jpg", "bio": "", "nickname": "", "website": "", "stream_tokens": null, "feature_set_id": null, "csrf_token": null, "date_joined": "2025-08-02 19:09:05", "mapbox_access_tokens": null, "has_password": null, "username": "mlwhite2", "email": null, "is_active": null, "readonly": null, "is_dash_creator": null, "dash_created_count": null, "is_chart_creator": null, "charts_created_count": null } }, { "creation_time": "2025-08-02T20:51:52.823999Z", "comments": { "results": [], "count": 0 }, "parented": true, "embed_url": "https://chart-studio.plotly.com/~mlwhite2/5.embed", "fid": "mlwhite2:5", "filename": "averaged naive g(r) for Periodic Cube Bacterium, 6000 5nm molecules, s = 250nm, η = 0.2011.html", "filetype": "plot", "img_url": "https://storage.googleapis.com/plotly-prod-images/mlwhite2/5/9_OUQC036RPX1NN1VPXVC61E177ZO8T5.png", "image_urls": { "default": "https://storage.googleapis.com/plotly-prod-images/mlwhite2/5/2_KFVG64DLVKGOXRSNPN6Z47A5ICBZUJ.png", "block-thumb": "https://storage.googleapis.com/plotly-prod-images/mlwhite2/5/8_VASAWML3608KGMBQM030PX7SOKKONY.png", "list-thumb": "https://storage.googleapis.com/plotly-prod-images/mlwhite2/5/9_OUQC036RPX1NN1VPXVC61E177ZO8T5.png" }, "api_urls": { "files": "https://api.plotly.com/v2/files/mlwhite2:5", "plots": "https://api.plotly.com/v2/plots/mlwhite2:5", "parent": "https://api.plotly.com/v2/folders/home?user=mlwhite2" }, "owner": "mlwhite2", "parent": -1, "preview": "", "referencers": [], "references": [], "title": "", "views": 4, "web_url": "https://chart-studio.plotly.com/~mlwhite2/5/", "world_readable": true, "date_modified": "2025-08-02T20:51:52.834Z", "stars": { "results": [], "count": 0 }, "collaborators": { "results": [], "count": 0 }, "subfolder_count": null, "refresh_interval": null, "organize_view_url": "https://chart-studio.plotly.com/~mlwhite2/5/", "current_user_permission": "read", "is_theme": null, "is_template": null, "autosize": true, "caption": "", "figure": { "data": [ { "mode": "markers", "name": "PY g(r)", "type": "scattergl", "xsrc": "mlwhite2:4:4b7491", "ysrc": "mlwhite2:4:71edd2", "xaxis": "x", "yaxis": "y", "marker": { "color": "#636efa", "symbol": "circle" }, "showlegend": true, "legendgroup": "PY g(r)", "hovertemplate": "color=PY g(r)<br>x=%{x}<br>y=%{y}<extra></extra>" }, { "mode": "markers", "name": "Averaged naive g(r) ; η = 0.2011, dr = 1.0 nm", "type": "scattergl", "xsrc": "mlwhite2:4:5b9704", "ysrc": "mlwhite2:4:5329c9", "xaxis": "x", "yaxis": "y", "marker": { "color": "#EF553B", "symbol": "circle" }, "showlegend": true, "legendgroup": "Averaged naive g(r) ; η = 0.2011, dr = 1.0 nm", "hovertemplate": "color=Averaged naive g(r) ; η = 0.2011, dr = 1.0 nm<br>x=%{x}<br>y=%{y}<extra></extra>" } ], "layout": { "xaxis": { "title": { "text": "r (nm)" }, "anchor": "y", "domain": [ 0.0, 1.0 ] }, "yaxis": { "title": { "text": "g(r)" }, "anchor": "x", "domain": [ 0.0, 1.0 ] }, "legend": { "title": { "text": "Legend:" }, "tracegroupgap": 0 }, "margin": { "t": 60 }, "template": { "data": { "bar": [ { "type": "bar", "marker": { "line": { "color": "#E5ECF6", "width": 0.5 }, "pattern": { "size": 10, "fillmode": "overlay", "solidity": 0.2 } }, "error_x": { "color": "#2a3f5f" }, "error_y": { "color": "#2a3f5f" } } ], "pie": [ { "type": "pie", "automargin": true } ], "table": [ { "type": "table", "cells": { "fill": { "color": "#EBF0F8" }, "line": { "color": "white" } }, "header": { "fill": { "color": "#C8D4E3" }, "line": { "color": "white" } } } ], "carpet": [ { "type": "carpet", "aaxis": { "gridcolor": "white", "linecolor": "white", "endlinecolor": "#2a3f5f", "minorgridcolor": "white", "startlinecolor": "#2a3f5f" }, "baxis": { "gridcolor": "white", "linecolor": "white", "endlinecolor": "#2a3f5f", "minorgridcolor": "white", "startlinecolor": "#2a3f5f" } } ], "mesh3d": [ { "type": "mesh3d", "colorbar": { "ticks": "", "outlinewidth": 0 } } ], "contour": [ { "type": "contour", "colorbar": { "ticks": "", "outlinewidth": 0 }, "colorscale": [ [ 0.0, "#0d0887" ], [ 0.1111111111111111, "#46039f" ], [ 0.2222222222222222, "#7201a8" ], [ 0.3333333333333333, "#9c179e" ], [ 0.4444444444444444, "#bd3786" ], [ 0.5555555555555556, "#d8576b" ], [ 0.6666666666666666, "#ed7953" ], [ 0.7777777777777778, "#fb9f3a" ], [ 0.8888888888888888, "#fdca26" ], [ 1.0, "#f0f921" ] ] } ], "heatmap": [ { "type": "heatmap", "colorbar": { "ticks": "", "outlinewidth": 0 }, "colorscale": [ [ 0.0, "#0d0887" ], [ 0.1111111111111111, "#46039f" ], [ 0.2222222222222222, "#7201a8" ], [ 0.3333333333333333, "#9c179e" ], [ 0.4444444444444444, "#bd3786" ], [ 0.5555555555555556, "#d8576b" ], [ 0.6666666666666666, "#ed7953" ], [ 0.7777777777777778, "#fb9f3a" ], [ 0.8888888888888888, "#fdca26" ], [ 1.0, "#f0f921" ] ] } ], "scatter": [ { "type": "scatter", "fillpattern": { "size": 10, "fillmode": "overlay", "solidity": 0.2 } } ], "surface": [ { "type": "surface", "colorbar": { "ticks": "", "outlinewidth": 0 }, "colorscale": [ [ 0.0, "#0d0887" ], [ 0.1111111111111111, "#46039f" ], [ 0.2222222222222222, "#7201a8" ], [ 0.3333333333333333, "#9c179e" ], [ 0.4444444444444444, "#bd3786" ], [ 0.5555555555555556, "#d8576b" ], [ 0.6666666666666666, "#ed7953" ], [ 0.7777777777777778, "#fb9f3a" ], [ 0.8888888888888888, "#fdca26" ], [ 1.0, "#f0f921" ] ] } ], "barpolar": [ { "type": "barpolar", "marker": { "line": { "color": "#E5ECF6", "width": 0.5 }, "pattern": { "size": 10, "fillmode": "overlay", "solidity": 0.2 } } } ], "heatmapgl": [ { "type": "heatmapgl", "colorbar": { "ticks": "", "outlinewidth": 0 }, "colorscale": [ [ 0.0, "#0d0887" ], [ 0.1111111111111111, "#46039f" ], [ 0.2222222222222222, "#7201a8" ], [ 0.3333333333333333, "#9c179e" ], [ 0.4444444444444444, "#bd3786" ], [ 0.5555555555555556, "#d8576b" ], [ 0.6666666666666666, "#ed7953" ], [ 0.7777777777777778, "#fb9f3a" ], [ 0.8888888888888888, "#fdca26" ], [ 1.0, "#f0f921" ] ] } ], "histogram": [ { "type": "histogram", "marker": { "pattern": { "size": 10, "fillmode": "overlay", "solidity": 0.2 } } } ], "parcoords": [ { "line": { "colorbar": { "ticks": "", "outlinewidth": 0 } }, "type": "parcoords" } ], "scatter3d": [ { "line": { "colorbar": { "ticks": "", "outlinewidth": 0 } }, "type": "scatter3d", "marker": { "colorbar": { "ticks": "", "outlinewidth": 0 } } } ], "scattergl": [ { "type": "scattergl", "marker": { "colorbar": { "ticks": "", "outlinewidth": 0 } } } ], "choropleth": [ { "type": "choropleth", "colorbar": { "ticks": "", "outlinewidth": 0 } } ], "scattergeo": [ { "type": "scattergeo", "marker": { "colorbar": { "ticks": "", "outlinewidth": 0 } } } ], "histogram2d": [ { "type": "histogram2d", "colorbar": { "ticks": "", "outlinewidth": 0 }, "colorscale": [ [ 0.0, "#0d0887" ], [ 0.1111111111111111, "#46039f" ], [ 0.2222222222222222, "#7201a8" ], [ 0.3333333333333333, "#9c179e" ], [ 0.4444444444444444, "#bd3786" ], [ 0.5555555555555556, "#d8576b" ], [ 0.6666666666666666, "#ed7953" ], [ 0.7777777777777778, "#fb9f3a" ], [ 0.8888888888888888, "#fdca26" ], [ 1.0, "#f0f921" ] ] } ], "scatterpolar": [ { "type": "scatterpolar", "marker": { "colorbar": { "ticks": "", "outlinewidth": 0 } } } ], "contourcarpet": [ { "type": "contourcarpet", "colorbar": { "ticks": "", "outlinewidth": 0 } } ], "scattercarpet": [ { "type": "scattercarpet", "marker": { "colorbar": { "ticks": "", "outlinewidth": 0 } } } ], "scattermapbox": [ { "type": "scattermapbox", "marker": { "colorbar": { "ticks": "", "outlinewidth": 0 } } } ], "scatterpolargl": [ { "type": "scatterpolargl", "marker": { "colorbar": { "ticks": "", "outlinewidth": 0 } } } ], "scatterternary": [ { "type": "scatterternary", "marker": { "colorbar": { "ticks": "", "outlinewidth": 0 } } } ], "histogram2dcontour": [ { "type": "histogram2dcontour", "colorbar": { "ticks": "", "outlinewidth": 0 }, "colorscale": [ [ 0.0, "#0d0887" ], [ 0.1111111111111111, "#46039f" ], [ 0.2222222222222222, "#7201a8" ], [ 0.3333333333333333, "#9c179e" ], [ 0.4444444444444444, "#bd3786" ], [ 0.5555555555555556, "#d8576b" ], [ 0.6666666666666666, "#ed7953" ], [ 0.7777777777777778, "#fb9f3a" ], [ 0.8888888888888888, "#fdca26" ], [ 1.0, "#f0f921" ] ] } ] }, "layout": { "geo": { "bgcolor": "white", "showland": true, "lakecolor": "white", "landcolor": "#E5ECF6", "showlakes": true, "subunitcolor": "white" }, "font": { "color": "#2a3f5f" }, "polar": { "bgcolor": "#E5ECF6", "radialaxis": { "ticks": "", "gridcolor": "white", "linecolor": "white" }, "angularaxis": { "ticks": "", "gridcolor": "white", "linecolor": "white" } }, "scene": { "xaxis": { "ticks": "", "gridcolor": "white", "gridwidth": 2, "linecolor": "white", "zerolinecolor": "white", "showbackground": true, "backgroundcolor": "#E5ECF6" }, "yaxis": { "ticks": "", "gridcolor": "white", "gridwidth": 2, "linecolor": "white", "zerolinecolor": "white", "showbackground": true, "backgroundcolor": "#E5ECF6" }, "zaxis": { "ticks": "", "gridcolor": "white", "gridwidth": 2, "linecolor": "white", "zerolinecolor": "white", "showbackground": true, "backgroundcolor": "#E5ECF6" } }, "title": { "x": 0.05 }, "xaxis": { "ticks": "", "title": { "standoff": 15 }, "gridcolor": "white", "linecolor": "white", "automargin": true, "zerolinecolor": "white", "zerolinewidth": 2 }, "yaxis": { "ticks": "", "title": { "standoff": 15 }, "gridcolor": "white", "linecolor": "white", "automargin": true, "zerolinecolor": "white", "zerolinewidth": 2 }, "mapbox": { "style": "light" }, "ternary": { "aaxis": { "ticks": "", "gridcolor": "white", "linecolor": "white" }, "baxis": { "ticks": "", "gridcolor": "white", "linecolor": "white" }, "caxis": { "ticks": "", "gridcolor": "white", "linecolor": "white" }, "bgcolor": "#E5ECF6" }, "colorway": [ "#636efa", "#EF553B", "#00cc96", "#ab63fa", "#FFA15A", "#19d3f3", "#FF6692", "#B6E880", "#FF97FF", "#FECB52" ], "coloraxis": { "colorbar": { "ticks": "", "outlinewidth": 0 } }, "hovermode": "closest", "colorscale": { "diverging": [ [ 0, "#8e0152" ], [ 0.1, "#c51b7d" ], [ 0.2, "#de77ae" ], [ 0.3, "#f1b6da" ], [ 0.4, "#fde0ef" ], [ 0.5, "#f7f7f7" ], [ 0.6, "#e6f5d0" ], [ 0.7, "#b8e186" ], [ 0.8, "#7fbc41" ], [ 0.9, "#4d9221" ], [ 1, "#276419" ] ], "sequential": [ [ 0.0, "#0d0887" ], [ 0.1111111111111111, "#46039f" ], [ 0.2222222222222222, "#7201a8" ], [ 0.3333333333333333, "#9c179e" ], [ 0.4444444444444444, "#bd3786" ], [ 0.5555555555555556, "#d8576b" ], [ 0.6666666666666666, "#ed7953" ], [ 0.7777777777777778, "#fb9f3a" ], [ 0.8888888888888888, "#fdca26" ], [ 1.0, "#f0f921" ] ], "sequentialminus": [ [ 0.0, "#0d0887" ], [ 0.1111111111111111, "#46039f" ], [ 0.2222222222222222, "#7201a8" ], [ 0.3333333333333333, "#9c179e" ], [ 0.4444444444444444, "#bd3786" ], [ 0.5555555555555556, "#d8576b" ], [ 0.6666666666666666, "#ed7953" ], [ 0.7777777777777778, "#fb9f3a" ], [ 0.8888888888888888, "#fdca26" ], [ 1.0, "#f0f921" ] ] }, "hoverlabel": { "align": "left" }, "plot_bgcolor": "#E5ECF6", "paper_bgcolor": "white", "shapedefaults": { "line": { "color": "#2a3f5f" } }, "autotypenumbers": "strict", "annotationdefaults": { "arrowhead": 0, "arrowcolor": "#2a3f5f", "arrowwidth": 1 } } } } }, "height": null, "width": null, "user": { "profile_url": "https://chart-studio.plotly.com/~mlwhite2", "avatar_url": "https://storage.googleapis.com/plotly-prod-profiles/42.jpg", "background_url": "https://storage.googleapis.com/plotly-prod-profiles/bg-10.jpg", "bio": "", "nickname": "", "website": "", "stream_tokens": null, "feature_set_id": null, "csrf_token": null, "date_joined": "2025-08-02 19:09:05", "mapbox_access_tokens": null, "has_password": null, "username": "mlwhite2", "email": null, "is_active": null, "readonly": null, "is_dash_creator": null, "dash_created_count": null, "is_chart_creator": null, "charts_created_count": null } }, { "creation_time": "2025-08-02T20:44:38.671083Z", "comments": { "results": [], "count": 0 }, "parented": true, "embed_url": "https://chart-studio.plotly.com/~mbala/1.embed", "fid": "mbala:1", "filename": "Plot 1", "filetype": "plot", "img_url": "https://storage.googleapis.com/plotly-prod-images/mbala/1/9_L47MPXDTYUI5YWRHC3DRBD1HGKX55N.png", "image_urls": { "default": "https://storage.googleapis.com/plotly-prod-images/mbala/1/2_DNX3MCYRSGF05VRUSMBMI9DG2J3RWZ.png", "block-thumb": "https://storage.googleapis.com/plotly-prod-images/mbala/1/8_J8A9KB42IT4RV9FPPBLTWNIYIBQ7PG.png", "list-thumb": "https://storage.googleapis.com/plotly-prod-images/mbala/1/9_L47MPXDTYUI5YWRHC3DRBD1HGKX55N.png" }, "api_urls": { "files": "https://api.plotly.com/v2/files/mbala:1", "plots": "https://api.plotly.com/v2/plots/mbala:1", "parent": "https://api.plotly.com/v2/folders/home?user=mbala" }, "owner": "mbala", "parent": -1, "preview": "", "referencers": [], "references": [], "title": "", "views": 0, "web_url": "https://chart-studio.plotly.com/~mbala/1/", "world_readable": true, "date_modified": "2025-08-02T20:44:38.681Z", "stars": { "results": [], "count": 0 }, "collaborators": { "results": [], "count": 0 }, "subfolder_count": null, "refresh_interval": null, "organize_view_url": "https://chart-studio.plotly.com/~mbala/1/", "current_user_permission": "read", "is_theme": null, "is_template": false, "autosize": true, "caption": "", "figure": { "data": [ { "meta": { "columnNames": { "x": "x", "y": "y" } }, "type": "bar", "xsrc": "mbala:0:3c7063", "ysrc": "mbala:0:2998b7", "marker": { "color": "#e53934", "width": "700px" } } ], "frames": [], "layout": { "title": { "text": "Results from the specific site ID" }, "xaxis": { "type": "date", "range": [ "2025-05-16 12:00", "2025-07-23 12:00" ], "title": { "text": "Dates" }, "autorange": true }, "yaxis": { "type": "linear", "range": [ 0, 62.10526315789474 ], "title": { "text": "Number of forms" }, "autorange": true }, "bargap": 0.05, "barmode": "overlay", "autosize": true, "bargroupgap": 0.2 } }, "height": null, "width": null, "user": { "profile_url": "https://chart-studio.plotly.com/~mbala", "avatar_url": "https://storage.googleapis.com/plotly-prod-profiles/27.jpg", "background_url": "https://storage.googleapis.com/plotly-prod-profiles/bg-2.jpg", "bio": "", "nickname": "", "website": "", "stream_tokens": null, "feature_set_id": null, "csrf_token": null, "date_joined": "2025-08-02 20:43:30", "mapbox_access_tokens": null, "has_password": null, "username": "mbala", "email": null, "is_active": null, "readonly": null, "is_dash_creator": null, "dash_created_count": null, "is_chart_creator": null, "charts_created_count": null } }, { "creation_time": "2025-08-02T19:34:02.603935Z", "comments": { "results": [], "count": 0 }, "parented": true, "embed_url": "https://chart-studio.plotly.com/~mlwhite2/3.embed", "fid": "mlwhite2:3", "filename": "averaged nn for Periodic Cube Bacterium, 6000 5nm molecules, s = 250nm, η = 0.2011.html", "filetype": "plot", "img_url": "https://storage.googleapis.com/plotly-prod-images/mlwhite2/3/9_PYXD7B3QCJCK123ERFIYUF9I35Q0R0.png", "image_urls": { "default": "https://storage.googleapis.com/plotly-prod-images/mlwhite2/3/2_9O7SSEPMVOSBQVB9I8T7VBRZWAFY5P.png", "block-thumb": "https://storage.googleapis.com/plotly-prod-images/mlwhite2/3/8_MLHBP50K8WC808GGRTAAU2969G1ECW.png", "list-thumb": "https://storage.googleapis.com/plotly-prod-images/mlwhite2/3/9_PYXD7B3QCJCK123ERFIYUF9I35Q0R0.png" }, "api_urls": { "files": "https://api.plotly.com/v2/files/mlwhite2:3", "plots": "https://api.plotly.com/v2/plots/mlwhite2:3", "parent": "https://api.plotly.com/v2/folders/home?user=mlwhite2" }, "owner": "mlwhite2", "parent": -1, "preview": "", "referencers": [], "references": [], "title": "", "views": 0, "web_url": "https://chart-studio.plotly.com/~mlwhite2/3/", "world_readable": true, "date_modified": "2025-08-02T19:34:02.613Z", "stars": { "results": [], "count": 0 }, "collaborators": { "results": [], "count": 0 }, "subfolder_count": null, "refresh_interval": null, "organize_view_url": "https://chart-studio.plotly.com/~mlwhite2/3/", "current_user_permission": "read", "is_theme": null, "is_template": null, "autosize": true, "caption": "", "figure": { "data": [ { "mode": "markers", "name": "PY nn dist.", "type": "scattergl", "xsrc": "mlwhite2:2:cf31df", "ysrc": "mlwhite2:2:23587d", "xaxis": "x", "yaxis": "y", "marker": { "size": 6, "color": "#636efa", "symbol": "circle" }, "showlegend": true, "legendgroup": "PY nn dist.", "hovertemplate": "color=PY nn dist.<br>x=%{x}<br>y=%{y}<extra></extra>" }, { "mode": "markers", "name": "Averaged Simulation nn dist. ; η = 0.2011, dr = 0.5 nm", "type": "scattergl", "xsrc": "mlwhite2:2:fd72a1", "ysrc": "mlwhite2:2:18a861", "xaxis": "x", "yaxis": "y", "marker": { "size": 6, "color": "#EF553B", "symbol": "circle" }, "showlegend": true, "legendgroup": "Averaged Simulation nn dist. ; η = 0.2011, dr = 0.5 nm", "hovertemplate": "color=Averaged Simulation nn dist. ; η = 0.2011, dr = 0.5 nm<br>x=%{x}<br>y=%{y}<extra></extra>" } ], "layout": { "xaxis": { "title": { "text": "r (nm)" }, "anchor": "y", "domain": [ 0.0, 1.0 ] }, "yaxis": { "title": { "text": "nearest neighbor distribution" }, "anchor": "x", "domain": [ 0.0, 1.0 ] }, "legend": { "title": { "text": "Legend:" }, "tracegroupgap": 0 }, "margin": { "t": 60 }, "template": { "data": { "bar": [ { "type": "bar", "marker": { "line": { "color": "#E5ECF6", "width": 0.5 }, "pattern": { "size": 10, "fillmode": "overlay", "solidity": 0.2 } }, "error_x": { "color": "#2a3f5f" }, "error_y": { "color": "#2a3f5f" } } ], "pie": [ { "type": "pie", "automargin": true } ], "table": [ { "type": "table", "cells": { "fill": { "color": "#EBF0F8" }, "line": { "color": "white" } }, "header": { "fill": { "color": "#C8D4E3" }, "line": { "color": "white" } } } ], "carpet": [ { "type": "carpet", "aaxis": { "gridcolor": "white", "linecolor": "white", "endlinecolor": "#2a3f5f", "minorgridcolor": "white", "startlinecolor": "#2a3f5f" }, "baxis": { "gridcolor": "white", "linecolor": "white", "endlinecolor": "#2a3f5f", "minorgridcolor": "white", "startlinecolor": "#2a3f5f" } } ], "mesh3d": [ { "type": "mesh3d", "colorbar": { "ticks": "", "outlinewidth": 0 } } ], "contour": [ { "type": "contour", "colorbar": { "ticks": "", "outlinewidth": 0 }, "colorscale": [ [ 0.0, "#0d0887" ], [ 0.1111111111111111, "#46039f" ], [ 0.2222222222222222, "#7201a8" ], [ 0.3333333333333333, "#9c179e" ], [ 0.4444444444444444, "#bd3786" ], [ 0.5555555555555556, "#d8576b" ], [ 0.6666666666666666, "#ed7953" ], [ 0.7777777777777778, "#fb9f3a" ], [ 0.8888888888888888, "#fdca26" ], [ 1.0, "#f0f921" ] ] } ], "heatmap": [ { "type": "heatmap", "colorbar": { "ticks": "", "outlinewidth": 0 }, "colorscale": [ [ 0.0, "#0d0887" ], [ 0.1111111111111111, "#46039f" ], [ 0.2222222222222222, "#7201a8" ], [ 0.3333333333333333, "#9c179e" ], [ 0.4444444444444444, "#bd3786" ], [ 0.5555555555555556, "#d8576b" ], [ 0.6666666666666666, "#ed7953" ], [ 0.7777777777777778, "#fb9f3a" ], [ 0.8888888888888888, "#fdca26" ], [ 1.0, "#f0f921" ] ] } ], "scatter": [ { "type": "scatter", "fillpattern": { "size": 10, "fillmode": "overlay", "solidity": 0.2 } } ], "surface": [ { "type": "surface", "colorbar": { "ticks": "", "outlinewidth": 0 }, "colorscale": [ [ 0.0, "#0d0887" ], [ 0.1111111111111111, "#46039f" ], [ 0.2222222222222222, "#7201a8" ], [ 0.3333333333333333, "#9c179e" ], [ 0.4444444444444444, "#bd3786" ], [ 0.5555555555555556, "#d8576b" ], [ 0.6666666666666666, "#ed7953" ], [ 0.7777777777777778, "#fb9f3a" ], [ 0.8888888888888888, "#fdca26" ], [ 1.0, "#f0f921" ] ] } ], "barpolar": [ { "type": "barpolar", "marker": { "line": { "color": "#E5ECF6", "width": 0.5 }, "pattern": { "size": 10, "fillmode": "overlay", "solidity": 0.2 } } } ], "heatmapgl": [ { "type": "heatmapgl", "colorbar": { "ticks": "", "outlinewidth": 0 }, "colorscale": [ [ 0.0, "#0d0887" ], [ 0.1111111111111111, "#46039f" ], [ 0.2222222222222222, "#7201a8" ], [ 0.3333333333333333, "#9c179e" ], [ 0.4444444444444444, "#bd3786" ], [ 0.5555555555555556, "#d8576b" ], [ 0.6666666666666666, "#ed7953" ], [ 0.7777777777777778, "#fb9f3a" ], [ 0.8888888888888888, "#fdca26" ], [ 1.0, "#f0f921" ] ] } ], "histogram": [ { "type": "histogram", "marker": { "pattern": { "size": 10, "fillmode": "overlay", "solidity": 0.2 } } } ], "parcoords": [ { "line": { "colorbar": { "ticks": "", "outlinewidth": 0 } }, "type": "parcoords" } ], "scatter3d": [ { "line": { "colorbar": { "ticks": "", "outlinewidth": 0 } }, "type": "scatter3d", "marker": { "colorbar": { "ticks": "", "outlinewidth": 0 } } } ], "scattergl": [ { "type": "scattergl", "marker": { "colorbar": { "ticks": "", "outlinewidth": 0 } } } ], "choropleth": [ { "type": "choropleth", "colorbar": { "ticks": "", "outlinewidth": 0 } } ], "scattergeo": [ { "type": "scattergeo", "marker": { "colorbar": { "ticks": "", "outlinewidth": 0 } } } ], "histogram2d": [ { "type": "histogram2d", "colorbar": { "ticks": "", "outlinewidth": 0 }, "colorscale": [ [ 0.0, "#0d0887" ], [ 0.1111111111111111, "#46039f" ], [ 0.2222222222222222, "#7201a8" ], [ 0.3333333333333333, "#9c179e" ], [ 0.4444444444444444, "#bd3786" ], [ 0.5555555555555556, "#d8576b" ], [ 0.6666666666666666, "#ed7953" ], [ 0.7777777777777778, "#fb9f3a" ], [ 0.8888888888888888, "#fdca26" ], [ 1.0, "#f0f921" ] ] } ], "scatterpolar": [ { "type": "scatterpolar", "marker": { "colorbar": { "ticks": "", "outlinewidth": 0 } } } ], "contourcarpet": [ { "type": "contourcarpet", "colorbar": { "ticks": "", "outlinewidth": 0 } } ], "scattercarpet": [ { "type": "scattercarpet", "marker": { "colorbar": { "ticks": "", "outlinewidth": 0 } } } ], "scattermapbox": [ { "type": "scattermapbox", "marker": { "colorbar": { "ticks": "", "outlinewidth": 0 } } } ], "scatterpolargl": [ { "type": "scatterpolargl", "marker": { "colorbar": { "ticks": "", "outlinewidth": 0 } } } ], "scatterternary": [ { "type": "scatterternary", "marker": { "colorbar": { "ticks": "", "outlinewidth": 0 } } } ], "histogram2dcontour": [ { "type": "histogram2dcontour", "colorbar": { "ticks": "", "outlinewidth": 0 }, "colorscale": [ [ 0.0, "#0d0887" ], [ 0.1111111111111111, "#46039f" ], [ 0.2222222222222222, "#7201a8" ], [ 0.3333333333333333, "#9c179e" ], [ 0.4444444444444444, "#bd3786" ], [ 0.5555555555555556, "#d8576b" ], [ 0.6666666666666666, "#ed7953" ], [ 0.7777777777777778, "#fb9f3a" ], [ 0.8888888888888888, "#fdca26" ], [ 1.0, "#f0f921" ] ] } ] }, "layout": { "geo": { "bgcolor": "white", "showland": true, "lakecolor": "white", "landcolor": "#E5ECF6", "showlakes": true, "subunitcolor": "white" }, "font": { "color": "#2a3f5f" }, "polar": { "bgcolor": "#E5ECF6", "radialaxis": { "ticks": "", "gridcolor": "white", "linecolor": "white" }, "angularaxis": { "ticks": "", "gridcolor": "white", "linecolor": "white" } }, "scene": { "xaxis": { "ticks": "", "gridcolor": "white", "gridwidth": 2, "linecolor": "white", "zerolinecolor": "white", "showbackground": true, "backgroundcolor": "#E5ECF6" }, "yaxis": { "ticks": "", "gridcolor": "white", "gridwidth": 2, "linecolor": "white", "zerolinecolor": "white", "showbackground": true, "backgroundcolor": "#E5ECF6" }, "zaxis": { "ticks": "", "gridcolor": "white", "gridwidth": 2, "linecolor": "white", "zerolinecolor": "white", "showbackground": true, "backgroundcolor": "#E5ECF6" } }, "title": { "x": 0.05 }, "xaxis": { "ticks": "", "title": { "standoff": 15 }, "gridcolor": "white", "linecolor": "white", "automargin": true, "zerolinecolor": "white", "zerolinewidth": 2 }, "yaxis": { "ticks": "", "title": { "standoff": 15 }, "gridcolor": "white", "linecolor": "white", "automargin": true, "zerolinecolor": "white", "zerolinewidth": 2 }, "mapbox": { "style": "light" }, "ternary": { "aaxis": { "ticks": "", "gridcolor": "white", "linecolor": "white" }, "baxis": { "ticks": "", "gridcolor": "white", "linecolor": "white" }, "caxis": { "ticks": "", "gridcolor": "white", "linecolor": "white" }, "bgcolor": "#E5ECF6" }, "colorway": [ "#636efa", "#EF553B", "#00cc96", "#ab63fa", "#FFA15A", "#19d3f3", "#FF6692", "#B6E880", "#FF97FF", "#FECB52" ], "coloraxis": { "colorbar": { "ticks": "", "outlinewidth": 0 } }, "hovermode": "closest", "colorscale": { "diverging": [ [ 0, "#8e0152" ], [ 0.1, "#c51b7d" ], [ 0.2, "#de77ae" ], [ 0.3, "#f1b6da" ], [ 0.4, "#fde0ef" ], [ 0.5, "#f7f7f7" ], [ 0.6, "#e6f5d0" ], [ 0.7, "#b8e186" ], [ 0.8, "#7fbc41" ], [ 0.9, "#4d9221" ], [ 1, "#276419" ] ], "sequential": [ [ 0.0, "#0d0887" ], [ 0.1111111111111111, "#46039f" ], [ 0.2222222222222222, "#7201a8" ], [ 0.3333333333333333, "#9c179e" ], [ 0.4444444444444444, "#bd3786" ], [ 0.5555555555555556, "#d8576b" ], [ 0.6666666666666666, "#ed7953" ], [ 0.7777777777777778, "#fb9f3a" ], [ 0.8888888888888888, "#fdca26" ], [ 1.0, "#f0f921" ] ], "sequentialminus": [ [ 0.0, "#0d0887" ], [ 0.1111111111111111, "#46039f" ], [ 0.2222222222222222, "#7201a8" ], [ 0.3333333333333333, "#9c179e" ], [ 0.4444444444444444, "#bd3786" ], [ 0.5555555555555556, "#d8576b" ], [ 0.6666666666666666, "#ed7953" ], [ 0.7777777777777778, "#fb9f3a" ], [ 0.8888888888888888, "#fdca26" ], [ 1.0, "#f0f921" ] ] }, "hoverlabel": { "align": "left" }, "plot_bgcolor": "#E5ECF6", "paper_bgcolor": "white", "shapedefaults": { "line": { "color": "#2a3f5f" } }, "autotypenumbers": "strict", "annotationdefaults": { "arrowhead": 0, "arrowcolor": "#2a3f5f", "arrowwidth": 1 } } } } }, "height": null, "width": null, "user": { "profile_url": "https://chart-studio.plotly.com/~mlwhite2", "avatar_url": "https://storage.googleapis.com/plotly-prod-profiles/42.jpg", "background_url": "https://storage.googleapis.com/plotly-prod-profiles/bg-10.jpg", "bio": "", "nickname": "", "website": "", "stream_tokens": null, "feature_set_id": null, "csrf_token": null, "date_joined": "2025-08-02 19:09:05", "mapbox_access_tokens": null, "has_password": null, "username": "mlwhite2", "email": null, "is_active": null, "readonly": null, "is_dash_creator": null, "dash_created_count": null, "is_chart_creator": null, "charts_created_count": null } }, { "creation_time": "2025-08-02T19:33:59.151150Z", "comments": { "results": [], "count": 0 }, "parented": true, "embed_url": "https://chart-studio.plotly.com/~mlwhite2/1.embed", "fid": "mlwhite2:1", "filename": "averaged g(r) for Periodic Cube Bacterium, 6000 5nm molecules, s = 250nm, η = 0.2011.html", "filetype": "plot", "img_url": "https://storage.googleapis.com/plotly-prod-images/mlwhite2/1/9_QMEDH9H1DOCQJZ34EEK8G0KIX52M9S.png", "image_urls": { "default": "https://storage.googleapis.com/plotly-prod-images/mlwhite2/1/2_MZQJZ4SGH4WOOZA2DCG1BHW6T7GDJC.png", "block-thumb": "https://storage.googleapis.com/plotly-prod-images/mlwhite2/1/8_ML8608Y1ELCY9H319TN82KEBAZWH43.png", "list-thumb": "https://storage.googleapis.com/plotly-prod-images/mlwhite2/1/9_QMEDH9H1DOCQJZ34EEK8G0KIX52M9S.png" }, "api_urls": { "files": "https://api.plotly.com/v2/files/mlwhite2:1", "plots": "https://api.plotly.com/v2/plots/mlwhite2:1", "parent": "https://api.plotly.com/v2/folders/home?user=mlwhite2" }, "owner": "mlwhite2", "parent": -1, "preview": "", "referencers": [], "references": [], "title": "", "views": 5, "web_url": "https://chart-studio.plotly.com/~mlwhite2/1/", "world_readable": true, "date_modified": "2025-08-02T19:33:59.161Z", "stars": { "results": [], "count": 0 }, "collaborators": { "results": [], "count": 0 }, "subfolder_count": null, "refresh_interval": null, "organize_view_url": "https://chart-studio.plotly.com/~mlwhite2/1/", "current_user_permission": "read", "is_theme": null, "is_template": null, "autosize": true, "caption": "", "figure": { "data": [ { "mode": "markers", "name": "PY g(r)", "type": "scattergl", "xsrc": "mlwhite2:0:afc4d6", "ysrc": "mlwhite2:0:87aa9c", "xaxis": "x", "yaxis": "y", "marker": { "size": 6, "color": "#636efa", "symbol": "circle" }, "showlegend": true, "legendgroup": "PY g(r)", "hovertemplate": "color=PY g(r)<br>x=%{x}<br>y=%{y}<extra></extra>" }, { "mode": "markers", "name": "Averaged Simulation g(r) ; η = 0.2011, dr = 1.0 nm", "type": "scattergl", "xsrc": "mlwhite2:0:99bc86", "ysrc": "mlwhite2:0:14c12d", "xaxis": "x", "yaxis": "y", "marker": { "size": 6, "color": "#EF553B", "symbol": "circle" }, "showlegend": true, "legendgroup": "Averaged Simulation g(r) ; η = 0.2011, dr = 1.0 nm", "hovertemplate": "color=Averaged Simulation g(r) ; η = 0.2011, dr = 1.0 nm<br>x=%{x}<br>y=%{y}<extra></extra>" } ], "layout": { "xaxis": { "title": { "text": "r (nm)" }, "anchor": "y", "domain": [ 0.0, 1.0 ] }, "yaxis": { "title": { "text": "g(r)" }, "anchor": "x", "domain": [ 0.0, 1.0 ] }, "legend": { "title": { "text": "Legend:" }, "tracegroupgap": 0 }, "margin": { "t": 60 }, "template": { "data": { "bar": [ { "type": "bar", "marker": { "line": { "color": "#E5ECF6", "width": 0.5 }, "pattern": { "size": 10, "fillmode": "overlay", "solidity": 0.2 } }, "error_x": { "color": "#2a3f5f" }, "error_y": { "color": "#2a3f5f" } } ], "pie": [ { "type": "pie", "automargin": true } ], "table": [ { "type": "table", "cells": { "fill": { "color": "#EBF0F8" }, "line": { "color": "white" } }, "header": { "fill": { "color": "#C8D4E3" }, "line": { "color": "white" } } } ], "carpet": [ { "type": "carpet", "aaxis": { "gridcolor": "white", "linecolor": "white", "endlinecolor": "#2a3f5f", "minorgridcolor": "white", "startlinecolor": "#2a3f5f" }, "baxis": { "gridcolor": "white", "linecolor": "white", "endlinecolor": "#2a3f5f", "minorgridcolor": "white", "startlinecolor": "#2a3f5f" } } ], "mesh3d": [ { "type": "mesh3d", "colorbar": { "ticks": "", "outlinewidth": 0 } } ], "contour": [ { "type": "contour", "colorbar": { "ticks": "", "outlinewidth": 0 }, "colorscale": [ [ 0.0, "#0d0887" ], [ 0.1111111111111111, "#46039f" ], [ 0.2222222222222222, "#7201a8" ], [ 0.3333333333333333, "#9c179e" ], [ 0.4444444444444444, "#bd3786" ], [ 0.5555555555555556, "#d8576b" ], [ 0.6666666666666666, "#ed7953" ], [ 0.7777777777777778, "#fb9f3a" ], [ 0.8888888888888888, "#fdca26" ], [ 1.0, "#f0f921" ] ] } ], "heatmap": [ { "type": "heatmap", "colorbar": { "ticks": "", "outlinewidth": 0 }, "colorscale": [ [ 0.0, "#0d0887" ], [ 0.1111111111111111, "#46039f" ], [ 0.2222222222222222, "#7201a8" ], [ 0.3333333333333333, "#9c179e" ], [ 0.4444444444444444, "#bd3786" ], [ 0.5555555555555556, "#d8576b" ], [ 0.6666666666666666, "#ed7953" ], [ 0.7777777777777778, "#fb9f3a" ], [ 0.8888888888888888, "#fdca26" ], [ 1.0, "#f0f921" ] ] } ], "scatter": [ { "type": "scatter", "fillpattern": { "size": 10, "fillmode": "overlay", "solidity": 0.2 } } ], "surface": [ { "type": "surface", "colorbar": { "ticks": "", "outlinewidth": 0 }, "colorscale": [ [ 0.0, "#0d0887" ], [ 0.1111111111111111, "#46039f" ], [ 0.2222222222222222, "#7201a8" ], [ 0.3333333333333333, "#9c179e" ], [ 0.4444444444444444, "#bd3786" ], [ 0.5555555555555556, "#d8576b" ], [ 0.6666666666666666, "#ed7953" ], [ 0.7777777777777778, "#fb9f3a" ], [ 0.8888888888888888, "#fdca26" ], [ 1.0, "#f0f921" ] ] } ], "barpolar": [ { "type": "barpolar", "marker": { "line": { "color": "#E5ECF6", "width": 0.5 }, "pattern": { "size": 10, "fillmode": "overlay", "solidity": 0.2 } } } ], "heatmapgl": [ { "type": "heatmapgl", "colorbar": { "ticks": "", "outlinewidth": 0 }, "colorscale": [ [ 0.0, "#0d0887" ], [ 0.1111111111111111, "#46039f" ], [ 0.2222222222222222, "#7201a8" ], [ 0.3333333333333333, "#9c179e" ], [ 0.4444444444444444, "#bd3786" ], [ 0.5555555555555556, "#d8576b" ], [ 0.6666666666666666, "#ed7953" ], [ 0.7777777777777778, "#fb9f3a" ], [ 0.8888888888888888, "#fdca26" ], [ 1.0, "#f0f921" ] ] } ], "histogram": [ { "type": "histogram", "marker": { "pattern": { "size": 10, "fillmode": "overlay", "solidity": 0.2 } } } ], "parcoords": [ { "line": { "colorbar": { "ticks": "", "outlinewidth": 0 } }, "type": "parcoords" } ], "scatter3d": [ { "line": { "colorbar": { "ticks": "", "outlinewidth": 0 } }, "type": "scatter3d", "marker": { "colorbar": { "ticks": "", "outlinewidth": 0 } } } ], "scattergl": [ { "type": "scattergl", "marker": { "colorbar": { "ticks": "", "outlinewidth": 0 } } } ], "choropleth": [ { "type": "choropleth", "colorbar": { "ticks": "", "outlinewidth": 0 } } ], "scattergeo": [ { "type": "scattergeo", "marker": { "colorbar": { "ticks": "", "outlinewidth": 0 } } } ], "histogram2d": [ { "type": "histogram2d", "colorbar": { "ticks": "", "outlinewidth": 0 }, "colorscale": [ [ 0.0, "#0d0887" ], [ 0.1111111111111111, "#46039f" ], [ 0.2222222222222222, "#7201a8" ], [ 0.3333333333333333, "#9c179e" ], [ 0.4444444444444444, "#bd3786" ], [ 0.5555555555555556, "#d8576b" ], [ 0.6666666666666666, "#ed7953" ], [ 0.7777777777777778, "#fb9f3a" ], [ 0.8888888888888888, "#fdca26" ], [ 1.0, "#f0f921" ] ] } ], "scatterpolar": [ { "type": "scatterpolar", "marker": { "colorbar": { "ticks": "", "outlinewidth": 0 } } } ], "contourcarpet": [ { "type": "contourcarpet", "colorbar": { "ticks": "", "outlinewidth": 0 } } ], "scattercarpet": [ { "type": "scattercarpet", "marker": { "colorbar": { "ticks": "", "outlinewidth": 0 } } } ], "scattermapbox": [ { "type": "scattermapbox", "marker": { "colorbar": { "ticks": "", "outlinewidth": 0 } } } ], "scatterpolargl": [ { "type": "scatterpolargl", "marker": { "colorbar": { "ticks": "", "outlinewidth": 0 } } } ], "scatterternary": [ { "type": "scatterternary", "marker": { "colorbar": { "ticks": "", "outlinewidth": 0 } } } ], "histogram2dcontour": [ { "type": "histogram2dcontour", "colorbar": { "ticks": "", "outlinewidth": 0 }, "colorscale": [ [ 0.0, "#0d0887" ], [ 0.1111111111111111, "#46039f" ], [ 0.2222222222222222, "#7201a8" ], [ 0.3333333333333333, "#9c179e" ], [ 0.4444444444444444, "#bd3786" ], [ 0.5555555555555556, "#d8576b" ], [ 0.6666666666666666, "#ed7953" ], [ 0.7777777777777778, "#fb9f3a" ], [ 0.8888888888888888, "#fdca26" ], [ 1.0, "#f0f921" ] ] } ] }, "layout": { "geo": { "bgcolor": "white", "showland": true, "lakecolor": "white", "landcolor": "#E5ECF6", "showlakes": true, "subunitcolor": "white" }, "font": { "color": "#2a3f5f" }, "polar": { "bgcolor": "#E5ECF6", "radialaxis": { "ticks": "", "gridcolor": "white", "linecolor": "white" }, "angularaxis": { "ticks": "", "gridcolor": "white", "linecolor": "white" } }, "scene": { "xaxis": { "ticks": "", "gridcolor": "white", "gridwidth": 2, "linecolor": "white", "zerolinecolor": "white", "showbackground": true, "backgroundcolor": "#E5ECF6" }, "yaxis": { "ticks": "", "gridcolor": "white", "gridwidth": 2, "linecolor": "white", "zerolinecolor": "white", "showbackground": true, "backgroundcolor": "#E5ECF6" }, "zaxis": { "ticks": "", "gridcolor": "white", "gridwidth": 2, "linecolor": "white", "zerolinecolor": "white", "showbackground": true, "backgroundcolor": "#E5ECF6" } }, "title": { "x": 0.05 }, "xaxis": { "ticks": "", "title": { "standoff": 15 }, "gridcolor": "white", "linecolor": "white", "automargin": true, "zerolinecolor": "white", "zerolinewidth": 2 }, "yaxis": { "ticks": "", "title": { "standoff": 15 }, "gridcolor": "white", "linecolor": "white", "automargin": true, "zerolinecolor": "white", "zerolinewidth": 2 }, "mapbox": { "style": "light" }, "ternary": { "aaxis": { "ticks": "", "gridcolor": "white", "linecolor": "white" }, "baxis": { "ticks": "", "gridcolor": "white", "linecolor": "white" }, "caxis": { "ticks": "", "gridcolor": "white", "linecolor": "white" }, "bgcolor": "#E5ECF6" }, "colorway": [ "#636efa", "#EF553B", "#00cc96", "#ab63fa", "#FFA15A", "#19d3f3", "#FF6692", "#B6E880", "#FF97FF", "#FECB52" ], "coloraxis": { "colorbar": { "ticks": "", "outlinewidth": 0 } }, "hovermode": "closest", "colorscale": { "diverging": [ [ 0, "#8e0152" ], [ 0.1, "#c51b7d" ], [ 0.2, "#de77ae" ], [ 0.3, "#f1b6da" ], [ 0.4, "#fde0ef" ], [ 0.5, "#f7f7f7" ], [ 0.6, "#e6f5d0" ], [ 0.7, "#b8e186" ], [ 0.8, "#7fbc41" ], [ 0.9, "#4d9221" ], [ 1, "#276419" ] ], "sequential": [ [ 0.0, "#0d0887" ], [ 0.1111111111111111, "#46039f" ], [ 0.2222222222222222, "#7201a8" ], [ 0.3333333333333333, "#9c179e" ], [ 0.4444444444444444, "#bd3786" ], [ 0.5555555555555556, "#d8576b" ], [ 0.6666666666666666, "#ed7953" ], [ 0.7777777777777778, "#fb9f3a" ], [ 0.8888888888888888, "#fdca26" ], [ 1.0, "#f0f921" ] ], "sequentialminus": [ [ 0.0, "#0d0887" ], [ 0.1111111111111111, "#46039f" ], [ 0.2222222222222222, "#7201a8" ], [ 0.3333333333333333, "#9c179e" ], [ 0.4444444444444444, "#bd3786" ], [ 0.5555555555555556, "#d8576b" ], [ 0.6666666666666666, "#ed7953" ], [ 0.7777777777777778, "#fb9f3a" ], [ 0.8888888888888888, "#fdca26" ], [ 1.0, "#f0f921" ] ] }, "hoverlabel": { "align": "left" }, "plot_bgcolor": "#E5ECF6", "paper_bgcolor": "white", "shapedefaults": { "line": { "color": "#2a3f5f" } }, "autotypenumbers": "strict", "annotationdefaults": { "arrowhead": 0, "arrowcolor": "#2a3f5f", "arrowwidth": 1 } } } } }, "height": null, "width": null, "user": { "profile_url": "https://chart-studio.plotly.com/~mlwhite2", "avatar_url": "https://storage.googleapis.com/plotly-prod-profiles/42.jpg", "background_url": "https://storage.googleapis.com/plotly-prod-profiles/bg-10.jpg", "bio": "", "nickname": "", "website": "", "stream_tokens": null, "feature_set_id": null, "csrf_token": null, "date_joined": "2025-08-02 19:09:05", "mapbox_access_tokens": null, "has_password": null, "username": "mlwhite2", "email": null, "is_active": null, "readonly": null, "is_dash_creator": null, "dash_created_count": null, "is_chart_creator": null, "charts_created_count": null } }, { "creation_time": "2025-08-02T18:47:41.150455Z", "comments": { "results": [], "count": 0 }, "parented": true, "embed_url": "https://chart-studio.plotly.com/~ATrav/34.embed", "fid": "ATrav:34", "filename": "lenght", "filetype": "plot", "img_url": "https://storage.googleapis.com/plotly-prod-images/ATrav/34/9_J4E1ZVZB5TBK3ZP84ZJ5CK3KET9G2W.png", "image_urls": { "default": "https://storage.googleapis.com/plotly-prod-images/ATrav/34/2_2IL9A1APMJJMDWN72TSRHOFWQABZOO.png", "block-thumb": "https://storage.googleapis.com/plotly-prod-images/ATrav/34/8_GUYG0EGXWHUCJ3KT8RTLRYQA945L9S.png", "list-thumb": "https://storage.googleapis.com/plotly-prod-images/ATrav/34/9_J4E1ZVZB5TBK3ZP84ZJ5CK3KET9G2W.png" }, "api_urls": { "files": "https://api.plotly.com/v2/files/ATrav:34", "plots": "https://api.plotly.com/v2/plots/ATrav:34", "parent": "https://api.plotly.com/v2/folders/home?user=ATrav" }, "owner": "ATrav", "parent": -1, "preview": "", "referencers": [], "references": [], "title": "", "views": 0, "web_url": "https://chart-studio.plotly.com/~ATrav/34/", "world_readable": true, "date_modified": "2025-08-02T18:47:41.160Z", "stars": { "results": [], "count": 0 }, "collaborators": { "results": [], "count": 0 }, "subfolder_count": null, "refresh_interval": null, "organize_view_url": "https://chart-studio.plotly.com/~ATrav/34/", "current_user_permission": "read", "is_theme": null, "is_template": false, "autosize": true, "caption": "", "figure": { "data": [ { "meta": { "columnNames": { "x": "TR name", "y": "H", "marker": { "size": "All array length" } } }, "mode": "markers", "name": "<i>R.muscosa</i>", "type": "scatter", "xsrc": "ATrav:21:45e301", "ysrc": "ATrav:21:53ca0e", "jitter": 0.55, "marker": { "meta": { "columnNames": { "size": "All array length" } }, "opacity": 1, "sizeref": 258524.65679012347, "sizesrc": "ATrav:21:3c8a84", "sizemode": "area" }, "error_x": { "type": "percent", "color": "#636efa", "value": 10, "width": 4, "visible": false, "symmetric": true, "thickness": 2 }, "hoveron": "points", "opacity": 0.67, "bandwidth": 0, "selectedpoints": [ 0, 1, 2, 3, 4, 5, 6, 7, 8, 10, 12, 13, 14, 15, 16, 17, 18, 20, 21, 22, 24, 27, 29, 30, 31, 33, 34, 35, 37, 39, 40, 41, 42, 43, 44, 46, 48, 49, 52, 55, 56, 58, 60, 61, 62, 63, 65, 66, 68, 71, 72, 74, 75, 76, 78, 79, 80, 81, 82, 83, 84, 85, 86, 89, 91, 92, 97, 98, 99, 100, 102, 105, 106, 107, 108, 109, 110, 111, 116, 117, 119, 120, 123, 124, 127, 131, 132, 134, 136, 138, 139, 141, 143, 144, 145, 147, 149, 150, 151, 154, 155, 156, 157, 158, 159, 160, 163, 175, 176, 177, 178, 179, 181, 182, 187, 191, 193, 198, 200, 202, 203, 204, 205, 208, 209, 210, 213, 215, 222, 223, 226, 228, 229, 236, 240, 243, 250, 254, 256, 259, 261, 262, 269, 270, 273, 276, 277, 278, 283, 285, 287, 288, 289, 302, 303, 310, 311, 313, 316, 317, 318, 319, 327, 330, 331, 332, 342, 345, 346, 348, 351, 353, 360, 361, 362, 363, 377, 380, 390, 399, 402, 405, 407, 411, 413, 416, 418, 427, 430, 437, 438, 442, 446, 449, 452, 457, 464, 465, 470, 487, 490, 503, 514, 523, 525, 527, 528, 529, 534, 540, 547, 552, 554, 555, 557, 580, 583, 586, 593, 604, 609, 615, 618, 640, 652, 653, 656, 657, 666, 672, 677, 684, 685, 687, 690, 699 ] }, { "meta": { "columnNames": { "x": "TR name", "y": "H", "marker": { "size": "All array length" } } }, "mode": "markers", "name": "<i>P.lessonae</i>", "type": "scatter", "xsrc": "ATrav:26:b1a330", "ysrc": "ATrav:26:17c621", "jitter": 0.59, "marker": { "meta": { "columnNames": { "size": "All array length" } }, "opacity": 1, "sizeref": 5893.7037037037035, "sizesrc": "ATrav:26:ec39c7", "sizemode": "area" }, "opacity": 0.67, "bandwidth": 0, "selectedpoints": [] }, { "meta": { "columnNames": { "x": "TR name", "y": "H", "marker": { "size": "All array length" } } }, "mode": "markers", "name": "<i>L.septentrionalis</i>", "type": "scatter", "xsrc": "ATrav:25:657427", "ysrc": "ATrav:25:ac2c61", "jitter": 0.55, "marker": { "meta": { "columnNames": { "size": "All array length" } }, "opacity": 1, "sizeref": 5893.7037037037035, "sizesrc": "ATrav:25:632494", "sizemode": "area" }, "opacity": 0.67, "bandwidth": 0, "selectedpoints": [] }, { "meta": { "columnNames": { "x": "TR name", "y": "H", "marker": { "size": "All array length" } } }, "mode": "markers", "name": "<i>L.pipiens</i>", "type": "scatter", "xsrc": "ATrav:24:4d7c21", "ysrc": "ATrav:24:d3c4ee", "jitter": 0.59, "marker": { "meta": { "columnNames": { "size": "All array length" } }, "opacity": 1, "sizeref": 5893.7037037037035, "sizesrc": "ATrav:24:430686", "sizemode": "area" }, "opacity": 0.67, "bandwidth": 0, "selectedpoints": [] }, { "meta": { "columnNames": { "x": "TR name", "y": "I", "text": "", "marker": { "size": "All array length", "color": "Number of arrays" } } }, "mode": "markers", "name": "<i>A.catesbeiana</i>", "type": "scatter", "xsrc": "ATrav:27:bfe106", "ysrc": "ATrav:27:034350", "jitter": 0.59, "marker": { "meta": { "columnNames": { "size": "All array length", "color": "Number of arrays" } }, "color": "#1f77b4", "opacity": 1, "sizeref": 5893.7037037037035, "sizesrc": "ATrav:22:e0790f", "sizemode": "area" }, "opacity": 0.67, "pointpos": 0, "bandwidth": 0, "selectedpoints": [] }, { "meta": { "columnNames": { "x": "TR name", "y": "H", "marker": { "size": "All array length" } } }, "mode": "markers", "name": "<i>L.sylvaticus</i>", "type": "scatter", "xsrc": "ATrav:23:27b616", "ysrc": "ATrav:23:d678fd", "jitter": 0.59, "marker": { "meta": { "columnNames": { "size": "All array length" } }, "opacity": 1, "sizeref": 5893.7037037037035, "sizesrc": "ATrav:23:5093a6", "sizemode": "area" }, "opacity": 0.67, "bandwidth": 0, "selectedpoints": [] }, { "meta": { "columnNames": { "x": "TR name", "y": "I", "marker": { "size": "All array length" } } }, "mode": "markers", "name": "<i>R.temporaria</i>", "side": "both", "type": "scatter", "xsrc": "ATrav:20:9ad86a", "ysrc": "ATrav:20:9c3671", "jitter": 0.59, "marker": { "meta": { "columnNames": { "size": "All array length" } }, "opacity": 1, "sizeref": 5893.7037037037035, "sizesrc": "ATrav:20:9245cb", "sizemode": "area" }, "opacity": 0.67, "pointpos": 0, "spanmode": "soft", "bandwidth": 0, "showlegend": true, "selectedpoints": [] }, { "meta": { "columnNames": { "x": "TR name", "y": "I", "marker": { "size": "All array length" } } }, "mode": "markers", "name": "<i>R.kukunoris</i>", "type": "scatter", "xsrc": "ATrav:22:6921b3", "ysrc": "ATrav:22:89a893", "jitter": 0.59, "marker": { "meta": { "columnNames": { "size": "All array length" } }, "opacity": 1, "sizeref": 5893.7037037037035, "sizesrc": "ATrav:22:e0790f", "sizemode": "area" }, "opacity": 0.67, "pointpos": 0, "bandwidth": 0, "selectedpoints": [] }, { "meta": { "columnNames": { "x": "TR name", "y": "H", "marker": { "size": "All array length" } } }, "mode": "markers", "name": "<i>S.parvus</i>", "type": "scatter", "xsrc": "ATrav:28:890c54", "ysrc": "ATrav:28:5b68c3", "jitter": 0.59, "marker": { "meta": { "columnNames": { "size": "All array length" } }, "opacity": 1, "sizeref": 5893.7037037037035, "sizesrc": "ATrav:28:aee06e", "sizemode": "area" }, "opacity": 0.67, "bandwidth": 0, "orientation": "v", "selectedpoints": [] } ], "frames": [], "layout": { "xaxis": { "side": "bottom", "type": "category", "range": [ 1954.344416987357, 7779.049752583216 ], "anchor": "free", "autorange": false }, "yaxis": { "side": "left", "type": "linear", "range": [ 0.05325591131030072, 0.7634725083179786 ], "autorange": false }, "autosize": true, "dragmode": "select", "template": { "data": { "bar": [ { "type": "bar", "marker": { "colorbar": { "ticks": "", "outlinewidth": 0 } } } ], "table": [ { "type": "table", "cells": { "fill": { "color": "#EBF0F8" }, "line": { "color": "white" } }, "header": { "fill": { "color": "#C8D4E3" }, "line": { "color": "white" } } } ], "carpet": [ { "type": "carpet", "aaxis": { "gridcolor": "#C8D4E3", "linecolor": "#C8D4E3", "endlinecolor": "#2a3f5f", "minorgridcolor": "#C8D4E3", "startlinecolor": "#2a3f5f" }, "baxis": { "gridcolor": "#C8D4E3", "linecolor": "#C8D4E3", "endlinecolor": "#2a3f5f", "minorgridcolor": "#C8D4E3", "startlinecolor": "#2a3f5f" } } ], "mesh3d": [ { "type": "mesh3d", "colorbar": { "ticks": "", "outlinewidth": 0 } } ], "contour": [ { "type": "contour", "colorbar": { "ticks": "", "outlinewidth": 0 }, "autocolorscale": true } ], "heatmap": [ { "type": "heatmap", "colorbar": { "ticks": "", "outlinewidth": 0 }, "autocolorscale": true } ], "scatter": [ { "type": "scatter", "marker": { "colorbar": { "ticks": "", "outlinewidth": 0 } } } ], "surface": [ { "type": "surface", "colorbar": { "ticks": "", "outlinewidth": 0 } } ], "heatmapgl": [ { "type": "heatmapgl", "colorbar": { "ticks": "", "outlinewidth": 0 } } ], "histogram": [ { "type": "histogram", "marker": { "colorbar": { "ticks": "", "outlinewidth": 0 } } } ], "parcoords": [ { "line": { "colorbar": { "ticks": "", "outlinewidth": 0 } }, "type": "parcoords" } ], "scatter3d": [ { "type": "scatter3d", "marker": { "colorbar": { "ticks": "", "outlinewidth": 0 } } } ], "scattergl": [ { "type": "scattergl", "marker": { "colorbar": { "ticks": "", "outlinewidth": 0 } } } ], "choropleth": [ { "type": "choropleth", "colorbar": { "ticks": "", "outlinewidth": 0 } } ], "scattergeo": [ { "type": "scattergeo", "marker": { "colorbar": { "ticks": "", "outlinewidth": 0 } } } ], "histogram2d": [ { "type": "histogram2d", "colorbar": { "ticks": "", "outlinewidth": 0 }, "autocolorscale": true } ], "scatterpolar": [ { "type": "scatterpolar", "marker": { "colorbar": { "ticks": "", "outlinewidth": 0 } } } ], "contourcarpet": [ { "type": "contourcarpet", "colorbar": { "ticks": "", "outlinewidth": 0 } } ], "scattercarpet": [ { "type": "scattercarpet", "marker": { "colorbar": { "ticks": "", "outlinewidth": 0 } } } ], "scattermapbox": [ { "type": "scattermapbox", "marker": { "colorbar": { "ticks": "", "outlinewidth": 0 } } } ], "scatterpolargl": [ { "type": "scatterpolargl", "marker": { "colorbar": { "ticks": "", "outlinewidth": 0 } } } ], "scatterternary": [ { "type": "scatterternary", "marker": { "colorbar": { "ticks": "", "outlinewidth": 0 } } } ], "histogram2dcontour": [ { "type": "histogram2dcontour", "colorbar": { "ticks": "", "outlinewidth": 0 }, "autocolorscale": true } ] }, "layout": { "geo": { "bgcolor": "white", "showland": true, "lakecolor": "white", "landcolor": "white", "showlakes": true, "subunitcolor": "#C8D4E3" }, "font": { "color": "#2a3f5f" }, "polar": { "bgcolor": "white", "radialaxis": { "ticks": "", "gridcolor": "#EBF0F8", "linecolor": "#EBF0F8" }, "angularaxis": { "ticks": "", "gridcolor": "#EBF0F8", "linecolor": "#EBF0F8" } }, "scene": { "xaxis": { "ticks": "", "gridcolor": "#DFE8F3", "gridwidth": 2, "linecolor": "#EBF0F8", "zerolinecolor": "#EBF0F8", "showbackground": true, "backgroundcolor": "white" }, "yaxis": { "ticks": "", "gridcolor": "#DFE8F3", "gridwidth": 2, "linecolor": "#EBF0F8", "zerolinecolor": "#EBF0F8", "showbackground": true, "backgroundcolor": "white" }, "zaxis": { "ticks": "", "gridcolor": "#DFE8F3", "gridwidth": 2, "linecolor": "#EBF0F8", "zerolinecolor": "#EBF0F8", "showbackground": true, "backgroundcolor": "white" } }, "title": { "x": 0.05 }, "xaxis": { "ticks": "", "gridcolor": "#EBF0F8", "linecolor": "#EBF0F8", "automargin": true, "zerolinecolor": "#EBF0F8", "zerolinewidth": 2 }, "yaxis": { "ticks": "", "gridcolor": "#EBF0F8", "linecolor": "#EBF0F8", "automargin": true, "zerolinecolor": "#EBF0F8", "zerolinewidth": 2 }, "ternary": { "aaxis": { "ticks": "", "gridcolor": "#DFE8F3", "linecolor": "#A2B1C6" }, "baxis": { "ticks": "", "gridcolor": "#DFE8F3", "linecolor": "#A2B1C6" }, "caxis": { "ticks": "", "gridcolor": "#DFE8F3", "linecolor": "#A2B1C6" }, "bgcolor": "white" }, "colorway": [ "#636efa", "#EF553B", "#00cc96", "#ab63fa", "#19d3f3", "#e763fa", "#fecb52", "#ffa15a", "#ff6692", "#b6e880" ], "hovermode": "closest", "colorscale": { "diverging": [ [ 0, "#8e0152" ], [ 0.1, "#c51b7d" ], [ 0.2, "#de77ae" ], [ 0.3, "#f1b6da" ], [ 0.4, "#fde0ef" ], [ 0.5, "#f7f7f7" ], [ 0.6, "#e6f5d0" ], [ 0.7, "#b8e186" ], [ 0.8, "#7fbc41" ], [ 0.9, "#4d9221" ], [ 1, "#276419" ] ], "sequential": [ [ 0, "#0508b8" ], [ 0.0893854748603352, "#1910d8" ], [ 0.1787709497206704, "#3c19f0" ], [ 0.2681564245810056, "#6b1cfb" ], [ 0.3575418994413408, "#981cfd" ], [ 0.44692737430167595, "#bf1cfd" ], [ 0.5363128491620112, "#dd2bfd" ], [ 0.6256983240223464, "#f246fe" ], [ 0.7150837988826816, "#fc67fd" ], [ 0.8044692737430168, "#fe88fc" ], [ 0.8938547486033519, "#fea5fd" ], [ 0.9832402234636871, "#febefe" ], [ 1, "#fec3fe" ] ], "sequentialminus": [ [ 0, "#0508b8" ], [ 0.0893854748603352, "#1910d8" ], [ 0.1787709497206704, "#3c19f0" ], [ 0.2681564245810056, "#6b1cfb" ], [ 0.3575418994413408, "#981cfd" ], [ 0.44692737430167595, "#bf1cfd" ], [ 0.5363128491620112, "#dd2bfd" ], [ 0.6256983240223464, "#f246fe" ], [ 0.7150837988826816, "#fc67fd" ], [ 0.8044692737430168, "#fe88fc" ], [ 0.8938547486033519, "#fea5fd" ], [ 0.9832402234636871, "#febefe" ], [ 1, "#fec3fe" ] ] }, "plot_bgcolor": "white", "paper_bgcolor": "white", "shapedefaults": { "line": { "width": 0 }, "opacity": 0.4, "fillcolor": "#506784" }, "annotationdefaults": { "arrowhead": 0, "arrowcolor": "#506784", "arrowwidth": 1 } }, "themeRef": "PLOTLY_WHITE" }, "violingap": 0.56 } }, "height": null, "width": null, "user": { "profile_url": "https://chart-studio.plotly.com/~ATrav", "avatar_url": "https://storage.googleapis.com/plotly-prod-profiles/89.jpg", "background_url": "https://storage.googleapis.com/plotly-prod-profiles/bg-7.jpg", "bio": "", "nickname": "", "website": "", "stream_tokens": null, "feature_set_id": null, "csrf_token": null, "date_joined": "2025-07-26 09:57:47", "mapbox_access_tokens": null, "has_password": null, "username": "ATrav", "email": null, "is_active": null, "readonly": null, "is_dash_creator": null, "dash_created_count": null, "is_chart_creator": null, "charts_created_count": null } }, { "creation_time": "2025-08-02T18:41:17.247060Z", "comments": { "results": [], "count": 0 }, "parented": true, "embed_url": "https://chart-studio.plotly.com/~ATrav/33.embed", "fid": "ATrav:33", "filename": "Plot 33", "filetype": "plot", "img_url": "https://storage.googleapis.com/plotly-prod-images/ATrav/33/9_355OHKYXDG9ED86TMV6YGWXTYZNL6Z.png", "image_urls": { "default": "https://storage.googleapis.com/plotly-prod-images/ATrav/33/2_G6W8U6I5V4RAKPWD5NX41RXIOW1HHK.png", "block-thumb": "https://storage.googleapis.com/plotly-prod-images/ATrav/33/8_H41RU7LBQK5BD3LZAIL67IWW9RIUVQ.png", "list-thumb": "https://storage.googleapis.com/plotly-prod-images/ATrav/33/9_355OHKYXDG9ED86TMV6YGWXTYZNL6Z.png" }, "api_urls": { "files": "https://api.plotly.com/v2/files/ATrav:33", "plots": "https://api.plotly.com/v2/plots/ATrav:33", "parent": "https://api.plotly.com/v2/folders/home?user=ATrav" }, "owner": "ATrav", "parent": -1, "preview": "", "referencers": [], "references": [], "title": "", "views": 1, "web_url": "https://chart-studio.plotly.com/~ATrav/33/", "world_readable": true, "date_modified": "2025-08-02T18:41:17.259Z", "stars": { "results": [], "count": 0 }, "collaborators": { "results": [], "count": 0 }, "subfolder_count": null, "refresh_interval": null, "organize_view_url": "https://chart-studio.plotly.com/~ATrav/33/", "current_user_permission": "read", "is_theme": null, "is_template": false, "autosize": true, "caption": "", "figure": { "data": [ { "meta": { "columnNames": { "x": "TR name", "y": "H", "marker": { "size": "Number of arrays" } } }, "mode": "markers", "name": "<i>R.muscosa</i>", "type": "scatter", "xsrc": "ATrav:21:45e301", "ysrc": "ATrav:21:53ca0e", "jitter": 0.55, "marker": { "meta": { "columnNames": { "size": "Number of arrays" } }, "opacity": 1, "sizeref": 1, "sizesrc": "ATrav:21:a964bc", "sizemode": "area" }, "error_x": { "type": "percent", "color": "#636efa", "value": 10, "width": 4, "visible": false, "symmetric": true, "thickness": 2 }, "hoveron": "points", "opacity": 0.67, "bandwidth": 0, "selectedpoints": [ 0, 1, 2, 3, 4, 5, 6, 7, 8, 10, 12, 13, 14, 15, 16, 17, 18, 20, 21, 22, 24, 27, 29, 30, 31, 33, 34, 35, 37, 39, 40, 41, 42, 43, 44, 46, 48, 49, 52, 55, 56, 58, 60, 61, 62, 63, 65, 66, 68, 71, 72, 74, 75, 76, 78, 79, 80, 81, 82, 83, 84, 85, 86, 89, 91, 92, 97, 98, 99, 100, 102, 105, 106, 107, 108, 109, 110, 111, 116, 117, 119, 120, 123, 124, 127, 131, 132, 134, 136, 138, 139, 141, 143, 144, 145, 147, 149, 150, 151, 154, 155, 156, 157, 158, 159, 160, 163, 175, 176, 177, 178, 179, 181, 182, 187, 191, 193, 198, 200, 202, 203, 204, 205, 208, 209, 210, 213, 215, 222, 223, 226, 228, 229, 236, 240, 243, 250, 254, 256, 259, 261, 262, 269, 270, 273, 276, 277, 278, 283, 285, 287, 288, 289, 302, 303, 310, 311, 313, 316, 317, 318, 319, 327, 330, 331, 332, 342, 345, 346, 348, 351, 353, 360, 361, 362, 363, 377, 380, 390, 399, 402, 405, 407, 411, 413, 416, 418, 427, 430, 437, 438, 442, 446, 449, 452, 457, 464, 465, 470, 487, 490, 503, 514, 523, 525, 527, 528, 529, 534, 540, 547, 552, 554, 555, 557, 580, 583, 586, 593, 604, 609, 615, 618, 640, 652, 653, 656, 657, 666, 672, 677, 684, 685, 687, 690, 699 ] }, { "meta": { "columnNames": { "x": "TR name", "y": "H", "marker": { "size": "Number of arrays" } } }, "mode": "markers", "name": "<i>P.lessonae</i>", "type": "scatter", "xsrc": "ATrav:26:b1a330", "ysrc": "ATrav:26:17c621", "jitter": 0.59, "marker": { "meta": { "columnNames": { "size": "Number of arrays" } }, "opacity": 1, "sizeref": 1, "sizesrc": "ATrav:26:95879f", "sizemode": "area" }, "opacity": 0.67, "bandwidth": 0, "selectedpoints": [] }, { "meta": { "columnNames": { "x": "TR name", "y": "H", "marker": { "size": "Number of arrays" } } }, "mode": "markers", "name": "<i>L.septentrionalis</i>", "type": "scatter", "xsrc": "ATrav:25:657427", "ysrc": "ATrav:25:ac2c61", "jitter": 0.55, "marker": { "meta": { "columnNames": { "size": "Number of arrays" } }, "opacity": 1, "sizeref": 1, "sizesrc": "ATrav:25:1fc567", "sizemode": "area" }, "opacity": 0.67, "bandwidth": 0, "selectedpoints": [] }, { "meta": { "columnNames": { "x": "TR name", "y": "H", "marker": { "size": "Number of arrays" } } }, "mode": "markers", "name": "<i>L.pipiens</i>", "type": "scatter", "xsrc": "ATrav:24:4d7c21", "ysrc": "ATrav:24:d3c4ee", "jitter": 0.59, "marker": { "meta": { "columnNames": { "size": "Number of arrays" } }, "opacity": 1, "sizeref": 1, "sizesrc": "ATrav:24:761081", "sizemode": "area" }, "opacity": 0.67, "bandwidth": 0, "selectedpoints": [] }, { "meta": { "columnNames": { "x": "TR name", "y": "I", "text": "", "marker": { "size": "Number of arrays", "color": "Number of arrays" } } }, "mode": "markers", "name": "<i>A.catesbeiana</i>", "type": "scatter", "xsrc": "ATrav:27:bfe106", "ysrc": "ATrav:27:034350", "jitter": 0.59, "marker": { "meta": { "columnNames": { "size": "Number of arrays", "color": "Number of arrays" } }, "color": "#1f77b4", "opacity": 1, "sizeref": 1, "sizesrc": "ATrav:22:967dfa", "sizemode": "area" }, "opacity": 0.67, "pointpos": 0, "bandwidth": 0, "selectedpoints": [] }, { "meta": { "columnNames": { "x": "TR name", "y": "H", "marker": { "size": "Number of arrays" } } }, "mode": "markers", "name": "<i>L.sylvaticus</i>", "type": "scatter", "xsrc": "ATrav:23:27b616", "ysrc": "ATrav:23:d678fd", "jitter": 0.59, "marker": { "meta": { "columnNames": { "size": "Number of arrays" } }, "opacity": 1, "sizeref": 1, "sizesrc": "ATrav:23:e3592f", "sizemode": "area" }, "opacity": 0.67, "bandwidth": 0, "selectedpoints": [] }, { "meta": { "columnNames": { "x": "TR name", "y": "I", "marker": { "size": "Number of arrays" } } }, "mode": "markers", "name": "<i>R.temporaria</i>", "side": "both", "type": "scatter", "xsrc": "ATrav:20:9ad86a", "ysrc": "ATrav:20:9c3671", "jitter": 0.59, "marker": { "meta": { "columnNames": { "size": "Number of arrays" } }, "opacity": 1, "sizeref": 1, "sizesrc": "ATrav:20:e2b9dc", "sizemode": "area" }, "opacity": 0.67, "pointpos": 0, "spanmode": "soft", "bandwidth": 0, "showlegend": true, "selectedpoints": [] }, { "meta": { "columnNames": { "x": "TR name", "y": "I", "marker": { "size": "Number of arrays" } } }, "mode": "markers", "name": "<i>R.kukunoris</i>", "type": "scatter", "xsrc": "ATrav:22:6921b3", "ysrc": "ATrav:22:89a893", "jitter": 0.59, "marker": { "meta": { "columnNames": { "size": "Number of arrays" } }, "opacity": 1, "sizeref": 1, "sizesrc": "ATrav:22:967dfa", "sizemode": "area" }, "opacity": 0.67, "pointpos": 0, "bandwidth": 0, "selectedpoints": [] }, { "meta": { "columnNames": { "x": "TR name", "y": "H", "marker": { "size": "Number of arrays" } } }, "mode": "markers", "name": "<i>S.parvus</i>", "type": "scatter", "xsrc": "ATrav:28:890c54", "ysrc": "ATrav:28:5b68c3", "jitter": 0.59, "marker": { "meta": { "columnNames": { "size": "Number of arrays" } }, "opacity": 1, "sizeref": 1, "sizesrc": "ATrav:28:1561bb", "sizemode": "area" }, "opacity": 0.67, "bandwidth": 0, "orientation": "v", "selectedpoints": [] } ], "frames": [], "layout": { "xaxis": { "side": "bottom", "type": "category", "range": [ 1954.344416987357, 7779.049752583216 ], "anchor": "free", "autorange": false }, "yaxis": { "side": "left", "type": "linear", "range": [ 0.05325591131030072, 0.7634725083179786 ], "autorange": false }, "autosize": true, "dragmode": "select", "template": { "data": { "bar": [ { "type": "bar", "marker": { "colorbar": { "ticks": "", "outlinewidth": 0 } } } ], "table": [ { "type": "table", "cells": { "fill": { "color": "#EBF0F8" }, "line": { "color": "white" } }, "header": { "fill": { "color": "#C8D4E3" }, "line": { "color": "white" } } } ], "carpet": [ { "type": "carpet", "aaxis": { "gridcolor": "#C8D4E3", "linecolor": "#C8D4E3", "endlinecolor": "#2a3f5f", "minorgridcolor": "#C8D4E3", "startlinecolor": "#2a3f5f" }, "baxis": { "gridcolor": "#C8D4E3", "linecolor": "#C8D4E3", "endlinecolor": "#2a3f5f", "minorgridcolor": "#C8D4E3", "startlinecolor": "#2a3f5f" } } ], "mesh3d": [ { "type": "mesh3d", "colorbar": { "ticks": "", "outlinewidth": 0 } } ], "contour": [ { "type": "contour", "colorbar": { "ticks": "", "outlinewidth": 0 }, "autocolorscale": true } ], "heatmap": [ { "type": "heatmap", "colorbar": { "ticks": "", "outlinewidth": 0 }, "autocolorscale": true } ], "scatter": [ { "type": "scatter", "marker": { "colorbar": { "ticks": "", "outlinewidth": 0 } } } ], "surface": [ { "type": "surface", "colorbar": { "ticks": "", "outlinewidth": 0 } } ], "heatmapgl": [ { "type": "heatmapgl", "colorbar": { "ticks": "", "outlinewidth": 0 } } ], "histogram": [ { "type": "histogram", "marker": { "colorbar": { "ticks": "", "outlinewidth": 0 } } } ], "parcoords": [ { "line": { "colorbar": { "ticks": "", "outlinewidth": 0 } }, "type": "parcoords" } ], "scatter3d": [ { "type": "scatter3d", "marker": { "colorbar": { "ticks": "", "outlinewidth": 0 } } } ], "scattergl": [ { "type": "scattergl", "marker": { "colorbar": { "ticks": "", "outlinewidth": 0 } } } ], "choropleth": [ { "type": "choropleth", "colorbar": { "ticks": "", "outlinewidth": 0 } } ], "scattergeo": [ { "type": "scattergeo", "marker": { "colorbar": { "ticks": "", "outlinewidth": 0 } } } ], "histogram2d": [ { "type": "histogram2d", "colorbar": { "ticks": "", "outlinewidth": 0 }, "autocolorscale": true } ], "scatterpolar": [ { "type": "scatterpolar", "marker": { "colorbar": { "ticks": "", "outlinewidth": 0 } } } ], "contourcarpet": [ { "type": "contourcarpet", "colorbar": { "ticks": "", "outlinewidth": 0 } } ], "scattercarpet": [ { "type": "scattercarpet", "marker": { "colorbar": { "ticks": "", "outlinewidth": 0 } } } ], "scattermapbox": [ { "type": "scattermapbox", "marker": { "colorbar": { "ticks": "", "outlinewidth": 0 } } } ], "scatterpolargl": [ { "type": "scatterpolargl", "marker": { "colorbar": { "ticks": "", "outlinewidth": 0 } } } ], "scatterternary": [ { "type": "scatterternary", "marker": { "colorbar": { "ticks": "", "outlinewidth": 0 } } } ], "histogram2dcontour": [ { "type": "histogram2dcontour", "colorbar": { "ticks": "", "outlinewidth": 0 }, "autocolorscale": true } ] }, "layout": { "geo": { "bgcolor": "white", "showland": true, "lakecolor": "white", "landcolor": "white", "showlakes": true, "subunitcolor": "#C8D4E3" }, "font": { "color": "#2a3f5f" }, "polar": { "bgcolor": "white", "radialaxis": { "ticks": "", "gridcolor": "#EBF0F8", "linecolor": "#EBF0F8" }, "angularaxis": { "ticks": "", "gridcolor": "#EBF0F8", "linecolor": "#EBF0F8" } }, "scene": { "xaxis": { "ticks": "", "gridcolor": "#DFE8F3", "gridwidth": 2, "linecolor": "#EBF0F8", "zerolinecolor": "#EBF0F8", "showbackground": true, "backgroundcolor": "white" }, "yaxis": { "ticks": "", "gridcolor": "#DFE8F3", "gridwidth": 2, "linecolor": "#EBF0F8", "zerolinecolor": "#EBF0F8", "showbackground": true, "backgroundcolor": "white" }, "zaxis": { "ticks": "", "gridcolor": "#DFE8F3", "gridwidth": 2, "linecolor": "#EBF0F8", "zerolinecolor": "#EBF0F8", "showbackground": true, "backgroundcolor": "white" } }, "title": { "x": 0.05 }, "xaxis": { "ticks": "", "gridcolor": "#EBF0F8", "linecolor": "#EBF0F8", "automargin": true, "zerolinecolor": "#EBF0F8", "zerolinewidth": 2 }, "yaxis": { "ticks": "", "gridcolor": "#EBF0F8", "linecolor": "#EBF0F8", "automargin": true, "zerolinecolor": "#EBF0F8", "zerolinewidth": 2 }, "ternary": { "aaxis": { "ticks": "", "gridcolor": "#DFE8F3", "linecolor": "#A2B1C6" }, "baxis": { "ticks": "", "gridcolor": "#DFE8F3", "linecolor": "#A2B1C6" }, "caxis": { "ticks": "", "gridcolor": "#DFE8F3", "linecolor": "#A2B1C6" }, "bgcolor": "white" }, "colorway": [ "#636efa", "#EF553B", "#00cc96", "#ab63fa", "#19d3f3", "#e763fa", "#fecb52", "#ffa15a", "#ff6692", "#b6e880" ], "hovermode": "closest", "colorscale": { "diverging": [ [ 0, "#8e0152" ], [ 0.1, "#c51b7d" ], [ 0.2, "#de77ae" ], [ 0.3, "#f1b6da" ], [ 0.4, "#fde0ef" ], [ 0.5, "#f7f7f7" ], [ 0.6, "#e6f5d0" ], [ 0.7, "#b8e186" ], [ 0.8, "#7fbc41" ], [ 0.9, "#4d9221" ], [ 1, "#276419" ] ], "sequential": [ [ 0, "#0508b8" ], [ 0.0893854748603352, "#1910d8" ], [ 0.1787709497206704, "#3c19f0" ], [ 0.2681564245810056, "#6b1cfb" ], [ 0.3575418994413408, "#981cfd" ], [ 0.44692737430167595, "#bf1cfd" ], [ 0.5363128491620112, "#dd2bfd" ], [ 0.6256983240223464, "#f246fe" ], [ 0.7150837988826816, "#fc67fd" ], [ 0.8044692737430168, "#fe88fc" ], [ 0.8938547486033519, "#fea5fd" ], [ 0.9832402234636871, "#febefe" ], [ 1, "#fec3fe" ] ], "sequentialminus": [ [ 0, "#0508b8" ], [ 0.0893854748603352, "#1910d8" ], [ 0.1787709497206704, "#3c19f0" ], [ 0.2681564245810056, "#6b1cfb" ], [ 0.3575418994413408, "#981cfd" ], [ 0.44692737430167595, "#bf1cfd" ], [ 0.5363128491620112, "#dd2bfd" ], [ 0.6256983240223464, "#f246fe" ], [ 0.7150837988826816, "#fc67fd" ], [ 0.8044692737430168, "#fe88fc" ], [ 0.8938547486033519, "#fea5fd" ], [ 0.9832402234636871, "#febefe" ], [ 1, "#fec3fe" ] ] }, "plot_bgcolor": "white", "paper_bgcolor": "white", "shapedefaults": { "line": { "width": 0 }, "opacity": 0.4, "fillcolor": "#506784" }, "annotationdefaults": { "arrowhead": 0, "arrowcolor": "#506784", "arrowwidth": 1 } }, "themeRef": "PLOTLY_WHITE" }, "violingap": 0.56 } }, "height": null, "width": null, "user": { "profile_url": "https://chart-studio.plotly.com/~ATrav", "avatar_url": "https://storage.googleapis.com/plotly-prod-profiles/89.jpg", "background_url": "https://storage.googleapis.com/plotly-prod-profiles/bg-7.jpg", "bio": "", "nickname": "", "website": "", "stream_tokens": null, "feature_set_id": null, "csrf_token": null, "date_joined": "2025-07-26 09:57:47", "mapbox_access_tokens": null, "has_password": null, "username": "ATrav", "email": null, "is_active": null, "readonly": null, "is_dash_creator": null, "dash_created_count": null, "is_chart_creator": null, "charts_created_count": null } }, { "creation_time": "2025-08-02T18:30:03.094147Z", "comments": { "results": [], "count": 0 }, "parented": true, "embed_url": "https://chart-studio.plotly.com/~ATrav/32.embed", "fid": "ATrav:32", "filename": "number arry2", "filetype": "plot", "img_url": "https://storage.googleapis.com/plotly-prod-images/ATrav/32/9_Y65S5EWKBH1K41WFSBSWOTDT2IQZYK.png", "image_urls": { "default": "https://storage.googleapis.com/plotly-prod-images/ATrav/32/2_N8JZDCLW07RENITF1HQMWQCHJB6L4Y.png", "block-thumb": "https://storage.googleapis.com/plotly-prod-images/ATrav/32/8_IYDFLXL3YWT1EK9AXNYDYVEISZSQ4V.png", "list-thumb": "https://storage.googleapis.com/plotly-prod-images/ATrav/32/9_Y65S5EWKBH1K41WFSBSWOTDT2IQZYK.png" }, "api_urls": { "files": "https://api.plotly.com/v2/files/ATrav:32", "plots": "https://api.plotly.com/v2/plots/ATrav:32", "parent": "https://api.plotly.com/v2/folders/home?user=ATrav" }, "owner": "ATrav", "parent": -1, "preview": "", "referencers": [], "references": [], "title": "", "views": 0, "web_url": "https://chart-studio.plotly.com/~ATrav/32/", "world_readable": true, "date_modified": "2025-08-02T18:30:03.108Z", "stars": { "results": [], "count": 0 }, "collaborators": { "results": [], "count": 0 }, "subfolder_count": null, "refresh_interval": null, "organize_view_url": "https://chart-studio.plotly.com/~ATrav/32/", "current_user_permission": "read", "is_theme": null, "is_template": false, "autosize": true, "caption": "", "figure": { "data": [ { "meta": { "columnNames": { "x": "TR name", "y": "H", "marker": { "size": "Number of arrays" } } }, "mode": "markers", "name": "<i>R.muscosa</i>", "type": "scatter", "xsrc": "ATrav:21:45e301", "ysrc": "ATrav:21:53ca0e", "jitter": 0.55, "marker": { "meta": { "columnNames": { "size": "Number of arrays" } }, "opacity": 0.7, "sizeref": 1, "sizesrc": "ATrav:21:a964bc", "sizemode": "area" }, "error_x": { "type": "percent", "color": "#636efa", "value": 10, "width": 4, "visible": false, "symmetric": true, "thickness": 2 }, "hoveron": "points", "opacity": 0.67, "bandwidth": 0, "selectedpoints": [ 0, 1, 2, 3, 4, 5, 6, 7, 8, 10, 12, 13, 14, 15, 16, 17, 18, 20, 21, 22, 24, 27, 29, 30, 31, 33, 34, 35, 37, 39, 40, 41, 42, 43, 44, 46, 48, 49, 52, 55, 56, 58, 60, 61, 62, 63, 65, 66, 68, 71, 72, 74, 75, 76, 78, 79, 80, 81, 82, 83, 84, 85, 86, 89, 91, 92, 97, 98, 99, 100, 102, 105, 106, 107, 108, 109, 110, 111, 116, 117, 119, 120, 123, 124, 127, 131, 132, 134, 136, 138, 139, 141, 143, 144, 145, 147, 149, 150, 151, 154, 155, 156, 157, 158, 159, 160, 163, 175, 176, 177, 178, 179, 181, 182, 187, 191, 193, 198, 200, 202, 203, 204, 205, 208, 209, 210, 213, 215, 222, 223, 226, 228, 229, 236, 240, 243, 250, 254, 256, 259, 261, 262, 269, 270, 273, 276, 277, 278, 283, 285, 287, 288, 289, 302, 303, 310, 311, 313, 316, 317, 318, 319, 327, 330, 331, 332, 342, 345, 346, 348, 351, 353, 360, 361, 362, 363, 377, 380, 390, 399, 402, 405, 407, 411, 413, 416, 418, 427, 430, 437, 438, 442, 446, 449, 452, 457, 464, 465, 470, 487, 490, 503, 514, 523, 525, 527, 528, 529, 534, 540, 547, 552, 554, 555, 557, 580, 583, 586, 593, 604, 609, 615, 618, 640, 652, 653, 656, 657, 666, 672, 677, 684, 685, 687, 690, 699 ] }, { "meta": { "columnNames": { "x": "TR name", "y": "H", "marker": { "size": "Number of arrays" } } }, "mode": "markers", "name": "<i>P.lessonae</i>", "type": "scatter", "xsrc": "ATrav:26:b1a330", "ysrc": "ATrav:26:17c621", "jitter": 0.59, "marker": { "meta": { "columnNames": { "size": "Number of arrays" } }, "opacity": 0.7, "sizeref": 1, "sizesrc": "ATrav:26:95879f", "sizemode": "area" }, "opacity": 0.67, "bandwidth": 0, "selectedpoints": [] }, { "meta": { "columnNames": { "x": "TR name", "y": "H", "marker": { "size": "Number of arrays" } } }, "mode": "markers", "name": "<i>L.septentrionalis</i>", "type": "scatter", "xsrc": "ATrav:25:657427", "ysrc": "ATrav:25:ac2c61", "jitter": 0.55, "marker": { "meta": { "columnNames": { "size": "Number of arrays" } }, "opacity": 0.7, "sizeref": 1, "sizesrc": "ATrav:25:1fc567", "sizemode": "area" }, "opacity": 0.67, "bandwidth": 0, "selectedpoints": [] }, { "meta": { "columnNames": { "x": "TR name", "y": "H", "marker": { "size": "Number of arrays" } } }, "mode": "markers", "name": "<i>L.pipiens</i>", "type": "scatter", "xsrc": "ATrav:24:4d7c21", "ysrc": "ATrav:24:d3c4ee", "jitter": 0.59, "marker": { "meta": { "columnNames": { "size": "Number of arrays" } }, "opacity": 0.7, "sizeref": 1, "sizesrc": "ATrav:24:761081", "sizemode": "area" }, "opacity": 0.67, "bandwidth": 0, "selectedpoints": [] }, { "meta": { "columnNames": { "x": "TR name", "y": "I", "text": "", "marker": { "size": "Number of arrays", "color": "Number of arrays" } } }, "mode": "markers", "name": "<i>A.catesbeiana</i>", "type": "scatter", "xsrc": "ATrav:27:bfe106", "ysrc": "ATrav:27:034350", "jitter": 0.59, "marker": { "meta": { "columnNames": { "size": "Number of arrays", "color": "Number of arrays" } }, "color": "#1f77b4", "opacity": 0.7, "sizeref": 1, "sizesrc": "ATrav:22:967dfa", "sizemode": "area" }, "opacity": 0.67, "pointpos": 0, "bandwidth": 0, "selectedpoints": [] }, { "meta": { "columnNames": { "x": "TR name", "y": "H", "marker": { "size": "Number of arrays" } } }, "mode": "markers", "name": "<i>L.sylvaticus</i>", "type": "scatter", "xsrc": "ATrav:23:27b616", "ysrc": "ATrav:23:d678fd", "jitter": 0.59, "marker": { "meta": { "columnNames": { "size": "Number of arrays" } }, "opacity": 0.7, "sizeref": 1, "sizesrc": "ATrav:23:e3592f", "sizemode": "area" }, "opacity": 0.67, "bandwidth": 0, "selectedpoints": [] }, { "meta": { "columnNames": { "x": "TR name", "y": "I", "marker": { "size": "Number of arrays" } } }, "mode": "markers", "name": "<i>R.temporaria</i>", "side": "both", "type": "scatter", "xsrc": "ATrav:20:9ad86a", "ysrc": "ATrav:20:9c3671", "jitter": 0.59, "marker": { "meta": { "columnNames": { "size": "Number of arrays" } }, "opacity": 0.7, "sizeref": 1, "sizesrc": "ATrav:20:e2b9dc", "sizemode": "area" }, "opacity": 0.67, "pointpos": 0, "spanmode": "soft", "bandwidth": 0, "showlegend": true, "selectedpoints": [] }, { "meta": { "columnNames": { "x": "TR name", "y": "I", "marker": { "size": "Number of arrays" } } }, "mode": "markers", "name": "<i>R.kukunoris</i>", "type": "scatter", "xsrc": "ATrav:22:6921b3", "ysrc": "ATrav:22:89a893", "jitter": 0.59, "marker": { "meta": { "columnNames": { "size": "Number of arrays" } }, "opacity": 0.7, "sizeref": 1, "sizesrc": "ATrav:22:967dfa", "sizemode": "area" }, "opacity": 0.67, "pointpos": 0, "bandwidth": 0, "selectedpoints": [] }, { "meta": { "columnNames": { "x": "TR name", "y": "H", "marker": { "size": "Number of arrays" } } }, "mode": "markers", "name": "<i>S.parvus</i>", "type": "scatter", "xsrc": "ATrav:28:890c54", "ysrc": "ATrav:28:5b68c3", "jitter": 0.59, "marker": { "meta": { "columnNames": { "size": "Number of arrays" } }, "opacity": 0.7, "sizeref": 1, "sizesrc": "ATrav:28:1561bb", "sizemode": "area" }, "opacity": 0.67, "bandwidth": 0, "orientation": "v", "selectedpoints": [] } ], "frames": [], "layout": { "xaxis": { "side": "bottom", "type": "category", "range": [ 1954.344416987357, 7779.049752583216 ], "anchor": "free", "autorange": false }, "yaxis": { "side": "left", "type": "linear", "range": [ 0.05325591131030072, 0.7634725083179786 ], "autorange": false }, "autosize": true, "dragmode": "select", "template": { "data": { "bar": [ { "type": "bar", "marker": { "colorbar": { "ticks": "", "outlinewidth": 0 } } } ], "table": [ { "type": "table", "cells": { "fill": { "color": "#EBF0F8" }, "line": { "color": "white" } }, "header": { "fill": { "color": "#C8D4E3" }, "line": { "color": "white" } } } ], "carpet": [ { "type": "carpet", "aaxis": { "gridcolor": "#C8D4E3", "linecolor": "#C8D4E3", "endlinecolor": "#2a3f5f", "minorgridcolor": "#C8D4E3", "startlinecolor": "#2a3f5f" }, "baxis": { "gridcolor": "#C8D4E3", "linecolor": "#C8D4E3", "endlinecolor": "#2a3f5f", "minorgridcolor": "#C8D4E3", "startlinecolor": "#2a3f5f" } } ], "mesh3d": [ { "type": "mesh3d", "colorbar": { "ticks": "", "outlinewidth": 0 } } ], "contour": [ { "type": "contour", "colorbar": { "ticks": "", "outlinewidth": 0 }, "autocolorscale": true } ], "heatmap": [ { "type": "heatmap", "colorbar": { "ticks": "", "outlinewidth": 0 }, "autocolorscale": true } ], "scatter": [ { "type": "scatter", "marker": { "colorbar": { "ticks": "", "outlinewidth": 0 } } } ], "surface": [ { "type": "surface", "colorbar": { "ticks": "", "outlinewidth": 0 } } ], "heatmapgl": [ { "type": "heatmapgl", "colorbar": { "ticks": "", "outlinewidth": 0 } } ], "histogram": [ { "type": "histogram", "marker": { "colorbar": { "ticks": "", "outlinewidth": 0 } } } ], "parcoords": [ { "line": { "colorbar": { "ticks": "", "outlinewidth": 0 } }, "type": "parcoords" } ], "scatter3d": [ { "type": "scatter3d", "marker": { "colorbar": { "ticks": "", "outlinewidth": 0 } } } ], "scattergl": [ { "type": "scattergl", "marker": { "colorbar": { "ticks": "", "outlinewidth": 0 } } } ], "choropleth": [ { "type": "choropleth", "colorbar": { "ticks": "", "outlinewidth": 0 } } ], "scattergeo": [ { "type": "scattergeo", "marker": { "colorbar": { "ticks": "", "outlinewidth": 0 } } } ], "histogram2d": [ { "type": "histogram2d", "colorbar": { "ticks": "", "outlinewidth": 0 }, "autocolorscale": true } ], "scatterpolar": [ { "type": "scatterpolar", "marker": { "colorbar": { "ticks": "", "outlinewidth": 0 } } } ], "contourcarpet": [ { "type": "contourcarpet", "colorbar": { "ticks": "", "outlinewidth": 0 } } ], "scattercarpet": [ { "type": "scattercarpet", "marker": { "colorbar": { "ticks": "", "outlinewidth": 0 } } } ], "scattermapbox": [ { "type": "scattermapbox", "marker": { "colorbar": { "ticks": "", "outlinewidth": 0 } } } ], "scatterpolargl": [ { "type": "scatterpolargl", "marker": { "colorbar": { "ticks": "", "outlinewidth": 0 } } } ], "scatterternary": [ { "type": "scatterternary", "marker": { "colorbar": { "ticks": "", "outlinewidth": 0 } } } ], "histogram2dcontour": [ { "type": "histogram2dcontour", "colorbar": { "ticks": "", "outlinewidth": 0 }, "autocolorscale": true } ] }, "layout": { "geo": { "bgcolor": "white", "showland": true, "lakecolor": "white", "landcolor": "white", "showlakes": true, "subunitcolor": "#C8D4E3" }, "font": { "color": "#2a3f5f" }, "polar": { "bgcolor": "white", "radialaxis": { "ticks": "", "gridcolor": "#EBF0F8", "linecolor": "#EBF0F8" }, "angularaxis": { "ticks": "", "gridcolor": "#EBF0F8", "linecolor": "#EBF0F8" } }, "scene": { "xaxis": { "ticks": "", "gridcolor": "#DFE8F3", "gridwidth": 2, "linecolor": "#EBF0F8", "zerolinecolor": "#EBF0F8", "showbackground": true, "backgroundcolor": "white" }, "yaxis": { "ticks": "", "gridcolor": "#DFE8F3", "gridwidth": 2, "linecolor": "#EBF0F8", "zerolinecolor": "#EBF0F8", "showbackground": true, "backgroundcolor": "white" }, "zaxis": { "ticks": "", "gridcolor": "#DFE8F3", "gridwidth": 2, "linecolor": "#EBF0F8", "zerolinecolor": "#EBF0F8", "showbackground": true, "backgroundcolor": "white" } }, "title": { "x": 0.05 }, "xaxis": { "ticks": "", "gridcolor": "#EBF0F8", "linecolor": "#EBF0F8", "automargin": true, "zerolinecolor": "#EBF0F8", "zerolinewidth": 2 }, "yaxis": { "ticks": "", "gridcolor": "#EBF0F8", "linecolor": "#EBF0F8", "automargin": true, "zerolinecolor": "#EBF0F8", "zerolinewidth": 2 }, "ternary": { "aaxis": { "ticks": "", "gridcolor": "#DFE8F3", "linecolor": "#A2B1C6" }, "baxis": { "ticks": "", "gridcolor": "#DFE8F3", "linecolor": "#A2B1C6" }, "caxis": { "ticks": "", "gridcolor": "#DFE8F3", "linecolor": "#A2B1C6" }, "bgcolor": "white" }, "colorway": [ "#636efa", "#EF553B", "#00cc96", "#ab63fa", "#19d3f3", "#e763fa", "#fecb52", "#ffa15a", "#ff6692", "#b6e880" ], "hovermode": "closest", "colorscale": { "diverging": [ [ 0, "#8e0152" ], [ 0.1, "#c51b7d" ], [ 0.2, "#de77ae" ], [ 0.3, "#f1b6da" ], [ 0.4, "#fde0ef" ], [ 0.5, "#f7f7f7" ], [ 0.6, "#e6f5d0" ], [ 0.7, "#b8e186" ], [ 0.8, "#7fbc41" ], [ 0.9, "#4d9221" ], [ 1, "#276419" ] ], "sequential": [ [ 0, "#0508b8" ], [ 0.0893854748603352, "#1910d8" ], [ 0.1787709497206704, "#3c19f0" ], [ 0.2681564245810056, "#6b1cfb" ], [ 0.3575418994413408, "#981cfd" ], [ 0.44692737430167595, "#bf1cfd" ], [ 0.5363128491620112, "#dd2bfd" ], [ 0.6256983240223464, "#f246fe" ], [ 0.7150837988826816, "#fc67fd" ], [ 0.8044692737430168, "#fe88fc" ], [ 0.8938547486033519, "#fea5fd" ], [ 0.9832402234636871, "#febefe" ], [ 1, "#fec3fe" ] ], "sequentialminus": [ [ 0, "#0508b8" ], [ 0.0893854748603352, "#1910d8" ], [ 0.1787709497206704, "#3c19f0" ], [ 0.2681564245810056, "#6b1cfb" ], [ 0.3575418994413408, "#981cfd" ], [ 0.44692737430167595, "#bf1cfd" ], [ 0.5363128491620112, "#dd2bfd" ], [ 0.6256983240223464, "#f246fe" ], [ 0.7150837988826816, "#fc67fd" ], [ 0.8044692737430168, "#fe88fc" ], [ 0.8938547486033519, "#fea5fd" ], [ 0.9832402234636871, "#febefe" ], [ 1, "#fec3fe" ] ] }, "plot_bgcolor": "white", "paper_bgcolor": "white", "shapedefaults": { "line": { "width": 0 }, "opacity": 0.4, "fillcolor": "#506784" }, "annotationdefaults": { "arrowhead": 0, "arrowcolor": "#506784", "arrowwidth": 1 } }, "themeRef": "PLOTLY_WHITE" }, "violingap": 0.56 } }, "height": null, "width": null, "user": { "profile_url": "https://chart-studio.plotly.com/~ATrav", "avatar_url": "https://storage.googleapis.com/plotly-prod-profiles/89.jpg", "background_url": "https://storage.googleapis.com/plotly-prod-profiles/bg-7.jpg", "bio": "", "nickname": "", "website": "", "stream_tokens": null, "feature_set_id": null, "csrf_token": null, "date_joined": "2025-07-26 09:57:47", "mapbox_access_tokens": null, "has_password": null, "username": "ATrav", "email": null, "is_active": null, "readonly": null, "is_dash_creator": null, "dash_created_count": null, "is_chart_creator": null, "charts_created_count": null } } ] }
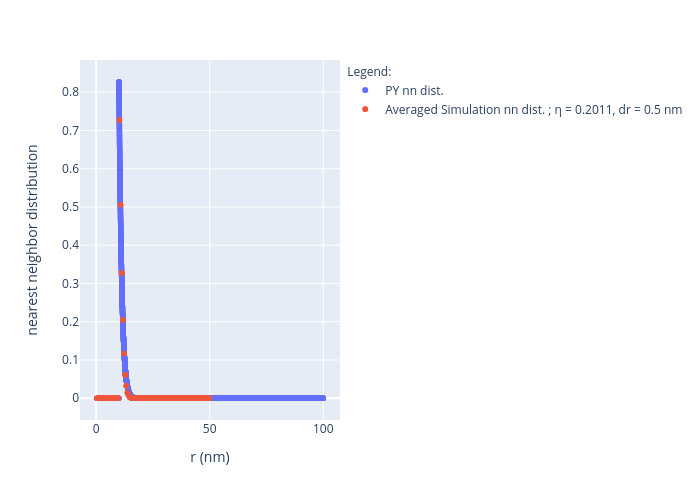
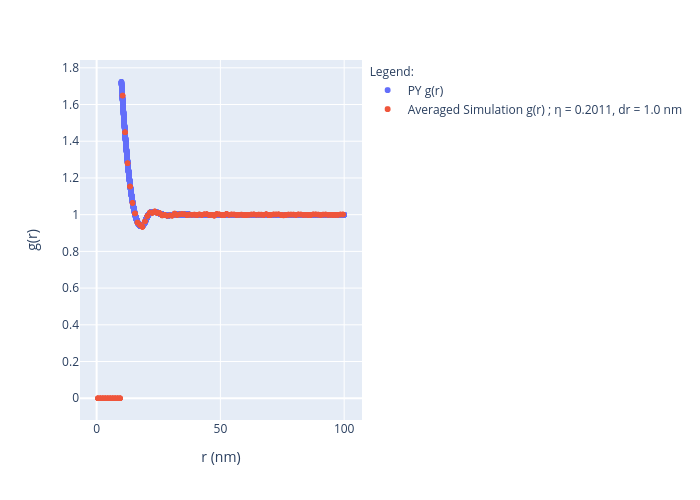