Plots List
Plots
This endpoint handles manipulation of Plotly plot files.
Reference
Authorization
Any user with or without a Plotly account may view public plots. For private plots, see authentication.
Actions
list
Listing all public plots can be done via a GET request to this endpoint.
By default, plots will be listed in order of date created. The order_by
query parameter is accepted at this endpoint. Currently, only ordering by
views is supported. It is possible to filter the plots by quality
with min_quality or max_quality as query parameter.
Example:
// GET https://api.plotly.com/v2/plots/ ---> 200

// GET https://api.plotly.com/v2/plots/?order_by=-views ---> 200

// GET https://api.plotly.com/v2/plots/?min_quality=5 ---> 200

// GET https://api.plotly.com/v2/plots/?max_quality=5 ---> 200
feed
Listing all handpicked feed plots can be done via a GET request to this endpoint. By default, plots will be listed in a random order.
Example:
// GET https://api.plotly.com/v2/plots/feed ---> 200
create
You can create new plot resources here. The only required field is 'figure'. Currently, the figure is restricted to only contain references to grid data. That is, this will fail if raw data arrays are passed in. To create and manipulate underlying grids for plots, see the grids endpoint.
Example:
// This fails because a figure field is required.
// POST https://api.plotly.com/v2/plots ---> 400 Bad Request
{}

// This fails because the figure has raw data
//POST https://api.plotly.com/v2/plots ---> 400 Bad Request
{
    "figure": {"data": [{"y": ['this', 'is', 'raw', 'data']}]}
}

// This succeeds because the figure has src keys, not raw data.
//POST https://api.plotly.com/v2/plots ---> 200 OK
{
    "figure": {"data": [{"ysrc": "sven:88:u8nd62"}]}
}
When creating a grid, you can optionally specify a source_fid to specify where a plot has come from:
- source_fid: the fid of a plot that was copied (and presumably edited) to produce this one
detail
There is a lot of meta information stored about plot files including filename, title, share_url, and content_url to name a few.
This information can only be reached with a GET to this endpoint.
Example:
// GET https://api.plotly.com/v2/plots/iheartgraphs:90
content
The contents of a plot can be downloaded via the content resource. The plot
content contains referenced grid/column data by default. If you wish to
return the raw grid/column data, the inline_data=true query must be included
in the request url. The Content-Type header will be appropriately set for the
response body.
Alternatively, you can set ?map_data=unreadable to append a mapping of
sources to data that belongs to grids which are unreadable for the
requestor. This is useful when you have read access to another users plot,
but that plot contains grid references which you don't have access to.
Examples:
// Returns referenced grid/column data
// GET https://api.plotly.com/v2/plots/iheartgraphs:90/content ---> 200 OK

// Returns full grid/column data
// GET https://api.plotly.com/v2/plots/iheartgraphs:90/content?inline_data=true ---> 200 OK

// Returns full grid/column data when requestor doesn't have permission
// to read the referenced grid.
// GET https://api.plotly.com/v2/plots/iheartgraphs:90/content?map_data=unreadable ---> 200 OK
GET /v2/plots?cursor=cD0yMDI1LTA4LTE0KzA4JTNBMjklM0EwMy4wNjkwOTglMkIwMCUzQTAw&format=api
{ "next": "https://api.plotly.com/v2/plots?cursor=cD0yMDI1LTA4LTE0KzA0JTNBNTAlM0EyNC42MzMwNDIlMkIwMCUzQTAw&format=api", "previous": "https://api.plotly.com/v2/plots?cursor=cj0xJnA9MjAyNS0wOC0xNCswOCUzQTE2JTNBMjMuMjYwNDkyJTJCMDAlM0EwMA%3D%3D&format=api", "results": [ { "creation_time": "2025-08-14T08:16:23.260492Z", "comments": { "results": [], "count": 0 }, "parented": true, "embed_url": "https://chart-studio.plotly.com/~FredRam/3.embed", "fid": "FredRam:3", "filename": "Motor Performance Chart", "filetype": "plot", "img_url": "https://api.plotly.com/v2/files/FredRam:3/image?image_name=list-thumb", "image_urls": { "default": "https://storage.googleapis.com/plotly-prod-images/FredRam/3/2_9R8ZXQN6YCO4HFND2P9LYU7RAEZWW2.png", "block-thumb": "https://storage.googleapis.com/plotly-prod-images/FredRam/3/8_7FLZXBGFITCW7LF8V29FXBDEVQBRJO.png", "list-thumb": "https://api.plotly.com/v2/files/FredRam:3/image?image_name=list-thumb" }, "api_urls": { "files": "https://api.plotly.com/v2/files/FredRam:3", "plots": "https://api.plotly.com/v2/plots/FredRam:3", "parent": "https://api.plotly.com/v2/folders/home?user=FredRam" }, "owner": "FredRam", "parent": -1, "preview": "", "referencers": [], "references": [], "title": "", "views": 0, "web_url": "https://chart-studio.plotly.com/~FredRam/3/", "world_readable": true, "date_modified": "2025-08-14T08:16:32.381Z", "stars": { "results": [], "count": 0 }, "collaborators": { "results": [], "count": 0 }, "subfolder_count": null, "refresh_interval": null, "organize_view_url": "https://chart-studio.plotly.com/~FredRam/3/", "current_user_permission": "read", "is_theme": null, "is_template": true, "autosize": true, "caption": "", "figure": { "data": [ { "uid": "1da2cb", "line": { "color": "rgb(52, 168, 83)", "width": 3 }, "meta": { "columnNames": { "x": "Torque", "y": "Speed" } }, "mode": "lines", "name": "Torque", "type": "scatter", "xsrc": "FredRam:2:c5626a", "ysrc": "FredRam:2:737df8", "marker": { "line": { "color": "#444", "width": "" }, "size": 6, "color": "#c50131", "symbol": "circle", "opacity": 1, "gradient": { "type": "none" }, "maxdisplayed": 0 }, "opacity": 1, "selected": { "marker": { "opacity": 1 } }, "hoverinfo": "x+y+z+text", "cliponaxis": true, "hoverlabel": { "namelength": 15 }, "showlegend": true, "unselected": { "marker": { "opacity": 0.2 } }, "hovertemplate": "Speed: %{y:.0f}; Torque: %{x:.1f}" }, { "uid": "390e8d", "line": { "color": "rgb(197, 1, 49)", "width": 3 }, "meta": { "columnNames": { "x": "Torque", "y": "Current" } }, "mode": "lines", "name": "Current", "type": "scatter", "xsrc": "FredRam:2:c5626a", "ysrc": "FredRam:2:f7d710", "yaxis": "y2", "visible": true, "stackgroup": null }, { "uid": "90bcdf", "line": { "color": "rgb(255, 153, 0)", "shape": "spline", "smoothing": 1 }, "meta": { "columnNames": { "x": "Torque", "y": "PowerOut" } }, "mode": "lines", "name": "Power Out", "type": "scatter", "xsrc": "FredRam:2:c5626a", "ysrc": "FredRam:2:1f3eb2", "yaxis": "y3", "stackgroup": null }, { "line": { "color": "rgb(153, 0, 255)" }, "meta": { "columnNames": { "x": "Torque", "y": "Efficiency" } }, "mode": "lines", "name": "Efficiency", "type": "scatter", "xsrc": "FredRam:2:c5626a", "ysrc": "FredRam:2:eebc0f", "yaxis": "y4", "stackgroup": null } ], "frames": [], "layout": { "font": { "size": 14, "color": "rgb(73, 73, 73)", "family": "Open Sans" }, "title": { "text": "<b>110-108</b>" }, "xaxis": { "side": "bottom", "type": "linear", "dtick": 0.5, "range": [ 0, 2.6546 ], "tick0": 0, "ticks": "inside", "title": { "text": "<b>Torque</b> [mN·m]" }, "anchor": "y", "domain": [ 0, 0.8 ], "mirror": false, "nticks": 0, "ticklen": 8, "showgrid": true, "showline": true, "tickfont": { "color": "rgb(0, 0, 0)" }, "tickmode": "auto", "autorange": true, "linecolor": "rgb(73, 73, 73)", "linewidth": 2, "tickcolor": "rgb(73, 73, 73)", "tickwidth": 2, "showspikes": false, "rangeslider": { "range": [ 0, 2.6546 ], "yaxis": {}, "yaxis2": {}, "yaxis3": {}, "yaxis4": {}, "visible": false, "autorange": true }, "zerolinecolor": "rgb(73, 73, 73)", "zerolinewidth": 0, "exponentformat": "none" }, "yaxis": { "type": "linear", "dtick": 5000, "range": [ 0, 19235.27947368421 ], "tick0": 0, "ticks": "inside", "title": { "text": "<b>Speed</b> [rpm]" }, "domain": [ 0, 1 ], "nticks": 0, "ticklen": 6, "showgrid": true, "tickmode": "auto", "autorange": true, "gridcolor": "rgb(235, 240, 248)", "rangemode": "tozero", "tickwidth": 2, "exponentformat": "none", "constraintoward": "right" }, "legend": { "x": 1, "y": 1.25, "font": { "size": 14 }, "valign": "top", "xanchor": "right", "yanchor": "top", "borderwidth": 0, "orientation": "h" }, "shapes": [], "yaxis2": { "side": "right", "type": "linear", "dtick": 100, "range": [ 0, 680.4748421052632 ], "tick0": 0, "ticks": "inside", "title": { "text": "<b>Current</b> [mA]" }, "nticks": 0, "ticklen": 6, "showgrid": false, "showline": true, "tickmode": "auto", "autorange": true, "gridcolor": "rgb(235, 240, 248)", "linecolor": "rgb(73, 73, 73)", "linewidth": 2, "rangemode": "tozero", "tickwidth": 2, "overlaying": "y" }, "yaxis3": { "side": "right", "type": "linear", "range": [ 0, 1306.9471347368421 ], "ticks": "inside", "title": { "text": "<b>Power</b> [mW]" }, "anchor": "free", "domain": [ 0, "" ], "nticks": 0, "ticklen": 6, "position": 0.9, "showgrid": false, "showline": true, "autorange": true, "gridcolor": "#EBF0F8", "gridwidth": 1, "linecolor": "rgb(73, 73, 73)", "rangemode": "tozero", "tickwidth": 2, "fixedrange": false, "overlaying": "y" }, "yaxis4": { "side": "right", "type": "linear", "range": [ 0, 68.88705263157895 ], "ticks": "inside", "title": { "text": "<b>Efficiency</b> [%]" }, "anchor": "free", "ticklen": 6, "position": 1, "showgrid": false, "showline": true, "autorange": true, "linecolor": "rgb(73, 73, 73)", "linewidth": 2, "rangemode": "tozero", "tickwidth": 2, "overlaying": "y" }, "modebar": { "orientation": "h" }, "autosize": true, "dragmode": "zoom", "template": { "data": { "bar": [ { "type": "bar", "marker": { "colorbar": { "ticks": "", "outlinewidth": 0 } } } ], "table": [ { "type": "table", "cells": { "fill": { "color": "#EBF0F8" }, "line": { "color": "white" } }, "header": { "fill": { "color": "#C8D4E3" }, "line": { "color": "white" } } } ], "carpet": [ { "type": "carpet", "aaxis": { "gridcolor": "#C8D4E3", "linecolor": "#C8D4E3", "endlinecolor": "#2a3f5f", "minorgridcolor": "#C8D4E3", "startlinecolor": "#2a3f5f" }, "baxis": { "gridcolor": "#C8D4E3", "linecolor": "#C8D4E3", "endlinecolor": "#2a3f5f", "minorgridcolor": "#C8D4E3", "startlinecolor": "#2a3f5f" } } ], "mesh3d": [ { "type": "mesh3d", "colorbar": { "ticks": "", "outlinewidth": 0 } } ], "contour": [ { "type": "contour", "colorbar": { "ticks": "", "outlinewidth": 0 }, "autocolorscale": true } ], "heatmap": [ { "type": "heatmap", "colorbar": { "ticks": "", "outlinewidth": 0 }, "autocolorscale": true } ], "scatter": [ { "type": "scatter", "marker": { "colorbar": { "ticks": "", "outlinewidth": 0 } } } ], "surface": [ { "type": "surface", "colorbar": { "ticks": "", "outlinewidth": 0 } } ], "heatmapgl": [ { "type": "heatmapgl", "colorbar": { "ticks": "", "outlinewidth": 0 } } ], "histogram": [ { "type": "histogram", "marker": { "colorbar": { "ticks": "", "outlinewidth": 0 } } } ], "parcoords": [ { "line": { "colorbar": { "ticks": "", "outlinewidth": 0 } }, "type": "parcoords" } ], "scatter3d": [ { "type": "scatter3d", "marker": { "colorbar": { "ticks": "", "outlinewidth": 0 } } } ], "scattergl": [ { "type": "scattergl", "marker": { "colorbar": { "ticks": "", "outlinewidth": 0 } } } ], "choropleth": [ { "type": "choropleth", "colorbar": { "ticks": "", "outlinewidth": 0 } } ], "scattergeo": [ { "type": "scattergeo", "marker": { "colorbar": { "ticks": "", "outlinewidth": 0 } } } ], "histogram2d": [ { "type": "histogram2d", "colorbar": { "ticks": "", "outlinewidth": 0 }, "autocolorscale": true } ], "scatterpolar": [ { "type": "scatterpolar", "marker": { "colorbar": { "ticks": "", "outlinewidth": 0 } } } ], "contourcarpet": [ { "type": "contourcarpet", "colorbar": { "ticks": "", "outlinewidth": 0 } } ], "scattercarpet": [ { "type": "scattercarpet", "marker": { "colorbar": { "ticks": "", "outlinewidth": 0 } } } ], "scattermapbox": [ { "type": "scattermapbox", "marker": { "colorbar": { "ticks": "", "outlinewidth": 0 } } } ], "scatterpolargl": [ { "type": "scatterpolargl", "marker": { "colorbar": { "ticks": "", "outlinewidth": 0 } } } ], "scatterternary": [ { "type": "scatterternary", "marker": { "colorbar": { "ticks": "", "outlinewidth": 0 } } } ], "histogram2dcontour": [ { "type": "histogram2dcontour", "colorbar": { "ticks": "", "outlinewidth": 0 }, "autocolorscale": true } ] }, "layout": { "geo": { "bgcolor": "white", "showland": true, "lakecolor": "white", "landcolor": "white", "showlakes": true, "subunitcolor": "#C8D4E3" }, "font": { "color": "#2a3f5f" }, "polar": { "bgcolor": "white", "radialaxis": { "ticks": "", "gridcolor": "#EBF0F8", "linecolor": "#EBF0F8" }, "angularaxis": { "ticks": "", "gridcolor": "#EBF0F8", "linecolor": "#EBF0F8" } }, "scene": { "xaxis": { "ticks": "", "gridcolor": "#DFE8F3", "gridwidth": 2, "linecolor": "#EBF0F8", "zerolinecolor": "#EBF0F8", "showbackground": true, "backgroundcolor": "white" }, "yaxis": { "ticks": "", "gridcolor": "#DFE8F3", "gridwidth": 2, "linecolor": "#EBF0F8", "zerolinecolor": "#EBF0F8", "showbackground": true, "backgroundcolor": "white" }, "zaxis": { "ticks": "", "gridcolor": "#DFE8F3", "gridwidth": 2, "linecolor": "#EBF0F8", "zerolinecolor": "#EBF0F8", "showbackground": true, "backgroundcolor": "white" } }, "title": { "x": 0.05 }, "xaxis": { "ticks": "", "gridcolor": "#EBF0F8", "linecolor": "#EBF0F8", "automargin": true, "zerolinecolor": "#EBF0F8", "zerolinewidth": 2 }, "yaxis": { "ticks": "", "gridcolor": "#EBF0F8", "linecolor": "#EBF0F8", "automargin": true, "zerolinecolor": "#EBF0F8", "zerolinewidth": 2 }, "ternary": { "aaxis": { "ticks": "", "gridcolor": "#DFE8F3", "linecolor": "#A2B1C6" }, "baxis": { "ticks": "", "gridcolor": "#DFE8F3", "linecolor": "#A2B1C6" }, "caxis": { "ticks": "", "gridcolor": "#DFE8F3", "linecolor": "#A2B1C6" }, "bgcolor": "white" }, "colorway": [ "#636efa", "#EF553B", "#00cc96", "#ab63fa", "#19d3f3", "#e763fa", "#fecb52", "#ffa15a", "#ff6692", "#b6e880" ], "hovermode": "closest", "colorscale": { "diverging": [ [ 0, "#8e0152" ], [ 0.1, "#c51b7d" ], [ 0.2, "#de77ae" ], [ 0.3, "#f1b6da" ], [ 0.4, "#fde0ef" ], [ 0.5, "#f7f7f7" ], [ 0.6, "#e6f5d0" ], [ 0.7, "#b8e186" ], [ 0.8, "#7fbc41" ], [ 0.9, "#4d9221" ], [ 1, "#276419" ] ], "sequential": [ [ 0, "#0508b8" ], [ 0.0893854748603352, "#1910d8" ], [ 0.1787709497206704, "#3c19f0" ], [ 0.2681564245810056, "#6b1cfb" ], [ 0.3575418994413408, "#981cfd" ], [ 0.44692737430167595, "#bf1cfd" ], [ 0.5363128491620112, "#dd2bfd" ], [ 0.6256983240223464, "#f246fe" ], [ 0.7150837988826816, "#fc67fd" ], [ 0.8044692737430168, "#fe88fc" ], [ 0.8938547486033519, "#fea5fd" ], [ 0.9832402234636871, "#febefe" ], [ 1, "#fec3fe" ] ], "sequentialminus": [ [ 0, "#0508b8" ], [ 0.0893854748603352, "#1910d8" ], [ 0.1787709497206704, "#3c19f0" ], [ 0.2681564245810056, "#6b1cfb" ], [ 0.3575418994413408, "#981cfd" ], [ 0.44692737430167595, "#bf1cfd" ], [ 0.5363128491620112, "#dd2bfd" ], [ 0.6256983240223464, "#f246fe" ], [ 0.7150837988826816, "#fc67fd" ], [ 0.8044692737430168, "#fe88fc" ], [ 0.8938547486033519, "#fea5fd" ], [ 0.9832402234636871, "#febefe" ], [ 1, "#fec3fe" ] ] }, "plot_bgcolor": "white", "paper_bgcolor": "white", "shapedefaults": { "line": { "width": 0 }, "opacity": 0.4, "fillcolor": "#506784" }, "annotationdefaults": { "arrowhead": 0, "arrowcolor": "#506784", "arrowwidth": 1 } }, "themeRef": "PLOTLY_WHITE" }, "showlegend": true } }, "height": null, "width": null, "user": { "profile_url": "https://chart-studio.plotly.com/~FredRam", "avatar_url": "https://storage.googleapis.com/plotly-prod-profiles/54.jpg", "background_url": "https://storage.googleapis.com/plotly-prod-profiles/bg-6.jpg", "bio": "", "nickname": "", "website": "", "stream_tokens": null, "feature_set_id": null, "csrf_token": null, "date_joined": "2025-08-14 03:20:24", "mapbox_access_tokens": null, "has_password": null, "username": "FredRam", "email": null, "is_active": null, "readonly": null, "is_dash_creator": null, "dash_created_count": null, "is_chart_creator": null, "charts_created_count": null } }, { "creation_time": "2025-08-14T08:16:00.956487Z", "comments": { "results": [], "count": 0 }, "parented": true, "embed_url": "https://chart-studio.plotly.com/~FredRam/1.embed", "fid": "FredRam:1", "filename": "Plot 1", "filetype": "plot", "img_url": "https://api.plotly.com/v2/files/FredRam:1/image?image_name=list-thumb", "image_urls": { "default": "https://storage.googleapis.com/plotly-prod-images/FredRam/1/2_JP9S7N9XFZT3DDIAHG8KRKVBPHQI9V.png", "block-thumb": "https://storage.googleapis.com/plotly-prod-images/FredRam/1/8_0FWHJA5C7XIF1YF6ABFCMLQUGUP9AJ.png", "list-thumb": "https://api.plotly.com/v2/files/FredRam:1/image?image_name=list-thumb" }, "api_urls": { "files": "https://api.plotly.com/v2/files/FredRam:1", "plots": "https://api.plotly.com/v2/plots/FredRam:1", "parent": "https://api.plotly.com/v2/folders/home?user=FredRam" }, "owner": "FredRam", "parent": -1, "preview": "", "referencers": [], "references": [], "title": "", "views": 0, "web_url": "https://chart-studio.plotly.com/~FredRam/1/", "world_readable": true, "date_modified": "2025-08-14T08:16:00.967Z", "stars": { "results": [], "count": 0 }, "collaborators": { "results": [], "count": 0 }, "subfolder_count": null, "refresh_interval": null, "organize_view_url": "https://chart-studio.plotly.com/~FredRam/1/", "current_user_permission": "read", "is_theme": null, "is_template": true, "autosize": true, "caption": "", "figure": { "data": [ { "uid": "1da2cb", "line": { "color": "rgb(52, 168, 83)", "width": 3 }, "meta": { "columnNames": { "x": "Torque", "y": "Speed" } }, "mode": "lines", "name": "Torque", "type": "scatter", "xsrc": "FredRam:0:7b41dc", "ysrc": "FredRam:0:3d52d0", "marker": { "line": { "color": "#444", "width": "" }, "size": 6, "color": "#c50131", "symbol": "circle", "opacity": 1, "gradient": { "type": "none" }, "maxdisplayed": 0 }, "opacity": 1, "selected": { "marker": { "opacity": 1 } }, "hoverinfo": "x+y+z+text", "cliponaxis": true, "hoverlabel": { "namelength": 15 }, "showlegend": true, "unselected": { "marker": { "opacity": 0.2 } }, "hovertemplate": "Speed: %{y:.0f}; Torque: %{x:.1f}" }, { "uid": "390e8d", "line": { "color": "rgb(197, 1, 49)", "width": 3 }, "meta": { "columnNames": { "x": "Torque", "y": "Current" } }, "mode": "lines", "name": "Current", "type": "scatter", "xsrc": "FredRam:0:7b41dc", "ysrc": "FredRam:0:a987d0", "yaxis": "y2", "visible": true, "stackgroup": null }, { "uid": "90bcdf", "line": { "color": "rgb(255, 153, 0)", "shape": "spline", "smoothing": 1 }, "meta": { "columnNames": { "x": "Torque", "y": "PowerOut" } }, "mode": "lines", "name": "Power Out", "type": "scatter", "xsrc": "FredRam:0:7b41dc", "ysrc": "FredRam:0:ce663d", "yaxis": "y3", "stackgroup": null }, { "line": { "color": "rgb(153, 0, 255)" }, "meta": { "columnNames": { "x": "Torque", "y": "Efficiency" } }, "mode": "lines", "name": "Efficiency", "type": "scatter", "xsrc": "FredRam:0:7b41dc", "ysrc": "FredRam:0:e0d013", "yaxis": "y4", "stackgroup": null } ], "frames": [], "layout": { "font": { "size": 14, "color": "rgb(73, 73, 73)", "family": "Open Sans" }, "title": { "text": "<b>110-108</b>" }, "xaxis": { "side": "bottom", "type": "linear", "dtick": 0.5, "range": [ 0, 2.6546 ], "tick0": 0, "ticks": "inside", "title": { "text": "<b>Torque</b> [mN·m]" }, "anchor": "y", "domain": [ 0, 0.8 ], "mirror": false, "nticks": 0, "ticklen": 8, "showgrid": true, "showline": true, "tickfont": { "color": "rgb(0, 0, 0)" }, "tickmode": "auto", "autorange": true, "linecolor": "rgb(73, 73, 73)", "linewidth": 2, "tickcolor": "rgb(73, 73, 73)", "tickwidth": 2, "showspikes": false, "rangeslider": { "range": [ 0, 2.6546 ], "yaxis": {}, "yaxis2": {}, "yaxis3": {}, "yaxis4": {}, "visible": false, "autorange": true }, "zerolinecolor": "rgb(73, 73, 73)", "zerolinewidth": 0, "exponentformat": "none" }, "yaxis": { "type": "linear", "dtick": 5000, "range": [ 0, 19235.27947368421 ], "tick0": 0, "ticks": "inside", "title": { "text": "<b>Speed</b> [rpm]" }, "domain": [ 0, 1 ], "nticks": 0, "ticklen": 6, "showgrid": true, "tickmode": "auto", "autorange": true, "gridcolor": "rgb(235, 240, 248)", "rangemode": "tozero", "tickwidth": 2, "exponentformat": "none", "constraintoward": "right" }, "legend": { "x": 1, "y": 1.25, "font": { "size": 14 }, "valign": "top", "xanchor": "right", "yanchor": "top", "borderwidth": 0, "orientation": "h" }, "shapes": [], "yaxis2": { "side": "right", "type": "linear", "dtick": 100, "range": [ 0, 680.4748421052632 ], "tick0": 0, "ticks": "inside", "title": { "text": "<b>Current</b> [mA]" }, "nticks": 0, "ticklen": 6, "showgrid": false, "showline": true, "tickmode": "auto", "autorange": true, "gridcolor": "rgb(235, 240, 248)", "linecolor": "rgb(73, 73, 73)", "linewidth": 2, "rangemode": "tozero", "tickwidth": 2, "overlaying": "y" }, "yaxis3": { "side": "right", "type": "linear", "range": [ 0, 1306.9471347368421 ], "ticks": "inside", "title": { "text": "<b>Power</b> [mW]" }, "anchor": "free", "domain": [ 0, "" ], "nticks": 0, "ticklen": 6, "position": 0.9, "showgrid": false, "showline": true, "autorange": true, "gridcolor": "#EBF0F8", "gridwidth": 1, "linecolor": "rgb(73, 73, 73)", "rangemode": "tozero", "tickwidth": 2, "fixedrange": false, "overlaying": "y" }, "yaxis4": { "side": "right", "type": "linear", "range": [ 0, 68.88705263157895 ], "ticks": "inside", "title": { "text": "<b>Efficiency</b> [%]" }, "anchor": "free", "ticklen": 6, "position": 1, "showgrid": false, "showline": true, "autorange": true, "linecolor": "rgb(73, 73, 73)", "linewidth": 2, "rangemode": "tozero", "tickwidth": 2, "overlaying": "y" }, "modebar": { "orientation": "h" }, "autosize": true, "dragmode": "zoom", "template": { "data": { "bar": [ { "type": "bar", "marker": { "colorbar": { "ticks": "", "outlinewidth": 0 } } } ], "table": [ { "type": "table", "cells": { "fill": { "color": "#EBF0F8" }, "line": { "color": "white" } }, "header": { "fill": { "color": "#C8D4E3" }, "line": { "color": "white" } } } ], "carpet": [ { "type": "carpet", "aaxis": { "gridcolor": "#C8D4E3", "linecolor": "#C8D4E3", "endlinecolor": "#2a3f5f", "minorgridcolor": "#C8D4E3", "startlinecolor": "#2a3f5f" }, "baxis": { "gridcolor": "#C8D4E3", "linecolor": "#C8D4E3", "endlinecolor": "#2a3f5f", "minorgridcolor": "#C8D4E3", "startlinecolor": "#2a3f5f" } } ], "mesh3d": [ { "type": "mesh3d", "colorbar": { "ticks": "", "outlinewidth": 0 } } ], "contour": [ { "type": "contour", "colorbar": { "ticks": "", "outlinewidth": 0 }, "autocolorscale": true } ], "heatmap": [ { "type": "heatmap", "colorbar": { "ticks": "", "outlinewidth": 0 }, "autocolorscale": true } ], "scatter": [ { "type": "scatter", "marker": { "colorbar": { "ticks": "", "outlinewidth": 0 } } } ], "surface": [ { "type": "surface", "colorbar": { "ticks": "", "outlinewidth": 0 } } ], "heatmapgl": [ { "type": "heatmapgl", "colorbar": { "ticks": "", "outlinewidth": 0 } } ], "histogram": [ { "type": "histogram", "marker": { "colorbar": { "ticks": "", "outlinewidth": 0 } } } ], "parcoords": [ { "line": { "colorbar": { "ticks": "", "outlinewidth": 0 } }, "type": "parcoords" } ], "scatter3d": [ { "type": "scatter3d", "marker": { "colorbar": { "ticks": "", "outlinewidth": 0 } } } ], "scattergl": [ { "type": "scattergl", "marker": { "colorbar": { "ticks": "", "outlinewidth": 0 } } } ], "choropleth": [ { "type": "choropleth", "colorbar": { "ticks": "", "outlinewidth": 0 } } ], "scattergeo": [ { "type": "scattergeo", "marker": { "colorbar": { "ticks": "", "outlinewidth": 0 } } } ], "histogram2d": [ { "type": "histogram2d", "colorbar": { "ticks": "", "outlinewidth": 0 }, "autocolorscale": true } ], "scatterpolar": [ { "type": "scatterpolar", "marker": { "colorbar": { "ticks": "", "outlinewidth": 0 } } } ], "contourcarpet": [ { "type": "contourcarpet", "colorbar": { "ticks": "", "outlinewidth": 0 } } ], "scattercarpet": [ { "type": "scattercarpet", "marker": { "colorbar": { "ticks": "", "outlinewidth": 0 } } } ], "scattermapbox": [ { "type": "scattermapbox", "marker": { "colorbar": { "ticks": "", "outlinewidth": 0 } } } ], "scatterpolargl": [ { "type": "scatterpolargl", "marker": { "colorbar": { "ticks": "", "outlinewidth": 0 } } } ], "scatterternary": [ { "type": "scatterternary", "marker": { "colorbar": { "ticks": "", "outlinewidth": 0 } } } ], "histogram2dcontour": [ { "type": "histogram2dcontour", "colorbar": { "ticks": "", "outlinewidth": 0 }, "autocolorscale": true } ] }, "layout": { "geo": { "bgcolor": "white", "showland": true, "lakecolor": "white", "landcolor": "white", "showlakes": true, "subunitcolor": "#C8D4E3" }, "font": { "color": "#2a3f5f" }, "polar": { "bgcolor": "white", "radialaxis": { "ticks": "", "gridcolor": "#EBF0F8", "linecolor": "#EBF0F8" }, "angularaxis": { "ticks": "", "gridcolor": "#EBF0F8", "linecolor": "#EBF0F8" } }, "scene": { "xaxis": { "ticks": "", "gridcolor": "#DFE8F3", "gridwidth": 2, "linecolor": "#EBF0F8", "zerolinecolor": "#EBF0F8", "showbackground": true, "backgroundcolor": "white" }, "yaxis": { "ticks": "", "gridcolor": "#DFE8F3", "gridwidth": 2, "linecolor": "#EBF0F8", "zerolinecolor": "#EBF0F8", "showbackground": true, "backgroundcolor": "white" }, "zaxis": { "ticks": "", "gridcolor": "#DFE8F3", "gridwidth": 2, "linecolor": "#EBF0F8", "zerolinecolor": "#EBF0F8", "showbackground": true, "backgroundcolor": "white" } }, "title": { "x": 0.05 }, "xaxis": { "ticks": "", "gridcolor": "#EBF0F8", "linecolor": "#EBF0F8", "automargin": true, "zerolinecolor": "#EBF0F8", "zerolinewidth": 2 }, "yaxis": { "ticks": "", "gridcolor": "#EBF0F8", "linecolor": "#EBF0F8", "automargin": true, "zerolinecolor": "#EBF0F8", "zerolinewidth": 2 }, "ternary": { "aaxis": { "ticks": "", "gridcolor": "#DFE8F3", "linecolor": "#A2B1C6" }, "baxis": { "ticks": "", "gridcolor": "#DFE8F3", "linecolor": "#A2B1C6" }, "caxis": { "ticks": "", "gridcolor": "#DFE8F3", "linecolor": "#A2B1C6" }, "bgcolor": "white" }, "colorway": [ "#636efa", "#EF553B", "#00cc96", "#ab63fa", "#19d3f3", "#e763fa", "#fecb52", "#ffa15a", "#ff6692", "#b6e880" ], "hovermode": "closest", "colorscale": { "diverging": [ [ 0, "#8e0152" ], [ 0.1, "#c51b7d" ], [ 0.2, "#de77ae" ], [ 0.3, "#f1b6da" ], [ 0.4, "#fde0ef" ], [ 0.5, "#f7f7f7" ], [ 0.6, "#e6f5d0" ], [ 0.7, "#b8e186" ], [ 0.8, "#7fbc41" ], [ 0.9, "#4d9221" ], [ 1, "#276419" ] ], "sequential": [ [ 0, "#0508b8" ], [ 0.0893854748603352, "#1910d8" ], [ 0.1787709497206704, "#3c19f0" ], [ 0.2681564245810056, "#6b1cfb" ], [ 0.3575418994413408, "#981cfd" ], [ 0.44692737430167595, "#bf1cfd" ], [ 0.5363128491620112, "#dd2bfd" ], [ 0.6256983240223464, "#f246fe" ], [ 0.7150837988826816, "#fc67fd" ], [ 0.8044692737430168, "#fe88fc" ], [ 0.8938547486033519, "#fea5fd" ], [ 0.9832402234636871, "#febefe" ], [ 1, "#fec3fe" ] ], "sequentialminus": [ [ 0, "#0508b8" ], [ 0.0893854748603352, "#1910d8" ], [ 0.1787709497206704, "#3c19f0" ], [ 0.2681564245810056, "#6b1cfb" ], [ 0.3575418994413408, "#981cfd" ], [ 0.44692737430167595, "#bf1cfd" ], [ 0.5363128491620112, "#dd2bfd" ], [ 0.6256983240223464, "#f246fe" ], [ 0.7150837988826816, "#fc67fd" ], [ 0.8044692737430168, "#fe88fc" ], [ 0.8938547486033519, "#fea5fd" ], [ 0.9832402234636871, "#febefe" ], [ 1, "#fec3fe" ] ] }, "plot_bgcolor": "white", "paper_bgcolor": "white", "shapedefaults": { "line": { "width": 0 }, "opacity": 0.4, "fillcolor": "#506784" }, "annotationdefaults": { "arrowhead": 0, "arrowcolor": "#506784", "arrowwidth": 1 } }, "themeRef": "PLOTLY_WHITE" }, "showlegend": true } }, "height": null, "width": null, "user": { "profile_url": "https://chart-studio.plotly.com/~FredRam", "avatar_url": "https://storage.googleapis.com/plotly-prod-profiles/54.jpg", "background_url": "https://storage.googleapis.com/plotly-prod-profiles/bg-6.jpg", "bio": "", "nickname": "", "website": "", "stream_tokens": null, "feature_set_id": null, "csrf_token": null, "date_joined": "2025-08-14 03:20:24", "mapbox_access_tokens": null, "has_password": null, "username": "FredRam", "email": null, "is_active": null, "readonly": null, "is_dash_creator": null, "dash_created_count": null, "is_chart_creator": null, "charts_created_count": null } }, { "creation_time": "2025-08-14T08:10:57.888983Z", "comments": { "results": [], "count": 0 }, "parented": true, "embed_url": "https://chart-studio.plotly.com/~RABZSTONE/3.embed", "fid": "RABZSTONE:3", "filename": "Plot 3", "filetype": "plot", "img_url": "https://api.plotly.com/v2/files/RABZSTONE:3/image?image_name=list-thumb", "image_urls": { "default": "https://storage.googleapis.com/plotly-prod-images/RABZSTONE/3/2_SYQV9E9Q3ZG0O64GKTYAUA241UJ79Z.png", "block-thumb": "https://storage.googleapis.com/plotly-prod-images/RABZSTONE/3/8_7I7MBHFXIFBXWWIWXNRZLOIAVURH18.png", "list-thumb": "https://api.plotly.com/v2/files/RABZSTONE:3/image?image_name=list-thumb" }, "api_urls": { "files": "https://api.plotly.com/v2/files/RABZSTONE:3", "plots": "https://api.plotly.com/v2/plots/RABZSTONE:3", "parent": "https://api.plotly.com/v2/folders/home?user=RABZSTONE" }, "owner": "RABZSTONE", "parent": -1, "preview": "", "referencers": [], "references": [], "title": "", "views": 0, "web_url": "https://chart-studio.plotly.com/~RABZSTONE/3/", "world_readable": true, "date_modified": "2025-08-14T08:11:49.781Z", "stars": { "results": [], "count": 0 }, "collaborators": { "results": [], "count": 0 }, "subfolder_count": null, "refresh_interval": null, "organize_view_url": "https://chart-studio.plotly.com/~RABZSTONE/3/", "current_user_permission": "read", "is_theme": null, "is_template": false, "autosize": true, "caption": "", "figure": { "data": [ { "meta": { "columnNames": { "x": "Year - Technology Category", "y": "Technology Category - Key Innovation/Event" } }, "mode": "lines", "type": "bar", "xsrc": "RABZSTONE:2:8bea7a,9316a8*", "ysrc": "RABZSTONE:2:9316a8,0c734b*", "orientation": "v" } ], "frames": [], "layout": { "title": { "text": "Evolution of Technology 2000 - 2025" }, "xaxis": { "type": "multicategory", "range": [ -0.5, 14.5 ], "autorange": true }, "yaxis": { "type": "multicategory", "range": [ -1.5, 28.5 ], "autorange": true }, "autosize": true, "template": { "data": { "bar": [ { "type": "bar", "marker": { "colorbar": { "ticks": "", "outlinewidth": 0 } } } ], "table": [ { "type": "table", "cells": { "fill": { "color": "#EBF0F8" }, "line": { "color": "white" } }, "header": { "fill": { "color": "#C8D4E3" }, "line": { "color": "white" } } } ], "carpet": [ { "type": "carpet", "aaxis": { "gridcolor": "#C8D4E3", "linecolor": "#C8D4E3", "endlinecolor": "#2a3f5f", "minorgridcolor": "#C8D4E3", "startlinecolor": "#2a3f5f" }, "baxis": { "gridcolor": "#C8D4E3", "linecolor": "#C8D4E3", "endlinecolor": "#2a3f5f", "minorgridcolor": "#C8D4E3", "startlinecolor": "#2a3f5f" } } ], "mesh3d": [ { "type": "mesh3d", "colorbar": { "ticks": "", "outlinewidth": 0 } } ], "contour": [ { "type": "contour", "colorbar": { "ticks": "", "outlinewidth": 0 }, "autocolorscale": true } ], "heatmap": [ { "type": "heatmap", "colorbar": { "ticks": "", "outlinewidth": 0 }, "autocolorscale": true } ], "scatter": [ { "type": "scatter", "marker": { "colorbar": { "ticks": "", "outlinewidth": 0 } } } ], "surface": [ { "type": "surface", "colorbar": { "ticks": "", "outlinewidth": 0 } } ], "heatmapgl": [ { "type": "heatmapgl", "colorbar": { "ticks": "", "outlinewidth": 0 } } ], "histogram": [ { "type": "histogram", "marker": { "colorbar": { "ticks": "", "outlinewidth": 0 } } } ], "parcoords": [ { "line": { "colorbar": { "ticks": "", "outlinewidth": 0 } }, "type": "parcoords" } ], "scatter3d": [ { "type": "scatter3d", "marker": { "colorbar": { "ticks": "", "outlinewidth": 0 } } } ], "scattergl": [ { "type": "scattergl", "marker": { "colorbar": { "ticks": "", "outlinewidth": 0 } } } ], "choropleth": [ { "type": "choropleth", "colorbar": { "ticks": "", "outlinewidth": 0 } } ], "scattergeo": [ { "type": "scattergeo", "marker": { "colorbar": { "ticks": "", "outlinewidth": 0 } } } ], "histogram2d": [ { "type": "histogram2d", "colorbar": { "ticks": "", "outlinewidth": 0 }, "autocolorscale": true } ], "scatterpolar": [ { "type": "scatterpolar", "marker": { "colorbar": { "ticks": "", "outlinewidth": 0 } } } ], "contourcarpet": [ { "type": "contourcarpet", "colorbar": { "ticks": "", "outlinewidth": 0 } } ], "scattercarpet": [ { "type": "scattercarpet", "marker": { "colorbar": { "ticks": "", "outlinewidth": 0 } } } ], "scattermapbox": [ { "type": "scattermapbox", "marker": { "colorbar": { "ticks": "", "outlinewidth": 0 } } } ], "scatterpolargl": [ { "type": "scatterpolargl", "marker": { "colorbar": { "ticks": "", "outlinewidth": 0 } } } ], "scatterternary": [ { "type": "scatterternary", "marker": { "colorbar": { "ticks": "", "outlinewidth": 0 } } } ], "histogram2dcontour": [ { "type": "histogram2dcontour", "colorbar": { "ticks": "", "outlinewidth": 0 }, "autocolorscale": true } ] }, "layout": { "geo": { "bgcolor": "white", "showland": true, "lakecolor": "white", "landcolor": "white", "showlakes": true, "subunitcolor": "#C8D4E3" }, "font": { "color": "#2a3f5f" }, "polar": { "bgcolor": "white", "radialaxis": { "ticks": "", "gridcolor": "#EBF0F8", "linecolor": "#EBF0F8" }, "angularaxis": { "ticks": "", "gridcolor": "#EBF0F8", "linecolor": "#EBF0F8" } }, "scene": { "xaxis": { "ticks": "", "gridcolor": "#DFE8F3", "gridwidth": 2, "linecolor": "#EBF0F8", "zerolinecolor": "#EBF0F8", "showbackground": true, "backgroundcolor": "white" }, "yaxis": { "ticks": "", "gridcolor": "#DFE8F3", "gridwidth": 2, "linecolor": "#EBF0F8", "zerolinecolor": "#EBF0F8", "showbackground": true, "backgroundcolor": "white" }, "zaxis": { "ticks": "", "gridcolor": "#DFE8F3", "gridwidth": 2, "linecolor": "#EBF0F8", "zerolinecolor": "#EBF0F8", "showbackground": true, "backgroundcolor": "white" } }, "title": { "x": 0.05 }, "xaxis": { "ticks": "", "gridcolor": "#EBF0F8", "linecolor": "#EBF0F8", "automargin": true, "zerolinecolor": "#EBF0F8", "zerolinewidth": 2 }, "yaxis": { "ticks": "", "gridcolor": "#EBF0F8", "linecolor": "#EBF0F8", "automargin": true, "zerolinecolor": "#EBF0F8", "zerolinewidth": 2 }, "ternary": { "aaxis": { "ticks": "", "gridcolor": "#DFE8F3", "linecolor": "#A2B1C6" }, "baxis": { "ticks": "", "gridcolor": "#DFE8F3", "linecolor": "#A2B1C6" }, "caxis": { "ticks": "", "gridcolor": "#DFE8F3", "linecolor": "#A2B1C6" }, "bgcolor": "white" }, "colorway": [ "#636efa", "#EF553B", "#00cc96", "#ab63fa", "#19d3f3", "#e763fa", "#fecb52", "#ffa15a", "#ff6692", "#b6e880" ], "hovermode": "closest", "colorscale": { "diverging": [ [ 0, "#8e0152" ], [ 0.1, "#c51b7d" ], [ 0.2, "#de77ae" ], [ 0.3, "#f1b6da" ], [ 0.4, "#fde0ef" ], [ 0.5, "#f7f7f7" ], [ 0.6, "#e6f5d0" ], [ 0.7, "#b8e186" ], [ 0.8, "#7fbc41" ], [ 0.9, "#4d9221" ], [ 1, "#276419" ] ], "sequential": [ [ 0, "#0508b8" ], [ 0.0893854748603352, "#1910d8" ], [ 0.1787709497206704, "#3c19f0" ], [ 0.2681564245810056, "#6b1cfb" ], [ 0.3575418994413408, "#981cfd" ], [ 0.44692737430167595, "#bf1cfd" ], [ 0.5363128491620112, "#dd2bfd" ], [ 0.6256983240223464, "#f246fe" ], [ 0.7150837988826816, "#fc67fd" ], [ 0.8044692737430168, "#fe88fc" ], [ 0.8938547486033519, "#fea5fd" ], [ 0.9832402234636871, "#febefe" ], [ 1, "#fec3fe" ] ], "sequentialminus": [ [ 0, "#0508b8" ], [ 0.0893854748603352, "#1910d8" ], [ 0.1787709497206704, "#3c19f0" ], [ 0.2681564245810056, "#6b1cfb" ], [ 0.3575418994413408, "#981cfd" ], [ 0.44692737430167595, "#bf1cfd" ], [ 0.5363128491620112, "#dd2bfd" ], [ 0.6256983240223464, "#f246fe" ], [ 0.7150837988826816, "#fc67fd" ], [ 0.8044692737430168, "#fe88fc" ], [ 0.8938547486033519, "#fea5fd" ], [ 0.9832402234636871, "#febefe" ], [ 1, "#fec3fe" ] ] }, "plot_bgcolor": "white", "paper_bgcolor": "white", "shapedefaults": { "line": { "width": 0 }, "opacity": 0.4, "fillcolor": "#506784" }, "annotationdefaults": { "arrowhead": 0, "arrowcolor": "#506784", "arrowwidth": 1 } }, "themeRef": "PLOTLY_WHITE" } } }, "height": null, "width": null, "user": { "profile_url": "https://chart-studio.plotly.com/~RABZSTONE", "avatar_url": "https://storage.googleapis.com/plotly-prod-profiles/34.jpg", "background_url": "https://storage.googleapis.com/plotly-prod-profiles/bg-12.jpg", "bio": "", "nickname": "", "website": "", "stream_tokens": null, "feature_set_id": null, "csrf_token": null, "date_joined": "2025-08-12 07:27:07", "mapbox_access_tokens": null, "has_password": null, "username": "RABZSTONE", "email": null, "is_active": null, "readonly": null, "is_dash_creator": null, "dash_created_count": null, "is_chart_creator": null, "charts_created_count": null } }, { "creation_time": "2025-08-14T07:30:16.588892Z", "comments": { "results": [], "count": 0 }, "parented": true, "embed_url": "https://chart-studio.plotly.com/~kaushikkotakonda/12.embed", "fid": "kaushikkotakonda:12", "filename": "Plot 12", "filetype": "plot", "img_url": "https://api.plotly.com/v2/files/kaushikkotakonda:12/image?image_name=list-thumb", "image_urls": { "default": "https://storage.googleapis.com/plotly-prod-images/kaushikkotakonda/12/2_I65B1P9BZE1JNQ73KBKDS26MAE9G4I.png", "block-thumb": "https://storage.googleapis.com/plotly-prod-images/kaushikkotakonda/12/8_TBP0IVCAFIB3EIMPPL3LQM77QUPVCX.png", "list-thumb": "https://api.plotly.com/v2/files/kaushikkotakonda:12/image?image_name=list-thumb" }, "api_urls": { "files": "https://api.plotly.com/v2/files/kaushikkotakonda:12", "plots": "https://api.plotly.com/v2/plots/kaushikkotakonda:12", "parent": "https://api.plotly.com/v2/folders/home?user=kaushikkotakonda" }, "owner": "kaushikkotakonda", "parent": -1, "preview": "", "referencers": [], "references": [], "title": "", "views": 0, "web_url": "https://chart-studio.plotly.com/~kaushikkotakonda/12/", "world_readable": true, "date_modified": "2025-08-14T08:27:45.127Z", "stars": { "results": [], "count": 0 }, "collaborators": { "results": [], "count": 0 }, "subfolder_count": null, "refresh_interval": null, "organize_view_url": "https://chart-studio.plotly.com/~kaushikkotakonda/12/", "current_user_permission": "read", "is_theme": null, "is_template": false, "autosize": true, "caption": "", "figure": { "data": [ { "line": { "width": 5 }, "meta": { "columnNames": { "x": "A - E", "y": "F", "text": "", "marker": { "size": "E", "color": "A" } } }, "mode": "markers", "type": "box", "xsrc": "kaushikkotakonda:11:f84b2c,894f2f*", "ysrc": "kaushikkotakonda:11:d23637", "marker": { "meta": { "columnNames": { "size": "E", "color": "A" } }, "sizeref": null, "sizesrc": "kaushikkotakonda:11:894f2f", "colorsrc": "kaushikkotakonda:11:f84b2c", "sizemode": "area" }, "notched": false, "boxpoints": "outliers", "hoverinfo": "x+y", "whiskerwidth": 0.42 } ], "frames": [], "layout": { "font": { "size": 20, "family": "Arial" }, "title": { "text": "Cmax Data obtained in BE Studies TAFA-125-23 and S-25-879" }, "xaxis": { "type": "multicategory", "range": [ 0.5, 4.5 ], "title": { "font": { "size": 24 } }, "autorange": true, "showticklabels": true }, "yaxis": { "type": "linear", "range": [ 1768.8017777777777, 9530.586222222222 ], "title": { "text": "Cmax Distribution" }, "autorange": true }, "boxgap": 0.39, "boxmode": "group", "autosize": true, "dragmode": "zoom", "template": { "data": { "bar": [ { "type": "bar", "marker": { "colorbar": { "ticks": "", "outlinewidth": 0 } } } ], "table": [ { "type": "table", "cells": { "fill": { "color": "#EBF0F8" }, "line": { "color": "white" } }, "header": { "fill": { "color": "#C8D4E3" }, "line": { "color": "white" } } } ], "carpet": [ { "type": "carpet", "aaxis": { "gridcolor": "#C8D4E3", "linecolor": "#C8D4E3", "endlinecolor": "#2a3f5f", "minorgridcolor": "#C8D4E3", "startlinecolor": "#2a3f5f" }, "baxis": { "gridcolor": "#C8D4E3", "linecolor": "#C8D4E3", "endlinecolor": "#2a3f5f", "minorgridcolor": "#C8D4E3", "startlinecolor": "#2a3f5f" } } ], "mesh3d": [ { "type": "mesh3d", "colorbar": { "ticks": "", "outlinewidth": 0 } } ], "contour": [ { "type": "contour", "colorbar": { "ticks": "", "outlinewidth": 0 }, "autocolorscale": true } ], "heatmap": [ { "type": "heatmap", "colorbar": { "ticks": "", "outlinewidth": 0 }, "autocolorscale": true } ], "scatter": [ { "type": "scatter", "marker": { "colorbar": { "ticks": "", "outlinewidth": 0 } } } ], "surface": [ { "type": "surface", "colorbar": { "ticks": "", "outlinewidth": 0 } } ], "heatmapgl": [ { "type": "heatmapgl", "colorbar": { "ticks": "", "outlinewidth": 0 } } ], "histogram": [ { "type": "histogram", "marker": { "colorbar": { "ticks": "", "outlinewidth": 0 } } } ], "parcoords": [ { "line": { "colorbar": { "ticks": "", "outlinewidth": 0 } }, "type": "parcoords" } ], "scatter3d": [ { "type": "scatter3d", "marker": { "colorbar": { "ticks": "", "outlinewidth": 0 } } } ], "scattergl": [ { "type": "scattergl", "marker": { "colorbar": { "ticks": "", "outlinewidth": 0 } } } ], "choropleth": [ { "type": "choropleth", "colorbar": { "ticks": "", "outlinewidth": 0 } } ], "scattergeo": [ { "type": "scattergeo", "marker": { "colorbar": { "ticks": "", "outlinewidth": 0 } } } ], "histogram2d": [ { "type": "histogram2d", "colorbar": { "ticks": "", "outlinewidth": 0 }, "autocolorscale": true } ], "scatterpolar": [ { "type": "scatterpolar", "marker": { "colorbar": { "ticks": "", "outlinewidth": 0 } } } ], "contourcarpet": [ { "type": "contourcarpet", "colorbar": { "ticks": "", "outlinewidth": 0 } } ], "scattercarpet": [ { "type": "scattercarpet", "marker": { "colorbar": { "ticks": "", "outlinewidth": 0 } } } ], "scattermapbox": [ { "type": "scattermapbox", "marker": { "colorbar": { "ticks": "", "outlinewidth": 0 } } } ], "scatterpolargl": [ { "type": "scatterpolargl", "marker": { "colorbar": { "ticks": "", "outlinewidth": 0 } } } ], "scatterternary": [ { "type": "scatterternary", "marker": { "colorbar": { "ticks": "", "outlinewidth": 0 } } } ], "histogram2dcontour": [ { "type": "histogram2dcontour", "colorbar": { "ticks": "", "outlinewidth": 0 }, "autocolorscale": true } ] }, "layout": { "geo": { "bgcolor": "white", "showland": true, "lakecolor": "white", "landcolor": "white", "showlakes": true, "subunitcolor": "#C8D4E3" }, "font": { "color": "#2a3f5f" }, "polar": { "bgcolor": "white", "radialaxis": { "ticks": "", "gridcolor": "#EBF0F8", "linecolor": "#EBF0F8" }, "angularaxis": { "ticks": "", "gridcolor": "#EBF0F8", "linecolor": "#EBF0F8" } }, "scene": { "xaxis": { "ticks": "", "gridcolor": "#DFE8F3", "gridwidth": 2, "linecolor": "#EBF0F8", "zerolinecolor": "#EBF0F8", "showbackground": true, "backgroundcolor": "white" }, "yaxis": { "ticks": "", "gridcolor": "#DFE8F3", "gridwidth": 2, "linecolor": "#EBF0F8", "zerolinecolor": "#EBF0F8", "showbackground": true, "backgroundcolor": "white" }, "zaxis": { "ticks": "", "gridcolor": "#DFE8F3", "gridwidth": 2, "linecolor": "#EBF0F8", "zerolinecolor": "#EBF0F8", "showbackground": true, "backgroundcolor": "white" } }, "title": { "x": 0.05 }, "xaxis": { "ticks": "", "gridcolor": "#EBF0F8", "linecolor": "#EBF0F8", "automargin": true, "zerolinecolor": "#EBF0F8", "zerolinewidth": 2 }, "yaxis": { "ticks": "", "gridcolor": "#EBF0F8", "linecolor": "#EBF0F8", "automargin": true, "zerolinecolor": "#EBF0F8", "zerolinewidth": 2 }, "ternary": { "aaxis": { "ticks": "", "gridcolor": "#DFE8F3", "linecolor": "#A2B1C6" }, "baxis": { "ticks": "", "gridcolor": "#DFE8F3", "linecolor": "#A2B1C6" }, "caxis": { "ticks": "", "gridcolor": "#DFE8F3", "linecolor": "#A2B1C6" }, "bgcolor": "white" }, "colorway": [ "#636efa", "#EF553B", "#00cc96", "#ab63fa", "#19d3f3", "#e763fa", "#fecb52", "#ffa15a", "#ff6692", "#b6e880" ], "hovermode": "closest", "colorscale": { "diverging": [ [ 0, "#8e0152" ], [ 0.1, "#c51b7d" ], [ 0.2, "#de77ae" ], [ 0.3, "#f1b6da" ], [ 0.4, "#fde0ef" ], [ 0.5, "#f7f7f7" ], [ 0.6, "#e6f5d0" ], [ 0.7, "#b8e186" ], [ 0.8, "#7fbc41" ], [ 0.9, "#4d9221" ], [ 1, "#276419" ] ], "sequential": [ [ 0, "#0508b8" ], [ 0.0893854748603352, "#1910d8" ], [ 0.1787709497206704, "#3c19f0" ], [ 0.2681564245810056, "#6b1cfb" ], [ 0.3575418994413408, "#981cfd" ], [ 0.44692737430167595, "#bf1cfd" ], [ 0.5363128491620112, "#dd2bfd" ], [ 0.6256983240223464, "#f246fe" ], [ 0.7150837988826816, "#fc67fd" ], [ 0.8044692737430168, "#fe88fc" ], [ 0.8938547486033519, "#fea5fd" ], [ 0.9832402234636871, "#febefe" ], [ 1, "#fec3fe" ] ], "sequentialminus": [ [ 0, "#0508b8" ], [ 0.0893854748603352, "#1910d8" ], [ 0.1787709497206704, "#3c19f0" ], [ 0.2681564245810056, "#6b1cfb" ], [ 0.3575418994413408, "#981cfd" ], [ 0.44692737430167595, "#bf1cfd" ], [ 0.5363128491620112, "#dd2bfd" ], [ 0.6256983240223464, "#f246fe" ], [ 0.7150837988826816, "#fc67fd" ], [ 0.8044692737430168, "#fe88fc" ], [ 0.8938547486033519, "#fea5fd" ], [ 0.9832402234636871, "#febefe" ], [ 1, "#fec3fe" ] ] }, "plot_bgcolor": "white", "paper_bgcolor": "white", "shapedefaults": { "line": { "width": 0 }, "opacity": 0.4, "fillcolor": "#506784" }, "annotationdefaults": { "arrowhead": 0, "arrowcolor": "#506784", "arrowwidth": 1 } }, "themeRef": "PLOTLY_WHITE" }, "showlegend": false, "boxgroupgap": 0.63, "uniformtext": { "mode": "show" } } }, "height": null, "width": null, "user": { "profile_url": "https://chart-studio.plotly.com/~kaushikkotakonda", "avatar_url": "https://storage.googleapis.com/plotly-prod-profiles/30.jpg", "background_url": "https://storage.googleapis.com/plotly-prod-profiles/bg-3.jpg", "bio": "", "nickname": "", "website": "", "stream_tokens": null, "feature_set_id": null, "csrf_token": null, "date_joined": "2014-09-24 08:28:23", "mapbox_access_tokens": null, "has_password": null, "username": "kaushikkotakonda", "email": null, "is_active": null, "readonly": null, "is_dash_creator": null, "dash_created_count": null, "is_chart_creator": null, "charts_created_count": null } }, { "creation_time": "2025-08-14T06:35:55.738292Z", "comments": { "results": [], "count": 0 }, "parented": true, "embed_url": "https://chart-studio.plotly.com/~trannhuhai/5.embed", "fid": "trannhuhai:5", "filename": "Template _Plot copy", "filetype": "plot", "img_url": "https://storage.googleapis.com/plotly-prod-images/trannhuhai/5/9_27A8ZO79HFWTIYTP8V2XI97Y7VJ73X.png", "image_urls": { "default": "https://storage.googleapis.com/plotly-prod-images/trannhuhai/5/2_Q3MDNKZ56HSV5TXC55LJJ18WM3TJT7.png", "block-thumb": "https://storage.googleapis.com/plotly-prod-images/trannhuhai/5/8_66RPVJR9X97CWEI8HK5A59UCH7148V.png", "list-thumb": "https://storage.googleapis.com/plotly-prod-images/trannhuhai/5/9_27A8ZO79HFWTIYTP8V2XI97Y7VJ73X.png" }, "api_urls": { "files": "https://api.plotly.com/v2/files/trannhuhai:5", "plots": "https://api.plotly.com/v2/plots/trannhuhai:5", "parent": "https://api.plotly.com/v2/folders/home?user=trannhuhai" }, "owner": "trannhuhai", "parent": -1, "preview": "", "referencers": [], "references": [], "title": "", "views": 0, "web_url": "https://chart-studio.plotly.com/~trannhuhai/5/", "world_readable": true, "date_modified": "2025-08-14T06:35:55.749Z", "stars": { "results": [], "count": 0 }, "collaborators": { "results": [], "count": 0 }, "subfolder_count": null, "refresh_interval": null, "organize_view_url": "https://chart-studio.plotly.com/~trannhuhai/5/", "current_user_permission": "read", "is_theme": null, "is_template": true, "autosize": true, "caption": "", "figure": { "data": [ { "meta": { "columnNames": { "x": "", "y": "" } }, "mode": "lines", "name": "Điện áp (V)", "type": "scatter" }, { "meta": { "columnNames": { "x": "", "y": "" } }, "mode": "lines", "name": "Công suất (W)", "type": "scatter", "stackgroup": null }, { "meta": { "columnNames": { "x": "", "y": "" } }, "mode": "lines", "name": "Dòng điện (mA)", "type": "scatter", "stackgroup": null }, { "meta": { "columnNames": { "x": "", "y": "" } }, "mode": "lines", "name": "Tần số (Hz)", "type": "scatter", "stackgroup": null }, { "meta": { "columnNames": { "x": "", "y": "" } }, "mode": "lines", "name": "Nhiệt độ môi trường (*C)", "type": "scatter", "stackgroup": null }, { "meta": { "columnNames": { "x": "", "y": "" } }, "mode": "lines", "name": "Độ ẩm môi trường (%)", "type": "scatter", "stackgroup": null }, { "meta": { "columnNames": { "x": "", "y": "" } }, "mode": "lines", "name": "Áp suất không khí (hPa)", "type": "scatter", "stackgroup": null } ], "frames": [], "layout": { "title": { "text": "Biểu đồ công suất theo thời gian chế độ nấu: " }, "xaxis": { "range": [ 0, 4998 ], "title": { "text": "Thời gian" }, "autorange": true }, "yaxis": { "range": [ 1493.2438888888887, 1494.9661111111113 ], "title": { "text": "Giá trị" }, "autorange": true }, "autosize": true, "template": { "data": { "bar": [ { "type": "bar", "marker": { "colorbar": { "ticks": "", "outlinewidth": 0 } } } ], "table": [ { "type": "table", "cells": { "fill": { "color": "#EBF0F8" }, "line": { "color": "white" } }, "header": { "fill": { "color": "#C8D4E3" }, "line": { "color": "white" } } } ], "carpet": [ { "type": "carpet", "aaxis": { "gridcolor": "#C8D4E3", "linecolor": "#C8D4E3", "endlinecolor": "#2a3f5f", "minorgridcolor": "#C8D4E3", "startlinecolor": "#2a3f5f" }, "baxis": { "gridcolor": "#C8D4E3", "linecolor": "#C8D4E3", "endlinecolor": "#2a3f5f", "minorgridcolor": "#C8D4E3", "startlinecolor": "#2a3f5f" } } ], "mesh3d": [ { "type": "mesh3d", "colorbar": { "ticks": "", "outlinewidth": 0 } } ], "contour": [ { "type": "contour", "colorbar": { "ticks": "", "outlinewidth": 0 }, "autocolorscale": true } ], "heatmap": [ { "type": "heatmap", "colorbar": { "ticks": "", "outlinewidth": 0 }, "autocolorscale": true } ], "scatter": [ { "type": "scatter", "marker": { "colorbar": { "ticks": "", "outlinewidth": 0 } } } ], "surface": [ { "type": "surface", "colorbar": { "ticks": "", "outlinewidth": 0 } } ], "heatmapgl": [ { "type": "heatmapgl", "colorbar": { "ticks": "", "outlinewidth": 0 } } ], "histogram": [ { "type": "histogram", "marker": { "colorbar": { "ticks": "", "outlinewidth": 0 } } } ], "parcoords": [ { "line": { "colorbar": { "ticks": "", "outlinewidth": 0 } }, "type": "parcoords" } ], "scatter3d": [ { "type": "scatter3d", "marker": { "colorbar": { "ticks": "", "outlinewidth": 0 } } } ], "scattergl": [ { "type": "scattergl", "marker": { "colorbar": { "ticks": "", "outlinewidth": 0 } } } ], "choropleth": [ { "type": "choropleth", "colorbar": { "ticks": "", "outlinewidth": 0 } } ], "scattergeo": [ { "type": "scattergeo", "marker": { "colorbar": { "ticks": "", "outlinewidth": 0 } } } ], "histogram2d": [ { "type": "histogram2d", "colorbar": { "ticks": "", "outlinewidth": 0 }, "autocolorscale": true } ], "scatterpolar": [ { "type": "scatterpolar", "marker": { "colorbar": { "ticks": "", "outlinewidth": 0 } } } ], "contourcarpet": [ { "type": "contourcarpet", "colorbar": { "ticks": "", "outlinewidth": 0 } } ], "scattercarpet": [ { "type": "scattercarpet", "marker": { "colorbar": { "ticks": "", "outlinewidth": 0 } } } ], "scattermapbox": [ { "type": "scattermapbox", "marker": { "colorbar": { "ticks": "", "outlinewidth": 0 } } } ], "scatterpolargl": [ { "type": "scatterpolargl", "marker": { "colorbar": { "ticks": "", "outlinewidth": 0 } } } ], "scatterternary": [ { "type": "scatterternary", "marker": { "colorbar": { "ticks": "", "outlinewidth": 0 } } } ], "histogram2dcontour": [ { "type": "histogram2dcontour", "colorbar": { "ticks": "", "outlinewidth": 0 }, "autocolorscale": true } ] }, "layout": { "geo": { "bgcolor": "white", "showland": true, "lakecolor": "white", "landcolor": "white", "showlakes": true, "subunitcolor": "#C8D4E3" }, "font": { "color": "#2a3f5f" }, "polar": { "bgcolor": "white", "radialaxis": { "ticks": "", "gridcolor": "#EBF0F8", "linecolor": "#EBF0F8" }, "angularaxis": { "ticks": "", "gridcolor": "#EBF0F8", "linecolor": "#EBF0F8" } }, "scene": { "xaxis": { "ticks": "", "gridcolor": "#DFE8F3", "gridwidth": 2, "linecolor": "#EBF0F8", "zerolinecolor": "#EBF0F8", "showbackground": true, "backgroundcolor": "white" }, "yaxis": { "ticks": "", "gridcolor": "#DFE8F3", "gridwidth": 2, "linecolor": "#EBF0F8", "zerolinecolor": "#EBF0F8", "showbackground": true, "backgroundcolor": "white" }, "zaxis": { "ticks": "", "gridcolor": "#DFE8F3", "gridwidth": 2, "linecolor": "#EBF0F8", "zerolinecolor": "#EBF0F8", "showbackground": true, "backgroundcolor": "white" } }, "title": { "x": 0.05 }, "xaxis": { "ticks": "", "gridcolor": "#EBF0F8", "linecolor": "#EBF0F8", "automargin": true, "zerolinecolor": "#EBF0F8", "zerolinewidth": 2 }, "yaxis": { "ticks": "", "gridcolor": "#EBF0F8", "linecolor": "#EBF0F8", "automargin": true, "zerolinecolor": "#EBF0F8", "zerolinewidth": 2 }, "ternary": { "aaxis": { "ticks": "", "gridcolor": "#DFE8F3", "linecolor": "#A2B1C6" }, "baxis": { "ticks": "", "gridcolor": "#DFE8F3", "linecolor": "#A2B1C6" }, "caxis": { "ticks": "", "gridcolor": "#DFE8F3", "linecolor": "#A2B1C6" }, "bgcolor": "white" }, "colorway": [ "#636efa", "#EF553B", "#00cc96", "#ab63fa", "#19d3f3", "#e763fa", "#fecb52", "#ffa15a", "#ff6692", "#b6e880" ], "hovermode": "closest", "colorscale": { "diverging": [ [ 0, "#8e0152" ], [ 0.1, "#c51b7d" ], [ 0.2, "#de77ae" ], [ 0.3, "#f1b6da" ], [ 0.4, "#fde0ef" ], [ 0.5, "#f7f7f7" ], [ 0.6, "#e6f5d0" ], [ 0.7, "#b8e186" ], [ 0.8, "#7fbc41" ], [ 0.9, "#4d9221" ], [ 1, "#276419" ] ], "sequential": [ [ 0, "#0508b8" ], [ 0.0893854748603352, "#1910d8" ], [ 0.1787709497206704, "#3c19f0" ], [ 0.2681564245810056, "#6b1cfb" ], [ 0.3575418994413408, "#981cfd" ], [ 0.44692737430167595, "#bf1cfd" ], [ 0.5363128491620112, "#dd2bfd" ], [ 0.6256983240223464, "#f246fe" ], [ 0.7150837988826816, "#fc67fd" ], [ 0.8044692737430168, "#fe88fc" ], [ 0.8938547486033519, "#fea5fd" ], [ 0.9832402234636871, "#febefe" ], [ 1, "#fec3fe" ] ], "sequentialminus": [ [ 0, "#0508b8" ], [ 0.0893854748603352, "#1910d8" ], [ 0.1787709497206704, "#3c19f0" ], [ 0.2681564245810056, "#6b1cfb" ], [ 0.3575418994413408, "#981cfd" ], [ 0.44692737430167595, "#bf1cfd" ], [ 0.5363128491620112, "#dd2bfd" ], [ 0.6256983240223464, "#f246fe" ], [ 0.7150837988826816, "#fc67fd" ], [ 0.8044692737430168, "#fe88fc" ], [ 0.8938547486033519, "#fea5fd" ], [ 0.9832402234636871, "#febefe" ], [ 1, "#fec3fe" ] ] }, "plot_bgcolor": "white", "paper_bgcolor": "white", "shapedefaults": { "line": { "width": 0 }, "opacity": 0.4, "fillcolor": "#506784" }, "annotationdefaults": { "arrowhead": 0, "arrowcolor": "#506784", "arrowwidth": 1 } }, "themeRef": "PLOTLY_WHITE" }, "hovermode": "x" } }, "height": null, "width": null, "user": { "profile_url": "https://chart-studio.plotly.com/~trannhuhai", "avatar_url": "https://storage.googleapis.com/plotly-prod-profiles/87.jpg", "background_url": "https://storage.googleapis.com/plotly-prod-profiles/bg-1.jpg", "bio": "", "nickname": "", "website": "", "stream_tokens": null, "feature_set_id": null, "csrf_token": null, "date_joined": "2025-08-14 05:31:14", "mapbox_access_tokens": null, "has_password": null, "username": "trannhuhai", "email": null, "is_active": null, "readonly": null, "is_dash_creator": null, "dash_created_count": null, "is_chart_creator": null, "charts_created_count": null } }, { "creation_time": "2025-08-14T06:30:23.022144Z", "comments": { "results": [], "count": 0 }, "parented": true, "embed_url": "https://chart-studio.plotly.com/~trannhuhai/3.embed", "fid": "trannhuhai:3", "filename": "Template _Plot", "filetype": "plot", "img_url": "https://api.plotly.com/v2/files/trannhuhai:3/image?image_name=list-thumb", "image_urls": { "default": "https://storage.googleapis.com/plotly-prod-images/trannhuhai/3/2_QN2G3F1PYBY7NAFYU5JBTC1WZM9F99.png", "block-thumb": "https://storage.googleapis.com/plotly-prod-images/trannhuhai/3/8_ADKHOML74M3ABJ3R5QDRHX4TFKJE2Y.png", "list-thumb": "https://api.plotly.com/v2/files/trannhuhai:3/image?image_name=list-thumb" }, "api_urls": { "files": "https://api.plotly.com/v2/files/trannhuhai:3", "plots": "https://api.plotly.com/v2/plots/trannhuhai:3", "parent": "https://api.plotly.com/v2/folders/home?user=trannhuhai" }, "owner": "trannhuhai", "parent": -1, "preview": "", "referencers": [], "references": [], "title": "", "views": 1, "web_url": "https://chart-studio.plotly.com/~trannhuhai/3/", "world_readable": true, "date_modified": "2025-08-14T06:35:40.380Z", "stars": { "results": [], "count": 0 }, "collaborators": { "results": [], "count": 0 }, "subfolder_count": null, "refresh_interval": null, "organize_view_url": "https://chart-studio.plotly.com/~trannhuhai/3/", "current_user_permission": "read", "is_theme": null, "is_template": true, "autosize": true, "caption": "", "figure": { "data": [ { "meta": { "columnNames": { "x": "", "y": "" } }, "mode": "lines", "name": "Điện áp (V)", "type": "scatter" }, { "meta": { "columnNames": { "x": "", "y": "" } }, "mode": "lines", "name": "Công suất (W)", "type": "scatter", "stackgroup": null }, { "meta": { "columnNames": { "x": "", "y": "" } }, "mode": "lines", "name": "Dòng điện (mA)", "type": "scatter", "stackgroup": null }, { "meta": { "columnNames": { "x": "", "y": "" } }, "mode": "lines", "name": "Tần số (Hz)", "type": "scatter", "stackgroup": null }, { "meta": { "columnNames": { "x": "", "y": "" } }, "mode": "lines", "name": "Nhiệt độ môi trường (*C)", "type": "scatter", "stackgroup": null }, { "meta": { "columnNames": { "x": "", "y": "" } }, "mode": "lines", "name": "Độ ẩm môi trường (%)", "type": "scatter", "stackgroup": null }, { "meta": { "columnNames": { "x": "", "y": "" } }, "mode": "lines", "name": "Áp suất không khí (hPa)", "type": "scatter", "stackgroup": null } ], "frames": [], "layout": { "title": { "text": "Biểu đồ công suất theo thời gian chế độ nấu: " }, "xaxis": { "range": [ 0, 4998 ], "title": { "text": "Thời gian" }, "autorange": true }, "yaxis": { "range": [ 1493.2438888888887, 1494.9661111111113 ], "title": { "text": "Giá trị" }, "autorange": true }, "autosize": true, "template": { "data": { "bar": [ { "type": "bar", "marker": { "colorbar": { "ticks": "", "outlinewidth": 0 } } } ], "table": [ { "type": "table", "cells": { "fill": { "color": "#EBF0F8" }, "line": { "color": "white" } }, "header": { "fill": { "color": "#C8D4E3" }, "line": { "color": "white" } } } ], "carpet": [ { "type": "carpet", "aaxis": { "gridcolor": "#C8D4E3", "linecolor": "#C8D4E3", "endlinecolor": "#2a3f5f", "minorgridcolor": "#C8D4E3", "startlinecolor": "#2a3f5f" }, "baxis": { "gridcolor": "#C8D4E3", "linecolor": "#C8D4E3", "endlinecolor": "#2a3f5f", "minorgridcolor": "#C8D4E3", "startlinecolor": "#2a3f5f" } } ], "mesh3d": [ { "type": "mesh3d", "colorbar": { "ticks": "", "outlinewidth": 0 } } ], "contour": [ { "type": "contour", "colorbar": { "ticks": "", "outlinewidth": 0 }, "autocolorscale": true } ], "heatmap": [ { "type": "heatmap", "colorbar": { "ticks": "", "outlinewidth": 0 }, "autocolorscale": true } ], "scatter": [ { "type": "scatter", "marker": { "colorbar": { "ticks": "", "outlinewidth": 0 } } } ], "surface": [ { "type": "surface", "colorbar": { "ticks": "", "outlinewidth": 0 } } ], "heatmapgl": [ { "type": "heatmapgl", "colorbar": { "ticks": "", "outlinewidth": 0 } } ], "histogram": [ { "type": "histogram", "marker": { "colorbar": { "ticks": "", "outlinewidth": 0 } } } ], "parcoords": [ { "line": { "colorbar": { "ticks": "", "outlinewidth": 0 } }, "type": "parcoords" } ], "scatter3d": [ { "type": "scatter3d", "marker": { "colorbar": { "ticks": "", "outlinewidth": 0 } } } ], "scattergl": [ { "type": "scattergl", "marker": { "colorbar": { "ticks": "", "outlinewidth": 0 } } } ], "choropleth": [ { "type": "choropleth", "colorbar": { "ticks": "", "outlinewidth": 0 } } ], "scattergeo": [ { "type": "scattergeo", "marker": { "colorbar": { "ticks": "", "outlinewidth": 0 } } } ], "histogram2d": [ { "type": "histogram2d", "colorbar": { "ticks": "", "outlinewidth": 0 }, "autocolorscale": true } ], "scatterpolar": [ { "type": "scatterpolar", "marker": { "colorbar": { "ticks": "", "outlinewidth": 0 } } } ], "contourcarpet": [ { "type": "contourcarpet", "colorbar": { "ticks": "", "outlinewidth": 0 } } ], "scattercarpet": [ { "type": "scattercarpet", "marker": { "colorbar": { "ticks": "", "outlinewidth": 0 } } } ], "scattermapbox": [ { "type": "scattermapbox", "marker": { "colorbar": { "ticks": "", "outlinewidth": 0 } } } ], "scatterpolargl": [ { "type": "scatterpolargl", "marker": { "colorbar": { "ticks": "", "outlinewidth": 0 } } } ], "scatterternary": [ { "type": "scatterternary", "marker": { "colorbar": { "ticks": "", "outlinewidth": 0 } } } ], "histogram2dcontour": [ { "type": "histogram2dcontour", "colorbar": { "ticks": "", "outlinewidth": 0 }, "autocolorscale": true } ] }, "layout": { "geo": { "bgcolor": "white", "showland": true, "lakecolor": "white", "landcolor": "white", "showlakes": true, "subunitcolor": "#C8D4E3" }, "font": { "color": "#2a3f5f" }, "polar": { "bgcolor": "white", "radialaxis": { "ticks": "", "gridcolor": "#EBF0F8", "linecolor": "#EBF0F8" }, "angularaxis": { "ticks": "", "gridcolor": "#EBF0F8", "linecolor": "#EBF0F8" } }, "scene": { "xaxis": { "ticks": "", "gridcolor": "#DFE8F3", "gridwidth": 2, "linecolor": "#EBF0F8", "zerolinecolor": "#EBF0F8", "showbackground": true, "backgroundcolor": "white" }, "yaxis": { "ticks": "", "gridcolor": "#DFE8F3", "gridwidth": 2, "linecolor": "#EBF0F8", "zerolinecolor": "#EBF0F8", "showbackground": true, "backgroundcolor": "white" }, "zaxis": { "ticks": "", "gridcolor": "#DFE8F3", "gridwidth": 2, "linecolor": "#EBF0F8", "zerolinecolor": "#EBF0F8", "showbackground": true, "backgroundcolor": "white" } }, "title": { "x": 0.05 }, "xaxis": { "ticks": "", "gridcolor": "#EBF0F8", "linecolor": "#EBF0F8", "automargin": true, "zerolinecolor": "#EBF0F8", "zerolinewidth": 2 }, "yaxis": { "ticks": "", "gridcolor": "#EBF0F8", "linecolor": "#EBF0F8", "automargin": true, "zerolinecolor": "#EBF0F8", "zerolinewidth": 2 }, "ternary": { "aaxis": { "ticks": "", "gridcolor": "#DFE8F3", "linecolor": "#A2B1C6" }, "baxis": { "ticks": "", "gridcolor": "#DFE8F3", "linecolor": "#A2B1C6" }, "caxis": { "ticks": "", "gridcolor": "#DFE8F3", "linecolor": "#A2B1C6" }, "bgcolor": "white" }, "colorway": [ "#636efa", "#EF553B", "#00cc96", "#ab63fa", "#19d3f3", "#e763fa", "#fecb52", "#ffa15a", "#ff6692", "#b6e880" ], "hovermode": "closest", "colorscale": { "diverging": [ [ 0, "#8e0152" ], [ 0.1, "#c51b7d" ], [ 0.2, "#de77ae" ], [ 0.3, "#f1b6da" ], [ 0.4, "#fde0ef" ], [ 0.5, "#f7f7f7" ], [ 0.6, "#e6f5d0" ], [ 0.7, "#b8e186" ], [ 0.8, "#7fbc41" ], [ 0.9, "#4d9221" ], [ 1, "#276419" ] ], "sequential": [ [ 0, "#0508b8" ], [ 0.0893854748603352, "#1910d8" ], [ 0.1787709497206704, "#3c19f0" ], [ 0.2681564245810056, "#6b1cfb" ], [ 0.3575418994413408, "#981cfd" ], [ 0.44692737430167595, "#bf1cfd" ], [ 0.5363128491620112, "#dd2bfd" ], [ 0.6256983240223464, "#f246fe" ], [ 0.7150837988826816, "#fc67fd" ], [ 0.8044692737430168, "#fe88fc" ], [ 0.8938547486033519, "#fea5fd" ], [ 0.9832402234636871, "#febefe" ], [ 1, "#fec3fe" ] ], "sequentialminus": [ [ 0, "#0508b8" ], [ 0.0893854748603352, "#1910d8" ], [ 0.1787709497206704, "#3c19f0" ], [ 0.2681564245810056, "#6b1cfb" ], [ 0.3575418994413408, "#981cfd" ], [ 0.44692737430167595, "#bf1cfd" ], [ 0.5363128491620112, "#dd2bfd" ], [ 0.6256983240223464, "#f246fe" ], [ 0.7150837988826816, "#fc67fd" ], [ 0.8044692737430168, "#fe88fc" ], [ 0.8938547486033519, "#fea5fd" ], [ 0.9832402234636871, "#febefe" ], [ 1, "#fec3fe" ] ] }, "plot_bgcolor": "white", "paper_bgcolor": "white", "shapedefaults": { "line": { "width": 0 }, "opacity": 0.4, "fillcolor": "#506784" }, "annotationdefaults": { "arrowhead": 0, "arrowcolor": "#506784", "arrowwidth": 1 } }, "themeRef": "PLOTLY_WHITE" }, "hovermode": "x" } }, "height": null, "width": null, "user": { "profile_url": "https://chart-studio.plotly.com/~trannhuhai", "avatar_url": "https://storage.googleapis.com/plotly-prod-profiles/87.jpg", "background_url": "https://storage.googleapis.com/plotly-prod-profiles/bg-1.jpg", "bio": "", "nickname": "", "website": "", "stream_tokens": null, "feature_set_id": null, "csrf_token": null, "date_joined": "2025-08-14 05:31:14", "mapbox_access_tokens": null, "has_password": null, "username": "trannhuhai", "email": null, "is_active": null, "readonly": null, "is_dash_creator": null, "dash_created_count": null, "is_chart_creator": null, "charts_created_count": null } }, { "creation_time": "2025-08-14T06:14:15.324017Z", "comments": { "results": [], "count": 0 }, "parented": true, "embed_url": "https://chart-studio.plotly.com/~brukmars/2.embed", "fid": "brukmars:2", "filename": "Plot 2", "filetype": "plot", "img_url": "https://api.plotly.com/v2/files/brukmars:2/image?image_name=list-thumb", "image_urls": { "default": "https://storage.googleapis.com/plotly-prod-images/brukmars/2/2_EF8YYKQMJL34866WUA241XH30C4SF7.png", "block-thumb": "https://storage.googleapis.com/plotly-prod-images/brukmars/2/8_UCH0YAWA7FI6T8O562V6NMSWOVN9X9.png", "list-thumb": "https://api.plotly.com/v2/files/brukmars:2/image?image_name=list-thumb" }, "api_urls": { "files": "https://api.plotly.com/v2/files/brukmars:2", "plots": "https://api.plotly.com/v2/plots/brukmars:2", "parent": "https://api.plotly.com/v2/folders/home?user=brukmars" }, "owner": "brukmars", "parent": -1, "preview": "", "referencers": [], "references": [], "title": "", "views": 1, "web_url": "https://chart-studio.plotly.com/~brukmars/2/", "world_readable": true, "date_modified": "2025-08-14T06:14:15.334Z", "stars": { "results": [], "count": 0 }, "collaborators": { "results": [], "count": 0 }, "subfolder_count": null, "refresh_interval": null, "organize_view_url": "https://chart-studio.plotly.com/~brukmars/2/", "current_user_permission": "read", "is_theme": null, "is_template": false, "autosize": true, "caption": "", "figure": { "data": [ { "meta": { "columnNames": { "ids": "Catagory", "labels": "Count", "values": "Channel", "parents": "Catagory" } }, "mode": "markers", "type": "sunburst", "idssrc": "brukmars:1:4f2bbc", "labelssrc": "brukmars:1:8dba9e", "valuessrc": "brukmars:1:6405e2", "parentssrc": "brukmars:1:4f2bbc", "branchvalues": "total" } ], "frames": [], "layout": { "title": { "text": "new" }, "xaxis": { "range": [ -1, 6 ], "autorange": true }, "yaxis": { "range": [ -1, 4 ], "autorange": true }, "autosize": true, "template": { "data": { "bar": [ { "type": "bar", "marker": { "colorbar": { "ticks": "", "outlinewidth": 0 } } } ], "table": [ { "type": "table", "cells": { "fill": { "color": "#EBF0F8" }, "line": { "color": "white" } }, "header": { "fill": { "color": "#C8D4E3" }, "line": { "color": "white" } } } ], "carpet": [ { "type": "carpet", "aaxis": { "gridcolor": "#C8D4E3", "linecolor": "#C8D4E3", "endlinecolor": "#2a3f5f", "minorgridcolor": "#C8D4E3", "startlinecolor": "#2a3f5f" }, "baxis": { "gridcolor": "#C8D4E3", "linecolor": "#C8D4E3", "endlinecolor": "#2a3f5f", "minorgridcolor": "#C8D4E3", "startlinecolor": "#2a3f5f" } } ], "mesh3d": [ { "type": "mesh3d", "colorbar": { "ticks": "", "outlinewidth": 0 } } ], "contour": [ { "type": "contour", "colorbar": { "ticks": "", "outlinewidth": 0 }, "autocolorscale": true } ], "heatmap": [ { "type": "heatmap", "colorbar": { "ticks": "", "outlinewidth": 0 }, "autocolorscale": true } ], "scatter": [ { "type": "scatter", "marker": { "colorbar": { "ticks": "", "outlinewidth": 0 } } } ], "surface": [ { "type": "surface", "colorbar": { "ticks": "", "outlinewidth": 0 } } ], "heatmapgl": [ { "type": "heatmapgl", "colorbar": { "ticks": "", "outlinewidth": 0 } } ], "histogram": [ { "type": "histogram", "marker": { "colorbar": { "ticks": "", "outlinewidth": 0 } } } ], "parcoords": [ { "line": { "colorbar": { "ticks": "", "outlinewidth": 0 } }, "type": "parcoords" } ], "scatter3d": [ { "type": "scatter3d", "marker": { "colorbar": { "ticks": "", "outlinewidth": 0 } } } ], "scattergl": [ { "type": "scattergl", "marker": { "colorbar": { "ticks": "", "outlinewidth": 0 } } } ], "choropleth": [ { "type": "choropleth", "colorbar": { "ticks": "", "outlinewidth": 0 } } ], "scattergeo": [ { "type": "scattergeo", "marker": { "colorbar": { "ticks": "", "outlinewidth": 0 } } } ], "histogram2d": [ { "type": "histogram2d", "colorbar": { "ticks": "", "outlinewidth": 0 }, "autocolorscale": true } ], "scatterpolar": [ { "type": "scatterpolar", "marker": { "colorbar": { "ticks": "", "outlinewidth": 0 } } } ], "contourcarpet": [ { "type": "contourcarpet", "colorbar": { "ticks": "", "outlinewidth": 0 } } ], "scattercarpet": [ { "type": "scattercarpet", "marker": { "colorbar": { "ticks": "", "outlinewidth": 0 } } } ], "scattermapbox": [ { "type": "scattermapbox", "marker": { "colorbar": { "ticks": "", "outlinewidth": 0 } } } ], "scatterpolargl": [ { "type": "scatterpolargl", "marker": { "colorbar": { "ticks": "", "outlinewidth": 0 } } } ], "scatterternary": [ { "type": "scatterternary", "marker": { "colorbar": { "ticks": "", "outlinewidth": 0 } } } ], "histogram2dcontour": [ { "type": "histogram2dcontour", "colorbar": { "ticks": "", "outlinewidth": 0 }, "autocolorscale": true } ] }, "layout": { "geo": { "bgcolor": "white", "showland": true, "lakecolor": "white", "landcolor": "white", "showlakes": true, "subunitcolor": "#C8D4E3" }, "font": { "color": "#2a3f5f" }, "polar": { "bgcolor": "white", "radialaxis": { "ticks": "", "gridcolor": "#EBF0F8", "linecolor": "#EBF0F8" }, "angularaxis": { "ticks": "", "gridcolor": "#EBF0F8", "linecolor": "#EBF0F8" } }, "scene": { "xaxis": { "ticks": "", "gridcolor": "#DFE8F3", "gridwidth": 2, "linecolor": "#EBF0F8", "zerolinecolor": "#EBF0F8", "showbackground": true, "backgroundcolor": "white" }, "yaxis": { "ticks": "", "gridcolor": "#DFE8F3", "gridwidth": 2, "linecolor": "#EBF0F8", "zerolinecolor": "#EBF0F8", "showbackground": true, "backgroundcolor": "white" }, "zaxis": { "ticks": "", "gridcolor": "#DFE8F3", "gridwidth": 2, "linecolor": "#EBF0F8", "zerolinecolor": "#EBF0F8", "showbackground": true, "backgroundcolor": "white" } }, "title": { "x": 0.05 }, "xaxis": { "ticks": "", "gridcolor": "#EBF0F8", "linecolor": "#EBF0F8", "automargin": true, "zerolinecolor": "#EBF0F8", "zerolinewidth": 2 }, "yaxis": { "ticks": "", "gridcolor": "#EBF0F8", "linecolor": "#EBF0F8", "automargin": true, "zerolinecolor": "#EBF0F8", "zerolinewidth": 2 }, "ternary": { "aaxis": { "ticks": "", "gridcolor": "#DFE8F3", "linecolor": "#A2B1C6" }, "baxis": { "ticks": "", "gridcolor": "#DFE8F3", "linecolor": "#A2B1C6" }, "caxis": { "ticks": "", "gridcolor": "#DFE8F3", "linecolor": "#A2B1C6" }, "bgcolor": "white" }, "colorway": [ "#636efa", "#EF553B", "#00cc96", "#ab63fa", "#19d3f3", "#e763fa", "#fecb52", "#ffa15a", "#ff6692", "#b6e880" ], "hovermode": "closest", "colorscale": { "diverging": [ [ 0, "#8e0152" ], [ 0.1, "#c51b7d" ], [ 0.2, "#de77ae" ], [ 0.3, "#f1b6da" ], [ 0.4, "#fde0ef" ], [ 0.5, "#f7f7f7" ], [ 0.6, "#e6f5d0" ], [ 0.7, "#b8e186" ], [ 0.8, "#7fbc41" ], [ 0.9, "#4d9221" ], [ 1, "#276419" ] ], "sequential": [ [ 0, "#0508b8" ], [ 0.0893854748603352, "#1910d8" ], [ 0.1787709497206704, "#3c19f0" ], [ 0.2681564245810056, "#6b1cfb" ], [ 0.3575418994413408, "#981cfd" ], [ 0.44692737430167595, "#bf1cfd" ], [ 0.5363128491620112, "#dd2bfd" ], [ 0.6256983240223464, "#f246fe" ], [ 0.7150837988826816, "#fc67fd" ], [ 0.8044692737430168, "#fe88fc" ], [ 0.8938547486033519, "#fea5fd" ], [ 0.9832402234636871, "#febefe" ], [ 1, "#fec3fe" ] ], "sequentialminus": [ [ 0, "#0508b8" ], [ 0.0893854748603352, "#1910d8" ], [ 0.1787709497206704, "#3c19f0" ], [ 0.2681564245810056, "#6b1cfb" ], [ 0.3575418994413408, "#981cfd" ], [ 0.44692737430167595, "#bf1cfd" ], [ 0.5363128491620112, "#dd2bfd" ], [ 0.6256983240223464, "#f246fe" ], [ 0.7150837988826816, "#fc67fd" ], [ 0.8044692737430168, "#fe88fc" ], [ 0.8938547486033519, "#fea5fd" ], [ 0.9832402234636871, "#febefe" ], [ 1, "#fec3fe" ] ] }, "plot_bgcolor": "white", "paper_bgcolor": "white", "shapedefaults": { "line": { "width": 0 }, "opacity": 0.4, "fillcolor": "#506784" }, "annotationdefaults": { "arrowhead": 0, "arrowcolor": "#506784", "arrowwidth": 1 } }, "themeRef": "PLOTLY_WHITE" } } }, "height": null, "width": null, "user": { "profile_url": "https://chart-studio.plotly.com/~brukmars", "avatar_url": "https://storage.googleapis.com/plotly-prod-profiles/76.jpg", "background_url": "https://storage.googleapis.com/plotly-prod-profiles/bg-14.jpg", "bio": "", "nickname": "", "website": "", "stream_tokens": null, "feature_set_id": null, "csrf_token": null, "date_joined": "2025-08-14 06:11:41", "mapbox_access_tokens": null, "has_password": null, "username": "brukmars", "email": null, "is_active": null, "readonly": null, "is_dash_creator": null, "dash_created_count": null, "is_chart_creator": null, "charts_created_count": null } }, { "creation_time": "2025-08-14T05:59:50.822000Z", "comments": { "results": [], "count": 0 }, "parented": true, "embed_url": "https://chart-studio.plotly.com/~achieng/1.embed", "fid": "achieng:1", "filename": "Plot 1", "filetype": "plot", "img_url": "https://api.plotly.com/v2/files/achieng:1/image?image_name=list-thumb", "image_urls": { "default": "https://storage.googleapis.com/plotly-prod-images/achieng/1/2_FEMHA4HSTEH7LI8717SASWCRKXIS04.png", "block-thumb": "https://storage.googleapis.com/plotly-prod-images/achieng/1/8_UDXGE1F8ZEDPXRXE43IM8VIIBC6NSP.png", "list-thumb": "https://api.plotly.com/v2/files/achieng:1/image?image_name=list-thumb" }, "api_urls": { "files": "https://api.plotly.com/v2/files/achieng:1", "plots": "https://api.plotly.com/v2/plots/achieng:1", "parent": "https://api.plotly.com/v2/folders/home?user=achieng" }, "owner": "achieng", "parent": -1, "preview": "", "referencers": [], "references": [], "title": "", "views": 0, "web_url": "https://chart-studio.plotly.com/~achieng/1/", "world_readable": true, "date_modified": "2025-08-14T06:22:57.326Z", "stars": { "results": [], "count": 0 }, "collaborators": { "results": [], "count": 0 }, "subfolder_count": null, "refresh_interval": null, "organize_view_url": "https://chart-studio.plotly.com/~achieng/1/", "current_user_permission": "read", "is_theme": null, "is_template": false, "autosize": true, "caption": "", "figure": { "data": [ { "meta": { "columnNames": { "r": "Yagi_dB", "theta": "Theta_deg" } }, "rsrc": "achieng:0:ef322a", "type": "scatterpolar", "subplot": "polar", "thetasrc": "achieng:0:0b5d9e", "thetaunit": "degrees" } ], "frames": [], "layout": { "polar": { "radialaxis": { "type": "linear", "range": [ -27.771428571428572, 0 ], "autorange": true }, "angularaxis": { "type": "linear" } }, "title": { "text": "YAGI ANTENNA RADIATION PATTERN" }, "xaxis": { "range": [ -1, 6 ], "autorange": true }, "yaxis": { "range": [ -1, 4 ], "autorange": true }, "autosize": true, "template": { "data": { "bar": [ { "type": "bar", "marker": { "colorbar": { "ticks": "", "outlinewidth": 0 } } } ], "table": [ { "type": "table", "cells": { "fill": { "color": "#EBF0F8" }, "line": { "color": "white" } }, "header": { "fill": { "color": "#C8D4E3" }, "line": { "color": "white" } } } ], "carpet": [ { "type": "carpet", "aaxis": { "gridcolor": "#C8D4E3", "linecolor": "#C8D4E3", "endlinecolor": "#2a3f5f", "minorgridcolor": "#C8D4E3", "startlinecolor": "#2a3f5f" }, "baxis": { "gridcolor": "#C8D4E3", "linecolor": "#C8D4E3", "endlinecolor": "#2a3f5f", "minorgridcolor": "#C8D4E3", "startlinecolor": "#2a3f5f" } } ], "mesh3d": [ { "type": "mesh3d", "colorbar": { "ticks": "", "outlinewidth": 0 } } ], "contour": [ { "type": "contour", "colorbar": { "ticks": "", "outlinewidth": 0 }, "autocolorscale": true } ], "heatmap": [ { "type": "heatmap", "colorbar": { "ticks": "", "outlinewidth": 0 }, "autocolorscale": true } ], "scatter": [ { "type": "scatter", "marker": { "colorbar": { "ticks": "", "outlinewidth": 0 } } } ], "surface": [ { "type": "surface", "colorbar": { "ticks": "", "outlinewidth": 0 } } ], "heatmapgl": [ { "type": "heatmapgl", "colorbar": { "ticks": "", "outlinewidth": 0 } } ], "histogram": [ { "type": "histogram", "marker": { "colorbar": { "ticks": "", "outlinewidth": 0 } } } ], "parcoords": [ { "line": { "colorbar": { "ticks": "", "outlinewidth": 0 } }, "type": "parcoords" } ], "scatter3d": [ { "type": "scatter3d", "marker": { "colorbar": { "ticks": "", "outlinewidth": 0 } } } ], "scattergl": [ { "type": "scattergl", "marker": { "colorbar": { "ticks": "", "outlinewidth": 0 } } } ], "choropleth": [ { "type": "choropleth", "colorbar": { "ticks": "", "outlinewidth": 0 } } ], "scattergeo": [ { "type": "scattergeo", "marker": { "colorbar": { "ticks": "", "outlinewidth": 0 } } } ], "histogram2d": [ { "type": "histogram2d", "colorbar": { "ticks": "", "outlinewidth": 0 }, "autocolorscale": true } ], "scatterpolar": [ { "type": "scatterpolar", "marker": { "colorbar": { "ticks": "", "outlinewidth": 0 } } } ], "contourcarpet": [ { "type": "contourcarpet", "colorbar": { "ticks": "", "outlinewidth": 0 } } ], "scattercarpet": [ { "type": "scattercarpet", "marker": { "colorbar": { "ticks": "", "outlinewidth": 0 } } } ], "scattermapbox": [ { "type": "scattermapbox", "marker": { "colorbar": { "ticks": "", "outlinewidth": 0 } } } ], "scatterpolargl": [ { "type": "scatterpolargl", "marker": { "colorbar": { "ticks": "", "outlinewidth": 0 } } } ], "scatterternary": [ { "type": "scatterternary", "marker": { "colorbar": { "ticks": "", "outlinewidth": 0 } } } ], "histogram2dcontour": [ { "type": "histogram2dcontour", "colorbar": { "ticks": "", "outlinewidth": 0 }, "autocolorscale": true } ] }, "layout": { "geo": { "bgcolor": "white", "showland": true, "lakecolor": "white", "landcolor": "white", "showlakes": true, "subunitcolor": "#C8D4E3" }, "font": { "color": "#2a3f5f" }, "polar": { "bgcolor": "white", "radialaxis": { "ticks": "", "gridcolor": "#EBF0F8", "linecolor": "#EBF0F8" }, "angularaxis": { "ticks": "", "gridcolor": "#EBF0F8", "linecolor": "#EBF0F8" } }, "scene": { "xaxis": { "ticks": "", "gridcolor": "#DFE8F3", "gridwidth": 2, "linecolor": "#EBF0F8", "zerolinecolor": "#EBF0F8", "showbackground": true, "backgroundcolor": "white" }, "yaxis": { "ticks": "", "gridcolor": "#DFE8F3", "gridwidth": 2, "linecolor": "#EBF0F8", "zerolinecolor": "#EBF0F8", "showbackground": true, "backgroundcolor": "white" }, "zaxis": { "ticks": "", "gridcolor": "#DFE8F3", "gridwidth": 2, "linecolor": "#EBF0F8", "zerolinecolor": "#EBF0F8", "showbackground": true, "backgroundcolor": "white" } }, "title": { "x": 0.05 }, "xaxis": { "ticks": "", "gridcolor": "#EBF0F8", "linecolor": "#EBF0F8", "automargin": true, "zerolinecolor": "#EBF0F8", "zerolinewidth": 2 }, "yaxis": { "ticks": "", "gridcolor": "#EBF0F8", "linecolor": "#EBF0F8", "automargin": true, "zerolinecolor": "#EBF0F8", "zerolinewidth": 2 }, "ternary": { "aaxis": { "ticks": "", "gridcolor": "#DFE8F3", "linecolor": "#A2B1C6" }, "baxis": { "ticks": "", "gridcolor": "#DFE8F3", "linecolor": "#A2B1C6" }, "caxis": { "ticks": "", "gridcolor": "#DFE8F3", "linecolor": "#A2B1C6" }, "bgcolor": "white" }, "colorway": [ "#636efa", "#EF553B", "#00cc96", "#ab63fa", "#19d3f3", "#e763fa", "#fecb52", "#ffa15a", "#ff6692", "#b6e880" ], "hovermode": "closest", "colorscale": { "diverging": [ [ 0, "#8e0152" ], [ 0.1, "#c51b7d" ], [ 0.2, "#de77ae" ], [ 0.3, "#f1b6da" ], [ 0.4, "#fde0ef" ], [ 0.5, "#f7f7f7" ], [ 0.6, "#e6f5d0" ], [ 0.7, "#b8e186" ], [ 0.8, "#7fbc41" ], [ 0.9, "#4d9221" ], [ 1, "#276419" ] ], "sequential": [ [ 0, "#0508b8" ], [ 0.0893854748603352, "#1910d8" ], [ 0.1787709497206704, "#3c19f0" ], [ 0.2681564245810056, "#6b1cfb" ], [ 0.3575418994413408, "#981cfd" ], [ 0.44692737430167595, "#bf1cfd" ], [ 0.5363128491620112, "#dd2bfd" ], [ 0.6256983240223464, "#f246fe" ], [ 0.7150837988826816, "#fc67fd" ], [ 0.8044692737430168, "#fe88fc" ], [ 0.8938547486033519, "#fea5fd" ], [ 0.9832402234636871, "#febefe" ], [ 1, "#fec3fe" ] ], "sequentialminus": [ [ 0, "#0508b8" ], [ 0.0893854748603352, "#1910d8" ], [ 0.1787709497206704, "#3c19f0" ], [ 0.2681564245810056, "#6b1cfb" ], [ 0.3575418994413408, "#981cfd" ], [ 0.44692737430167595, "#bf1cfd" ], [ 0.5363128491620112, "#dd2bfd" ], [ 0.6256983240223464, "#f246fe" ], [ 0.7150837988826816, "#fc67fd" ], [ 0.8044692737430168, "#fe88fc" ], [ 0.8938547486033519, "#fea5fd" ], [ 0.9832402234636871, "#febefe" ], [ 1, "#fec3fe" ] ] }, "plot_bgcolor": "white", "paper_bgcolor": "white", "shapedefaults": { "line": { "width": 0 }, "opacity": 0.4, "fillcolor": "#506784" }, "annotationdefaults": { "arrowhead": 0, "arrowcolor": "#506784", "arrowwidth": 1 } }, "themeRef": "PLOTLY_WHITE" } } }, "height": null, "width": null, "user": { "profile_url": "https://chart-studio.plotly.com/~achieng", "avatar_url": "https://storage.googleapis.com/plotly-prod-profiles/3.jpg", "background_url": "https://storage.googleapis.com/plotly-prod-profiles/bg-11.jpg", "bio": "", "nickname": "", "website": "", "stream_tokens": null, "feature_set_id": null, "csrf_token": null, "date_joined": "2025-08-14 05:47:07", "mapbox_access_tokens": null, "has_password": null, "username": "achieng", "email": null, "is_active": null, "readonly": null, "is_dash_creator": null, "dash_created_count": null, "is_chart_creator": null, "charts_created_count": null } }, { "creation_time": "2025-08-14T05:13:10.597344Z", "comments": { "results": [], "count": 0 }, "parented": true, "embed_url": "https://chart-studio.plotly.com/~cs42/4.embed", "fid": "cs42:4", "filename": "Plot 4", "filetype": "plot", "img_url": "https://storage.googleapis.com/plotly-prod-images/cs42/4/9_U11PVXVP6DJ1HH109I292F3XK75AWI.png", "image_urls": { "default": "https://api.plotly.com/v2/files/cs42:4/image?image_name=default", "block-thumb": "https://storage.googleapis.com/plotly-prod-images/cs42/4/8_BVPYM07ZXLWM60J3LZTHIO40XRY57V.png", "list-thumb": "https://storage.googleapis.com/plotly-prod-images/cs42/4/9_U11PVXVP6DJ1HH109I292F3XK75AWI.png" }, "api_urls": { "files": "https://api.plotly.com/v2/files/cs42:4", "plots": "https://api.plotly.com/v2/plots/cs42:4", "parent": "https://api.plotly.com/v2/folders/home?user=cs42" }, "owner": "cs42", "parent": -1, "preview": "", "referencers": [], "references": [], "title": "", "views": 1, "web_url": "https://chart-studio.plotly.com/~cs42/4/", "world_readable": true, "date_modified": "2025-08-14T05:29:10.819Z", "stars": { "results": [], "count": 0 }, "collaborators": { "results": [], "count": 0 }, "subfolder_count": null, "refresh_interval": null, "organize_view_url": "https://chart-studio.plotly.com/~cs42/4/", "current_user_permission": "read", "is_theme": null, "is_template": false, "autosize": true, "caption": "", "figure": { "data": [ { "hole": 0.44, "meta": { "columnNames": { "z": "C", "labels": "A", "values": "C", "locations": "A" } }, "mode": "markers", "pull": 0, "sort": false, "type": "choropleth", "zmax": 3, "zmin": 0, "zsrc": "cs42:5:276c39", "zauto": false, "marker": { "line": { "color": "rgb(123, 140, 150)", "width": 1 } }, "opacity": 0.88, "rotation": 115, "textfont": { "size": 15, "family": "Old Standard TT" }, "textinfo": "label+percent", "direction": "clockwise", "hoverinfo": "location+z", "labelssrc": "cs42:2:5c33bb", "showscale": false, "valuessrc": "cs42:2:d68247", "colorscale": [ [ 0, "#f7fcf5" ], [ 0.125, "#e5f5e0" ], [ 0.25, "#c7e9c0" ], [ 0.375, "#a1d99b" ], [ 0.5, "#74c476" ], [ 0.625, "#41ab5d" ], [ 0.75, "#238b45" ], [ 0.875, "#006d2c" ], [ 1, "#00441b" ] ], "locationmode": "country names", "locationssrc": "cs42:5:bb41a1", "reversescale": false, "textposition": "middle center", "autocolorscale": false } ], "frames": [], "layout": { "geo": {}, "font": { "size": 17, "family": "Old Standard TT" }, "title": { "x": 0.5, "font": { "size": 22 }, "text": "2025 SySTEAM mini-conference registrants by country" }, "xaxis": { "range": [ -1, 6 ], "autorange": true }, "yaxis": { "range": [ -1, 4 ], "autorange": true }, "legend": { "x": 0.7, "y": 1, "traceorder": "grouped", "orientation": "v", "tracegroupgap": 15 }, "mapbox": {}, "margin": { "b": 30, "l": 50, "r": 50, "t": 50, "pad": 0 }, "modebar": { "orientation": "h" }, "autosize": true, "template": { "data": { "bar": [ { "type": "bar", "marker": { "colorbar": { "ticks": "", "outlinewidth": 0 } } } ], "table": [ { "type": "table", "cells": { "fill": { "color": "#EBF0F8" }, "line": { "color": "white" } }, "header": { "fill": { "color": "#C8D4E3" }, "line": { "color": "white" } } } ], "carpet": [ { "type": "carpet", "aaxis": { "gridcolor": "#C8D4E3", "linecolor": "#C8D4E3", "endlinecolor": "#2a3f5f", "minorgridcolor": "#C8D4E3", "startlinecolor": "#2a3f5f" }, "baxis": { "gridcolor": "#C8D4E3", "linecolor": "#C8D4E3", "endlinecolor": "#2a3f5f", "minorgridcolor": "#C8D4E3", "startlinecolor": "#2a3f5f" } } ], "mesh3d": [ { "type": "mesh3d", "colorbar": { "ticks": "", "outlinewidth": 0 } } ], "contour": [ { "type": "contour", "colorbar": { "ticks": "", "outlinewidth": 0 }, "autocolorscale": true } ], "heatmap": [ { "type": "heatmap", "colorbar": { "ticks": "", "outlinewidth": 0 }, "autocolorscale": true } ], "scatter": [ { "type": "scatter", "marker": { "colorbar": { "ticks": "", "outlinewidth": 0 } } } ], "surface": [ { "type": "surface", "colorbar": { "ticks": "", "outlinewidth": 0 } } ], "heatmapgl": [ { "type": "heatmapgl", "colorbar": { "ticks": "", "outlinewidth": 0 } } ], "histogram": [ { "type": "histogram", "marker": { "colorbar": { "ticks": "", "outlinewidth": 0 } } } ], "parcoords": [ { "line": { "colorbar": { "ticks": "", "outlinewidth": 0 } }, "type": "parcoords" } ], "scatter3d": [ { "type": "scatter3d", "marker": { "colorbar": { "ticks": "", "outlinewidth": 0 } } } ], "scattergl": [ { "type": "scattergl", "marker": { "colorbar": { "ticks": "", "outlinewidth": 0 } } } ], "choropleth": [ { "type": "choropleth", "colorbar": { "ticks": "", "outlinewidth": 0 } } ], "scattergeo": [ { "type": "scattergeo", "marker": { "colorbar": { "ticks": "", "outlinewidth": 0 } } } ], "histogram2d": [ { "type": "histogram2d", "colorbar": { "ticks": "", "outlinewidth": 0 }, "autocolorscale": true } ], "scatterpolar": [ { "type": "scatterpolar", "marker": { "colorbar": { "ticks": "", "outlinewidth": 0 } } } ], "contourcarpet": [ { "type": "contourcarpet", "colorbar": { "ticks": "", "outlinewidth": 0 } } ], "scattercarpet": [ { "type": "scattercarpet", "marker": { "colorbar": { "ticks": "", "outlinewidth": 0 } } } ], "scattermapbox": [ { "type": "scattermapbox", "marker": { "colorbar": { "ticks": "", "outlinewidth": 0 } } } ], "scatterpolargl": [ { "type": "scatterpolargl", "marker": { "colorbar": { "ticks": "", "outlinewidth": 0 } } } ], "scatterternary": [ { "type": "scatterternary", "marker": { "colorbar": { "ticks": "", "outlinewidth": 0 } } } ], "histogram2dcontour": [ { "type": "histogram2dcontour", "colorbar": { "ticks": "", "outlinewidth": 0 }, "autocolorscale": true } ] }, "layout": { "geo": { "bgcolor": "white", "showland": true, "lakecolor": "white", "landcolor": "white", "showlakes": true, "subunitcolor": "#C8D4E3" }, "font": { "color": "#2a3f5f" }, "polar": { "bgcolor": "white", "radialaxis": { "ticks": "", "gridcolor": "#EBF0F8", "linecolor": "#EBF0F8" }, "angularaxis": { "ticks": "", "gridcolor": "#EBF0F8", "linecolor": "#EBF0F8" } }, "scene": { "xaxis": { "ticks": "", "gridcolor": "#DFE8F3", "gridwidth": 2, "linecolor": "#EBF0F8", "zerolinecolor": "#EBF0F8", "showbackground": true, "backgroundcolor": "white" }, "yaxis": { "ticks": "", "gridcolor": "#DFE8F3", "gridwidth": 2, "linecolor": "#EBF0F8", "zerolinecolor": "#EBF0F8", "showbackground": true, "backgroundcolor": "white" }, "zaxis": { "ticks": "", "gridcolor": "#DFE8F3", "gridwidth": 2, "linecolor": "#EBF0F8", "zerolinecolor": "#EBF0F8", "showbackground": true, "backgroundcolor": "white" } }, "title": { "x": 0.05 }, "xaxis": { "ticks": "", "gridcolor": "#EBF0F8", "linecolor": "#EBF0F8", "automargin": true, "zerolinecolor": "#EBF0F8", "zerolinewidth": 2 }, "yaxis": { "ticks": "", "gridcolor": "#EBF0F8", "linecolor": "#EBF0F8", "automargin": true, "zerolinecolor": "#EBF0F8", "zerolinewidth": 2 }, "ternary": { "aaxis": { "ticks": "", "gridcolor": "#DFE8F3", "linecolor": "#A2B1C6" }, "baxis": { "ticks": "", "gridcolor": "#DFE8F3", "linecolor": "#A2B1C6" }, "caxis": { "ticks": "", "gridcolor": "#DFE8F3", "linecolor": "#A2B1C6" }, "bgcolor": "white" }, "colorway": [ "#636efa", "#EF553B", "#00cc96", "#ab63fa", "#19d3f3", "#e763fa", "#fecb52", "#ffa15a", "#ff6692", "#b6e880" ], "hovermode": "closest", "colorscale": { "diverging": [ [ 0, "#8e0152" ], [ 0.1, "#c51b7d" ], [ 0.2, "#de77ae" ], [ 0.3, "#f1b6da" ], [ 0.4, "#fde0ef" ], [ 0.5, "#f7f7f7" ], [ 0.6, "#e6f5d0" ], [ 0.7, "#b8e186" ], [ 0.8, "#7fbc41" ], [ 0.9, "#4d9221" ], [ 1, "#276419" ] ], "sequential": [ [ 0, "#0508b8" ], [ 0.0893854748603352, "#1910d8" ], [ 0.1787709497206704, "#3c19f0" ], [ 0.2681564245810056, "#6b1cfb" ], [ 0.3575418994413408, "#981cfd" ], [ 0.44692737430167595, "#bf1cfd" ], [ 0.5363128491620112, "#dd2bfd" ], [ 0.6256983240223464, "#f246fe" ], [ 0.7150837988826816, "#fc67fd" ], [ 0.8044692737430168, "#fe88fc" ], [ 0.8938547486033519, "#fea5fd" ], [ 0.9832402234636871, "#febefe" ], [ 1, "#fec3fe" ] ], "sequentialminus": [ [ 0, "#0508b8" ], [ 0.0893854748603352, "#1910d8" ], [ 0.1787709497206704, "#3c19f0" ], [ 0.2681564245810056, "#6b1cfb" ], [ 0.3575418994413408, "#981cfd" ], [ 0.44692737430167595, "#bf1cfd" ], [ 0.5363128491620112, "#dd2bfd" ], [ 0.6256983240223464, "#f246fe" ], [ 0.7150837988826816, "#fc67fd" ], [ 0.8044692737430168, "#fe88fc" ], [ 0.8938547486033519, "#fea5fd" ], [ 0.9832402234636871, "#febefe" ], [ 1, "#fec3fe" ] ] }, "plot_bgcolor": "white", "paper_bgcolor": "white", "shapedefaults": { "line": { "width": 0 }, "opacity": 0.4, "fillcolor": "#506784" }, "annotationdefaults": { "arrowhead": 0, "arrowcolor": "#506784", "arrowwidth": 1 } }, "themeRef": "PLOTLY_WHITE" }, "showlegend": false, "piecolorway": [ "#4c78a8", "#f58518", "#e45756", "#72b7b2", "#54a24b", "#eeca3b", "#b279a2", "#ff9da6", "#9d755d", "#bab0ac" ], "extendpiecolors": true } }, "height": null, "width": null, "user": { "profile_url": "https://chart-studio.plotly.com/~cs42", "avatar_url": "https://storage.googleapis.com/plotly-prod-profiles/87.jpg", "background_url": "https://storage.googleapis.com/plotly-prod-profiles/bg-7.jpg", "bio": "", "nickname": "", "website": "", "stream_tokens": null, "feature_set_id": null, "csrf_token": null, "date_joined": "2025-08-14 04:21:29", "mapbox_access_tokens": null, "has_password": null, "username": "cs42", "email": null, "is_active": null, "readonly": null, "is_dash_creator": null, "dash_created_count": null, "is_chart_creator": null, "charts_created_count": null } }, { "creation_time": "2025-08-14T04:50:24.633042Z", "comments": { "results": [], "count": 0 }, "parented": true, "embed_url": "https://chart-studio.plotly.com/~cs42/3.embed", "fid": "cs42:3", "filename": "Plot 3", "filetype": "plot", "img_url": "https://api.plotly.com/v2/files/cs42:3/image?image_name=list-thumb", "image_urls": { "default": "https://storage.googleapis.com/plotly-prod-images/cs42/3/2_6IG0RL41F7KKZOK0LNJD4SNHMQWLKQ.png", "block-thumb": "https://storage.googleapis.com/plotly-prod-images/cs42/3/8_9EMRHJOTDF7S5V8RSMMML1WE9KLDMQ.png", "list-thumb": "https://api.plotly.com/v2/files/cs42:3/image?image_name=list-thumb" }, "api_urls": { "files": "https://api.plotly.com/v2/files/cs42:3", "plots": "https://api.plotly.com/v2/plots/cs42:3", "parent": "https://api.plotly.com/v2/folders/home?user=cs42" }, "owner": "cs42", "parent": -1, "preview": "", "referencers": [], "references": [], "title": "", "views": 0, "web_url": "https://chart-studio.plotly.com/~cs42/3/", "world_readable": true, "date_modified": "2025-08-14T04:53:48.041Z", "stars": { "results": [], "count": 0 }, "collaborators": { "results": [], "count": 0 }, "subfolder_count": null, "refresh_interval": null, "organize_view_url": "https://chart-studio.plotly.com/~cs42/3/", "current_user_permission": "read", "is_theme": null, "is_template": false, "autosize": true, "caption": "", "figure": { "data": [ { "meta": { "columnNames": { "x": "B", "y": "C", "text": "", "marker": { "color": "A" } } }, "mode": "markers", "type": "bar", "xsrc": "cs42:1:2e4779", "ysrc": "cs42:1:1f9efd", "marker": { "cmin": -12, "meta": { "columnNames": { "color": "A" } }, "cauto": false, "opacity": 0.84, "colorsrc": "cs42:1:b180ef", "showscale": false, "colorscale": [ [ 0, "#f884f7" ], [ 0.06666666666666667, "#f968c4" ], [ 0.13333333333333333, "#ea4388" ], [ 0.2, "#cf244b" ], [ 0.26666666666666666, "#b51a15" ], [ 0.3333333333333333, "#bd4304" ], [ 0.4, "#cc6904" ], [ 0.4666666666666667, "#d58f04" ], [ 0.5333333333333333, "#cfaa27" ], [ 0.6, "#a19f62" ], [ 0.6666666666666666, "#588a93" ], [ 0.7333333333333333, "#2269c4" ], [ 0.8, "#3e3ef0" ], [ 0.8666666666666667, "#6b4ef9" ], [ 0.9333333333333333, "#956bfa" ], [ 1, "#cd7dfe" ] ], "reversescale": false }, "opacity": 1, "textfont": { "size": 16 }, "textangle": -45, "cliponaxis": true, "hoverlabel": { "align": "auto" }, "orientation": "v", "textposition": "outside", "autocolorscale": false } ], "frames": [], "layout": { "font": { "size": 14, "family": "Old Standard TT" }, "title": { "text": "2025 SySTEAM mini-conference participants by timezone" }, "xaxis": { "side": "bottom", "type": "category", "range": [ -0.5, 24.5 ], "ticks": "outside", "title": { "font": { "size": 17 }, "text": "<b>Timezone</b>" }, "tickson": "labels", "autorange": true, "tickangle": 45, "ticksuffix": "" }, "yaxis": { "type": "linear", "dtick": 2, "range": [ 0, 20 ], "title": { "font": { "size": 18 }, "text": "% of registered participants" }, "tickmode": "linear", "autorange": false, "automargin": true, "tickformat": "", "ticksuffix": "%", "zerolinecolor": "rgb(48, 48, 48)", "zerolinewidth": 2, "exponentformat": "none", "separatethousands": false }, "autosize": true, "dragmode": "select", "template": { "data": { "bar": [ { "type": "bar", "marker": { "colorbar": { "ticks": "outside", "ticklen": 8, "tickcolor": "rgb(36,36,36)", "tickwidth": 2, "outlinewidth": 0 } } } ], "table": [ { "type": "table", "cells": { "fill": { "color": "rgb(231,231,240)" }, "line": { "color": "white" } }, "header": { "fill": { "color": "rgb(183,183,191)" }, "line": { "color": "white" } } } ], "carpet": [ { "type": "carpet", "aaxis": { "gridcolor": "white", "linecolor": "white", "endlinecolor": "rgb(36,36,36)", "minorgridcolor": "white", "startlinecolor": "rgb(36,36,36)" }, "baxis": { "gridcolor": "white", "linecolor": "white", "endlinecolor": "rgb(36,36,36)", "minorgridcolor": "white", "startlinecolor": "rgb(36,36,36)" } } ], "mesh3d": [ { "type": "mesh3d", "colorbar": { "ticks": "outside", "ticklen": 8, "tickcolor": "rgb(36,36,36)", "tickwidth": 2, "outlinewidth": 0 } } ], "contour": [ { "type": "contour", "colorbar": { "ticks": "outside", "ticklen": 8, "tickcolor": "rgb(36,36,36)", "tickwidth": 2, "outlinewidth": 0 }, "autocolorscale": true } ], "heatmap": [ { "type": "heatmap", "colorbar": { "ticks": "outside", "ticklen": 8, "tickcolor": "rgb(36,36,36)", "tickwidth": 2, "outlinewidth": 0 }, "autocolorscale": true } ], "scatter": [ { "type": "scatter", "marker": { "colorbar": { "ticks": "outside", "ticklen": 8, "tickcolor": "rgb(36,36,36)", "tickwidth": 2, "outlinewidth": 0 } } } ], "surface": [ { "type": "surface", "colorbar": { "ticks": "outside", "ticklen": 8, "tickcolor": "rgb(36,36,36)", "tickwidth": 2, "outlinewidth": 0 } } ], "heatmapgl": [ { "type": "heatmapgl", "colorbar": { "ticks": "outside", "ticklen": 8, "tickcolor": "rgb(36,36,36)", "tickwidth": 2, "outlinewidth": 0 } } ], "histogram": [ { "type": "histogram", "marker": { "colorbar": { "ticks": "outside", "ticklen": 8, "tickcolor": "rgb(36,36,36)", "tickwidth": 2, "outlinewidth": 0 } } } ], "parcoords": [ { "line": { "colorbar": { "ticks": "outside", "ticklen": 8, "tickcolor": "rgb(36,36,36)", "tickwidth": 2, "outlinewidth": 0 } }, "type": "parcoords" } ], "scatter3d": [ { "type": "scatter3d", "marker": { "colorbar": { "ticks": "outside", "ticklen": 8, "tickcolor": "rgb(36,36,36)", "tickwidth": 2, "outlinewidth": 0 } } } ], "scattergl": [ { "type": "scattergl", "marker": { "colorbar": { "ticks": "outside", "ticklen": 8, "tickcolor": "rgb(36,36,36)", "tickwidth": 2, "outlinewidth": 0 } } } ], "choropleth": [ { "type": "choropleth", "colorbar": { "ticks": "outside", "ticklen": 8, "tickcolor": "rgb(36,36,36)", "tickwidth": 2, "outlinewidth": 0 } } ], "scattergeo": [ { "type": "scattergeo", "marker": { "colorbar": { "ticks": "outside", "ticklen": 8, "tickcolor": "rgb(36,36,36)", "tickwidth": 2, "outlinewidth": 0 } } } ], "histogram2d": [ { "type": "histogram2d", "colorbar": { "ticks": "outside", "ticklen": 8, "tickcolor": "rgb(36,36,36)", "tickwidth": 2, "outlinewidth": 0 }, "autocolorscale": true } ], "scatterpolar": [ { "type": "scatterpolar", "marker": { "colorbar": { "ticks": "outside", "ticklen": 8, "tickcolor": "rgb(36,36,36)", "tickwidth": 2, "outlinewidth": 0 } } } ], "contourcarpet": [ { "type": "contourcarpet", "colorbar": { "ticks": "outside", "ticklen": 8, "tickcolor": "rgb(36,36,36)", "tickwidth": 2, "outlinewidth": 0 } } ], "scattercarpet": [ { "type": "scattercarpet", "marker": { "colorbar": { "ticks": "outside", "ticklen": 8, "tickcolor": "rgb(36,36,36)", "tickwidth": 2, "outlinewidth": 0 } } } ], "scattermapbox": [ { "type": "scattermapbox", "marker": { "colorbar": { "ticks": "outside", "ticklen": 8, "tickcolor": "rgb(36,36,36)", "tickwidth": 2, "outlinewidth": 0 } } } ], "scatterpolargl": [ { "type": "scatterpolargl", "marker": { "colorbar": { "ticks": "outside", "ticklen": 8, "tickcolor": "rgb(36,36,36)", "tickwidth": 2, "outlinewidth": 0 } } } ], "scatterternary": [ { "type": "scatterternary", "marker": { "colorbar": { "ticks": "outside", "ticklen": 8, "tickcolor": "rgb(36,36,36)", "tickwidth": 2, "outlinewidth": 0 } } } ], "histogram2dcontour": [ { "type": "histogram2dcontour", "colorbar": { "ticks": "outside", "ticklen": 8, "tickcolor": "rgb(36,36,36)", "tickwidth": 2, "outlinewidth": 0 }, "autocolorscale": true } ] }, "layout": { "geo": { "bgcolor": "white", "showland": true, "lakecolor": "white", "landcolor": "rgb(234,234,242)", "showlakes": true, "subunitcolor": "white" }, "font": { "color": "rgb(36,36,36)" }, "polar": { "bgcolor": "rgb(234,234,242)", "radialaxis": { "ticks": "", "showgrid": true, "gridcolor": "white", "linecolor": "white" }, "angularaxis": { "ticks": "", "showgrid": true, "gridcolor": "white", "linecolor": "white" } }, "scene": { "xaxis": { "ticks": "", "showgrid": true, "gridcolor": "white", "gridwidth": 2, "linecolor": "white", "zerolinecolor": "white", "showbackground": true, "backgroundcolor": "rgb(234,234,242)" }, "yaxis": { "ticks": "", "showgrid": true, "gridcolor": "white", "gridwidth": 2, "linecolor": "white", "zerolinecolor": "white", "showbackground": true, "backgroundcolor": "rgb(234,234,242)" }, "zaxis": { "ticks": "", "showgrid": true, "gridcolor": "white", "gridwidth": 2, "linecolor": "white", "zerolinecolor": "white", "showbackground": true, "backgroundcolor": "rgb(234,234,242)" } }, "xaxis": { "ticks": "", "showgrid": true, "gridcolor": "white", "linecolor": "white", "automargin": true, "zerolinecolor": "white" }, "yaxis": { "ticks": "", "showgrid": true, "gridcolor": "white", "linecolor": "white", "automargin": true, "zerolinecolor": "white" }, "ternary": { "aaxis": { "ticks": "", "showgrid": true, "gridcolor": "white", "linecolor": "white" }, "baxis": { "ticks": "", "showgrid": true, "gridcolor": "white", "linecolor": "white" }, "caxis": { "ticks": "", "showgrid": true, "gridcolor": "white", "linecolor": "white" }, "bgcolor": "rgb(234,234,242)" }, "colorway": [ "rgb(76,114,176)", "rgb(221,132,82)", "rgb(85,168,104)", "rgb(196,78,82)", "rgb(129,114,179)", "rgb(147,120,96)", "rgb(218,139,195)", "rgb(140,140,140)", "rgb(204,185,116)", "rgb(100,181,205)" ], "hovermode": "closest", "colorscale": { "diverging": [ [ 0, "#67001f" ], [ 0.1, "#b2182b" ], [ 0.2, "#d6604d" ], [ 0.3, "#f4a582" ], [ 0.4, "#fddbc7" ], [ 0.5, "#f7f7f7" ], [ 0.6, "#d1e5f0" ], [ 0.7, "#92c5de" ], [ 0.8, "#4393c3" ], [ 0.9, "#2166ac" ], [ 1, "#053061" ] ], "sequential": [ [ 0, "rgb(2,4,25)" ], [ 0.06274509803921569, "rgb(24,15,41)" ], [ 0.12549019607843137, "rgb(47,23,57)" ], [ 0.18823529411764706, "rgb(71,28,72)" ], [ 0.25098039215686274, "rgb(97,30,82)" ], [ 0.3137254901960784, "rgb(123,30,89)" ], [ 0.3764705882352941, "rgb(150,27,91)" ], [ 0.4392156862745098, "rgb(177,22,88)" ], [ 0.5019607843137255, "rgb(203,26,79)" ], [ 0.5647058823529412, "rgb(223,47,67)" ], [ 0.6274509803921569, "rgb(236,76,61)" ], [ 0.6901960784313725, "rgb(242,107,73)" ], [ 0.7529411764705882, "rgb(244,135,95)" ], [ 0.8156862745098039, "rgb(245,162,122)" ], [ 0.8784313725490196, "rgb(246,188,153)" ], [ 0.9411764705882353, "rgb(247,212,187)" ], [ 1, "rgb(250,234,220)" ] ], "sequentialminus": [ [ 0, "rgb(2,4,25)" ], [ 0.06274509803921569, "rgb(24,15,41)" ], [ 0.12549019607843137, "rgb(47,23,57)" ], [ 0.18823529411764706, "rgb(71,28,72)" ], [ 0.25098039215686274, "rgb(97,30,82)" ], [ 0.3137254901960784, "rgb(123,30,89)" ], [ 0.3764705882352941, "rgb(150,27,91)" ], [ 0.4392156862745098, "rgb(177,22,88)" ], [ 0.5019607843137255, "rgb(203,26,79)" ], [ 0.5647058823529412, "rgb(223,47,67)" ], [ 0.6274509803921569, "rgb(236,76,61)" ], [ 0.6901960784313725, "rgb(242,107,73)" ], [ 0.7529411764705882, "rgb(244,135,95)" ], [ 0.8156862745098039, "rgb(245,162,122)" ], [ 0.8784313725490196, "rgb(246,188,153)" ], [ 0.9411764705882353, "rgb(247,212,187)" ], [ 1, "rgb(250,234,220)" ] ] }, "plot_bgcolor": "rgb(234,234,242)", "paper_bgcolor": "white", "shapedefaults": { "line": { "width": 0 }, "opacity": 0.5, "fillcolor": "rgb(67,103,167)" }, "annotationdefaults": { "arrowcolor": "rgb(67,103,167)" } }, "themeRef": "SEABORN" }, "colorscale": { "diverging": [ [ 0, "#9e0142" ], [ 0.1, "#d53e4f" ], [ 0.2, "#f46d43" ], [ 0.3, "#fdae61" ], [ 0.4, "#fee08b" ], [ 0.5, "#ffffbf" ], [ 0.6, "#e6f598" ], [ 0.7, "#abdda4" ], [ 0.8, "#66c2a5" ], [ 0.9, "#3288bd" ], [ 1, "#5e4fa2" ] ], "sequential": [ [ 0, "#440154" ], [ 0.1111111111111111, "#482878" ], [ 0.2222222222222222, "#3e4989" ], [ 0.3333333333333333, "#31688e" ], [ 0.4444444444444444, "#26828e" ], [ 0.5555555555555556, "#1f9e89" ], [ 0.6666666666666666, "#35b779" ], [ 0.7777777777777778, "#6ece58" ], [ 0.8888888888888888, "#b5de2b" ], [ 1, "#fde725" ] ] }, "bargroupgap": 0.05, "uniformtext": { "mode": false } } }, "height": null, "width": null, "user": { "profile_url": "https://chart-studio.plotly.com/~cs42", "avatar_url": "https://storage.googleapis.com/plotly-prod-profiles/87.jpg", "background_url": "https://storage.googleapis.com/plotly-prod-profiles/bg-7.jpg", "bio": "", "nickname": "", "website": "", "stream_tokens": null, "feature_set_id": null, "csrf_token": null, "date_joined": "2025-08-14 04:21:29", "mapbox_access_tokens": null, "has_password": null, "username": "cs42", "email": null, "is_active": null, "readonly": null, "is_dash_creator": null, "dash_created_count": null, "is_chart_creator": null, "charts_created_count": null } } ] }
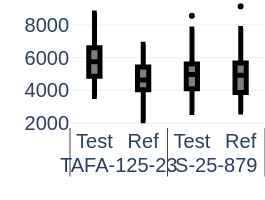
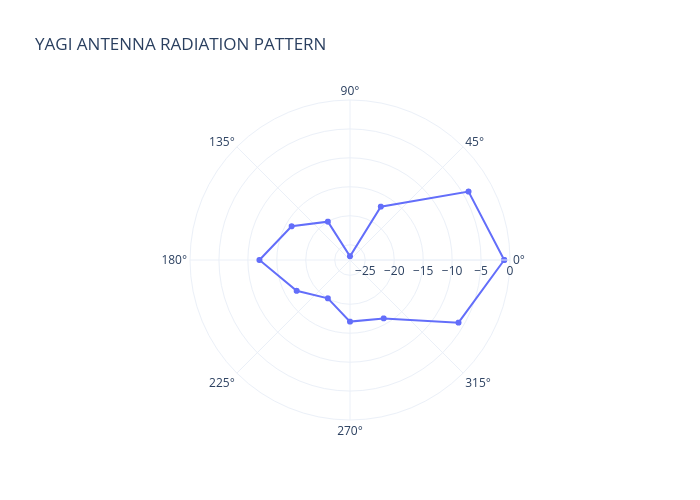
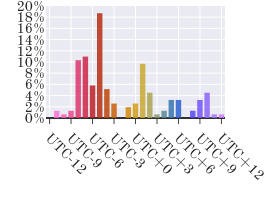