Plots List
Plots
This endpoint handles manipulation of Plotly plot files.
Reference
Authorization
Any user with or without a Plotly account may view public plots. For private plots, see authentication.
Actions
list
Listing all public plots can be done via a GET request to this endpoint.
By default, plots will be listed in order of date created. The order_by
query parameter is accepted at this endpoint. Currently, only ordering by
views is supported. It is possible to filter the plots by quality
with min_quality or max_quality as query parameter.
Example:
// GET https://api.plotly.com/v2/plots/ ---> 200

// GET https://api.plotly.com/v2/plots/?order_by=-views ---> 200

// GET https://api.plotly.com/v2/plots/?min_quality=5 ---> 200

// GET https://api.plotly.com/v2/plots/?max_quality=5 ---> 200
feed
Listing all handpicked feed plots can be done via a GET request to this endpoint. By default, plots will be listed in a random order.
Example:
// GET https://api.plotly.com/v2/plots/feed ---> 200
create
You can create new plot resources here. The only required field is 'figure'. Currently, the figure is restricted to only contain references to grid data. That is, this will fail if raw data arrays are passed in. To create and manipulate underlying grids for plots, see the grids endpoint.
Example:
// This fails because a figure field is required.
// POST https://api.plotly.com/v2/plots ---> 400 Bad Request
{}

// This fails because the figure has raw data
//POST https://api.plotly.com/v2/plots ---> 400 Bad Request
{
    "figure": {"data": [{"y": ['this', 'is', 'raw', 'data']}]}
}

// This succeeds because the figure has src keys, not raw data.
//POST https://api.plotly.com/v2/plots ---> 200 OK
{
    "figure": {"data": [{"ysrc": "sven:88:u8nd62"}]}
}
When creating a grid, you can optionally specify a source_fid to specify where a plot has come from:
- source_fid: the fid of a plot that was copied (and presumably edited) to produce this one
detail
There is a lot of meta information stored about plot files including filename, title, share_url, and content_url to name a few.
This information can only be reached with a GET to this endpoint.
Example:
// GET https://api.plotly.com/v2/plots/iheartgraphs:90
content
The contents of a plot can be downloaded via the content resource. The plot
content contains referenced grid/column data by default. If you wish to
return the raw grid/column data, the inline_data=true query must be included
in the request url. The Content-Type header will be appropriately set for the
response body.
Alternatively, you can set ?map_data=unreadable to append a mapping of
sources to data that belongs to grids which are unreadable for the
requestor. This is useful when you have read access to another users plot,
but that plot contains grid references which you don't have access to.
Examples:
// Returns referenced grid/column data
// GET https://api.plotly.com/v2/plots/iheartgraphs:90/content ---> 200 OK

// Returns full grid/column data
// GET https://api.plotly.com/v2/plots/iheartgraphs:90/content?inline_data=true ---> 200 OK

// Returns full grid/column data when requestor doesn't have permission
// to read the referenced grid.
// GET https://api.plotly.com/v2/plots/iheartgraphs:90/content?map_data=unreadable ---> 200 OK
GET /v2/plots?cursor=cD0yMDI1LTA5LTAyKzEwJTNBMDElM0EwMy40MDk0NTMlMkIwMCUzQTAw&format=api
{ "next": "https://api.plotly.com/v2/plots?cursor=cD0yMDI1LTA5LTAyKzA1JTNBMjQlM0E0NC41OTQwNDMlMkIwMCUzQTAw&format=api", "previous": "https://api.plotly.com/v2/plots?cursor=cj0xJnA9MjAyNS0wOS0wMiswOSUzQTI0JTNBMTAuNDkwNTU2JTJCMDAlM0EwMA%3D%3D&format=api", "results": [ { "creation_time": "2025-09-02T09:24:10.490556Z", "comments": { "results": [], "count": 0 }, "parented": true, "embed_url": "https://chart-studio.plotly.com/~machael/4.embed", "fid": "machael:4", "filename": "Plot 4", "filetype": "plot", "img_url": "https://storage.googleapis.com/plotly-prod-images/machael/4/9_A3OA2E68FOW0SLHJ4TSVW2VBXFGFF0.png", "image_urls": { "default": "https://storage.googleapis.com/plotly-prod-images/machael/4/2_OG980GPF6AQFAEPNJ76ZO3132SCVQD.png", "block-thumb": "https://storage.googleapis.com/plotly-prod-images/machael/4/8_00OLPINDAS4Q2Y972YX7SC0K07ITUB.png", "list-thumb": "https://storage.googleapis.com/plotly-prod-images/machael/4/9_A3OA2E68FOW0SLHJ4TSVW2VBXFGFF0.png" }, "api_urls": { "files": "https://api.plotly.com/v2/files/machael:4", "plots": "https://api.plotly.com/v2/plots/machael:4", "parent": "https://api.plotly.com/v2/folders/home?user=machael" }, "owner": "machael", "parent": -1, "preview": "", "referencers": [], "references": [], "title": "", "views": 0, "web_url": "https://chart-studio.plotly.com/~machael/4/", "world_readable": true, "date_modified": "2025-09-02T09:24:10.505Z", "stars": { "results": [], "count": 0 }, "collaborators": { "results": [], "count": 0 }, "subfolder_count": null, "refresh_interval": null, "organize_view_url": "https://chart-studio.plotly.com/~machael/4/", "current_user_permission": "read", "is_theme": null, "is_template": false, "autosize": true, "caption": "", "figure": { "data": [ { "meta": { "columnNames": { "labels": "B", "values": "A" } }, "mode": "markers", "type": "pie", "labelssrc": "machael:3:555a0b", "valuessrc": "machael:3:dbaffe" }, { "meta": { "columnNames": { "x": "Xerox® C235 Color Multifunction Printer", "y": "C" } }, "mode": "markers", "type": "bar", "xsrc": "machael:2:fb7daf", "ysrc": "machael:3:017667", "stackgroup": null, "orientation": "v" } ], "frames": [], "layout": { "xaxis": { "type": "linear", "range": [ 342.5, 1556.5 ], "autorange": true }, "yaxis": { "type": "category", "range": [ -0.11111111111111112, 2.111111111111111 ], "autorange": true }, "autosize": true, "template": { "data": { "bar": [ { "type": "bar", "marker": { "colorbar": { "ticks": "", "outlinewidth": 0 } } } ], "table": [ { "type": "table", "cells": { "fill": { "color": "#EBF0F8" }, "line": { "color": "white" } }, "header": { "fill": { "color": "#C8D4E3" }, "line": { "color": "white" } } } ], "carpet": [ { "type": "carpet", "aaxis": { "gridcolor": "#C8D4E3", "linecolor": "#C8D4E3", "endlinecolor": "#2a3f5f", "minorgridcolor": "#C8D4E3", "startlinecolor": "#2a3f5f" }, "baxis": { "gridcolor": "#C8D4E3", "linecolor": "#C8D4E3", "endlinecolor": "#2a3f5f", "minorgridcolor": "#C8D4E3", "startlinecolor": "#2a3f5f" } } ], "mesh3d": [ { "type": "mesh3d", "colorbar": { "ticks": "", "outlinewidth": 0 } } ], "contour": [ { "type": "contour", "colorbar": { "ticks": "", "outlinewidth": 0 }, "autocolorscale": true } ], "heatmap": [ { "type": "heatmap", "colorbar": { "ticks": "", "outlinewidth": 0 }, "autocolorscale": true } ], "scatter": [ { "type": "scatter", "marker": { "colorbar": { "ticks": "", "outlinewidth": 0 } } } ], "surface": [ { "type": "surface", "colorbar": { "ticks": "", "outlinewidth": 0 } } ], "heatmapgl": [ { "type": "heatmapgl", "colorbar": { "ticks": "", "outlinewidth": 0 } } ], "histogram": [ { "type": "histogram", "marker": { "colorbar": { "ticks": "", "outlinewidth": 0 } } } ], "parcoords": [ { "line": { "colorbar": { "ticks": "", "outlinewidth": 0 } }, "type": "parcoords" } ], "scatter3d": [ { "type": "scatter3d", "marker": { "colorbar": { "ticks": "", "outlinewidth": 0 } } } ], "scattergl": [ { "type": "scattergl", "marker": { "colorbar": { "ticks": "", "outlinewidth": 0 } } } ], "choropleth": [ { "type": "choropleth", "colorbar": { "ticks": "", "outlinewidth": 0 } } ], "scattergeo": [ { "type": "scattergeo", "marker": { "colorbar": { "ticks": "", "outlinewidth": 0 } } } ], "histogram2d": [ { "type": "histogram2d", "colorbar": { "ticks": "", "outlinewidth": 0 }, "autocolorscale": true } ], "scatterpolar": [ { "type": "scatterpolar", "marker": { "colorbar": { "ticks": "", "outlinewidth": 0 } } } ], "contourcarpet": [ { "type": "contourcarpet", "colorbar": { "ticks": "", "outlinewidth": 0 } } ], "scattercarpet": [ { "type": "scattercarpet", "marker": { "colorbar": { "ticks": "", "outlinewidth": 0 } } } ], "scattermapbox": [ { "type": "scattermapbox", "marker": { "colorbar": { "ticks": "", "outlinewidth": 0 } } } ], "scatterpolargl": [ { "type": "scatterpolargl", "marker": { "colorbar": { "ticks": "", "outlinewidth": 0 } } } ], "scatterternary": [ { "type": "scatterternary", "marker": { "colorbar": { "ticks": "", "outlinewidth": 0 } } } ], "histogram2dcontour": [ { "type": "histogram2dcontour", "colorbar": { "ticks": "", "outlinewidth": 0 }, "autocolorscale": true } ] }, "layout": { "geo": { "bgcolor": "white", "showland": true, "lakecolor": "white", "landcolor": "white", "showlakes": true, "subunitcolor": "#C8D4E3" }, "font": { "color": "#2a3f5f" }, "polar": { "bgcolor": "white", "radialaxis": { "ticks": "", "gridcolor": "#EBF0F8", "linecolor": "#EBF0F8" }, "angularaxis": { "ticks": "", "gridcolor": "#EBF0F8", "linecolor": "#EBF0F8" } }, "scene": { "xaxis": { "ticks": "", "gridcolor": "#DFE8F3", "gridwidth": 2, "linecolor": "#EBF0F8", "zerolinecolor": "#EBF0F8", "showbackground": true, "backgroundcolor": "white" }, "yaxis": { "ticks": "", "gridcolor": "#DFE8F3", "gridwidth": 2, "linecolor": "#EBF0F8", "zerolinecolor": "#EBF0F8", "showbackground": true, "backgroundcolor": "white" }, "zaxis": { "ticks": "", "gridcolor": "#DFE8F3", "gridwidth": 2, "linecolor": "#EBF0F8", "zerolinecolor": "#EBF0F8", "showbackground": true, "backgroundcolor": "white" } }, "title": { "x": 0.05 }, "xaxis": { "ticks": "", "gridcolor": "#EBF0F8", "linecolor": "#EBF0F8", "automargin": true, "zerolinecolor": "#EBF0F8", "zerolinewidth": 2 }, "yaxis": { "ticks": "", "gridcolor": "#EBF0F8", "linecolor": "#EBF0F8", "automargin": true, "zerolinecolor": "#EBF0F8", "zerolinewidth": 2 }, "ternary": { "aaxis": { "ticks": "", "gridcolor": "#DFE8F3", "linecolor": "#A2B1C6" }, "baxis": { "ticks": "", "gridcolor": "#DFE8F3", "linecolor": "#A2B1C6" }, "caxis": { "ticks": "", "gridcolor": "#DFE8F3", "linecolor": "#A2B1C6" }, "bgcolor": "white" }, "colorway": [ "#636efa", "#EF553B", "#00cc96", "#ab63fa", "#19d3f3", "#e763fa", "#fecb52", "#ffa15a", "#ff6692", "#b6e880" ], "hovermode": "closest", "colorscale": { "diverging": [ [ 0, "#8e0152" ], [ 0.1, "#c51b7d" ], [ 0.2, "#de77ae" ], [ 0.3, "#f1b6da" ], [ 0.4, "#fde0ef" ], [ 0.5, "#f7f7f7" ], [ 0.6, "#e6f5d0" ], [ 0.7, "#b8e186" ], [ 0.8, "#7fbc41" ], [ 0.9, "#4d9221" ], [ 1, "#276419" ] ], "sequential": [ [ 0, "#0508b8" ], [ 0.0893854748603352, "#1910d8" ], [ 0.1787709497206704, "#3c19f0" ], [ 0.2681564245810056, "#6b1cfb" ], [ 0.3575418994413408, "#981cfd" ], [ 0.44692737430167595, "#bf1cfd" ], [ 0.5363128491620112, "#dd2bfd" ], [ 0.6256983240223464, "#f246fe" ], [ 0.7150837988826816, "#fc67fd" ], [ 0.8044692737430168, "#fe88fc" ], [ 0.8938547486033519, "#fea5fd" ], [ 0.9832402234636871, "#febefe" ], [ 1, "#fec3fe" ] ], "sequentialminus": [ [ 0, "#0508b8" ], [ 0.0893854748603352, "#1910d8" ], [ 0.1787709497206704, "#3c19f0" ], [ 0.2681564245810056, "#6b1cfb" ], [ 0.3575418994413408, "#981cfd" ], [ 0.44692737430167595, "#bf1cfd" ], [ 0.5363128491620112, "#dd2bfd" ], [ 0.6256983240223464, "#f246fe" ], [ 0.7150837988826816, "#fc67fd" ], [ 0.8044692737430168, "#fe88fc" ], [ 0.8938547486033519, "#fea5fd" ], [ 0.9832402234636871, "#febefe" ], [ 1, "#fec3fe" ] ] }, "plot_bgcolor": "white", "paper_bgcolor": "white", "shapedefaults": { "line": { "width": 0 }, "opacity": 0.4, "fillcolor": "#506784" }, "annotationdefaults": { "arrowhead": 0, "arrowcolor": "#506784", "arrowwidth": 1 } }, "themeRef": "PLOTLY_WHITE" } } }, "height": null, "width": null, "user": { "profile_url": "https://chart-studio.plotly.com/~machael", "avatar_url": "https://storage.googleapis.com/plotly-prod-profiles/56.jpg", "background_url": "https://storage.googleapis.com/plotly-prod-profiles/bg-5.jpg", "bio": "", "nickname": "", "website": "", "stream_tokens": null, "feature_set_id": null, "csrf_token": null, "date_joined": "2025-08-28 09:02:49", "mapbox_access_tokens": null, "has_password": null, "username": "machael", "email": null, "is_active": null, "readonly": null, "is_dash_creator": null, "dash_created_count": null, "is_chart_creator": null, "charts_created_count": null } }, { "creation_time": "2025-09-02T09:18:56.254269Z", "comments": { "results": [], "count": 0 }, "parented": true, "embed_url": "https://chart-studio.plotly.com/~tinkasingh/269.embed", "fid": "tinkasingh:269", "filename": "PM2.5", "filetype": "plot", "img_url": "https://storage.googleapis.com/plotly-prod-images/tinkasingh/269/9_0NZYR8YCK7O66RXDZ5J5UDANM8XMTR.png", "image_urls": { "default": "https://storage.googleapis.com/plotly-prod-images/tinkasingh/269/2_2OJ4TP34CYO6FPCHC2GD3SG9AFXZA3.png", "block-thumb": "https://storage.googleapis.com/plotly-prod-images/tinkasingh/269/8_PS9D0BKXQMLTRRHRC5PQ94QIEI3WKN.png", "list-thumb": "https://storage.googleapis.com/plotly-prod-images/tinkasingh/269/9_0NZYR8YCK7O66RXDZ5J5UDANM8XMTR.png" }, "api_urls": { "files": "https://api.plotly.com/v2/files/tinkasingh:269", "plots": "https://api.plotly.com/v2/plots/tinkasingh:269", "parent": "https://api.plotly.com/v2/folders/home?user=tinkasingh" }, "owner": "tinkasingh", "parent": -1, "preview": "", "referencers": [], "references": [], "title": "", "views": 0, "web_url": "https://chart-studio.plotly.com/~tinkasingh/269/", "world_readable": true, "date_modified": "2025-09-02T09:18:56.265Z", "stars": { "results": [], "count": 0 }, "collaborators": { "results": [], "count": 0 }, "subfolder_count": null, "refresh_interval": null, "organize_view_url": "https://chart-studio.plotly.com/~tinkasingh/269/", "current_user_permission": "read", "is_theme": null, "is_template": false, "autosize": true, "caption": "", "figure": { "data": [ { "uid": "dc984e", "line": { "color": "#7F7F7F" }, "meta": { "columnNames": { "x": "Anand Vihar, x", "y": "Anand Vihar, y" } }, "mode": "lines", "name": "Anand Vihar", "type": "scatter", "xsrc": "tinkasingh:268:1e6fd9", "ysrc": "tinkasingh:268:926869", "opacity": 0.8 }, { "uid": "181912", "line": { "color": "#317DBD" }, "meta": { "columnNames": { "x": "NSIT Dwarka, x", "y": "NSIT Dwarka, y" } }, "mode": "lines", "name": "NSIT Dwarka", "type": "scatter", "xsrc": "tinkasingh:268:a98f88", "ysrc": "tinkasingh:268:de0576", "opacity": 0.8 }, { "uid": "66dbc7", "line": { "color": "#17BECF" }, "meta": { "columnNames": { "x": "Shadipur, x", "y": "Shadipur, y" } }, "mode": "lines", "name": "Shadipur", "type": "scatter", "xsrc": "tinkasingh:268:747a39", "ysrc": "tinkasingh:268:d7d390", "opacity": 0.8 }, { "uid": "73f4dd", "line": { "color": "#498015" }, "meta": { "columnNames": { "x": "IHBAS, x", "y": "IHBAS, y" } }, "mode": "lines", "name": "IHBAS, y", "type": "scatter", "xsrc": "tinkasingh:268:627f42", "ysrc": "tinkasingh:268:e1e84b", "opacity": 0.8 }, { "uid": "4325a7", "line": { "color": "#9E4634" }, "meta": { "columnNames": { "x": "DTU, x", "y": "DTU, y" } }, "mode": "lines", "name": "DTU", "type": "scatter", "xsrc": "tinkasingh:268:e5746f", "ysrc": "tinkasingh:268:ed62e8", "opacity": 0.8 }, { "uid": "b6e76b", "line": { "color": "#BD319D" }, "meta": { "columnNames": { "x": "Mandir Marg, x", "y": "Mandir Marg, y" } }, "mode": "lines", "name": "Mandir Marg", "type": "scatter", "xsrc": "tinkasingh:268:927115", "ysrc": "tinkasingh:268:c2198d", "opacity": 0.8 } ], "frames": [], "layout": { "title": { "text": "PM 2.5 for Delhi" }, "xaxis": { "type": "date", "range": [ "2015-03-23", "2017-04-17" ], "title": { "text": "Time" }, "autorange": true, "rangeslider": { "range": [ "2015-03-23", "2017-04-17" ], "yaxis": { "rangemode": "match" }, "autorange": true }, "rangeselector": { "buttons": [ { "step": "day", "count": 1, "label": "1 day", "stepmode": "backward" }, { "step": "hour", "count": 6, "label": "6 hours", "stepmode": "backward" }, { "step": "all" } ] } }, "yaxis": { "type": "linear", "range": [ -87.84277777777777, 1038.2127777777778 ], "title": { "text": "PM 2.5 (µg/m³)" }, "autorange": true }, "autosize": true } }, "height": null, "width": null, "user": { "profile_url": "https://chart-studio.plotly.com/~tinkasingh", "avatar_url": "https://storage.googleapis.com/plotly-prod-profiles/38.jpg", "background_url": "https://storage.googleapis.com/plotly-prod-profiles/bg-5.jpg", "bio": "", "nickname": "", "website": "", "stream_tokens": null, "feature_set_id": null, "csrf_token": null, "date_joined": "2017-11-05 14:36:17", "mapbox_access_tokens": null, "has_password": null, "username": "tinkasingh", "email": null, "is_active": null, "readonly": null, "is_dash_creator": null, "dash_created_count": null, "is_chart_creator": null, "charts_created_count": null } }, { "creation_time": "2025-09-02T09:10:47.416772Z", "comments": { "results": [], "count": 0 }, "parented": true, "embed_url": "https://chart-studio.plotly.com/~mballage/1.embed", "fid": "mballage:1", "filename": "Plot 1", "filetype": "plot", "img_url": "https://storage.googleapis.com/plotly-prod-images/mballage/1/9_1FARUQDFCKCMUFGZ8SRFI90VU8KFDP.png", "image_urls": { "default": "https://storage.googleapis.com/plotly-prod-images/mballage/1/2_0BLORG44C2NG3R206IQOFO5JP2Q2N3.png", "block-thumb": "https://storage.googleapis.com/plotly-prod-images/mballage/1/8_VC9RP6WCIKNTVA9NMAWAQDEMND9EK5.png", "list-thumb": "https://storage.googleapis.com/plotly-prod-images/mballage/1/9_1FARUQDFCKCMUFGZ8SRFI90VU8KFDP.png" }, "api_urls": { "files": "https://api.plotly.com/v2/files/mballage:1", "plots": "https://api.plotly.com/v2/plots/mballage:1", "parent": "https://api.plotly.com/v2/folders/home?user=mballage" }, "owner": "mballage", "parent": -1, "preview": "", "referencers": [], "references": [], "title": "", "views": 0, "web_url": "https://chart-studio.plotly.com/~mballage/1/", "world_readable": true, "date_modified": "2025-09-02T09:10:47.428Z", "stars": { "results": [], "count": 0 }, "collaborators": { "results": [], "count": 0 }, "subfolder_count": null, "refresh_interval": null, "organize_view_url": "https://chart-studio.plotly.com/~mballage/1/", "current_user_permission": "read", "is_theme": null, "is_template": true, "autosize": true, "caption": "", "figure": { "data": [ { "meta": { "columnNames": { "x": "", "y": "B" } }, "mode": "markers", "name": "0.1", "type": "box", "ysrc": "mballage:0:c5092b", "boxpoints": false, "orientation": "v" }, { "meta": { "columnNames": { "x": "", "y": "C" } }, "name": "0.11", "type": "box", "ysrc": "mballage:0:0ac26f", "boxpoints": false }, { "meta": { "columnNames": { "y": "D" } }, "name": "0.12", "type": "box", "ysrc": "mballage:0:d673b7", "boxpoints": false }, { "meta": { "columnNames": { "y": "E" } }, "name": "0.13", "type": "box", "ysrc": "mballage:0:79a008", "boxpoints": false }, { "meta": { "columnNames": { "x": "", "y": "F" } }, "name": "0.14", "type": "box", "ysrc": "mballage:0:a1dbb8", "visible": true, "boxpoints": false }, { "meta": { "columnNames": { "y": "G" } }, "name": "0.15", "type": "box", "ysrc": "mballage:0:865f35", "boxpoints": false }, { "meta": { "columnNames": { "y": "H" } }, "name": "0.16", "type": "box", "ysrc": "mballage:0:edca40", "boxpoints": false }, { "meta": { "columnNames": { "x": "", "y": "I" } }, "name": "0.17", "type": "box", "ysrc": "mballage:0:01a992", "boxpoints": false }, { "meta": { "columnNames": { "y": "J" } }, "name": "0.18", "type": "box", "ysrc": "mballage:0:3e13d1", "boxpoints": false }, { "meta": { "columnNames": { "y": "K" } }, "name": "0.19", "type": "box", "ysrc": "mballage:0:d115c8", "boxpoints": false }, { "meta": { "columnNames": { "y": "L" } }, "name": "0.2", "type": "box", "ysrc": "mballage:0:2676fc", "boxpoints": false } ], "frames": [], "layout": { "title": { "text": "Gaussian noise - St-Albert - 2025.07.15" }, "xaxis": { "type": "linear", "range": [ 0.09659905796682214, 0.2045423880913142 ], "title": { "text": "std" }, "domain": [ 0, 1 ], "autorange": false }, "yaxis": { "type": "linear", "range": [ -8.514928319561971, 101.05543234288798 ], "title": { "text": "absolute error (seconds)" }, "domain": [ 0, 1 ], "autorange": false }, "autosize": true, "dragmode": "zoom", "template": { "data": { "bar": [ { "type": "bar", "marker": { "colorbar": { "ticks": "", "outlinewidth": 0 } } } ], "table": [ { "type": "table", "cells": { "fill": { "color": "#EBF0F8" }, "line": { "color": "white" } }, "header": { "fill": { "color": "#C8D4E3" }, "line": { "color": "white" } } } ], "carpet": [ { "type": "carpet", "aaxis": { "gridcolor": "#C8D4E3", "linecolor": "#C8D4E3", "endlinecolor": "#2a3f5f", "minorgridcolor": "#C8D4E3", "startlinecolor": "#2a3f5f" }, "baxis": { "gridcolor": "#C8D4E3", "linecolor": "#C8D4E3", "endlinecolor": "#2a3f5f", "minorgridcolor": "#C8D4E3", "startlinecolor": "#2a3f5f" } } ], "mesh3d": [ { "type": "mesh3d", "colorbar": { "ticks": "", "outlinewidth": 0 } } ], "contour": [ { "type": "contour", "colorbar": { "ticks": "", "outlinewidth": 0 }, "autocolorscale": true } ], "heatmap": [ { "type": "heatmap", "colorbar": { "ticks": "", "outlinewidth": 0 }, "autocolorscale": true } ], "scatter": [ { "type": "scatter", "marker": { "colorbar": { "ticks": "", "outlinewidth": 0 } } } ], "surface": [ { "type": "surface", "colorbar": { "ticks": "", "outlinewidth": 0 } } ], "heatmapgl": [ { "type": "heatmapgl", "colorbar": { "ticks": "", "outlinewidth": 0 } } ], "histogram": [ { "type": "histogram", "marker": { "colorbar": { "ticks": "", "outlinewidth": 0 } } } ], "parcoords": [ { "line": { "colorbar": { "ticks": "", "outlinewidth": 0 } }, "type": "parcoords" } ], "scatter3d": [ { "type": "scatter3d", "marker": { "colorbar": { "ticks": "", "outlinewidth": 0 } } } ], "scattergl": [ { "type": "scattergl", "marker": { "colorbar": { "ticks": "", "outlinewidth": 0 } } } ], "choropleth": [ { "type": "choropleth", "colorbar": { "ticks": "", "outlinewidth": 0 } } ], "scattergeo": [ { "type": "scattergeo", "marker": { "colorbar": { "ticks": "", "outlinewidth": 0 } } } ], "histogram2d": [ { "type": "histogram2d", "colorbar": { "ticks": "", "outlinewidth": 0 }, "autocolorscale": true } ], "scatterpolar": [ { "type": "scatterpolar", "marker": { "colorbar": { "ticks": "", "outlinewidth": 0 } } } ], "contourcarpet": [ { "type": "contourcarpet", "colorbar": { "ticks": "", "outlinewidth": 0 } } ], "scattercarpet": [ { "type": "scattercarpet", "marker": { "colorbar": { "ticks": "", "outlinewidth": 0 } } } ], "scattermapbox": [ { "type": "scattermapbox", "marker": { "colorbar": { "ticks": "", "outlinewidth": 0 } } } ], "scatterpolargl": [ { "type": "scatterpolargl", "marker": { "colorbar": { "ticks": "", "outlinewidth": 0 } } } ], "scatterternary": [ { "type": "scatterternary", "marker": { "colorbar": { "ticks": "", "outlinewidth": 0 } } } ], "histogram2dcontour": [ { "type": "histogram2dcontour", "colorbar": { "ticks": "", "outlinewidth": 0 }, "autocolorscale": true } ] }, "layout": { "geo": { "bgcolor": "white", "showland": true, "lakecolor": "white", "landcolor": "white", "showlakes": true, "subunitcolor": "#C8D4E3" }, "font": { "color": "#2a3f5f" }, "polar": { "bgcolor": "white", "radialaxis": { "ticks": "", "gridcolor": "#EBF0F8", "linecolor": "#EBF0F8" }, "angularaxis": { "ticks": "", "gridcolor": "#EBF0F8", "linecolor": "#EBF0F8" } }, "scene": { "xaxis": { "ticks": "", "gridcolor": "#DFE8F3", "gridwidth": 2, "linecolor": "#EBF0F8", "zerolinecolor": "#EBF0F8", "showbackground": true, "backgroundcolor": "white" }, "yaxis": { "ticks": "", "gridcolor": "#DFE8F3", "gridwidth": 2, "linecolor": "#EBF0F8", "zerolinecolor": "#EBF0F8", "showbackground": true, "backgroundcolor": "white" }, "zaxis": { "ticks": "", "gridcolor": "#DFE8F3", "gridwidth": 2, "linecolor": "#EBF0F8", "zerolinecolor": "#EBF0F8", "showbackground": true, "backgroundcolor": "white" } }, "title": { "x": 0.05 }, "xaxis": { "ticks": "", "gridcolor": "#EBF0F8", "linecolor": "#EBF0F8", "automargin": true, "zerolinecolor": "#EBF0F8", "zerolinewidth": 2 }, "yaxis": { "ticks": "", "gridcolor": "#EBF0F8", "linecolor": "#EBF0F8", "automargin": true, "zerolinecolor": "#EBF0F8", "zerolinewidth": 2 }, "ternary": { "aaxis": { "ticks": "", "gridcolor": "#DFE8F3", "linecolor": "#A2B1C6" }, "baxis": { "ticks": "", "gridcolor": "#DFE8F3", "linecolor": "#A2B1C6" }, "caxis": { "ticks": "", "gridcolor": "#DFE8F3", "linecolor": "#A2B1C6" }, "bgcolor": "white" }, "colorway": [ "#636efa", "#EF553B", "#00cc96", "#ab63fa", "#19d3f3", "#e763fa", "#fecb52", "#ffa15a", "#ff6692", "#b6e880" ], "hovermode": "closest", "colorscale": { "diverging": [ [ 0, "#8e0152" ], [ 0.1, "#c51b7d" ], [ 0.2, "#de77ae" ], [ 0.3, "#f1b6da" ], [ 0.4, "#fde0ef" ], [ 0.5, "#f7f7f7" ], [ 0.6, "#e6f5d0" ], [ 0.7, "#b8e186" ], [ 0.8, "#7fbc41" ], [ 0.9, "#4d9221" ], [ 1, "#276419" ] ], "sequential": [ [ 0, "#0508b8" ], [ 0.0893854748603352, "#1910d8" ], [ 0.1787709497206704, "#3c19f0" ], [ 0.2681564245810056, "#6b1cfb" ], [ 0.3575418994413408, "#981cfd" ], [ 0.44692737430167595, "#bf1cfd" ], [ 0.5363128491620112, "#dd2bfd" ], [ 0.6256983240223464, "#f246fe" ], [ 0.7150837988826816, "#fc67fd" ], [ 0.8044692737430168, "#fe88fc" ], [ 0.8938547486033519, "#fea5fd" ], [ 0.9832402234636871, "#febefe" ], [ 1, "#fec3fe" ] ], "sequentialminus": [ [ 0, "#0508b8" ], [ 0.0893854748603352, "#1910d8" ], [ 0.1787709497206704, "#3c19f0" ], [ 0.2681564245810056, "#6b1cfb" ], [ 0.3575418994413408, "#981cfd" ], [ 0.44692737430167595, "#bf1cfd" ], [ 0.5363128491620112, "#dd2bfd" ], [ 0.6256983240223464, "#f246fe" ], [ 0.7150837988826816, "#fc67fd" ], [ 0.8044692737430168, "#fe88fc" ], [ 0.8938547486033519, "#fea5fd" ], [ 0.9832402234636871, "#febefe" ], [ 1, "#fec3fe" ] ] }, "plot_bgcolor": "white", "paper_bgcolor": "white", "shapedefaults": { "line": { "width": 0 }, "opacity": 0.4, "fillcolor": "#506784" }, "annotationdefaults": { "arrowhead": 0, "arrowcolor": "#506784", "arrowwidth": 1 } }, "themeRef": "PLOTLY_WHITE" } } }, "height": null, "width": null, "user": { "profile_url": "https://chart-studio.plotly.com/~mballage", "avatar_url": "https://storage.googleapis.com/plotly-prod-profiles/68.jpg", "background_url": "https://storage.googleapis.com/plotly-prod-profiles/bg-12.jpg", "bio": "", "nickname": "", "website": "", "stream_tokens": null, "feature_set_id": null, "csrf_token": null, "date_joined": "2025-09-02 07:34:12", "mapbox_access_tokens": null, "has_password": null, "username": "mballage", "email": null, "is_active": null, "readonly": null, "is_dash_creator": null, "dash_created_count": null, "is_chart_creator": null, "charts_created_count": null } }, { "creation_time": "2025-09-02T09:02:17.781082Z", "comments": { "results": [], "count": 0 }, "parented": true, "embed_url": "https://chart-studio.plotly.com/~JohnJohnDoeDoe/9.embed", "fid": "JohnJohnDoeDoe:9", "filename": "something", "filetype": "plot", "img_url": "https://storage.googleapis.com/plotly-prod-images/JohnJohnDoeDoe/9/9_3LBKYVU2EGMRP31XH2HA5VT6BX6075.png", "image_urls": { "default": "https://storage.googleapis.com/plotly-prod-images/JohnJohnDoeDoe/9/2_JCDFITACMC6ZNFPDNTPNNUWNES84B7.png", "block-thumb": "https://storage.googleapis.com/plotly-prod-images/JohnJohnDoeDoe/9/8_JO36NLKSO00GRC90LZR058XR6K03W4.png", "list-thumb": "https://storage.googleapis.com/plotly-prod-images/JohnJohnDoeDoe/9/9_3LBKYVU2EGMRP31XH2HA5VT6BX6075.png" }, "api_urls": { "files": "https://api.plotly.com/v2/files/JohnJohnDoeDoe:9", "plots": "https://api.plotly.com/v2/plots/JohnJohnDoeDoe:9", "parent": "https://api.plotly.com/v2/folders/home?user=JohnJohnDoeDoe" }, "owner": "JohnJohnDoeDoe", "parent": -1, "preview": "", "referencers": [], "references": [], "title": "", "views": 0, "web_url": "https://chart-studio.plotly.com/~JohnJohnDoeDoe/9/", "world_readable": true, "date_modified": "2025-09-02T19:49:50.360Z", "stars": { "results": [], "count": 0 }, "collaborators": { "results": [], "count": 0 }, "subfolder_count": null, "refresh_interval": null, "organize_view_url": "https://chart-studio.plotly.com/~JohnJohnDoeDoe/9/", "current_user_permission": "read", "is_theme": null, "is_template": false, "autosize": true, "caption": "", "figure": { "data": [ { "meta": { "columnNames": { "x": "A", "y": "B", "text": "", "error_y": { "array": "C" } } }, "mode": "markers", "type": "bar", "xsrc": "JohnJohnDoeDoe:8:cb8691", "ysrc": "JohnJohnDoeDoe:8:36845d", "error_y": { "meta": { "columnNames": { "array": "C" } }, "type": "data", "visible": true, "arraysrc": "JohnJohnDoeDoe:8:fd0deb", "symmetric": true }, "hoverinfo": "x+y", "hoverlabel": { "align": "auto" }, "orientation": "v", "textposition": "none" } ], "frames": [], "layout": { "title": { "x": 0.02, "text": "Median Estimate of Sum of Discounts in Both Conditions" }, "xaxis": { "type": "category", "range": [ -0.5, 1.5 ], "title": { "text": "Conditions" }, "autorange": true }, "yaxis": { "type": "linear", "range": [ 0, 13292.105263157895 ], "title": { "text": "Median Estimate of Sum of Discounts" }, "autorange": true, "exponentformat": "none" }, "bargap": 0.18999999999999995, "margin": { "l": 80, "r": 450, "pad": 0 }, "autosize": true, "template": { "data": { "bar": [ { "type": "bar", "marker": { "colorbar": { "ticks": "", "outlinewidth": 0 } } } ], "table": [ { "type": "table", "cells": { "fill": { "color": "#EBF0F8" }, "line": { "color": "white" } }, "header": { "fill": { "color": "#C8D4E3" }, "line": { "color": "white" } } } ], "carpet": [ { "type": "carpet", "aaxis": { "gridcolor": "#C8D4E3", "linecolor": "#C8D4E3", "endlinecolor": "#2a3f5f", "minorgridcolor": "#C8D4E3", "startlinecolor": "#2a3f5f" }, "baxis": { "gridcolor": "#C8D4E3", "linecolor": "#C8D4E3", "endlinecolor": "#2a3f5f", "minorgridcolor": "#C8D4E3", "startlinecolor": "#2a3f5f" } } ], "mesh3d": [ { "type": "mesh3d", "colorbar": { "ticks": "", "outlinewidth": 0 } } ], "contour": [ { "type": "contour", "colorbar": { "ticks": "", "outlinewidth": 0 }, "autocolorscale": true } ], "heatmap": [ { "type": "heatmap", "colorbar": { "ticks": "", "outlinewidth": 0 }, "autocolorscale": true } ], "scatter": [ { "type": "scatter", "marker": { "colorbar": { "ticks": "", "outlinewidth": 0 } } } ], "surface": [ { "type": "surface", "colorbar": { "ticks": "", "outlinewidth": 0 } } ], "heatmapgl": [ { "type": "heatmapgl", "colorbar": { "ticks": "", "outlinewidth": 0 } } ], "histogram": [ { "type": "histogram", "marker": { "colorbar": { "ticks": "", "outlinewidth": 0 } } } ], "parcoords": [ { "line": { "colorbar": { "ticks": "", "outlinewidth": 0 } }, "type": "parcoords" } ], "scatter3d": [ { "type": "scatter3d", "marker": { "colorbar": { "ticks": "", "outlinewidth": 0 } } } ], "scattergl": [ { "type": "scattergl", "marker": { "colorbar": { "ticks": "", "outlinewidth": 0 } } } ], "choropleth": [ { "type": "choropleth", "colorbar": { "ticks": "", "outlinewidth": 0 } } ], "scattergeo": [ { "type": "scattergeo", "marker": { "colorbar": { "ticks": "", "outlinewidth": 0 } } } ], "histogram2d": [ { "type": "histogram2d", "colorbar": { "ticks": "", "outlinewidth": 0 }, "autocolorscale": true } ], "scatterpolar": [ { "type": "scatterpolar", "marker": { "colorbar": { "ticks": "", "outlinewidth": 0 } } } ], "contourcarpet": [ { "type": "contourcarpet", "colorbar": { "ticks": "", "outlinewidth": 0 } } ], "scattercarpet": [ { "type": "scattercarpet", "marker": { "colorbar": { "ticks": "", "outlinewidth": 0 } } } ], "scattermapbox": [ { "type": "scattermapbox", "marker": { "colorbar": { "ticks": "", "outlinewidth": 0 } } } ], "scatterpolargl": [ { "type": "scatterpolargl", "marker": { "colorbar": { "ticks": "", "outlinewidth": 0 } } } ], "scatterternary": [ { "type": "scatterternary", "marker": { "colorbar": { "ticks": "", "outlinewidth": 0 } } } ], "histogram2dcontour": [ { "type": "histogram2dcontour", "colorbar": { "ticks": "", "outlinewidth": 0 }, "autocolorscale": true } ] }, "layout": { "geo": { "bgcolor": "white", "showland": true, "lakecolor": "white", "landcolor": "white", "showlakes": true, "subunitcolor": "#C8D4E3" }, "font": { "color": "#2a3f5f" }, "polar": { "bgcolor": "white", "radialaxis": { "ticks": "", "gridcolor": "#EBF0F8", "linecolor": "#EBF0F8" }, "angularaxis": { "ticks": "", "gridcolor": "#EBF0F8", "linecolor": "#EBF0F8" } }, "scene": { "xaxis": { "ticks": "", "gridcolor": "#DFE8F3", "gridwidth": 2, "linecolor": "#EBF0F8", "zerolinecolor": "#EBF0F8", "showbackground": true, "backgroundcolor": "white" }, "yaxis": { "ticks": "", "gridcolor": "#DFE8F3", "gridwidth": 2, "linecolor": "#EBF0F8", "zerolinecolor": "#EBF0F8", "showbackground": true, "backgroundcolor": "white" }, "zaxis": { "ticks": "", "gridcolor": "#DFE8F3", "gridwidth": 2, "linecolor": "#EBF0F8", "zerolinecolor": "#EBF0F8", "showbackground": true, "backgroundcolor": "white" } }, "title": { "x": 0.05 }, "xaxis": { "ticks": "", "gridcolor": "#EBF0F8", "linecolor": "#EBF0F8", "automargin": true, "zerolinecolor": "#EBF0F8", "zerolinewidth": 2 }, "yaxis": { "ticks": "", "gridcolor": "#EBF0F8", "linecolor": "#EBF0F8", "automargin": true, "zerolinecolor": "#EBF0F8", "zerolinewidth": 2 }, "ternary": { "aaxis": { "ticks": "", "gridcolor": "#DFE8F3", "linecolor": "#A2B1C6" }, "baxis": { "ticks": "", "gridcolor": "#DFE8F3", "linecolor": "#A2B1C6" }, "caxis": { "ticks": "", "gridcolor": "#DFE8F3", "linecolor": "#A2B1C6" }, "bgcolor": "white" }, "colorway": [ "#636efa", "#EF553B", "#00cc96", "#ab63fa", "#19d3f3", "#e763fa", "#fecb52", "#ffa15a", "#ff6692", "#b6e880" ], "hovermode": "closest", "colorscale": { "diverging": [ [ 0, "#8e0152" ], [ 0.1, "#c51b7d" ], [ 0.2, "#de77ae" ], [ 0.3, "#f1b6da" ], [ 0.4, "#fde0ef" ], [ 0.5, "#f7f7f7" ], [ 0.6, "#e6f5d0" ], [ 0.7, "#b8e186" ], [ 0.8, "#7fbc41" ], [ 0.9, "#4d9221" ], [ 1, "#276419" ] ], "sequential": [ [ 0, "#0508b8" ], [ 0.0893854748603352, "#1910d8" ], [ 0.1787709497206704, "#3c19f0" ], [ 0.2681564245810056, "#6b1cfb" ], [ 0.3575418994413408, "#981cfd" ], [ 0.44692737430167595, "#bf1cfd" ], [ 0.5363128491620112, "#dd2bfd" ], [ 0.6256983240223464, "#f246fe" ], [ 0.7150837988826816, "#fc67fd" ], [ 0.8044692737430168, "#fe88fc" ], [ 0.8938547486033519, "#fea5fd" ], [ 0.9832402234636871, "#febefe" ], [ 1, "#fec3fe" ] ], "sequentialminus": [ [ 0, "#0508b8" ], [ 0.0893854748603352, "#1910d8" ], [ 0.1787709497206704, "#3c19f0" ], [ 0.2681564245810056, "#6b1cfb" ], [ 0.3575418994413408, "#981cfd" ], [ 0.44692737430167595, "#bf1cfd" ], [ 0.5363128491620112, "#dd2bfd" ], [ 0.6256983240223464, "#f246fe" ], [ 0.7150837988826816, "#fc67fd" ], [ 0.8044692737430168, "#fe88fc" ], [ 0.8938547486033519, "#fea5fd" ], [ 0.9832402234636871, "#febefe" ], [ 1, "#fec3fe" ] ] }, "plot_bgcolor": "white", "paper_bgcolor": "white", "shapedefaults": { "line": { "width": 0 }, "opacity": 0.4, "fillcolor": "#506784" }, "annotationdefaults": { "arrowhead": 0, "arrowcolor": "#506784", "arrowwidth": 1 } }, "themeRef": "PLOTLY_WHITE" }, "showlegend": false, "bargroupgap": 0.38 } }, "height": null, "width": null, "user": { "profile_url": "https://chart-studio.plotly.com/~JohnJohnDoeDoe", "avatar_url": "https://storage.googleapis.com/plotly-prod-profiles/12.jpg", "background_url": "https://storage.googleapis.com/plotly-prod-profiles/bg-3.jpg", "bio": "", "nickname": "", "website": "", "stream_tokens": null, "feature_set_id": null, "csrf_token": null, "date_joined": "2025-07-28 14:07:39", "mapbox_access_tokens": null, "has_password": null, "username": "JohnJohnDoeDoe", "email": null, "is_active": null, "readonly": null, "is_dash_creator": null, "dash_created_count": null, "is_chart_creator": null, "charts_created_count": null } }, { "creation_time": "2025-09-02T09:01:17.451979Z", "comments": { "results": [], "count": 0 }, "parented": true, "embed_url": "https://chart-studio.plotly.com/~victoria.delucas/2.embed", "fid": "victoria.delucas:2", "filename": "Plot 2", "filetype": "plot", "img_url": "https://storage.googleapis.com/plotly-prod-images/victoria.delucas/2/9_QE24NMCHU3JAXLESO3OISPJ9BUSEMJ.png", "image_urls": { "default": "https://storage.googleapis.com/plotly-prod-images/victoria.delucas/2/2_US7NFO129BGBPJ05JHL3EXNX1QW2CF.png", "block-thumb": "https://storage.googleapis.com/plotly-prod-images/victoria.delucas/2/8_CF9VF221RPWPCCRS8VHQG560WYXQS1.png", "list-thumb": "https://storage.googleapis.com/plotly-prod-images/victoria.delucas/2/9_QE24NMCHU3JAXLESO3OISPJ9BUSEMJ.png" }, "api_urls": { "files": "https://api.plotly.com/v2/files/victoria.delucas:2", "plots": "https://api.plotly.com/v2/plots/victoria.delucas:2", "parent": "https://api.plotly.com/v2/folders/home?user=victoria.delucas" }, "owner": "victoria.delucas", "parent": -1, "preview": "", "referencers": [], "references": [], "title": "", "views": 0, "web_url": "https://chart-studio.plotly.com/~victoria.delucas/2/", "world_readable": true, "date_modified": "2025-09-02T09:01:17.464Z", "stars": { "results": [], "count": 0 }, "collaborators": { "results": [], "count": 0 }, "subfolder_count": null, "refresh_interval": null, "organize_view_url": "https://chart-studio.plotly.com/~victoria.delucas/2/", "current_user_permission": "read", "is_theme": null, "is_template": false, "autosize": true, "caption": "", "figure": { "data": [ { "uid": "47d11b", "meta": { "columnNames": { "x": "x", "y": "y", "z": "z" } }, "mode": "markers", "type": "scatter3d", "xsrc": "victoria.delucas:1:a84abd", "ysrc": "victoria.delucas:1:a651bf", "zsrc": "victoria.delucas:1:540619", "marker": { "cmax": 2.3142891795941964, "cmin": -2.3933207624421855, "meta": { "columnNames": { "color": "color" } }, "size": 12, "cauto": true, "opacity": 0.8, "colorsrc": "victoria.delucas:1:bebdf2", "colorscale": "Viridis" } } ], "frames": [], "layout": { "scene": { "aspectratio": { "x": 1.0560558127413222, "y": 1.11481060831123, "z": 0.8493995683121707 } }, "margin": { "b": 0, "l": 0, "r": 0, "t": 0 }, "autosize": true } }, "height": null, "width": null, "user": { "profile_url": "https://chart-studio.plotly.com/~victoria.delucas", "avatar_url": "https://storage.googleapis.com/plotly-prod-profiles/87.jpg", "background_url": "https://storage.googleapis.com/plotly-prod-profiles/bg-6.jpg", "bio": "", "nickname": "", "website": "", "stream_tokens": null, "feature_set_id": null, "csrf_token": null, "date_joined": "2025-09-02 08:58:32", "mapbox_access_tokens": null, "has_password": null, "username": "victoria.delucas", "email": null, "is_active": null, "readonly": null, "is_dash_creator": null, "dash_created_count": null, "is_chart_creator": null, "charts_created_count": null } }, { "creation_time": "2025-09-02T08:33:34.244645Z", "comments": { "results": [], "count": 0 }, "parented": true, "embed_url": "https://chart-studio.plotly.com/~wangzhihao/74.embed", "fid": "wangzhihao:74", "filename": "Plot 74", "filetype": "plot", "img_url": "https://storage.googleapis.com/plotly-prod-images/wangzhihao/74/9_J7NVXXL27UFHD3FAVI4RP4ZY8TGVQ3.png", "image_urls": { "default": "https://storage.googleapis.com/plotly-prod-images/wangzhihao/74/2_5D9I2PV0ARGFNP85STTKVQMTBKEEK6.png", "block-thumb": "https://storage.googleapis.com/plotly-prod-images/wangzhihao/74/8_QWNOPCXI1W3V503PRXE25Q5Z7N4HIX.png", "list-thumb": "https://storage.googleapis.com/plotly-prod-images/wangzhihao/74/9_J7NVXXL27UFHD3FAVI4RP4ZY8TGVQ3.png" }, "api_urls": { "files": "https://api.plotly.com/v2/files/wangzhihao:74", "plots": "https://api.plotly.com/v2/plots/wangzhihao:74", "parent": "https://api.plotly.com/v2/folders/home?user=wangzhihao" }, "owner": "wangzhihao", "parent": -1, "preview": "", "referencers": [], "references": [], "title": "", "views": 0, "web_url": "https://chart-studio.plotly.com/~wangzhihao/74/", "world_readable": true, "date_modified": "2025-09-02T08:33:34.255Z", "stars": { "results": [], "count": 0 }, "collaborators": { "results": [], "count": 0 }, "subfolder_count": null, "refresh_interval": null, "organize_view_url": "https://chart-studio.plotly.com/~wangzhihao/74/", "current_user_permission": "read", "is_theme": null, "is_template": false, "autosize": true, "caption": "", "figure": { "data": [ { "meta": { "columnNames": { "x": "A", "y": "C" } }, "mode": "lines", "name": "300k<br>", "type": "scatter", "xsrc": "wangzhihao:73:e29719", "ysrc": "wangzhihao:73:52710e" }, { "meta": { "columnNames": { "x": "E", "y": "G" } }, "mode": "lines", "name": "500k", "type": "scatter", "xsrc": "wangzhihao:73:0f6e80", "ysrc": "wangzhihao:73:dcc152", "stackgroup": null }, { "meta": { "columnNames": { "x": "I", "y": "K" } }, "mode": "lines", "name": "700k", "type": "scatter", "xsrc": "wangzhihao:73:c4270f", "ysrc": "wangzhihao:73:0fd544", "stackgroup": null }, { "meta": { "columnNames": { "x": "M", "y": "O" } }, "mode": "lines", "name": "900k", "type": "scatter", "xsrc": "wangzhihao:73:e955ce", "ysrc": "wangzhihao:73:3ab70f", "stackgroup": null }, { "meta": { "columnNames": { "x": "Q", "y": "S" } }, "mode": "lines", "name": "1500k", "type": "scatter", "xsrc": "wangzhihao:73:3e643c", "ysrc": "wangzhihao:73:db26d2", "stackgroup": null }, { "meta": { "columnNames": { "x": "U", "y": "W" } }, "mode": "lines", "name": "2500k", "type": "scatter", "xsrc": "wangzhihao:73:9cbe70", "ysrc": "wangzhihao:73:20a15f", "stackgroup": null }, { "meta": { "columnNames": { "x": "Y", "y": "AA" } }, "mode": "lines", "name": "3000k", "type": "scatter", "xsrc": "wangzhihao:73:1ba333", "ysrc": "wangzhihao:73:68e8d8", "stackgroup": null }, { "meta": { "columnNames": { "x": "A", "y": "0" } }, "mode": "lines", "name": "3300k", "type": "scatter", "xsrc": "wangzhihao:73:e29719", "ysrc": "wangzhihao:73:958649", "stackgroup": null } ], "frames": [], "layout": { "xaxis": { "range": [ 19.95, 20.05 ], "title": { "text": "角度" }, "autorange": true }, "yaxis": { "type": "linear", "range": [ -1.1888888888888888e-06, 2.2588888888888888e-05 ], "title": { "text": "放射収量" }, "autorange": true }, "autosize": true, "template": { "data": { "bar": [ { "type": "bar", "marker": { "colorbar": { "ticks": "", "outlinewidth": 0 } } } ], "table": [ { "type": "table", "cells": { "fill": { "color": "#EBF0F8" }, "line": { "color": "white" } }, "header": { "fill": { "color": "#C8D4E3" }, "line": { "color": "white" } } } ], "carpet": [ { "type": "carpet", "aaxis": { "gridcolor": "#C8D4E3", "linecolor": "#C8D4E3", "endlinecolor": "#2a3f5f", "minorgridcolor": "#C8D4E3", "startlinecolor": "#2a3f5f" }, "baxis": { "gridcolor": "#C8D4E3", "linecolor": "#C8D4E3", "endlinecolor": "#2a3f5f", "minorgridcolor": "#C8D4E3", "startlinecolor": "#2a3f5f" } } ], "mesh3d": [ { "type": "mesh3d", "colorbar": { "ticks": "", "outlinewidth": 0 } } ], "contour": [ { "type": "contour", "colorbar": { "ticks": "", "outlinewidth": 0 }, "autocolorscale": true } ], "heatmap": [ { "type": "heatmap", "colorbar": { "ticks": "", "outlinewidth": 0 }, "autocolorscale": true } ], "scatter": [ { "type": "scatter", "marker": { "colorbar": { "ticks": "", "outlinewidth": 0 } } } ], "surface": [ { "type": "surface", "colorbar": { "ticks": "", "outlinewidth": 0 } } ], "heatmapgl": [ { "type": "heatmapgl", "colorbar": { "ticks": "", "outlinewidth": 0 } } ], "histogram": [ { "type": "histogram", "marker": { "colorbar": { "ticks": "", "outlinewidth": 0 } } } ], "parcoords": [ { "line": { "colorbar": { "ticks": "", "outlinewidth": 0 } }, "type": "parcoords" } ], "scatter3d": [ { "type": "scatter3d", "marker": { "colorbar": { "ticks": "", "outlinewidth": 0 } } } ], "scattergl": [ { "type": "scattergl", "marker": { "colorbar": { "ticks": "", "outlinewidth": 0 } } } ], "choropleth": [ { "type": "choropleth", "colorbar": { "ticks": "", "outlinewidth": 0 } } ], "scattergeo": [ { "type": "scattergeo", "marker": { "colorbar": { "ticks": "", "outlinewidth": 0 } } } ], "histogram2d": [ { "type": "histogram2d", "colorbar": { "ticks": "", "outlinewidth": 0 }, "autocolorscale": true } ], "scatterpolar": [ { "type": "scatterpolar", "marker": { "colorbar": { "ticks": "", "outlinewidth": 0 } } } ], "contourcarpet": [ { "type": "contourcarpet", "colorbar": { "ticks": "", "outlinewidth": 0 } } ], "scattercarpet": [ { "type": "scattercarpet", "marker": { "colorbar": { "ticks": "", "outlinewidth": 0 } } } ], "scattermapbox": [ { "type": "scattermapbox", "marker": { "colorbar": { "ticks": "", "outlinewidth": 0 } } } ], "scatterpolargl": [ { "type": "scatterpolargl", "marker": { "colorbar": { "ticks": "", "outlinewidth": 0 } } } ], "scatterternary": [ { "type": "scatterternary", "marker": { "colorbar": { "ticks": "", "outlinewidth": 0 } } } ], "histogram2dcontour": [ { "type": "histogram2dcontour", "colorbar": { "ticks": "", "outlinewidth": 0 }, "autocolorscale": true } ] }, "layout": { "geo": { "bgcolor": "white", "showland": true, "lakecolor": "white", "landcolor": "white", "showlakes": true, "subunitcolor": "#C8D4E3" }, "font": { "color": "#2a3f5f" }, "polar": { "bgcolor": "white", "radialaxis": { "ticks": "", "gridcolor": "#EBF0F8", "linecolor": "#EBF0F8" }, "angularaxis": { "ticks": "", "gridcolor": "#EBF0F8", "linecolor": "#EBF0F8" } }, "scene": { "xaxis": { "ticks": "", "gridcolor": "#DFE8F3", "gridwidth": 2, "linecolor": "#EBF0F8", "zerolinecolor": "#EBF0F8", "showbackground": true, "backgroundcolor": "white" }, "yaxis": { "ticks": "", "gridcolor": "#DFE8F3", "gridwidth": 2, "linecolor": "#EBF0F8", "zerolinecolor": "#EBF0F8", "showbackground": true, "backgroundcolor": "white" }, "zaxis": { "ticks": "", "gridcolor": "#DFE8F3", "gridwidth": 2, "linecolor": "#EBF0F8", "zerolinecolor": "#EBF0F8", "showbackground": true, "backgroundcolor": "white" } }, "title": { "x": 0.05 }, "xaxis": { "ticks": "", "gridcolor": "#EBF0F8", "linecolor": "#EBF0F8", "automargin": true, "zerolinecolor": "#EBF0F8", "zerolinewidth": 2 }, "yaxis": { "ticks": "", "gridcolor": "#EBF0F8", "linecolor": "#EBF0F8", "automargin": true, "zerolinecolor": "#EBF0F8", "zerolinewidth": 2 }, "ternary": { "aaxis": { "ticks": "", "gridcolor": "#DFE8F3", "linecolor": "#A2B1C6" }, "baxis": { "ticks": "", "gridcolor": "#DFE8F3", "linecolor": "#A2B1C6" }, "caxis": { "ticks": "", "gridcolor": "#DFE8F3", "linecolor": "#A2B1C6" }, "bgcolor": "white" }, "colorway": [ "#636efa", "#EF553B", "#00cc96", "#ab63fa", "#19d3f3", "#e763fa", "#fecb52", "#ffa15a", "#ff6692", "#b6e880" ], "hovermode": "closest", "colorscale": { "diverging": [ [ 0, "#8e0152" ], [ 0.1, "#c51b7d" ], [ 0.2, "#de77ae" ], [ 0.3, "#f1b6da" ], [ 0.4, "#fde0ef" ], [ 0.5, "#f7f7f7" ], [ 0.6, "#e6f5d0" ], [ 0.7, "#b8e186" ], [ 0.8, "#7fbc41" ], [ 0.9, "#4d9221" ], [ 1, "#276419" ] ], "sequential": [ [ 0, "#0508b8" ], [ 0.0893854748603352, "#1910d8" ], [ 0.1787709497206704, "#3c19f0" ], [ 0.2681564245810056, "#6b1cfb" ], [ 0.3575418994413408, "#981cfd" ], [ 0.44692737430167595, "#bf1cfd" ], [ 0.5363128491620112, "#dd2bfd" ], [ 0.6256983240223464, "#f246fe" ], [ 0.7150837988826816, "#fc67fd" ], [ 0.8044692737430168, "#fe88fc" ], [ 0.8938547486033519, "#fea5fd" ], [ 0.9832402234636871, "#febefe" ], [ 1, "#fec3fe" ] ], "sequentialminus": [ [ 0, "#0508b8" ], [ 0.0893854748603352, "#1910d8" ], [ 0.1787709497206704, "#3c19f0" ], [ 0.2681564245810056, "#6b1cfb" ], [ 0.3575418994413408, "#981cfd" ], [ 0.44692737430167595, "#bf1cfd" ], [ 0.5363128491620112, "#dd2bfd" ], [ 0.6256983240223464, "#f246fe" ], [ 0.7150837988826816, "#fc67fd" ], [ 0.8044692737430168, "#fe88fc" ], [ 0.8938547486033519, "#fea5fd" ], [ 0.9832402234636871, "#febefe" ], [ 1, "#fec3fe" ] ] }, "plot_bgcolor": "white", "paper_bgcolor": "white", "shapedefaults": { "line": { "width": 0 }, "opacity": 0.4, "fillcolor": "#506784" }, "annotationdefaults": { "arrowhead": 0, "arrowcolor": "#506784", "arrowwidth": 1 } }, "themeRef": "PLOTLY_WHITE" } } }, "height": null, "width": null, "user": { "profile_url": "https://chart-studio.plotly.com/~wangzhihao", "avatar_url": "https://storage.googleapis.com/plotly-prod-profiles/84.jpg", "background_url": "https://storage.googleapis.com/plotly-prod-profiles/bg-2.jpg", "bio": "", "nickname": "", "website": "", "stream_tokens": null, "feature_set_id": null, "csrf_token": null, "date_joined": "2025-05-12 07:47:43", "mapbox_access_tokens": null, "has_password": null, "username": "wangzhihao", "email": null, "is_active": null, "readonly": null, "is_dash_creator": null, "dash_created_count": null, "is_chart_creator": null, "charts_created_count": null } }, { "creation_time": "2025-09-02T07:51:49.542196Z", "comments": { "results": [], "count": 0 }, "parented": true, "embed_url": "https://chart-studio.plotly.com/~NiklasG1907/1.embed", "fid": "NiklasG1907:1", "filename": "WTI+BRENT", "filetype": "plot", "img_url": "https://storage.googleapis.com/plotly-prod-images/NiklasG1907/1/9_LY4AE1W8YZNTN7YU7L73MSKQBHDZ2M.png", "image_urls": { "default": "https://storage.googleapis.com/plotly-prod-images/NiklasG1907/1/2_02DW0CFSX9DP3YLSQLC4Z3TXOTOTQR.png", "block-thumb": "https://storage.googleapis.com/plotly-prod-images/NiklasG1907/1/8_D9Q9MAV760QLVNHNALKKTZDHILMAAP.png", "list-thumb": "https://storage.googleapis.com/plotly-prod-images/NiklasG1907/1/9_LY4AE1W8YZNTN7YU7L73MSKQBHDZ2M.png" }, "api_urls": { "files": "https://api.plotly.com/v2/files/NiklasG1907:1", "plots": "https://api.plotly.com/v2/plots/NiklasG1907:1", "parent": "https://api.plotly.com/v2/folders/home?user=NiklasG1907" }, "owner": "NiklasG1907", "parent": -1, "preview": "", "referencers": [], "references": [], "title": "", "views": 0, "web_url": "https://chart-studio.plotly.com/~NiklasG1907/1/", "world_readable": true, "date_modified": "2025-09-02T08:00:24.812Z", "stars": { "results": [], "count": 0 }, "collaborators": { "results": [], "count": 0 }, "subfolder_count": null, "refresh_interval": null, "organize_view_url": "https://chart-studio.plotly.com/~NiklasG1907/1/", "current_user_permission": "read", "is_theme": null, "is_template": false, "autosize": true, "caption": "", "figure": { "data": [ { "line": { "width": 5 }, "meta": { "columnNames": { "x": "Date", "y": "TTF" } }, "mode": "markers+lines", "name": "TTF", "type": "scatter", "xsrc": "NiklasG1907:0:261632", "ysrc": "NiklasG1907:0:bd2a8e", "marker": { "line": { "width": 0 }, "size": 13, "symbol": "diamond" }, "visible": true }, { "line": { "width": 5 }, "meta": { "columnNames": { "x": "Date", "y": "THE" } }, "mode": "markers+lines", "name": "THE", "type": "scatter", "xsrc": "NiklasG1907:0:261632", "ysrc": "NiklasG1907:0:39a4b4", "marker": { "size": 12, "symbol": "x" }, "visible": true, "stackgroup": null } ], "frames": [], "layout": { "title": { "text": "Click to enter Plot title" }, "xaxis": { "type": "category", "range": [ -0.25354556100099757, 4.253545561000998 ], "title": { "font": { "size": 14 } }, "autorange": false, "showspikes": false }, "yaxis": { "type": "linear", "range": [ 31.402320806937695, 34.6653308321545 ], "title": { "font": { "size": 18 }, "text": "EUR / MWh" }, "autorange": true, "showspikes": false }, "legend": { "x": 0.987384494406382, "y": 0.5533049040511727, "font": { "size": 17 } }, "autosize": true, "template": { "data": { "bar": [ { "type": "bar", "marker": { "colorbar": { "ticks": "", "outlinewidth": 0 } } } ], "table": [ { "type": "table", "cells": { "fill": { "color": "#506784" }, "line": { "color": "rgb(17,17,17)" } }, "header": { "fill": { "color": "#2a3f5f" }, "line": { "color": "rgb(17,17,17)" } } } ], "carpet": [ { "type": "carpet", "aaxis": { "gridcolor": "#506784", "linecolor": "#506784", "endlinecolor": "#A2B1C6", "minorgridcolor": "#506784", "startlinecolor": "#A2B1C6" }, "baxis": { "gridcolor": "#506784", "linecolor": "#506784", "endlinecolor": "#A2B1C6", "minorgridcolor": "#506784", "startlinecolor": "#A2B1C6" } } ], "mesh3d": [ { "type": "mesh3d", "colorbar": { "ticks": "", "outlinewidth": 0 } } ], "contour": [ { "type": "contour", "colorbar": { "ticks": "", "outlinewidth": 0 }, "autocolorscale": true } ], "heatmap": [ { "type": "heatmap", "colorbar": { "ticks": "", "outlinewidth": 0 }, "autocolorscale": true } ], "scatter": [ { "type": "scatter", "marker": { "colorbar": { "ticks": "", "outlinewidth": 0 } } } ], "surface": [ { "type": "surface", "colorbar": { "ticks": "", "outlinewidth": 0 } } ], "heatmapgl": [ { "type": "heatmapgl", "colorbar": { "ticks": "", "outlinewidth": 0 } } ], "histogram": [ { "type": "histogram", "marker": { "colorbar": { "ticks": "", "outlinewidth": 0 } } } ], "parcoords": [ { "line": { "colorbar": { "ticks": "", "outlinewidth": 0 } }, "type": "parcoords" } ], "scatter3d": [ { "type": "scatter3d", "marker": { "colorbar": { "ticks": "", "outlinewidth": 0 } } } ], "scattergl": [ { "type": "scattergl", "marker": { "colorbar": { "ticks": "", "outlinewidth": 0 } } } ], "choropleth": [ { "type": "choropleth", "colorbar": { "ticks": "", "outlinewidth": 0 } } ], "scattergeo": [ { "type": "scattergeo", "marker": { "colorbar": { "ticks": "", "outlinewidth": 0 } } } ], "histogram2d": [ { "type": "histogram2d", "colorbar": { "ticks": "", "outlinewidth": 0 }, "autocolorscale": true } ], "scatterpolar": [ { "type": "scatterpolar", "marker": { "colorbar": { "ticks": "", "outlinewidth": 0 } } } ], "contourcarpet": [ { "type": "contourcarpet", "colorbar": { "ticks": "", "outlinewidth": 0 } } ], "scattercarpet": [ { "type": "scattercarpet", "marker": { "colorbar": { "ticks": "", "outlinewidth": 0 } } } ], "scattermapbox": [ { "type": "scattermapbox", "marker": { "colorbar": { "ticks": "", "outlinewidth": 0 } } } ], "scatterpolargl": [ { "type": "scatterpolargl", "marker": { "colorbar": { "ticks": "", "outlinewidth": 0 } } } ], "scatterternary": [ { "type": "scatterternary", "marker": { "colorbar": { "ticks": "", "outlinewidth": 0 } } } ], "histogram2dcontour": [ { "type": "histogram2dcontour", "colorbar": { "ticks": "", "outlinewidth": 0 }, "autocolorscale": true } ] }, "layout": { "geo": { "bgcolor": "rgb(17,17,17)", "showland": true, "lakecolor": "rgb(17,17,17)", "landcolor": "rgb(17,17,17)", "showlakes": true, "subunitcolor": "#506784" }, "font": { "color": "#f2f5fa" }, "polar": { "bgcolor": "rgb(17,17,17)", "radialaxis": { "ticks": "", "gridcolor": "#506784", "linecolor": "#506784" }, "angularaxis": { "ticks": "", "gridcolor": "#506784", "linecolor": "#506784" } }, "scene": { "xaxis": { "ticks": "", "gridcolor": "#506784", "gridwidth": 2, "linecolor": "#506784", "zerolinecolor": "#C8D4E3", "showbackground": true, "backgroundcolor": "rgb(17,17,17)" }, "yaxis": { "ticks": "", "gridcolor": "#506784", "gridwidth": 2, "linecolor": "#506784", "zerolinecolor": "#C8D4E3", "showbackground": true, "backgroundcolor": "rgb(17,17,17)" }, "zaxis": { "ticks": "", "gridcolor": "#506784", "gridwidth": 2, "linecolor": "#506784", "zerolinecolor": "#C8D4E3", "showbackground": true, "backgroundcolor": "rgb(17,17,17)" } }, "title": { "x": 0.05 }, "xaxis": { "ticks": "", "gridcolor": "#283442", "linecolor": "#506784", "automargin": true, "zerolinecolor": "#283442", "zerolinewidth": 2 }, "yaxis": { "ticks": "", "gridcolor": "#283442", "linecolor": "#506784", "automargin": true, "zerolinecolor": "#283442", "zerolinewidth": 2 }, "ternary": { "aaxis": { "ticks": "", "gridcolor": "#506784", "linecolor": "#506784" }, "baxis": { "ticks": "", "gridcolor": "#506784", "linecolor": "#506784" }, "caxis": { "ticks": "", "gridcolor": "#506784", "linecolor": "#506784" }, "bgcolor": "rgb(17,17,17)" }, "colorway": [ "#636efa", "#EF553B", "#00cc96", "#ab63fa", "#19d3f3", "#e763fa", "#fecb52", "#ffa15a", "#ff6692", "#b6e880" ], "hovermode": "closest", "colorscale": { "diverging": [ [ 0, "#8e0152" ], [ 0.1, "#c51b7d" ], [ 0.2, "#de77ae" ], [ 0.3, "#f1b6da" ], [ 0.4, "#fde0ef" ], [ 0.5, "#f7f7f7" ], [ 0.6, "#e6f5d0" ], [ 0.7, "#b8e186" ], [ 0.8, "#7fbc41" ], [ 0.9, "#4d9221" ], [ 1, "#276419" ] ], "sequential": [ [ 0, "#0508b8" ], [ 0.0893854748603352, "#1910d8" ], [ 0.1787709497206704, "#3c19f0" ], [ 0.2681564245810056, "#6b1cfb" ], [ 0.3575418994413408, "#981cfd" ], [ 0.44692737430167595, "#bf1cfd" ], [ 0.5363128491620112, "#dd2bfd" ], [ 0.6256983240223464, "#f246fe" ], [ 0.7150837988826816, "#fc67fd" ], [ 0.8044692737430168, "#fe88fc" ], [ 0.8938547486033519, "#fea5fd" ], [ 0.9832402234636871, "#febefe" ], [ 1, "#fec3fe" ] ], "sequentialminus": [ [ 0, "#0508b8" ], [ 0.0893854748603352, "#1910d8" ], [ 0.1787709497206704, "#3c19f0" ], [ 0.2681564245810056, "#6b1cfb" ], [ 0.3575418994413408, "#981cfd" ], [ 0.44692737430167595, "#bf1cfd" ], [ 0.5363128491620112, "#dd2bfd" ], [ 0.6256983240223464, "#f246fe" ], [ 0.7150837988826816, "#fc67fd" ], [ 0.8044692737430168, "#fe88fc" ], [ 0.8938547486033519, "#fea5fd" ], [ 0.9832402234636871, "#febefe" ], [ 1, "#fec3fe" ] ] }, "plot_bgcolor": "rgb(17,17,17)", "paper_bgcolor": "rgb(17,17,17)", "shapedefaults": { "line": { "width": 0 }, "opacity": 0.4, "fillcolor": "#f2f5fa" }, "sliderdefaults": { "bgcolor": "#C8D4E3", "tickwidth": 0, "bordercolor": "rgb(17,17,17)", "borderwidth": 1 }, "annotationdefaults": { "arrowhead": 0, "arrowcolor": "#f2f5fa", "arrowwidth": 1 }, "updatemenudefaults": { "bgcolor": "#506784", "borderwidth": 0 } }, "themeRef": "PLOTLY_DARK" } } }, "height": null, "width": null, "user": { "profile_url": "https://chart-studio.plotly.com/~NiklasG1907", "avatar_url": "https://storage.googleapis.com/plotly-prod-profiles/67.jpg", "background_url": "https://storage.googleapis.com/plotly-prod-profiles/bg-4.jpg", "bio": "", "nickname": "", "website": "", "stream_tokens": null, "feature_set_id": null, "csrf_token": null, "date_joined": "2025-09-02 07:44:55", "mapbox_access_tokens": null, "has_password": null, "username": "NiklasG1907", "email": null, "is_active": null, "readonly": null, "is_dash_creator": null, "dash_created_count": null, "is_chart_creator": null, "charts_created_count": null } }, { "creation_time": "2025-09-02T07:38:25.789859Z", "comments": { "results": [], "count": 0 }, "parented": true, "embed_url": "https://chart-studio.plotly.com/~julmac29/1.embed", "fid": "julmac29:1", "filename": "Plot 1", "filetype": "plot", "img_url": "https://storage.googleapis.com/plotly-prod-images/julmac29/1/9_5OQZQ6OJP1V3WWUQ8P8YMCABWTGNNG.png", "image_urls": { "default": "https://storage.googleapis.com/plotly-prod-images/julmac29/1/2_WH9RCDAOZEX17VN6SIKM541WGPLE0C.png", "block-thumb": "https://storage.googleapis.com/plotly-prod-images/julmac29/1/8_AENSUNLGL3SGK6VL2O539HWR0TCKE0.png", "list-thumb": "https://storage.googleapis.com/plotly-prod-images/julmac29/1/9_5OQZQ6OJP1V3WWUQ8P8YMCABWTGNNG.png" }, "api_urls": { "files": "https://api.plotly.com/v2/files/julmac29:1", "plots": "https://api.plotly.com/v2/plots/julmac29:1", "parent": "https://api.plotly.com/v2/folders/home?user=julmac29" }, "owner": "julmac29", "parent": -1, "preview": "", "referencers": [], "references": [], "title": "", "views": 0, "web_url": "https://chart-studio.plotly.com/~julmac29/1/", "world_readable": true, "date_modified": "2025-09-02T07:38:25.801Z", "stars": { "results": [], "count": 0 }, "collaborators": { "results": [], "count": 0 }, "subfolder_count": null, "refresh_interval": null, "organize_view_url": "https://chart-studio.plotly.com/~julmac29/1/", "current_user_permission": "read", "is_theme": null, "is_template": false, "autosize": true, "caption": "", "figure": { "data": [ { "meta": { "columnNames": { "x": "B", "y": "A" } }, "mode": "markers", "type": "scatter", "xsrc": "julmac29:0:ea9075", "ysrc": "julmac29:0:30cc6a" }, { "mode": "markers", "type": "scatter", "stackgroup": null } ], "frames": [], "layout": { "xaxis": { "type": "linear", "range": [ 15.726536237268485, 18.80079044365555 ], "autorange": true }, "yaxis": { "type": "linear", "range": [ 51.278008389914, 53.363562046323935 ], "autorange": true }, "autosize": true, "template": { "data": { "bar": [ { "type": "bar", "marker": { "colorbar": { "ticks": "", "outlinewidth": 0 } } } ], "table": [ { "type": "table", "cells": { "fill": { "color": "#EBF0F8" }, "line": { "color": "white" } }, "header": { "fill": { "color": "#C8D4E3" }, "line": { "color": "white" } } } ], "carpet": [ { "type": "carpet", "aaxis": { "gridcolor": "#C8D4E3", "linecolor": "#C8D4E3", "endlinecolor": "#2a3f5f", "minorgridcolor": "#C8D4E3", "startlinecolor": "#2a3f5f" }, "baxis": { "gridcolor": "#C8D4E3", "linecolor": "#C8D4E3", "endlinecolor": "#2a3f5f", "minorgridcolor": "#C8D4E3", "startlinecolor": "#2a3f5f" } } ], "mesh3d": [ { "type": "mesh3d", "colorbar": { "ticks": "", "outlinewidth": 0 } } ], "contour": [ { "type": "contour", "colorbar": { "ticks": "", "outlinewidth": 0 }, "autocolorscale": true } ], "heatmap": [ { "type": "heatmap", "colorbar": { "ticks": "", "outlinewidth": 0 }, "autocolorscale": true } ], "scatter": [ { "type": "scatter", "marker": { "colorbar": { "ticks": "", "outlinewidth": 0 } } } ], "surface": [ { "type": "surface", "colorbar": { "ticks": "", "outlinewidth": 0 } } ], "heatmapgl": [ { "type": "heatmapgl", "colorbar": { "ticks": "", "outlinewidth": 0 } } ], "histogram": [ { "type": "histogram", "marker": { "colorbar": { "ticks": "", "outlinewidth": 0 } } } ], "parcoords": [ { "line": { "colorbar": { "ticks": "", "outlinewidth": 0 } }, "type": "parcoords" } ], "scatter3d": [ { "type": "scatter3d", "marker": { "colorbar": { "ticks": "", "outlinewidth": 0 } } } ], "scattergl": [ { "type": "scattergl", "marker": { "colorbar": { "ticks": "", "outlinewidth": 0 } } } ], "choropleth": [ { "type": "choropleth", "colorbar": { "ticks": "", "outlinewidth": 0 } } ], "scattergeo": [ { "type": "scattergeo", "marker": { "colorbar": { "ticks": "", "outlinewidth": 0 } } } ], "histogram2d": [ { "type": "histogram2d", "colorbar": { "ticks": "", "outlinewidth": 0 }, "autocolorscale": true } ], "scatterpolar": [ { "type": "scatterpolar", "marker": { "colorbar": { "ticks": "", "outlinewidth": 0 } } } ], "contourcarpet": [ { "type": "contourcarpet", "colorbar": { "ticks": "", "outlinewidth": 0 } } ], "scattercarpet": [ { "type": "scattercarpet", "marker": { "colorbar": { "ticks": "", "outlinewidth": 0 } } } ], "scattermapbox": [ { "type": "scattermapbox", "marker": { "colorbar": { "ticks": "", "outlinewidth": 0 } } } ], "scatterpolargl": [ { "type": "scatterpolargl", "marker": { "colorbar": { "ticks": "", "outlinewidth": 0 } } } ], "scatterternary": [ { "type": "scatterternary", "marker": { "colorbar": { "ticks": "", "outlinewidth": 0 } } } ], "histogram2dcontour": [ { "type": "histogram2dcontour", "colorbar": { "ticks": "", "outlinewidth": 0 }, "autocolorscale": true } ] }, "layout": { "geo": { "bgcolor": "white", "showland": true, "lakecolor": "white", "landcolor": "white", "showlakes": true, "subunitcolor": "#C8D4E3" }, "font": { "color": "#2a3f5f" }, "polar": { "bgcolor": "white", "radialaxis": { "ticks": "", "gridcolor": "#EBF0F8", "linecolor": "#EBF0F8" }, "angularaxis": { "ticks": "", "gridcolor": "#EBF0F8", "linecolor": "#EBF0F8" } }, "scene": { "xaxis": { "ticks": "", "gridcolor": "#DFE8F3", "gridwidth": 2, "linecolor": "#EBF0F8", "zerolinecolor": "#EBF0F8", "showbackground": true, "backgroundcolor": "white" }, "yaxis": { "ticks": "", "gridcolor": "#DFE8F3", "gridwidth": 2, "linecolor": "#EBF0F8", "zerolinecolor": "#EBF0F8", "showbackground": true, "backgroundcolor": "white" }, "zaxis": { "ticks": "", "gridcolor": "#DFE8F3", "gridwidth": 2, "linecolor": "#EBF0F8", "zerolinecolor": "#EBF0F8", "showbackground": true, "backgroundcolor": "white" } }, "title": { "x": 0.05 }, "xaxis": { "ticks": "", "gridcolor": "#EBF0F8", "linecolor": "#EBF0F8", "automargin": true, "zerolinecolor": "#EBF0F8", "zerolinewidth": 2 }, "yaxis": { "ticks": "", "gridcolor": "#EBF0F8", "linecolor": "#EBF0F8", "automargin": true, "zerolinecolor": "#EBF0F8", "zerolinewidth": 2 }, "ternary": { "aaxis": { "ticks": "", "gridcolor": "#DFE8F3", "linecolor": "#A2B1C6" }, "baxis": { "ticks": "", "gridcolor": "#DFE8F3", "linecolor": "#A2B1C6" }, "caxis": { "ticks": "", "gridcolor": "#DFE8F3", "linecolor": "#A2B1C6" }, "bgcolor": "white" }, "colorway": [ "#636efa", "#EF553B", "#00cc96", "#ab63fa", "#19d3f3", "#e763fa", "#fecb52", "#ffa15a", "#ff6692", "#b6e880" ], "hovermode": "closest", "colorscale": { "diverging": [ [ 0, "#8e0152" ], [ 0.1, "#c51b7d" ], [ 0.2, "#de77ae" ], [ 0.3, "#f1b6da" ], [ 0.4, "#fde0ef" ], [ 0.5, "#f7f7f7" ], [ 0.6, "#e6f5d0" ], [ 0.7, "#b8e186" ], [ 0.8, "#7fbc41" ], [ 0.9, "#4d9221" ], [ 1, "#276419" ] ], "sequential": [ [ 0, "#0508b8" ], [ 0.0893854748603352, "#1910d8" ], [ 0.1787709497206704, "#3c19f0" ], [ 0.2681564245810056, "#6b1cfb" ], [ 0.3575418994413408, "#981cfd" ], [ 0.44692737430167595, "#bf1cfd" ], [ 0.5363128491620112, "#dd2bfd" ], [ 0.6256983240223464, "#f246fe" ], [ 0.7150837988826816, "#fc67fd" ], [ 0.8044692737430168, "#fe88fc" ], [ 0.8938547486033519, "#fea5fd" ], [ 0.9832402234636871, "#febefe" ], [ 1, "#fec3fe" ] ], "sequentialminus": [ [ 0, "#0508b8" ], [ 0.0893854748603352, "#1910d8" ], [ 0.1787709497206704, "#3c19f0" ], [ 0.2681564245810056, "#6b1cfb" ], [ 0.3575418994413408, "#981cfd" ], [ 0.44692737430167595, "#bf1cfd" ], [ 0.5363128491620112, "#dd2bfd" ], [ 0.6256983240223464, "#f246fe" ], [ 0.7150837988826816, "#fc67fd" ], [ 0.8044692737430168, "#fe88fc" ], [ 0.8938547486033519, "#fea5fd" ], [ 0.9832402234636871, "#febefe" ], [ 1, "#fec3fe" ] ] }, "plot_bgcolor": "white", "paper_bgcolor": "white", "shapedefaults": { "line": { "width": 0 }, "opacity": 0.4, "fillcolor": "#506784" }, "annotationdefaults": { "arrowhead": 0, "arrowcolor": "#506784", "arrowwidth": 1 } }, "themeRef": "PLOTLY_WHITE" } } }, "height": null, "width": null, "user": { "profile_url": "https://chart-studio.plotly.com/~julmac29", "avatar_url": "https://storage.googleapis.com/plotly-prod-profiles/34.jpg", "background_url": "https://storage.googleapis.com/plotly-prod-profiles/bg-3.jpg", "bio": "", "nickname": "", "website": "", "stream_tokens": null, "feature_set_id": null, "csrf_token": null, "date_joined": "2025-09-02 07:13:25", "mapbox_access_tokens": null, "has_password": null, "username": "julmac29", "email": null, "is_active": null, "readonly": null, "is_dash_creator": null, "dash_created_count": null, "is_chart_creator": null, "charts_created_count": null } }, { "creation_time": "2025-09-02T06:22:44.688112Z", "comments": { "results": [], "count": 0 }, "parented": true, "embed_url": "https://chart-studio.plotly.com/~vivekrajesh88/1.embed", "fid": "vivekrajesh88:1", "filename": "Plot 1", "filetype": "plot", "img_url": "https://storage.googleapis.com/plotly-prod-images/vivekrajesh88/1/9_PLBIVEOYG0S2S5JCYGVK8TN9ZGV5UW.png", "image_urls": { "default": "https://storage.googleapis.com/plotly-prod-images/vivekrajesh88/1/2_IE6CYMITYSQQ3TZ4WNL6YEU8M4P3T2.png", "block-thumb": "https://storage.googleapis.com/plotly-prod-images/vivekrajesh88/1/8_FBK6O29KMCCQR0QYY6XJP4H4IVDRUE.png", "list-thumb": "https://storage.googleapis.com/plotly-prod-images/vivekrajesh88/1/9_PLBIVEOYG0S2S5JCYGVK8TN9ZGV5UW.png" }, "api_urls": { "files": "https://api.plotly.com/v2/files/vivekrajesh88:1", "plots": "https://api.plotly.com/v2/plots/vivekrajesh88:1", "parent": "https://api.plotly.com/v2/folders/home?user=vivekrajesh88" }, "owner": "vivekrajesh88", "parent": -1, "preview": "", "referencers": [], "references": [], "title": "", "views": 0, "web_url": "https://chart-studio.plotly.com/~vivekrajesh88/1/", "world_readable": true, "date_modified": "2025-09-02T06:22:44.700Z", "stars": { "results": [], "count": 0 }, "collaborators": { "results": [], "count": 0 }, "subfolder_count": null, "refresh_interval": null, "organize_view_url": "https://chart-studio.plotly.com/~vivekrajesh88/1/", "current_user_permission": "read", "is_theme": null, "is_template": false, "autosize": true, "caption": "", "figure": { "data": [ { "meta": { "columnNames": { "x": "x", "y": "y", "text": "text" } }, "type": "bar", "xsrc": "vivekrajesh88:0:ba8ca1", "ysrc": "vivekrajesh88:0:d43183", "marker": { "line": { "color": "rgb(8,48,107)", "width": 1.5 }, "color": "rgb(158,202,225)" }, "opacity": 0.6, "textsrc": "vivekrajesh88:0:91c3e0", "textposition": "auto" } ], "frames": [], "layout": { "xaxis": { "type": "category", "range": [ -0.5, 2.5 ], "autorange": true }, "yaxis": { "type": "linear", "range": [ 0, 24.210526315789473 ], "autorange": true } } }, "height": null, "width": null, "user": { "profile_url": "https://chart-studio.plotly.com/~vivekrajesh88", "avatar_url": "https://storage.googleapis.com/plotly-prod-profiles/62.jpg", "background_url": "https://storage.googleapis.com/plotly-prod-profiles/bg-9.jpg", "bio": "", "nickname": "", "website": "", "stream_tokens": null, "feature_set_id": null, "csrf_token": null, "date_joined": "2025-09-02 06:16:33", "mapbox_access_tokens": null, "has_password": null, "username": "vivekrajesh88", "email": null, "is_active": null, "readonly": null, "is_dash_creator": null, "dash_created_count": null, "is_chart_creator": null, "charts_created_count": null } }, { "creation_time": "2025-09-02T05:24:44.594043Z", "comments": { "results": [], "count": 0 }, "parented": true, "embed_url": "https://chart-studio.plotly.com/~ddwad/7.embed", "fid": "ddwad:7", "filename": "Plot 7", "filetype": "plot", "img_url": "https://storage.googleapis.com/plotly-prod-images/ddwad/7/9_PS022Q48DBBNC7UQZO42L26D21YAMQ.png", "image_urls": { "default": "https://storage.googleapis.com/plotly-prod-images/ddwad/7/2_IS45JL97PK04A38GLLCB6HH5Z3WSAK.png", "block-thumb": "https://storage.googleapis.com/plotly-prod-images/ddwad/7/8_RYINVSZUO2CZRQIB0PXGE7I2YX6YZJ.png", "list-thumb": "https://storage.googleapis.com/plotly-prod-images/ddwad/7/9_PS022Q48DBBNC7UQZO42L26D21YAMQ.png" }, "api_urls": { "files": "https://api.plotly.com/v2/files/ddwad:7", "plots": "https://api.plotly.com/v2/plots/ddwad:7", "parent": "https://api.plotly.com/v2/folders/home?user=ddwad" }, "owner": "ddwad", "parent": -1, "preview": "", "referencers": [], "references": [], "title": "", "views": 0, "web_url": "https://chart-studio.plotly.com/~ddwad/7/", "world_readable": true, "date_modified": "2025-09-04T16:39:35.890Z", "stars": { "results": [], "count": 0 }, "collaborators": { "results": [], "count": 0 }, "subfolder_count": null, "refresh_interval": null, "organize_view_url": "https://chart-studio.plotly.com/~ddwad/7/", "current_user_permission": "read", "is_theme": null, "is_template": false, "autosize": true, "caption": "", "figure": { "data": [ { "fill": "none", "line": { "color": "rgb(239, 85, 59)" }, "meta": { "columnNames": { "x": "A", "y": "C" } }, "mode": "lines", "name": "Supply (S<sub>1</sub>)", "type": "scatter", "xsrc": "ddwad:6:fe1dcb", "ysrc": "ddwad:6:e0e6ae", "visible": true, "stackgroup": "" }, { "line": { "color": "rgb(99, 110, 250)" }, "meta": { "columnNames": { "x": "A", "y": "B" } }, "mode": "lines", "name": "Demand (D<sub>1</sub>)", "type": "scatter", "xsrc": "ddwad:6:fe1dcb", "ysrc": "ddwad:6:b6b449" }, { "fill": "tonexty", "meta": { "columnNames": { "x": "E", "y": "F" } }, "mode": "none", "name": "Dead Weight Loss", "type": "scatter", "xsrc": "ddwad:6:39fa50", "ysrc": "ddwad:6:277ffd", "visible": true, "fillcolor": "rgba(243, 206, 99, 0.5)", "stackgroup": 1, "orientation": "h" }, { "fill": "tozeroy", "meta": { "columnNames": { "x": "I", "y": "J" } }, "mode": "none", "name": "Tax revenue", "type": "scatter", "xsrc": "ddwad:6:09f473", "ysrc": "ddwad:6:e9d163", "fillcolor": "rgb(252, 182, 255)" }, { "fill": "tozerox", "meta": { "columnNames": { "x": "K", "y": "L" } }, "mode": "none", "name": "Consumer Surplus", "type": "scatter", "xsrc": "ddwad:6:b3f86c", "ysrc": "ddwad:6:6d530f", "marker": { "line": { "width": 8 }, "size": 6, "color": "rgb(82, 254, 237)" }, "error_x": { "type": "percent", "color": "#fecb52", "value": 10, "width": 4, "visible": false, "symmetric": true, "thickness": 2 }, "fillcolor": "rgba(82, 248, 254, 0.5)", "hoverinfo": "x+y+name", "stackgroup": "", "connectgaps": true }, { "fill": "tonextx", "meta": { "columnNames": { "x": "M", "y": "N" } }, "mode": "none", "name": "Producer Surplus", "type": "scatter", "xsrc": "ddwad:6:08b29e", "ysrc": "ddwad:6:558e67", "fillcolor": "rgba(255, 174, 47, 0.5)", "stackgroup": 2, "orientation": "h" }, { "line": { "dash": "longdash", "color": "rgb(0, 204, 150)" }, "meta": { "columnNames": { "x": "A", "y": "D" } }, "mode": "lines", "name": "Supply with Tax (S<sub>2</sub>)", "type": "scatter", "xsrc": "ddwad:6:fe1dcb", "ysrc": "ddwad:6:621d0b", "stackgroup": null }, { "meta": { "columnNames": { "x": "G", "y": "H" } }, "mode": "markers", "name": "trace 4", "type": "scatter", "xsrc": "ddwad:6:090367", "ysrc": "ddwad:6:cd6ac1", "marker": { "size": 9, "color": "rgb(147, 63, 226)" }, "visible": true, "showlegend": false } ], "frames": [], "layout": { "title": { "text": "Effects of a Production Tax on Supplier" }, "xaxis": { "side": "bottom", "type": "linear", "range": [ -2.813991031391919, 79.95414655163168 ], "title": { "text": "Quantity of Transactions" }, "autorange": false }, "yaxis": { "type": "linear", "range": [ -0.44163653856211216, 126.33903350202958 ], "title": { "text": "Price per Transaction ($)" }, "autorange": false }, "legend": { "x": 1.03, "y": 1.0168918918918919, "font": { "size": 12 }, "title": { "font": { "size": 12 }, "text": "P<sub>1</sub> = Original Equilibrium Price<br>P<sub>2</sub> = Seller Price after Tax<br>\nP<sub>3</sub> = Buyer Price after Tax<br>\nTax Wedge = P<sub>3</sub> - P<sub>2</sub>" }, "borderwidth": 1 }, "shapes": [ { "x0": 40, "x1": 40, "y0": 71, "y1": 0, "line": { "dash": "longdash", "color": "#444444", "width": 2 }, "type": "line", "opacity": 0.3, "fillcolor": "#7f7f7f" }, { "x0": 50, "x1": 50, "y0": 58, "y1": 0, "line": { "dash": "longdash", "color": "#444444", "width": 2 }, "type": "line", "opacity": 0.3, "visible": true, "fillcolor": "#7f7f7f" }, { "x0": 0, "x1": 40, "y0": 52, "y1": 52, "line": { "dash": "longdash", "color": "#444444", "width": 2 }, "type": "line", "opacity": 0.5, "fillcolor": "#7f7f7f" }, { "x0": 0, "x1": 50, "y0": 60, "y1": 60, "line": { "dash": "longdash", "color": "#444444", "width": 2 }, "type": "line", "opacity": 0.4, "fillcolor": "#7f7f7f" }, { "x0": 0, "x1": 40, "y0": 72, "y1": 72, "line": { "dash": "longdash", "color": "#444444", "width": 2 }, "type": "line", "opacity": 0.3, "visible": true, "fillcolor": "#7f7f7f" } ], "autosize": true, "dragmode": "pan", "template": { "data": { "bar": [ { "type": "bar", "marker": { "colorbar": { "ticks": "", "outlinewidth": 0 } } } ], "table": [ { "type": "table", "cells": { "fill": { "color": "#EBF0F8" }, "line": { "color": "white" } }, "header": { "fill": { "color": "#C8D4E3" }, "line": { "color": "white" } } } ], "carpet": [ { "type": "carpet", "aaxis": { "gridcolor": "#C8D4E3", "linecolor": "#C8D4E3", "endlinecolor": "#2a3f5f", "minorgridcolor": "#C8D4E3", "startlinecolor": "#2a3f5f" }, "baxis": { "gridcolor": "#C8D4E3", "linecolor": "#C8D4E3", "endlinecolor": "#2a3f5f", "minorgridcolor": "#C8D4E3", "startlinecolor": "#2a3f5f" } } ], "mesh3d": [ { "type": "mesh3d", "colorbar": { "ticks": "", "outlinewidth": 0 } } ], "contour": [ { "type": "contour", "colorbar": { "ticks": "", "outlinewidth": 0 }, "autocolorscale": true } ], "heatmap": [ { "type": "heatmap", "colorbar": { "ticks": "", "outlinewidth": 0 }, "autocolorscale": true } ], "scatter": [ { "type": "scatter", "marker": { "colorbar": { "ticks": "", "outlinewidth": 0 } } } ], "surface": [ { "type": "surface", "colorbar": { "ticks": "", "outlinewidth": 0 } } ], "heatmapgl": [ { "type": "heatmapgl", "colorbar": { "ticks": "", "outlinewidth": 0 } } ], "histogram": [ { "type": "histogram", "marker": { "colorbar": { "ticks": "", "outlinewidth": 0 } } } ], "parcoords": [ { "line": { "colorbar": { "ticks": "", "outlinewidth": 0 } }, "type": "parcoords" } ], "scatter3d": [ { "type": "scatter3d", "marker": { "colorbar": { "ticks": "", "outlinewidth": 0 } } } ], "scattergl": [ { "type": "scattergl", "marker": { "colorbar": { "ticks": "", "outlinewidth": 0 } } } ], "choropleth": [ { "type": "choropleth", "colorbar": { "ticks": "", "outlinewidth": 0 } } ], "scattergeo": [ { "type": "scattergeo", "marker": { "colorbar": { "ticks": "", "outlinewidth": 0 } } } ], "histogram2d": [ { "type": "histogram2d", "colorbar": { "ticks": "", "outlinewidth": 0 }, "autocolorscale": true } ], "scatterpolar": [ { "type": "scatterpolar", "marker": { "colorbar": { "ticks": "", "outlinewidth": 0 } } } ], "contourcarpet": [ { "type": "contourcarpet", "colorbar": { "ticks": "", "outlinewidth": 0 } } ], "scattercarpet": [ { "type": "scattercarpet", "marker": { "colorbar": { "ticks": "", "outlinewidth": 0 } } } ], "scattermapbox": [ { "type": "scattermapbox", "marker": { "colorbar": { "ticks": "", "outlinewidth": 0 } } } ], "scatterpolargl": [ { "type": "scatterpolargl", "marker": { "colorbar": { "ticks": "", "outlinewidth": 0 } } } ], "scatterternary": [ { "type": "scatterternary", "marker": { "colorbar": { "ticks": "", "outlinewidth": 0 } } } ], "histogram2dcontour": [ { "type": "histogram2dcontour", "colorbar": { "ticks": "", "outlinewidth": 0 }, "autocolorscale": true } ] }, "layout": { "geo": { "bgcolor": "white", "showland": true, "lakecolor": "white", "landcolor": "white", "showlakes": true, "subunitcolor": "#C8D4E3" }, "font": { "color": "#2a3f5f" }, "polar": { "bgcolor": "white", "radialaxis": { "ticks": "", "gridcolor": "#EBF0F8", "linecolor": "#EBF0F8" }, "angularaxis": { "ticks": "", "gridcolor": "#EBF0F8", "linecolor": "#EBF0F8" } }, "scene": { "xaxis": { "ticks": "", "gridcolor": "#DFE8F3", "gridwidth": 2, "linecolor": "#EBF0F8", "zerolinecolor": "#EBF0F8", "showbackground": true, "backgroundcolor": "white" }, "yaxis": { "ticks": "", "gridcolor": "#DFE8F3", "gridwidth": 2, "linecolor": "#EBF0F8", "zerolinecolor": "#EBF0F8", "showbackground": true, "backgroundcolor": "white" }, "zaxis": { "ticks": "", "gridcolor": "#DFE8F3", "gridwidth": 2, "linecolor": "#EBF0F8", "zerolinecolor": "#EBF0F8", "showbackground": true, "backgroundcolor": "white" } }, "title": { "x": 0.05 }, "xaxis": { "ticks": "", "gridcolor": "#EBF0F8", "linecolor": "#EBF0F8", "automargin": true, "zerolinecolor": "#EBF0F8", "zerolinewidth": 2 }, "yaxis": { "ticks": "", "gridcolor": "#EBF0F8", "linecolor": "#EBF0F8", "automargin": true, "zerolinecolor": "#EBF0F8", "zerolinewidth": 2 }, "ternary": { "aaxis": { "ticks": "", "gridcolor": "#DFE8F3", "linecolor": "#A2B1C6" }, "baxis": { "ticks": "", "gridcolor": "#DFE8F3", "linecolor": "#A2B1C6" }, "caxis": { "ticks": "", "gridcolor": "#DFE8F3", "linecolor": "#A2B1C6" }, "bgcolor": "white" }, "colorway": [ "#636efa", "#EF553B", "#00cc96", "#ab63fa", "#19d3f3", "#e763fa", "#fecb52", "#ffa15a", "#ff6692", "#b6e880" ], "hovermode": "closest", "colorscale": { "diverging": [ [ 0, "#8e0152" ], [ 0.1, "#c51b7d" ], [ 0.2, "#de77ae" ], [ 0.3, "#f1b6da" ], [ 0.4, "#fde0ef" ], [ 0.5, "#f7f7f7" ], [ 0.6, "#e6f5d0" ], [ 0.7, "#b8e186" ], [ 0.8, "#7fbc41" ], [ 0.9, "#4d9221" ], [ 1, "#276419" ] ], "sequential": [ [ 0, "#0508b8" ], [ 0.0893854748603352, "#1910d8" ], [ 0.1787709497206704, "#3c19f0" ], [ 0.2681564245810056, "#6b1cfb" ], [ 0.3575418994413408, "#981cfd" ], [ 0.44692737430167595, "#bf1cfd" ], [ 0.5363128491620112, "#dd2bfd" ], [ 0.6256983240223464, "#f246fe" ], [ 0.7150837988826816, "#fc67fd" ], [ 0.8044692737430168, "#fe88fc" ], [ 0.8938547486033519, "#fea5fd" ], [ 0.9832402234636871, "#febefe" ], [ 1, "#fec3fe" ] ], "sequentialminus": [ [ 0, "#0508b8" ], [ 0.0893854748603352, "#1910d8" ], [ 0.1787709497206704, "#3c19f0" ], [ 0.2681564245810056, "#6b1cfb" ], [ 0.3575418994413408, "#981cfd" ], [ 0.44692737430167595, "#bf1cfd" ], [ 0.5363128491620112, "#dd2bfd" ], [ 0.6256983240223464, "#f246fe" ], [ 0.7150837988826816, "#fc67fd" ], [ 0.8044692737430168, "#fe88fc" ], [ 0.8938547486033519, "#fea5fd" ], [ 0.9832402234636871, "#febefe" ], [ 1, "#fec3fe" ] ] }, "plot_bgcolor": "white", "paper_bgcolor": "white", "shapedefaults": { "line": { "width": 0 }, "opacity": 0.4, "fillcolor": "#506784" }, "annotationdefaults": { "arrowhead": 0, "arrowcolor": "#506784", "arrowwidth": 1 } }, "themeRef": "PLOTLY_WHITE" }, "annotations": [ { "x": 51.14487706900598, "y": 65.3344801815885, "text": "E<sub>1</sub>", "showarrow": false }, { "x": 41.19369032767026, "y": 77.78118025033405, "ax": 12, "ay": 41, "text": "E<sub>2</sub>", "showarrow": false }, { "x": 51.40722291407222, "y": 4.282655246252677, "text": "Q<sub>1</sub>", "showarrow": false }, { "x": 41.245330012453294, "y": 4.26980728051393, "ax": 14, "ay": 139, "text": "Q<sub>2</sub>", "showarrow": false }, { "x": -1, "y": 50.9559323968129, "text": "P<sub>2</sub>", "showarrow": false }, { "x": 78.60175504648267, "y": 76.6547168645004, "text": "S<sub>1</sub>", "showarrow": false }, { "x": 78.50586766541822, "y": 96.3571182897275, "text": "S<sub>2</sub>", "showarrow": false }, { "x": 78.90137328339576, "y": 17.9758256632806, "text": "D<sub>1</sub>", "showarrow": false }, { "x": -1.0399457881847176, "y": 72.79989919434728, "ax": -393, "ay": -21, "text": "P<sub>3</sub>", "showarrow": false }, { "x": -1.0874187848034094, "y": 60.091850275075814, "text": "P<sub>1</sub>", "showarrow": false } ] } }, "height": null, "width": null, "user": { "profile_url": "https://chart-studio.plotly.com/~ddwad", "avatar_url": "https://storage.googleapis.com/plotly-prod-profiles/96.jpg", "background_url": "https://storage.googleapis.com/plotly-prod-profiles/bg-5.jpg", "bio": "", "nickname": "", "website": "", "stream_tokens": null, "feature_set_id": null, "csrf_token": null, "date_joined": "2025-08-08 15:13:48", "mapbox_access_tokens": null, "has_password": null, "username": "ddwad", "email": null, "is_active": null, "readonly": null, "is_dash_creator": null, "dash_created_count": null, "is_chart_creator": null, "charts_created_count": null } } ] }
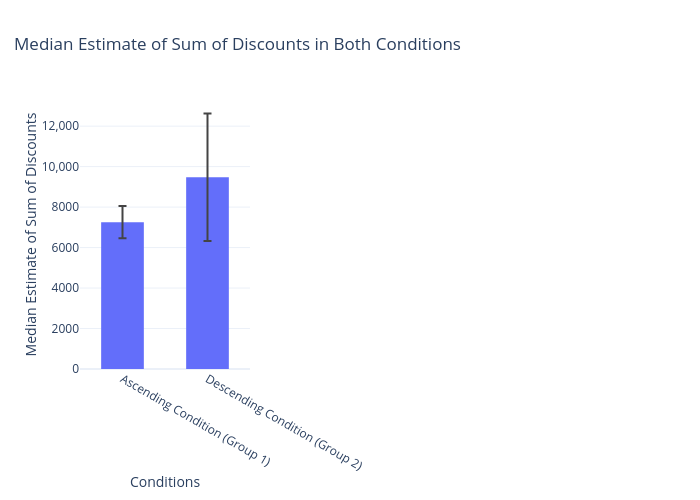
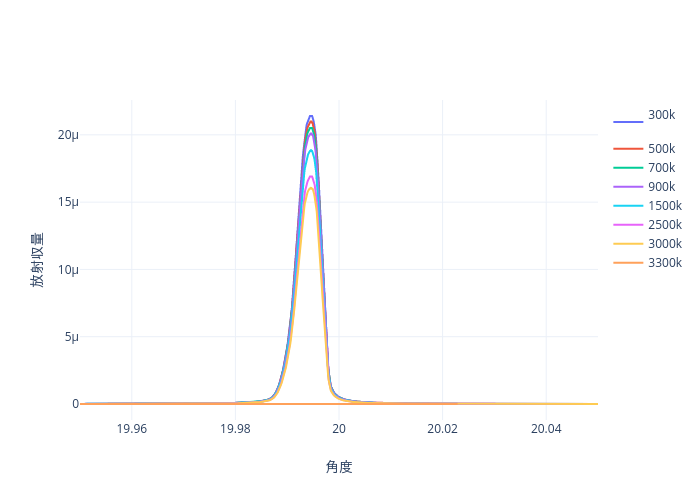
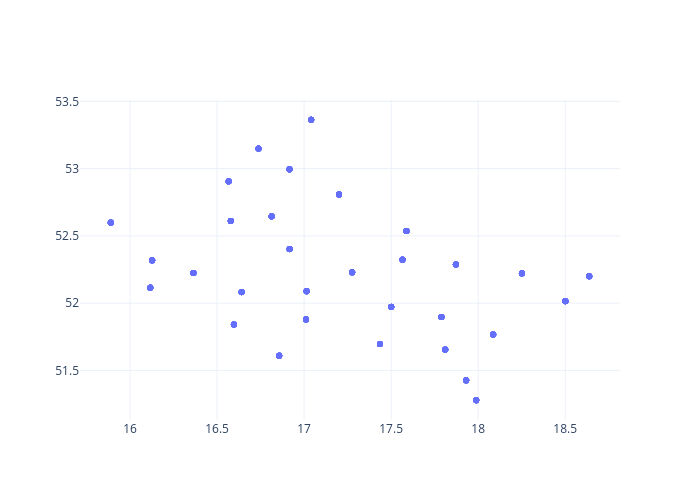
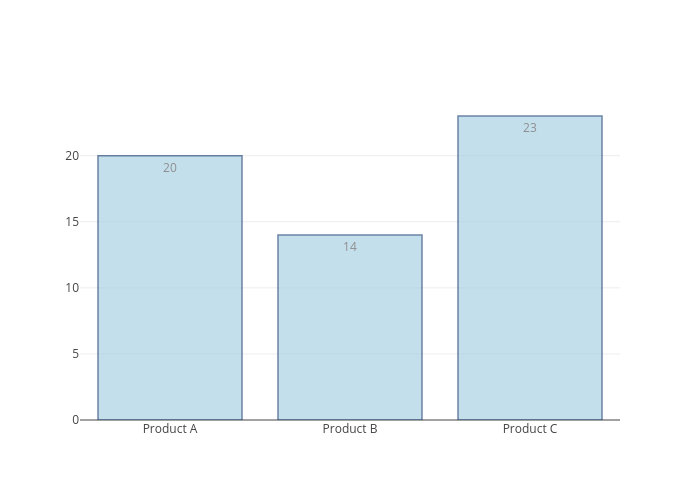