Plots List
Plots
This endpoint handles manipulation of Plotly plot files.
Reference
Authorization
Any user with or without a Plotly account may view public plots. For private plots, see authentication.
Actions
list
Listing all public plots can be done via a GET request to this endpoint.
By default, plots will be listed in order of date created. The order_by
query parameter is accepted at this endpoint. Currently, only ordering by
views is supported. It is possible to filter the plots by quality
with min_quality or max_quality as query parameter.
Example:
// GET https://api.plotly.com/v2/plots/ ---> 200

// GET https://api.plotly.com/v2/plots/?order_by=-views ---> 200

// GET https://api.plotly.com/v2/plots/?min_quality=5 ---> 200

// GET https://api.plotly.com/v2/plots/?max_quality=5 ---> 200
feed
Listing all handpicked feed plots can be done via a GET request to this endpoint. By default, plots will be listed in a random order.
Example:
// GET https://api.plotly.com/v2/plots/feed ---> 200
create
You can create new plot resources here. The only required field is 'figure'. Currently, the figure is restricted to only contain references to grid data. That is, this will fail if raw data arrays are passed in. To create and manipulate underlying grids for plots, see the grids endpoint.
Example:
// This fails because a figure field is required.
// POST https://api.plotly.com/v2/plots ---> 400 Bad Request
{}

// This fails because the figure has raw data
//POST https://api.plotly.com/v2/plots ---> 400 Bad Request
{
    "figure": {"data": [{"y": ['this', 'is', 'raw', 'data']}]}
}

// This succeeds because the figure has src keys, not raw data.
//POST https://api.plotly.com/v2/plots ---> 200 OK
{
    "figure": {"data": [{"ysrc": "sven:88:u8nd62"}]}
}
When creating a grid, you can optionally specify a source_fid to specify where a plot has come from:
- source_fid: the fid of a plot that was copied (and presumably edited) to produce this one
detail
There is a lot of meta information stored about plot files including filename, title, share_url, and content_url to name a few.
This information can only be reached with a GET to this endpoint.
Example:
// GET https://api.plotly.com/v2/plots/iheartgraphs:90
content
The contents of a plot can be downloaded via the content resource. The plot
content contains referenced grid/column data by default. If you wish to
return the raw grid/column data, the inline_data=true query must be included
in the request url. The Content-Type header will be appropriately set for the
response body.
Alternatively, you can set ?map_data=unreadable to append a mapping of
sources to data that belongs to grids which are unreadable for the
requestor. This is useful when you have read access to another users plot,
but that plot contains grid references which you don't have access to.
Examples:
// Returns referenced grid/column data
// GET https://api.plotly.com/v2/plots/iheartgraphs:90/content ---> 200 OK

// Returns full grid/column data
// GET https://api.plotly.com/v2/plots/iheartgraphs:90/content?inline_data=true ---> 200 OK

// Returns full grid/column data when requestor doesn't have permission
// to read the referenced grid.
// GET https://api.plotly.com/v2/plots/iheartgraphs:90/content?map_data=unreadable ---> 200 OK
GET /v2/plots?cursor=cD0yMDI1LTA5LTE1KzE2JTNBNTAlM0E0Ni4wNTczNzclMkIwMCUzQTAw&format=api
{ "next": "https://api.plotly.com/v2/plots?cursor=cD0yMDI1LTA5LTE1KzEzJTNBMjIlM0ExMy44Nzg1NzAlMkIwMCUzQTAw&format=api", "previous": "https://api.plotly.com/v2/plots?cursor=cj0xJnA9MjAyNS0wOS0xNSsxNiUzQTM3JTNBMDYuMjI4NTk4JTJCMDAlM0EwMA%3D%3D&format=api", "results": [ { "creation_time": "2025-09-15T16:37:06.228598Z", "comments": { "results": [], "count": 0 }, "parented": true, "embed_url": "https://chart-studio.plotly.com/~mp27173/1.embed", "fid": "mp27173:1", "filename": "Plot 1", "filetype": "plot", "img_url": "https://storage.googleapis.com/plotly-prod-images/mp27173/1/9_7DLBSYJFM17DHX3IC6L7GTLDZTNPG2.png", "image_urls": { "default": "https://storage.googleapis.com/plotly-prod-images/mp27173/1/2_DJ91V86BAEA49XBBSZ7HO2D5RKD5O6.png", "block-thumb": "https://storage.googleapis.com/plotly-prod-images/mp27173/1/8_1A08J9J8B4XXUEXCE671Q48IP2C688.png", "list-thumb": "https://storage.googleapis.com/plotly-prod-images/mp27173/1/9_7DLBSYJFM17DHX3IC6L7GTLDZTNPG2.png" }, "api_urls": { "files": "https://api.plotly.com/v2/files/mp27173:1", "plots": "https://api.plotly.com/v2/plots/mp27173:1", "parent": "https://api.plotly.com/v2/folders/home?user=mp27173" }, "owner": "mp27173", "parent": -1, "preview": "", "referencers": [], "references": [], "title": "", "views": 1, "web_url": "https://chart-studio.plotly.com/~mp27173/1/", "world_readable": true, "date_modified": "2025-09-15T21:38:20.690Z", "stars": { "results": [], "count": 0 }, "collaborators": { "results": [], "count": 0 }, "subfolder_count": null, "refresh_interval": null, "organize_view_url": "https://chart-studio.plotly.com/~mp27173/1/", "current_user_permission": "read", "is_theme": null, "is_template": false, "autosize": true, "caption": "", "figure": { "data": [ { "meta": { "columnNames": { "x": "A", "y": "B", "error_y": { "array": "C" } } }, "mode": "markers", "type": "bar", "xsrc": "mp27173:0:1f5646", "ysrc": "mp27173:0:38ff5c", "error_y": { "meta": { "columnNames": { "array": "C" } }, "type": "data", "visible": true, "arraysrc": "mp27173:0:d87eda", "symmetric": true }, "orientation": "v" } ], "frames": [], "layout": { "title": { "text": "spores vs. no spores" }, "xaxis": { "type": "category", "range": [ -0.5, 1.5 ], "title": { "text": "The soil that the chives grew in" }, "autorange": true }, "yaxis": { "type": "linear", "range": [ 0, 11.418265924210525 ], "title": { "text": "The average height of the chives in cm" }, "autorange": true }, "autosize": true, "template": { "data": { "bar": [ { "type": "bar", "marker": { "colorbar": { "ticks": "", "outlinewidth": 0 } } } ], "table": [ { "type": "table", "cells": { "fill": { "color": "#EBF0F8" }, "line": { "color": "white" } }, "header": { "fill": { "color": "#C8D4E3" }, "line": { "color": "white" } } } ], "carpet": [ { "type": "carpet", "aaxis": { "gridcolor": "#C8D4E3", "linecolor": "#C8D4E3", "endlinecolor": "#2a3f5f", "minorgridcolor": "#C8D4E3", "startlinecolor": "#2a3f5f" }, "baxis": { "gridcolor": "#C8D4E3", "linecolor": "#C8D4E3", "endlinecolor": "#2a3f5f", "minorgridcolor": "#C8D4E3", "startlinecolor": "#2a3f5f" } } ], "mesh3d": [ { "type": "mesh3d", "colorbar": { "ticks": "", "outlinewidth": 0 } } ], "contour": [ { "type": "contour", "colorbar": { "ticks": "", "outlinewidth": 0 }, "autocolorscale": true } ], "heatmap": [ { "type": "heatmap", "colorbar": { "ticks": "", "outlinewidth": 0 }, "autocolorscale": true } ], "scatter": [ { "type": "scatter", "marker": { "colorbar": { "ticks": "", "outlinewidth": 0 } } } ], "surface": [ { "type": "surface", "colorbar": { "ticks": "", "outlinewidth": 0 } } ], "heatmapgl": [ { "type": "heatmapgl", "colorbar": { "ticks": "", "outlinewidth": 0 } } ], "histogram": [ { "type": "histogram", "marker": { "colorbar": { "ticks": "", "outlinewidth": 0 } } } ], "parcoords": [ { "line": { "colorbar": { "ticks": "", "outlinewidth": 0 } }, "type": "parcoords" } ], "scatter3d": [ { "type": "scatter3d", "marker": { "colorbar": { "ticks": "", "outlinewidth": 0 } } } ], "scattergl": [ { "type": "scattergl", "marker": { "colorbar": { "ticks": "", "outlinewidth": 0 } } } ], "choropleth": [ { "type": "choropleth", "colorbar": { "ticks": "", "outlinewidth": 0 } } ], "scattergeo": [ { "type": "scattergeo", "marker": { "colorbar": { "ticks": "", "outlinewidth": 0 } } } ], "histogram2d": [ { "type": "histogram2d", "colorbar": { "ticks": "", "outlinewidth": 0 }, "autocolorscale": true } ], "scatterpolar": [ { "type": "scatterpolar", "marker": { "colorbar": { "ticks": "", "outlinewidth": 0 } } } ], "contourcarpet": [ { "type": "contourcarpet", "colorbar": { "ticks": "", "outlinewidth": 0 } } ], "scattercarpet": [ { "type": "scattercarpet", "marker": { "colorbar": { "ticks": "", "outlinewidth": 0 } } } ], "scattermapbox": [ { "type": "scattermapbox", "marker": { "colorbar": { "ticks": "", "outlinewidth": 0 } } } ], "scatterpolargl": [ { "type": "scatterpolargl", "marker": { "colorbar": { "ticks": "", "outlinewidth": 0 } } } ], "scatterternary": [ { "type": "scatterternary", "marker": { "colorbar": { "ticks": "", "outlinewidth": 0 } } } ], "histogram2dcontour": [ { "type": "histogram2dcontour", "colorbar": { "ticks": "", "outlinewidth": 0 }, "autocolorscale": true } ] }, "layout": { "geo": { "bgcolor": "white", "showland": true, "lakecolor": "white", "landcolor": "white", "showlakes": true, "subunitcolor": "#C8D4E3" }, "font": { "color": "#2a3f5f" }, "polar": { "bgcolor": "white", "radialaxis": { "ticks": "", "gridcolor": "#EBF0F8", "linecolor": "#EBF0F8" }, "angularaxis": { "ticks": "", "gridcolor": "#EBF0F8", "linecolor": "#EBF0F8" } }, "scene": { "xaxis": { "ticks": "", "gridcolor": "#DFE8F3", "gridwidth": 2, "linecolor": "#EBF0F8", "zerolinecolor": "#EBF0F8", "showbackground": true, "backgroundcolor": "white" }, "yaxis": { "ticks": "", "gridcolor": "#DFE8F3", "gridwidth": 2, "linecolor": "#EBF0F8", "zerolinecolor": "#EBF0F8", "showbackground": true, "backgroundcolor": "white" }, "zaxis": { "ticks": "", "gridcolor": "#DFE8F3", "gridwidth": 2, "linecolor": "#EBF0F8", "zerolinecolor": "#EBF0F8", "showbackground": true, "backgroundcolor": "white" } }, "title": { "x": 0.05 }, "xaxis": { "ticks": "", "gridcolor": "#EBF0F8", "linecolor": "#EBF0F8", "automargin": true, "zerolinecolor": "#EBF0F8", "zerolinewidth": 2 }, "yaxis": { "ticks": "", "gridcolor": "#EBF0F8", "linecolor": "#EBF0F8", "automargin": true, "zerolinecolor": "#EBF0F8", "zerolinewidth": 2 }, "ternary": { "aaxis": { "ticks": "", "gridcolor": "#DFE8F3", "linecolor": "#A2B1C6" }, "baxis": { "ticks": "", "gridcolor": "#DFE8F3", "linecolor": "#A2B1C6" }, "caxis": { "ticks": "", "gridcolor": "#DFE8F3", "linecolor": "#A2B1C6" }, "bgcolor": "white" }, "colorway": [ "#636efa", "#EF553B", "#00cc96", "#ab63fa", "#19d3f3", "#e763fa", "#fecb52", "#ffa15a", "#ff6692", "#b6e880" ], "hovermode": "closest", "colorscale": { "diverging": [ [ 0, "#8e0152" ], [ 0.1, "#c51b7d" ], [ 0.2, "#de77ae" ], [ 0.3, "#f1b6da" ], [ 0.4, "#fde0ef" ], [ 0.5, "#f7f7f7" ], [ 0.6, "#e6f5d0" ], [ 0.7, "#b8e186" ], [ 0.8, "#7fbc41" ], [ 0.9, "#4d9221" ], [ 1, "#276419" ] ], "sequential": [ [ 0, "#0508b8" ], [ 0.0893854748603352, "#1910d8" ], [ 0.1787709497206704, "#3c19f0" ], [ 0.2681564245810056, "#6b1cfb" ], [ 0.3575418994413408, "#981cfd" ], [ 0.44692737430167595, "#bf1cfd" ], [ 0.5363128491620112, "#dd2bfd" ], [ 0.6256983240223464, "#f246fe" ], [ 0.7150837988826816, "#fc67fd" ], [ 0.8044692737430168, "#fe88fc" ], [ 0.8938547486033519, "#fea5fd" ], [ 0.9832402234636871, "#febefe" ], [ 1, "#fec3fe" ] ], "sequentialminus": [ [ 0, "#0508b8" ], [ 0.0893854748603352, "#1910d8" ], [ 0.1787709497206704, "#3c19f0" ], [ 0.2681564245810056, "#6b1cfb" ], [ 0.3575418994413408, "#981cfd" ], [ 0.44692737430167595, "#bf1cfd" ], [ 0.5363128491620112, "#dd2bfd" ], [ 0.6256983240223464, "#f246fe" ], [ 0.7150837988826816, "#fc67fd" ], [ 0.8044692737430168, "#fe88fc" ], [ 0.8938547486033519, "#fea5fd" ], [ 0.9832402234636871, "#febefe" ], [ 1, "#fec3fe" ] ] }, "plot_bgcolor": "white", "paper_bgcolor": "white", "shapedefaults": { "line": { "width": 0 }, "opacity": 0.4, "fillcolor": "#506784" }, "annotationdefaults": { "arrowhead": 0, "arrowcolor": "#506784", "arrowwidth": 1 } }, "themeRef": "PLOTLY_WHITE" } } }, "height": null, "width": null, "user": { "profile_url": "https://chart-studio.plotly.com/~mp27173", "avatar_url": "https://storage.googleapis.com/plotly-prod-profiles/63.jpg", "background_url": "https://storage.googleapis.com/plotly-prod-profiles/bg-2.jpg", "bio": "", "nickname": "", "website": "", "stream_tokens": null, "feature_set_id": null, "csrf_token": null, "date_joined": "2025-08-29 16:09:21", "mapbox_access_tokens": null, "has_password": null, "username": "mp27173", "email": null, "is_active": null, "readonly": null, "is_dash_creator": null, "dash_created_count": null, "is_chart_creator": null, "charts_created_count": null } }, { "creation_time": "2025-09-15T16:36:58.274499Z", "comments": { "results": [], "count": 0 }, "parented": true, "embed_url": "https://chart-studio.plotly.com/~Madi1031/1.embed", "fid": "Madi1031:1", "filename": "Plot 1", "filetype": "plot", "img_url": "https://storage.googleapis.com/plotly-prod-images/Madi1031/1/9_HP6VQQP0ZB60H2E6YOPT9P2IF1HRW7.png", "image_urls": { "default": "https://storage.googleapis.com/plotly-prod-images/Madi1031/1/2_G0UB0ZLUDCNM5X4SHOA5Q3GRYR1VPA.png", "block-thumb": "https://storage.googleapis.com/plotly-prod-images/Madi1031/1/8_APTTPT5EHNDX0FNXYEYUGCQVZ9H4VC.png", "list-thumb": "https://storage.googleapis.com/plotly-prod-images/Madi1031/1/9_HP6VQQP0ZB60H2E6YOPT9P2IF1HRW7.png" }, "api_urls": { "files": "https://api.plotly.com/v2/files/Madi1031:1", "plots": "https://api.plotly.com/v2/plots/Madi1031:1", "parent": "https://api.plotly.com/v2/folders/home?user=Madi1031" }, "owner": "Madi1031", "parent": -1, "preview": "", "referencers": [], "references": [], "title": "", "views": 1, "web_url": "https://chart-studio.plotly.com/~Madi1031/1/", "world_readable": true, "date_modified": "2025-09-16T03:54:53.781Z", "stars": { "results": [], "count": 0 }, "collaborators": { "results": [], "count": 0 }, "subfolder_count": null, "refresh_interval": null, "organize_view_url": "https://chart-studio.plotly.com/~Madi1031/1/", "current_user_permission": "read", "is_theme": null, "is_template": false, "autosize": true, "caption": "", "figure": { "data": [ { "meta": { "columnNames": { "x": "A", "y": "B", "error_x": { "array": "C" }, "error_y": { "array": "C" } } }, "mode": "markers", "type": "bar", "xsrc": "Madi1031:0:4fc788", "ysrc": "Madi1031:0:0076e2", "error_x": { "meta": { "columnNames": { "array": "C" } }, "type": "data", "visible": true, "arraysrc": "Madi1031:0:a589e1", "symmetric": true }, "error_y": { "meta": { "columnNames": { "array": "C" } }, "type": "data", "visible": true, "arraysrc": "Madi1031:0:a589e1", "symmetric": true }, "orientation": "v" } ], "frames": [], "layout": { "title": { "text": "Spores vs. No Spores" }, "xaxis": { "type": "category", "range": [ -0.5, 1.5 ], "autorange": true }, "yaxis": { "type": "linear", "range": [ 0, 11.418265924210527 ], "autorange": true }, "autosize": true, "dragmode": "zoom", "template": { "data": { "bar": [ { "type": "bar", "marker": { "colorbar": { "ticks": "", "outlinewidth": 0 } } } ], "table": [ { "type": "table", "cells": { "fill": { "color": "#EBF0F8" }, "line": { "color": "white" } }, "header": { "fill": { "color": "#C8D4E3" }, "line": { "color": "white" } } } ], "carpet": [ { "type": "carpet", "aaxis": { "gridcolor": "#C8D4E3", "linecolor": "#C8D4E3", "endlinecolor": "#2a3f5f", "minorgridcolor": "#C8D4E3", "startlinecolor": "#2a3f5f" }, "baxis": { "gridcolor": "#C8D4E3", "linecolor": "#C8D4E3", "endlinecolor": "#2a3f5f", "minorgridcolor": "#C8D4E3", "startlinecolor": "#2a3f5f" } } ], "mesh3d": [ { "type": "mesh3d", "colorbar": { "ticks": "", "outlinewidth": 0 } } ], "contour": [ { "type": "contour", "colorbar": { "ticks": "", "outlinewidth": 0 }, "autocolorscale": true } ], "heatmap": [ { "type": "heatmap", "colorbar": { "ticks": "", "outlinewidth": 0 }, "autocolorscale": true } ], "scatter": [ { "type": "scatter", "marker": { "colorbar": { "ticks": "", "outlinewidth": 0 } } } ], "surface": [ { "type": "surface", "colorbar": { "ticks": "", "outlinewidth": 0 } } ], "heatmapgl": [ { "type": "heatmapgl", "colorbar": { "ticks": "", "outlinewidth": 0 } } ], "histogram": [ { "type": "histogram", "marker": { "colorbar": { "ticks": "", "outlinewidth": 0 } } } ], "parcoords": [ { "line": { "colorbar": { "ticks": "", "outlinewidth": 0 } }, "type": "parcoords" } ], "scatter3d": [ { "type": "scatter3d", "marker": { "colorbar": { "ticks": "", "outlinewidth": 0 } } } ], "scattergl": [ { "type": "scattergl", "marker": { "colorbar": { "ticks": "", "outlinewidth": 0 } } } ], "choropleth": [ { "type": "choropleth", "colorbar": { "ticks": "", "outlinewidth": 0 } } ], "scattergeo": [ { "type": "scattergeo", "marker": { "colorbar": { "ticks": "", "outlinewidth": 0 } } } ], "histogram2d": [ { "type": "histogram2d", "colorbar": { "ticks": "", "outlinewidth": 0 }, "autocolorscale": true } ], "scatterpolar": [ { "type": "scatterpolar", "marker": { "colorbar": { "ticks": "", "outlinewidth": 0 } } } ], "contourcarpet": [ { "type": "contourcarpet", "colorbar": { "ticks": "", "outlinewidth": 0 } } ], "scattercarpet": [ { "type": "scattercarpet", "marker": { "colorbar": { "ticks": "", "outlinewidth": 0 } } } ], "scattermapbox": [ { "type": "scattermapbox", "marker": { "colorbar": { "ticks": "", "outlinewidth": 0 } } } ], "scatterpolargl": [ { "type": "scatterpolargl", "marker": { "colorbar": { "ticks": "", "outlinewidth": 0 } } } ], "scatterternary": [ { "type": "scatterternary", "marker": { "colorbar": { "ticks": "", "outlinewidth": 0 } } } ], "histogram2dcontour": [ { "type": "histogram2dcontour", "colorbar": { "ticks": "", "outlinewidth": 0 }, "autocolorscale": true } ] }, "layout": { "geo": { "bgcolor": "white", "showland": true, "lakecolor": "white", "landcolor": "white", "showlakes": true, "subunitcolor": "#C8D4E3" }, "font": { "color": "#2a3f5f" }, "polar": { "bgcolor": "white", "radialaxis": { "ticks": "", "gridcolor": "#EBF0F8", "linecolor": "#EBF0F8" }, "angularaxis": { "ticks": "", "gridcolor": "#EBF0F8", "linecolor": "#EBF0F8" } }, "scene": { "xaxis": { "ticks": "", "gridcolor": "#DFE8F3", "gridwidth": 2, "linecolor": "#EBF0F8", "zerolinecolor": "#EBF0F8", "showbackground": true, "backgroundcolor": "white" }, "yaxis": { "ticks": "", "gridcolor": "#DFE8F3", "gridwidth": 2, "linecolor": "#EBF0F8", "zerolinecolor": "#EBF0F8", "showbackground": true, "backgroundcolor": "white" }, "zaxis": { "ticks": "", "gridcolor": "#DFE8F3", "gridwidth": 2, "linecolor": "#EBF0F8", "zerolinecolor": "#EBF0F8", "showbackground": true, "backgroundcolor": "white" } }, "title": { "x": 0.05 }, "xaxis": { "ticks": "", "gridcolor": "#EBF0F8", "linecolor": "#EBF0F8", "automargin": true, "zerolinecolor": "#EBF0F8", "zerolinewidth": 2 }, "yaxis": { "ticks": "", "gridcolor": "#EBF0F8", "linecolor": "#EBF0F8", "automargin": true, "zerolinecolor": "#EBF0F8", "zerolinewidth": 2 }, "ternary": { "aaxis": { "ticks": "", "gridcolor": "#DFE8F3", "linecolor": "#A2B1C6" }, "baxis": { "ticks": "", "gridcolor": "#DFE8F3", "linecolor": "#A2B1C6" }, "caxis": { "ticks": "", "gridcolor": "#DFE8F3", "linecolor": "#A2B1C6" }, "bgcolor": "white" }, "colorway": [ "#636efa", "#EF553B", "#00cc96", "#ab63fa", "#19d3f3", "#e763fa", "#fecb52", "#ffa15a", "#ff6692", "#b6e880" ], "hovermode": "closest", "colorscale": { "diverging": [ [ 0, "#8e0152" ], [ 0.1, "#c51b7d" ], [ 0.2, "#de77ae" ], [ 0.3, "#f1b6da" ], [ 0.4, "#fde0ef" ], [ 0.5, "#f7f7f7" ], [ 0.6, "#e6f5d0" ], [ 0.7, "#b8e186" ], [ 0.8, "#7fbc41" ], [ 0.9, "#4d9221" ], [ 1, "#276419" ] ], "sequential": [ [ 0, "#0508b8" ], [ 0.0893854748603352, "#1910d8" ], [ 0.1787709497206704, "#3c19f0" ], [ 0.2681564245810056, "#6b1cfb" ], [ 0.3575418994413408, "#981cfd" ], [ 0.44692737430167595, "#bf1cfd" ], [ 0.5363128491620112, "#dd2bfd" ], [ 0.6256983240223464, "#f246fe" ], [ 0.7150837988826816, "#fc67fd" ], [ 0.8044692737430168, "#fe88fc" ], [ 0.8938547486033519, "#fea5fd" ], [ 0.9832402234636871, "#febefe" ], [ 1, "#fec3fe" ] ], "sequentialminus": [ [ 0, "#0508b8" ], [ 0.0893854748603352, "#1910d8" ], [ 0.1787709497206704, "#3c19f0" ], [ 0.2681564245810056, "#6b1cfb" ], [ 0.3575418994413408, "#981cfd" ], [ 0.44692737430167595, "#bf1cfd" ], [ 0.5363128491620112, "#dd2bfd" ], [ 0.6256983240223464, "#f246fe" ], [ 0.7150837988826816, "#fc67fd" ], [ 0.8044692737430168, "#fe88fc" ], [ 0.8938547486033519, "#fea5fd" ], [ 0.9832402234636871, "#febefe" ], [ 1, "#fec3fe" ] ] }, "plot_bgcolor": "white", "paper_bgcolor": "white", "shapedefaults": { "line": { "width": 0 }, "opacity": 0.4, "fillcolor": "#506784" }, "annotationdefaults": { "arrowhead": 0, "arrowcolor": "#506784", "arrowwidth": 1 } }, "themeRef": "PLOTLY_WHITE" } } }, "height": null, "width": null, "user": { "profile_url": "https://chart-studio.plotly.com/~Madi1031", "avatar_url": "https://storage.googleapis.com/plotly-prod-profiles/41.jpg", "background_url": "https://storage.googleapis.com/plotly-prod-profiles/bg-3.jpg", "bio": "", "nickname": "", "website": "", "stream_tokens": null, "feature_set_id": null, "csrf_token": null, "date_joined": "2025-08-29 16:11:05", "mapbox_access_tokens": null, "has_password": null, "username": "Madi1031", "email": null, "is_active": null, "readonly": null, "is_dash_creator": null, "dash_created_count": null, "is_chart_creator": null, "charts_created_count": null } }, { "creation_time": "2025-09-15T15:43:58.759772Z", "comments": { "results": [], "count": 0 }, "parented": true, "embed_url": "https://chart-studio.plotly.com/~tim_stuhec/34.embed", "fid": "tim_stuhec:34", "filename": "image-search-deployed-vs-new", "filetype": "plot", "img_url": "https://storage.googleapis.com/plotly-prod-images/tim_stuhec/34/9_9QUG9YPMT367IGHCQJ6ZI3YQET151T.png", "image_urls": { "default": "https://storage.googleapis.com/plotly-prod-images/tim_stuhec/34/2_YDARJJABJ7W71CSQ1L30IYAFCWNITD.png", "block-thumb": "https://storage.googleapis.com/plotly-prod-images/tim_stuhec/34/8_VJN2LLRJJEUMRWR1SS0EKHSNRFL2IW.png", "list-thumb": "https://storage.googleapis.com/plotly-prod-images/tim_stuhec/34/9_9QUG9YPMT367IGHCQJ6ZI3YQET151T.png" }, "api_urls": { "files": "https://api.plotly.com/v2/files/tim_stuhec:34", "plots": "https://api.plotly.com/v2/plots/tim_stuhec:34", "parent": "https://api.plotly.com/v2/folders/home?user=tim_stuhec" }, "owner": "tim_stuhec", "parent": -1, "preview": "", "referencers": [], "references": [], "title": "", "views": 1, "web_url": "https://chart-studio.plotly.com/~tim_stuhec/34/", "world_readable": true, "date_modified": "2025-09-19T09:57:43.038Z", "stars": { "results": [], "count": 0 }, "collaborators": { "results": [], "count": 0 }, "subfolder_count": null, "refresh_interval": null, "organize_view_url": "https://chart-studio.plotly.com/~tim_stuhec/34/", "current_user_permission": "read", "is_theme": null, "is_template": null, "autosize": true, "caption": "", "figure": { "data": [ { "fill": "toself", "line": { "color": "#636EFA", "width": 0 }, "mode": "lines", "name": "Deployed Model uncertainty", "type": "scatter", "xsrc": "tim_stuhec:51:ffffca", "ysrc": "tim_stuhec:51:5ba9f6", "opacity": 1.0, "fillcolor": "rgba(99,110,250,0.3)", "hoverinfo": "skip", "showlegend": false }, { "line": { "color": "#636EFA", "width": 3 }, "mode": "lines+markers", "name": "Deployed Model", "type": "scatter", "xsrc": "tim_stuhec:51:9c2e22", "ysrc": "tim_stuhec:51:48e04a", "marker": { "size": 3, "color": "#636EFA" }, "textsrc": "tim_stuhec:51:44e3fe", "hoverinfo": "text" }, { "fill": "toself", "line": { "color": "#EF553B", "width": 0 }, "mode": "lines", "name": "context uncertainty", "type": "scatter", "xsrc": "tim_stuhec:51:4b1a83", "ysrc": "tim_stuhec:51:3b4e14", "opacity": 1.0, "fillcolor": "rgba(239,85,59,0.3)", "hoverinfo": "skip", "showlegend": false }, { "line": { "color": "#EF553B", "width": 3 }, "mode": "lines+markers", "name": "context", "type": "scatter", "xsrc": "tim_stuhec:51:093a68", "ysrc": "tim_stuhec:51:1fe3c6", "marker": { "size": 3, "color": "#EF553B" }, "textsrc": "tim_stuhec:51:aac910", "hoverinfo": "text" }, { "fill": "toself", "line": { "color": "#00CC96", "width": 0 }, "mode": "lines", "name": "OCR uncertainty", "type": "scatter", "xsrc": "tim_stuhec:51:41ff02", "ysrc": "tim_stuhec:51:d0de7e", "opacity": 1.0, "fillcolor": "rgba(0,204,150,0.3)", "hoverinfo": "skip", "showlegend": false }, { "line": { "color": "#00CC96", "width": 3 }, "mode": "lines+markers", "name": "OCR", "type": "scatter", "xsrc": "tim_stuhec:51:819c87", "ysrc": "tim_stuhec:51:0f4d9c", "marker": { "size": 3, "color": "#00CC96" }, "textsrc": "tim_stuhec:51:9dd507", "hoverinfo": "text" }, { "fill": "toself", "line": { "color": "#AB63FA", "width": 0 }, "mode": "lines", "name": "Image uncertainty", "type": "scatter", "xsrc": "tim_stuhec:51:47b902", "ysrc": "tim_stuhec:51:a06105", "opacity": 1.0, "fillcolor": "rgba(171,99,250,0.3)", "hoverinfo": "skip", "showlegend": false }, { "line": { "color": "#AB63FA", "width": 3 }, "mode": "lines+markers", "name": "Image", "type": "scatter", "xsrc": "tim_stuhec:51:112a7b", "ysrc": "tim_stuhec:51:840be0", "marker": { "size": 3, "color": "#AB63FA" }, "textsrc": "tim_stuhec:51:666abe", "hoverinfo": "text" }, { "fill": "toself", "line": { "color": "#FFA15A", "width": 0 }, "mode": "lines", "name": "Image+OCR uncertainty", "type": "scatter", "xsrc": "tim_stuhec:51:b073b2", "ysrc": "tim_stuhec:51:9d78ab", "opacity": 1.0, "fillcolor": "rgba(255,161,90,0.3)", "hoverinfo": "skip", "showlegend": false }, { "line": { "color": "#FFA15A", "width": 3 }, "mode": "lines+markers", "name": "Image+OCR", "type": "scatter", "xsrc": "tim_stuhec:51:3a5a6b", "ysrc": "tim_stuhec:51:a078e9", "marker": { "size": 3, "color": "#FFA15A" }, "textsrc": "tim_stuhec:51:5b65be", "hoverinfo": "text" }, { "fill": "toself", "line": { "color": "#19D3F3", "width": 0 }, "mode": "lines", "name": "Image+OCR+context uncertainty", "type": "scatter", "xsrc": "tim_stuhec:51:8f50e5", "ysrc": "tim_stuhec:51:e1e825", "opacity": 1.0, "fillcolor": "rgba(25,211,243,0.3)", "hoverinfo": "skip", "showlegend": false }, { "line": { "color": "#19D3F3", "width": 3 }, "mode": "lines+markers", "name": "Image+OCR+context", "type": "scatter", "xsrc": "tim_stuhec:51:671139", "ysrc": "tim_stuhec:51:0e960f", "marker": { "size": 3, "color": "#19D3F3" }, "textsrc": "tim_stuhec:51:0221ce", "hoverinfo": "text" } ], "layout": { "title": { "text": "Evaluating Image Retrieval with Precision-Recall Curve" }, "xaxis": { "minor": { "dtick": 0.05, "showgrid": true, "gridcolor": "rgb(230,230,230)", "gridwidth": 0.5 }, "range": [ 0.0, 1.05 ], "title": { "text": "Retrieval Recall" }, "mirror": true, "gridcolor": "LightGrey", "gridwidth": 1, "linecolor": "black", "linewidth": 1, "tickformat": ".0%" }, "yaxis": { "minor": { "dtick": 0.05, "showgrid": true, "gridcolor": "rgb(230,230,230)", "gridwidth": 0.5 }, "range": [ 0.0, 1.05 ], "title": { "text": "Retrieval Precision@1" }, "mirror": true, "gridcolor": "LightGrey", "gridwidth": 1, "linecolor": "black", "linewidth": 1, "tickformat": ".0%" }, "height": 700, "legend": { "x": 0.02, "y": 0.02, "xanchor": "left", "yanchor": "bottom", "bordercolor": "Black", "borderwidth": 1 }, "shapes": [ { "x0": 0.05, "x1": 0.05, "y0": 0, "y1": 1.05, "line": { "color": "rgb(230,230,230)", "width": 0.5 }, "type": "line", "xref": "x", "yref": "paper", "layer": "below" }, { "x0": 0.1, "x1": 0.1, "y0": 0, "y1": 1.05, "line": { "color": "rgb(230,230,230)", "width": 0.5 }, "type": "line", "xref": "x", "yref": "paper", "layer": "below" }, { "x0": 0.15000000000000002, "x1": 0.15000000000000002, "y0": 0, "y1": 1.05, "line": { "color": "rgb(230,230,230)", "width": 0.5 }, "type": "line", "xref": "x", "yref": "paper", "layer": "below" }, { "x0": 0.2, "x1": 0.2, "y0": 0, "y1": 1.05, "line": { "color": "rgb(230,230,230)", "width": 0.5 }, "type": "line", "xref": "x", "yref": "paper", "layer": "below" }, { "x0": 0.25, "x1": 0.25, "y0": 0, "y1": 1.05, "line": { "color": "rgb(230,230,230)", "width": 0.5 }, "type": "line", "xref": "x", "yref": "paper", "layer": "below" }, { "x0": 0.3, "x1": 0.3, "y0": 0, "y1": 1.05, "line": { "color": "rgb(230,230,230)", "width": 0.5 }, "type": "line", "xref": "x", "yref": "paper", "layer": "below" }, { "x0": 0.35000000000000003, "x1": 0.35000000000000003, "y0": 0, "y1": 1.05, "line": { "color": "rgb(230,230,230)", "width": 0.5 }, "type": "line", "xref": "x", "yref": "paper", "layer": "below" }, { "x0": 0.4, "x1": 0.4, "y0": 0, "y1": 1.05, "line": { "color": "rgb(230,230,230)", "width": 0.5 }, "type": "line", "xref": "x", "yref": "paper", "layer": "below" }, { "x0": 0.45, "x1": 0.45, "y0": 0, "y1": 1.05, "line": { "color": "rgb(230,230,230)", "width": 0.5 }, "type": "line", "xref": "x", "yref": "paper", "layer": "below" }, { "x0": 0.5, "x1": 0.5, "y0": 0, "y1": 1.05, "line": { "color": "rgb(230,230,230)", "width": 0.5 }, "type": "line", "xref": "x", "yref": "paper", "layer": "below" }, { "x0": 0.55, "x1": 0.55, "y0": 0, "y1": 1.05, "line": { "color": "rgb(230,230,230)", "width": 0.5 }, "type": "line", "xref": "x", "yref": "paper", "layer": "below" }, { "x0": 0.6000000000000001, "x1": 0.6000000000000001, "y0": 0, "y1": 1.05, "line": { "color": "rgb(230,230,230)", "width": 0.5 }, "type": "line", "xref": "x", "yref": "paper", "layer": "below" }, { "x0": 0.6500000000000001, "x1": 0.6500000000000001, "y0": 0, "y1": 1.05, "line": { "color": "rgb(230,230,230)", "width": 0.5 }, "type": "line", "xref": "x", "yref": "paper", "layer": "below" }, { "x0": 0.7000000000000001, "x1": 0.7000000000000001, "y0": 0, "y1": 1.05, "line": { "color": "rgb(230,230,230)", "width": 0.5 }, "type": "line", "xref": "x", "yref": "paper", "layer": "below" }, { "x0": 0.7500000000000001, "x1": 0.7500000000000001, "y0": 0, "y1": 1.05, "line": { "color": "rgb(230,230,230)", "width": 0.5 }, "type": "line", "xref": "x", "yref": "paper", "layer": "below" }, { "x0": 0.8, "x1": 0.8, "y0": 0, "y1": 1.05, "line": { "color": "rgb(230,230,230)", "width": 0.5 }, "type": "line", "xref": "x", "yref": "paper", "layer": "below" }, { "x0": 0.8500000000000001, "x1": 0.8500000000000001, "y0": 0, "y1": 1.05, "line": { "color": "rgb(230,230,230)", "width": 0.5 }, "type": "line", "xref": "x", "yref": "paper", "layer": "below" }, { "x0": 0.9000000000000001, "x1": 0.9000000000000001, "y0": 0, "y1": 1.05, "line": { "color": "rgb(230,230,230)", "width": 0.5 }, "type": "line", "xref": "x", "yref": "paper", "layer": "below" }, { "x0": 0.9500000000000001, "x1": 0.9500000000000001, "y0": 0, "y1": 1.05, "line": { "color": "rgb(230,230,230)", "width": 0.5 }, "type": "line", "xref": "x", "yref": "paper", "layer": "below" }, { "x0": 0, "x1": 1.05, "y0": 0.05, "y1": 0.05, "line": { "color": "rgb(230,230,230)", "width": 0.5 }, "type": "line", "xref": "paper", "yref": "y", "layer": "below" }, { "x0": 0, "x1": 1.05, "y0": 0.1, "y1": 0.1, "line": { "color": "rgb(230,230,230)", "width": 0.5 }, "type": "line", "xref": "paper", "yref": "y", "layer": "below" }, { "x0": 0, "x1": 1.05, "y0": 0.15000000000000002, "y1": 0.15000000000000002, "line": { "color": "rgb(230,230,230)", "width": 0.5 }, "type": "line", "xref": "paper", "yref": "y", "layer": "below" }, { "x0": 0, "x1": 1.05, "y0": 0.2, "y1": 0.2, "line": { "color": "rgb(230,230,230)", "width": 0.5 }, "type": "line", "xref": "paper", "yref": "y", "layer": "below" }, { "x0": 0, "x1": 1.05, "y0": 0.25, "y1": 0.25, "line": { "color": "rgb(230,230,230)", "width": 0.5 }, "type": "line", "xref": "paper", "yref": "y", "layer": "below" }, { "x0": 0, "x1": 1.05, "y0": 0.3, "y1": 0.3, "line": { "color": "rgb(230,230,230)", "width": 0.5 }, "type": "line", "xref": "paper", "yref": "y", "layer": "below" }, { "x0": 0, "x1": 1.05, "y0": 0.35000000000000003, "y1": 0.35000000000000003, "line": { "color": "rgb(230,230,230)", "width": 0.5 }, "type": "line", "xref": "paper", "yref": "y", "layer": "below" }, { "x0": 0, "x1": 1.05, "y0": 0.4, "y1": 0.4, "line": { "color": "rgb(230,230,230)", "width": 0.5 }, "type": "line", "xref": "paper", "yref": "y", "layer": "below" }, { "x0": 0, "x1": 1.05, "y0": 0.45, "y1": 0.45, "line": { "color": "rgb(230,230,230)", "width": 0.5 }, "type": "line", "xref": "paper", "yref": "y", "layer": "below" }, { "x0": 0, "x1": 1.05, "y0": 0.5, "y1": 0.5, "line": { "color": "rgb(230,230,230)", "width": 0.5 }, "type": "line", "xref": "paper", "yref": "y", "layer": "below" }, { "x0": 0, "x1": 1.05, "y0": 0.55, "y1": 0.55, "line": { "color": "rgb(230,230,230)", "width": 0.5 }, "type": "line", "xref": "paper", "yref": "y", "layer": "below" }, { "x0": 0, "x1": 1.05, "y0": 0.6000000000000001, "y1": 0.6000000000000001, "line": { "color": "rgb(230,230,230)", "width": 0.5 }, "type": "line", "xref": "paper", "yref": "y", "layer": "below" }, { "x0": 0, "x1": 1.05, "y0": 0.6500000000000001, "y1": 0.6500000000000001, "line": { "color": "rgb(230,230,230)", "width": 0.5 }, "type": "line", "xref": "paper", "yref": "y", "layer": "below" }, { "x0": 0, "x1": 1.05, "y0": 0.7000000000000001, "y1": 0.7000000000000001, "line": { "color": "rgb(230,230,230)", "width": 0.5 }, "type": "line", "xref": "paper", "yref": "y", "layer": "below" }, { "x0": 0, "x1": 1.05, "y0": 0.7500000000000001, "y1": 0.7500000000000001, "line": { "color": "rgb(230,230,230)", "width": 0.5 }, "type": "line", "xref": "paper", "yref": "y", "layer": "below" }, { "x0": 0, "x1": 1.05, "y0": 0.8, "y1": 0.8, "line": { "color": "rgb(230,230,230)", "width": 0.5 }, "type": "line", "xref": "paper", "yref": "y", "layer": "below" }, { "x0": 0, "x1": 1.05, "y0": 0.8500000000000001, "y1": 0.8500000000000001, "line": { "color": "rgb(230,230,230)", "width": 0.5 }, "type": "line", "xref": "paper", "yref": "y", "layer": "below" }, { "x0": 0, "x1": 1.05, "y0": 0.9000000000000001, "y1": 0.9000000000000001, "line": { "color": "rgb(230,230,230)", "width": 0.5 }, "type": "line", "xref": "paper", "yref": "y", "layer": "below" }, { "x0": 0, "x1": 1.05, "y0": 0.9500000000000001, "y1": 0.9500000000000001, "line": { "color": "rgb(230,230,230)", "width": 0.5 }, "type": "line", "xref": "paper", "yref": "y", "layer": "below" } ], "template": { "data": { "bar": [ { "type": "bar", "marker": { "line": { "color": "#E5ECF6", "width": 0.5 }, "pattern": { "size": 10, "fillmode": "overlay", "solidity": 0.2 } }, "error_x": { "color": "#2a3f5f" }, "error_y": { "color": "#2a3f5f" } } ], "pie": [ { "type": "pie", "automargin": true } ], "table": [ { "type": "table", "cells": { "fill": { "color": "#EBF0F8" }, "line": { "color": "white" } }, "header": { "fill": { "color": "#C8D4E3" }, "line": { "color": "white" } } } ], "carpet": [ { "type": "carpet", "aaxis": { "gridcolor": "white", "linecolor": "white", "endlinecolor": "#2a3f5f", "minorgridcolor": "white", "startlinecolor": "#2a3f5f" }, "baxis": { "gridcolor": "white", "linecolor": "white", "endlinecolor": "#2a3f5f", "minorgridcolor": "white", "startlinecolor": "#2a3f5f" } } ], "mesh3d": [ { "type": "mesh3d", "colorbar": { "ticks": "", "outlinewidth": 0 } } ], "contour": [ { "type": "contour", "colorbar": { "ticks": "", "outlinewidth": 0 }, "colorscale": [ [ 0.0, "#0d0887" ], [ 0.1111111111111111, "#46039f" ], [ 0.2222222222222222, "#7201a8" ], [ 0.3333333333333333, "#9c179e" ], [ 0.4444444444444444, "#bd3786" ], [ 0.5555555555555556, "#d8576b" ], [ 0.6666666666666666, "#ed7953" ], [ 0.7777777777777778, "#fb9f3a" ], [ 0.8888888888888888, "#fdca26" ], [ 1.0, "#f0f921" ] ] } ], "heatmap": [ { "type": "heatmap", "colorbar": { "ticks": "", "outlinewidth": 0 }, "colorscale": [ [ 0.0, "#0d0887" ], [ 0.1111111111111111, "#46039f" ], [ 0.2222222222222222, "#7201a8" ], [ 0.3333333333333333, "#9c179e" ], [ 0.4444444444444444, "#bd3786" ], [ 0.5555555555555556, "#d8576b" ], [ 0.6666666666666666, "#ed7953" ], [ 0.7777777777777778, "#fb9f3a" ], [ 0.8888888888888888, "#fdca26" ], [ 1.0, "#f0f921" ] ] } ], "scatter": [ { "type": "scatter", "fillpattern": { "size": 10, "fillmode": "overlay", "solidity": 0.2 } } ], "surface": [ { "type": "surface", "colorbar": { "ticks": "", "outlinewidth": 0 }, "colorscale": [ [ 0.0, "#0d0887" ], [ 0.1111111111111111, "#46039f" ], [ 0.2222222222222222, "#7201a8" ], [ 0.3333333333333333, "#9c179e" ], [ 0.4444444444444444, "#bd3786" ], [ 0.5555555555555556, "#d8576b" ], [ 0.6666666666666666, "#ed7953" ], [ 0.7777777777777778, "#fb9f3a" ], [ 0.8888888888888888, "#fdca26" ], [ 1.0, "#f0f921" ] ] } ], "barpolar": [ { "type": "barpolar", "marker": { "line": { "color": "#E5ECF6", "width": 0.5 }, "pattern": { "size": 10, "fillmode": "overlay", "solidity": 0.2 } } } ], "histogram": [ { "type": "histogram", "marker": { "pattern": { "size": 10, "fillmode": "overlay", "solidity": 0.2 } } } ], "parcoords": [ { "line": { "colorbar": { "ticks": "", "outlinewidth": 0 } }, "type": "parcoords" } ], "scatter3d": [ { "line": { "colorbar": { "ticks": "", "outlinewidth": 0 } }, "type": "scatter3d", "marker": { "colorbar": { "ticks": "", "outlinewidth": 0 } } } ], "scattergl": [ { "type": "scattergl", "marker": { "colorbar": { "ticks": "", "outlinewidth": 0 } } } ], "choropleth": [ { "type": "choropleth", "colorbar": { "ticks": "", "outlinewidth": 0 } } ], "scattergeo": [ { "type": "scattergeo", "marker": { "colorbar": { "ticks": "", "outlinewidth": 0 } } } ], "scattermap": [ { "type": "scattermap", "marker": { "colorbar": { "ticks": "", "outlinewidth": 0 } } } ], "histogram2d": [ { "type": "histogram2d", "colorbar": { "ticks": "", "outlinewidth": 0 }, "colorscale": [ [ 0.0, "#0d0887" ], [ 0.1111111111111111, "#46039f" ], [ 0.2222222222222222, "#7201a8" ], [ 0.3333333333333333, "#9c179e" ], [ 0.4444444444444444, "#bd3786" ], [ 0.5555555555555556, "#d8576b" ], [ 0.6666666666666666, "#ed7953" ], [ 0.7777777777777778, "#fb9f3a" ], [ 0.8888888888888888, "#fdca26" ], [ 1.0, "#f0f921" ] ] } ], "scatterpolar": [ { "type": "scatterpolar", "marker": { "colorbar": { "ticks": "", "outlinewidth": 0 } } } ], "contourcarpet": [ { "type": "contourcarpet", "colorbar": { "ticks": "", "outlinewidth": 0 } } ], "scattercarpet": [ { "type": "scattercarpet", "marker": { "colorbar": { "ticks": "", "outlinewidth": 0 } } } ], "scattermapbox": [ { "type": "scattermapbox", "marker": { "colorbar": { "ticks": "", "outlinewidth": 0 } } } ], "scatterpolargl": [ { "type": "scatterpolargl", "marker": { "colorbar": { "ticks": "", "outlinewidth": 0 } } } ], "scatterternary": [ { "type": "scatterternary", "marker": { "colorbar": { "ticks": "", "outlinewidth": 0 } } } ], "histogram2dcontour": [ { "type": "histogram2dcontour", "colorbar": { "ticks": "", "outlinewidth": 0 }, "colorscale": [ [ 0.0, "#0d0887" ], [ 0.1111111111111111, "#46039f" ], [ 0.2222222222222222, "#7201a8" ], [ 0.3333333333333333, "#9c179e" ], [ 0.4444444444444444, "#bd3786" ], [ 0.5555555555555556, "#d8576b" ], [ 0.6666666666666666, "#ed7953" ], [ 0.7777777777777778, "#fb9f3a" ], [ 0.8888888888888888, "#fdca26" ], [ 1.0, "#f0f921" ] ] } ] }, "layout": { "geo": { "bgcolor": "white", "showland": true, "lakecolor": "white", "landcolor": "#E5ECF6", "showlakes": true, "subunitcolor": "white" }, "font": { "color": "#2a3f5f" }, "polar": { "bgcolor": "#E5ECF6", "radialaxis": { "ticks": "", "gridcolor": "white", "linecolor": "white" }, "angularaxis": { "ticks": "", "gridcolor": "white", "linecolor": "white" } }, "scene": { "xaxis": { "ticks": "", "gridcolor": "white", "gridwidth": 2, "linecolor": "white", "zerolinecolor": "white", "showbackground": true, "backgroundcolor": "#E5ECF6" }, "yaxis": { "ticks": "", "gridcolor": "white", "gridwidth": 2, "linecolor": "white", "zerolinecolor": "white", "showbackground": true, "backgroundcolor": "#E5ECF6" }, "zaxis": { "ticks": "", "gridcolor": "white", "gridwidth": 2, "linecolor": "white", "zerolinecolor": "white", "showbackground": true, "backgroundcolor": "#E5ECF6" } }, "title": { "x": 0.05 }, "xaxis": { "ticks": "", "title": { "standoff": 15 }, "gridcolor": "white", "linecolor": "white", "automargin": true, "zerolinecolor": "white", "zerolinewidth": 2 }, "yaxis": { "ticks": "", "title": { "standoff": 15 }, "gridcolor": "white", "linecolor": "white", "automargin": true, "zerolinecolor": "white", "zerolinewidth": 2 }, "mapbox": { "style": "light" }, "ternary": { "aaxis": { "ticks": "", "gridcolor": "white", "linecolor": "white" }, "baxis": { "ticks": "", "gridcolor": "white", "linecolor": "white" }, "caxis": { "ticks": "", "gridcolor": "white", "linecolor": "white" }, "bgcolor": "#E5ECF6" }, "colorway": [ "#636efa", "#EF553B", "#00cc96", "#ab63fa", "#FFA15A", "#19d3f3", "#FF6692", "#B6E880", "#FF97FF", "#FECB52" ], "coloraxis": { "colorbar": { "ticks": "", "outlinewidth": 0 } }, "hovermode": "closest", "colorscale": { "diverging": [ [ 0, "#8e0152" ], [ 0.1, "#c51b7d" ], [ 0.2, "#de77ae" ], [ 0.3, "#f1b6da" ], [ 0.4, "#fde0ef" ], [ 0.5, "#f7f7f7" ], [ 0.6, "#e6f5d0" ], [ 0.7, "#b8e186" ], [ 0.8, "#7fbc41" ], [ 0.9, "#4d9221" ], [ 1, "#276419" ] ], "sequential": [ [ 0.0, "#0d0887" ], [ 0.1111111111111111, "#46039f" ], [ 0.2222222222222222, "#7201a8" ], [ 0.3333333333333333, "#9c179e" ], [ 0.4444444444444444, "#bd3786" ], [ 0.5555555555555556, "#d8576b" ], [ 0.6666666666666666, "#ed7953" ], [ 0.7777777777777778, "#fb9f3a" ], [ 0.8888888888888888, "#fdca26" ], [ 1.0, "#f0f921" ] ], "sequentialminus": [ [ 0.0, "#0d0887" ], [ 0.1111111111111111, "#46039f" ], [ 0.2222222222222222, "#7201a8" ], [ 0.3333333333333333, "#9c179e" ], [ 0.4444444444444444, "#bd3786" ], [ 0.5555555555555556, "#d8576b" ], [ 0.6666666666666666, "#ed7953" ], [ 0.7777777777777778, "#fb9f3a" ], [ 0.8888888888888888, "#fdca26" ], [ 1.0, "#f0f921" ] ] }, "hoverlabel": { "align": "left" }, "plot_bgcolor": "#E5ECF6", "paper_bgcolor": "white", "shapedefaults": { "line": { "color": "#2a3f5f" } }, "autotypenumbers": "strict", "annotationdefaults": { "arrowhead": 0, "arrowcolor": "#2a3f5f", "arrowwidth": 1 } } }, "plot_bgcolor": "white" } }, "height": 700, "width": null, "user": { "profile_url": "https://chart-studio.plotly.com/~tim_stuhec", "avatar_url": "https://storage.googleapis.com/plotly-prod-profiles/77.jpg", "background_url": "https://storage.googleapis.com/plotly-prod-profiles/bg-12.jpg", "bio": "", "nickname": "", "website": "", "stream_tokens": null, "feature_set_id": null, "csrf_token": null, "date_joined": "2025-07-09 07:40:53", "mapbox_access_tokens": null, "has_password": null, "username": "tim_stuhec", "email": null, "is_active": null, "readonly": null, "is_dash_creator": null, "dash_created_count": null, "is_chart_creator": null, "charts_created_count": null } }, { "creation_time": "2025-09-15T15:26:48.490517Z", "comments": { "results": [], "count": 0 }, "parented": true, "embed_url": "https://chart-studio.plotly.com/~mark2001500/1.embed", "fid": "mark2001500:1", "filename": "Plot 1", "filetype": "plot", "img_url": "https://storage.googleapis.com/plotly-prod-images/mark2001500/1/9_NKANPKOSROAKR6WWE55RHM39NSO23T.png", "image_urls": { "default": "https://storage.googleapis.com/plotly-prod-images/mark2001500/1/2_GUP6517ZKI7DAIQUFJWV84J3L8SEU2.png", "block-thumb": "https://storage.googleapis.com/plotly-prod-images/mark2001500/1/8_KGJZQ3F29372401X58RYC140RXEL7N.png", "list-thumb": "https://storage.googleapis.com/plotly-prod-images/mark2001500/1/9_NKANPKOSROAKR6WWE55RHM39NSO23T.png" }, "api_urls": { "files": "https://api.plotly.com/v2/files/mark2001500:1", "plots": "https://api.plotly.com/v2/plots/mark2001500:1", "parent": "https://api.plotly.com/v2/folders/home?user=mark2001500" }, "owner": "mark2001500", "parent": -1, "preview": "", "referencers": [], "references": [], "title": "", "views": 1, "web_url": "https://chart-studio.plotly.com/~mark2001500/1/", "world_readable": true, "date_modified": "2025-09-15T15:26:48.505Z", "stars": { "results": [], "count": 0 }, "collaborators": { "results": [], "count": 0 }, "subfolder_count": null, "refresh_interval": null, "organize_view_url": "https://chart-studio.plotly.com/~mark2001500/1/", "current_user_permission": "read", "is_theme": null, "is_template": false, "autosize": true, "caption": "", "figure": { "data": [ { "meta": { "columnNames": { "x": "Fidelity (Low → High)", "y": "Resolution (Low → High)", "z": "Scale (Micro → Macro)" } }, "mode": "markers", "type": "scatter3d", "xsrc": "mark2001500:0:9346cc", "ysrc": "mark2001500:0:ed3ab0", "zsrc": "mark2001500:0:6b9e27", "marker": { "line": { "width": 0.5 }, "meta": { "columnNames": { "color": "color" } }, "size": 4, "colorsrc": "mark2001500:0:819fcd" } } ], "frames": [], "layout": { "scene": { "xaxis": { "type": "linear", "range": [ -1, 6 ], "title": { "text": "Fidelity (Low → High)" }, "autorange": true, "rangemode": "normal" }, "yaxis": { "type": "linear", "range": [ -1, 4 ], "title": { "text": "Resolution (Low → High)" }, "autorange": true, "rangemode": "normal" }, "zaxis": { "type": "linear", "range": [ -1, 6 ], "title": { "text": "Scale (Micro → Macro)" }, "autorange": true, "rangemode": "normal" }, "camera": { "up": { "x": 0, "y": 0, "z": 1 }, "eye": { "x": 1.1110043642222884, "y": 1.6415847399523273, "z": 0.40263436058999075 }, "center": { "x": 0.05916222142854159, "y": -0.16522365337771436, "z": -0.13758360120303287 }, "projection": { "type": "perspective" } }, "aspectmode": "auto", "aspectratio": { "x": 0.7302539161255788, "y": 1.0548112121813913, "z": 1.2982291842232512 } }, "title": { "text": "Styled Scatter" }, "xaxis": { "zeroline": false }, "yaxis": { "zeroline": true }, "autosize": true } }, "height": null, "width": null, "user": { "profile_url": "https://chart-studio.plotly.com/~mark2001500", "avatar_url": "https://storage.googleapis.com/plotly-prod-profiles/88.jpg", "background_url": "https://storage.googleapis.com/plotly-prod-profiles/bg-8.jpg", "bio": "", "nickname": "", "website": "", "stream_tokens": null, "feature_set_id": null, "csrf_token": null, "date_joined": "2025-09-15 13:17:34", "mapbox_access_tokens": null, "has_password": null, "username": "mark2001500", "email": null, "is_active": null, "readonly": null, "is_dash_creator": null, "dash_created_count": null, "is_chart_creator": null, "charts_created_count": null } }, { "creation_time": "2025-09-15T14:47:53.433434Z", "comments": { "results": [], "count": 0 }, "parented": true, "embed_url": "https://chart-studio.plotly.com/~flusempreflu/3.embed", "fid": "flusempreflu:3", "filename": "Maths IA", "filetype": "plot", "img_url": "https://storage.googleapis.com/plotly-prod-images/flusempreflu/3/9_INMYI44DAPBC7BE0BI8OIC68ZAY6FB.png", "image_urls": { "default": "https://storage.googleapis.com/plotly-prod-images/flusempreflu/3/2_7ZPK4MXDCBPIU90U4VJZE5LSREIPZ9.png", "block-thumb": "https://storage.googleapis.com/plotly-prod-images/flusempreflu/3/8_CZEPI1IIUYXJ8XG04G5VTX5G86LKD8.png", "list-thumb": "https://storage.googleapis.com/plotly-prod-images/flusempreflu/3/9_INMYI44DAPBC7BE0BI8OIC68ZAY6FB.png" }, "api_urls": { "files": "https://api.plotly.com/v2/files/flusempreflu:3", "plots": "https://api.plotly.com/v2/plots/flusempreflu:3", "parent": "https://api.plotly.com/v2/folders/home?user=flusempreflu" }, "owner": "flusempreflu", "parent": -1, "preview": "", "referencers": [], "references": [], "title": "", "views": 1, "web_url": "https://chart-studio.plotly.com/~flusempreflu/3/", "world_readable": true, "date_modified": "2025-09-15T14:47:53.445Z", "stars": { "results": [], "count": 0 }, "collaborators": { "results": [], "count": 0 }, "subfolder_count": null, "refresh_interval": null, "organize_view_url": "https://chart-studio.plotly.com/~flusempreflu/3/", "current_user_permission": "read", "is_theme": null, "is_template": false, "autosize": true, "caption": "", "figure": { "data": [ { "meta": { "columnNames": { "x": "x", "y": "y" } }, "mode": "lines", "type": "scatter", "xsrc": "flusempreflu:2:4de1b2", "ysrc": "flusempreflu:2:bd7c6a" } ], "frames": [], "layout": { "xaxis": { "type": "linear", "range": [ 0.2199124723934257, 0.7602352446070878 ], "autorange": true }, "yaxis": { "type": "linear", "range": [ 11.56776809848993, 15.105921767981629 ], "autorange": true }, "autosize": true } }, "height": null, "width": null, "user": { "profile_url": "https://chart-studio.plotly.com/~flusempreflu", "avatar_url": "https://storage.googleapis.com/plotly-prod-profiles/80.jpg", "background_url": "https://storage.googleapis.com/plotly-prod-profiles/bg-12.jpg", "bio": "", "nickname": "", "website": "", "stream_tokens": null, "feature_set_id": null, "csrf_token": null, "date_joined": "2025-09-15 14:40:38", "mapbox_access_tokens": null, "has_password": null, "username": "flusempreflu", "email": null, "is_active": null, "readonly": null, "is_dash_creator": null, "dash_created_count": null, "is_chart_creator": null, "charts_created_count": null } }, { "creation_time": "2025-09-15T14:42:30.800330Z", "comments": { "results": [], "count": 0 }, "parented": true, "embed_url": "https://chart-studio.plotly.com/~flusempreflu/1.embed", "fid": "flusempreflu:1", "filename": "Plot 1", "filetype": "plot", "img_url": "https://storage.googleapis.com/plotly-prod-images/flusempreflu/1/9_4D0LTY3R9CWH14NCFGSSUTPCQI60CW.png", "image_urls": { "default": "https://storage.googleapis.com/plotly-prod-images/flusempreflu/1/2_XUEA62PU8XIR0JFM7783RDFSHJMHZL.png", "block-thumb": "https://storage.googleapis.com/plotly-prod-images/flusempreflu/1/8_MCRCV7C1AQVREGXDYNQ1YPK24NLNFA.png", "list-thumb": "https://storage.googleapis.com/plotly-prod-images/flusempreflu/1/9_4D0LTY3R9CWH14NCFGSSUTPCQI60CW.png" }, "api_urls": { "files": "https://api.plotly.com/v2/files/flusempreflu:1", "plots": "https://api.plotly.com/v2/plots/flusempreflu:1", "parent": "https://api.plotly.com/v2/folders/home?user=flusempreflu" }, "owner": "flusempreflu", "parent": -1, "preview": "", "referencers": [], "references": [], "title": "", "views": 1, "web_url": "https://chart-studio.plotly.com/~flusempreflu/1/", "world_readable": true, "date_modified": "2025-09-15T14:42:30.815Z", "stars": { "results": [], "count": 0 }, "collaborators": { "results": [], "count": 0 }, "subfolder_count": null, "refresh_interval": null, "organize_view_url": "https://chart-studio.plotly.com/~flusempreflu/1/", "current_user_permission": "read", "is_theme": null, "is_template": false, "autosize": true, "caption": "", "figure": { "data": [ { "meta": { "columnNames": { "x": "x", "y": "y" } }, "mode": "lines", "type": "scatter", "xsrc": "flusempreflu:0:f080c8", "ysrc": "flusempreflu:0:c48f46" } ], "frames": [], "layout": { "xaxis": { "type": "linear", "range": [ 0.2199124723934257, 0.7602352446070878 ], "autorange": true }, "yaxis": { "type": "linear", "range": [ 11.56776809848993, 15.105921767981629 ], "autorange": true }, "autosize": true } }, "height": null, "width": null, "user": { "profile_url": "https://chart-studio.plotly.com/~flusempreflu", "avatar_url": "https://storage.googleapis.com/plotly-prod-profiles/80.jpg", "background_url": "https://storage.googleapis.com/plotly-prod-profiles/bg-12.jpg", "bio": "", "nickname": "", "website": "", "stream_tokens": null, "feature_set_id": null, "csrf_token": null, "date_joined": "2025-09-15 14:40:38", "mapbox_access_tokens": null, "has_password": null, "username": "flusempreflu", "email": null, "is_active": null, "readonly": null, "is_dash_creator": null, "dash_created_count": null, "is_chart_creator": null, "charts_created_count": null } }, { "creation_time": "2025-09-15T13:43:33.899066Z", "comments": { "results": [], "count": 0 }, "parented": true, "embed_url": "https://chart-studio.plotly.com/~elena_thebigg/3.embed", "fid": "elena_thebigg:3", "filename": "Konzentrationsleistung mit Musik in originaler Geschwindigkeit", "filetype": "plot", "img_url": "https://storage.googleapis.com/plotly-prod-images/elena_thebigg/3/9_7QM0G3ZN1ORIXTTF6VMH7H1M1VQ0FP.png", "image_urls": { "default": "https://storage.googleapis.com/plotly-prod-images/elena_thebigg/3/2_82PPMWFO30CE1Z7NFEMH8JLWE7ZE06.png", "block-thumb": "https://storage.googleapis.com/plotly-prod-images/elena_thebigg/3/8_L53PIQLHZN3Y8UPFOT8X6KMFQNUFPW.png", "list-thumb": "https://storage.googleapis.com/plotly-prod-images/elena_thebigg/3/9_7QM0G3ZN1ORIXTTF6VMH7H1M1VQ0FP.png" }, "api_urls": { "files": "https://api.plotly.com/v2/files/elena_thebigg:3", "plots": "https://api.plotly.com/v2/plots/elena_thebigg:3", "parent": "https://api.plotly.com/v2/folders/home?user=elena_thebigg" }, "owner": "elena_thebigg", "parent": -1, "preview": "", "referencers": [], "references": [], "title": "", "views": 0, "web_url": "https://chart-studio.plotly.com/~elena_thebigg/3/", "world_readable": true, "date_modified": "2025-09-15T13:43:33.908Z", "stars": { "results": [], "count": 0 }, "collaborators": { "results": [], "count": 0 }, "subfolder_count": null, "refresh_interval": null, "organize_view_url": "https://chart-studio.plotly.com/~elena_thebigg/3/", "current_user_permission": "read", "is_theme": null, "is_template": false, "autosize": true, "caption": "", "figure": { "data": [ { "meta": { "columnNames": { "y": "2.1" } }, "mode": "markers", "name": "Versuch 2.1", "type": "box", "ysrc": "elena_thebigg:2:3739d0", "marker": { "size": 5 }, "boxpoints": "all" }, { "meta": { "columnNames": { "y": "2.2" } }, "name": "Versuch 2.2", "type": "box", "ysrc": "elena_thebigg:2:84adb1", "marker": { "size": 5 }, "boxpoints": "all" }, { "meta": { "columnNames": { "y": "2.3" } }, "name": "Versuch 2.3", "type": "box", "ysrc": "elena_thebigg:2:547deb", "marker": { "size": 5 }, "boxpoints": "all" }, { "meta": { "columnNames": { "y": "2.4" } }, "name": "Versuch 2.4", "type": "box", "ysrc": "elena_thebigg:2:fcc0b4", "marker": { "size": 5 }, "boxpoints": "all" } ], "frames": [], "layout": { "title": { "text": "Konzentrationsleistung mit Musik in original Geschwindigkeit" }, "xaxis": { "type": "category", "range": [ -0.5174367916303401, 3.5 ], "title": { "text": "Versuch" }, "autorange": true }, "yaxis": { "type": "linear", "range": [ 150, 350 ], "autorange": false }, "autosize": true, "template": { "data": { "bar": [ { "type": "bar", "marker": { "colorbar": { "ticks": "", "outlinewidth": 0 } } } ], "table": [ { "type": "table", "cells": { "fill": { "color": "#EBF0F8" }, "line": { "color": "white" } }, "header": { "fill": { "color": "#C8D4E3" }, "line": { "color": "white" } } } ], "carpet": [ { "type": "carpet", "aaxis": { "gridcolor": "#C8D4E3", "linecolor": "#C8D4E3", "endlinecolor": "#2a3f5f", "minorgridcolor": "#C8D4E3", "startlinecolor": "#2a3f5f" }, "baxis": { "gridcolor": "#C8D4E3", "linecolor": "#C8D4E3", "endlinecolor": "#2a3f5f", "minorgridcolor": "#C8D4E3", "startlinecolor": "#2a3f5f" } } ], "mesh3d": [ { "type": "mesh3d", "colorbar": { "ticks": "", "outlinewidth": 0 } } ], "contour": [ { "type": "contour", "colorbar": { "ticks": "", "outlinewidth": 0 }, "autocolorscale": true } ], "heatmap": [ { "type": "heatmap", "colorbar": { "ticks": "", "outlinewidth": 0 }, "autocolorscale": true } ], "scatter": [ { "type": "scatter", "marker": { "colorbar": { "ticks": "", "outlinewidth": 0 } } } ], "surface": [ { "type": "surface", "colorbar": { "ticks": "", "outlinewidth": 0 } } ], "heatmapgl": [ { "type": "heatmapgl", "colorbar": { "ticks": "", "outlinewidth": 0 } } ], "histogram": [ { "type": "histogram", "marker": { "colorbar": { "ticks": "", "outlinewidth": 0 } } } ], "parcoords": [ { "line": { "colorbar": { "ticks": "", "outlinewidth": 0 } }, "type": "parcoords" } ], "scatter3d": [ { "type": "scatter3d", "marker": { "colorbar": { "ticks": "", "outlinewidth": 0 } } } ], "scattergl": [ { "type": "scattergl", "marker": { "colorbar": { "ticks": "", "outlinewidth": 0 } } } ], "choropleth": [ { "type": "choropleth", "colorbar": { "ticks": "", "outlinewidth": 0 } } ], "scattergeo": [ { "type": "scattergeo", "marker": { "colorbar": { "ticks": "", "outlinewidth": 0 } } } ], "histogram2d": [ { "type": "histogram2d", "colorbar": { "ticks": "", "outlinewidth": 0 }, "autocolorscale": true } ], "scatterpolar": [ { "type": "scatterpolar", "marker": { "colorbar": { "ticks": "", "outlinewidth": 0 } } } ], "contourcarpet": [ { "type": "contourcarpet", "colorbar": { "ticks": "", "outlinewidth": 0 } } ], "scattercarpet": [ { "type": "scattercarpet", "marker": { "colorbar": { "ticks": "", "outlinewidth": 0 } } } ], "scattermapbox": [ { "type": "scattermapbox", "marker": { "colorbar": { "ticks": "", "outlinewidth": 0 } } } ], "scatterpolargl": [ { "type": "scatterpolargl", "marker": { "colorbar": { "ticks": "", "outlinewidth": 0 } } } ], "scatterternary": [ { "type": "scatterternary", "marker": { "colorbar": { "ticks": "", "outlinewidth": 0 } } } ], "histogram2dcontour": [ { "type": "histogram2dcontour", "colorbar": { "ticks": "", "outlinewidth": 0 }, "autocolorscale": true } ] }, "layout": { "geo": { "bgcolor": "white", "showland": true, "lakecolor": "white", "landcolor": "white", "showlakes": true, "subunitcolor": "#C8D4E3" }, "font": { "color": "#2a3f5f" }, "polar": { "bgcolor": "white", "radialaxis": { "ticks": "", "gridcolor": "#EBF0F8", "linecolor": "#EBF0F8" }, "angularaxis": { "ticks": "", "gridcolor": "#EBF0F8", "linecolor": "#EBF0F8" } }, "scene": { "xaxis": { "ticks": "", "gridcolor": "#DFE8F3", "gridwidth": 2, "linecolor": "#EBF0F8", "zerolinecolor": "#EBF0F8", "showbackground": true, "backgroundcolor": "white" }, "yaxis": { "ticks": "", "gridcolor": "#DFE8F3", "gridwidth": 2, "linecolor": "#EBF0F8", "zerolinecolor": "#EBF0F8", "showbackground": true, "backgroundcolor": "white" }, "zaxis": { "ticks": "", "gridcolor": "#DFE8F3", "gridwidth": 2, "linecolor": "#EBF0F8", "zerolinecolor": "#EBF0F8", "showbackground": true, "backgroundcolor": "white" } }, "title": { "x": 0.05 }, "xaxis": { "ticks": "", "gridcolor": "#EBF0F8", "linecolor": "#EBF0F8", "automargin": true, "zerolinecolor": "#EBF0F8", "zerolinewidth": 2 }, "yaxis": { "ticks": "", "gridcolor": "#EBF0F8", "linecolor": "#EBF0F8", "automargin": true, "zerolinecolor": "#EBF0F8", "zerolinewidth": 2 }, "ternary": { "aaxis": { "ticks": "", "gridcolor": "#DFE8F3", "linecolor": "#A2B1C6" }, "baxis": { "ticks": "", "gridcolor": "#DFE8F3", "linecolor": "#A2B1C6" }, "caxis": { "ticks": "", "gridcolor": "#DFE8F3", "linecolor": "#A2B1C6" }, "bgcolor": "white" }, "colorway": [ "#636efa", "#EF553B", "#00cc96", "#ab63fa", "#19d3f3", "#e763fa", "#fecb52", "#ffa15a", "#ff6692", "#b6e880" ], "hovermode": "closest", "colorscale": { "diverging": [ [ 0, "#8e0152" ], [ 0.1, "#c51b7d" ], [ 0.2, "#de77ae" ], [ 0.3, "#f1b6da" ], [ 0.4, "#fde0ef" ], [ 0.5, "#f7f7f7" ], [ 0.6, "#e6f5d0" ], [ 0.7, "#b8e186" ], [ 0.8, "#7fbc41" ], [ 0.9, "#4d9221" ], [ 1, "#276419" ] ], "sequential": [ [ 0, "#0508b8" ], [ 0.0893854748603352, "#1910d8" ], [ 0.1787709497206704, "#3c19f0" ], [ 0.2681564245810056, "#6b1cfb" ], [ 0.3575418994413408, "#981cfd" ], [ 0.44692737430167595, "#bf1cfd" ], [ 0.5363128491620112, "#dd2bfd" ], [ 0.6256983240223464, "#f246fe" ], [ 0.7150837988826816, "#fc67fd" ], [ 0.8044692737430168, "#fe88fc" ], [ 0.8938547486033519, "#fea5fd" ], [ 0.9832402234636871, "#febefe" ], [ 1, "#fec3fe" ] ], "sequentialminus": [ [ 0, "#0508b8" ], [ 0.0893854748603352, "#1910d8" ], [ 0.1787709497206704, "#3c19f0" ], [ 0.2681564245810056, "#6b1cfb" ], [ 0.3575418994413408, "#981cfd" ], [ 0.44692737430167595, "#bf1cfd" ], [ 0.5363128491620112, "#dd2bfd" ], [ 0.6256983240223464, "#f246fe" ], [ 0.7150837988826816, "#fc67fd" ], [ 0.8044692737430168, "#fe88fc" ], [ 0.8938547486033519, "#fea5fd" ], [ 0.9832402234636871, "#febefe" ], [ 1, "#fec3fe" ] ] }, "plot_bgcolor": "white", "paper_bgcolor": "white", "shapedefaults": { "line": { "width": 0 }, "opacity": 0.4, "fillcolor": "#506784" }, "annotationdefaults": { "arrowhead": 0, "arrowcolor": "#506784", "arrowwidth": 1 } }, "themeRef": "PLOTLY_WHITE" } } }, "height": null, "width": null, "user": { "profile_url": "https://chart-studio.plotly.com/~elena_thebigg", "avatar_url": "https://storage.googleapis.com/plotly-prod-profiles/3.jpg", "background_url": "https://storage.googleapis.com/plotly-prod-profiles/bg-4.jpg", "bio": "", "nickname": "", "website": "", "stream_tokens": null, "feature_set_id": null, "csrf_token": null, "date_joined": "2025-09-15 13:20:05", "mapbox_access_tokens": null, "has_password": null, "username": "elena_thebigg", "email": null, "is_active": null, "readonly": null, "is_dash_creator": null, "dash_created_count": null, "is_chart_creator": null, "charts_created_count": null } }, { "creation_time": "2025-09-15T13:34:32.968335Z", "comments": { "results": [], "count": 0 }, "parented": true, "embed_url": "https://chart-studio.plotly.com/~simon.berger/6.embed", "fid": "simon.berger:6", "filename": "Plot 6", "filetype": "plot", "img_url": "https://storage.googleapis.com/plotly-prod-images/simon.berger/6/9_2MDNKL3HFQHL7995BXBP7ERX3161KN.png", "image_urls": { "default": "https://storage.googleapis.com/plotly-prod-images/simon.berger/6/2_Y6XKMXPSS9CA810XK6Q5C8AR0UHCTG.png", "block-thumb": "https://storage.googleapis.com/plotly-prod-images/simon.berger/6/8_D75UCQWJ4MFB75LLPQBOHTQZ36TFIS.png", "list-thumb": "https://storage.googleapis.com/plotly-prod-images/simon.berger/6/9_2MDNKL3HFQHL7995BXBP7ERX3161KN.png" }, "api_urls": { "files": "https://api.plotly.com/v2/files/simon.berger:6", "plots": "https://api.plotly.com/v2/plots/simon.berger:6", "parent": "https://api.plotly.com/v2/folders/home?user=simon.berger" }, "owner": "simon.berger", "parent": -1, "preview": "", "referencers": [], "references": [], "title": "", "views": 1, "web_url": "https://chart-studio.plotly.com/~simon.berger/6/", "world_readable": true, "date_modified": "2025-09-15T13:34:32.979Z", "stars": { "results": [], "count": 0 }, "collaborators": { "results": [], "count": 0 }, "subfolder_count": null, "refresh_interval": null, "organize_view_url": "https://chart-studio.plotly.com/~simon.berger/6/", "current_user_permission": "read", "is_theme": null, "is_template": false, "autosize": true, "caption": "", "figure": { "data": [ { "meta": { "columnNames": { "x": "A", "y": "C", "marker": { "size": "B", "color": "B" } } }, "mode": "markers", "type": "scatter", "xsrc": "simon.berger:5:ae0835", "ysrc": "simon.berger:5:5ef238", "marker": { "meta": { "columnNames": { "size": "B", "color": "B" } }, "size": 15, "symbol": "diamond", "opacity": 1, "sizeref": 0.006464197530864198, "colorsrc": "simon.berger:5:fa255d", "sizemode": "area", "colorscale": [ [ 0, "#67001f" ], [ 0.1, "#b2182b" ], [ 0.2, "#d6604d" ], [ 0.3, "#f4a582" ], [ 0.4, "#fddbc7" ], [ 0.5, "#ffffff" ], [ 0.6, "#e0e0e0" ], [ 0.7, "#bababa" ], [ 0.8, "#878787" ], [ 0.9, "#4d4d4d" ], [ 1, "#1a1a1a" ] ], "reversescale": true }, "autocolorscale": false } ], "frames": [], "layout": { "font": { "size": 20 }, "xaxis": { "type": "linear", "range": [ 0, 2500 ], "title": { "font": { "size": 20 }, "text": "Energie [kJ]" }, "mirror": false, "nticks": 17, "showgrid": true, "showline": true, "autorange": false, "gridcolor": "rgb(192, 196, 196)", "gridwidth": 1, "linecolor": "rgb(13, 13, 13)", "linewidth": 1, "zerolinecolor": "rgb(15, 15, 15)", "zerolinewidth": 1 }, "yaxis": { "type": "linear", "range": [ -55, 55 ], "title": { "font": { "size": 20 }, "text": "Impaktwinkel [°]" }, "mirror": false, "nticks": 17, "showgrid": true, "showline": true, "autorange": false, "gridcolor": "rgb(192, 196, 196)", "gridwidth": 1, "linecolor": "rgb(13, 13, 13)", "linewidth": 1, "zerolinecolor": "rgb(15, 15, 15)", "zerolinewidth": 1 }, "autosize": true, "template": { "data": { "bar": [ { "type": "bar", "marker": { "colorbar": { "ticks": "", "outlinewidth": 0 } } } ], "table": [ { "type": "table", "cells": { "fill": { "color": "#EBF0F8" }, "line": { "color": "white" } }, "header": { "fill": { "color": "#C8D4E3" }, "line": { "color": "white" } } } ], "carpet": [ { "type": "carpet", "aaxis": { "gridcolor": "#C8D4E3", "linecolor": "#C8D4E3", "endlinecolor": "#2a3f5f", "minorgridcolor": "#C8D4E3", "startlinecolor": "#2a3f5f" }, "baxis": { "gridcolor": "#C8D4E3", "linecolor": "#C8D4E3", "endlinecolor": "#2a3f5f", "minorgridcolor": "#C8D4E3", "startlinecolor": "#2a3f5f" } } ], "mesh3d": [ { "type": "mesh3d", "colorbar": { "ticks": "", "outlinewidth": 0 } } ], "contour": [ { "type": "contour", "colorbar": { "ticks": "", "outlinewidth": 0 }, "autocolorscale": true } ], "heatmap": [ { "type": "heatmap", "colorbar": { "ticks": "", "outlinewidth": 0 }, "autocolorscale": true } ], "scatter": [ { "type": "scatter", "marker": { "colorbar": { "ticks": "", "outlinewidth": 0 } } } ], "surface": [ { "type": "surface", "colorbar": { "ticks": "", "outlinewidth": 0 } } ], "heatmapgl": [ { "type": "heatmapgl", "colorbar": { "ticks": "", "outlinewidth": 0 } } ], "histogram": [ { "type": "histogram", "marker": { "colorbar": { "ticks": "", "outlinewidth": 0 } } } ], "parcoords": [ { "line": { "colorbar": { "ticks": "", "outlinewidth": 0 } }, "type": "parcoords" } ], "scatter3d": [ { "type": "scatter3d", "marker": { "colorbar": { "ticks": "", "outlinewidth": 0 } } } ], "scattergl": [ { "type": "scattergl", "marker": { "colorbar": { "ticks": "", "outlinewidth": 0 } } } ], "choropleth": [ { "type": "choropleth", "colorbar": { "ticks": "", "outlinewidth": 0 } } ], "scattergeo": [ { "type": "scattergeo", "marker": { "colorbar": { "ticks": "", "outlinewidth": 0 } } } ], "histogram2d": [ { "type": "histogram2d", "colorbar": { "ticks": "", "outlinewidth": 0 }, "autocolorscale": true } ], "scatterpolar": [ { "type": "scatterpolar", "marker": { "colorbar": { "ticks": "", "outlinewidth": 0 } } } ], "contourcarpet": [ { "type": "contourcarpet", "colorbar": { "ticks": "", "outlinewidth": 0 } } ], "scattercarpet": [ { "type": "scattercarpet", "marker": { "colorbar": { "ticks": "", "outlinewidth": 0 } } } ], "scattermapbox": [ { "type": "scattermapbox", "marker": { "colorbar": { "ticks": "", "outlinewidth": 0 } } } ], "scatterpolargl": [ { "type": "scatterpolargl", "marker": { "colorbar": { "ticks": "", "outlinewidth": 0 } } } ], "scatterternary": [ { "type": "scatterternary", "marker": { "colorbar": { "ticks": "", "outlinewidth": 0 } } } ], "histogram2dcontour": [ { "type": "histogram2dcontour", "colorbar": { "ticks": "", "outlinewidth": 0 }, "autocolorscale": true } ] }, "layout": { "geo": { "bgcolor": "white", "showland": true, "lakecolor": "white", "landcolor": "white", "showlakes": true, "subunitcolor": "#C8D4E3" }, "font": { "color": "#2a3f5f" }, "polar": { "bgcolor": "white", "radialaxis": { "ticks": "", "gridcolor": "#EBF0F8", "linecolor": "#EBF0F8" }, "angularaxis": { "ticks": "", "gridcolor": "#EBF0F8", "linecolor": "#EBF0F8" } }, "scene": { "xaxis": { "ticks": "", "gridcolor": "#DFE8F3", "gridwidth": 2, "linecolor": "#EBF0F8", "zerolinecolor": "#EBF0F8", "showbackground": true, "backgroundcolor": "white" }, "yaxis": { "ticks": "", "gridcolor": "#DFE8F3", "gridwidth": 2, "linecolor": "#EBF0F8", "zerolinecolor": "#EBF0F8", "showbackground": true, "backgroundcolor": "white" }, "zaxis": { "ticks": "", "gridcolor": "#DFE8F3", "gridwidth": 2, "linecolor": "#EBF0F8", "zerolinecolor": "#EBF0F8", "showbackground": true, "backgroundcolor": "white" } }, "title": { "x": 0.05 }, "xaxis": { "ticks": "", "gridcolor": "#EBF0F8", "linecolor": "#EBF0F8", "automargin": true, "zerolinecolor": "#EBF0F8", "zerolinewidth": 2 }, "yaxis": { "ticks": "", "gridcolor": "#EBF0F8", "linecolor": "#EBF0F8", "automargin": true, "zerolinecolor": "#EBF0F8", "zerolinewidth": 2 }, "ternary": { "aaxis": { "ticks": "", "gridcolor": "#DFE8F3", "linecolor": "#A2B1C6" }, "baxis": { "ticks": "", "gridcolor": "#DFE8F3", "linecolor": "#A2B1C6" }, "caxis": { "ticks": "", "gridcolor": "#DFE8F3", "linecolor": "#A2B1C6" }, "bgcolor": "white" }, "colorway": [ "#636efa", "#EF553B", "#00cc96", "#ab63fa", "#19d3f3", "#e763fa", "#fecb52", "#ffa15a", "#ff6692", "#b6e880" ], "hovermode": "closest", "colorscale": { "diverging": [ [ 0, "#8e0152" ], [ 0.1, "#c51b7d" ], [ 0.2, "#de77ae" ], [ 0.3, "#f1b6da" ], [ 0.4, "#fde0ef" ], [ 0.5, "#f7f7f7" ], [ 0.6, "#e6f5d0" ], [ 0.7, "#b8e186" ], [ 0.8, "#7fbc41" ], [ 0.9, "#4d9221" ], [ 1, "#276419" ] ], "sequential": [ [ 0, "#0508b8" ], [ 0.0893854748603352, "#1910d8" ], [ 0.1787709497206704, "#3c19f0" ], [ 0.2681564245810056, "#6b1cfb" ], [ 0.3575418994413408, "#981cfd" ], [ 0.44692737430167595, "#bf1cfd" ], [ 0.5363128491620112, "#dd2bfd" ], [ 0.6256983240223464, "#f246fe" ], [ 0.7150837988826816, "#fc67fd" ], [ 0.8044692737430168, "#fe88fc" ], [ 0.8938547486033519, "#fea5fd" ], [ 0.9832402234636871, "#febefe" ], [ 1, "#fec3fe" ] ], "sequentialminus": [ [ 0, "#0508b8" ], [ 0.0893854748603352, "#1910d8" ], [ 0.1787709497206704, "#3c19f0" ], [ 0.2681564245810056, "#6b1cfb" ], [ 0.3575418994413408, "#981cfd" ], [ 0.44692737430167595, "#bf1cfd" ], [ 0.5363128491620112, "#dd2bfd" ], [ 0.6256983240223464, "#f246fe" ], [ 0.7150837988826816, "#fc67fd" ], [ 0.8044692737430168, "#fe88fc" ], [ 0.8938547486033519, "#fea5fd" ], [ 0.9832402234636871, "#febefe" ], [ 1, "#fec3fe" ] ] }, "plot_bgcolor": "white", "paper_bgcolor": "white", "shapedefaults": { "line": { "width": 0 }, "opacity": 0.4, "fillcolor": "#506784" }, "annotationdefaults": { "arrowhead": 0, "arrowcolor": "#506784", "arrowwidth": 1 } }, "themeRef": "PLOTLY_WHITE" } } }, "height": null, "width": null, "user": { "profile_url": "https://chart-studio.plotly.com/~simon.berger", "avatar_url": "https://storage.googleapis.com/plotly-prod-profiles/54.jpg", "background_url": "https://storage.googleapis.com/plotly-prod-profiles/bg-7.jpg", "bio": "", "nickname": "", "website": "", "stream_tokens": null, "feature_set_id": null, "csrf_token": null, "date_joined": "2021-03-02 15:39:41", "mapbox_access_tokens": null, "has_password": null, "username": "simon.berger", "email": null, "is_active": null, "readonly": null, "is_dash_creator": null, "dash_created_count": null, "is_chart_creator": null, "charts_created_count": null } }, { "creation_time": "2025-09-15T13:32:33.056320Z", "comments": { "results": [], "count": 0 }, "parented": true, "embed_url": "https://chart-studio.plotly.com/~abhishek.karn025/101.embed", "fid": "abhishek.karn025:101", "filename": "us-patents-–-flow-export-test-57943013-20250915_190228", "filetype": "plot", "img_url": "https://api.plotly.com/v2/files/abhishek.karn025:101/image?image_name=list-thumb", "image_urls": { "default": "https://storage.googleapis.com/plotly-prod-images/abhishek.karn025/101/2_KQ747IG6F8YJ5OCU43J74L23UN1LYM.png", "block-thumb": "https://storage.googleapis.com/plotly-prod-images/abhishek.karn025/101/8_ZL8MHK8E6US9CBA040JU0KRVVM2HVS.png", "list-thumb": "https://api.plotly.com/v2/files/abhishek.karn025:101/image?image_name=list-thumb" }, "api_urls": { "files": "https://api.plotly.com/v2/files/abhishek.karn025:101", "plots": "https://api.plotly.com/v2/plots/abhishek.karn025:101", "parent": "https://api.plotly.com/v2/folders/home?user=abhishek.karn025" }, "owner": "abhishek.karn025", "parent": -1, "preview": "", "referencers": [], "references": [], "title": "", "views": 1, "web_url": "https://chart-studio.plotly.com/~abhishek.karn025/101/", "world_readable": true, "date_modified": "2025-09-15T13:32:33.066Z", "stars": { "results": [], "count": 0 }, "collaborators": { "results": [], "count": 0 }, "subfolder_count": null, "refresh_interval": null, "organize_view_url": "https://chart-studio.plotly.com/~abhishek.karn025/101/", "current_user_permission": "read", "is_theme": null, "is_template": null, "autosize": true, "caption": "", "figure": { "data": [ { "y": { "bdata": "CAYEAwMCAgICAgICAQEBAQEBAQEBAQEBAQEBAQEBAQEBAQEBAQEBAQEBAQEBAQEBAQEBAQEBAQEBAQEBAQEBAQEBAQEBAQEB", "dtype": "i1" }, "name": "", "type": "bar", "xsrc": "abhishek.karn025:100:5bdade", "xaxis": "x", "yaxis": "y", "marker": { "color": "#636efa", "pattern": { "shape": "" } }, "showlegend": false, "legendgroup": "", "offsetgroup": "", "orientation": "v", "textposition": "auto", "hovertemplate": "assignee_organization=%{x}<br>patent_id=%{y}<extra></extra>", "alignmentgroup": "True" }, { "name": "", "type": "histogram", "xsrc": "abhishek.karn025:100:8072a0", "xaxis": "x2", "yaxis": "y2", "marker": { "color": "#636efa", "pattern": { "shape": "" } }, "nbinsx": 20, "bingroup": "x", "histfunc": "count", "showlegend": false, "legendgroup": "", "offsetgroup": "", "orientation": "v", "hovertemplate": "patent_term_extension=%{x}<br>count=%{y}<extra></extra>", "alignmentgroup": "True" }, { "hole": 0, "name": "", "type": "pie", "domain": { "x": [ 0.0, 0.5018181818181818 ], "y": [ 0.0, 0.4 ] }, "values": { "bdata": "ZA==", "dtype": "i1" }, "labelssrc": "abhishek.karn025:100:b23e79", "showlegend": true, "legendgroup": "", "hovertemplate": "patent_type=%{label}<br>count=%{value}<extra></extra>" } ], "layout": { "title": { "x": 0.5, "font": { "size": 22 }, "text": "US Patents – Flow Export Test", "xanchor": "center" }, "width": 1180, "xaxis": { "anchor": "y", "domain": [ 0.0, 0.5018181818181818 ], "categoryorder": "total descending" }, "yaxis": { "type": "linear", "anchor": "x", "domain": [ 0.6000000000000001, 1.0 ], "autorange": true }, "height": 1240, "legend": { "x": 0.5, "y": -0.1, "xanchor": "center", "yanchor": "top", "orientation": "h" }, "margin": { "b": 110, "l": 70, "r": 40, "t": 96 }, "xaxis2": { "anchor": "y2", "domain": [ 0.5818181818181818, 1.0 ], "categoryorder": "total descending" }, "xaxis3": { "anchor": "y3", "domain": [ 0.5818181818181818, 1.0 ] }, "yaxis2": { "type": "linear", "anchor": "x2", "domain": [ 0.6000000000000001, 1.0 ], "autorange": true }, "yaxis3": { "anchor": "x3", "domain": [ 0.0, 0.4 ] }, "template": { "data": { "bar": [ { "type": "bar", "marker": { "line": { "color": "white", "width": 0.5 }, "pattern": { "size": 10, "fillmode": "overlay", "solidity": 0.2 } }, "error_x": { "color": "#2a3f5f" }, "error_y": { "color": "#2a3f5f" } } ], "pie": [ { "type": "pie", "automargin": true } ], "table": [ { "type": "table", "cells": { "fill": { "color": "#EBF0F8" }, "line": { "color": "white" } }, "header": { "fill": { "color": "#C8D4E3" }, "line": { "color": "white" } } } ], "carpet": [ { "type": "carpet", "aaxis": { "gridcolor": "#C8D4E3", "linecolor": "#C8D4E3", "endlinecolor": "#2a3f5f", "minorgridcolor": "#C8D4E3", "startlinecolor": "#2a3f5f" }, "baxis": { "gridcolor": "#C8D4E3", "linecolor": "#C8D4E3", "endlinecolor": "#2a3f5f", "minorgridcolor": "#C8D4E3", "startlinecolor": "#2a3f5f" } } ], "mesh3d": [ { "type": "mesh3d", "colorbar": { "ticks": "", "outlinewidth": 0 } } ], "contour": [ { "type": "contour", "colorbar": { "ticks": "", "outlinewidth": 0 }, "colorscale": [ [ 0.0, "#0d0887" ], [ 0.1111111111111111, "#46039f" ], [ 0.2222222222222222, "#7201a8" ], [ 0.3333333333333333, "#9c179e" ], [ 0.4444444444444444, "#bd3786" ], [ 0.5555555555555556, "#d8576b" ], [ 0.6666666666666666, "#ed7953" ], [ 0.7777777777777778, "#fb9f3a" ], [ 0.8888888888888888, "#fdca26" ], [ 1.0, "#f0f921" ] ] } ], "heatmap": [ { "type": "heatmap", "colorbar": { "ticks": "", "outlinewidth": 0 }, "colorscale": [ [ 0.0, "#0d0887" ], [ 0.1111111111111111, "#46039f" ], [ 0.2222222222222222, "#7201a8" ], [ 0.3333333333333333, "#9c179e" ], [ 0.4444444444444444, "#bd3786" ], [ 0.5555555555555556, "#d8576b" ], [ 0.6666666666666666, "#ed7953" ], [ 0.7777777777777778, "#fb9f3a" ], [ 0.8888888888888888, "#fdca26" ], [ 1.0, "#f0f921" ] ] } ], "scatter": [ { "type": "scatter", "fillpattern": { "size": 10, "fillmode": "overlay", "solidity": 0.2 } } ], "surface": [ { "type": "surface", "colorbar": { "ticks": "", "outlinewidth": 0 }, "colorscale": [ [ 0.0, "#0d0887" ], [ 0.1111111111111111, "#46039f" ], [ 0.2222222222222222, "#7201a8" ], [ 0.3333333333333333, "#9c179e" ], [ 0.4444444444444444, "#bd3786" ], [ 0.5555555555555556, "#d8576b" ], [ 0.6666666666666666, "#ed7953" ], [ 0.7777777777777778, "#fb9f3a" ], [ 0.8888888888888888, "#fdca26" ], [ 1.0, "#f0f921" ] ] } ], "barpolar": [ { "type": "barpolar", "marker": { "line": { "color": "white", "width": 0.5 }, "pattern": { "size": 10, "fillmode": "overlay", "solidity": 0.2 } } } ], "histogram": [ { "type": "histogram", "marker": { "pattern": { "size": 10, "fillmode": "overlay", "solidity": 0.2 } } } ], "parcoords": [ { "line": { "colorbar": { "ticks": "", "outlinewidth": 0 } }, "type": "parcoords" } ], "scatter3d": [ { "line": { "colorbar": { "ticks": "", "outlinewidth": 0 } }, "type": "scatter3d", "marker": { "colorbar": { "ticks": "", "outlinewidth": 0 } } } ], "scattergl": [ { "type": "scattergl", "marker": { "colorbar": { "ticks": "", "outlinewidth": 0 } } } ], "choropleth": [ { "type": "choropleth", "colorbar": { "ticks": "", "outlinewidth": 0 } } ], "scattergeo": [ { "type": "scattergeo", "marker": { "colorbar": { "ticks": "", "outlinewidth": 0 } } } ], "scattermap": [ { "type": "scattermap", "marker": { "colorbar": { "ticks": "", "outlinewidth": 0 } } } ], "histogram2d": [ { "type": "histogram2d", "colorbar": { "ticks": "", "outlinewidth": 0 }, "colorscale": [ [ 0.0, "#0d0887" ], [ 0.1111111111111111, "#46039f" ], [ 0.2222222222222222, "#7201a8" ], [ 0.3333333333333333, "#9c179e" ], [ 0.4444444444444444, "#bd3786" ], [ 0.5555555555555556, "#d8576b" ], [ 0.6666666666666666, "#ed7953" ], [ 0.7777777777777778, "#fb9f3a" ], [ 0.8888888888888888, "#fdca26" ], [ 1.0, "#f0f921" ] ] } ], "scatterpolar": [ { "type": "scatterpolar", "marker": { "colorbar": { "ticks": "", "outlinewidth": 0 } } } ], "contourcarpet": [ { "type": "contourcarpet", "colorbar": { "ticks": "", "outlinewidth": 0 } } ], "scattercarpet": [ { "type": "scattercarpet", "marker": { "colorbar": { "ticks": "", "outlinewidth": 0 } } } ], "scattermapbox": [ { "type": "scattermapbox", "marker": { "colorbar": { "ticks": "", "outlinewidth": 0 } } } ], "scatterpolargl": [ { "type": "scatterpolargl", "marker": { "colorbar": { "ticks": "", "outlinewidth": 0 } } } ], "scatterternary": [ { "type": "scatterternary", "marker": { "colorbar": { "ticks": "", "outlinewidth": 0 } } } ], "histogram2dcontour": [ { "type": "histogram2dcontour", "colorbar": { "ticks": "", "outlinewidth": 0 }, "colorscale": [ [ 0.0, "#0d0887" ], [ 0.1111111111111111, "#46039f" ], [ 0.2222222222222222, "#7201a8" ], [ 0.3333333333333333, "#9c179e" ], [ 0.4444444444444444, "#bd3786" ], [ 0.5555555555555556, "#d8576b" ], [ 0.6666666666666666, "#ed7953" ], [ 0.7777777777777778, "#fb9f3a" ], [ 0.8888888888888888, "#fdca26" ], [ 1.0, "#f0f921" ] ] } ] }, "layout": { "geo": { "bgcolor": "white", "showland": true, "lakecolor": "white", "landcolor": "white", "showlakes": true, "subunitcolor": "#C8D4E3" }, "font": { "color": "#2a3f5f" }, "polar": { "bgcolor": "white", "radialaxis": { "ticks": "", "gridcolor": "#EBF0F8", "linecolor": "#EBF0F8" }, "angularaxis": { "ticks": "", "gridcolor": "#EBF0F8", "linecolor": "#EBF0F8" } }, "scene": { "xaxis": { "ticks": "", "gridcolor": "#DFE8F3", "gridwidth": 2, "linecolor": "#EBF0F8", "zerolinecolor": "#EBF0F8", "showbackground": true, "backgroundcolor": "white" }, "yaxis": { "ticks": "", "gridcolor": "#DFE8F3", "gridwidth": 2, "linecolor": "#EBF0F8", "zerolinecolor": "#EBF0F8", "showbackground": true, "backgroundcolor": "white" }, "zaxis": { "ticks": "", "gridcolor": "#DFE8F3", "gridwidth": 2, "linecolor": "#EBF0F8", "zerolinecolor": "#EBF0F8", "showbackground": true, "backgroundcolor": "white" } }, "title": { "x": 0.05 }, "xaxis": { "ticks": "", "title": { "standoff": 15 }, "gridcolor": "#EBF0F8", "linecolor": "#EBF0F8", "automargin": true, "zerolinecolor": "#EBF0F8", "zerolinewidth": 2 }, "yaxis": { "ticks": "", "title": { "standoff": 15 }, "gridcolor": "#EBF0F8", "linecolor": "#EBF0F8", "automargin": true, "zerolinecolor": "#EBF0F8", "zerolinewidth": 2 }, "mapbox": { "style": "light" }, "ternary": { "aaxis": { "ticks": "", "gridcolor": "#DFE8F3", "linecolor": "#A2B1C6" }, "baxis": { "ticks": "", "gridcolor": "#DFE8F3", "linecolor": "#A2B1C6" }, "caxis": { "ticks": "", "gridcolor": "#DFE8F3", "linecolor": "#A2B1C6" }, "bgcolor": "white" }, "colorway": [ "#636efa", "#EF553B", "#00cc96", "#ab63fa", "#FFA15A", "#19d3f3", "#FF6692", "#B6E880", "#FF97FF", "#FECB52" ], "coloraxis": { "colorbar": { "ticks": "", "outlinewidth": 0 } }, "hovermode": "closest", "colorscale": { "diverging": [ [ 0, "#8e0152" ], [ 0.1, "#c51b7d" ], [ 0.2, "#de77ae" ], [ 0.3, "#f1b6da" ], [ 0.4, "#fde0ef" ], [ 0.5, "#f7f7f7" ], [ 0.6, "#e6f5d0" ], [ 0.7, "#b8e186" ], [ 0.8, "#7fbc41" ], [ 0.9, "#4d9221" ], [ 1, "#276419" ] ], "sequential": [ [ 0.0, "#0d0887" ], [ 0.1111111111111111, "#46039f" ], [ 0.2222222222222222, "#7201a8" ], [ 0.3333333333333333, "#9c179e" ], [ 0.4444444444444444, "#bd3786" ], [ 0.5555555555555556, "#d8576b" ], [ 0.6666666666666666, "#ed7953" ], [ 0.7777777777777778, "#fb9f3a" ], [ 0.8888888888888888, "#fdca26" ], [ 1.0, "#f0f921" ] ], "sequentialminus": [ [ 0.0, "#0d0887" ], [ 0.1111111111111111, "#46039f" ], [ 0.2222222222222222, "#7201a8" ], [ 0.3333333333333333, "#9c179e" ], [ 0.4444444444444444, "#bd3786" ], [ 0.5555555555555556, "#d8576b" ], [ 0.6666666666666666, "#ed7953" ], [ 0.7777777777777778, "#fb9f3a" ], [ 0.8888888888888888, "#fdca26" ], [ 1.0, "#f0f921" ] ] }, "hoverlabel": { "align": "left" }, "plot_bgcolor": "white", "paper_bgcolor": "white", "shapedefaults": { "line": { "color": "#2a3f5f" } }, "autotypenumbers": "strict", "annotationdefaults": { "arrowhead": 0, "arrowcolor": "#2a3f5f", "arrowwidth": 1 } } }, "showlegend": true, "annotations": [ { "x": 0.2509090909090909, "y": 1.0, "font": { "size": 15 }, "text": "Number of Patents by Assignee Organization", "xref": "paper", "yref": "paper", "yshift": 12, "xanchor": "center", "yanchor": "bottom", "showarrow": false }, { "x": 0.7909090909090909, "y": 1.0, "font": { "size": 15 }, "text": "Distribution of Patent Term Extensions", "xref": "paper", "yref": "paper", "yshift": 12, "xanchor": "center", "yanchor": "bottom", "showarrow": false }, { "x": 0.2509090909090909, "y": 0.4, "font": { "size": 15 }, "text": "Distribution of Patent Types", "xref": "paper", "yref": "paper", "yshift": 12, "xanchor": "center", "yanchor": "bottom", "showarrow": false } ] } }, "height": 1240, "width": 1180, "user": { "profile_url": "https://chart-studio.plotly.com/~abhishek.karn025", "avatar_url": "https://storage.googleapis.com/plotly-prod-profiles/8.jpg", "background_url": "https://storage.googleapis.com/plotly-prod-profiles/bg-4.jpg", "bio": "", "nickname": "", "website": "", "stream_tokens": null, "feature_set_id": null, "csrf_token": null, "date_joined": "2025-08-19 08:26:37", "mapbox_access_tokens": null, "has_password": null, "username": "abhishek.karn025", "email": null, "is_active": null, "readonly": null, "is_dash_creator": null, "dash_created_count": null, "is_chart_creator": null, "charts_created_count": null } }, { "creation_time": "2025-09-15T13:22:13.878570Z", "comments": { "results": [], "count": 0 }, "parented": true, "embed_url": "https://chart-studio.plotly.com/~elena_thebigg/1.embed", "fid": "elena_thebigg:1", "filename": "Konzentrationsleistung ohne Musik", "filetype": "plot", "img_url": "https://storage.googleapis.com/plotly-prod-images/elena_thebigg/1/9_EF05TRG2LWRBX86C4W9E1NAIRBX1KZ.png", "image_urls": { "default": "https://storage.googleapis.com/plotly-prod-images/elena_thebigg/1/2_OMGLG94ARJNMPKYTMFSK56S8W60D8J.png", "block-thumb": "https://storage.googleapis.com/plotly-prod-images/elena_thebigg/1/8_YEN8RCU2ZW6HSSAEZPC0C218FA1689.png", "list-thumb": "https://storage.googleapis.com/plotly-prod-images/elena_thebigg/1/9_EF05TRG2LWRBX86C4W9E1NAIRBX1KZ.png" }, "api_urls": { "files": "https://api.plotly.com/v2/files/elena_thebigg:1", "plots": "https://api.plotly.com/v2/plots/elena_thebigg:1", "parent": "https://api.plotly.com/v2/folders/home?user=elena_thebigg" }, "owner": "elena_thebigg", "parent": -1, "preview": "", "referencers": [], "references": [], "title": "", "views": 1, "web_url": "https://chart-studio.plotly.com/~elena_thebigg/1/", "world_readable": true, "date_modified": "2025-09-16T06:21:25.266Z", "stars": { "results": [], "count": 0 }, "collaborators": { "results": [], "count": 0 }, "subfolder_count": null, "refresh_interval": null, "organize_view_url": "https://chart-studio.plotly.com/~elena_thebigg/1/", "current_user_permission": "read", "is_theme": null, "is_template": true, "autosize": true, "caption": "", "figure": { "data": [ { "meta": { "columnNames": { "x": "", "y": "1.1", "low": "", "high": "1.1", "open": "", "close": "" } }, "mode": "lines", "name": "Versuch 1.1", "type": "box", "ysrc": "elena_thebigg:0:e43cb3", "width": 0, "marker": { "line": { "width": 0 }, "size": 4, "color": "#636efa", "symbol": "circle-open" }, "boxmean": false, "highsrc": "elena_thebigg:0:e43cb3", "boxpoints": "all", "transforms": [ { "meta": { "columnNames": { "groups": "1.1" } }, "type": "aggregate", "enabled": true, "groupssrc": "elena_thebigg:0:e43cb3", "aggregations": [ { "func": "median", "target": "y", "enabled": true } ] } ], "orientation": "v", "hovertemplate": "", "selectedpoints": [ 0, 5, 2, 4, 3, 1 ] }, { "meta": { "columnNames": { "y": "1.2" } }, "name": "Versuch 1.2", "type": "box", "ysrc": "elena_thebigg:0:c13929", "width": 0, "marker": { "line": { "width": 0 }, "size": 4, "color": "#EF553B", "symbol": "circle" }, "boxmean": false, "boxpoints": "all", "hovertemplate": "", "selectedpoints": [ 1, 0, 4, 3, 2 ] }, { "meta": { "columnNames": { "y": "1.3" } }, "name": "Versuch 1.3", "type": "box", "ysrc": "elena_thebigg:0:918f10", "width": 0, "marker": { "line": { "width": 0 }, "size": 4, "color": "#00cc96", "symbol": "hexagon2-open" }, "boxmean": false, "visible": true, "boxpoints": "all", "hovertemplate": "", "selectedpoints": [ 2, 3, 5, 1, 0, 4 ] }, { "meta": { "columnNames": { "x": "", "y": "1.4" } }, "name": "Versuch 1.4", "type": "box", "ysrc": "elena_thebigg:0:6fec04", "width": 0, "marker": { "line": { "width": 0 }, "size": 4, "color": "#ab63fa", "symbol": "octagon" }, "boxmean": false, "visible": true, "boxpoints": "all", "orientation": "v", "hovertemplate": "", "selectedpoints": [ 1, 0, 3, 4, 2 ] } ], "frames": [], "layout": { "title": { "font": { "family": "Arial" }, "text": "Konzentrationsleistung ohne Musik" }, "xaxis": { "type": "category", "range": [ -2.5845710329068377, 5.757970089277594 ], "title": { "text": "Versuch" }, "anchor": "y", "autorange": false, "showspikes": false, "rangeslider": { "range": [ -2.5845710329068377, 5.757970089277594 ], "yaxis": {}, "visible": false, "autorange": true } }, "yaxis": { "type": "linear", "range": [ 150, 350 ], "title": { "text": "Konzentrationsleistung [Punkte]" }, "domain": [ 0, 1 ], "autorange": false, "showspikes": false }, "legend": { "x": 1.02, "y": 1 }, "boxmode": "overlay", "autosize": true, "colorway": [ "#636efa", "#EF553B", "#00cc96", "#ab63fa", "#19d3f3", "#e763fa", "#fecb52", "#ffa15a", "#ff6692", "#b6e880" ], "dragmode": "select", "template": { "data": { "bar": [ { "type": "bar", "marker": { "colorbar": { "ticks": "", "outlinewidth": 0 } } } ], "table": [ { "type": "table", "cells": { "fill": { "color": "#EBF0F8" }, "line": { "color": "white" } }, "header": { "fill": { "color": "#C8D4E3" }, "line": { "color": "white" } } } ], "carpet": [ { "type": "carpet", "aaxis": { "gridcolor": "#C8D4E3", "linecolor": "#C8D4E3", "endlinecolor": "#2a3f5f", "minorgridcolor": "#C8D4E3", "startlinecolor": "#2a3f5f" }, "baxis": { "gridcolor": "#C8D4E3", "linecolor": "#C8D4E3", "endlinecolor": "#2a3f5f", "minorgridcolor": "#C8D4E3", "startlinecolor": "#2a3f5f" } } ], "mesh3d": [ { "type": "mesh3d", "colorbar": { "ticks": "", "outlinewidth": 0 } } ], "contour": [ { "type": "contour", "colorbar": { "ticks": "", "outlinewidth": 0 }, "autocolorscale": true } ], "heatmap": [ { "type": "heatmap", "colorbar": { "ticks": "", "outlinewidth": 0 }, "autocolorscale": true } ], "scatter": [ { "type": "scatter", "marker": { "colorbar": { "ticks": "", "outlinewidth": 0 } } } ], "surface": [ { "type": "surface", "colorbar": { "ticks": "", "outlinewidth": 0 } } ], "heatmapgl": [ { "type": "heatmapgl", "colorbar": { "ticks": "", "outlinewidth": 0 } } ], "histogram": [ { "type": "histogram", "marker": { "colorbar": { "ticks": "", "outlinewidth": 0 } } } ], "parcoords": [ { "line": { "colorbar": { "ticks": "", "outlinewidth": 0 } }, "type": "parcoords" } ], "scatter3d": [ { "type": "scatter3d", "marker": { "colorbar": { "ticks": "", "outlinewidth": 0 } } } ], "scattergl": [ { "type": "scattergl", "marker": { "colorbar": { "ticks": "", "outlinewidth": 0 } } } ], "choropleth": [ { "type": "choropleth", "colorbar": { "ticks": "", "outlinewidth": 0 } } ], "scattergeo": [ { "type": "scattergeo", "marker": { "colorbar": { "ticks": "", "outlinewidth": 0 } } } ], "histogram2d": [ { "type": "histogram2d", "colorbar": { "ticks": "", "outlinewidth": 0 }, "autocolorscale": true } ], "scatterpolar": [ { "type": "scatterpolar", "marker": { "colorbar": { "ticks": "", "outlinewidth": 0 } } } ], "contourcarpet": [ { "type": "contourcarpet", "colorbar": { "ticks": "", "outlinewidth": 0 } } ], "scattercarpet": [ { "type": "scattercarpet", "marker": { "colorbar": { "ticks": "", "outlinewidth": 0 } } } ], "scattermapbox": [ { "type": "scattermapbox", "marker": { "colorbar": { "ticks": "", "outlinewidth": 0 } } } ], "scatterpolargl": [ { "type": "scatterpolargl", "marker": { "colorbar": { "ticks": "", "outlinewidth": 0 } } } ], "scatterternary": [ { "type": "scatterternary", "marker": { "colorbar": { "ticks": "", "outlinewidth": 0 } } } ], "histogram2dcontour": [ { "type": "histogram2dcontour", "colorbar": { "ticks": "", "outlinewidth": 0 }, "autocolorscale": true } ] }, "layout": { "geo": { "bgcolor": "white", "showland": true, "lakecolor": "white", "landcolor": "white", "showlakes": true, "subunitcolor": "#C8D4E3" }, "font": { "color": "#2a3f5f" }, "polar": { "bgcolor": "white", "radialaxis": { "ticks": "", "gridcolor": "#EBF0F8", "linecolor": "#EBF0F8" }, "angularaxis": { "ticks": "", "gridcolor": "#EBF0F8", "linecolor": "#EBF0F8" } }, "scene": { "xaxis": { "ticks": "", "gridcolor": "#DFE8F3", "gridwidth": 2, "linecolor": "#EBF0F8", "zerolinecolor": "#EBF0F8", "showbackground": true, "backgroundcolor": "white" }, "yaxis": { "ticks": "", "gridcolor": "#DFE8F3", "gridwidth": 2, "linecolor": "#EBF0F8", "zerolinecolor": "#EBF0F8", "showbackground": true, "backgroundcolor": "white" }, "zaxis": { "ticks": "", "gridcolor": "#DFE8F3", "gridwidth": 2, "linecolor": "#EBF0F8", "zerolinecolor": "#EBF0F8", "showbackground": true, "backgroundcolor": "white" } }, "title": { "x": 0.05 }, "xaxis": { "ticks": "", "gridcolor": "#EBF0F8", "linecolor": "#EBF0F8", "automargin": true, "zerolinecolor": "#EBF0F8", "zerolinewidth": 2 }, "yaxis": { "ticks": "", "gridcolor": "#EBF0F8", "linecolor": "#EBF0F8", "automargin": true, "zerolinecolor": "#EBF0F8", "zerolinewidth": 2 }, "ternary": { "aaxis": { "ticks": "", "gridcolor": "#DFE8F3", "linecolor": "#A2B1C6" }, "baxis": { "ticks": "", "gridcolor": "#DFE8F3", "linecolor": "#A2B1C6" }, "caxis": { "ticks": "", "gridcolor": "#DFE8F3", "linecolor": "#A2B1C6" }, "bgcolor": "white" }, "colorway": [ "#636efa", "#EF553B", "#00cc96", "#ab63fa", "#19d3f3", "#e763fa", "#fecb52", "#ffa15a", "#ff6692", "#b6e880" ], "hovermode": "closest", "colorscale": { "diverging": [ [ 0, "#8e0152" ], [ 0.1, "#c51b7d" ], [ 0.2, "#de77ae" ], [ 0.3, "#f1b6da" ], [ 0.4, "#fde0ef" ], [ 0.5, "#f7f7f7" ], [ 0.6, "#e6f5d0" ], [ 0.7, "#b8e186" ], [ 0.8, "#7fbc41" ], [ 0.9, "#4d9221" ], [ 1, "#276419" ] ], "sequential": [ [ 0, "#0508b8" ], [ 0.0893854748603352, "#1910d8" ], [ 0.1787709497206704, "#3c19f0" ], [ 0.2681564245810056, "#6b1cfb" ], [ 0.3575418994413408, "#981cfd" ], [ 0.44692737430167595, "#bf1cfd" ], [ 0.5363128491620112, "#dd2bfd" ], [ 0.6256983240223464, "#f246fe" ], [ 0.7150837988826816, "#fc67fd" ], [ 0.8044692737430168, "#fe88fc" ], [ 0.8938547486033519, "#fea5fd" ], [ 0.9832402234636871, "#febefe" ], [ 1, "#fec3fe" ] ], "sequentialminus": [ [ 0, "#0508b8" ], [ 0.0893854748603352, "#1910d8" ], [ 0.1787709497206704, "#3c19f0" ], [ 0.2681564245810056, "#6b1cfb" ], [ 0.3575418994413408, "#981cfd" ], [ 0.44692737430167595, "#bf1cfd" ], [ 0.5363128491620112, "#dd2bfd" ], [ 0.6256983240223464, "#f246fe" ], [ 0.7150837988826816, "#fc67fd" ], [ 0.8044692737430168, "#fe88fc" ], [ 0.8938547486033519, "#fea5fd" ], [ 0.9832402234636871, "#febefe" ], [ 1, "#fec3fe" ] ] }, "plot_bgcolor": "white", "paper_bgcolor": "white", "shapedefaults": { "line": { "width": 0 }, "opacity": 0.4, "fillcolor": "#506784" }, "annotationdefaults": { "arrowhead": 0, "arrowcolor": "#506784", "arrowwidth": 1 } }, "themeRef": "PLOTLY_WHITE" }, "hovermode": "closest", "colorscale": { "sequential": [ [ 0, "#f7fcf5" ], [ 0.125, "#e5f5e0" ], [ 0.25, "#c7e9c0" ], [ 0.375, "#a1d99b" ], [ 0.5, "#74c476" ], [ 0.625, "#41ab5d" ], [ 0.75, "#238b45" ], [ 0.875, "#006d2c" ], [ 1, "#00441b" ] ] }, "annotations": [] } }, "height": null, "width": null, "user": { "profile_url": "https://chart-studio.plotly.com/~elena_thebigg", "avatar_url": "https://storage.googleapis.com/plotly-prod-profiles/3.jpg", "background_url": "https://storage.googleapis.com/plotly-prod-profiles/bg-4.jpg", "bio": "", "nickname": "", "website": "", "stream_tokens": null, "feature_set_id": null, "csrf_token": null, "date_joined": "2025-09-15 13:20:05", "mapbox_access_tokens": null, "has_password": null, "username": "elena_thebigg", "email": null, "is_active": null, "readonly": null, "is_dash_creator": null, "dash_created_count": null, "is_chart_creator": null, "charts_created_count": null } } ] }
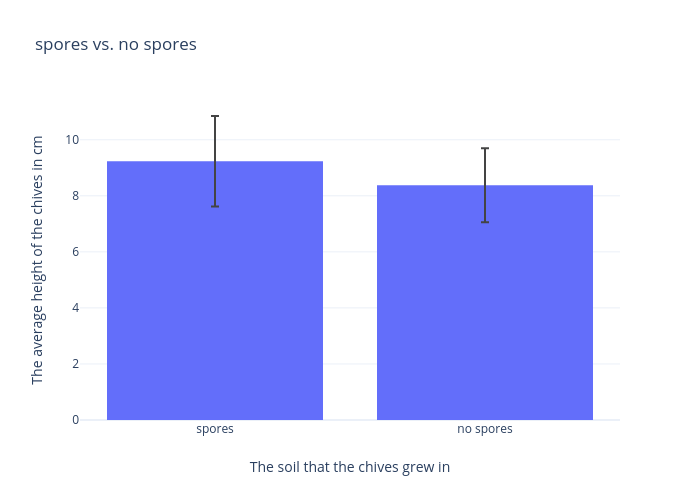
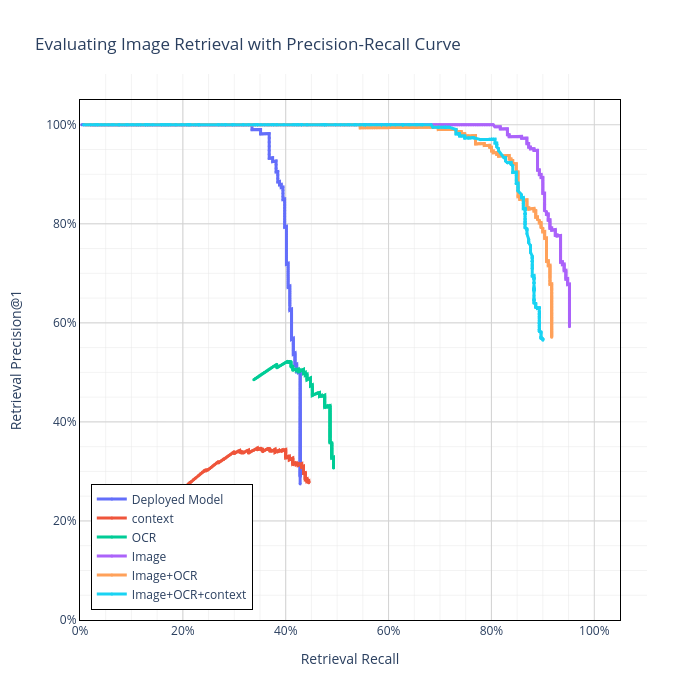