Plots List
Plots
This endpoint handles manipulation of Plotly plot files.
Reference
Authorization
Any user with or without a Plotly account may view public plots. For private plots, see authentication.
Actions
list
Listing all public plots can be done via a GET request to this endpoint.
By default, plots will be listed in order of date created. The order_by
query parameter is accepted at this endpoint. Currently, only ordering by
views is supported. It is possible to filter the plots by quality
with min_quality or max_quality as query parameter.
Example:
// GET https://api.plotly.com/v2/plots/ ---> 200

// GET https://api.plotly.com/v2/plots/?order_by=-views ---> 200

// GET https://api.plotly.com/v2/plots/?min_quality=5 ---> 200

// GET https://api.plotly.com/v2/plots/?max_quality=5 ---> 200
feed
Listing all handpicked feed plots can be done via a GET request to this endpoint. By default, plots will be listed in a random order.
Example:
// GET https://api.plotly.com/v2/plots/feed ---> 200
create
You can create new plot resources here. The only required field is 'figure'. Currently, the figure is restricted to only contain references to grid data. That is, this will fail if raw data arrays are passed in. To create and manipulate underlying grids for plots, see the grids endpoint.
Example:
// This fails because a figure field is required.
// POST https://api.plotly.com/v2/plots ---> 400 Bad Request
{}

// This fails because the figure has raw data
//POST https://api.plotly.com/v2/plots ---> 400 Bad Request
{
    "figure": {"data": [{"y": ['this', 'is', 'raw', 'data']}]}
}

// This succeeds because the figure has src keys, not raw data.
//POST https://api.plotly.com/v2/plots ---> 200 OK
{
    "figure": {"data": [{"ysrc": "sven:88:u8nd62"}]}
}
When creating a grid, you can optionally specify a source_fid to specify where a plot has come from:
- source_fid: the fid of a plot that was copied (and presumably edited) to produce this one
detail
There is a lot of meta information stored about plot files including filename, title, share_url, and content_url to name a few.
This information can only be reached with a GET to this endpoint.
Example:
// GET https://api.plotly.com/v2/plots/iheartgraphs:90
content
The contents of a plot can be downloaded via the content resource. The plot
content contains referenced grid/column data by default. If you wish to
return the raw grid/column data, the inline_data=true query must be included
in the request url. The Content-Type header will be appropriately set for the
response body.
Alternatively, you can set ?map_data=unreadable to append a mapping of
sources to data that belongs to grids which are unreadable for the
requestor. This is useful when you have read access to another users plot,
but that plot contains grid references which you don't have access to.
Examples:
// Returns referenced grid/column data
// GET https://api.plotly.com/v2/plots/iheartgraphs:90/content ---> 200 OK

// Returns full grid/column data
// GET https://api.plotly.com/v2/plots/iheartgraphs:90/content?inline_data=true ---> 200 OK

// Returns full grid/column data when requestor doesn't have permission
// to read the referenced grid.
// GET https://api.plotly.com/v2/plots/iheartgraphs:90/content?map_data=unreadable ---> 200 OK
GET /v2/plots?cursor=cD0yMDI1LTA5LTE2KzA2JTNBMjQlM0EwNS4yMzYwOTQlMkIwMCUzQTAw&format=api
{ "next": "https://api.plotly.com/v2/plots?cursor=cD0yMDI1LTA5LTE2KzA0JTNBMzglM0EzMS44MzE0NjMlMkIwMCUzQTAw&format=api", "previous": "https://api.plotly.com/v2/plots?cursor=cj0xJnA9MjAyNS0wOS0xNiswNiUzQTE4JTNBMzEuMTg3NDEwJTJCMDAlM0EwMA%3D%3D&format=api", "results": [ { "creation_time": "2025-09-16T06:18:31.187410Z", "comments": { "results": [], "count": 0 }, "parented": true, "embed_url": "https://chart-studio.plotly.com/~elena_thebigg/5.embed", "fid": "elena_thebigg:5", "filename": "Konzentrationsleistung mit Musik in 0.5-facher Geschwindigkeit (73.5 BPM)", "filetype": "plot", "img_url": "https://storage.googleapis.com/plotly-prod-images/elena_thebigg/5/9_T3KRPJUA52ULDHMOAWO4JHKZM3W2SY.png", "image_urls": { "default": "https://storage.googleapis.com/plotly-prod-images/elena_thebigg/5/2_F272CDBGXAIPP0GXZ1WR4HMSMIKLVA.png", "block-thumb": "https://storage.googleapis.com/plotly-prod-images/elena_thebigg/5/8_OT68QFJIAH02CI9SQ839OAVWGZHPP1.png", "list-thumb": "https://storage.googleapis.com/plotly-prod-images/elena_thebigg/5/9_T3KRPJUA52ULDHMOAWO4JHKZM3W2SY.png" }, "api_urls": { "files": "https://api.plotly.com/v2/files/elena_thebigg:5", "plots": "https://api.plotly.com/v2/plots/elena_thebigg:5", "parent": "https://api.plotly.com/v2/folders/home?user=elena_thebigg" }, "owner": "elena_thebigg", "parent": -1, "preview": "", "referencers": [], "references": [], "title": "", "views": 0, "web_url": "https://chart-studio.plotly.com/~elena_thebigg/5/", "world_readable": true, "date_modified": "2025-09-16T06:20:17.495Z", "stars": { "results": [], "count": 0 }, "collaborators": { "results": [], "count": 0 }, "subfolder_count": null, "refresh_interval": null, "organize_view_url": "https://chart-studio.plotly.com/~elena_thebigg/5/", "current_user_permission": "read", "is_theme": null, "is_template": false, "autosize": true, "caption": "", "figure": { "data": [ { "meta": { "columnNames": { "y": "3.1" } }, "mode": "lines", "name": "Versuch 3.1", "type": "box", "ysrc": "elena_thebigg:4:b32994", "marker": { "size": 5 }, "boxpoints": "all" }, { "meta": { "columnNames": { "y": "3.2" } }, "name": "Versuch 3.2", "type": "box", "ysrc": "elena_thebigg:4:8fa7b3", "marker": { "size": 5 }, "boxpoints": "all" }, { "meta": { "columnNames": { "y": "3.3" } }, "name": "Versuch 3.3", "type": "box", "ysrc": "elena_thebigg:4:8be10f", "marker": { "size": 5 }, "boxpoints": "all" }, { "meta": { "columnNames": { "y": "3.4" } }, "name": "Versuch 3. 4", "type": "box", "ysrc": "elena_thebigg:4:17951d", "marker": { "size": 5 }, "boxpoints": "all" } ], "frames": [], "layout": { "title": { "text": "Konzentrationsleistung mit Musik in 0.5-facher Geschwindigkeit (73.5 BPM)" }, "xaxis": { "type": "category", "range": [ -0.5175284837861525, 3.5 ], "title": { "text": "Versuch" }, "autorange": true }, "yaxis": { "type": "linear", "range": [ 150, 350 ], "title": { "text": "Konzentrationsleistung [Punkte]" }, "autorange": false }, "autosize": true, "template": { "data": { "bar": [ { "type": "bar", "marker": { "colorbar": { "ticks": "", "outlinewidth": 0 } } } ], "table": [ { "type": "table", "cells": { "fill": { "color": "#EBF0F8" }, "line": { "color": "white" } }, "header": { "fill": { "color": "#C8D4E3" }, "line": { "color": "white" } } } ], "carpet": [ { "type": "carpet", "aaxis": { "gridcolor": "#C8D4E3", "linecolor": "#C8D4E3", "endlinecolor": "#2a3f5f", "minorgridcolor": "#C8D4E3", "startlinecolor": "#2a3f5f" }, "baxis": { "gridcolor": "#C8D4E3", "linecolor": "#C8D4E3", "endlinecolor": "#2a3f5f", "minorgridcolor": "#C8D4E3", "startlinecolor": "#2a3f5f" } } ], "mesh3d": [ { "type": "mesh3d", "colorbar": { "ticks": "", "outlinewidth": 0 } } ], "contour": [ { "type": "contour", "colorbar": { "ticks": "", "outlinewidth": 0 }, "autocolorscale": true } ], "heatmap": [ { "type": "heatmap", "colorbar": { "ticks": "", "outlinewidth": 0 }, "autocolorscale": true } ], "scatter": [ { "type": "scatter", "marker": { "colorbar": { "ticks": "", "outlinewidth": 0 } } } ], "surface": [ { "type": "surface", "colorbar": { "ticks": "", "outlinewidth": 0 } } ], "heatmapgl": [ { "type": "heatmapgl", "colorbar": { "ticks": "", "outlinewidth": 0 } } ], "histogram": [ { "type": "histogram", "marker": { "colorbar": { "ticks": "", "outlinewidth": 0 } } } ], "parcoords": [ { "line": { "colorbar": { "ticks": "", "outlinewidth": 0 } }, "type": "parcoords" } ], "scatter3d": [ { "type": "scatter3d", "marker": { "colorbar": { "ticks": "", "outlinewidth": 0 } } } ], "scattergl": [ { "type": "scattergl", "marker": { "colorbar": { "ticks": "", "outlinewidth": 0 } } } ], "choropleth": [ { "type": "choropleth", "colorbar": { "ticks": "", "outlinewidth": 0 } } ], "scattergeo": [ { "type": "scattergeo", "marker": { "colorbar": { "ticks": "", "outlinewidth": 0 } } } ], "histogram2d": [ { "type": "histogram2d", "colorbar": { "ticks": "", "outlinewidth": 0 }, "autocolorscale": true } ], "scatterpolar": [ { "type": "scatterpolar", "marker": { "colorbar": { "ticks": "", "outlinewidth": 0 } } } ], "contourcarpet": [ { "type": "contourcarpet", "colorbar": { "ticks": "", "outlinewidth": 0 } } ], "scattercarpet": [ { "type": "scattercarpet", "marker": { "colorbar": { "ticks": "", "outlinewidth": 0 } } } ], "scattermapbox": [ { "type": "scattermapbox", "marker": { "colorbar": { "ticks": "", "outlinewidth": 0 } } } ], "scatterpolargl": [ { "type": "scatterpolargl", "marker": { "colorbar": { "ticks": "", "outlinewidth": 0 } } } ], "scatterternary": [ { "type": "scatterternary", "marker": { "colorbar": { "ticks": "", "outlinewidth": 0 } } } ], "histogram2dcontour": [ { "type": "histogram2dcontour", "colorbar": { "ticks": "", "outlinewidth": 0 }, "autocolorscale": true } ] }, "layout": { "geo": { "bgcolor": "white", "showland": true, "lakecolor": "white", "landcolor": "white", "showlakes": true, "subunitcolor": "#C8D4E3" }, "font": { "color": "#2a3f5f" }, "polar": { "bgcolor": "white", "radialaxis": { "ticks": "", "gridcolor": "#EBF0F8", "linecolor": "#EBF0F8" }, "angularaxis": { "ticks": "", "gridcolor": "#EBF0F8", "linecolor": "#EBF0F8" } }, "scene": { "xaxis": { "ticks": "", "gridcolor": "#DFE8F3", "gridwidth": 2, "linecolor": "#EBF0F8", "zerolinecolor": "#EBF0F8", "showbackground": true, "backgroundcolor": "white" }, "yaxis": { "ticks": "", "gridcolor": "#DFE8F3", "gridwidth": 2, "linecolor": "#EBF0F8", "zerolinecolor": "#EBF0F8", "showbackground": true, "backgroundcolor": "white" }, "zaxis": { "ticks": "", "gridcolor": "#DFE8F3", "gridwidth": 2, "linecolor": "#EBF0F8", "zerolinecolor": "#EBF0F8", "showbackground": true, "backgroundcolor": "white" } }, "title": { "x": 0.05 }, "xaxis": { "ticks": "", "gridcolor": "#EBF0F8", "linecolor": "#EBF0F8", "automargin": true, "zerolinecolor": "#EBF0F8", "zerolinewidth": 2 }, "yaxis": { "ticks": "", "gridcolor": "#EBF0F8", "linecolor": "#EBF0F8", "automargin": true, "zerolinecolor": "#EBF0F8", "zerolinewidth": 2 }, "ternary": { "aaxis": { "ticks": "", "gridcolor": "#DFE8F3", "linecolor": "#A2B1C6" }, "baxis": { "ticks": "", "gridcolor": "#DFE8F3", "linecolor": "#A2B1C6" }, "caxis": { "ticks": "", "gridcolor": "#DFE8F3", "linecolor": "#A2B1C6" }, "bgcolor": "white" }, "colorway": [ "#636efa", "#EF553B", "#00cc96", "#ab63fa", "#19d3f3", "#e763fa", "#fecb52", "#ffa15a", "#ff6692", "#b6e880" ], "hovermode": "closest", "colorscale": { "diverging": [ [ 0, "#8e0152" ], [ 0.1, "#c51b7d" ], [ 0.2, "#de77ae" ], [ 0.3, "#f1b6da" ], [ 0.4, "#fde0ef" ], [ 0.5, "#f7f7f7" ], [ 0.6, "#e6f5d0" ], [ 0.7, "#b8e186" ], [ 0.8, "#7fbc41" ], [ 0.9, "#4d9221" ], [ 1, "#276419" ] ], "sequential": [ [ 0, "#0508b8" ], [ 0.0893854748603352, "#1910d8" ], [ 0.1787709497206704, "#3c19f0" ], [ 0.2681564245810056, "#6b1cfb" ], [ 0.3575418994413408, "#981cfd" ], [ 0.44692737430167595, "#bf1cfd" ], [ 0.5363128491620112, "#dd2bfd" ], [ 0.6256983240223464, "#f246fe" ], [ 0.7150837988826816, "#fc67fd" ], [ 0.8044692737430168, "#fe88fc" ], [ 0.8938547486033519, "#fea5fd" ], [ 0.9832402234636871, "#febefe" ], [ 1, "#fec3fe" ] ], "sequentialminus": [ [ 0, "#0508b8" ], [ 0.0893854748603352, "#1910d8" ], [ 0.1787709497206704, "#3c19f0" ], [ 0.2681564245810056, "#6b1cfb" ], [ 0.3575418994413408, "#981cfd" ], [ 0.44692737430167595, "#bf1cfd" ], [ 0.5363128491620112, "#dd2bfd" ], [ 0.6256983240223464, "#f246fe" ], [ 0.7150837988826816, "#fc67fd" ], [ 0.8044692737430168, "#fe88fc" ], [ 0.8938547486033519, "#fea5fd" ], [ 0.9832402234636871, "#febefe" ], [ 1, "#fec3fe" ] ] }, "plot_bgcolor": "white", "paper_bgcolor": "white", "shapedefaults": { "line": { "width": 0 }, "opacity": 0.4, "fillcolor": "#506784" }, "annotationdefaults": { "arrowhead": 0, "arrowcolor": "#506784", "arrowwidth": 1 } }, "themeRef": "PLOTLY_WHITE" }, "hoverlabel": { "font": { "size": 13 } } } }, "height": null, "width": null, "user": { "profile_url": "https://chart-studio.plotly.com/~elena_thebigg", "avatar_url": "https://storage.googleapis.com/plotly-prod-profiles/3.jpg", "background_url": "https://storage.googleapis.com/plotly-prod-profiles/bg-4.jpg", "bio": "", "nickname": "", "website": "", "stream_tokens": null, "feature_set_id": null, "csrf_token": null, "date_joined": "2025-09-15 13:20:05", "mapbox_access_tokens": null, "has_password": null, "username": "elena_thebigg", "email": null, "is_active": null, "readonly": null, "is_dash_creator": null, "dash_created_count": null, "is_chart_creator": null, "charts_created_count": null } }, { "creation_time": "2025-09-16T06:10:04.316426Z", "comments": { "results": [], "count": 0 }, "parented": true, "embed_url": "https://chart-studio.plotly.com/~mariaaaaaaaa/2.embed", "fid": "mariaaaaaaaa:2", "filename": "Plot 2", "filetype": "plot", "img_url": "https://api.plotly.com/v2/files/mariaaaaaaaa:2/image?image_name=list-thumb", "image_urls": { "default": "https://api.plotly.com/v2/files/mariaaaaaaaa:2/image?image_name=default", "block-thumb": "https://api.plotly.com/v2/files/mariaaaaaaaa:2/image?image_name=block-thumb", "list-thumb": "https://api.plotly.com/v2/files/mariaaaaaaaa:2/image?image_name=list-thumb" }, "api_urls": { "files": "https://api.plotly.com/v2/files/mariaaaaaaaa:2", "plots": "https://api.plotly.com/v2/plots/mariaaaaaaaa:2", "parent": "https://api.plotly.com/v2/folders/home?user=mariaaaaaaaa" }, "owner": "mariaaaaaaaa", "parent": -1, "preview": "", "referencers": [], "references": [], "title": "", "views": 0, "web_url": "https://chart-studio.plotly.com/~mariaaaaaaaa/2/", "world_readable": true, "date_modified": "2025-09-18T05:24:32.697Z", "stars": { "results": [], "count": 0 }, "collaborators": { "results": [], "count": 0 }, "subfolder_count": null, "refresh_interval": null, "organize_view_url": "https://chart-studio.plotly.com/~mariaaaaaaaa/2/", "current_user_permission": "read", "is_theme": null, "is_template": false, "autosize": true, "caption": "", "figure": { "data": [ { "line": { "shape": "spline" }, "meta": { "columnNames": { "x": "A", "y": "B" } }, "mode": "markers+lines", "name": "Equilibrio S-V", "type": "scatter", "xsrc": "mariaaaaaaaa:1:cabdcb", "ysrc": "mariaaaaaaaa:1:767591" }, { "line": { "shape": "spline" }, "meta": { "columnNames": { "x": "C", "y": "D" } }, "mode": "markers+lines", "name": "Equilibrio S-L", "type": "scatter", "xsrc": "mariaaaaaaaa:1:8f010d", "ysrc": "mariaaaaaaaa:1:cd3439", "stackgroup": null }, { "line": { "shape": "spline", "width": 2, "smoothing": 1 }, "meta": { "columnNames": { "x": "E", "y": "F" } }, "mode": "markers+lines", "name": "Equilibrio L-V", "type": "scatter", "xsrc": "mariaaaaaaaa:1:44ed43", "ysrc": "mariaaaaaaaa:1:471d6f", "marker": { "size": 6, "color": "#00cc96", "maxdisplayed": 0 }, "error_x": { "type": "percent", "color": "#00cc96", "value": 10, "width": 4, "visible": false, "symmetric": false, "thickness": 2, "valueminus": 10 }, "cliponaxis": true, "showlegend": true, "stackgroup": null, "connectgaps": false, "legendgroup": "", "hovertemplate": "" }, { "meta": { "columnNames": { "x": "K", "y": "L" } }, "mode": "markers", "name": "Punto triple experimental", "type": "scatter", "xsrc": "mariaaaaaaaa:1:b9497c", "ysrc": "mariaaaaaaaa:1:253718", "marker": { "size": 14 } }, { "meta": { "columnNames": { "x": "M", "y": "N" } }, "mode": "markers", "name": "Punto de ebullición experimental", "type": "scatter", "xsrc": "mariaaaaaaaa:1:dbfc83", "ysrc": "mariaaaaaaaa:1:9320b2", "marker": { "size": 10 }, "stackgroup": null }, { "meta": { "columnNames": { "x": "O", "y": "P" } }, "mode": "markers", "name": "Punto de fusión experimental", "type": "scatter", "xsrc": "mariaaaaaaaa:1:0e6dce", "ysrc": "mariaaaaaaaa:1:f05a6a", "marker": { "size": 10 }, "stackgroup": null } ], "frames": [], "layout": { "title": { "font": { "family": "Droid Serif" }, "text": "Diagrama de fases del ciclohexano" }, "xaxis": { "type": "linear", "range": [ -46.7739170365835, 76.19103015459973 ], "title": { "text": "T (°C)" }, "autorange": true }, "yaxis": { "type": "linear", "range": [ -59.442380870083426, 917.3374808700834 ], "title": { "text": "P (mmHg)" }, "autorange": true }, "autosize": true, "dragmode": "zoom", "template": { "data": { "bar": [ { "type": "bar", "marker": { "colorbar": { "ticks": "", "outlinewidth": 0 } } } ], "table": [ { "type": "table", "cells": { "fill": { "color": "#EBF0F8" }, "line": { "color": "white" } }, "header": { "fill": { "color": "#C8D4E3" }, "line": { "color": "white" } } } ], "carpet": [ { "type": "carpet", "aaxis": { "gridcolor": "#C8D4E3", "linecolor": "#C8D4E3", "endlinecolor": "#2a3f5f", "minorgridcolor": "#C8D4E3", "startlinecolor": "#2a3f5f" }, "baxis": { "gridcolor": "#C8D4E3", "linecolor": "#C8D4E3", "endlinecolor": "#2a3f5f", "minorgridcolor": "#C8D4E3", "startlinecolor": "#2a3f5f" } } ], "mesh3d": [ { "type": "mesh3d", "colorbar": { "ticks": "", "outlinewidth": 0 } } ], "contour": [ { "type": "contour", "colorbar": { "ticks": "", "outlinewidth": 0 }, "autocolorscale": true } ], "heatmap": [ { "type": "heatmap", "colorbar": { "ticks": "", "outlinewidth": 0 }, "autocolorscale": true } ], "scatter": [ { "type": "scatter", "marker": { "colorbar": { "ticks": "", "outlinewidth": 0 } } } ], "surface": [ { "type": "surface", "colorbar": { "ticks": "", "outlinewidth": 0 } } ], "heatmapgl": [ { "type": "heatmapgl", "colorbar": { "ticks": "", "outlinewidth": 0 } } ], "histogram": [ { "type": "histogram", "marker": { "colorbar": { "ticks": "", "outlinewidth": 0 } } } ], "parcoords": [ { "line": { "colorbar": { "ticks": "", "outlinewidth": 0 } }, "type": "parcoords" } ], "scatter3d": [ { "type": "scatter3d", "marker": { "colorbar": { "ticks": "", "outlinewidth": 0 } } } ], "scattergl": [ { "type": "scattergl", "marker": { "colorbar": { "ticks": "", "outlinewidth": 0 } } } ], "choropleth": [ { "type": "choropleth", "colorbar": { "ticks": "", "outlinewidth": 0 } } ], "scattergeo": [ { "type": "scattergeo", "marker": { "colorbar": { "ticks": "", "outlinewidth": 0 } } } ], "histogram2d": [ { "type": "histogram2d", "colorbar": { "ticks": "", "outlinewidth": 0 }, "autocolorscale": true } ], "scatterpolar": [ { "type": "scatterpolar", "marker": { "colorbar": { "ticks": "", "outlinewidth": 0 } } } ], "contourcarpet": [ { "type": "contourcarpet", "colorbar": { "ticks": "", "outlinewidth": 0 } } ], "scattercarpet": [ { "type": "scattercarpet", "marker": { "colorbar": { "ticks": "", "outlinewidth": 0 } } } ], "scattermapbox": [ { "type": "scattermapbox", "marker": { "colorbar": { "ticks": "", "outlinewidth": 0 } } } ], "scatterpolargl": [ { "type": "scatterpolargl", "marker": { "colorbar": { "ticks": "", "outlinewidth": 0 } } } ], "scatterternary": [ { "type": "scatterternary", "marker": { "colorbar": { "ticks": "", "outlinewidth": 0 } } } ], "histogram2dcontour": [ { "type": "histogram2dcontour", "colorbar": { "ticks": "", "outlinewidth": 0 }, "autocolorscale": true } ] }, "layout": { "geo": { "bgcolor": "white", "showland": true, "lakecolor": "white", "landcolor": "white", "showlakes": true, "subunitcolor": "#C8D4E3" }, "font": { "color": "#2a3f5f" }, "polar": { "bgcolor": "white", "radialaxis": { "ticks": "", "gridcolor": "#EBF0F8", "linecolor": "#EBF0F8" }, "angularaxis": { "ticks": "", "gridcolor": "#EBF0F8", "linecolor": "#EBF0F8" } }, "scene": { "xaxis": { "ticks": "", "gridcolor": "#DFE8F3", "gridwidth": 2, "linecolor": "#EBF0F8", "zerolinecolor": "#EBF0F8", "showbackground": true, "backgroundcolor": "white" }, "yaxis": { "ticks": "", "gridcolor": "#DFE8F3", "gridwidth": 2, "linecolor": "#EBF0F8", "zerolinecolor": "#EBF0F8", "showbackground": true, "backgroundcolor": "white" }, "zaxis": { "ticks": "", "gridcolor": "#DFE8F3", "gridwidth": 2, "linecolor": "#EBF0F8", "zerolinecolor": "#EBF0F8", "showbackground": true, "backgroundcolor": "white" } }, "title": { "x": 0.05 }, "xaxis": { "ticks": "", "gridcolor": "#EBF0F8", "linecolor": "#EBF0F8", "automargin": true, "zerolinecolor": "#EBF0F8", "zerolinewidth": 2 }, "yaxis": { "ticks": "", "gridcolor": "#EBF0F8", "linecolor": "#EBF0F8", "automargin": true, "zerolinecolor": "#EBF0F8", "zerolinewidth": 2 }, "ternary": { "aaxis": { "ticks": "", "gridcolor": "#DFE8F3", "linecolor": "#A2B1C6" }, "baxis": { "ticks": "", "gridcolor": "#DFE8F3", "linecolor": "#A2B1C6" }, "caxis": { "ticks": "", "gridcolor": "#DFE8F3", "linecolor": "#A2B1C6" }, "bgcolor": "white" }, "colorway": [ "#636efa", "#EF553B", "#00cc96", "#ab63fa", "#19d3f3", "#e763fa", "#fecb52", "#ffa15a", "#ff6692", "#b6e880" ], "hovermode": "closest", "colorscale": { "diverging": [ [ 0, "#8e0152" ], [ 0.1, "#c51b7d" ], [ 0.2, "#de77ae" ], [ 0.3, "#f1b6da" ], [ 0.4, "#fde0ef" ], [ 0.5, "#f7f7f7" ], [ 0.6, "#e6f5d0" ], [ 0.7, "#b8e186" ], [ 0.8, "#7fbc41" ], [ 0.9, "#4d9221" ], [ 1, "#276419" ] ], "sequential": [ [ 0, "#0508b8" ], [ 0.0893854748603352, "#1910d8" ], [ 0.1787709497206704, "#3c19f0" ], [ 0.2681564245810056, "#6b1cfb" ], [ 0.3575418994413408, "#981cfd" ], [ 0.44692737430167595, "#bf1cfd" ], [ 0.5363128491620112, "#dd2bfd" ], [ 0.6256983240223464, "#f246fe" ], [ 0.7150837988826816, "#fc67fd" ], [ 0.8044692737430168, "#fe88fc" ], [ 0.8938547486033519, "#fea5fd" ], [ 0.9832402234636871, "#febefe" ], [ 1, "#fec3fe" ] ], "sequentialminus": [ [ 0, "#0508b8" ], [ 0.0893854748603352, "#1910d8" ], [ 0.1787709497206704, "#3c19f0" ], [ 0.2681564245810056, "#6b1cfb" ], [ 0.3575418994413408, "#981cfd" ], [ 0.44692737430167595, "#bf1cfd" ], [ 0.5363128491620112, "#dd2bfd" ], [ 0.6256983240223464, "#f246fe" ], [ 0.7150837988826816, "#fc67fd" ], [ 0.8044692737430168, "#fe88fc" ], [ 0.8938547486033519, "#fea5fd" ], [ 0.9832402234636871, "#febefe" ], [ 1, "#fec3fe" ] ] }, "plot_bgcolor": "white", "paper_bgcolor": "white", "shapedefaults": { "line": { "width": 0 }, "opacity": 0.4, "fillcolor": "#506784" }, "annotationdefaults": { "arrowhead": 0, "arrowcolor": "#506784", "arrowwidth": 1 } }, "themeRef": "PLOTLY_WHITE" } } }, "height": null, "width": null, "user": { "profile_url": "https://chart-studio.plotly.com/~mariaaaaaaaa", "avatar_url": "https://storage.googleapis.com/plotly-prod-profiles/55.jpg", "background_url": "https://storage.googleapis.com/plotly-prod-profiles/bg-6.jpg", "bio": "", "nickname": "", "website": "", "stream_tokens": null, "feature_set_id": null, "csrf_token": null, "date_joined": "2025-09-16 05:31:13", "mapbox_access_tokens": null, "has_password": null, "username": "mariaaaaaaaa", "email": null, "is_active": null, "readonly": null, "is_dash_creator": null, "dash_created_count": null, "is_chart_creator": null, "charts_created_count": null } }, { "creation_time": "2025-09-16T06:01:46.472419Z", "comments": { "results": [], "count": 0 }, "parented": true, "embed_url": "https://chart-studio.plotly.com/~Menasser/1.embed", "fid": "Menasser:1", "filename": "Menasser Awad Bio Lab assignment 3 data chart", "filetype": "plot", "img_url": "https://storage.googleapis.com/plotly-prod-images/Menasser/1/9_GQDQF5GQWQPYLGB2SP1ABVVCKIVE9E.png", "image_urls": { "default": "https://storage.googleapis.com/plotly-prod-images/Menasser/1/2_A49B5JJNA5CM5K2BKHPJNJ5ZF2J5NE.png", "block-thumb": "https://storage.googleapis.com/plotly-prod-images/Menasser/1/8_AH7016W5XF7SZD5OPPIPQV93LI8NZB.png", "list-thumb": "https://storage.googleapis.com/plotly-prod-images/Menasser/1/9_GQDQF5GQWQPYLGB2SP1ABVVCKIVE9E.png" }, "api_urls": { "files": "https://api.plotly.com/v2/files/Menasser:1", "plots": "https://api.plotly.com/v2/plots/Menasser:1", "parent": "https://api.plotly.com/v2/folders/home?user=Menasser" }, "owner": "Menasser", "parent": -1, "preview": "", "referencers": [], "references": [], "title": "", "views": 0, "web_url": "https://chart-studio.plotly.com/~Menasser/1/", "world_readable": true, "date_modified": "2025-09-16T06:01:46.483Z", "stars": { "results": [], "count": 0 }, "collaborators": { "results": [], "count": 0 }, "subfolder_count": null, "refresh_interval": null, "organize_view_url": "https://chart-studio.plotly.com/~Menasser/1/", "current_user_permission": "read", "is_theme": null, "is_template": false, "autosize": true, "caption": "", "figure": { "data": [ { "meta": { "columnNames": { "x": "mL", "y": "Ph" } }, "mode": "markers", "type": "scatter", "xsrc": "Menasser:0:0ffd17", "ysrc": "Menasser:0:a601b3" } ], "frames": [], "layout": { "title": { "text": "Titration Of Phosphate Buffer " }, "xaxis": { "type": "linear", "range": [ -2.086325966850829, 38.08632596685083 ], "title": { "text": "Ph" }, "autorange": true }, "yaxis": { "type": "linear", "range": [ 1.7424617860016087, 13.077538213998391 ], "title": { "text": "mL" }, "autorange": true }, "autosize": true, "template": { "data": { "bar": [ { "type": "bar", "marker": { "colorbar": { "ticks": "", "outlinewidth": 0 } } } ], "table": [ { "type": "table", "cells": { "fill": { "color": "#EBF0F8" }, "line": { "color": "white" } }, "header": { "fill": { "color": "#C8D4E3" }, "line": { "color": "white" } } } ], "carpet": [ { "type": "carpet", "aaxis": { "gridcolor": "#C8D4E3", "linecolor": "#C8D4E3", "endlinecolor": "#2a3f5f", "minorgridcolor": "#C8D4E3", "startlinecolor": "#2a3f5f" }, "baxis": { "gridcolor": "#C8D4E3", "linecolor": "#C8D4E3", "endlinecolor": "#2a3f5f", "minorgridcolor": "#C8D4E3", "startlinecolor": "#2a3f5f" } } ], "mesh3d": [ { "type": "mesh3d", "colorbar": { "ticks": "", "outlinewidth": 0 } } ], "contour": [ { "type": "contour", "colorbar": { "ticks": "", "outlinewidth": 0 }, "autocolorscale": true } ], "heatmap": [ { "type": "heatmap", "colorbar": { "ticks": "", "outlinewidth": 0 }, "autocolorscale": true } ], "scatter": [ { "type": "scatter", "marker": { "colorbar": { "ticks": "", "outlinewidth": 0 } } } ], "surface": [ { "type": "surface", "colorbar": { "ticks": "", "outlinewidth": 0 } } ], "heatmapgl": [ { "type": "heatmapgl", "colorbar": { "ticks": "", "outlinewidth": 0 } } ], "histogram": [ { "type": "histogram", "marker": { "colorbar": { "ticks": "", "outlinewidth": 0 } } } ], "parcoords": [ { "line": { "colorbar": { "ticks": "", "outlinewidth": 0 } }, "type": "parcoords" } ], "scatter3d": [ { "type": "scatter3d", "marker": { "colorbar": { "ticks": "", "outlinewidth": 0 } } } ], "scattergl": [ { "type": "scattergl", "marker": { "colorbar": { "ticks": "", "outlinewidth": 0 } } } ], "choropleth": [ { "type": "choropleth", "colorbar": { "ticks": "", "outlinewidth": 0 } } ], "scattergeo": [ { "type": "scattergeo", "marker": { "colorbar": { "ticks": "", "outlinewidth": 0 } } } ], "histogram2d": [ { "type": "histogram2d", "colorbar": { "ticks": "", "outlinewidth": 0 }, "autocolorscale": true } ], "scatterpolar": [ { "type": "scatterpolar", "marker": { "colorbar": { "ticks": "", "outlinewidth": 0 } } } ], "contourcarpet": [ { "type": "contourcarpet", "colorbar": { "ticks": "", "outlinewidth": 0 } } ], "scattercarpet": [ { "type": "scattercarpet", "marker": { "colorbar": { "ticks": "", "outlinewidth": 0 } } } ], "scattermapbox": [ { "type": "scattermapbox", "marker": { "colorbar": { "ticks": "", "outlinewidth": 0 } } } ], "scatterpolargl": [ { "type": "scatterpolargl", "marker": { "colorbar": { "ticks": "", "outlinewidth": 0 } } } ], "scatterternary": [ { "type": "scatterternary", "marker": { "colorbar": { "ticks": "", "outlinewidth": 0 } } } ], "histogram2dcontour": [ { "type": "histogram2dcontour", "colorbar": { "ticks": "", "outlinewidth": 0 }, "autocolorscale": true } ] }, "layout": { "geo": { "bgcolor": "white", "showland": true, "lakecolor": "white", "landcolor": "white", "showlakes": true, "subunitcolor": "#C8D4E3" }, "font": { "color": "#2a3f5f" }, "polar": { "bgcolor": "white", "radialaxis": { "ticks": "", "gridcolor": "#EBF0F8", "linecolor": "#EBF0F8" }, "angularaxis": { "ticks": "", "gridcolor": "#EBF0F8", "linecolor": "#EBF0F8" } }, "scene": { "xaxis": { "ticks": "", "gridcolor": "#DFE8F3", "gridwidth": 2, "linecolor": "#EBF0F8", "zerolinecolor": "#EBF0F8", "showbackground": true, "backgroundcolor": "white" }, "yaxis": { "ticks": "", "gridcolor": "#DFE8F3", "gridwidth": 2, "linecolor": "#EBF0F8", "zerolinecolor": "#EBF0F8", "showbackground": true, "backgroundcolor": "white" }, "zaxis": { "ticks": "", "gridcolor": "#DFE8F3", "gridwidth": 2, "linecolor": "#EBF0F8", "zerolinecolor": "#EBF0F8", "showbackground": true, "backgroundcolor": "white" } }, "title": { "x": 0.05 }, "xaxis": { "ticks": "", "gridcolor": "#EBF0F8", "linecolor": "#EBF0F8", "automargin": true, "zerolinecolor": "#EBF0F8", "zerolinewidth": 2 }, "yaxis": { "ticks": "", "gridcolor": "#EBF0F8", "linecolor": "#EBF0F8", "automargin": true, "zerolinecolor": "#EBF0F8", "zerolinewidth": 2 }, "ternary": { "aaxis": { "ticks": "", "gridcolor": "#DFE8F3", "linecolor": "#A2B1C6" }, "baxis": { "ticks": "", "gridcolor": "#DFE8F3", "linecolor": "#A2B1C6" }, "caxis": { "ticks": "", "gridcolor": "#DFE8F3", "linecolor": "#A2B1C6" }, "bgcolor": "white" }, "colorway": [ "#636efa", "#EF553B", "#00cc96", "#ab63fa", "#19d3f3", "#e763fa", "#fecb52", "#ffa15a", "#ff6692", "#b6e880" ], "hovermode": "closest", "colorscale": { "diverging": [ [ 0, "#8e0152" ], [ 0.1, "#c51b7d" ], [ 0.2, "#de77ae" ], [ 0.3, "#f1b6da" ], [ 0.4, "#fde0ef" ], [ 0.5, "#f7f7f7" ], [ 0.6, "#e6f5d0" ], [ 0.7, "#b8e186" ], [ 0.8, "#7fbc41" ], [ 0.9, "#4d9221" ], [ 1, "#276419" ] ], "sequential": [ [ 0, "#0508b8" ], [ 0.0893854748603352, "#1910d8" ], [ 0.1787709497206704, "#3c19f0" ], [ 0.2681564245810056, "#6b1cfb" ], [ 0.3575418994413408, "#981cfd" ], [ 0.44692737430167595, "#bf1cfd" ], [ 0.5363128491620112, "#dd2bfd" ], [ 0.6256983240223464, "#f246fe" ], [ 0.7150837988826816, "#fc67fd" ], [ 0.8044692737430168, "#fe88fc" ], [ 0.8938547486033519, "#fea5fd" ], [ 0.9832402234636871, "#febefe" ], [ 1, "#fec3fe" ] ], "sequentialminus": [ [ 0, "#0508b8" ], [ 0.0893854748603352, "#1910d8" ], [ 0.1787709497206704, "#3c19f0" ], [ 0.2681564245810056, "#6b1cfb" ], [ 0.3575418994413408, "#981cfd" ], [ 0.44692737430167595, "#bf1cfd" ], [ 0.5363128491620112, "#dd2bfd" ], [ 0.6256983240223464, "#f246fe" ], [ 0.7150837988826816, "#fc67fd" ], [ 0.8044692737430168, "#fe88fc" ], [ 0.8938547486033519, "#fea5fd" ], [ 0.9832402234636871, "#febefe" ], [ 1, "#fec3fe" ] ] }, "plot_bgcolor": "white", "paper_bgcolor": "white", "shapedefaults": { "line": { "width": 0 }, "opacity": 0.4, "fillcolor": "#506784" }, "annotationdefaults": { "arrowhead": 0, "arrowcolor": "#506784", "arrowwidth": 1 } }, "themeRef": "PLOTLY_WHITE" } } }, "height": null, "width": null, "user": { "profile_url": "https://chart-studio.plotly.com/~Menasser", "avatar_url": "https://storage.googleapis.com/plotly-prod-profiles/71.jpg", "background_url": "https://storage.googleapis.com/plotly-prod-profiles/bg-10.jpg", "bio": "", "nickname": "", "website": "", "stream_tokens": null, "feature_set_id": null, "csrf_token": null, "date_joined": "2025-09-16 05:38:59", "mapbox_access_tokens": null, "has_password": null, "username": "Menasser", "email": null, "is_active": null, "readonly": null, "is_dash_creator": null, "dash_created_count": null, "is_chart_creator": null, "charts_created_count": null } }, { "creation_time": "2025-09-16T04:41:01.500497Z", "comments": { "results": [], "count": 0 }, "parented": true, "embed_url": "https://chart-studio.plotly.com/~hackathon_test/118.embed", "fid": "hackathon_test:118", "filename": "infracost-graph-table-1757997654", "filetype": "plot", "img_url": "https://storage.googleapis.com/plotly-prod-images/hackathon_test/118/9_Y0C7AU0K4H3UIFOXI29D2HU0HHZ6SE.png", "image_urls": { "default": "https://storage.googleapis.com/plotly-prod-images/hackathon_test/118/2_OMAG0A9E7G7ARWFF5YZ66VW942VGWE.png", "block-thumb": "https://storage.googleapis.com/plotly-prod-images/hackathon_test/118/8_IA5UTJLSCTP1QDM69GLEQ2YS2C4DBF.png", "list-thumb": "https://storage.googleapis.com/plotly-prod-images/hackathon_test/118/9_Y0C7AU0K4H3UIFOXI29D2HU0HHZ6SE.png" }, "api_urls": { "files": "https://api.plotly.com/v2/files/hackathon_test:118", "plots": "https://api.plotly.com/v2/plots/hackathon_test:118", "parent": "https://api.plotly.com/v2/folders/home?user=hackathon_test" }, "owner": "hackathon_test", "parent": -1, "preview": "", "referencers": [], "references": [], "title": "", "views": 0, "web_url": "https://chart-studio.plotly.com/~hackathon_test/118/", "world_readable": true, "date_modified": "2025-09-16T04:41:01.511Z", "stars": { "results": [], "count": 0 }, "collaborators": { "results": [], "count": 0 }, "subfolder_count": null, "refresh_interval": null, "organize_view_url": "https://chart-studio.plotly.com/~hackathon_test/118/", "current_user_permission": "read", "is_theme": null, "is_template": null, "autosize": true, "caption": "", "figure": { "data": [ { "name": "aws_lb.hack_lb", "type": "bar", "xsrc": "hackathon_test:117:dbafe6", "ysrc": "hackathon_test:117:a2f8be", "xaxis": "x", "yaxis": "y", "marker": { "color": "rgb(229, 134, 6)", "pattern": { "shape": "" } }, "showlegend": true, "legendgroup": "aws_lb.hack_lb", "offsetgroup": "aws_lb.hack_lb", "orientation": "v", "textposition": "auto", "hovertemplate": "Resource=%{x}<br>Monthly Cost ($)=%{y}<extra></extra>", "alignmentgroup": "True" }, { "name": "aws_db_instance.hack_db", "type": "bar", "xsrc": "hackathon_test:117:8a8432", "ysrc": "hackathon_test:117:e5a2f8", "xaxis": "x", "yaxis": "y", "marker": { "color": "rgb(93, 105, 177)", "pattern": { "shape": "" } }, "showlegend": true, "legendgroup": "aws_db_instance.hack_db", "offsetgroup": "aws_db_instance.hack_db", "orientation": "v", "textposition": "auto", "hovertemplate": "Resource=%{x}<br>Monthly Cost ($)=%{y}<extra></extra>", "alignmentgroup": "True" }, { "name": "aws_instance.hack_vm", "type": "bar", "xsrc": "hackathon_test:117:9542f1", "ysrc": "hackathon_test:117:96a4ba", "xaxis": "x", "yaxis": "y", "marker": { "color": "rgb(82, 188, 163)", "pattern": { "shape": "" } }, "showlegend": true, "legendgroup": "aws_instance.hack_vm", "offsetgroup": "aws_instance.hack_vm", "orientation": "v", "textposition": "auto", "hovertemplate": "Resource=%{x}<br>Monthly Cost ($)=%{y}<extra></extra>", "alignmentgroup": "True" }, { "name": "aws_instance.hack_vm2", "type": "bar", "xsrc": "hackathon_test:117:94b438", "ysrc": "hackathon_test:117:d10bd7", "xaxis": "x", "yaxis": "y", "marker": { "color": "rgb(153, 201, 69)", "pattern": { "shape": "" } }, "showlegend": true, "legendgroup": "aws_instance.hack_vm2", "offsetgroup": "aws_instance.hack_vm2", "orientation": "v", "textposition": "auto", "hovertemplate": "Resource=%{x}<br>Monthly Cost ($)=%{y}<extra></extra>", "alignmentgroup": "True" }, { "name": "aws_ebs_volume.hack_volume", "type": "bar", "xsrc": "hackathon_test:117:22a70a", "ysrc": "hackathon_test:117:f585ed", "xaxis": "x", "yaxis": "y", "marker": { "color": "rgb(204, 97, 176)", "pattern": { "shape": "" } }, "showlegend": true, "legendgroup": "aws_ebs_volume.hack_volume", "offsetgroup": "aws_ebs_volume.hack_volume", "orientation": "v", "textposition": "auto", "hovertemplate": "Resource=%{x}<br>Monthly Cost ($)=%{y}<extra></extra>", "alignmentgroup": "True" }, { "type": "table", "cells": { "fill": { "colorsrc": "hackathon_test:117:0af955" }, "font": { "size": 11 }, "align": "center", "valuessrc": "hackathon_test:117:029c09" }, "domain": { "x": [ 0.0, 1.0 ], "y": [ 0.0, 0.2976 ] }, "header": { "fill": { "color": "lightgrey" }, "font": { "size": 12, "color": "black" }, "align": "center", "valuessrc": "hackathon_test:117:eca3cd" } } ], "layout": { "title": { "text": "Monthly Infracost Breakdown per Resource" }, "width": 1200, "xaxis": { "anchor": "y", "domain": [ 0.0, 1.0 ] }, "yaxis": { "anchor": "x", "domain": [ 0.3676, 1.0 ] }, "height": 900, "template": { "data": { "table": [ { "type": "table", "cells": { "fill": { "color": "#000038" }, "font": { "color": "#000037" }, "line": { "color": "#000039" } }, "header": { "fill": { "color": "#000040" }, "font": { "color": "#000036" }, "line": { "color": "#000039" } } } ], "icicle": [ { "type": "icicle", "textfont": { "color": "white" } } ], "sankey": [ { "type": "sankey", "textfont": { "color": "#000036" } } ], "contour": [ { "type": "contour", "colorscale": [ [ 0.0, "#000011" ], [ 0.1111111111111111, "#000012" ], [ 0.2222222222222222, "#000013" ], [ 0.3333333333333333, "#000014" ], [ 0.4444444444444444, "#000015" ], [ 0.5555555555555556, "#000016" ], [ 0.6666666666666666, "#000017" ], [ 0.7777777777777778, "#000018" ], [ 0.8888888888888888, "#000019" ], [ 1.0, "#000020" ] ] } ], "heatmap": [ { "type": "heatmap", "colorscale": [ [ 0.0, "#000011" ], [ 0.1111111111111111, "#000012" ], [ 0.2222222222222222, "#000013" ], [ 0.3333333333333333, "#000014" ], [ 0.4444444444444444, "#000015" ], [ 0.5555555555555556, "#000016" ], [ 0.6666666666666666, "#000017" ], [ 0.7777777777777778, "#000018" ], [ 0.8888888888888888, "#000019" ], [ 1.0, "#000020" ] ] } ], "scatter": [ { "type": "scatter", "marker": { "line": { "width": 0 } } } ], "waterfall": [ { "type": "waterfall", "totals": { "marker": { "color": "#000034" } }, "connector": { "line": { "color": "#000036", "width": 2 } }, "decreasing": { "marker": { "color": "#000033" } }, "increasing": { "marker": { "color": "#000032" } } } ], "candlestick": [ { "type": "candlestick", "decreasing": { "line": { "color": "#000033" } }, "increasing": { "line": { "color": "#000032" } } } ], "histogram2d": [ { "type": "histogram2d", "colorscale": [ [ 0.0, "#000011" ], [ 0.1111111111111111, "#000012" ], [ 0.2222222222222222, "#000013" ], [ 0.3333333333333333, "#000014" ], [ 0.4444444444444444, "#000015" ], [ 0.5555555555555556, "#000016" ], [ 0.6666666666666666, "#000017" ], [ 0.7777777777777778, "#000018" ], [ 0.8888888888888888, "#000019" ], [ 1.0, "#000020" ] ] } ], "contourcarpet": [ { "type": "contourcarpet", "colorscale": [ [ 0.0, "#000011" ], [ 0.1111111111111111, "#000012" ], [ 0.2222222222222222, "#000013" ], [ 0.3333333333333333, "#000014" ], [ 0.4444444444444444, "#000015" ], [ 0.5555555555555556, "#000016" ], [ 0.6666666666666666, "#000017" ], [ 0.7777777777777778, "#000018" ], [ 0.8888888888888888, "#000019" ], [ 1.0, "#000020" ] ] } ] }, "layout": { "colorway": [ "#000001", "#000002", "#000003", "#000004", "#000005", "#000006", "#000007", "#000008", "#000009", "#000010" ], "coloraxis": { "colorscale": [ [ 0.0, "#000011" ], [ 0.1111111111111111, "#000012" ], [ 0.2222222222222222, "#000013" ], [ 0.3333333333333333, "#000014" ], [ 0.4444444444444444, "#000015" ], [ 0.5555555555555556, "#000016" ], [ 0.6666666666666666, "#000017" ], [ 0.7777777777777778, "#000018" ], [ 0.8888888888888888, "#000019" ], [ 1.0, "#000020" ] ] }, "colorscale": { "diverging": [ [ 0.0, "#000021" ], [ 0.1, "#000022" ], [ 0.2, "#000023" ], [ 0.3, "#000024" ], [ 0.4, "#000025" ], [ 0.5, "#000026" ], [ 0.6, "#000027" ], [ 0.7, "#000028" ], [ 0.8, "#000029" ], [ 0.9, "#000030" ], [ 1.0, "#000031" ] ], "sequential": [ [ 0.0, "#000011" ], [ 0.1111111111111111, "#000012" ], [ 0.2222222222222222, "#000013" ], [ 0.3333333333333333, "#000014" ], [ 0.4444444444444444, "#000015" ], [ 0.5555555555555556, "#000016" ], [ 0.6666666666666666, "#000017" ], [ 0.7777777777777778, "#000018" ], [ 0.8888888888888888, "#000019" ], [ 1.0, "#000020" ] ], "sequentialminus": [ [ 0.0, "#000011" ], [ 0.1111111111111111, "#000012" ], [ 0.2222222222222222, "#000013" ], [ 0.3333333333333333, "#000014" ], [ 0.4444444444444444, "#000015" ], [ 0.5555555555555556, "#000016" ], [ 0.6666666666666666, "#000017" ], [ 0.7777777777777778, "#000018" ], [ 0.8888888888888888, "#000019" ], [ 1.0, "#000020" ] ] } } }, "plot_bgcolor": "rgba(245,245,245,1)", "paper_bgcolor": "rgba(245,245,245,1)" } }, "height": 900, "width": 1200, "user": { "profile_url": "https://chart-studio.plotly.com/~hackathon_test", "avatar_url": "https://storage.googleapis.com/plotly-prod-profiles/21.jpg", "background_url": "https://storage.googleapis.com/plotly-prod-profiles/bg-7.jpg", "bio": "", "nickname": "", "website": "", "stream_tokens": null, "feature_set_id": null, "csrf_token": null, "date_joined": "2025-09-16 02:59:33", "mapbox_access_tokens": null, "has_password": null, "username": "hackathon_test", "email": null, "is_active": null, "readonly": null, "is_dash_creator": null, "dash_created_count": null, "is_chart_creator": null, "charts_created_count": null } }, { "creation_time": "2025-09-16T04:38:35.774773Z", "comments": { "results": [], "count": 0 }, "parented": true, "embed_url": "https://chart-studio.plotly.com/~hackathon_test/112.embed", "fid": "hackathon_test:112", "filename": "infracost-graph-table-1757997508", "filetype": "plot", "img_url": "https://storage.googleapis.com/plotly-prod-images/hackathon_test/112/9_1DP4QIQM0OCAZ0MYE4CT26KIRMZPMJ.png", "image_urls": { "default": "https://storage.googleapis.com/plotly-prod-images/hackathon_test/112/2_FGIQMEGQF9X1YCJZ1MVCCIAHXSCRJS.png", "block-thumb": "https://storage.googleapis.com/plotly-prod-images/hackathon_test/112/8_L3MWYKE5XAI8XSBQ4YHAB0GUPUY3RO.png", "list-thumb": "https://storage.googleapis.com/plotly-prod-images/hackathon_test/112/9_1DP4QIQM0OCAZ0MYE4CT26KIRMZPMJ.png" }, "api_urls": { "files": "https://api.plotly.com/v2/files/hackathon_test:112", "plots": "https://api.plotly.com/v2/plots/hackathon_test:112", "parent": "https://api.plotly.com/v2/folders/home?user=hackathon_test" }, "owner": "hackathon_test", "parent": -1, "preview": "", "referencers": [], "references": [], "title": "", "views": 0, "web_url": "https://chart-studio.plotly.com/~hackathon_test/112/", "world_readable": true, "date_modified": "2025-09-16T04:38:35.787Z", "stars": { "results": [], "count": 0 }, "collaborators": { "results": [], "count": 0 }, "subfolder_count": null, "refresh_interval": null, "organize_view_url": "https://chart-studio.plotly.com/~hackathon_test/112/", "current_user_permission": "read", "is_theme": null, "is_template": null, "autosize": true, "caption": "", "figure": { "data": [ { "name": "aws_lb.hack_lb", "type": "bar", "xsrc": "hackathon_test:104:688699", "ysrc": "hackathon_test:104:82e172", "xaxis": "x", "yaxis": "y", "marker": { "color": "rgb(229, 134, 6)", "pattern": { "shape": "" } }, "showlegend": true, "legendgroup": "aws_lb.hack_lb", "offsetgroup": "aws_lb.hack_lb", "orientation": "v", "textposition": "auto", "hovertemplate": "Resource=%{x}<br>Monthly Cost ($)=%{y}<extra></extra>", "alignmentgroup": "True" }, { "name": "aws_db_instance.hack_db", "type": "bar", "xsrc": "hackathon_test:104:99b33b", "ysrc": "hackathon_test:104:f7acc3", "xaxis": "x", "yaxis": "y", "marker": { "color": "rgb(93, 105, 177)", "pattern": { "shape": "" } }, "showlegend": true, "legendgroup": "aws_db_instance.hack_db", "offsetgroup": "aws_db_instance.hack_db", "orientation": "v", "textposition": "auto", "hovertemplate": "Resource=%{x}<br>Monthly Cost ($)=%{y}<extra></extra>", "alignmentgroup": "True" }, { "name": "aws_instance.hack_vm", "type": "bar", "xsrc": "hackathon_test:104:572ebb", "ysrc": "hackathon_test:104:fb2059", "xaxis": "x", "yaxis": "y", "marker": { "color": "rgb(82, 188, 163)", "pattern": { "shape": "" } }, "showlegend": true, "legendgroup": "aws_instance.hack_vm", "offsetgroup": "aws_instance.hack_vm", "orientation": "v", "textposition": "auto", "hovertemplate": "Resource=%{x}<br>Monthly Cost ($)=%{y}<extra></extra>", "alignmentgroup": "True" }, { "name": "aws_instance.hack_vm2", "type": "bar", "xsrc": "hackathon_test:104:39131b", "ysrc": "hackathon_test:104:9f0bc5", "xaxis": "x", "yaxis": "y", "marker": { "color": "rgb(153, 201, 69)", "pattern": { "shape": "" } }, "showlegend": true, "legendgroup": "aws_instance.hack_vm2", "offsetgroup": "aws_instance.hack_vm2", "orientation": "v", "textposition": "auto", "hovertemplate": "Resource=%{x}<br>Monthly Cost ($)=%{y}<extra></extra>", "alignmentgroup": "True" }, { "name": "aws_ebs_volume.hack_volume", "type": "bar", "xsrc": "hackathon_test:104:ce9c0e", "ysrc": "hackathon_test:104:b9b22c", "xaxis": "x", "yaxis": "y", "marker": { "color": "rgb(204, 97, 176)", "pattern": { "shape": "" } }, "showlegend": true, "legendgroup": "aws_ebs_volume.hack_volume", "offsetgroup": "aws_ebs_volume.hack_volume", "orientation": "v", "textposition": "auto", "hovertemplate": "Resource=%{x}<br>Monthly Cost ($)=%{y}<extra></extra>", "alignmentgroup": "True" }, { "type": "table", "cells": { "fill": { "colorsrc": "hackathon_test:104:d4f92c" }, "font": { "size": 11 }, "align": "center", "valuessrc": "hackathon_test:104:d2e503" }, "domain": { "x": [ 0.0, 1.0 ], "y": [ 0.0, 0.2976 ] }, "header": { "fill": { "color": "lightgrey" }, "font": { "size": 12, "color": "black" }, "align": "center", "valuessrc": "hackathon_test:104:3cee68" } } ], "layout": { "title": { "text": "Monthly Infracost Breakdown per Resource" }, "width": 1200, "xaxis": { "anchor": "y", "domain": [ 0.0, 1.0 ] }, "yaxis": { "anchor": "x", "domain": [ 0.3676, 1.0 ] }, "height": 900, "template": { "data": { "table": [ { "type": "table", "cells": { "fill": { "color": "#000038" }, "font": { "color": "#000037" }, "line": { "color": "#000039" } }, "header": { "fill": { "color": "#000040" }, "font": { "color": "#000036" }, "line": { "color": "#000039" } } } ], "icicle": [ { "type": "icicle", "textfont": { "color": "white" } } ], "sankey": [ { "type": "sankey", "textfont": { "color": "#000036" } } ], "contour": [ { "type": "contour", "colorscale": [ [ 0.0, "#000011" ], [ 0.1111111111111111, "#000012" ], [ 0.2222222222222222, "#000013" ], [ 0.3333333333333333, "#000014" ], [ 0.4444444444444444, "#000015" ], [ 0.5555555555555556, "#000016" ], [ 0.6666666666666666, "#000017" ], [ 0.7777777777777778, "#000018" ], [ 0.8888888888888888, "#000019" ], [ 1.0, "#000020" ] ] } ], "heatmap": [ { "type": "heatmap", "colorscale": [ [ 0.0, "#000011" ], [ 0.1111111111111111, "#000012" ], [ 0.2222222222222222, "#000013" ], [ 0.3333333333333333, "#000014" ], [ 0.4444444444444444, "#000015" ], [ 0.5555555555555556, "#000016" ], [ 0.6666666666666666, "#000017" ], [ 0.7777777777777778, "#000018" ], [ 0.8888888888888888, "#000019" ], [ 1.0, "#000020" ] ] } ], "scatter": [ { "type": "scatter", "marker": { "line": { "width": 0 } } } ], "waterfall": [ { "type": "waterfall", "totals": { "marker": { "color": "#000034" } }, "connector": { "line": { "color": "#000036", "width": 2 } }, "decreasing": { "marker": { "color": "#000033" } }, "increasing": { "marker": { "color": "#000032" } } } ], "candlestick": [ { "type": "candlestick", "decreasing": { "line": { "color": "#000033" } }, "increasing": { "line": { "color": "#000032" } } } ], "histogram2d": [ { "type": "histogram2d", "colorscale": [ [ 0.0, "#000011" ], [ 0.1111111111111111, "#000012" ], [ 0.2222222222222222, "#000013" ], [ 0.3333333333333333, "#000014" ], [ 0.4444444444444444, "#000015" ], [ 0.5555555555555556, "#000016" ], [ 0.6666666666666666, "#000017" ], [ 0.7777777777777778, "#000018" ], [ 0.8888888888888888, "#000019" ], [ 1.0, "#000020" ] ] } ], "contourcarpet": [ { "type": "contourcarpet", "colorscale": [ [ 0.0, "#000011" ], [ 0.1111111111111111, "#000012" ], [ 0.2222222222222222, "#000013" ], [ 0.3333333333333333, "#000014" ], [ 0.4444444444444444, "#000015" ], [ 0.5555555555555556, "#000016" ], [ 0.6666666666666666, "#000017" ], [ 0.7777777777777778, "#000018" ], [ 0.8888888888888888, "#000019" ], [ 1.0, "#000020" ] ] } ] }, "layout": { "colorway": [ "#000001", "#000002", "#000003", "#000004", "#000005", "#000006", "#000007", "#000008", "#000009", "#000010" ], "coloraxis": { "colorscale": [ [ 0.0, "#000011" ], [ 0.1111111111111111, "#000012" ], [ 0.2222222222222222, "#000013" ], [ 0.3333333333333333, "#000014" ], [ 0.4444444444444444, "#000015" ], [ 0.5555555555555556, "#000016" ], [ 0.6666666666666666, "#000017" ], [ 0.7777777777777778, "#000018" ], [ 0.8888888888888888, "#000019" ], [ 1.0, "#000020" ] ] }, "colorscale": { "diverging": [ [ 0.0, "#000021" ], [ 0.1, "#000022" ], [ 0.2, "#000023" ], [ 0.3, "#000024" ], [ 0.4, "#000025" ], [ 0.5, "#000026" ], [ 0.6, "#000027" ], [ 0.7, "#000028" ], [ 0.8, "#000029" ], [ 0.9, "#000030" ], [ 1.0, "#000031" ] ], "sequential": [ [ 0.0, "#000011" ], [ 0.1111111111111111, "#000012" ], [ 0.2222222222222222, "#000013" ], [ 0.3333333333333333, "#000014" ], [ 0.4444444444444444, "#000015" ], [ 0.5555555555555556, "#000016" ], [ 0.6666666666666666, "#000017" ], [ 0.7777777777777778, "#000018" ], [ 0.8888888888888888, "#000019" ], [ 1.0, "#000020" ] ], "sequentialminus": [ [ 0.0, "#000011" ], [ 0.1111111111111111, "#000012" ], [ 0.2222222222222222, "#000013" ], [ 0.3333333333333333, "#000014" ], [ 0.4444444444444444, "#000015" ], [ 0.5555555555555556, "#000016" ], [ 0.6666666666666666, "#000017" ], [ 0.7777777777777778, "#000018" ], [ 0.8888888888888888, "#000019" ], [ 1.0, "#000020" ] ] } } }, "plot_bgcolor": "rgba(245,245,245,1)", "paper_bgcolor": "rgba(245,245,245,1)" } }, "height": 900, "width": 1200, "user": { "profile_url": "https://chart-studio.plotly.com/~hackathon_test", "avatar_url": "https://storage.googleapis.com/plotly-prod-profiles/21.jpg", "background_url": "https://storage.googleapis.com/plotly-prod-profiles/bg-7.jpg", "bio": "", "nickname": "", "website": "", "stream_tokens": null, "feature_set_id": null, "csrf_token": null, "date_joined": "2025-09-16 02:59:33", "mapbox_access_tokens": null, "has_password": null, "username": "hackathon_test", "email": null, "is_active": null, "readonly": null, "is_dash_creator": null, "dash_created_count": null, "is_chart_creator": null, "charts_created_count": null } }, { "creation_time": "2025-09-16T04:38:34.495822Z", "comments": { "results": [], "count": 0 }, "parented": true, "embed_url": "https://chart-studio.plotly.com/~hackathon_test/108.embed", "fid": "hackathon_test:108", "filename": "infracost-graph-table-1757997507", "filetype": "plot", "img_url": "https://storage.googleapis.com/plotly-prod-images/hackathon_test/108/9_EPK6TBH8EFO44S6DAPCZPJNM4WNCDS.png", "image_urls": { "default": "https://storage.googleapis.com/plotly-prod-images/hackathon_test/108/2_ITYUAVCBSS50RIHHT386TU5HTUKI19.png", "block-thumb": "https://storage.googleapis.com/plotly-prod-images/hackathon_test/108/8_022TPET88PF08G14FCG3GB6SP76TTB.png", "list-thumb": "https://storage.googleapis.com/plotly-prod-images/hackathon_test/108/9_EPK6TBH8EFO44S6DAPCZPJNM4WNCDS.png" }, "api_urls": { "files": "https://api.plotly.com/v2/files/hackathon_test:108", "plots": "https://api.plotly.com/v2/plots/hackathon_test:108", "parent": "https://api.plotly.com/v2/folders/home?user=hackathon_test" }, "owner": "hackathon_test", "parent": -1, "preview": "", "referencers": [], "references": [], "title": "", "views": 0, "web_url": "https://chart-studio.plotly.com/~hackathon_test/108/", "world_readable": true, "date_modified": "2025-09-16T04:38:35.320Z", "stars": { "results": [], "count": 0 }, "collaborators": { "results": [], "count": 0 }, "subfolder_count": null, "refresh_interval": null, "organize_view_url": "https://chart-studio.plotly.com/~hackathon_test/108/", "current_user_permission": "read", "is_theme": null, "is_template": null, "autosize": true, "caption": "", "figure": { "data": [ { "name": "aws_lb.hack_lb", "type": "bar", "xsrc": "hackathon_test:100:e10e8e", "ysrc": "hackathon_test:100:4bf9f0", "xaxis": "x", "yaxis": "y", "marker": { "color": "rgb(229, 134, 6)", "pattern": { "shape": "" } }, "showlegend": true, "legendgroup": "aws_lb.hack_lb", "offsetgroup": "aws_lb.hack_lb", "orientation": "v", "textposition": "auto", "hovertemplate": "Resource=%{x}<br>Monthly Cost ($)=%{y}<extra></extra>", "alignmentgroup": "True" }, { "name": "aws_db_instance.hack_db", "type": "bar", "xsrc": "hackathon_test:100:7a8b81", "ysrc": "hackathon_test:100:ce0885", "xaxis": "x", "yaxis": "y", "marker": { "color": "rgb(93, 105, 177)", "pattern": { "shape": "" } }, "showlegend": true, "legendgroup": "aws_db_instance.hack_db", "offsetgroup": "aws_db_instance.hack_db", "orientation": "v", "textposition": "auto", "hovertemplate": "Resource=%{x}<br>Monthly Cost ($)=%{y}<extra></extra>", "alignmentgroup": "True" }, { "name": "aws_instance.hack_vm", "type": "bar", "xsrc": "hackathon_test:100:014e74", "ysrc": "hackathon_test:100:bdf2fe", "xaxis": "x", "yaxis": "y", "marker": { "color": "rgb(82, 188, 163)", "pattern": { "shape": "" } }, "showlegend": true, "legendgroup": "aws_instance.hack_vm", "offsetgroup": "aws_instance.hack_vm", "orientation": "v", "textposition": "auto", "hovertemplate": "Resource=%{x}<br>Monthly Cost ($)=%{y}<extra></extra>", "alignmentgroup": "True" }, { "name": "aws_instance.hack_vm2", "type": "bar", "xsrc": "hackathon_test:100:424031", "ysrc": "hackathon_test:100:b6cb1d", "xaxis": "x", "yaxis": "y", "marker": { "color": "rgb(153, 201, 69)", "pattern": { "shape": "" } }, "showlegend": true, "legendgroup": "aws_instance.hack_vm2", "offsetgroup": "aws_instance.hack_vm2", "orientation": "v", "textposition": "auto", "hovertemplate": "Resource=%{x}<br>Monthly Cost ($)=%{y}<extra></extra>", "alignmentgroup": "True" }, { "name": "aws_ebs_volume.hack_volume", "type": "bar", "xsrc": "hackathon_test:100:86fe02", "ysrc": "hackathon_test:100:0b1bfc", "xaxis": "x", "yaxis": "y", "marker": { "color": "rgb(204, 97, 176)", "pattern": { "shape": "" } }, "showlegend": true, "legendgroup": "aws_ebs_volume.hack_volume", "offsetgroup": "aws_ebs_volume.hack_volume", "orientation": "v", "textposition": "auto", "hovertemplate": "Resource=%{x}<br>Monthly Cost ($)=%{y}<extra></extra>", "alignmentgroup": "True" }, { "type": "table", "cells": { "fill": { "colorsrc": "hackathon_test:100:44f019" }, "font": { "size": 11 }, "align": "center", "valuessrc": "hackathon_test:100:0cbdee" }, "domain": { "x": [ 0.0, 1.0 ], "y": [ 0.0, 0.2976 ] }, "header": { "fill": { "color": "lightgrey" }, "font": { "size": 12, "color": "black" }, "align": "center", "valuessrc": "hackathon_test:100:35ade6" } } ], "layout": { "title": { "text": "Monthly Infracost Breakdown per Resource" }, "width": 1200, "xaxis": { "anchor": "y", "domain": [ 0.0, 1.0 ] }, "yaxis": { "anchor": "x", "domain": [ 0.3676, 1.0 ] }, "height": 900, "template": { "data": { "table": [ { "type": "table", "cells": { "fill": { "color": "#000038" }, "font": { "color": "#000037" }, "line": { "color": "#000039" } }, "header": { "fill": { "color": "#000040" }, "font": { "color": "#000036" }, "line": { "color": "#000039" } } } ], "icicle": [ { "type": "icicle", "textfont": { "color": "white" } } ], "sankey": [ { "type": "sankey", "textfont": { "color": "#000036" } } ], "contour": [ { "type": "contour", "colorscale": [ [ 0.0, "#000011" ], [ 0.1111111111111111, "#000012" ], [ 0.2222222222222222, "#000013" ], [ 0.3333333333333333, "#000014" ], [ 0.4444444444444444, "#000015" ], [ 0.5555555555555556, "#000016" ], [ 0.6666666666666666, "#000017" ], [ 0.7777777777777778, "#000018" ], [ 0.8888888888888888, "#000019" ], [ 1.0, "#000020" ] ] } ], "heatmap": [ { "type": "heatmap", "colorscale": [ [ 0.0, "#000011" ], [ 0.1111111111111111, "#000012" ], [ 0.2222222222222222, "#000013" ], [ 0.3333333333333333, "#000014" ], [ 0.4444444444444444, "#000015" ], [ 0.5555555555555556, "#000016" ], [ 0.6666666666666666, "#000017" ], [ 0.7777777777777778, "#000018" ], [ 0.8888888888888888, "#000019" ], [ 1.0, "#000020" ] ] } ], "scatter": [ { "type": "scatter", "marker": { "line": { "width": 0 } } } ], "waterfall": [ { "type": "waterfall", "totals": { "marker": { "color": "#000034" } }, "connector": { "line": { "color": "#000036", "width": 2 } }, "decreasing": { "marker": { "color": "#000033" } }, "increasing": { "marker": { "color": "#000032" } } } ], "candlestick": [ { "type": "candlestick", "decreasing": { "line": { "color": "#000033" } }, "increasing": { "line": { "color": "#000032" } } } ], "histogram2d": [ { "type": "histogram2d", "colorscale": [ [ 0.0, "#000011" ], [ 0.1111111111111111, "#000012" ], [ 0.2222222222222222, "#000013" ], [ 0.3333333333333333, "#000014" ], [ 0.4444444444444444, "#000015" ], [ 0.5555555555555556, "#000016" ], [ 0.6666666666666666, "#000017" ], [ 0.7777777777777778, "#000018" ], [ 0.8888888888888888, "#000019" ], [ 1.0, "#000020" ] ] } ], "contourcarpet": [ { "type": "contourcarpet", "colorscale": [ [ 0.0, "#000011" ], [ 0.1111111111111111, "#000012" ], [ 0.2222222222222222, "#000013" ], [ 0.3333333333333333, "#000014" ], [ 0.4444444444444444, "#000015" ], [ 0.5555555555555556, "#000016" ], [ 0.6666666666666666, "#000017" ], [ 0.7777777777777778, "#000018" ], [ 0.8888888888888888, "#000019" ], [ 1.0, "#000020" ] ] } ] }, "layout": { "colorway": [ "#000001", "#000002", "#000003", "#000004", "#000005", "#000006", "#000007", "#000008", "#000009", "#000010" ], "coloraxis": { "colorscale": [ [ 0.0, "#000011" ], [ 0.1111111111111111, "#000012" ], [ 0.2222222222222222, "#000013" ], [ 0.3333333333333333, "#000014" ], [ 0.4444444444444444, "#000015" ], [ 0.5555555555555556, "#000016" ], [ 0.6666666666666666, "#000017" ], [ 0.7777777777777778, "#000018" ], [ 0.8888888888888888, "#000019" ], [ 1.0, "#000020" ] ] }, "colorscale": { "diverging": [ [ 0.0, "#000021" ], [ 0.1, "#000022" ], [ 0.2, "#000023" ], [ 0.3, "#000024" ], [ 0.4, "#000025" ], [ 0.5, "#000026" ], [ 0.6, "#000027" ], [ 0.7, "#000028" ], [ 0.8, "#000029" ], [ 0.9, "#000030" ], [ 1.0, "#000031" ] ], "sequential": [ [ 0.0, "#000011" ], [ 0.1111111111111111, "#000012" ], [ 0.2222222222222222, "#000013" ], [ 0.3333333333333333, "#000014" ], [ 0.4444444444444444, "#000015" ], [ 0.5555555555555556, "#000016" ], [ 0.6666666666666666, "#000017" ], [ 0.7777777777777778, "#000018" ], [ 0.8888888888888888, "#000019" ], [ 1.0, "#000020" ] ], "sequentialminus": [ [ 0.0, "#000011" ], [ 0.1111111111111111, "#000012" ], [ 0.2222222222222222, "#000013" ], [ 0.3333333333333333, "#000014" ], [ 0.4444444444444444, "#000015" ], [ 0.5555555555555556, "#000016" ], [ 0.6666666666666666, "#000017" ], [ 0.7777777777777778, "#000018" ], [ 0.8888888888888888, "#000019" ], [ 1.0, "#000020" ] ] } } }, "plot_bgcolor": "rgba(245,245,245,1)", "paper_bgcolor": "rgba(245,245,245,1)" } }, "height": 900, "width": 1200, "user": { "profile_url": "https://chart-studio.plotly.com/~hackathon_test", "avatar_url": "https://storage.googleapis.com/plotly-prod-profiles/21.jpg", "background_url": "https://storage.googleapis.com/plotly-prod-profiles/bg-7.jpg", "bio": "", "nickname": "", "website": "", "stream_tokens": null, "feature_set_id": null, "csrf_token": null, "date_joined": "2025-09-16 02:59:33", "mapbox_access_tokens": null, "has_password": null, "username": "hackathon_test", "email": null, "is_active": null, "readonly": null, "is_dash_creator": null, "dash_created_count": null, "is_chart_creator": null, "charts_created_count": null } }, { "creation_time": "2025-09-16T04:38:33.672789Z", "comments": { "results": [], "count": 0 }, "parented": true, "embed_url": "https://chart-studio.plotly.com/~hackathon_test/107.embed", "fid": "hackathon_test:107", "filename": "infracost-graph-table-1757997505", "filetype": "plot", "img_url": "https://storage.googleapis.com/plotly-prod-images/hackathon_test/107/9_JS6L5SU7V3M4ZLEH7AGAFFQ3P8TMD2.png", "image_urls": { "default": "https://storage.googleapis.com/plotly-prod-images/hackathon_test/107/2_IWZ9MAE1Y3BXBY8P32Y7TQWT30EVJZ.png", "block-thumb": "https://storage.googleapis.com/plotly-prod-images/hackathon_test/107/8_V870W2393GN8G1IPSWTKY29JU1YODD.png", "list-thumb": "https://storage.googleapis.com/plotly-prod-images/hackathon_test/107/9_JS6L5SU7V3M4ZLEH7AGAFFQ3P8TMD2.png" }, "api_urls": { "files": "https://api.plotly.com/v2/files/hackathon_test:107", "plots": "https://api.plotly.com/v2/plots/hackathon_test:107", "parent": "https://api.plotly.com/v2/folders/home?user=hackathon_test" }, "owner": "hackathon_test", "parent": -1, "preview": "", "referencers": [], "references": [], "title": "", "views": 0, "web_url": "https://chart-studio.plotly.com/~hackathon_test/107/", "world_readable": true, "date_modified": "2025-09-16T04:38:35.494Z", "stars": { "results": [], "count": 0 }, "collaborators": { "results": [], "count": 0 }, "subfolder_count": null, "refresh_interval": null, "organize_view_url": "https://chart-studio.plotly.com/~hackathon_test/107/", "current_user_permission": "read", "is_theme": null, "is_template": null, "autosize": true, "caption": "", "figure": { "data": [ { "name": "aws_lb.hack_lb", "type": "bar", "xsrc": "hackathon_test:99:2fd59f", "ysrc": "hackathon_test:99:a5122b", "xaxis": "x", "yaxis": "y", "marker": { "color": "rgb(229, 134, 6)", "pattern": { "shape": "" } }, "showlegend": true, "legendgroup": "aws_lb.hack_lb", "offsetgroup": "aws_lb.hack_lb", "orientation": "v", "textposition": "auto", "hovertemplate": "Resource=%{x}<br>Monthly Cost ($)=%{y}<extra></extra>", "alignmentgroup": "True" }, { "name": "aws_db_instance.hack_db", "type": "bar", "xsrc": "hackathon_test:99:02403c", "ysrc": "hackathon_test:99:f5e60d", "xaxis": "x", "yaxis": "y", "marker": { "color": "rgb(93, 105, 177)", "pattern": { "shape": "" } }, "showlegend": true, "legendgroup": "aws_db_instance.hack_db", "offsetgroup": "aws_db_instance.hack_db", "orientation": "v", "textposition": "auto", "hovertemplate": "Resource=%{x}<br>Monthly Cost ($)=%{y}<extra></extra>", "alignmentgroup": "True" }, { "name": "aws_instance.hack_vm", "type": "bar", "xsrc": "hackathon_test:99:fe06d3", "ysrc": "hackathon_test:99:526668", "xaxis": "x", "yaxis": "y", "marker": { "color": "rgb(82, 188, 163)", "pattern": { "shape": "" } }, "showlegend": true, "legendgroup": "aws_instance.hack_vm", "offsetgroup": "aws_instance.hack_vm", "orientation": "v", "textposition": "auto", "hovertemplate": "Resource=%{x}<br>Monthly Cost ($)=%{y}<extra></extra>", "alignmentgroup": "True" }, { "name": "aws_instance.hack_vm2", "type": "bar", "xsrc": "hackathon_test:99:7efd50", "ysrc": "hackathon_test:99:c78f11", "xaxis": "x", "yaxis": "y", "marker": { "color": "rgb(153, 201, 69)", "pattern": { "shape": "" } }, "showlegend": true, "legendgroup": "aws_instance.hack_vm2", "offsetgroup": "aws_instance.hack_vm2", "orientation": "v", "textposition": "auto", "hovertemplate": "Resource=%{x}<br>Monthly Cost ($)=%{y}<extra></extra>", "alignmentgroup": "True" }, { "name": "aws_ebs_volume.hack_volume", "type": "bar", "xsrc": "hackathon_test:99:d26b77", "ysrc": "hackathon_test:99:698159", "xaxis": "x", "yaxis": "y", "marker": { "color": "rgb(204, 97, 176)", "pattern": { "shape": "" } }, "showlegend": true, "legendgroup": "aws_ebs_volume.hack_volume", "offsetgroup": "aws_ebs_volume.hack_volume", "orientation": "v", "textposition": "auto", "hovertemplate": "Resource=%{x}<br>Monthly Cost ($)=%{y}<extra></extra>", "alignmentgroup": "True" }, { "type": "table", "cells": { "fill": { "colorsrc": "hackathon_test:99:60fda0" }, "font": { "size": 11 }, "align": "center", "valuessrc": "hackathon_test:99:82f6eb" }, "domain": { "x": [ 0.0, 1.0 ], "y": [ 0.0, 0.2976 ] }, "header": { "fill": { "color": "lightgrey" }, "font": { "size": 12, "color": "black" }, "align": "center", "valuessrc": "hackathon_test:99:cf27af" } } ], "layout": { "title": { "text": "Monthly Infracost Breakdown per Resource" }, "width": 1200, "xaxis": { "anchor": "y", "domain": [ 0.0, 1.0 ] }, "yaxis": { "anchor": "x", "domain": [ 0.3676, 1.0 ] }, "height": 900, "template": { "data": { "table": [ { "type": "table", "cells": { "fill": { "color": "#000038" }, "font": { "color": "#000037" }, "line": { "color": "#000039" } }, "header": { "fill": { "color": "#000040" }, "font": { "color": "#000036" }, "line": { "color": "#000039" } } } ], "icicle": [ { "type": "icicle", "textfont": { "color": "white" } } ], "sankey": [ { "type": "sankey", "textfont": { "color": "#000036" } } ], "contour": [ { "type": "contour", "colorscale": [ [ 0.0, "#000011" ], [ 0.1111111111111111, "#000012" ], [ 0.2222222222222222, "#000013" ], [ 0.3333333333333333, "#000014" ], [ 0.4444444444444444, "#000015" ], [ 0.5555555555555556, "#000016" ], [ 0.6666666666666666, "#000017" ], [ 0.7777777777777778, "#000018" ], [ 0.8888888888888888, "#000019" ], [ 1.0, "#000020" ] ] } ], "heatmap": [ { "type": "heatmap", "colorscale": [ [ 0.0, "#000011" ], [ 0.1111111111111111, "#000012" ], [ 0.2222222222222222, "#000013" ], [ 0.3333333333333333, "#000014" ], [ 0.4444444444444444, "#000015" ], [ 0.5555555555555556, "#000016" ], [ 0.6666666666666666, "#000017" ], [ 0.7777777777777778, "#000018" ], [ 0.8888888888888888, "#000019" ], [ 1.0, "#000020" ] ] } ], "scatter": [ { "type": "scatter", "marker": { "line": { "width": 0 } } } ], "waterfall": [ { "type": "waterfall", "totals": { "marker": { "color": "#000034" } }, "connector": { "line": { "color": "#000036", "width": 2 } }, "decreasing": { "marker": { "color": "#000033" } }, "increasing": { "marker": { "color": "#000032" } } } ], "candlestick": [ { "type": "candlestick", "decreasing": { "line": { "color": "#000033" } }, "increasing": { "line": { "color": "#000032" } } } ], "histogram2d": [ { "type": "histogram2d", "colorscale": [ [ 0.0, "#000011" ], [ 0.1111111111111111, "#000012" ], [ 0.2222222222222222, "#000013" ], [ 0.3333333333333333, "#000014" ], [ 0.4444444444444444, "#000015" ], [ 0.5555555555555556, "#000016" ], [ 0.6666666666666666, "#000017" ], [ 0.7777777777777778, "#000018" ], [ 0.8888888888888888, "#000019" ], [ 1.0, "#000020" ] ] } ], "contourcarpet": [ { "type": "contourcarpet", "colorscale": [ [ 0.0, "#000011" ], [ 0.1111111111111111, "#000012" ], [ 0.2222222222222222, "#000013" ], [ 0.3333333333333333, "#000014" ], [ 0.4444444444444444, "#000015" ], [ 0.5555555555555556, "#000016" ], [ 0.6666666666666666, "#000017" ], [ 0.7777777777777778, "#000018" ], [ 0.8888888888888888, "#000019" ], [ 1.0, "#000020" ] ] } ] }, "layout": { "colorway": [ "#000001", "#000002", "#000003", "#000004", "#000005", "#000006", "#000007", "#000008", "#000009", "#000010" ], "coloraxis": { "colorscale": [ [ 0.0, "#000011" ], [ 0.1111111111111111, "#000012" ], [ 0.2222222222222222, "#000013" ], [ 0.3333333333333333, "#000014" ], [ 0.4444444444444444, "#000015" ], [ 0.5555555555555556, "#000016" ], [ 0.6666666666666666, "#000017" ], [ 0.7777777777777778, "#000018" ], [ 0.8888888888888888, "#000019" ], [ 1.0, "#000020" ] ] }, "colorscale": { "diverging": [ [ 0.0, "#000021" ], [ 0.1, "#000022" ], [ 0.2, "#000023" ], [ 0.3, "#000024" ], [ 0.4, "#000025" ], [ 0.5, "#000026" ], [ 0.6, "#000027" ], [ 0.7, "#000028" ], [ 0.8, "#000029" ], [ 0.9, "#000030" ], [ 1.0, "#000031" ] ], "sequential": [ [ 0.0, "#000011" ], [ 0.1111111111111111, "#000012" ], [ 0.2222222222222222, "#000013" ], [ 0.3333333333333333, "#000014" ], [ 0.4444444444444444, "#000015" ], [ 0.5555555555555556, "#000016" ], [ 0.6666666666666666, "#000017" ], [ 0.7777777777777778, "#000018" ], [ 0.8888888888888888, "#000019" ], [ 1.0, "#000020" ] ], "sequentialminus": [ [ 0.0, "#000011" ], [ 0.1111111111111111, "#000012" ], [ 0.2222222222222222, "#000013" ], [ 0.3333333333333333, "#000014" ], [ 0.4444444444444444, "#000015" ], [ 0.5555555555555556, "#000016" ], [ 0.6666666666666666, "#000017" ], [ 0.7777777777777778, "#000018" ], [ 0.8888888888888888, "#000019" ], [ 1.0, "#000020" ] ] } } }, "plot_bgcolor": "rgba(245,245,245,1)", "paper_bgcolor": "rgba(245,245,245,1)" } }, "height": 900, "width": 1200, "user": { "profile_url": "https://chart-studio.plotly.com/~hackathon_test", "avatar_url": "https://storage.googleapis.com/plotly-prod-profiles/21.jpg", "background_url": "https://storage.googleapis.com/plotly-prod-profiles/bg-7.jpg", "bio": "", "nickname": "", "website": "", "stream_tokens": null, "feature_set_id": null, "csrf_token": null, "date_joined": "2025-09-16 02:59:33", "mapbox_access_tokens": null, "has_password": null, "username": "hackathon_test", "email": null, "is_active": null, "readonly": null, "is_dash_creator": null, "dash_created_count": null, "is_chart_creator": null, "charts_created_count": null } }, { "creation_time": "2025-09-16T04:38:33.212652Z", "comments": { "results": [], "count": 0 }, "parented": true, "embed_url": "https://chart-studio.plotly.com/~hackathon_test/106.embed", "fid": "hackathon_test:106", "filename": "infracost-graph-table-1757997506", "filetype": "plot", "img_url": "https://storage.googleapis.com/plotly-prod-images/hackathon_test/106/9_8DW6VCFALLAZNZ1R6TDYI3EKXJ44GK.png", "image_urls": { "default": "https://storage.googleapis.com/plotly-prod-images/hackathon_test/106/2_QRARF2Q3XP4YC6LBYQAUUBIK72E616.png", "block-thumb": "https://storage.googleapis.com/plotly-prod-images/hackathon_test/106/8_A0053F1ZO251Z5C83624UDTT3RQQG4.png", "list-thumb": "https://storage.googleapis.com/plotly-prod-images/hackathon_test/106/9_8DW6VCFALLAZNZ1R6TDYI3EKXJ44GK.png" }, "api_urls": { "files": "https://api.plotly.com/v2/files/hackathon_test:106", "plots": "https://api.plotly.com/v2/plots/hackathon_test:106", "parent": "https://api.plotly.com/v2/folders/home?user=hackathon_test" }, "owner": "hackathon_test", "parent": -1, "preview": "", "referencers": [], "references": [], "title": "", "views": 0, "web_url": "https://chart-studio.plotly.com/~hackathon_test/106/", "world_readable": true, "date_modified": "2025-09-16T04:38:34.790Z", "stars": { "results": [], "count": 0 }, "collaborators": { "results": [], "count": 0 }, "subfolder_count": null, "refresh_interval": null, "organize_view_url": "https://chart-studio.plotly.com/~hackathon_test/106/", "current_user_permission": "read", "is_theme": null, "is_template": null, "autosize": true, "caption": "", "figure": { "data": [ { "name": "aws_lb.hack_lb", "type": "bar", "xsrc": "hackathon_test:98:b6a534", "ysrc": "hackathon_test:98:d7ab9f", "xaxis": "x", "yaxis": "y", "marker": { "color": "rgb(229, 134, 6)", "pattern": { "shape": "" } }, "showlegend": true, "legendgroup": "aws_lb.hack_lb", "offsetgroup": "aws_lb.hack_lb", "orientation": "v", "textposition": "auto", "hovertemplate": "Resource=%{x}<br>Monthly Cost ($)=%{y}<extra></extra>", "alignmentgroup": "True" }, { "name": "aws_db_instance.hack_db", "type": "bar", "xsrc": "hackathon_test:98:9f2299", "ysrc": "hackathon_test:98:19a57e", "xaxis": "x", "yaxis": "y", "marker": { "color": "rgb(93, 105, 177)", "pattern": { "shape": "" } }, "showlegend": true, "legendgroup": "aws_db_instance.hack_db", "offsetgroup": "aws_db_instance.hack_db", "orientation": "v", "textposition": "auto", "hovertemplate": "Resource=%{x}<br>Monthly Cost ($)=%{y}<extra></extra>", "alignmentgroup": "True" }, { "name": "aws_instance.hack_vm", "type": "bar", "xsrc": "hackathon_test:98:1177b9", "ysrc": "hackathon_test:98:a7b290", "xaxis": "x", "yaxis": "y", "marker": { "color": "rgb(82, 188, 163)", "pattern": { "shape": "" } }, "showlegend": true, "legendgroup": "aws_instance.hack_vm", "offsetgroup": "aws_instance.hack_vm", "orientation": "v", "textposition": "auto", "hovertemplate": "Resource=%{x}<br>Monthly Cost ($)=%{y}<extra></extra>", "alignmentgroup": "True" }, { "name": "aws_instance.hack_vm2", "type": "bar", "xsrc": "hackathon_test:98:a939d2", "ysrc": "hackathon_test:98:95be66", "xaxis": "x", "yaxis": "y", "marker": { "color": "rgb(153, 201, 69)", "pattern": { "shape": "" } }, "showlegend": true, "legendgroup": "aws_instance.hack_vm2", "offsetgroup": "aws_instance.hack_vm2", "orientation": "v", "textposition": "auto", "hovertemplate": "Resource=%{x}<br>Monthly Cost ($)=%{y}<extra></extra>", "alignmentgroup": "True" }, { "name": "aws_ebs_volume.hack_volume", "type": "bar", "xsrc": "hackathon_test:98:e24e65", "ysrc": "hackathon_test:98:be4e40", "xaxis": "x", "yaxis": "y", "marker": { "color": "rgb(204, 97, 176)", "pattern": { "shape": "" } }, "showlegend": true, "legendgroup": "aws_ebs_volume.hack_volume", "offsetgroup": "aws_ebs_volume.hack_volume", "orientation": "v", "textposition": "auto", "hovertemplate": "Resource=%{x}<br>Monthly Cost ($)=%{y}<extra></extra>", "alignmentgroup": "True" }, { "type": "table", "cells": { "fill": { "colorsrc": "hackathon_test:98:172aa1" }, "font": { "size": 11 }, "align": "center", "valuessrc": "hackathon_test:98:4c7b18" }, "domain": { "x": [ 0.0, 1.0 ], "y": [ 0.0, 0.2976 ] }, "header": { "fill": { "color": "lightgrey" }, "font": { "size": 12, "color": "black" }, "align": "center", "valuessrc": "hackathon_test:98:be7414" } } ], "layout": { "title": { "text": "Monthly Infracost Breakdown per Resource" }, "width": 1200, "xaxis": { "anchor": "y", "domain": [ 0.0, 1.0 ] }, "yaxis": { "anchor": "x", "domain": [ 0.3676, 1.0 ] }, "height": 900, "template": { "data": { "table": [ { "type": "table", "cells": { "fill": { "color": "#000038" }, "font": { "color": "#000037" }, "line": { "color": "#000039" } }, "header": { "fill": { "color": "#000040" }, "font": { "color": "#000036" }, "line": { "color": "#000039" } } } ], "icicle": [ { "type": "icicle", "textfont": { "color": "white" } } ], "sankey": [ { "type": "sankey", "textfont": { "color": "#000036" } } ], "contour": [ { "type": "contour", "colorscale": [ [ 0.0, "#000011" ], [ 0.1111111111111111, "#000012" ], [ 0.2222222222222222, "#000013" ], [ 0.3333333333333333, "#000014" ], [ 0.4444444444444444, "#000015" ], [ 0.5555555555555556, "#000016" ], [ 0.6666666666666666, "#000017" ], [ 0.7777777777777778, "#000018" ], [ 0.8888888888888888, "#000019" ], [ 1.0, "#000020" ] ] } ], "heatmap": [ { "type": "heatmap", "colorscale": [ [ 0.0, "#000011" ], [ 0.1111111111111111, "#000012" ], [ 0.2222222222222222, "#000013" ], [ 0.3333333333333333, "#000014" ], [ 0.4444444444444444, "#000015" ], [ 0.5555555555555556, "#000016" ], [ 0.6666666666666666, "#000017" ], [ 0.7777777777777778, "#000018" ], [ 0.8888888888888888, "#000019" ], [ 1.0, "#000020" ] ] } ], "scatter": [ { "type": "scatter", "marker": { "line": { "width": 0 } } } ], "waterfall": [ { "type": "waterfall", "totals": { "marker": { "color": "#000034" } }, "connector": { "line": { "color": "#000036", "width": 2 } }, "decreasing": { "marker": { "color": "#000033" } }, "increasing": { "marker": { "color": "#000032" } } } ], "candlestick": [ { "type": "candlestick", "decreasing": { "line": { "color": "#000033" } }, "increasing": { "line": { "color": "#000032" } } } ], "histogram2d": [ { "type": "histogram2d", "colorscale": [ [ 0.0, "#000011" ], [ 0.1111111111111111, "#000012" ], [ 0.2222222222222222, "#000013" ], [ 0.3333333333333333, "#000014" ], [ 0.4444444444444444, "#000015" ], [ 0.5555555555555556, "#000016" ], [ 0.6666666666666666, "#000017" ], [ 0.7777777777777778, "#000018" ], [ 0.8888888888888888, "#000019" ], [ 1.0, "#000020" ] ] } ], "contourcarpet": [ { "type": "contourcarpet", "colorscale": [ [ 0.0, "#000011" ], [ 0.1111111111111111, "#000012" ], [ 0.2222222222222222, "#000013" ], [ 0.3333333333333333, "#000014" ], [ 0.4444444444444444, "#000015" ], [ 0.5555555555555556, "#000016" ], [ 0.6666666666666666, "#000017" ], [ 0.7777777777777778, "#000018" ], [ 0.8888888888888888, "#000019" ], [ 1.0, "#000020" ] ] } ] }, "layout": { "colorway": [ "#000001", "#000002", "#000003", "#000004", "#000005", "#000006", "#000007", "#000008", "#000009", "#000010" ], "coloraxis": { "colorscale": [ [ 0.0, "#000011" ], [ 0.1111111111111111, "#000012" ], [ 0.2222222222222222, "#000013" ], [ 0.3333333333333333, "#000014" ], [ 0.4444444444444444, "#000015" ], [ 0.5555555555555556, "#000016" ], [ 0.6666666666666666, "#000017" ], [ 0.7777777777777778, "#000018" ], [ 0.8888888888888888, "#000019" ], [ 1.0, "#000020" ] ] }, "colorscale": { "diverging": [ [ 0.0, "#000021" ], [ 0.1, "#000022" ], [ 0.2, "#000023" ], [ 0.3, "#000024" ], [ 0.4, "#000025" ], [ 0.5, "#000026" ], [ 0.6, "#000027" ], [ 0.7, "#000028" ], [ 0.8, "#000029" ], [ 0.9, "#000030" ], [ 1.0, "#000031" ] ], "sequential": [ [ 0.0, "#000011" ], [ 0.1111111111111111, "#000012" ], [ 0.2222222222222222, "#000013" ], [ 0.3333333333333333, "#000014" ], [ 0.4444444444444444, "#000015" ], [ 0.5555555555555556, "#000016" ], [ 0.6666666666666666, "#000017" ], [ 0.7777777777777778, "#000018" ], [ 0.8888888888888888, "#000019" ], [ 1.0, "#000020" ] ], "sequentialminus": [ [ 0.0, "#000011" ], [ 0.1111111111111111, "#000012" ], [ 0.2222222222222222, "#000013" ], [ 0.3333333333333333, "#000014" ], [ 0.4444444444444444, "#000015" ], [ 0.5555555555555556, "#000016" ], [ 0.6666666666666666, "#000017" ], [ 0.7777777777777778, "#000018" ], [ 0.8888888888888888, "#000019" ], [ 1.0, "#000020" ] ] } } }, "plot_bgcolor": "rgba(245,245,245,1)", "paper_bgcolor": "rgba(245,245,245,1)" } }, "height": 900, "width": 1200, "user": { "profile_url": "https://chart-studio.plotly.com/~hackathon_test", "avatar_url": "https://storage.googleapis.com/plotly-prod-profiles/21.jpg", "background_url": "https://storage.googleapis.com/plotly-prod-profiles/bg-7.jpg", "bio": "", "nickname": "", "website": "", "stream_tokens": null, "feature_set_id": null, "csrf_token": null, "date_joined": "2025-09-16 02:59:33", "mapbox_access_tokens": null, "has_password": null, "username": "hackathon_test", "email": null, "is_active": null, "readonly": null, "is_dash_creator": null, "dash_created_count": null, "is_chart_creator": null, "charts_created_count": null } }, { "creation_time": "2025-09-16T04:38:32.401076Z", "comments": { "results": [], "count": 0 }, "parented": true, "embed_url": "https://chart-studio.plotly.com/~hackathon_test/105.embed", "fid": "hackathon_test:105", "filename": "infracost-graph-table-1757997504", "filetype": "plot", "img_url": "https://storage.googleapis.com/plotly-prod-images/hackathon_test/105/9_6O8MCV6VQ9FENFS5FI49YYCOIZOGND.png", "image_urls": { "default": "https://storage.googleapis.com/plotly-prod-images/hackathon_test/105/2_DW6SZBXJCVQFEXDHMW2XFBWDLVIL8I.png", "block-thumb": "https://storage.googleapis.com/plotly-prod-images/hackathon_test/105/8_OU85U5SUWF7ILTZD2GSOX5P868KC3H.png", "list-thumb": "https://storage.googleapis.com/plotly-prod-images/hackathon_test/105/9_6O8MCV6VQ9FENFS5FI49YYCOIZOGND.png" }, "api_urls": { "files": "https://api.plotly.com/v2/files/hackathon_test:105", "plots": "https://api.plotly.com/v2/plots/hackathon_test:105", "parent": "https://api.plotly.com/v2/folders/home?user=hackathon_test" }, "owner": "hackathon_test", "parent": -1, "preview": "", "referencers": [], "references": [], "title": "", "views": 0, "web_url": "https://chart-studio.plotly.com/~hackathon_test/105/", "world_readable": true, "date_modified": "2025-09-16T04:38:33.348Z", "stars": { "results": [], "count": 0 }, "collaborators": { "results": [], "count": 0 }, "subfolder_count": null, "refresh_interval": null, "organize_view_url": "https://chart-studio.plotly.com/~hackathon_test/105/", "current_user_permission": "read", "is_theme": null, "is_template": null, "autosize": true, "caption": "", "figure": { "data": [ { "name": "aws_lb.hack_lb", "type": "bar", "xsrc": "hackathon_test:95:ebe51b", "ysrc": "hackathon_test:95:dca5fb", "xaxis": "x", "yaxis": "y", "marker": { "color": "rgb(229, 134, 6)", "pattern": { "shape": "" } }, "showlegend": true, "legendgroup": "aws_lb.hack_lb", "offsetgroup": "aws_lb.hack_lb", "orientation": "v", "textposition": "auto", "hovertemplate": "Resource=%{x}<br>Monthly Cost ($)=%{y}<extra></extra>", "alignmentgroup": "True" }, { "name": "aws_db_instance.hack_db", "type": "bar", "xsrc": "hackathon_test:95:21a1c1", "ysrc": "hackathon_test:95:96913d", "xaxis": "x", "yaxis": "y", "marker": { "color": "rgb(93, 105, 177)", "pattern": { "shape": "" } }, "showlegend": true, "legendgroup": "aws_db_instance.hack_db", "offsetgroup": "aws_db_instance.hack_db", "orientation": "v", "textposition": "auto", "hovertemplate": "Resource=%{x}<br>Monthly Cost ($)=%{y}<extra></extra>", "alignmentgroup": "True" }, { "name": "aws_instance.hack_vm", "type": "bar", "xsrc": "hackathon_test:95:878109", "ysrc": "hackathon_test:95:550c99", "xaxis": "x", "yaxis": "y", "marker": { "color": "rgb(82, 188, 163)", "pattern": { "shape": "" } }, "showlegend": true, "legendgroup": "aws_instance.hack_vm", "offsetgroup": "aws_instance.hack_vm", "orientation": "v", "textposition": "auto", "hovertemplate": "Resource=%{x}<br>Monthly Cost ($)=%{y}<extra></extra>", "alignmentgroup": "True" }, { "name": "aws_instance.hack_vm2", "type": "bar", "xsrc": "hackathon_test:95:330639", "ysrc": "hackathon_test:95:24fa16", "xaxis": "x", "yaxis": "y", "marker": { "color": "rgb(153, 201, 69)", "pattern": { "shape": "" } }, "showlegend": true, "legendgroup": "aws_instance.hack_vm2", "offsetgroup": "aws_instance.hack_vm2", "orientation": "v", "textposition": "auto", "hovertemplate": "Resource=%{x}<br>Monthly Cost ($)=%{y}<extra></extra>", "alignmentgroup": "True" }, { "name": "aws_ebs_volume.hack_volume", "type": "bar", "xsrc": "hackathon_test:95:6c26ad", "ysrc": "hackathon_test:95:e6dcbd", "xaxis": "x", "yaxis": "y", "marker": { "color": "rgb(204, 97, 176)", "pattern": { "shape": "" } }, "showlegend": true, "legendgroup": "aws_ebs_volume.hack_volume", "offsetgroup": "aws_ebs_volume.hack_volume", "orientation": "v", "textposition": "auto", "hovertemplate": "Resource=%{x}<br>Monthly Cost ($)=%{y}<extra></extra>", "alignmentgroup": "True" }, { "type": "table", "cells": { "fill": { "colorsrc": "hackathon_test:95:258c0d" }, "font": { "size": 11 }, "align": "center", "valuessrc": "hackathon_test:95:45137b" }, "domain": { "x": [ 0.0, 1.0 ], "y": [ 0.0, 0.2976 ] }, "header": { "fill": { "color": "lightgrey" }, "font": { "size": 12, "color": "black" }, "align": "center", "valuessrc": "hackathon_test:95:8497c9" } } ], "layout": { "title": { "text": "Monthly Infracost Breakdown per Resource" }, "width": 1200, "xaxis": { "anchor": "y", "domain": [ 0.0, 1.0 ] }, "yaxis": { "anchor": "x", "domain": [ 0.3676, 1.0 ] }, "height": 900, "template": { "data": { "table": [ { "type": "table", "cells": { "fill": { "color": "#000038" }, "font": { "color": "#000037" }, "line": { "color": "#000039" } }, "header": { "fill": { "color": "#000040" }, "font": { "color": "#000036" }, "line": { "color": "#000039" } } } ], "icicle": [ { "type": "icicle", "textfont": { "color": "white" } } ], "sankey": [ { "type": "sankey", "textfont": { "color": "#000036" } } ], "contour": [ { "type": "contour", "colorscale": [ [ 0.0, "#000011" ], [ 0.1111111111111111, "#000012" ], [ 0.2222222222222222, "#000013" ], [ 0.3333333333333333, "#000014" ], [ 0.4444444444444444, "#000015" ], [ 0.5555555555555556, "#000016" ], [ 0.6666666666666666, "#000017" ], [ 0.7777777777777778, "#000018" ], [ 0.8888888888888888, "#000019" ], [ 1.0, "#000020" ] ] } ], "heatmap": [ { "type": "heatmap", "colorscale": [ [ 0.0, "#000011" ], [ 0.1111111111111111, "#000012" ], [ 0.2222222222222222, "#000013" ], [ 0.3333333333333333, "#000014" ], [ 0.4444444444444444, "#000015" ], [ 0.5555555555555556, "#000016" ], [ 0.6666666666666666, "#000017" ], [ 0.7777777777777778, "#000018" ], [ 0.8888888888888888, "#000019" ], [ 1.0, "#000020" ] ] } ], "scatter": [ { "type": "scatter", "marker": { "line": { "width": 0 } } } ], "waterfall": [ { "type": "waterfall", "totals": { "marker": { "color": "#000034" } }, "connector": { "line": { "color": "#000036", "width": 2 } }, "decreasing": { "marker": { "color": "#000033" } }, "increasing": { "marker": { "color": "#000032" } } } ], "candlestick": [ { "type": "candlestick", "decreasing": { "line": { "color": "#000033" } }, "increasing": { "line": { "color": "#000032" } } } ], "histogram2d": [ { "type": "histogram2d", "colorscale": [ [ 0.0, "#000011" ], [ 0.1111111111111111, "#000012" ], [ 0.2222222222222222, "#000013" ], [ 0.3333333333333333, "#000014" ], [ 0.4444444444444444, "#000015" ], [ 0.5555555555555556, "#000016" ], [ 0.6666666666666666, "#000017" ], [ 0.7777777777777778, "#000018" ], [ 0.8888888888888888, "#000019" ], [ 1.0, "#000020" ] ] } ], "contourcarpet": [ { "type": "contourcarpet", "colorscale": [ [ 0.0, "#000011" ], [ 0.1111111111111111, "#000012" ], [ 0.2222222222222222, "#000013" ], [ 0.3333333333333333, "#000014" ], [ 0.4444444444444444, "#000015" ], [ 0.5555555555555556, "#000016" ], [ 0.6666666666666666, "#000017" ], [ 0.7777777777777778, "#000018" ], [ 0.8888888888888888, "#000019" ], [ 1.0, "#000020" ] ] } ] }, "layout": { "colorway": [ "#000001", "#000002", "#000003", "#000004", "#000005", "#000006", "#000007", "#000008", "#000009", "#000010" ], "coloraxis": { "colorscale": [ [ 0.0, "#000011" ], [ 0.1111111111111111, "#000012" ], [ 0.2222222222222222, "#000013" ], [ 0.3333333333333333, "#000014" ], [ 0.4444444444444444, "#000015" ], [ 0.5555555555555556, "#000016" ], [ 0.6666666666666666, "#000017" ], [ 0.7777777777777778, "#000018" ], [ 0.8888888888888888, "#000019" ], [ 1.0, "#000020" ] ] }, "colorscale": { "diverging": [ [ 0.0, "#000021" ], [ 0.1, "#000022" ], [ 0.2, "#000023" ], [ 0.3, "#000024" ], [ 0.4, "#000025" ], [ 0.5, "#000026" ], [ 0.6, "#000027" ], [ 0.7, "#000028" ], [ 0.8, "#000029" ], [ 0.9, "#000030" ], [ 1.0, "#000031" ] ], "sequential": [ [ 0.0, "#000011" ], [ 0.1111111111111111, "#000012" ], [ 0.2222222222222222, "#000013" ], [ 0.3333333333333333, "#000014" ], [ 0.4444444444444444, "#000015" ], [ 0.5555555555555556, "#000016" ], [ 0.6666666666666666, "#000017" ], [ 0.7777777777777778, "#000018" ], [ 0.8888888888888888, "#000019" ], [ 1.0, "#000020" ] ], "sequentialminus": [ [ 0.0, "#000011" ], [ 0.1111111111111111, "#000012" ], [ 0.2222222222222222, "#000013" ], [ 0.3333333333333333, "#000014" ], [ 0.4444444444444444, "#000015" ], [ 0.5555555555555556, "#000016" ], [ 0.6666666666666666, "#000017" ], [ 0.7777777777777778, "#000018" ], [ 0.8888888888888888, "#000019" ], [ 1.0, "#000020" ] ] } } }, "plot_bgcolor": "rgba(245,245,245,1)", "paper_bgcolor": "rgba(245,245,245,1)" } }, "height": 900, "width": 1200, "user": { "profile_url": "https://chart-studio.plotly.com/~hackathon_test", "avatar_url": "https://storage.googleapis.com/plotly-prod-profiles/21.jpg", "background_url": "https://storage.googleapis.com/plotly-prod-profiles/bg-7.jpg", "bio": "", "nickname": "", "website": "", "stream_tokens": null, "feature_set_id": null, "csrf_token": null, "date_joined": "2025-09-16 02:59:33", "mapbox_access_tokens": null, "has_password": null, "username": "hackathon_test", "email": null, "is_active": null, "readonly": null, "is_dash_creator": null, "dash_created_count": null, "is_chart_creator": null, "charts_created_count": null } }, { "creation_time": "2025-09-16T04:38:31.831463Z", "comments": { "results": [], "count": 0 }, "parented": true, "embed_url": "https://chart-studio.plotly.com/~hackathon_test/103.embed", "fid": "hackathon_test:103", "filename": "infracost-graph-table-1757997503", "filetype": "plot", "img_url": "https://storage.googleapis.com/plotly-prod-images/hackathon_test/103/9_792YEOC2HJIHPICPX9D75UNP0QHRBB.png", "image_urls": { "default": "https://storage.googleapis.com/plotly-prod-images/hackathon_test/103/2_637JOV4N2VAZLT536G88SY9KPCWS6F.png", "block-thumb": "https://storage.googleapis.com/plotly-prod-images/hackathon_test/103/8_ZJDGGTW76SBTSJ1EK2HLPJ13DJDMMW.png", "list-thumb": "https://storage.googleapis.com/plotly-prod-images/hackathon_test/103/9_792YEOC2HJIHPICPX9D75UNP0QHRBB.png" }, "api_urls": { "files": "https://api.plotly.com/v2/files/hackathon_test:103", "plots": "https://api.plotly.com/v2/plots/hackathon_test:103", "parent": "https://api.plotly.com/v2/folders/home?user=hackathon_test" }, "owner": "hackathon_test", "parent": -1, "preview": "", "referencers": [], "references": [], "title": "", "views": 0, "web_url": "https://chart-studio.plotly.com/~hackathon_test/103/", "world_readable": true, "date_modified": "2025-09-16T04:38:33.089Z", "stars": { "results": [], "count": 0 }, "collaborators": { "results": [], "count": 0 }, "subfolder_count": null, "refresh_interval": null, "organize_view_url": "https://chart-studio.plotly.com/~hackathon_test/103/", "current_user_permission": "read", "is_theme": null, "is_template": null, "autosize": true, "caption": "", "figure": { "data": [ { "name": "aws_lb.hack_lb", "type": "bar", "xsrc": "hackathon_test:94:758867", "ysrc": "hackathon_test:94:2c1b29", "xaxis": "x", "yaxis": "y", "marker": { "color": "rgb(229, 134, 6)", "pattern": { "shape": "" } }, "showlegend": true, "legendgroup": "aws_lb.hack_lb", "offsetgroup": "aws_lb.hack_lb", "orientation": "v", "textposition": "auto", "hovertemplate": "Resource=%{x}<br>Monthly Cost ($)=%{y}<extra></extra>", "alignmentgroup": "True" }, { "name": "aws_db_instance.hack_db", "type": "bar", "xsrc": "hackathon_test:94:6ef20c", "ysrc": "hackathon_test:94:4e9859", "xaxis": "x", "yaxis": "y", "marker": { "color": "rgb(93, 105, 177)", "pattern": { "shape": "" } }, "showlegend": true, "legendgroup": "aws_db_instance.hack_db", "offsetgroup": "aws_db_instance.hack_db", "orientation": "v", "textposition": "auto", "hovertemplate": "Resource=%{x}<br>Monthly Cost ($)=%{y}<extra></extra>", "alignmentgroup": "True" }, { "name": "aws_instance.hack_vm", "type": "bar", "xsrc": "hackathon_test:94:76694d", "ysrc": "hackathon_test:94:9afed7", "xaxis": "x", "yaxis": "y", "marker": { "color": "rgb(82, 188, 163)", "pattern": { "shape": "" } }, "showlegend": true, "legendgroup": "aws_instance.hack_vm", "offsetgroup": "aws_instance.hack_vm", "orientation": "v", "textposition": "auto", "hovertemplate": "Resource=%{x}<br>Monthly Cost ($)=%{y}<extra></extra>", "alignmentgroup": "True" }, { "name": "aws_instance.hack_vm2", "type": "bar", "xsrc": "hackathon_test:94:52cffb", "ysrc": "hackathon_test:94:1cdf91", "xaxis": "x", "yaxis": "y", "marker": { "color": "rgb(153, 201, 69)", "pattern": { "shape": "" } }, "showlegend": true, "legendgroup": "aws_instance.hack_vm2", "offsetgroup": "aws_instance.hack_vm2", "orientation": "v", "textposition": "auto", "hovertemplate": "Resource=%{x}<br>Monthly Cost ($)=%{y}<extra></extra>", "alignmentgroup": "True" }, { "name": "aws_ebs_volume.hack_volume", "type": "bar", "xsrc": "hackathon_test:94:48d82a", "ysrc": "hackathon_test:94:6a3ddd", "xaxis": "x", "yaxis": "y", "marker": { "color": "rgb(204, 97, 176)", "pattern": { "shape": "" } }, "showlegend": true, "legendgroup": "aws_ebs_volume.hack_volume", "offsetgroup": "aws_ebs_volume.hack_volume", "orientation": "v", "textposition": "auto", "hovertemplate": "Resource=%{x}<br>Monthly Cost ($)=%{y}<extra></extra>", "alignmentgroup": "True" }, { "type": "table", "cells": { "fill": { "colorsrc": "hackathon_test:94:de03a1" }, "font": { "size": 11 }, "align": "center", "valuessrc": "hackathon_test:94:974c9e" }, "domain": { "x": [ 0.0, 1.0 ], "y": [ 0.0, 0.2976 ] }, "header": { "fill": { "color": "lightgrey" }, "font": { "size": 12, "color": "black" }, "align": "center", "valuessrc": "hackathon_test:94:681abd" } } ], "layout": { "title": { "text": "Monthly Infracost Breakdown per Resource" }, "width": 1200, "xaxis": { "anchor": "y", "domain": [ 0.0, 1.0 ] }, "yaxis": { "anchor": "x", "domain": [ 0.3676, 1.0 ] }, "height": 900, "template": { "data": { "table": [ { "type": "table", "cells": { "fill": { "color": "#000038" }, "font": { "color": "#000037" }, "line": { "color": "#000039" } }, "header": { "fill": { "color": "#000040" }, "font": { "color": "#000036" }, "line": { "color": "#000039" } } } ], "icicle": [ { "type": "icicle", "textfont": { "color": "white" } } ], "sankey": [ { "type": "sankey", "textfont": { "color": "#000036" } } ], "contour": [ { "type": "contour", "colorscale": [ [ 0.0, "#000011" ], [ 0.1111111111111111, "#000012" ], [ 0.2222222222222222, "#000013" ], [ 0.3333333333333333, "#000014" ], [ 0.4444444444444444, "#000015" ], [ 0.5555555555555556, "#000016" ], [ 0.6666666666666666, "#000017" ], [ 0.7777777777777778, "#000018" ], [ 0.8888888888888888, "#000019" ], [ 1.0, "#000020" ] ] } ], "heatmap": [ { "type": "heatmap", "colorscale": [ [ 0.0, "#000011" ], [ 0.1111111111111111, "#000012" ], [ 0.2222222222222222, "#000013" ], [ 0.3333333333333333, "#000014" ], [ 0.4444444444444444, "#000015" ], [ 0.5555555555555556, "#000016" ], [ 0.6666666666666666, "#000017" ], [ 0.7777777777777778, "#000018" ], [ 0.8888888888888888, "#000019" ], [ 1.0, "#000020" ] ] } ], "scatter": [ { "type": "scatter", "marker": { "line": { "width": 0 } } } ], "waterfall": [ { "type": "waterfall", "totals": { "marker": { "color": "#000034" } }, "connector": { "line": { "color": "#000036", "width": 2 } }, "decreasing": { "marker": { "color": "#000033" } }, "increasing": { "marker": { "color": "#000032" } } } ], "candlestick": [ { "type": "candlestick", "decreasing": { "line": { "color": "#000033" } }, "increasing": { "line": { "color": "#000032" } } } ], "histogram2d": [ { "type": "histogram2d", "colorscale": [ [ 0.0, "#000011" ], [ 0.1111111111111111, "#000012" ], [ 0.2222222222222222, "#000013" ], [ 0.3333333333333333, "#000014" ], [ 0.4444444444444444, "#000015" ], [ 0.5555555555555556, "#000016" ], [ 0.6666666666666666, "#000017" ], [ 0.7777777777777778, "#000018" ], [ 0.8888888888888888, "#000019" ], [ 1.0, "#000020" ] ] } ], "contourcarpet": [ { "type": "contourcarpet", "colorscale": [ [ 0.0, "#000011" ], [ 0.1111111111111111, "#000012" ], [ 0.2222222222222222, "#000013" ], [ 0.3333333333333333, "#000014" ], [ 0.4444444444444444, "#000015" ], [ 0.5555555555555556, "#000016" ], [ 0.6666666666666666, "#000017" ], [ 0.7777777777777778, "#000018" ], [ 0.8888888888888888, "#000019" ], [ 1.0, "#000020" ] ] } ] }, "layout": { "colorway": [ "#000001", "#000002", "#000003", "#000004", "#000005", "#000006", "#000007", "#000008", "#000009", "#000010" ], "coloraxis": { "colorscale": [ [ 0.0, "#000011" ], [ 0.1111111111111111, "#000012" ], [ 0.2222222222222222, "#000013" ], [ 0.3333333333333333, "#000014" ], [ 0.4444444444444444, "#000015" ], [ 0.5555555555555556, "#000016" ], [ 0.6666666666666666, "#000017" ], [ 0.7777777777777778, "#000018" ], [ 0.8888888888888888, "#000019" ], [ 1.0, "#000020" ] ] }, "colorscale": { "diverging": [ [ 0.0, "#000021" ], [ 0.1, "#000022" ], [ 0.2, "#000023" ], [ 0.3, "#000024" ], [ 0.4, "#000025" ], [ 0.5, "#000026" ], [ 0.6, "#000027" ], [ 0.7, "#000028" ], [ 0.8, "#000029" ], [ 0.9, "#000030" ], [ 1.0, "#000031" ] ], "sequential": [ [ 0.0, "#000011" ], [ 0.1111111111111111, "#000012" ], [ 0.2222222222222222, "#000013" ], [ 0.3333333333333333, "#000014" ], [ 0.4444444444444444, "#000015" ], [ 0.5555555555555556, "#000016" ], [ 0.6666666666666666, "#000017" ], [ 0.7777777777777778, "#000018" ], [ 0.8888888888888888, "#000019" ], [ 1.0, "#000020" ] ], "sequentialminus": [ [ 0.0, "#000011" ], [ 0.1111111111111111, "#000012" ], [ 0.2222222222222222, "#000013" ], [ 0.3333333333333333, "#000014" ], [ 0.4444444444444444, "#000015" ], [ 0.5555555555555556, "#000016" ], [ 0.6666666666666666, "#000017" ], [ 0.7777777777777778, "#000018" ], [ 0.8888888888888888, "#000019" ], [ 1.0, "#000020" ] ] } } }, "plot_bgcolor": "rgba(245,245,245,1)", "paper_bgcolor": "rgba(245,245,245,1)" } }, "height": 900, "width": 1200, "user": { "profile_url": "https://chart-studio.plotly.com/~hackathon_test", "avatar_url": "https://storage.googleapis.com/plotly-prod-profiles/21.jpg", "background_url": "https://storage.googleapis.com/plotly-prod-profiles/bg-7.jpg", "bio": "", "nickname": "", "website": "", "stream_tokens": null, "feature_set_id": null, "csrf_token": null, "date_joined": "2025-09-16 02:59:33", "mapbox_access_tokens": null, "has_password": null, "username": "hackathon_test", "email": null, "is_active": null, "readonly": null, "is_dash_creator": null, "dash_created_count": null, "is_chart_creator": null, "charts_created_count": null } } ] }
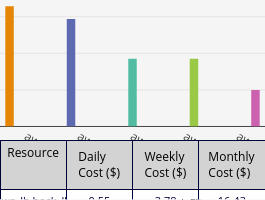
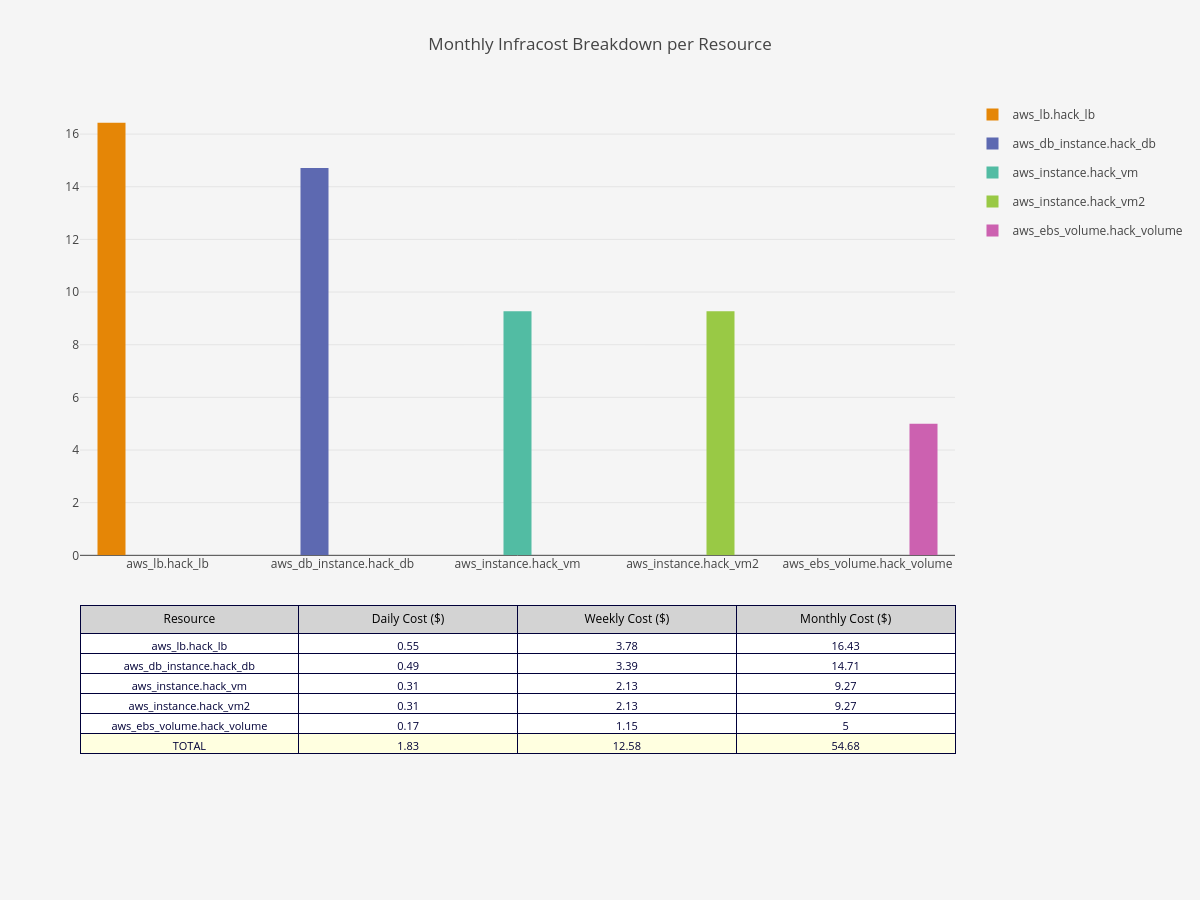