Plots List
Plots
This endpoint handles manipulation of Plotly plot files.
Reference
Authorization
Any user with or without a Plotly account may view public plots. For private plots, see authentication.
Actions
list
Listing all public plots can be done via a GET request to this endpoint.
By default, plots will be listed in order of date created. The order_by
query parameter is accepted at this endpoint. Currently, only ordering by
views is supported. It is possible to filter the plots by quality
with min_quality or max_quality as query parameter.
Example:
// GET https://api.plotly.com/v2/plots/ ---> 200

// GET https://api.plotly.com/v2/plots/?order_by=-views ---> 200

// GET https://api.plotly.com/v2/plots/?min_quality=5 ---> 200

// GET https://api.plotly.com/v2/plots/?max_quality=5 ---> 200
feed
Listing all handpicked feed plots can be done via a GET request to this endpoint. By default, plots will be listed in a random order.
Example:
// GET https://api.plotly.com/v2/plots/feed ---> 200
create
You can create new plot resources here. The only required field is 'figure'. Currently, the figure is restricted to only contain references to grid data. That is, this will fail if raw data arrays are passed in. To create and manipulate underlying grids for plots, see the grids endpoint.
Example:
// This fails because a figure field is required.
// POST https://api.plotly.com/v2/plots ---> 400 Bad Request
{}

// This fails because the figure has raw data
//POST https://api.plotly.com/v2/plots ---> 400 Bad Request
{
    "figure": {"data": [{"y": ['this', 'is', 'raw', 'data']}]}
}

// This succeeds because the figure has src keys, not raw data.
//POST https://api.plotly.com/v2/plots ---> 200 OK
{
    "figure": {"data": [{"ysrc": "sven:88:u8nd62"}]}
}
When creating a grid, you can optionally specify a source_fid to specify where a plot has come from:
- source_fid: the fid of a plot that was copied (and presumably edited) to produce this one
detail
There is a lot of meta information stored about plot files including filename, title, share_url, and content_url to name a few.
This information can only be reached with a GET to this endpoint.
Example:
// GET https://api.plotly.com/v2/plots/iheartgraphs:90
content
The contents of a plot can be downloaded via the content resource. The plot
content contains referenced grid/column data by default. If you wish to
return the raw grid/column data, the inline_data=true query must be included
in the request url. The Content-Type header will be appropriately set for the
response body.
Alternatively, you can set ?map_data=unreadable to append a mapping of
sources to data that belongs to grids which are unreadable for the
requestor. This is useful when you have read access to another users plot,
but that plot contains grid references which you don't have access to.
Examples:
// Returns referenced grid/column data
// GET https://api.plotly.com/v2/plots/iheartgraphs:90/content ---> 200 OK

// Returns full grid/column data
// GET https://api.plotly.com/v2/plots/iheartgraphs:90/content?inline_data=true ---> 200 OK

// Returns full grid/column data when requestor doesn't have permission
// to read the referenced grid.
// GET https://api.plotly.com/v2/plots/iheartgraphs:90/content?map_data=unreadable ---> 200 OK
GET /v2/plots?cursor=cD0yMDI1LTA5LTE2KzAzJTNBMjclM0EzNS4wMTE0NzIlMkIwMCUzQTAw&format=api
{ "next": "https://api.plotly.com/v2/plots?cursor=cD0yMDI1LTA5LTE2KzAyJTNBNTUlM0EzMC45ODI0MjAlMkIwMCUzQTAw&format=api", "previous": "https://api.plotly.com/v2/plots?cursor=cj0xJnA9MjAyNS0wOS0xNiswMyUzQTIzJTNBMjMuMDU3MzM5JTJCMDAlM0EwMA%3D%3D&format=api", "results": [ { "creation_time": "2025-09-16T03:23:23.057339Z", "comments": { "results": [], "count": 0 }, "parented": true, "embed_url": "https://chart-studio.plotly.com/~hackathon_test/33.embed", "fid": "hackathon_test:33", "filename": "infracost-combined", "filetype": "plot", "img_url": "https://storage.googleapis.com/plotly-prod-images/hackathon_test/33/9_H5HE0DREBYV9LSE028EOEOE8ES9S0W.png", "image_urls": { "default": "https://storage.googleapis.com/plotly-prod-images/hackathon_test/33/2_ZUVCHA38WHRY6Z8KHX5K3A8UU2I1HW.png", "block-thumb": "https://storage.googleapis.com/plotly-prod-images/hackathon_test/33/8_1FO1GMQ6TL60FWNN12GEGC1SRRBPEE.png", "list-thumb": "https://storage.googleapis.com/plotly-prod-images/hackathon_test/33/9_H5HE0DREBYV9LSE028EOEOE8ES9S0W.png" }, "api_urls": { "files": "https://api.plotly.com/v2/files/hackathon_test:33", "plots": "https://api.plotly.com/v2/plots/hackathon_test:33", "parent": "https://api.plotly.com/v2/folders/home?user=hackathon_test" }, "owner": "hackathon_test", "parent": -1, "preview": "", "referencers": [], "references": [], "title": "", "views": 0, "web_url": "https://chart-studio.plotly.com/~hackathon_test/33/", "world_readable": true, "date_modified": "2025-09-16T03:23:23.067Z", "stars": { "results": [], "count": 0 }, "collaborators": { "results": [], "count": 0 }, "subfolder_count": null, "refresh_interval": null, "organize_view_url": "https://chart-studio.plotly.com/~hackathon_test/33/", "current_user_permission": "read", "is_theme": null, "is_template": null, "autosize": true, "caption": "", "figure": { "data": [ { "name": "Monthly Cost", "type": "bar", "xsrc": "hackathon_test:32:ec230e", "ysrc": "hackathon_test:32:f1197f", "xaxis": "x", "yaxis": "y", "marker": { "colorsrc": "hackathon_test:32:88b745" } }, { "type": "table", "cells": { "fill": { "color": "white" }, "font": { "size": 11 }, "align": "center", "valuessrc": "hackathon_test:32:21ea44" }, "domain": { "x": [ 0.0, 1.0 ], "y": [ 0.0, 0.34 ] }, "header": { "fill": { "color": "lightgrey" }, "font": { "size": 12, "color": "black" }, "align": "center", "valuessrc": "hackathon_test:32:712745" } } ], "layout": { "width": 1200, "xaxis": { "anchor": "y", "domain": [ 0.0, 1.0 ], "tickangle": -30 }, "yaxis": { "anchor": "x", "domain": [ 0.49, 1.0 ] }, "height": 900, "legend": { "x": 1, "y": 1, "xanchor": "left", "yanchor": "top" }, "template": { "data": { "table": [ { "type": "table", "cells": { "fill": { "color": "#000038" }, "font": { "color": "#000037" }, "line": { "color": "#000039" } }, "header": { "fill": { "color": "#000040" }, "font": { "color": "#000036" }, "line": { "color": "#000039" } } } ], "icicle": [ { "type": "icicle", "textfont": { "color": "white" } } ], "sankey": [ { "type": "sankey", "textfont": { "color": "#000036" } } ], "contour": [ { "type": "contour", "colorscale": [ [ 0.0, "#000011" ], [ 0.1111111111111111, "#000012" ], [ 0.2222222222222222, "#000013" ], [ 0.3333333333333333, "#000014" ], [ 0.4444444444444444, "#000015" ], [ 0.5555555555555556, "#000016" ], [ 0.6666666666666666, "#000017" ], [ 0.7777777777777778, "#000018" ], [ 0.8888888888888888, "#000019" ], [ 1.0, "#000020" ] ] } ], "heatmap": [ { "type": "heatmap", "colorscale": [ [ 0.0, "#000011" ], [ 0.1111111111111111, "#000012" ], [ 0.2222222222222222, "#000013" ], [ 0.3333333333333333, "#000014" ], [ 0.4444444444444444, "#000015" ], [ 0.5555555555555556, "#000016" ], [ 0.6666666666666666, "#000017" ], [ 0.7777777777777778, "#000018" ], [ 0.8888888888888888, "#000019" ], [ 1.0, "#000020" ] ] } ], "scatter": [ { "type": "scatter", "marker": { "line": { "width": 0 } } } ], "waterfall": [ { "type": "waterfall", "totals": { "marker": { "color": "#000034" } }, "connector": { "line": { "color": "#000036", "width": 2 } }, "decreasing": { "marker": { "color": "#000033" } }, "increasing": { "marker": { "color": "#000032" } } } ], "candlestick": [ { "type": "candlestick", "decreasing": { "line": { "color": "#000033" } }, "increasing": { "line": { "color": "#000032" } } } ], "histogram2d": [ { "type": "histogram2d", "colorscale": [ [ 0.0, "#000011" ], [ 0.1111111111111111, "#000012" ], [ 0.2222222222222222, "#000013" ], [ 0.3333333333333333, "#000014" ], [ 0.4444444444444444, "#000015" ], [ 0.5555555555555556, "#000016" ], [ 0.6666666666666666, "#000017" ], [ 0.7777777777777778, "#000018" ], [ 0.8888888888888888, "#000019" ], [ 1.0, "#000020" ] ] } ], "contourcarpet": [ { "type": "contourcarpet", "colorscale": [ [ 0.0, "#000011" ], [ 0.1111111111111111, "#000012" ], [ 0.2222222222222222, "#000013" ], [ 0.3333333333333333, "#000014" ], [ 0.4444444444444444, "#000015" ], [ 0.5555555555555556, "#000016" ], [ 0.6666666666666666, "#000017" ], [ 0.7777777777777778, "#000018" ], [ 0.8888888888888888, "#000019" ], [ 1.0, "#000020" ] ] } ] }, "layout": { "colorway": [ "#000001", "#000002", "#000003", "#000004", "#000005", "#000006", "#000007", "#000008", "#000009", "#000010" ], "coloraxis": { "colorscale": [ [ 0.0, "#000011" ], [ 0.1111111111111111, "#000012" ], [ 0.2222222222222222, "#000013" ], [ 0.3333333333333333, "#000014" ], [ 0.4444444444444444, "#000015" ], [ 0.5555555555555556, "#000016" ], [ 0.6666666666666666, "#000017" ], [ 0.7777777777777778, "#000018" ], [ 0.8888888888888888, "#000019" ], [ 1.0, "#000020" ] ] }, "colorscale": { "diverging": [ [ 0.0, "#000021" ], [ 0.1, "#000022" ], [ 0.2, "#000023" ], [ 0.3, "#000024" ], [ 0.4, "#000025" ], [ 0.5, "#000026" ], [ 0.6, "#000027" ], [ 0.7, "#000028" ], [ 0.8, "#000029" ], [ 0.9, "#000030" ], [ 1.0, "#000031" ] ], "sequential": [ [ 0.0, "#000011" ], [ 0.1111111111111111, "#000012" ], [ 0.2222222222222222, "#000013" ], [ 0.3333333333333333, "#000014" ], [ 0.4444444444444444, "#000015" ], [ 0.5555555555555556, "#000016" ], [ 0.6666666666666666, "#000017" ], [ 0.7777777777777778, "#000018" ], [ 0.8888888888888888, "#000019" ], [ 1.0, "#000020" ] ], "sequentialminus": [ [ 0.0, "#000011" ], [ 0.1111111111111111, "#000012" ], [ 0.2222222222222222, "#000013" ], [ 0.3333333333333333, "#000014" ], [ 0.4444444444444444, "#000015" ], [ 0.5555555555555556, "#000016" ], [ 0.6666666666666666, "#000017" ], [ 0.7777777777777778, "#000018" ], [ 0.8888888888888888, "#000019" ], [ 1.0, "#000020" ] ] } } }, "showlegend": false, "annotations": [ { "x": 0.5, "y": 1.0, "font": { "size": 16 }, "text": "Monthly Infracost Breakdown per Resource", "xref": "paper", "yref": "paper", "xanchor": "center", "yanchor": "bottom", "showarrow": false }, { "x": 0.5, "y": 0.34, "font": { "size": 16 }, "text": "Resource Cost Table", "xref": "paper", "yref": "paper", "xanchor": "center", "yanchor": "bottom", "showarrow": false } ], "plot_bgcolor": "rgba(245,245,245,1)", "paper_bgcolor": "rgba(245,245,245,1)" } }, "height": 900, "width": 1200, "user": { "profile_url": "https://chart-studio.plotly.com/~hackathon_test", "avatar_url": "https://storage.googleapis.com/plotly-prod-profiles/21.jpg", "background_url": "https://storage.googleapis.com/plotly-prod-profiles/bg-7.jpg", "bio": "", "nickname": "", "website": "", "stream_tokens": null, "feature_set_id": null, "csrf_token": null, "date_joined": "2025-09-16 02:59:33", "mapbox_access_tokens": null, "has_password": null, "username": "hackathon_test", "email": null, "is_active": null, "readonly": null, "is_dash_creator": null, "dash_created_count": null, "is_chart_creator": null, "charts_created_count": null } }, { "creation_time": "2025-09-16T03:20:25.705591Z", "comments": { "results": [], "count": 0 }, "parented": true, "embed_url": "https://chart-studio.plotly.com/~hackathon_test/27.embed", "fid": "hackathon_test:27", "filename": "infracost-table", "filetype": "plot", "img_url": "https://storage.googleapis.com/plotly-prod-images/hackathon_test/27/9_L45BUQIFZH0ZJYFIB73ILI02OS7ZQ3.png", "image_urls": { "default": "https://storage.googleapis.com/plotly-prod-images/hackathon_test/27/2_3YWMDGAFUXB9U05GG88K5PY37VWRNX.png", "block-thumb": "https://storage.googleapis.com/plotly-prod-images/hackathon_test/27/8_80TQ7KCWTSJO5MY2SA892AGTIQI52I.png", "list-thumb": "https://storage.googleapis.com/plotly-prod-images/hackathon_test/27/9_L45BUQIFZH0ZJYFIB73ILI02OS7ZQ3.png" }, "api_urls": { "files": "https://api.plotly.com/v2/files/hackathon_test:27", "plots": "https://api.plotly.com/v2/plots/hackathon_test:27", "parent": "https://api.plotly.com/v2/folders/home?user=hackathon_test" }, "owner": "hackathon_test", "parent": -1, "preview": "", "referencers": [], "references": [], "title": "", "views": 0, "web_url": "https://chart-studio.plotly.com/~hackathon_test/27/", "world_readable": true, "date_modified": "2025-09-16T03:20:39.476Z", "stars": { "results": [], "count": 0 }, "collaborators": { "results": [], "count": 0 }, "subfolder_count": null, "refresh_interval": null, "organize_view_url": "https://chart-studio.plotly.com/~hackathon_test/27/", "current_user_permission": "read", "is_theme": null, "is_template": null, "autosize": true, "caption": "", "figure": { "data": [ { "type": "table", "cells": { "fill": { "colorsrc": "hackathon_test:30:eb8630" }, "font": { "size": 11 }, "align": "center", "valuessrc": "hackathon_test:30:b17e79" }, "header": { "fill": { "color": "lightgrey" }, "font": { "size": 12, "color": "black" }, "align": "center", "valuessrc": "hackathon_test:30:1a5ec9" } } ], "layout": { "title": { "text": "Cost Summary per Resource" }, "width": 800, "margin": { "b": 20, "l": 20, "r": 20, "t": 40 }, "template": { "data": { "table": [ { "type": "table", "cells": { "fill": { "color": "#000038" }, "font": { "color": "#000037" }, "line": { "color": "#000039" } }, "header": { "fill": { "color": "#000040" }, "font": { "color": "#000036" }, "line": { "color": "#000039" } } } ], "icicle": [ { "type": "icicle", "textfont": { "color": "white" } } ], "sankey": [ { "type": "sankey", "textfont": { "color": "#000036" } } ], "contour": [ { "type": "contour", "colorscale": [ [ 0.0, "#000011" ], [ 0.1111111111111111, "#000012" ], [ 0.2222222222222222, "#000013" ], [ 0.3333333333333333, "#000014" ], [ 0.4444444444444444, "#000015" ], [ 0.5555555555555556, "#000016" ], [ 0.6666666666666666, "#000017" ], [ 0.7777777777777778, "#000018" ], [ 0.8888888888888888, "#000019" ], [ 1.0, "#000020" ] ] } ], "heatmap": [ { "type": "heatmap", "colorscale": [ [ 0.0, "#000011" ], [ 0.1111111111111111, "#000012" ], [ 0.2222222222222222, "#000013" ], [ 0.3333333333333333, "#000014" ], [ 0.4444444444444444, "#000015" ], [ 0.5555555555555556, "#000016" ], [ 0.6666666666666666, "#000017" ], [ 0.7777777777777778, "#000018" ], [ 0.8888888888888888, "#000019" ], [ 1.0, "#000020" ] ] } ], "scatter": [ { "type": "scatter", "marker": { "line": { "width": 0 } } } ], "waterfall": [ { "type": "waterfall", "totals": { "marker": { "color": "#000034" } }, "connector": { "line": { "color": "#000036", "width": 2 } }, "decreasing": { "marker": { "color": "#000033" } }, "increasing": { "marker": { "color": "#000032" } } } ], "candlestick": [ { "type": "candlestick", "decreasing": { "line": { "color": "#000033" } }, "increasing": { "line": { "color": "#000032" } } } ], "histogram2d": [ { "type": "histogram2d", "colorscale": [ [ 0.0, "#000011" ], [ 0.1111111111111111, "#000012" ], [ 0.2222222222222222, "#000013" ], [ 0.3333333333333333, "#000014" ], [ 0.4444444444444444, "#000015" ], [ 0.5555555555555556, "#000016" ], [ 0.6666666666666666, "#000017" ], [ 0.7777777777777778, "#000018" ], [ 0.8888888888888888, "#000019" ], [ 1.0, "#000020" ] ] } ], "contourcarpet": [ { "type": "contourcarpet", "colorscale": [ [ 0.0, "#000011" ], [ 0.1111111111111111, "#000012" ], [ 0.2222222222222222, "#000013" ], [ 0.3333333333333333, "#000014" ], [ 0.4444444444444444, "#000015" ], [ 0.5555555555555556, "#000016" ], [ 0.6666666666666666, "#000017" ], [ 0.7777777777777778, "#000018" ], [ 0.8888888888888888, "#000019" ], [ 1.0, "#000020" ] ] } ] }, "layout": { "colorway": [ "#000001", "#000002", "#000003", "#000004", "#000005", "#000006", "#000007", "#000008", "#000009", "#000010" ], "coloraxis": { "colorscale": [ [ 0.0, "#000011" ], [ 0.1111111111111111, "#000012" ], [ 0.2222222222222222, "#000013" ], [ 0.3333333333333333, "#000014" ], [ 0.4444444444444444, "#000015" ], [ 0.5555555555555556, "#000016" ], [ 0.6666666666666666, "#000017" ], [ 0.7777777777777778, "#000018" ], [ 0.8888888888888888, "#000019" ], [ 1.0, "#000020" ] ] }, "colorscale": { "diverging": [ [ 0.0, "#000021" ], [ 0.1, "#000022" ], [ 0.2, "#000023" ], [ 0.3, "#000024" ], [ 0.4, "#000025" ], [ 0.5, "#000026" ], [ 0.6, "#000027" ], [ 0.7, "#000028" ], [ 0.8, "#000029" ], [ 0.9, "#000030" ], [ 1.0, "#000031" ] ], "sequential": [ [ 0.0, "#000011" ], [ 0.1111111111111111, "#000012" ], [ 0.2222222222222222, "#000013" ], [ 0.3333333333333333, "#000014" ], [ 0.4444444444444444, "#000015" ], [ 0.5555555555555556, "#000016" ], [ 0.6666666666666666, "#000017" ], [ 0.7777777777777778, "#000018" ], [ 0.8888888888888888, "#000019" ], [ 1.0, "#000020" ] ], "sequentialminus": [ [ 0.0, "#000011" ], [ 0.1111111111111111, "#000012" ], [ 0.2222222222222222, "#000013" ], [ 0.3333333333333333, "#000014" ], [ 0.4444444444444444, "#000015" ], [ 0.5555555555555556, "#000016" ], [ 0.6666666666666666, "#000017" ], [ 0.7777777777777778, "#000018" ], [ 0.8888888888888888, "#000019" ], [ 1.0, "#000020" ] ] } } } } }, "height": null, "width": 800, "user": { "profile_url": "https://chart-studio.plotly.com/~hackathon_test", "avatar_url": "https://storage.googleapis.com/plotly-prod-profiles/21.jpg", "background_url": "https://storage.googleapis.com/plotly-prod-profiles/bg-7.jpg", "bio": "", "nickname": "", "website": "", "stream_tokens": null, "feature_set_id": null, "csrf_token": null, "date_joined": "2025-09-16 02:59:33", "mapbox_access_tokens": null, "has_password": null, "username": "hackathon_test", "email": null, "is_active": null, "readonly": null, "is_dash_creator": null, "dash_created_count": null, "is_chart_creator": null, "charts_created_count": null } }, { "creation_time": "2025-09-16T03:20:19.171731Z", "comments": { "results": [], "count": 0 }, "parented": true, "embed_url": "https://chart-studio.plotly.com/~hackathon_test/24.embed", "fid": "hackathon_test:24", "filename": "infracost-bar", "filetype": "plot", "img_url": "https://storage.googleapis.com/plotly-prod-images/hackathon_test/24/9_H4ENOM0JWS7W79UZMZ5XAAGUS3ZX9F.png", "image_urls": { "default": "https://storage.googleapis.com/plotly-prod-images/hackathon_test/24/2_L197EIMU2YAEPMP6YSVO5BNBPPAXSQ.png", "block-thumb": "https://storage.googleapis.com/plotly-prod-images/hackathon_test/24/8_SH065OQMP8NFDS62IWCD0ABIUV4LJT.png", "list-thumb": "https://storage.googleapis.com/plotly-prod-images/hackathon_test/24/9_H4ENOM0JWS7W79UZMZ5XAAGUS3ZX9F.png" }, "api_urls": { "files": "https://api.plotly.com/v2/files/hackathon_test:24", "plots": "https://api.plotly.com/v2/plots/hackathon_test:24", "parent": "https://api.plotly.com/v2/folders/home?user=hackathon_test" }, "owner": "hackathon_test", "parent": -1, "preview": "", "referencers": [], "references": [], "title": "", "views": 0, "web_url": "https://chart-studio.plotly.com/~hackathon_test/24/", "world_readable": true, "date_modified": "2025-09-16T03:20:38.779Z", "stars": { "results": [], "count": 0 }, "collaborators": { "results": [], "count": 0 }, "subfolder_count": null, "refresh_interval": null, "organize_view_url": "https://chart-studio.plotly.com/~hackathon_test/24/", "current_user_permission": "read", "is_theme": null, "is_template": null, "autosize": true, "caption": "", "figure": { "data": [ { "name": "aws_lb.hack_lb", "type": "bar", "xsrc": "hackathon_test:28:ca21a7", "ysrc": "hackathon_test:28:3b1795", "xaxis": "x", "yaxis": "y", "marker": { "color": "rgb(229, 134, 6)", "pattern": { "shape": "" } }, "showlegend": true, "legendgroup": "aws_lb.hack_lb", "offsetgroup": "aws_lb.hack_lb", "orientation": "v", "textposition": "auto", "hovertemplate": "Resource=%{x}<br>Monthly Cost ($)=%{y}<extra></extra>", "alignmentgroup": "True" }, { "name": "aws_db_instance.hack_db", "type": "bar", "xsrc": "hackathon_test:28:30ea44", "ysrc": "hackathon_test:28:67e14d", "xaxis": "x", "yaxis": "y", "marker": { "color": "rgb(93, 105, 177)", "pattern": { "shape": "" } }, "showlegend": true, "legendgroup": "aws_db_instance.hack_db", "offsetgroup": "aws_db_instance.hack_db", "orientation": "v", "textposition": "auto", "hovertemplate": "Resource=%{x}<br>Monthly Cost ($)=%{y}<extra></extra>", "alignmentgroup": "True" }, { "name": "aws_instance.hack_vm", "type": "bar", "xsrc": "hackathon_test:28:cb2e2e", "ysrc": "hackathon_test:28:90ab02", "xaxis": "x", "yaxis": "y", "marker": { "color": "rgb(82, 188, 163)", "pattern": { "shape": "" } }, "showlegend": true, "legendgroup": "aws_instance.hack_vm", "offsetgroup": "aws_instance.hack_vm", "orientation": "v", "textposition": "auto", "hovertemplate": "Resource=%{x}<br>Monthly Cost ($)=%{y}<extra></extra>", "alignmentgroup": "True" }, { "name": "aws_instance.hack_vm2", "type": "bar", "xsrc": "hackathon_test:28:edc619", "ysrc": "hackathon_test:28:3eeb7d", "xaxis": "x", "yaxis": "y", "marker": { "color": "rgb(153, 201, 69)", "pattern": { "shape": "" } }, "showlegend": true, "legendgroup": "aws_instance.hack_vm2", "offsetgroup": "aws_instance.hack_vm2", "orientation": "v", "textposition": "auto", "hovertemplate": "Resource=%{x}<br>Monthly Cost ($)=%{y}<extra></extra>", "alignmentgroup": "True" }, { "name": "aws_ebs_volume.hack_volume", "type": "bar", "xsrc": "hackathon_test:28:49ae8b", "ysrc": "hackathon_test:28:2c1eb2", "xaxis": "x", "yaxis": "y", "marker": { "color": "rgb(204, 97, 176)", "pattern": { "shape": "" } }, "showlegend": true, "legendgroup": "aws_ebs_volume.hack_volume", "offsetgroup": "aws_ebs_volume.hack_volume", "orientation": "v", "textposition": "auto", "hovertemplate": "Resource=%{x}<br>Monthly Cost ($)=%{y}<extra></extra>", "alignmentgroup": "True" } ], "layout": { "title": { "text": "Monthly Infracost Breakdown per Resource" }, "width": 1200, "xaxis": { "title": { "text": "Resource" }, "anchor": "y", "domain": [ 0.0, 1.0 ], "tickangle": -30, "categoryarray": [ "aws_lb.hack_lb", "aws_db_instance.hack_db", "aws_instance.hack_vm", "aws_instance.hack_vm2", "aws_ebs_volume.hack_volume" ], "categoryorder": "array" }, "yaxis": { "title": { "text": "Monthly Cost ($)" }, "anchor": "x", "domain": [ 0.0, 1.0 ] }, "legend": { "x": 1, "y": 1, "font": { "size": 10 }, "title": { "text": "Resource" }, "bgcolor": "rgba(255,255,255,0.6)", "xanchor": "left", "yanchor": "top", "bordercolor": "black", "borderwidth": 1, "orientation": "v", "tracegroupgap": 0 }, "barmode": "relative", "template": { "data": { "table": [ { "type": "table", "cells": { "fill": { "color": "#000038" }, "font": { "color": "#000037" }, "line": { "color": "#000039" } }, "header": { "fill": { "color": "#000040" }, "font": { "color": "#000036" }, "line": { "color": "#000039" } } } ], "icicle": [ { "type": "icicle", "textfont": { "color": "white" } } ], "sankey": [ { "type": "sankey", "textfont": { "color": "#000036" } } ], "contour": [ { "type": "contour", "colorscale": [ [ 0.0, "#000011" ], [ 0.1111111111111111, "#000012" ], [ 0.2222222222222222, "#000013" ], [ 0.3333333333333333, "#000014" ], [ 0.4444444444444444, "#000015" ], [ 0.5555555555555556, "#000016" ], [ 0.6666666666666666, "#000017" ], [ 0.7777777777777778, "#000018" ], [ 0.8888888888888888, "#000019" ], [ 1.0, "#000020" ] ] } ], "heatmap": [ { "type": "heatmap", "colorscale": [ [ 0.0, "#000011" ], [ 0.1111111111111111, "#000012" ], [ 0.2222222222222222, "#000013" ], [ 0.3333333333333333, "#000014" ], [ 0.4444444444444444, "#000015" ], [ 0.5555555555555556, "#000016" ], [ 0.6666666666666666, "#000017" ], [ 0.7777777777777778, "#000018" ], [ 0.8888888888888888, "#000019" ], [ 1.0, "#000020" ] ] } ], "scatter": [ { "type": "scatter", "marker": { "line": { "width": 0 } } } ], "waterfall": [ { "type": "waterfall", "totals": { "marker": { "color": "#000034" } }, "connector": { "line": { "color": "#000036", "width": 2 } }, "decreasing": { "marker": { "color": "#000033" } }, "increasing": { "marker": { "color": "#000032" } } } ], "candlestick": [ { "type": "candlestick", "decreasing": { "line": { "color": "#000033" } }, "increasing": { "line": { "color": "#000032" } } } ], "histogram2d": [ { "type": "histogram2d", "colorscale": [ [ 0.0, "#000011" ], [ 0.1111111111111111, "#000012" ], [ 0.2222222222222222, "#000013" ], [ 0.3333333333333333, "#000014" ], [ 0.4444444444444444, "#000015" ], [ 0.5555555555555556, "#000016" ], [ 0.6666666666666666, "#000017" ], [ 0.7777777777777778, "#000018" ], [ 0.8888888888888888, "#000019" ], [ 1.0, "#000020" ] ] } ], "contourcarpet": [ { "type": "contourcarpet", "colorscale": [ [ 0.0, "#000011" ], [ 0.1111111111111111, "#000012" ], [ 0.2222222222222222, "#000013" ], [ 0.3333333333333333, "#000014" ], [ 0.4444444444444444, "#000015" ], [ 0.5555555555555556, "#000016" ], [ 0.6666666666666666, "#000017" ], [ 0.7777777777777778, "#000018" ], [ 0.8888888888888888, "#000019" ], [ 1.0, "#000020" ] ] } ] }, "layout": { "colorway": [ "#000001", "#000002", "#000003", "#000004", "#000005", "#000006", "#000007", "#000008", "#000009", "#000010" ], "coloraxis": { "colorscale": [ [ 0.0, "#000011" ], [ 0.1111111111111111, "#000012" ], [ 0.2222222222222222, "#000013" ], [ 0.3333333333333333, "#000014" ], [ 0.4444444444444444, "#000015" ], [ 0.5555555555555556, "#000016" ], [ 0.6666666666666666, "#000017" ], [ 0.7777777777777778, "#000018" ], [ 0.8888888888888888, "#000019" ], [ 1.0, "#000020" ] ] }, "colorscale": { "diverging": [ [ 0.0, "#000021" ], [ 0.1, "#000022" ], [ 0.2, "#000023" ], [ 0.3, "#000024" ], [ 0.4, "#000025" ], [ 0.5, "#000026" ], [ 0.6, "#000027" ], [ 0.7, "#000028" ], [ 0.8, "#000029" ], [ 0.9, "#000030" ], [ 1.0, "#000031" ] ], "sequential": [ [ 0.0, "#000011" ], [ 0.1111111111111111, "#000012" ], [ 0.2222222222222222, "#000013" ], [ 0.3333333333333333, "#000014" ], [ 0.4444444444444444, "#000015" ], [ 0.5555555555555556, "#000016" ], [ 0.6666666666666666, "#000017" ], [ 0.7777777777777778, "#000018" ], [ 0.8888888888888888, "#000019" ], [ 1.0, "#000020" ] ], "sequentialminus": [ [ 0.0, "#000011" ], [ 0.1111111111111111, "#000012" ], [ 0.2222222222222222, "#000013" ], [ 0.3333333333333333, "#000014" ], [ 0.4444444444444444, "#000015" ], [ 0.5555555555555556, "#000016" ], [ 0.6666666666666666, "#000017" ], [ 0.7777777777777778, "#000018" ], [ 0.8888888888888888, "#000019" ], [ 1.0, "#000020" ] ] } } }, "plot_bgcolor": "rgba(245,245,245,1)", "paper_bgcolor": "rgba(245,245,245,1)" } }, "height": null, "width": 1200, "user": { "profile_url": "https://chart-studio.plotly.com/~hackathon_test", "avatar_url": "https://storage.googleapis.com/plotly-prod-profiles/21.jpg", "background_url": "https://storage.googleapis.com/plotly-prod-profiles/bg-7.jpg", "bio": "", "nickname": "", "website": "", "stream_tokens": null, "feature_set_id": null, "csrf_token": null, "date_joined": "2025-09-16 02:59:33", "mapbox_access_tokens": null, "has_password": null, "username": "hackathon_test", "email": null, "is_active": null, "readonly": null, "is_dash_creator": null, "dash_created_count": null, "is_chart_creator": null, "charts_created_count": null } }, { "creation_time": "2025-09-16T03:17:54.431339Z", "comments": { "results": [], "count": 0 }, "parented": true, "embed_url": "https://chart-studio.plotly.com/~hackathon_test/22.embed", "fid": "hackathon_test:22", "filename": "infracost-costs-1757992668", "filetype": "plot", "img_url": "https://storage.googleapis.com/plotly-prod-images/hackathon_test/22/9_37EFOOQZ0I3VEL1QQ83QF1JUMAYG2S.png", "image_urls": { "default": "https://storage.googleapis.com/plotly-prod-images/hackathon_test/22/2_11VBUKABC6LIH7DA9N92E9RCCXL3MS.png", "block-thumb": "https://storage.googleapis.com/plotly-prod-images/hackathon_test/22/8_3KJDTNMSUJHGF2X5TIFGOP3IXKM1HE.png", "list-thumb": "https://storage.googleapis.com/plotly-prod-images/hackathon_test/22/9_37EFOOQZ0I3VEL1QQ83QF1JUMAYG2S.png" }, "api_urls": { "files": "https://api.plotly.com/v2/files/hackathon_test:22", "plots": "https://api.plotly.com/v2/plots/hackathon_test:22", "parent": "https://api.plotly.com/v2/folders/home?user=hackathon_test" }, "owner": "hackathon_test", "parent": -1, "preview": "", "referencers": [], "references": [], "title": "", "views": 0, "web_url": "https://chart-studio.plotly.com/~hackathon_test/22/", "world_readable": true, "date_modified": "2025-09-16T03:17:54.441Z", "stars": { "results": [], "count": 0 }, "collaborators": { "results": [], "count": 0 }, "subfolder_count": null, "refresh_interval": null, "organize_view_url": "https://chart-studio.plotly.com/~hackathon_test/22/", "current_user_permission": "read", "is_theme": null, "is_template": null, "autosize": true, "caption": "", "figure": { "data": [ { "name": "aws_lb.hack_lb", "type": "bar", "xsrc": "hackathon_test:20:db00ed", "ysrc": "hackathon_test:20:ae978c", "xaxis": "x", "yaxis": "y", "marker": { "color": "rgb(229, 134, 6)", "pattern": { "shape": "" } }, "showlegend": true, "legendgroup": "aws_lb.hack_lb", "offsetgroup": "aws_lb.hack_lb", "orientation": "v", "textposition": "auto", "hovertemplate": "Resource=%{x}<br>Monthly Cost ($)=%{y}<extra></extra>", "alignmentgroup": "True" }, { "name": "aws_db_instance.hack_db", "type": "bar", "xsrc": "hackathon_test:20:b7a1b3", "ysrc": "hackathon_test:20:eb6a51", "xaxis": "x", "yaxis": "y", "marker": { "color": "rgb(93, 105, 177)", "pattern": { "shape": "" } }, "showlegend": true, "legendgroup": "aws_db_instance.hack_db", "offsetgroup": "aws_db_instance.hack_db", "orientation": "v", "textposition": "auto", "hovertemplate": "Resource=%{x}<br>Monthly Cost ($)=%{y}<extra></extra>", "alignmentgroup": "True" }, { "name": "aws_instance.hack_vm", "type": "bar", "xsrc": "hackathon_test:20:feea61", "ysrc": "hackathon_test:20:b57a6f", "xaxis": "x", "yaxis": "y", "marker": { "color": "rgb(82, 188, 163)", "pattern": { "shape": "" } }, "showlegend": true, "legendgroup": "aws_instance.hack_vm", "offsetgroup": "aws_instance.hack_vm", "orientation": "v", "textposition": "auto", "hovertemplate": "Resource=%{x}<br>Monthly Cost ($)=%{y}<extra></extra>", "alignmentgroup": "True" }, { "name": "aws_instance.hack_vm2", "type": "bar", "xsrc": "hackathon_test:20:ed5da6", "ysrc": "hackathon_test:20:289b20", "xaxis": "x", "yaxis": "y", "marker": { "color": "rgb(153, 201, 69)", "pattern": { "shape": "" } }, "showlegend": true, "legendgroup": "aws_instance.hack_vm2", "offsetgroup": "aws_instance.hack_vm2", "orientation": "v", "textposition": "auto", "hovertemplate": "Resource=%{x}<br>Monthly Cost ($)=%{y}<extra></extra>", "alignmentgroup": "True" }, { "name": "aws_ebs_volume.hack_volume", "type": "bar", "xsrc": "hackathon_test:20:6c4ac7", "ysrc": "hackathon_test:20:a317bb", "xaxis": "x", "yaxis": "y", "marker": { "color": "rgb(204, 97, 176)", "pattern": { "shape": "" } }, "showlegend": true, "legendgroup": "aws_ebs_volume.hack_volume", "offsetgroup": "aws_ebs_volume.hack_volume", "orientation": "v", "textposition": "auto", "hovertemplate": "Resource=%{x}<br>Monthly Cost ($)=%{y}<extra></extra>", "alignmentgroup": "True" } ], "layout": { "title": { "text": "Monthly Infracost Breakdown per Resource" }, "width": 1200, "xaxis": { "title": { "text": "Resource" }, "anchor": "y", "domain": [ 0.0, 1.0 ], "tickangle": -30, "categoryarray": [ "aws_lb.hack_lb", "aws_db_instance.hack_db", "aws_instance.hack_vm", "aws_instance.hack_vm2", "aws_ebs_volume.hack_volume" ], "categoryorder": "array" }, "yaxis": { "title": { "text": "Monthly Cost ($)" }, "anchor": "x", "domain": [ 0.0, 1.0 ] }, "legend": { "x": 1, "y": 1, "font": { "size": 10 }, "title": { "text": "Resource" }, "bgcolor": "rgba(255,255,255,0.6)", "xanchor": "left", "yanchor": "top", "bordercolor": "black", "borderwidth": 1, "orientation": "v", "tracegroupgap": 0 }, "barmode": "relative", "template": { "data": { "table": [ { "type": "table", "cells": { "fill": { "color": "#000038" }, "font": { "color": "#000037" }, "line": { "color": "#000039" } }, "header": { "fill": { "color": "#000040" }, "font": { "color": "#000036" }, "line": { "color": "#000039" } } } ], "icicle": [ { "type": "icicle", "textfont": { "color": "white" } } ], "sankey": [ { "type": "sankey", "textfont": { "color": "#000036" } } ], "contour": [ { "type": "contour", "colorscale": [ [ 0.0, "#000011" ], [ 0.1111111111111111, "#000012" ], [ 0.2222222222222222, "#000013" ], [ 0.3333333333333333, "#000014" ], [ 0.4444444444444444, "#000015" ], [ 0.5555555555555556, "#000016" ], [ 0.6666666666666666, "#000017" ], [ 0.7777777777777778, "#000018" ], [ 0.8888888888888888, "#000019" ], [ 1.0, "#000020" ] ] } ], "heatmap": [ { "type": "heatmap", "colorscale": [ [ 0.0, "#000011" ], [ 0.1111111111111111, "#000012" ], [ 0.2222222222222222, "#000013" ], [ 0.3333333333333333, "#000014" ], [ 0.4444444444444444, "#000015" ], [ 0.5555555555555556, "#000016" ], [ 0.6666666666666666, "#000017" ], [ 0.7777777777777778, "#000018" ], [ 0.8888888888888888, "#000019" ], [ 1.0, "#000020" ] ] } ], "scatter": [ { "type": "scatter", "marker": { "line": { "width": 0 } } } ], "waterfall": [ { "type": "waterfall", "totals": { "marker": { "color": "#000034" } }, "connector": { "line": { "color": "#000036", "width": 2 } }, "decreasing": { "marker": { "color": "#000033" } }, "increasing": { "marker": { "color": "#000032" } } } ], "candlestick": [ { "type": "candlestick", "decreasing": { "line": { "color": "#000033" } }, "increasing": { "line": { "color": "#000032" } } } ], "histogram2d": [ { "type": "histogram2d", "colorscale": [ [ 0.0, "#000011" ], [ 0.1111111111111111, "#000012" ], [ 0.2222222222222222, "#000013" ], [ 0.3333333333333333, "#000014" ], [ 0.4444444444444444, "#000015" ], [ 0.5555555555555556, "#000016" ], [ 0.6666666666666666, "#000017" ], [ 0.7777777777777778, "#000018" ], [ 0.8888888888888888, "#000019" ], [ 1.0, "#000020" ] ] } ], "contourcarpet": [ { "type": "contourcarpet", "colorscale": [ [ 0.0, "#000011" ], [ 0.1111111111111111, "#000012" ], [ 0.2222222222222222, "#000013" ], [ 0.3333333333333333, "#000014" ], [ 0.4444444444444444, "#000015" ], [ 0.5555555555555556, "#000016" ], [ 0.6666666666666666, "#000017" ], [ 0.7777777777777778, "#000018" ], [ 0.8888888888888888, "#000019" ], [ 1.0, "#000020" ] ] } ] }, "layout": { "colorway": [ "#000001", "#000002", "#000003", "#000004", "#000005", "#000006", "#000007", "#000008", "#000009", "#000010" ], "coloraxis": { "colorscale": [ [ 0.0, "#000011" ], [ 0.1111111111111111, "#000012" ], [ 0.2222222222222222, "#000013" ], [ 0.3333333333333333, "#000014" ], [ 0.4444444444444444, "#000015" ], [ 0.5555555555555556, "#000016" ], [ 0.6666666666666666, "#000017" ], [ 0.7777777777777778, "#000018" ], [ 0.8888888888888888, "#000019" ], [ 1.0, "#000020" ] ] }, "colorscale": { "diverging": [ [ 0.0, "#000021" ], [ 0.1, "#000022" ], [ 0.2, "#000023" ], [ 0.3, "#000024" ], [ 0.4, "#000025" ], [ 0.5, "#000026" ], [ 0.6, "#000027" ], [ 0.7, "#000028" ], [ 0.8, "#000029" ], [ 0.9, "#000030" ], [ 1.0, "#000031" ] ], "sequential": [ [ 0.0, "#000011" ], [ 0.1111111111111111, "#000012" ], [ 0.2222222222222222, "#000013" ], [ 0.3333333333333333, "#000014" ], [ 0.4444444444444444, "#000015" ], [ 0.5555555555555556, "#000016" ], [ 0.6666666666666666, "#000017" ], [ 0.7777777777777778, "#000018" ], [ 0.8888888888888888, "#000019" ], [ 1.0, "#000020" ] ], "sequentialminus": [ [ 0.0, "#000011" ], [ 0.1111111111111111, "#000012" ], [ 0.2222222222222222, "#000013" ], [ 0.3333333333333333, "#000014" ], [ 0.4444444444444444, "#000015" ], [ 0.5555555555555556, "#000016" ], [ 0.6666666666666666, "#000017" ], [ 0.7777777777777778, "#000018" ], [ 0.8888888888888888, "#000019" ], [ 1.0, "#000020" ] ] } } }, "plot_bgcolor": "rgba(245,245,245,1)", "paper_bgcolor": "rgba(245,245,245,1)" } }, "height": null, "width": 1200, "user": { "profile_url": "https://chart-studio.plotly.com/~hackathon_test", "avatar_url": "https://storage.googleapis.com/plotly-prod-profiles/21.jpg", "background_url": "https://storage.googleapis.com/plotly-prod-profiles/bg-7.jpg", "bio": "", "nickname": "", "website": "", "stream_tokens": null, "feature_set_id": null, "csrf_token": null, "date_joined": "2025-09-16 02:59:33", "mapbox_access_tokens": null, "has_password": null, "username": "hackathon_test", "email": null, "is_active": null, "readonly": null, "is_dash_creator": null, "dash_created_count": null, "is_chart_creator": null, "charts_created_count": null } }, { "creation_time": "2025-09-16T03:17:51.837090Z", "comments": { "results": [], "count": 0 }, "parented": true, "embed_url": "https://chart-studio.plotly.com/~hackathon_test/21.embed", "fid": "hackathon_test:21", "filename": "infracost-costs-1757992665", "filetype": "plot", "img_url": "https://storage.googleapis.com/plotly-prod-images/hackathon_test/21/9_BIN5TIEDSTY2NTZU127XOTANCR2568.png", "image_urls": { "default": "https://storage.googleapis.com/plotly-prod-images/hackathon_test/21/2_IAWM7BQ5E24Q8B4HV7007D27ICRNKH.png", "block-thumb": "https://storage.googleapis.com/plotly-prod-images/hackathon_test/21/8_98DP7XAUD6A4M8X1SU07X9VKNHCMK8.png", "list-thumb": "https://storage.googleapis.com/plotly-prod-images/hackathon_test/21/9_BIN5TIEDSTY2NTZU127XOTANCR2568.png" }, "api_urls": { "files": "https://api.plotly.com/v2/files/hackathon_test:21", "plots": "https://api.plotly.com/v2/plots/hackathon_test:21", "parent": "https://api.plotly.com/v2/folders/home?user=hackathon_test" }, "owner": "hackathon_test", "parent": -1, "preview": "", "referencers": [], "references": [], "title": "", "views": 0, "web_url": "https://chart-studio.plotly.com/~hackathon_test/21/", "world_readable": true, "date_modified": "2025-09-16T03:17:51.847Z", "stars": { "results": [], "count": 0 }, "collaborators": { "results": [], "count": 0 }, "subfolder_count": null, "refresh_interval": null, "organize_view_url": "https://chart-studio.plotly.com/~hackathon_test/21/", "current_user_permission": "read", "is_theme": null, "is_template": null, "autosize": true, "caption": "", "figure": { "data": [ { "name": "aws_lb.hack_lb", "type": "bar", "xsrc": "hackathon_test:19:ecb863", "ysrc": "hackathon_test:19:8c9b22", "xaxis": "x", "yaxis": "y", "marker": { "color": "rgb(229, 134, 6)", "pattern": { "shape": "" } }, "showlegend": true, "legendgroup": "aws_lb.hack_lb", "offsetgroup": "aws_lb.hack_lb", "orientation": "v", "textposition": "auto", "hovertemplate": "Resource=%{x}<br>Monthly Cost ($)=%{y}<extra></extra>", "alignmentgroup": "True" }, { "name": "aws_db_instance.hack_db", "type": "bar", "xsrc": "hackathon_test:19:8d7bdf", "ysrc": "hackathon_test:19:6fe3b5", "xaxis": "x", "yaxis": "y", "marker": { "color": "rgb(93, 105, 177)", "pattern": { "shape": "" } }, "showlegend": true, "legendgroup": "aws_db_instance.hack_db", "offsetgroup": "aws_db_instance.hack_db", "orientation": "v", "textposition": "auto", "hovertemplate": "Resource=%{x}<br>Monthly Cost ($)=%{y}<extra></extra>", "alignmentgroup": "True" }, { "name": "aws_instance.hack_vm", "type": "bar", "xsrc": "hackathon_test:19:109fe1", "ysrc": "hackathon_test:19:ec13b4", "xaxis": "x", "yaxis": "y", "marker": { "color": "rgb(82, 188, 163)", "pattern": { "shape": "" } }, "showlegend": true, "legendgroup": "aws_instance.hack_vm", "offsetgroup": "aws_instance.hack_vm", "orientation": "v", "textposition": "auto", "hovertemplate": "Resource=%{x}<br>Monthly Cost ($)=%{y}<extra></extra>", "alignmentgroup": "True" }, { "name": "aws_instance.hack_vm2", "type": "bar", "xsrc": "hackathon_test:19:390fb5", "ysrc": "hackathon_test:19:7ca652", "xaxis": "x", "yaxis": "y", "marker": { "color": "rgb(153, 201, 69)", "pattern": { "shape": "" } }, "showlegend": true, "legendgroup": "aws_instance.hack_vm2", "offsetgroup": "aws_instance.hack_vm2", "orientation": "v", "textposition": "auto", "hovertemplate": "Resource=%{x}<br>Monthly Cost ($)=%{y}<extra></extra>", "alignmentgroup": "True" }, { "name": "aws_ebs_volume.hack_volume", "type": "bar", "xsrc": "hackathon_test:19:fc8c96", "ysrc": "hackathon_test:19:d1ff9b", "xaxis": "x", "yaxis": "y", "marker": { "color": "rgb(204, 97, 176)", "pattern": { "shape": "" } }, "showlegend": true, "legendgroup": "aws_ebs_volume.hack_volume", "offsetgroup": "aws_ebs_volume.hack_volume", "orientation": "v", "textposition": "auto", "hovertemplate": "Resource=%{x}<br>Monthly Cost ($)=%{y}<extra></extra>", "alignmentgroup": "True" } ], "layout": { "title": { "text": "Monthly Infracost Breakdown per Resource" }, "width": 1200, "xaxis": { "title": { "text": "Resource" }, "anchor": "y", "domain": [ 0.0, 1.0 ], "tickangle": -30, "categoryarray": [ "aws_lb.hack_lb", "aws_db_instance.hack_db", "aws_instance.hack_vm", "aws_instance.hack_vm2", "aws_ebs_volume.hack_volume" ], "categoryorder": "array" }, "yaxis": { "title": { "text": "Monthly Cost ($)" }, "anchor": "x", "domain": [ 0.0, 1.0 ] }, "legend": { "x": 1, "y": 1, "font": { "size": 10 }, "title": { "text": "Resource" }, "bgcolor": "rgba(255,255,255,0.6)", "xanchor": "left", "yanchor": "top", "bordercolor": "black", "borderwidth": 1, "orientation": "v", "tracegroupgap": 0 }, "barmode": "relative", "template": { "data": { "table": [ { "type": "table", "cells": { "fill": { "color": "#000038" }, "font": { "color": "#000037" }, "line": { "color": "#000039" } }, "header": { "fill": { "color": "#000040" }, "font": { "color": "#000036" }, "line": { "color": "#000039" } } } ], "icicle": [ { "type": "icicle", "textfont": { "color": "white" } } ], "sankey": [ { "type": "sankey", "textfont": { "color": "#000036" } } ], "contour": [ { "type": "contour", "colorscale": [ [ 0.0, "#000011" ], [ 0.1111111111111111, "#000012" ], [ 0.2222222222222222, "#000013" ], [ 0.3333333333333333, "#000014" ], [ 0.4444444444444444, "#000015" ], [ 0.5555555555555556, "#000016" ], [ 0.6666666666666666, "#000017" ], [ 0.7777777777777778, "#000018" ], [ 0.8888888888888888, "#000019" ], [ 1.0, "#000020" ] ] } ], "heatmap": [ { "type": "heatmap", "colorscale": [ [ 0.0, "#000011" ], [ 0.1111111111111111, "#000012" ], [ 0.2222222222222222, "#000013" ], [ 0.3333333333333333, "#000014" ], [ 0.4444444444444444, "#000015" ], [ 0.5555555555555556, "#000016" ], [ 0.6666666666666666, "#000017" ], [ 0.7777777777777778, "#000018" ], [ 0.8888888888888888, "#000019" ], [ 1.0, "#000020" ] ] } ], "scatter": [ { "type": "scatter", "marker": { "line": { "width": 0 } } } ], "waterfall": [ { "type": "waterfall", "totals": { "marker": { "color": "#000034" } }, "connector": { "line": { "color": "#000036", "width": 2 } }, "decreasing": { "marker": { "color": "#000033" } }, "increasing": { "marker": { "color": "#000032" } } } ], "candlestick": [ { "type": "candlestick", "decreasing": { "line": { "color": "#000033" } }, "increasing": { "line": { "color": "#000032" } } } ], "histogram2d": [ { "type": "histogram2d", "colorscale": [ [ 0.0, "#000011" ], [ 0.1111111111111111, "#000012" ], [ 0.2222222222222222, "#000013" ], [ 0.3333333333333333, "#000014" ], [ 0.4444444444444444, "#000015" ], [ 0.5555555555555556, "#000016" ], [ 0.6666666666666666, "#000017" ], [ 0.7777777777777778, "#000018" ], [ 0.8888888888888888, "#000019" ], [ 1.0, "#000020" ] ] } ], "contourcarpet": [ { "type": "contourcarpet", "colorscale": [ [ 0.0, "#000011" ], [ 0.1111111111111111, "#000012" ], [ 0.2222222222222222, "#000013" ], [ 0.3333333333333333, "#000014" ], [ 0.4444444444444444, "#000015" ], [ 0.5555555555555556, "#000016" ], [ 0.6666666666666666, "#000017" ], [ 0.7777777777777778, "#000018" ], [ 0.8888888888888888, "#000019" ], [ 1.0, "#000020" ] ] } ] }, "layout": { "colorway": [ "#000001", "#000002", "#000003", "#000004", "#000005", "#000006", "#000007", "#000008", "#000009", "#000010" ], "coloraxis": { "colorscale": [ [ 0.0, "#000011" ], [ 0.1111111111111111, "#000012" ], [ 0.2222222222222222, "#000013" ], [ 0.3333333333333333, "#000014" ], [ 0.4444444444444444, "#000015" ], [ 0.5555555555555556, "#000016" ], [ 0.6666666666666666, "#000017" ], [ 0.7777777777777778, "#000018" ], [ 0.8888888888888888, "#000019" ], [ 1.0, "#000020" ] ] }, "colorscale": { "diverging": [ [ 0.0, "#000021" ], [ 0.1, "#000022" ], [ 0.2, "#000023" ], [ 0.3, "#000024" ], [ 0.4, "#000025" ], [ 0.5, "#000026" ], [ 0.6, "#000027" ], [ 0.7, "#000028" ], [ 0.8, "#000029" ], [ 0.9, "#000030" ], [ 1.0, "#000031" ] ], "sequential": [ [ 0.0, "#000011" ], [ 0.1111111111111111, "#000012" ], [ 0.2222222222222222, "#000013" ], [ 0.3333333333333333, "#000014" ], [ 0.4444444444444444, "#000015" ], [ 0.5555555555555556, "#000016" ], [ 0.6666666666666666, "#000017" ], [ 0.7777777777777778, "#000018" ], [ 0.8888888888888888, "#000019" ], [ 1.0, "#000020" ] ], "sequentialminus": [ [ 0.0, "#000011" ], [ 0.1111111111111111, "#000012" ], [ 0.2222222222222222, "#000013" ], [ 0.3333333333333333, "#000014" ], [ 0.4444444444444444, "#000015" ], [ 0.5555555555555556, "#000016" ], [ 0.6666666666666666, "#000017" ], [ 0.7777777777777778, "#000018" ], [ 0.8888888888888888, "#000019" ], [ 1.0, "#000020" ] ] } } }, "plot_bgcolor": "rgba(245,245,245,1)", "paper_bgcolor": "rgba(245,245,245,1)" } }, "height": null, "width": 1200, "user": { "profile_url": "https://chart-studio.plotly.com/~hackathon_test", "avatar_url": "https://storage.googleapis.com/plotly-prod-profiles/21.jpg", "background_url": "https://storage.googleapis.com/plotly-prod-profiles/bg-7.jpg", "bio": "", "nickname": "", "website": "", "stream_tokens": null, "feature_set_id": null, "csrf_token": null, "date_joined": "2025-09-16 02:59:33", "mapbox_access_tokens": null, "has_password": null, "username": "hackathon_test", "email": null, "is_active": null, "readonly": null, "is_dash_creator": null, "dash_created_count": null, "is_chart_creator": null, "charts_created_count": null } }, { "creation_time": "2025-09-16T03:17:48.417059Z", "comments": { "results": [], "count": 0 }, "parented": true, "embed_url": "https://chart-studio.plotly.com/~hackathon_test/18.embed", "fid": "hackathon_test:18", "filename": "infracost-costs-1757992661", "filetype": "plot", "img_url": "https://storage.googleapis.com/plotly-prod-images/hackathon_test/18/9_EK9FO35KULN40Y9JMSQZTNLFPT0GBY.png", "image_urls": { "default": "https://storage.googleapis.com/plotly-prod-images/hackathon_test/18/2_TDXVAAD484EO9QE4JDFGYZVITR3XLN.png", "block-thumb": "https://storage.googleapis.com/plotly-prod-images/hackathon_test/18/8_2HZEE0M4USZX4HO0IP4MM8X44AES9U.png", "list-thumb": "https://storage.googleapis.com/plotly-prod-images/hackathon_test/18/9_EK9FO35KULN40Y9JMSQZTNLFPT0GBY.png" }, "api_urls": { "files": "https://api.plotly.com/v2/files/hackathon_test:18", "plots": "https://api.plotly.com/v2/plots/hackathon_test:18", "parent": "https://api.plotly.com/v2/folders/home?user=hackathon_test" }, "owner": "hackathon_test", "parent": -1, "preview": "", "referencers": [], "references": [], "title": "", "views": 0, "web_url": "https://chart-studio.plotly.com/~hackathon_test/18/", "world_readable": true, "date_modified": "2025-09-16T03:17:48.427Z", "stars": { "results": [], "count": 0 }, "collaborators": { "results": [], "count": 0 }, "subfolder_count": null, "refresh_interval": null, "organize_view_url": "https://chart-studio.plotly.com/~hackathon_test/18/", "current_user_permission": "read", "is_theme": null, "is_template": null, "autosize": true, "caption": "", "figure": { "data": [ { "name": "aws_lb.hack_lb", "type": "bar", "xsrc": "hackathon_test:17:64fb83", "ysrc": "hackathon_test:17:8b627c", "xaxis": "x", "yaxis": "y", "marker": { "color": "rgb(229, 134, 6)", "pattern": { "shape": "" } }, "showlegend": true, "legendgroup": "aws_lb.hack_lb", "offsetgroup": "aws_lb.hack_lb", "orientation": "v", "textposition": "auto", "hovertemplate": "Resource=%{x}<br>Monthly Cost ($)=%{y}<extra></extra>", "alignmentgroup": "True" }, { "name": "aws_db_instance.hack_db", "type": "bar", "xsrc": "hackathon_test:17:133eb7", "ysrc": "hackathon_test:17:865e13", "xaxis": "x", "yaxis": "y", "marker": { "color": "rgb(93, 105, 177)", "pattern": { "shape": "" } }, "showlegend": true, "legendgroup": "aws_db_instance.hack_db", "offsetgroup": "aws_db_instance.hack_db", "orientation": "v", "textposition": "auto", "hovertemplate": "Resource=%{x}<br>Monthly Cost ($)=%{y}<extra></extra>", "alignmentgroup": "True" }, { "name": "aws_instance.hack_vm", "type": "bar", "xsrc": "hackathon_test:17:303430", "ysrc": "hackathon_test:17:c47733", "xaxis": "x", "yaxis": "y", "marker": { "color": "rgb(82, 188, 163)", "pattern": { "shape": "" } }, "showlegend": true, "legendgroup": "aws_instance.hack_vm", "offsetgroup": "aws_instance.hack_vm", "orientation": "v", "textposition": "auto", "hovertemplate": "Resource=%{x}<br>Monthly Cost ($)=%{y}<extra></extra>", "alignmentgroup": "True" }, { "name": "aws_instance.hack_vm2", "type": "bar", "xsrc": "hackathon_test:17:c1d792", "ysrc": "hackathon_test:17:92e643", "xaxis": "x", "yaxis": "y", "marker": { "color": "rgb(153, 201, 69)", "pattern": { "shape": "" } }, "showlegend": true, "legendgroup": "aws_instance.hack_vm2", "offsetgroup": "aws_instance.hack_vm2", "orientation": "v", "textposition": "auto", "hovertemplate": "Resource=%{x}<br>Monthly Cost ($)=%{y}<extra></extra>", "alignmentgroup": "True" }, { "name": "aws_ebs_volume.hack_volume", "type": "bar", "xsrc": "hackathon_test:17:7f53cb", "ysrc": "hackathon_test:17:655fd6", "xaxis": "x", "yaxis": "y", "marker": { "color": "rgb(204, 97, 176)", "pattern": { "shape": "" } }, "showlegend": true, "legendgroup": "aws_ebs_volume.hack_volume", "offsetgroup": "aws_ebs_volume.hack_volume", "orientation": "v", "textposition": "auto", "hovertemplate": "Resource=%{x}<br>Monthly Cost ($)=%{y}<extra></extra>", "alignmentgroup": "True" } ], "layout": { "title": { "text": "Monthly Infracost Breakdown per Resource" }, "width": 1200, "xaxis": { "title": { "text": "Resource" }, "anchor": "y", "domain": [ 0.0, 1.0 ], "tickangle": -30, "categoryarray": [ "aws_lb.hack_lb", "aws_db_instance.hack_db", "aws_instance.hack_vm", "aws_instance.hack_vm2", "aws_ebs_volume.hack_volume" ], "categoryorder": "array" }, "yaxis": { "title": { "text": "Monthly Cost ($)" }, "anchor": "x", "domain": [ 0.0, 1.0 ] }, "legend": { "x": 1, "y": 1, "font": { "size": 10 }, "title": { "text": "Resource" }, "bgcolor": "rgba(255,255,255,0.6)", "xanchor": "left", "yanchor": "top", "bordercolor": "black", "borderwidth": 1, "orientation": "v", "tracegroupgap": 0 }, "barmode": "relative", "template": { "data": { "table": [ { "type": "table", "cells": { "fill": { "color": "#000038" }, "font": { "color": "#000037" }, "line": { "color": "#000039" } }, "header": { "fill": { "color": "#000040" }, "font": { "color": "#000036" }, "line": { "color": "#000039" } } } ], "icicle": [ { "type": "icicle", "textfont": { "color": "white" } } ], "sankey": [ { "type": "sankey", "textfont": { "color": "#000036" } } ], "contour": [ { "type": "contour", "colorscale": [ [ 0.0, "#000011" ], [ 0.1111111111111111, "#000012" ], [ 0.2222222222222222, "#000013" ], [ 0.3333333333333333, "#000014" ], [ 0.4444444444444444, "#000015" ], [ 0.5555555555555556, "#000016" ], [ 0.6666666666666666, "#000017" ], [ 0.7777777777777778, "#000018" ], [ 0.8888888888888888, "#000019" ], [ 1.0, "#000020" ] ] } ], "heatmap": [ { "type": "heatmap", "colorscale": [ [ 0.0, "#000011" ], [ 0.1111111111111111, "#000012" ], [ 0.2222222222222222, "#000013" ], [ 0.3333333333333333, "#000014" ], [ 0.4444444444444444, "#000015" ], [ 0.5555555555555556, "#000016" ], [ 0.6666666666666666, "#000017" ], [ 0.7777777777777778, "#000018" ], [ 0.8888888888888888, "#000019" ], [ 1.0, "#000020" ] ] } ], "scatter": [ { "type": "scatter", "marker": { "line": { "width": 0 } } } ], "waterfall": [ { "type": "waterfall", "totals": { "marker": { "color": "#000034" } }, "connector": { "line": { "color": "#000036", "width": 2 } }, "decreasing": { "marker": { "color": "#000033" } }, "increasing": { "marker": { "color": "#000032" } } } ], "candlestick": [ { "type": "candlestick", "decreasing": { "line": { "color": "#000033" } }, "increasing": { "line": { "color": "#000032" } } } ], "histogram2d": [ { "type": "histogram2d", "colorscale": [ [ 0.0, "#000011" ], [ 0.1111111111111111, "#000012" ], [ 0.2222222222222222, "#000013" ], [ 0.3333333333333333, "#000014" ], [ 0.4444444444444444, "#000015" ], [ 0.5555555555555556, "#000016" ], [ 0.6666666666666666, "#000017" ], [ 0.7777777777777778, "#000018" ], [ 0.8888888888888888, "#000019" ], [ 1.0, "#000020" ] ] } ], "contourcarpet": [ { "type": "contourcarpet", "colorscale": [ [ 0.0, "#000011" ], [ 0.1111111111111111, "#000012" ], [ 0.2222222222222222, "#000013" ], [ 0.3333333333333333, "#000014" ], [ 0.4444444444444444, "#000015" ], [ 0.5555555555555556, "#000016" ], [ 0.6666666666666666, "#000017" ], [ 0.7777777777777778, "#000018" ], [ 0.8888888888888888, "#000019" ], [ 1.0, "#000020" ] ] } ] }, "layout": { "colorway": [ "#000001", "#000002", "#000003", "#000004", "#000005", "#000006", "#000007", "#000008", "#000009", "#000010" ], "coloraxis": { "colorscale": [ [ 0.0, "#000011" ], [ 0.1111111111111111, "#000012" ], [ 0.2222222222222222, "#000013" ], [ 0.3333333333333333, "#000014" ], [ 0.4444444444444444, "#000015" ], [ 0.5555555555555556, "#000016" ], [ 0.6666666666666666, "#000017" ], [ 0.7777777777777778, "#000018" ], [ 0.8888888888888888, "#000019" ], [ 1.0, "#000020" ] ] }, "colorscale": { "diverging": [ [ 0.0, "#000021" ], [ 0.1, "#000022" ], [ 0.2, "#000023" ], [ 0.3, "#000024" ], [ 0.4, "#000025" ], [ 0.5, "#000026" ], [ 0.6, "#000027" ], [ 0.7, "#000028" ], [ 0.8, "#000029" ], [ 0.9, "#000030" ], [ 1.0, "#000031" ] ], "sequential": [ [ 0.0, "#000011" ], [ 0.1111111111111111, "#000012" ], [ 0.2222222222222222, "#000013" ], [ 0.3333333333333333, "#000014" ], [ 0.4444444444444444, "#000015" ], [ 0.5555555555555556, "#000016" ], [ 0.6666666666666666, "#000017" ], [ 0.7777777777777778, "#000018" ], [ 0.8888888888888888, "#000019" ], [ 1.0, "#000020" ] ], "sequentialminus": [ [ 0.0, "#000011" ], [ 0.1111111111111111, "#000012" ], [ 0.2222222222222222, "#000013" ], [ 0.3333333333333333, "#000014" ], [ 0.4444444444444444, "#000015" ], [ 0.5555555555555556, "#000016" ], [ 0.6666666666666666, "#000017" ], [ 0.7777777777777778, "#000018" ], [ 0.8888888888888888, "#000019" ], [ 1.0, "#000020" ] ] } } }, "plot_bgcolor": "rgba(245,245,245,1)", "paper_bgcolor": "rgba(245,245,245,1)" } }, "height": null, "width": 1200, "user": { "profile_url": "https://chart-studio.plotly.com/~hackathon_test", "avatar_url": "https://storage.googleapis.com/plotly-prod-profiles/21.jpg", "background_url": "https://storage.googleapis.com/plotly-prod-profiles/bg-7.jpg", "bio": "", "nickname": "", "website": "", "stream_tokens": null, "feature_set_id": null, "csrf_token": null, "date_joined": "2025-09-16 02:59:33", "mapbox_access_tokens": null, "has_password": null, "username": "hackathon_test", "email": null, "is_active": null, "readonly": null, "is_dash_creator": null, "dash_created_count": null, "is_chart_creator": null, "charts_created_count": null } }, { "creation_time": "2025-09-16T03:17:39.334620Z", "comments": { "results": [], "count": 0 }, "parented": true, "embed_url": "https://chart-studio.plotly.com/~hackathon_test/16.embed", "fid": "hackathon_test:16", "filename": "infracost-costs-1757992653", "filetype": "plot", "img_url": "https://storage.googleapis.com/plotly-prod-images/hackathon_test/16/9_SEYUPV4W7RSNS0J4XOEFG4Z94HBY2U.png", "image_urls": { "default": "https://storage.googleapis.com/plotly-prod-images/hackathon_test/16/2_DFQ9GLGUM59ZL6VBXEK9CK05UTK3PS.png", "block-thumb": "https://storage.googleapis.com/plotly-prod-images/hackathon_test/16/8_LYLAU9B337EYBP31JCRRJNIFFYCS7V.png", "list-thumb": "https://storage.googleapis.com/plotly-prod-images/hackathon_test/16/9_SEYUPV4W7RSNS0J4XOEFG4Z94HBY2U.png" }, "api_urls": { "files": "https://api.plotly.com/v2/files/hackathon_test:16", "plots": "https://api.plotly.com/v2/plots/hackathon_test:16", "parent": "https://api.plotly.com/v2/folders/home?user=hackathon_test" }, "owner": "hackathon_test", "parent": -1, "preview": "", "referencers": [], "references": [], "title": "", "views": 0, "web_url": "https://chart-studio.plotly.com/~hackathon_test/16/", "world_readable": true, "date_modified": "2025-09-16T03:17:39.348Z", "stars": { "results": [], "count": 0 }, "collaborators": { "results": [], "count": 0 }, "subfolder_count": null, "refresh_interval": null, "organize_view_url": "https://chart-studio.plotly.com/~hackathon_test/16/", "current_user_permission": "read", "is_theme": null, "is_template": null, "autosize": true, "caption": "", "figure": { "data": [ { "name": "aws_lb.hack_lb", "type": "bar", "xsrc": "hackathon_test:15:8ea19d", "ysrc": "hackathon_test:15:c8e9f3", "xaxis": "x", "yaxis": "y", "marker": { "color": "rgb(229, 134, 6)", "pattern": { "shape": "" } }, "showlegend": true, "legendgroup": "aws_lb.hack_lb", "offsetgroup": "aws_lb.hack_lb", "orientation": "v", "textposition": "auto", "hovertemplate": "Resource=%{x}<br>Monthly Cost ($)=%{y}<extra></extra>", "alignmentgroup": "True" }, { "name": "aws_db_instance.hack_db", "type": "bar", "xsrc": "hackathon_test:15:427e97", "ysrc": "hackathon_test:15:37cae9", "xaxis": "x", "yaxis": "y", "marker": { "color": "rgb(93, 105, 177)", "pattern": { "shape": "" } }, "showlegend": true, "legendgroup": "aws_db_instance.hack_db", "offsetgroup": "aws_db_instance.hack_db", "orientation": "v", "textposition": "auto", "hovertemplate": "Resource=%{x}<br>Monthly Cost ($)=%{y}<extra></extra>", "alignmentgroup": "True" }, { "name": "aws_instance.hack_vm", "type": "bar", "xsrc": "hackathon_test:15:3aac8e", "ysrc": "hackathon_test:15:11fd5c", "xaxis": "x", "yaxis": "y", "marker": { "color": "rgb(82, 188, 163)", "pattern": { "shape": "" } }, "showlegend": true, "legendgroup": "aws_instance.hack_vm", "offsetgroup": "aws_instance.hack_vm", "orientation": "v", "textposition": "auto", "hovertemplate": "Resource=%{x}<br>Monthly Cost ($)=%{y}<extra></extra>", "alignmentgroup": "True" }, { "name": "aws_instance.hack_vm2", "type": "bar", "xsrc": "hackathon_test:15:80f53d", "ysrc": "hackathon_test:15:d1d81d", "xaxis": "x", "yaxis": "y", "marker": { "color": "rgb(153, 201, 69)", "pattern": { "shape": "" } }, "showlegend": true, "legendgroup": "aws_instance.hack_vm2", "offsetgroup": "aws_instance.hack_vm2", "orientation": "v", "textposition": "auto", "hovertemplate": "Resource=%{x}<br>Monthly Cost ($)=%{y}<extra></extra>", "alignmentgroup": "True" }, { "name": "aws_ebs_volume.hack_volume", "type": "bar", "xsrc": "hackathon_test:15:844f99", "ysrc": "hackathon_test:15:90b072", "xaxis": "x", "yaxis": "y", "marker": { "color": "rgb(204, 97, 176)", "pattern": { "shape": "" } }, "showlegend": true, "legendgroup": "aws_ebs_volume.hack_volume", "offsetgroup": "aws_ebs_volume.hack_volume", "orientation": "v", "textposition": "auto", "hovertemplate": "Resource=%{x}<br>Monthly Cost ($)=%{y}<extra></extra>", "alignmentgroup": "True" } ], "layout": { "title": { "text": "Monthly Infracost Breakdown per Resource" }, "width": 1200, "xaxis": { "title": { "text": "Resource" }, "anchor": "y", "domain": [ 0.0, 1.0 ], "tickangle": -30, "categoryarray": [ "aws_lb.hack_lb", "aws_db_instance.hack_db", "aws_instance.hack_vm", "aws_instance.hack_vm2", "aws_ebs_volume.hack_volume" ], "categoryorder": "array" }, "yaxis": { "title": { "text": "Monthly Cost ($)" }, "anchor": "x", "domain": [ 0.0, 1.0 ] }, "legend": { "x": 1, "y": 1, "font": { "size": 10 }, "title": { "text": "Resource" }, "bgcolor": "rgba(255,255,255,0.6)", "xanchor": "left", "yanchor": "top", "bordercolor": "black", "borderwidth": 1, "orientation": "v", "tracegroupgap": 0 }, "barmode": "relative", "template": { "data": { "table": [ { "type": "table", "cells": { "fill": { "color": "#000038" }, "font": { "color": "#000037" }, "line": { "color": "#000039" } }, "header": { "fill": { "color": "#000040" }, "font": { "color": "#000036" }, "line": { "color": "#000039" } } } ], "icicle": [ { "type": "icicle", "textfont": { "color": "white" } } ], "sankey": [ { "type": "sankey", "textfont": { "color": "#000036" } } ], "contour": [ { "type": "contour", "colorscale": [ [ 0.0, "#000011" ], [ 0.1111111111111111, "#000012" ], [ 0.2222222222222222, "#000013" ], [ 0.3333333333333333, "#000014" ], [ 0.4444444444444444, "#000015" ], [ 0.5555555555555556, "#000016" ], [ 0.6666666666666666, "#000017" ], [ 0.7777777777777778, "#000018" ], [ 0.8888888888888888, "#000019" ], [ 1.0, "#000020" ] ] } ], "heatmap": [ { "type": "heatmap", "colorscale": [ [ 0.0, "#000011" ], [ 0.1111111111111111, "#000012" ], [ 0.2222222222222222, "#000013" ], [ 0.3333333333333333, "#000014" ], [ 0.4444444444444444, "#000015" ], [ 0.5555555555555556, "#000016" ], [ 0.6666666666666666, "#000017" ], [ 0.7777777777777778, "#000018" ], [ 0.8888888888888888, "#000019" ], [ 1.0, "#000020" ] ] } ], "scatter": [ { "type": "scatter", "marker": { "line": { "width": 0 } } } ], "waterfall": [ { "type": "waterfall", "totals": { "marker": { "color": "#000034" } }, "connector": { "line": { "color": "#000036", "width": 2 } }, "decreasing": { "marker": { "color": "#000033" } }, "increasing": { "marker": { "color": "#000032" } } } ], "candlestick": [ { "type": "candlestick", "decreasing": { "line": { "color": "#000033" } }, "increasing": { "line": { "color": "#000032" } } } ], "histogram2d": [ { "type": "histogram2d", "colorscale": [ [ 0.0, "#000011" ], [ 0.1111111111111111, "#000012" ], [ 0.2222222222222222, "#000013" ], [ 0.3333333333333333, "#000014" ], [ 0.4444444444444444, "#000015" ], [ 0.5555555555555556, "#000016" ], [ 0.6666666666666666, "#000017" ], [ 0.7777777777777778, "#000018" ], [ 0.8888888888888888, "#000019" ], [ 1.0, "#000020" ] ] } ], "contourcarpet": [ { "type": "contourcarpet", "colorscale": [ [ 0.0, "#000011" ], [ 0.1111111111111111, "#000012" ], [ 0.2222222222222222, "#000013" ], [ 0.3333333333333333, "#000014" ], [ 0.4444444444444444, "#000015" ], [ 0.5555555555555556, "#000016" ], [ 0.6666666666666666, "#000017" ], [ 0.7777777777777778, "#000018" ], [ 0.8888888888888888, "#000019" ], [ 1.0, "#000020" ] ] } ] }, "layout": { "colorway": [ "#000001", "#000002", "#000003", "#000004", "#000005", "#000006", "#000007", "#000008", "#000009", "#000010" ], "coloraxis": { "colorscale": [ [ 0.0, "#000011" ], [ 0.1111111111111111, "#000012" ], [ 0.2222222222222222, "#000013" ], [ 0.3333333333333333, "#000014" ], [ 0.4444444444444444, "#000015" ], [ 0.5555555555555556, "#000016" ], [ 0.6666666666666666, "#000017" ], [ 0.7777777777777778, "#000018" ], [ 0.8888888888888888, "#000019" ], [ 1.0, "#000020" ] ] }, "colorscale": { "diverging": [ [ 0.0, "#000021" ], [ 0.1, "#000022" ], [ 0.2, "#000023" ], [ 0.3, "#000024" ], [ 0.4, "#000025" ], [ 0.5, "#000026" ], [ 0.6, "#000027" ], [ 0.7, "#000028" ], [ 0.8, "#000029" ], [ 0.9, "#000030" ], [ 1.0, "#000031" ] ], "sequential": [ [ 0.0, "#000011" ], [ 0.1111111111111111, "#000012" ], [ 0.2222222222222222, "#000013" ], [ 0.3333333333333333, "#000014" ], [ 0.4444444444444444, "#000015" ], [ 0.5555555555555556, "#000016" ], [ 0.6666666666666666, "#000017" ], [ 0.7777777777777778, "#000018" ], [ 0.8888888888888888, "#000019" ], [ 1.0, "#000020" ] ], "sequentialminus": [ [ 0.0, "#000011" ], [ 0.1111111111111111, "#000012" ], [ 0.2222222222222222, "#000013" ], [ 0.3333333333333333, "#000014" ], [ 0.4444444444444444, "#000015" ], [ 0.5555555555555556, "#000016" ], [ 0.6666666666666666, "#000017" ], [ 0.7777777777777778, "#000018" ], [ 0.8888888888888888, "#000019" ], [ 1.0, "#000020" ] ] } } }, "plot_bgcolor": "rgba(245,245,245,1)", "paper_bgcolor": "rgba(245,245,245,1)" } }, "height": null, "width": 1200, "user": { "profile_url": "https://chart-studio.plotly.com/~hackathon_test", "avatar_url": "https://storage.googleapis.com/plotly-prod-profiles/21.jpg", "background_url": "https://storage.googleapis.com/plotly-prod-profiles/bg-7.jpg", "bio": "", "nickname": "", "website": "", "stream_tokens": null, "feature_set_id": null, "csrf_token": null, "date_joined": "2025-09-16 02:59:33", "mapbox_access_tokens": null, "has_password": null, "username": "hackathon_test", "email": null, "is_active": null, "readonly": null, "is_dash_creator": null, "dash_created_count": null, "is_chart_creator": null, "charts_created_count": null } }, { "creation_time": "2025-09-16T03:05:05.166732Z", "comments": { "results": [], "count": 0 }, "parented": true, "embed_url": "https://chart-studio.plotly.com/~jie.lin/1.embed", "fid": "jie.lin:1", "filename": "Plot 1", "filetype": "plot", "img_url": "https://storage.googleapis.com/plotly-prod-images/jie.lin/1/9_ONJKNRA60QCF85FRNOOSJ06FUHOD80.png", "image_urls": { "default": "https://storage.googleapis.com/plotly-prod-images/jie.lin/1/2_XM75CNUOO9JVIT0H9ME8C78FCCXZ7K.png", "block-thumb": "https://storage.googleapis.com/plotly-prod-images/jie.lin/1/8_KL0OZSQ5SDFSLGBAX2UCUGW776H44H.png", "list-thumb": "https://storage.googleapis.com/plotly-prod-images/jie.lin/1/9_ONJKNRA60QCF85FRNOOSJ06FUHOD80.png" }, "api_urls": { "files": "https://api.plotly.com/v2/files/jie.lin:1", "plots": "https://api.plotly.com/v2/plots/jie.lin:1", "parent": "https://api.plotly.com/v2/folders/home?user=jie.lin" }, "owner": "jie.lin", "parent": -1, "preview": "", "referencers": [], "references": [], "title": "", "views": 0, "web_url": "https://chart-studio.plotly.com/~jie.lin/1/", "world_readable": true, "date_modified": "2025-09-16T08:33:28.531Z", "stars": { "results": [], "count": 0 }, "collaborators": { "results": [], "count": 0 }, "subfolder_count": null, "refresh_interval": null, "organize_view_url": "https://chart-studio.plotly.com/~jie.lin/1/", "current_user_permission": "read", "is_theme": null, "is_template": false, "autosize": true, "caption": "", "figure": { "data": [ { "meta": { "columnNames": { "x": "A", "y": "B", "labels": "A", "values": "B" } }, "mode": "markers", "type": "bar", "xsrc": "jie.lin:0:bc02c0", "ysrc": "jie.lin:0:a66db6", "labelssrc": "jie.lin:0:bc02c0", "valuessrc": "jie.lin:0:a66db6", "orientation": "v", "autocolorscale": true } ], "frames": [], "layout": { "xaxis": { "type": "category", "range": [ -0.5, 9.5 ], "ticks": "outside", "showline": false, "tickfont": { "color": "rgb(229, 29, 29)" }, "tickmode": "linear", "autorange": true, "automargin": true, "fixedrange": false, "rangeslider": { "range": [ -0.5, 9.5 ], "yaxis": {}, "bgcolor": "rgb(192, 69, 69)", "visible": false, "autorange": true, "thickness": 0 } }, "yaxis": { "type": "linear", "range": [ 0, 12.631578947368421 ], "autorange": true }, "autosize": true, "template": { "data": { "bar": [ { "type": "bar", "marker": { "colorbar": { "ticks": "", "outlinewidth": 0 } } } ], "table": [ { "type": "table", "cells": { "fill": { "color": "#EBF0F8" }, "line": { "color": "white" } }, "header": { "fill": { "color": "#C8D4E3" }, "line": { "color": "white" } } } ], "carpet": [ { "type": "carpet", "aaxis": { "gridcolor": "#C8D4E3", "linecolor": "#C8D4E3", "endlinecolor": "#2a3f5f", "minorgridcolor": "#C8D4E3", "startlinecolor": "#2a3f5f" }, "baxis": { "gridcolor": "#C8D4E3", "linecolor": "#C8D4E3", "endlinecolor": "#2a3f5f", "minorgridcolor": "#C8D4E3", "startlinecolor": "#2a3f5f" } } ], "mesh3d": [ { "type": "mesh3d", "colorbar": { "ticks": "", "outlinewidth": 0 } } ], "contour": [ { "type": "contour", "colorbar": { "ticks": "", "outlinewidth": 0 }, "autocolorscale": true } ], "heatmap": [ { "type": "heatmap", "colorbar": { "ticks": "", "outlinewidth": 0 }, "autocolorscale": true } ], "scatter": [ { "type": "scatter", "marker": { "colorbar": { "ticks": "", "outlinewidth": 0 } } } ], "surface": [ { "type": "surface", "colorbar": { "ticks": "", "outlinewidth": 0 } } ], "heatmapgl": [ { "type": "heatmapgl", "colorbar": { "ticks": "", "outlinewidth": 0 } } ], "histogram": [ { "type": "histogram", "marker": { "colorbar": { "ticks": "", "outlinewidth": 0 } } } ], "parcoords": [ { "line": { "colorbar": { "ticks": "", "outlinewidth": 0 } }, "type": "parcoords" } ], "scatter3d": [ { "type": "scatter3d", "marker": { "colorbar": { "ticks": "", "outlinewidth": 0 } } } ], "scattergl": [ { "type": "scattergl", "marker": { "colorbar": { "ticks": "", "outlinewidth": 0 } } } ], "choropleth": [ { "type": "choropleth", "colorbar": { "ticks": "", "outlinewidth": 0 } } ], "scattergeo": [ { "type": "scattergeo", "marker": { "colorbar": { "ticks": "", "outlinewidth": 0 } } } ], "histogram2d": [ { "type": "histogram2d", "colorbar": { "ticks": "", "outlinewidth": 0 }, "autocolorscale": true } ], "scatterpolar": [ { "type": "scatterpolar", "marker": { "colorbar": { "ticks": "", "outlinewidth": 0 } } } ], "contourcarpet": [ { "type": "contourcarpet", "colorbar": { "ticks": "", "outlinewidth": 0 } } ], "scattercarpet": [ { "type": "scattercarpet", "marker": { "colorbar": { "ticks": "", "outlinewidth": 0 } } } ], "scattermapbox": [ { "type": "scattermapbox", "marker": { "colorbar": { "ticks": "", "outlinewidth": 0 } } } ], "scatterpolargl": [ { "type": "scatterpolargl", "marker": { "colorbar": { "ticks": "", "outlinewidth": 0 } } } ], "scatterternary": [ { "type": "scatterternary", "marker": { "colorbar": { "ticks": "", "outlinewidth": 0 } } } ], "histogram2dcontour": [ { "type": "histogram2dcontour", "colorbar": { "ticks": "", "outlinewidth": 0 }, "autocolorscale": true } ] }, "layout": { "geo": { "bgcolor": "white", "showland": true, "lakecolor": "white", "landcolor": "white", "showlakes": true, "subunitcolor": "#C8D4E3" }, "font": { "color": "#2a3f5f" }, "polar": { "bgcolor": "white", "radialaxis": { "ticks": "", "gridcolor": "#EBF0F8", "linecolor": "#EBF0F8" }, "angularaxis": { "ticks": "", "gridcolor": "#EBF0F8", "linecolor": "#EBF0F8" } }, "scene": { "xaxis": { "ticks": "", "gridcolor": "#DFE8F3", "gridwidth": 2, "linecolor": "#EBF0F8", "zerolinecolor": "#EBF0F8", "showbackground": true, "backgroundcolor": "white" }, "yaxis": { "ticks": "", "gridcolor": "#DFE8F3", "gridwidth": 2, "linecolor": "#EBF0F8", "zerolinecolor": "#EBF0F8", "showbackground": true, "backgroundcolor": "white" }, "zaxis": { "ticks": "", "gridcolor": "#DFE8F3", "gridwidth": 2, "linecolor": "#EBF0F8", "zerolinecolor": "#EBF0F8", "showbackground": true, "backgroundcolor": "white" } }, "title": { "x": 0.05 }, "xaxis": { "ticks": "", "gridcolor": "#EBF0F8", "linecolor": "#EBF0F8", "automargin": true, "zerolinecolor": "#EBF0F8", "zerolinewidth": 2 }, "yaxis": { "ticks": "", "gridcolor": "#EBF0F8", "linecolor": "#EBF0F8", "automargin": true, "zerolinecolor": "#EBF0F8", "zerolinewidth": 2 }, "ternary": { "aaxis": { "ticks": "", "gridcolor": "#DFE8F3", "linecolor": "#A2B1C6" }, "baxis": { "ticks": "", "gridcolor": "#DFE8F3", "linecolor": "#A2B1C6" }, "caxis": { "ticks": "", "gridcolor": "#DFE8F3", "linecolor": "#A2B1C6" }, "bgcolor": "white" }, "colorway": [ "#636efa", "#EF553B", "#00cc96", "#ab63fa", "#19d3f3", "#e763fa", "#fecb52", "#ffa15a", "#ff6692", "#b6e880" ], "hovermode": "closest", "colorscale": { "diverging": [ [ 0, "#8e0152" ], [ 0.1, "#c51b7d" ], [ 0.2, "#de77ae" ], [ 0.3, "#f1b6da" ], [ 0.4, "#fde0ef" ], [ 0.5, "#f7f7f7" ], [ 0.6, "#e6f5d0" ], [ 0.7, "#b8e186" ], [ 0.8, "#7fbc41" ], [ 0.9, "#4d9221" ], [ 1, "#276419" ] ], "sequential": [ [ 0, "#0508b8" ], [ 0.0893854748603352, "#1910d8" ], [ 0.1787709497206704, "#3c19f0" ], [ 0.2681564245810056, "#6b1cfb" ], [ 0.3575418994413408, "#981cfd" ], [ 0.44692737430167595, "#bf1cfd" ], [ 0.5363128491620112, "#dd2bfd" ], [ 0.6256983240223464, "#f246fe" ], [ 0.7150837988826816, "#fc67fd" ], [ 0.8044692737430168, "#fe88fc" ], [ 0.8938547486033519, "#fea5fd" ], [ 0.9832402234636871, "#febefe" ], [ 1, "#fec3fe" ] ], "sequentialminus": [ [ 0, "#0508b8" ], [ 0.0893854748603352, "#1910d8" ], [ 0.1787709497206704, "#3c19f0" ], [ 0.2681564245810056, "#6b1cfb" ], [ 0.3575418994413408, "#981cfd" ], [ 0.44692737430167595, "#bf1cfd" ], [ 0.5363128491620112, "#dd2bfd" ], [ 0.6256983240223464, "#f246fe" ], [ 0.7150837988826816, "#fc67fd" ], [ 0.8044692737430168, "#fe88fc" ], [ 0.8938547486033519, "#fea5fd" ], [ 0.9832402234636871, "#febefe" ], [ 1, "#fec3fe" ] ] }, "plot_bgcolor": "white", "paper_bgcolor": "white", "shapedefaults": { "line": { "width": 0 }, "opacity": 0.4, "fillcolor": "#506784" }, "annotationdefaults": { "arrowhead": 0, "arrowcolor": "#506784", "arrowwidth": 1 } }, "themeRef": "PLOTLY_WHITE" } } }, "height": null, "width": null, "user": { "profile_url": "https://chart-studio.plotly.com/~jie.lin", "avatar_url": "https://storage.googleapis.com/plotly-prod-profiles/50.jpg", "background_url": "https://storage.googleapis.com/plotly-prod-profiles/bg-7.jpg", "bio": "", "nickname": "", "website": "", "stream_tokens": null, "feature_set_id": null, "csrf_token": null, "date_joined": "2025-09-16 03:02:14", "mapbox_access_tokens": null, "has_password": null, "username": "jie.lin", "email": null, "is_active": null, "readonly": null, "is_dash_creator": null, "dash_created_count": null, "is_chart_creator": null, "charts_created_count": null } }, { "creation_time": "2025-09-16T03:03:58.015758Z", "comments": { "results": [], "count": 0 }, "parented": true, "embed_url": "https://chart-studio.plotly.com/~hackathon_test/1.embed", "fid": "hackathon_test:1", "filename": "infracost-costs", "filetype": "plot", "img_url": "https://storage.googleapis.com/plotly-prod-images/hackathon_test/1/9_W8MFU2LG8J60IH5DN69ORS2GWYUFNA.png", "image_urls": { "default": "https://storage.googleapis.com/plotly-prod-images/hackathon_test/1/2_TNOOCNOF089QS3UO6S91KMYJ0569NU.png", "block-thumb": "https://storage.googleapis.com/plotly-prod-images/hackathon_test/1/8_T3T0QAJSUBROGWTO3UO1DZKQBRUKWU.png", "list-thumb": "https://storage.googleapis.com/plotly-prod-images/hackathon_test/1/9_W8MFU2LG8J60IH5DN69ORS2GWYUFNA.png" }, "api_urls": { "files": "https://api.plotly.com/v2/files/hackathon_test:1", "plots": "https://api.plotly.com/v2/plots/hackathon_test:1", "parent": "https://api.plotly.com/v2/folders/home?user=hackathon_test" }, "owner": "hackathon_test", "parent": -1, "preview": "", "referencers": [], "references": [], "title": "", "views": 0, "web_url": "https://chart-studio.plotly.com/~hackathon_test/1/", "world_readable": true, "date_modified": "2025-09-16T03:17:36.463Z", "stars": { "results": [], "count": 0 }, "collaborators": { "results": [], "count": 0 }, "subfolder_count": null, "refresh_interval": null, "organize_view_url": "https://chart-studio.plotly.com/~hackathon_test/1/", "current_user_permission": "read", "is_theme": null, "is_template": null, "autosize": true, "caption": "", "figure": { "data": [ { "name": "aws_lb.hack_lb", "type": "bar", "xsrc": "hackathon_test:14:13afd3", "ysrc": "hackathon_test:14:388861", "xaxis": "x", "yaxis": "y", "marker": { "color": "rgb(229, 134, 6)", "pattern": { "shape": "" } }, "showlegend": true, "legendgroup": "aws_lb.hack_lb", "offsetgroup": "aws_lb.hack_lb", "orientation": "v", "textposition": "auto", "hovertemplate": "Resource=%{x}<br>Monthly Cost ($)=%{y}<extra></extra>", "alignmentgroup": "True" }, { "name": "aws_db_instance.hack_db", "type": "bar", "xsrc": "hackathon_test:14:62759c", "ysrc": "hackathon_test:14:39f5af", "xaxis": "x", "yaxis": "y", "marker": { "color": "rgb(93, 105, 177)", "pattern": { "shape": "" } }, "showlegend": true, "legendgroup": "aws_db_instance.hack_db", "offsetgroup": "aws_db_instance.hack_db", "orientation": "v", "textposition": "auto", "hovertemplate": "Resource=%{x}<br>Monthly Cost ($)=%{y}<extra></extra>", "alignmentgroup": "True" }, { "name": "aws_instance.hack_vm", "type": "bar", "xsrc": "hackathon_test:14:006e7a", "ysrc": "hackathon_test:14:551753", "xaxis": "x", "yaxis": "y", "marker": { "color": "rgb(82, 188, 163)", "pattern": { "shape": "" } }, "showlegend": true, "legendgroup": "aws_instance.hack_vm", "offsetgroup": "aws_instance.hack_vm", "orientation": "v", "textposition": "auto", "hovertemplate": "Resource=%{x}<br>Monthly Cost ($)=%{y}<extra></extra>", "alignmentgroup": "True" }, { "name": "aws_instance.hack_vm2", "type": "bar", "xsrc": "hackathon_test:14:0b1824", "ysrc": "hackathon_test:14:3233be", "xaxis": "x", "yaxis": "y", "marker": { "color": "rgb(153, 201, 69)", "pattern": { "shape": "" } }, "showlegend": true, "legendgroup": "aws_instance.hack_vm2", "offsetgroup": "aws_instance.hack_vm2", "orientation": "v", "textposition": "auto", "hovertemplate": "Resource=%{x}<br>Monthly Cost ($)=%{y}<extra></extra>", "alignmentgroup": "True" }, { "name": "aws_ebs_volume.hack_volume", "type": "bar", "xsrc": "hackathon_test:14:4e24e1", "ysrc": "hackathon_test:14:975443", "xaxis": "x", "yaxis": "y", "marker": { "color": "rgb(204, 97, 176)", "pattern": { "shape": "" } }, "showlegend": true, "legendgroup": "aws_ebs_volume.hack_volume", "offsetgroup": "aws_ebs_volume.hack_volume", "orientation": "v", "textposition": "auto", "hovertemplate": "Resource=%{x}<br>Monthly Cost ($)=%{y}<extra></extra>", "alignmentgroup": "True" } ], "layout": { "title": { "text": "Monthly Infracost Breakdown per Resource" }, "width": 1200, "xaxis": { "title": { "text": "Resource" }, "anchor": "y", "domain": [ 0.0, 1.0 ], "tickangle": -30, "categoryarray": [ "aws_lb.hack_lb", "aws_db_instance.hack_db", "aws_instance.hack_vm", "aws_instance.hack_vm2", "aws_ebs_volume.hack_volume" ], "categoryorder": "array" }, "yaxis": { "title": { "text": "Monthly Cost ($)" }, "anchor": "x", "domain": [ 0.0, 1.0 ] }, "legend": { "x": 1, "y": 1, "font": { "size": 10 }, "title": { "text": "Resource" }, "bgcolor": "rgba(255,255,255,0.6)", "xanchor": "left", "yanchor": "top", "bordercolor": "black", "borderwidth": 1, "orientation": "v", "tracegroupgap": 0 }, "barmode": "relative", "template": { "data": { "table": [ { "type": "table", "cells": { "fill": { "color": "#000038" }, "font": { "color": "#000037" }, "line": { "color": "#000039" } }, "header": { "fill": { "color": "#000040" }, "font": { "color": "#000036" }, "line": { "color": "#000039" } } } ], "icicle": [ { "type": "icicle", "textfont": { "color": "white" } } ], "sankey": [ { "type": "sankey", "textfont": { "color": "#000036" } } ], "contour": [ { "type": "contour", "colorscale": [ [ 0.0, "#000011" ], [ 0.1111111111111111, "#000012" ], [ 0.2222222222222222, "#000013" ], [ 0.3333333333333333, "#000014" ], [ 0.4444444444444444, "#000015" ], [ 0.5555555555555556, "#000016" ], [ 0.6666666666666666, "#000017" ], [ 0.7777777777777778, "#000018" ], [ 0.8888888888888888, "#000019" ], [ 1.0, "#000020" ] ] } ], "heatmap": [ { "type": "heatmap", "colorscale": [ [ 0.0, "#000011" ], [ 0.1111111111111111, "#000012" ], [ 0.2222222222222222, "#000013" ], [ 0.3333333333333333, "#000014" ], [ 0.4444444444444444, "#000015" ], [ 0.5555555555555556, "#000016" ], [ 0.6666666666666666, "#000017" ], [ 0.7777777777777778, "#000018" ], [ 0.8888888888888888, "#000019" ], [ 1.0, "#000020" ] ] } ], "scatter": [ { "type": "scatter", "marker": { "line": { "width": 0 } } } ], "waterfall": [ { "type": "waterfall", "totals": { "marker": { "color": "#000034" } }, "connector": { "line": { "color": "#000036", "width": 2 } }, "decreasing": { "marker": { "color": "#000033" } }, "increasing": { "marker": { "color": "#000032" } } } ], "candlestick": [ { "type": "candlestick", "decreasing": { "line": { "color": "#000033" } }, "increasing": { "line": { "color": "#000032" } } } ], "histogram2d": [ { "type": "histogram2d", "colorscale": [ [ 0.0, "#000011" ], [ 0.1111111111111111, "#000012" ], [ 0.2222222222222222, "#000013" ], [ 0.3333333333333333, "#000014" ], [ 0.4444444444444444, "#000015" ], [ 0.5555555555555556, "#000016" ], [ 0.6666666666666666, "#000017" ], [ 0.7777777777777778, "#000018" ], [ 0.8888888888888888, "#000019" ], [ 1.0, "#000020" ] ] } ], "contourcarpet": [ { "type": "contourcarpet", "colorscale": [ [ 0.0, "#000011" ], [ 0.1111111111111111, "#000012" ], [ 0.2222222222222222, "#000013" ], [ 0.3333333333333333, "#000014" ], [ 0.4444444444444444, "#000015" ], [ 0.5555555555555556, "#000016" ], [ 0.6666666666666666, "#000017" ], [ 0.7777777777777778, "#000018" ], [ 0.8888888888888888, "#000019" ], [ 1.0, "#000020" ] ] } ] }, "layout": { "colorway": [ "#000001", "#000002", "#000003", "#000004", "#000005", "#000006", "#000007", "#000008", "#000009", "#000010" ], "coloraxis": { "colorscale": [ [ 0.0, "#000011" ], [ 0.1111111111111111, "#000012" ], [ 0.2222222222222222, "#000013" ], [ 0.3333333333333333, "#000014" ], [ 0.4444444444444444, "#000015" ], [ 0.5555555555555556, "#000016" ], [ 0.6666666666666666, "#000017" ], [ 0.7777777777777778, "#000018" ], [ 0.8888888888888888, "#000019" ], [ 1.0, "#000020" ] ] }, "colorscale": { "diverging": [ [ 0.0, "#000021" ], [ 0.1, "#000022" ], [ 0.2, "#000023" ], [ 0.3, "#000024" ], [ 0.4, "#000025" ], [ 0.5, "#000026" ], [ 0.6, "#000027" ], [ 0.7, "#000028" ], [ 0.8, "#000029" ], [ 0.9, "#000030" ], [ 1.0, "#000031" ] ], "sequential": [ [ 0.0, "#000011" ], [ 0.1111111111111111, "#000012" ], [ 0.2222222222222222, "#000013" ], [ 0.3333333333333333, "#000014" ], [ 0.4444444444444444, "#000015" ], [ 0.5555555555555556, "#000016" ], [ 0.6666666666666666, "#000017" ], [ 0.7777777777777778, "#000018" ], [ 0.8888888888888888, "#000019" ], [ 1.0, "#000020" ] ], "sequentialminus": [ [ 0.0, "#000011" ], [ 0.1111111111111111, "#000012" ], [ 0.2222222222222222, "#000013" ], [ 0.3333333333333333, "#000014" ], [ 0.4444444444444444, "#000015" ], [ 0.5555555555555556, "#000016" ], [ 0.6666666666666666, "#000017" ], [ 0.7777777777777778, "#000018" ], [ 0.8888888888888888, "#000019" ], [ 1.0, "#000020" ] ] } } }, "plot_bgcolor": "rgba(245,245,245,1)", "paper_bgcolor": "rgba(245,245,245,1)" } }, "height": null, "width": 1200, "user": { "profile_url": "https://chart-studio.plotly.com/~hackathon_test", "avatar_url": "https://storage.googleapis.com/plotly-prod-profiles/21.jpg", "background_url": "https://storage.googleapis.com/plotly-prod-profiles/bg-7.jpg", "bio": "", "nickname": "", "website": "", "stream_tokens": null, "feature_set_id": null, "csrf_token": null, "date_joined": "2025-09-16 02:59:33", "mapbox_access_tokens": null, "has_password": null, "username": "hackathon_test", "email": null, "is_active": null, "readonly": null, "is_dash_creator": null, "dash_created_count": null, "is_chart_creator": null, "charts_created_count": null } }, { "creation_time": "2025-09-16T02:55:30.982420Z", "comments": { "results": [], "count": 0 }, "parented": true, "embed_url": "https://chart-studio.plotly.com/~adityaiyer98/5.embed", "fid": "adityaiyer98:5", "filename": "Plot 5", "filetype": "plot", "img_url": "https://storage.googleapis.com/plotly-prod-images/adityaiyer98/5/9_O59R4QAECWIA3VM62IUW5X76TPPH3D.png", "image_urls": { "default": "https://storage.googleapis.com/plotly-prod-images/adityaiyer98/5/2_OE4NQUT0BGXNFHZWZVBDSTHKKBQ32F.png", "block-thumb": "https://storage.googleapis.com/plotly-prod-images/adityaiyer98/5/8_PQ98382IROBAH7E51SMO5I5ZDIL5JE.png", "list-thumb": "https://storage.googleapis.com/plotly-prod-images/adityaiyer98/5/9_O59R4QAECWIA3VM62IUW5X76TPPH3D.png" }, "api_urls": { "files": "https://api.plotly.com/v2/files/adityaiyer98:5", "plots": "https://api.plotly.com/v2/plots/adityaiyer98:5", "parent": "https://api.plotly.com/v2/folders/home?user=adityaiyer98" }, "owner": "adityaiyer98", "parent": -1, "preview": "", "referencers": [], "references": [], "title": "", "views": 0, "web_url": "https://chart-studio.plotly.com/~adityaiyer98/5/", "world_readable": true, "date_modified": "2025-09-16T02:55:30.993Z", "stars": { "results": [], "count": 0 }, "collaborators": { "results": [], "count": 0 }, "subfolder_count": null, "refresh_interval": null, "organize_view_url": "https://chart-studio.plotly.com/~adityaiyer98/5/", "current_user_permission": "read", "is_theme": null, "is_template": false, "autosize": true, "caption": "", "figure": { "data": [ { "meta": { "columnNames": { "x": "A - C", "y": "B" } }, "mode": "lines", "type": "scatter", "xsrc": "adityaiyer98:4:4145af,6718d1*", "ysrc": "adityaiyer98:4:d53bf5" } ], "frames": [], "layout": { "title": { "text": "Burn-rate of Composite Solid Propellant (w/o additives)" }, "xaxis": { "type": "multicategory", "range": [ 0, 8 ], "title": { "text": "Time (secs)" }, "autorange": true }, "yaxis": { "type": "linear", "range": [ 1.2435, 1.5735 ], "title": { "text": "Burn-Rate (mm/s)" }, "autorange": true }, "autosize": true, "template": { "data": { "bar": [ { "type": "bar", "marker": { "colorbar": { "len": 0.2, "ticks": "inside", "ticklen": 6, "tickcolor": "rgb(237,237,237)", "outlinewidth": 0 } } } ], "table": [ { "type": "table", "cells": { "fill": { "color": "rgb(237,237,237)" }, "line": { "color": "white" } }, "header": { "fill": { "color": "rgb(217,217,217)" }, "line": { "color": "white" } } } ], "carpet": [ { "type": "carpet", "aaxis": { "gridcolor": "white", "linecolor": "white", "endlinecolor": "rgb(51,51,51)", "minorgridcolor": "white", "startlinecolor": "rgb(51,51,51)" }, "baxis": { "gridcolor": "white", "linecolor": "white", "endlinecolor": "rgb(51,51,51)", "minorgridcolor": "white", "startlinecolor": "rgb(51,51,51)" } } ], "mesh3d": [ { "type": "mesh3d", "colorbar": { "len": 0.2, "ticks": "inside", "ticklen": 6, "tickcolor": "rgb(237,237,237)", "outlinewidth": 0 } } ], "contour": [ { "type": "contour", "colorbar": { "len": 0.2, "ticks": "inside", "ticklen": 6, "tickcolor": "rgb(237,237,237)", "outlinewidth": 0 }, "autocolorscale": true } ], "heatmap": [ { "type": "heatmap", "colorbar": { "len": 0.2, "ticks": "inside", "ticklen": 6, "tickcolor": "rgb(237,237,237)", "outlinewidth": 0 }, "autocolorscale": true } ], "scatter": [ { "type": "scatter", "marker": { "colorbar": { "len": 0.2, "ticks": "inside", "ticklen": 6, "tickcolor": "rgb(237,237,237)", "outlinewidth": 0 } } } ], "surface": [ { "type": "surface", "colorbar": { "len": 0.2, "ticks": "inside", "ticklen": 6, "tickcolor": "rgb(237,237,237)", "outlinewidth": 0 } } ], "heatmapgl": [ { "type": "heatmapgl", "colorbar": { "len": 0.2, "ticks": "inside", "ticklen": 6, "tickcolor": "rgb(237,237,237)", "outlinewidth": 0 } } ], "histogram": [ { "type": "histogram", "marker": { "colorbar": { "len": 0.2, "ticks": "inside", "ticklen": 6, "tickcolor": "rgb(237,237,237)", "outlinewidth": 0 } } } ], "parcoords": [ { "line": { "colorbar": { "len": 0.2, "ticks": "inside", "ticklen": 6, "tickcolor": "rgb(237,237,237)", "outlinewidth": 0 } }, "type": "parcoords" } ], "scatter3d": [ { "type": "scatter3d", "marker": { "colorbar": { "len": 0.2, "ticks": "inside", "ticklen": 6, "tickcolor": "rgb(237,237,237)", "outlinewidth": 0 } } } ], "scattergl": [ { "type": "scattergl", "marker": { "colorbar": { "len": 0.2, "ticks": "inside", "ticklen": 6, "tickcolor": "rgb(237,237,237)", "outlinewidth": 0 } } } ], "choropleth": [ { "type": "choropleth", "colorbar": { "len": 0.2, "ticks": "inside", "ticklen": 6, "tickcolor": "rgb(237,237,237)", "outlinewidth": 0 } } ], "scattergeo": [ { "type": "scattergeo", "marker": { "colorbar": { "len": 0.2, "ticks": "inside", "ticklen": 6, "tickcolor": "rgb(237,237,237)", "outlinewidth": 0 } } } ], "histogram2d": [ { "type": "histogram2d", "colorbar": { "len": 0.2, "ticks": "inside", "ticklen": 6, "tickcolor": "rgb(237,237,237)", "outlinewidth": 0 }, "autocolorscale": true } ], "scatterpolar": [ { "type": "scatterpolar", "marker": { "colorbar": { "len": 0.2, "ticks": "inside", "ticklen": 6, "tickcolor": "rgb(237,237,237)", "outlinewidth": 0 } } } ], "contourcarpet": [ { "type": "contourcarpet", "colorbar": { "len": 0.2, "ticks": "inside", "ticklen": 6, "tickcolor": "rgb(237,237,237)", "outlinewidth": 0 } } ], "scattercarpet": [ { "type": "scattercarpet", "marker": { "colorbar": { "len": 0.2, "ticks": "inside", "ticklen": 6, "tickcolor": "rgb(237,237,237)", "outlinewidth": 0 } } } ], "scattermapbox": [ { "type": "scattermapbox", "marker": { "colorbar": { "len": 0.2, "ticks": "inside", "ticklen": 6, "tickcolor": "rgb(237,237,237)", "outlinewidth": 0 } } } ], "scatterpolargl": [ { "type": "scatterpolargl", "marker": { "colorbar": { "len": 0.2, "ticks": "inside", "ticklen": 6, "tickcolor": "rgb(237,237,237)", "outlinewidth": 0 } } } ], "scatterternary": [ { "type": "scatterternary", "marker": { "colorbar": { "len": 0.2, "ticks": "inside", "ticklen": 6, "tickcolor": "rgb(237,237,237)", "outlinewidth": 0 } } } ], "histogram2dcontour": [ { "type": "histogram2dcontour", "colorbar": { "len": 0.2, "ticks": "inside", "ticklen": 6, "tickcolor": "rgb(237,237,237)", "outlinewidth": 0 }, "autocolorscale": true } ] }, "layout": { "geo": { "bgcolor": "white", "showland": true, "lakecolor": "white", "landcolor": "rgb(237,237,237)", "showlakes": true, "subunitcolor": "white" }, "font": { "color": "rgb(51,51,51)" }, "polar": { "bgcolor": "rgb(237,237,237)", "radialaxis": { "ticks": "outside", "showgrid": true, "gridcolor": "white", "linecolor": "white", "tickcolor": "rgb(51,51,51)" }, "angularaxis": { "ticks": "outside", "showgrid": true, "gridcolor": "white", "linecolor": "white", "tickcolor": "rgb(51,51,51)" } }, "scene": { "xaxis": { "ticks": "outside", "showgrid": true, "gridcolor": "white", "gridwidth": 2, "linecolor": "white", "tickcolor": "rgb(51,51,51)", "zerolinecolor": "white", "showbackground": true, "backgroundcolor": "rgb(237,237,237)" }, "yaxis": { "ticks": "outside", "showgrid": true, "gridcolor": "white", "gridwidth": 2, "linecolor": "white", "tickcolor": "rgb(51,51,51)", "zerolinecolor": "white", "showbackground": true, "backgroundcolor": "rgb(237,237,237)" }, "zaxis": { "ticks": "outside", "showgrid": true, "gridcolor": "white", "gridwidth": 2, "linecolor": "white", "tickcolor": "rgb(51,51,51)", "zerolinecolor": "white", "showbackground": true, "backgroundcolor": "rgb(237,237,237)" } }, "xaxis": { "ticks": "outside", "showgrid": true, "gridcolor": "white", "linecolor": "white", "tickcolor": "rgb(51,51,51)", "automargin": true, "zerolinecolor": "white" }, "yaxis": { "ticks": "outside", "showgrid": true, "gridcolor": "white", "linecolor": "white", "tickcolor": "rgb(51,51,51)", "automargin": true, "zerolinecolor": "white" }, "ternary": { "aaxis": { "ticks": "outside", "showgrid": true, "gridcolor": "white", "linecolor": "white", "tickcolor": "rgb(51,51,51)" }, "baxis": { "ticks": "outside", "showgrid": true, "gridcolor": "white", "linecolor": "white", "tickcolor": "rgb(51,51,51)" }, "caxis": { "ticks": "outside", "showgrid": true, "gridcolor": "white", "linecolor": "white", "tickcolor": "rgb(51,51,51)" }, "bgcolor": "rgb(237,237,237)" }, "colorway": [ "#F8766D", "#A3A500", "#00BF7D", "#00B0F6", "#E76BF3" ], "hovermode": "closest", "colorscale": { "diverging": [ [ 0, "#40004b" ], [ 0.1, "#762a83" ], [ 0.2, "#9970ab" ], [ 0.3, "#c2a5cf" ], [ 0.4, "#e7d4e8" ], [ 0.5, "#f7f7f7" ], [ 0.6, "#d9f0d3" ], [ 0.7, "#a6dba0" ], [ 0.8, "#5aae61" ], [ 0.9, "#1b7837" ], [ 1, "#00441b" ] ], "sequential": [ [ 0, "rgb(20,44,66)" ], [ 1, "rgb(90,179,244)" ] ], "sequentialminus": [ [ 0, "rgb(20,44,66)" ], [ 1, "rgb(90,179,244)" ] ] }, "plot_bgcolor": "rgb(237,237,237)", "paper_bgcolor": "white", "shapedefaults": { "line": { "width": 0 }, "opacity": 0.3, "fillcolor": "black" }, "annotationdefaults": { "arrowhead": 0, "arrowwidth": 1 } }, "themeRef": "GGPLOT2" } } }, "height": null, "width": null, "user": { "profile_url": "https://chart-studio.plotly.com/~adityaiyer98", "avatar_url": "https://storage.googleapis.com/plotly-prod-profiles/45.jpg", "background_url": "https://storage.googleapis.com/plotly-prod-profiles/bg-1.jpg", "bio": "", "nickname": "", "website": "", "stream_tokens": null, "feature_set_id": null, "csrf_token": null, "date_joined": "2025-08-27 20:38:42", "mapbox_access_tokens": null, "has_password": null, "username": "adityaiyer98", "email": null, "is_active": null, "readonly": null, "is_dash_creator": null, "dash_created_count": null, "is_chart_creator": null, "charts_created_count": null } } ] }
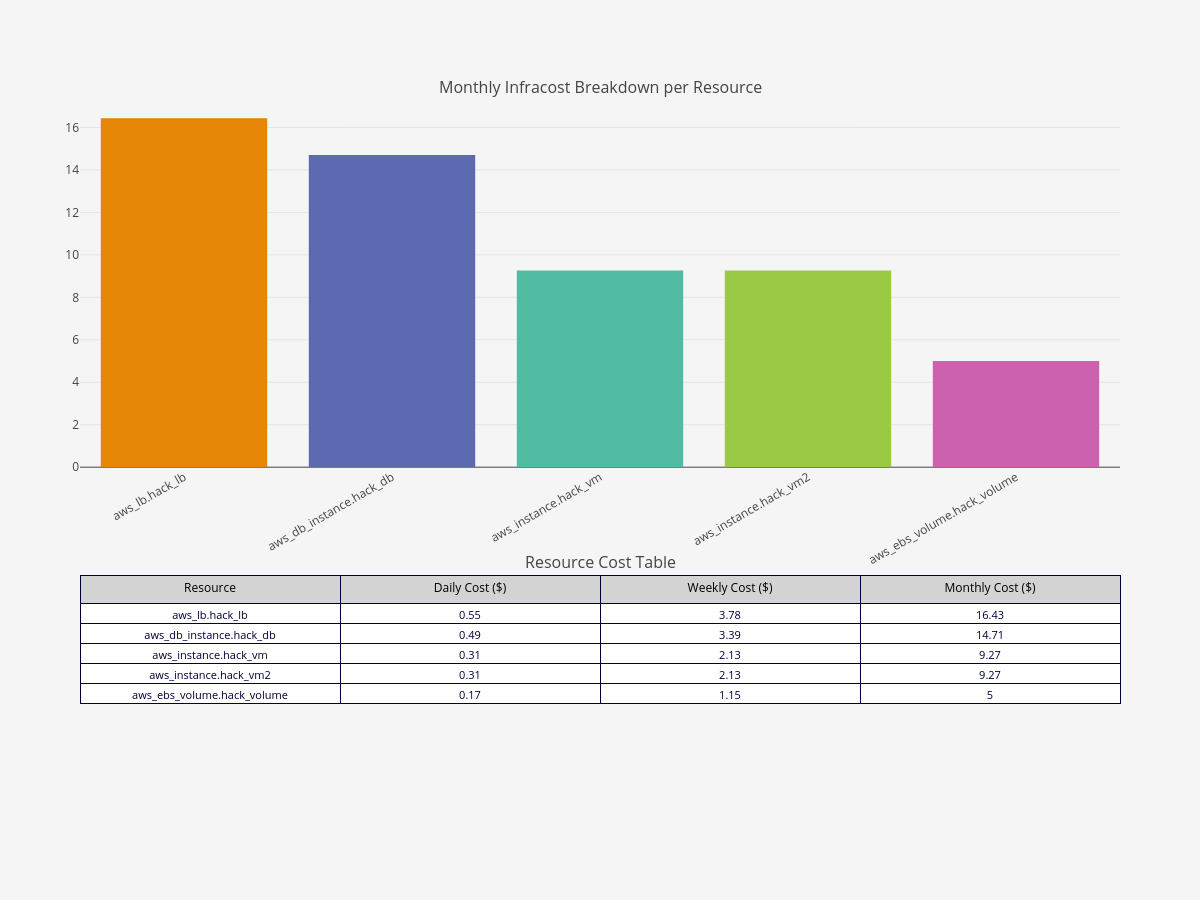
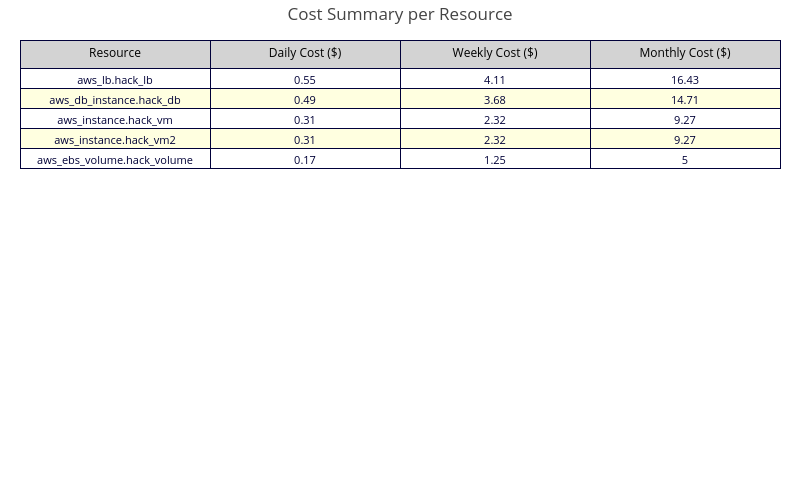
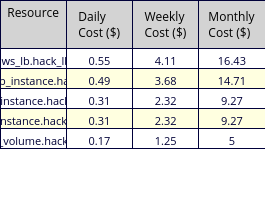
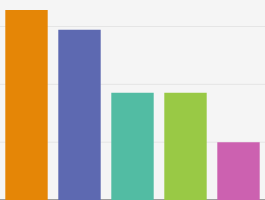
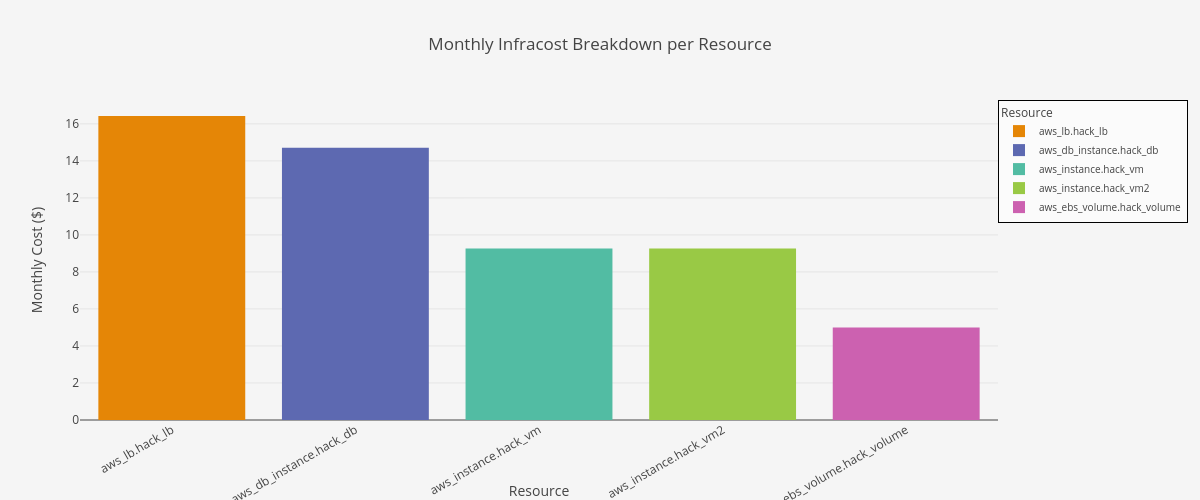
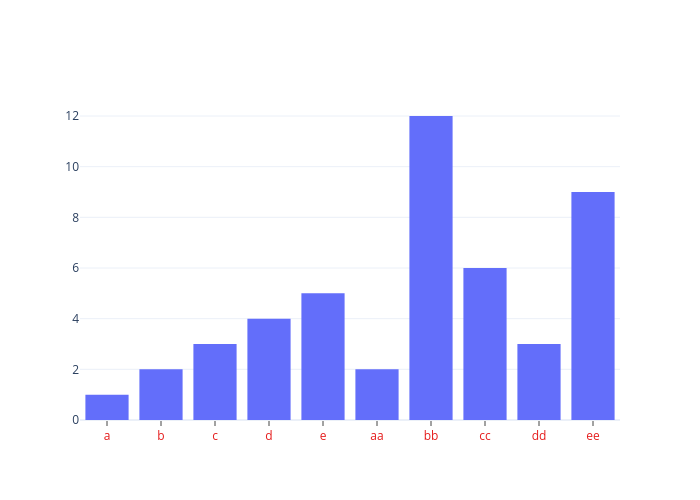
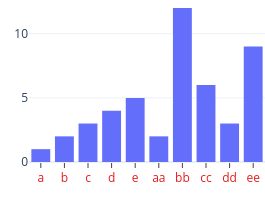