Plots List
Plots
This endpoint handles manipulation of Plotly plot files.
Reference
Authorization
Any user with or without a Plotly account may view public plots. For private plots, see authentication.
Actions
list
Listing all public plots can be done via a GET request to this endpoint.
By default, plots will be listed in order of date created. The order_by
query parameter is accepted at this endpoint. Currently, only ordering by
views is supported. It is possible to filter the plots by quality
with min_quality or max_quality as query parameter.
Example:
// GET https://api.plotly.com/v2/plots/ ---> 200

// GET https://api.plotly.com/v2/plots/?order_by=-views ---> 200

// GET https://api.plotly.com/v2/plots/?min_quality=5 ---> 200

// GET https://api.plotly.com/v2/plots/?max_quality=5 ---> 200
feed
Listing all handpicked feed plots can be done via a GET request to this endpoint. By default, plots will be listed in a random order.
Example:
// GET https://api.plotly.com/v2/plots/feed ---> 200
create
You can create new plot resources here. The only required field is 'figure'. Currently, the figure is restricted to only contain references to grid data. That is, this will fail if raw data arrays are passed in. To create and manipulate underlying grids for plots, see the grids endpoint.
Example:
// This fails because a figure field is required.
// POST https://api.plotly.com/v2/plots ---> 400 Bad Request
{}

// This fails because the figure has raw data
//POST https://api.plotly.com/v2/plots ---> 400 Bad Request
{
    "figure": {"data": [{"y": ['this', 'is', 'raw', 'data']}]}
}

// This succeeds because the figure has src keys, not raw data.
//POST https://api.plotly.com/v2/plots ---> 200 OK
{
    "figure": {"data": [{"ysrc": "sven:88:u8nd62"}]}
}
When creating a grid, you can optionally specify a source_fid to specify where a plot has come from:
- source_fid: the fid of a plot that was copied (and presumably edited) to produce this one
detail
There is a lot of meta information stored about plot files including filename, title, share_url, and content_url to name a few.
This information can only be reached with a GET to this endpoint.
Example:
// GET https://api.plotly.com/v2/plots/iheartgraphs:90
content
The contents of a plot can be downloaded via the content resource. The plot
content contains referenced grid/column data by default. If you wish to
return the raw grid/column data, the inline_data=true query must be included
in the request url. The Content-Type header will be appropriately set for the
response body.
Alternatively, you can set ?map_data=unreadable to append a mapping of
sources to data that belongs to grids which are unreadable for the
requestor. This is useful when you have read access to another users plot,
but that plot contains grid references which you don't have access to.
Examples:
// Returns referenced grid/column data
// GET https://api.plotly.com/v2/plots/iheartgraphs:90/content ---> 200 OK

// Returns full grid/column data
// GET https://api.plotly.com/v2/plots/iheartgraphs:90/content?inline_data=true ---> 200 OK

// Returns full grid/column data when requestor doesn't have permission
// to read the referenced grid.
// GET https://api.plotly.com/v2/plots/iheartgraphs:90/content?map_data=unreadable ---> 200 OK
GET /v2/plots?cursor=cj0xJnA9MjAyNC0wNC0xNisxNiUzQTQxJTNBMTQuOTE2NTA3JTJCMDAlM0EwMA%3D%3D&format=api
{ "next": "https://api.plotly.com/v2/plots?cursor=cD0yMDI0LTA0LTE2KzE2JTNBNDElM0ExOC43NTEwODglMkIwMCUzQTAw&format=api", "previous": "https://api.plotly.com/v2/plots?cursor=cj0xJnA9MjAyNC0wNC0xNisxNiUzQTU5JTNBNDcuNDk4MTk2JTJCMDAlM0EwMA%3D%3D&format=api", "results": [ { "creation_time": "2024-04-16T16:59:47.498196Z", "comments": { "results": [], "count": 0 }, "parented": true, "embed_url": "https://chart-studio.plotly.com/~parvathykrishnank/68.embed", "fid": "parvathykrishnank:68", "filename": "pareto_blog", "filetype": "plot", "img_url": "https://api.plotly.com/v2/files/parvathykrishnank:68/image?image_name=list-thumb", "image_urls": { "default": "https://storage.googleapis.com/plotly-prod-images/parvathykrishnank/68/2_OAS8KWH3HTWGKQLC5T0D7PMM9SDZQ0.png", "block-thumb": "https://storage.googleapis.com/plotly-prod-images/parvathykrishnank/68/8_MILK9NDB7Y4VQ32MP6SWF3C0A9URRD.png", "list-thumb": "https://api.plotly.com/v2/files/parvathykrishnank:68/image?image_name=list-thumb" }, "api_urls": { "files": "https://api.plotly.com/v2/files/parvathykrishnank:68", "plots": "https://api.plotly.com/v2/plots/parvathykrishnank:68", "parent": "https://api.plotly.com/v2/folders/home?user=parvathykrishnank" }, "owner": "parvathykrishnank", "parent": -1, "preview": "", "referencers": [], "references": [], "title": "", "views": 1347, "web_url": "https://chart-studio.plotly.com/~parvathykrishnank/68/", "world_readable": true, "date_modified": "2024-06-11T04:40:12.959Z", "stars": { "results": [], "count": 0 }, "collaborators": { "results": [], "count": 0 }, "subfolder_count": null, "refresh_interval": null, "organize_view_url": "https://chart-studio.plotly.com/~parvathykrishnank/68/", "current_user_permission": "read", "is_theme": null, "is_template": null, "autosize": true, "caption": "", "figure": { "data": [ { "mode": "lines", "type": "scatter", "xsrc": "parvathykrishnank:72:86b818", "ysrc": "parvathykrishnank:72:43fa4c" } ], "layout": { "width": 1200, "xaxis": { "range": [ 0, 100 ], "title": { "text": "Number of facilities (existing + new)" } }, "yaxis": { "range": [ 0, 100 ], "title": { "text": "Percentage of population with access" } }, "shapes": [ { "x0": 14, "x1": 14, "y0": 0, "y1": 1, "line": { "dash": "dash", "color": "green", "width": 3 }, "type": "line", "xref": "x", "yref": "y domain" }, { "x0": 0, "x1": 1, "y0": 86.3, "y1": 86.3, "line": { "dash": "dash", "color": "green", "width": 3 }, "type": "line", "xref": "x domain", "yref": "y" } ], "template": { "data": { "bar": [ { "type": "bar", "marker": { "line": { "color": "#E5ECF6", "width": 0.5 }, "pattern": { "size": 10, "fillmode": "overlay", "solidity": 0.2 } }, "error_x": { "color": "#2a3f5f" }, "error_y": { "color": "#2a3f5f" } } ], "pie": [ { "type": "pie", "automargin": true } ], "table": [ { "type": "table", "cells": { "fill": { "color": "#EBF0F8" }, "line": { "color": "white" } }, "header": { "fill": { "color": "#C8D4E3" }, "line": { "color": "white" } } } ], "carpet": [ { "type": "carpet", "aaxis": { "gridcolor": "white", "linecolor": "white", "endlinecolor": "#2a3f5f", "minorgridcolor": "white", "startlinecolor": "#2a3f5f" }, "baxis": { "gridcolor": "white", "linecolor": "white", "endlinecolor": "#2a3f5f", "minorgridcolor": "white", "startlinecolor": "#2a3f5f" } } ], "mesh3d": [ { "type": "mesh3d", "colorbar": { "ticks": "", "outlinewidth": 0 } } ], "contour": [ { "type": "contour", "colorbar": { "ticks": "", "outlinewidth": 0 }, "colorscale": [ [ 0.0, "#0d0887" ], [ 0.1111111111111111, "#46039f" ], [ 0.2222222222222222, "#7201a8" ], [ 0.3333333333333333, "#9c179e" ], [ 0.4444444444444444, "#bd3786" ], [ 0.5555555555555556, "#d8576b" ], [ 0.6666666666666666, "#ed7953" ], [ 0.7777777777777778, "#fb9f3a" ], [ 0.8888888888888888, "#fdca26" ], [ 1.0, "#f0f921" ] ] } ], "heatmap": [ { "type": "heatmap", "colorbar": { "ticks": "", "outlinewidth": 0 }, "colorscale": [ [ 0.0, "#0d0887" ], [ 0.1111111111111111, "#46039f" ], [ 0.2222222222222222, "#7201a8" ], [ 0.3333333333333333, "#9c179e" ], [ 0.4444444444444444, "#bd3786" ], [ 0.5555555555555556, "#d8576b" ], [ 0.6666666666666666, "#ed7953" ], [ 0.7777777777777778, "#fb9f3a" ], [ 0.8888888888888888, "#fdca26" ], [ 1.0, "#f0f921" ] ] } ], "scatter": [ { "type": "scatter", "fillpattern": { "size": 10, "fillmode": "overlay", "solidity": 0.2 } } ], "surface": [ { "type": "surface", "colorbar": { "ticks": "", "outlinewidth": 0 }, "colorscale": [ [ 0.0, "#0d0887" ], [ 0.1111111111111111, "#46039f" ], [ 0.2222222222222222, "#7201a8" ], [ 0.3333333333333333, "#9c179e" ], [ 0.4444444444444444, "#bd3786" ], [ 0.5555555555555556, "#d8576b" ], [ 0.6666666666666666, "#ed7953" ], [ 0.7777777777777778, "#fb9f3a" ], [ 0.8888888888888888, "#fdca26" ], [ 1.0, "#f0f921" ] ] } ], "barpolar": [ { "type": "barpolar", "marker": { "line": { "color": "#E5ECF6", "width": 0.5 }, "pattern": { "size": 10, "fillmode": "overlay", "solidity": 0.2 } } } ], "heatmapgl": [ { "type": "heatmapgl", "colorbar": { "ticks": "", "outlinewidth": 0 }, "colorscale": [ [ 0.0, "#0d0887" ], [ 0.1111111111111111, "#46039f" ], [ 0.2222222222222222, "#7201a8" ], [ 0.3333333333333333, "#9c179e" ], [ 0.4444444444444444, "#bd3786" ], [ 0.5555555555555556, "#d8576b" ], [ 0.6666666666666666, "#ed7953" ], [ 0.7777777777777778, "#fb9f3a" ], [ 0.8888888888888888, "#fdca26" ], [ 1.0, "#f0f921" ] ] } ], "histogram": [ { "type": "histogram", "marker": { "pattern": { "size": 10, "fillmode": "overlay", "solidity": 0.2 } } } ], "parcoords": [ { "line": { "colorbar": { "ticks": "", "outlinewidth": 0 } }, "type": "parcoords" } ], "scatter3d": [ { "line": { "colorbar": { "ticks": "", "outlinewidth": 0 } }, "type": "scatter3d", "marker": { "colorbar": { "ticks": "", "outlinewidth": 0 } } } ], "scattergl": [ { "type": "scattergl", "marker": { "colorbar": { "ticks": "", "outlinewidth": 0 } } } ], "choropleth": [ { "type": "choropleth", "colorbar": { "ticks": "", "outlinewidth": 0 } } ], "scattergeo": [ { "type": "scattergeo", "marker": { "colorbar": { "ticks": "", "outlinewidth": 0 } } } ], "histogram2d": [ { "type": "histogram2d", "colorbar": { "ticks": "", "outlinewidth": 0 }, "colorscale": [ [ 0.0, "#0d0887" ], [ 0.1111111111111111, "#46039f" ], [ 0.2222222222222222, "#7201a8" ], [ 0.3333333333333333, "#9c179e" ], [ 0.4444444444444444, "#bd3786" ], [ 0.5555555555555556, "#d8576b" ], [ 0.6666666666666666, "#ed7953" ], [ 0.7777777777777778, "#fb9f3a" ], [ 0.8888888888888888, "#fdca26" ], [ 1.0, "#f0f921" ] ] } ], "scatterpolar": [ { "type": "scatterpolar", "marker": { "colorbar": { "ticks": "", "outlinewidth": 0 } } } ], "contourcarpet": [ { "type": "contourcarpet", "colorbar": { "ticks": "", "outlinewidth": 0 } } ], "scattercarpet": [ { "type": "scattercarpet", "marker": { "colorbar": { "ticks": "", "outlinewidth": 0 } } } ], "scattermapbox": [ { "type": "scattermapbox", "marker": { "colorbar": { "ticks": "", "outlinewidth": 0 } } } ], "scatterpolargl": [ { "type": "scatterpolargl", "marker": { "colorbar": { "ticks": "", "outlinewidth": 0 } } } ], "scatterternary": [ { "type": "scatterternary", "marker": { "colorbar": { "ticks": "", "outlinewidth": 0 } } } ], "histogram2dcontour": [ { "type": "histogram2dcontour", "colorbar": { "ticks": "", "outlinewidth": 0 }, "colorscale": [ [ 0.0, "#0d0887" ], [ 0.1111111111111111, "#46039f" ], [ 0.2222222222222222, "#7201a8" ], [ 0.3333333333333333, "#9c179e" ], [ 0.4444444444444444, "#bd3786" ], [ 0.5555555555555556, "#d8576b" ], [ 0.6666666666666666, "#ed7953" ], [ 0.7777777777777778, "#fb9f3a" ], [ 0.8888888888888888, "#fdca26" ], [ 1.0, "#f0f921" ] ] } ] }, "layout": { "geo": { "bgcolor": "white", "showland": true, "lakecolor": "white", "landcolor": "#E5ECF6", "showlakes": true, "subunitcolor": "white" }, "font": { "color": "#2a3f5f" }, "polar": { "bgcolor": "#E5ECF6", "radialaxis": { "ticks": "", "gridcolor": "white", "linecolor": "white" }, "angularaxis": { "ticks": "", "gridcolor": "white", "linecolor": "white" } }, "scene": { "xaxis": { "ticks": "", "gridcolor": "white", "gridwidth": 2, "linecolor": "white", "zerolinecolor": "white", "showbackground": true, "backgroundcolor": "#E5ECF6" }, "yaxis": { "ticks": "", "gridcolor": "white", "gridwidth": 2, "linecolor": "white", "zerolinecolor": "white", "showbackground": true, "backgroundcolor": "#E5ECF6" }, "zaxis": { "ticks": "", "gridcolor": "white", "gridwidth": 2, "linecolor": "white", "zerolinecolor": "white", "showbackground": true, "backgroundcolor": "#E5ECF6" } }, "title": { "x": 0.05 }, "xaxis": { "ticks": "", "title": { "standoff": 15 }, "gridcolor": "white", "linecolor": "white", "automargin": true, "zerolinecolor": "white", "zerolinewidth": 2 }, "yaxis": { "ticks": "", "title": { "standoff": 15 }, "gridcolor": "white", "linecolor": "white", "automargin": true, "zerolinecolor": "white", "zerolinewidth": 2 }, "mapbox": { "style": "light" }, "ternary": { "aaxis": { "ticks": "", "gridcolor": "white", "linecolor": "white" }, "baxis": { "ticks": "", "gridcolor": "white", "linecolor": "white" }, "caxis": { "ticks": "", "gridcolor": "white", "linecolor": "white" }, "bgcolor": "#E5ECF6" }, "colorway": [ "#636efa", "#EF553B", "#00cc96", "#ab63fa", "#FFA15A", "#19d3f3", "#FF6692", "#B6E880", "#FF97FF", "#FECB52" ], "coloraxis": { "colorbar": { "ticks": "", "outlinewidth": 0 } }, "hovermode": "closest", "colorscale": { "diverging": [ [ 0, "#8e0152" ], [ 0.1, "#c51b7d" ], [ 0.2, "#de77ae" ], [ 0.3, "#f1b6da" ], [ 0.4, "#fde0ef" ], [ 0.5, "#f7f7f7" ], [ 0.6, "#e6f5d0" ], [ 0.7, "#b8e186" ], [ 0.8, "#7fbc41" ], [ 0.9, "#4d9221" ], [ 1, "#276419" ] ], "sequential": [ [ 0.0, "#0d0887" ], [ 0.1111111111111111, "#46039f" ], [ 0.2222222222222222, "#7201a8" ], [ 0.3333333333333333, "#9c179e" ], [ 0.4444444444444444, "#bd3786" ], [ 0.5555555555555556, "#d8576b" ], [ 0.6666666666666666, "#ed7953" ], [ 0.7777777777777778, "#fb9f3a" ], [ 0.8888888888888888, "#fdca26" ], [ 1.0, "#f0f921" ] ], "sequentialminus": [ [ 0.0, "#0d0887" ], [ 0.1111111111111111, "#46039f" ], [ 0.2222222222222222, "#7201a8" ], [ 0.3333333333333333, "#9c179e" ], [ 0.4444444444444444, "#bd3786" ], [ 0.5555555555555556, "#d8576b" ], [ 0.6666666666666666, "#ed7953" ], [ 0.7777777777777778, "#fb9f3a" ], [ 0.8888888888888888, "#fdca26" ], [ 1.0, "#f0f921" ] ] }, "hoverlabel": { "align": "left" }, "plot_bgcolor": "#E5ECF6", "paper_bgcolor": "white", "shapedefaults": { "line": { "color": "#2a3f5f" } }, "autotypenumbers": "strict", "annotationdefaults": { "arrowhead": 0, "arrowcolor": "#2a3f5f", "arrowwidth": 1 } } }, "annotations": [ { "x": 14, "y": 50, "ax": 20, "ay": -30, "text": "Number of existing facilities", "arrowhead": 1, "showarrow": true }, { "x": 13, "y": 87, "ax": 10, "ay": -30, "text": "Maximum access possible with the potential location list", "arrowhead": 1, "showarrow": true } ], "plot_bgcolor": "white" } }, "height": null, "width": 1200, "user": { "profile_url": "https://chart-studio.plotly.com/~parvathykrishnank", "avatar_url": "https://storage.googleapis.com/plotly-prod-profiles/87.jpg", "background_url": "https://storage.googleapis.com/plotly-prod-profiles/bg-1.jpg", "bio": "", "nickname": "", "website": "", "stream_tokens": null, "feature_set_id": null, "csrf_token": null, "date_joined": "2018-02-14 20:49:52", "mapbox_access_tokens": null, "has_password": null, "username": "parvathykrishnank", "email": null, "is_active": null, "readonly": null, "is_dash_creator": null, "dash_created_count": null, "is_chart_creator": null, "charts_created_count": null } }, { "creation_time": "2024-04-16T16:57:31.204095Z", "comments": { "results": [], "count": 0 }, "parented": true, "embed_url": "https://chart-studio.plotly.com/~parvathykrishnank/64.embed", "fid": "parvathykrishnank:64", "filename": "pareto_curve", "filetype": "plot", "img_url": "https://storage.googleapis.com/plotly-prod-images/parvathykrishnank/64/9_CCH9KZS5KRK6OKMMA7DE1Q6FPU3PKH.png", "image_urls": { "default": "https://storage.googleapis.com/plotly-prod-images/parvathykrishnank/64/2_ZHB3ZF6S5SYGK1G87FOG5S20VBUKZM.png", "block-thumb": "https://storage.googleapis.com/plotly-prod-images/parvathykrishnank/64/8_XSSSDPIRBWUKVGK5I3AJEDITXXK28J.png", "list-thumb": "https://storage.googleapis.com/plotly-prod-images/parvathykrishnank/64/9_CCH9KZS5KRK6OKMMA7DE1Q6FPU3PKH.png" }, "api_urls": { "files": "https://api.plotly.com/v2/files/parvathykrishnank:64", "plots": "https://api.plotly.com/v2/plots/parvathykrishnank:64", "parent": "https://api.plotly.com/v2/folders/home?user=parvathykrishnank" }, "owner": "parvathykrishnank", "parent": -1, "preview": "", "referencers": [], "references": [], "title": "", "views": 1, "web_url": "https://chart-studio.plotly.com/~parvathykrishnank/64/", "world_readable": true, "date_modified": "2024-04-16T16:59:08.542Z", "stars": { "results": [], "count": 0 }, "collaborators": { "results": [], "count": 0 }, "subfolder_count": null, "refresh_interval": null, "organize_view_url": "https://chart-studio.plotly.com/~parvathykrishnank/64/", "current_user_permission": "read", "is_theme": null, "is_template": null, "autosize": true, "caption": "", "figure": { "data": [ { "mode": "lines", "type": "scatter", "xsrc": "parvathykrishnank:66:fd590a", "ysrc": "parvathykrishnank:66:3ae70f" } ], "layout": { "title": { "text": "Pareto Curve" }, "width": 1200, "xaxis": { "range": [ 0, 100 ], "title": { "text": "Number of new facilities" } }, "yaxis": { "range": [ 0, 100 ], "title": { "text": "Percentage of population with access" } }, "shapes": [ { "x0": 14, "x1": 14, "y0": 0, "y1": 1, "line": { "dash": "dash", "color": "green", "width": 3 }, "type": "line", "xref": "x", "yref": "y domain" }, { "x0": 0, "x1": 1, "y0": 86.17, "y1": 86.17, "line": { "dash": "dash", "color": "green", "width": 3 }, "type": "line", "xref": "x domain", "yref": "y" } ], "template": { "data": { "bar": [ { "type": "bar", "marker": { "line": { "color": "#E5ECF6", "width": 0.5 }, "pattern": { "size": 10, "fillmode": "overlay", "solidity": 0.2 } }, "error_x": { "color": "#2a3f5f" }, "error_y": { "color": "#2a3f5f" } } ], "pie": [ { "type": "pie", "automargin": true } ], "table": [ { "type": "table", "cells": { "fill": { "color": "#EBF0F8" }, "line": { "color": "white" } }, "header": { "fill": { "color": "#C8D4E3" }, "line": { "color": "white" } } } ], "carpet": [ { "type": "carpet", "aaxis": { "gridcolor": "white", "linecolor": "white", "endlinecolor": "#2a3f5f", "minorgridcolor": "white", "startlinecolor": "#2a3f5f" }, "baxis": { "gridcolor": "white", "linecolor": "white", "endlinecolor": "#2a3f5f", "minorgridcolor": "white", "startlinecolor": "#2a3f5f" } } ], "mesh3d": [ { "type": "mesh3d", "colorbar": { "ticks": "", "outlinewidth": 0 } } ], "contour": [ { "type": "contour", "colorbar": { "ticks": "", "outlinewidth": 0 }, "colorscale": [ [ 0.0, "#0d0887" ], [ 0.1111111111111111, "#46039f" ], [ 0.2222222222222222, "#7201a8" ], [ 0.3333333333333333, "#9c179e" ], [ 0.4444444444444444, "#bd3786" ], [ 0.5555555555555556, "#d8576b" ], [ 0.6666666666666666, "#ed7953" ], [ 0.7777777777777778, "#fb9f3a" ], [ 0.8888888888888888, "#fdca26" ], [ 1.0, "#f0f921" ] ] } ], "heatmap": [ { "type": "heatmap", "colorbar": { "ticks": "", "outlinewidth": 0 }, "colorscale": [ [ 0.0, "#0d0887" ], [ 0.1111111111111111, "#46039f" ], [ 0.2222222222222222, "#7201a8" ], [ 0.3333333333333333, "#9c179e" ], [ 0.4444444444444444, "#bd3786" ], [ 0.5555555555555556, "#d8576b" ], [ 0.6666666666666666, "#ed7953" ], [ 0.7777777777777778, "#fb9f3a" ], [ 0.8888888888888888, "#fdca26" ], [ 1.0, "#f0f921" ] ] } ], "scatter": [ { "type": "scatter", "fillpattern": { "size": 10, "fillmode": "overlay", "solidity": 0.2 } } ], "surface": [ { "type": "surface", "colorbar": { "ticks": "", "outlinewidth": 0 }, "colorscale": [ [ 0.0, "#0d0887" ], [ 0.1111111111111111, "#46039f" ], [ 0.2222222222222222, "#7201a8" ], [ 0.3333333333333333, "#9c179e" ], [ 0.4444444444444444, "#bd3786" ], [ 0.5555555555555556, "#d8576b" ], [ 0.6666666666666666, "#ed7953" ], [ 0.7777777777777778, "#fb9f3a" ], [ 0.8888888888888888, "#fdca26" ], [ 1.0, "#f0f921" ] ] } ], "barpolar": [ { "type": "barpolar", "marker": { "line": { "color": "#E5ECF6", "width": 0.5 }, "pattern": { "size": 10, "fillmode": "overlay", "solidity": 0.2 } } } ], "heatmapgl": [ { "type": "heatmapgl", "colorbar": { "ticks": "", "outlinewidth": 0 }, "colorscale": [ [ 0.0, "#0d0887" ], [ 0.1111111111111111, "#46039f" ], [ 0.2222222222222222, "#7201a8" ], [ 0.3333333333333333, "#9c179e" ], [ 0.4444444444444444, "#bd3786" ], [ 0.5555555555555556, "#d8576b" ], [ 0.6666666666666666, "#ed7953" ], [ 0.7777777777777778, "#fb9f3a" ], [ 0.8888888888888888, "#fdca26" ], [ 1.0, "#f0f921" ] ] } ], "histogram": [ { "type": "histogram", "marker": { "pattern": { "size": 10, "fillmode": "overlay", "solidity": 0.2 } } } ], "parcoords": [ { "line": { "colorbar": { "ticks": "", "outlinewidth": 0 } }, "type": "parcoords" } ], "scatter3d": [ { "line": { "colorbar": { "ticks": "", "outlinewidth": 0 } }, "type": "scatter3d", "marker": { "colorbar": { "ticks": "", "outlinewidth": 0 } } } ], "scattergl": [ { "type": "scattergl", "marker": { "colorbar": { "ticks": "", "outlinewidth": 0 } } } ], "choropleth": [ { "type": "choropleth", "colorbar": { "ticks": "", "outlinewidth": 0 } } ], "scattergeo": [ { "type": "scattergeo", "marker": { "colorbar": { "ticks": "", "outlinewidth": 0 } } } ], "histogram2d": [ { "type": "histogram2d", "colorbar": { "ticks": "", "outlinewidth": 0 }, "colorscale": [ [ 0.0, "#0d0887" ], [ 0.1111111111111111, "#46039f" ], [ 0.2222222222222222, "#7201a8" ], [ 0.3333333333333333, "#9c179e" ], [ 0.4444444444444444, "#bd3786" ], [ 0.5555555555555556, "#d8576b" ], [ 0.6666666666666666, "#ed7953" ], [ 0.7777777777777778, "#fb9f3a" ], [ 0.8888888888888888, "#fdca26" ], [ 1.0, "#f0f921" ] ] } ], "scatterpolar": [ { "type": "scatterpolar", "marker": { "colorbar": { "ticks": "", "outlinewidth": 0 } } } ], "contourcarpet": [ { "type": "contourcarpet", "colorbar": { "ticks": "", "outlinewidth": 0 } } ], "scattercarpet": [ { "type": "scattercarpet", "marker": { "colorbar": { "ticks": "", "outlinewidth": 0 } } } ], "scattermapbox": [ { "type": "scattermapbox", "marker": { "colorbar": { "ticks": "", "outlinewidth": 0 } } } ], "scatterpolargl": [ { "type": "scatterpolargl", "marker": { "colorbar": { "ticks": "", "outlinewidth": 0 } } } ], "scatterternary": [ { "type": "scatterternary", "marker": { "colorbar": { "ticks": "", "outlinewidth": 0 } } } ], "histogram2dcontour": [ { "type": "histogram2dcontour", "colorbar": { "ticks": "", "outlinewidth": 0 }, "colorscale": [ [ 0.0, "#0d0887" ], [ 0.1111111111111111, "#46039f" ], [ 0.2222222222222222, "#7201a8" ], [ 0.3333333333333333, "#9c179e" ], [ 0.4444444444444444, "#bd3786" ], [ 0.5555555555555556, "#d8576b" ], [ 0.6666666666666666, "#ed7953" ], [ 0.7777777777777778, "#fb9f3a" ], [ 0.8888888888888888, "#fdca26" ], [ 1.0, "#f0f921" ] ] } ] }, "layout": { "geo": { "bgcolor": "white", "showland": true, "lakecolor": "white", "landcolor": "#E5ECF6", "showlakes": true, "subunitcolor": "white" }, "font": { "color": "#2a3f5f" }, "polar": { "bgcolor": "#E5ECF6", "radialaxis": { "ticks": "", "gridcolor": "white", "linecolor": "white" }, "angularaxis": { "ticks": "", "gridcolor": "white", "linecolor": "white" } }, "scene": { "xaxis": { "ticks": "", "gridcolor": "white", "gridwidth": 2, "linecolor": "white", "zerolinecolor": "white", "showbackground": true, "backgroundcolor": "#E5ECF6" }, "yaxis": { "ticks": "", "gridcolor": "white", "gridwidth": 2, "linecolor": "white", "zerolinecolor": "white", "showbackground": true, "backgroundcolor": "#E5ECF6" }, "zaxis": { "ticks": "", "gridcolor": "white", "gridwidth": 2, "linecolor": "white", "zerolinecolor": "white", "showbackground": true, "backgroundcolor": "#E5ECF6" } }, "title": { "x": 0.05 }, "xaxis": { "ticks": "", "title": { "standoff": 15 }, "gridcolor": "white", "linecolor": "white", "automargin": true, "zerolinecolor": "white", "zerolinewidth": 2 }, "yaxis": { "ticks": "", "title": { "standoff": 15 }, "gridcolor": "white", "linecolor": "white", "automargin": true, "zerolinecolor": "white", "zerolinewidth": 2 }, "mapbox": { "style": "light" }, "ternary": { "aaxis": { "ticks": "", "gridcolor": "white", "linecolor": "white" }, "baxis": { "ticks": "", "gridcolor": "white", "linecolor": "white" }, "caxis": { "ticks": "", "gridcolor": "white", "linecolor": "white" }, "bgcolor": "#E5ECF6" }, "colorway": [ "#636efa", "#EF553B", "#00cc96", "#ab63fa", "#FFA15A", "#19d3f3", "#FF6692", "#B6E880", "#FF97FF", "#FECB52" ], "coloraxis": { "colorbar": { "ticks": "", "outlinewidth": 0 } }, "hovermode": "closest", "colorscale": { "diverging": [ [ 0, "#8e0152" ], [ 0.1, "#c51b7d" ], [ 0.2, "#de77ae" ], [ 0.3, "#f1b6da" ], [ 0.4, "#fde0ef" ], [ 0.5, "#f7f7f7" ], [ 0.6, "#e6f5d0" ], [ 0.7, "#b8e186" ], [ 0.8, "#7fbc41" ], [ 0.9, "#4d9221" ], [ 1, "#276419" ] ], "sequential": [ [ 0.0, "#0d0887" ], [ 0.1111111111111111, "#46039f" ], [ 0.2222222222222222, "#7201a8" ], [ 0.3333333333333333, "#9c179e" ], [ 0.4444444444444444, "#bd3786" ], [ 0.5555555555555556, "#d8576b" ], [ 0.6666666666666666, "#ed7953" ], [ 0.7777777777777778, "#fb9f3a" ], [ 0.8888888888888888, "#fdca26" ], [ 1.0, "#f0f921" ] ], "sequentialminus": [ [ 0.0, "#0d0887" ], [ 0.1111111111111111, "#46039f" ], [ 0.2222222222222222, "#7201a8" ], [ 0.3333333333333333, "#9c179e" ], [ 0.4444444444444444, "#bd3786" ], [ 0.5555555555555556, "#d8576b" ], [ 0.6666666666666666, "#ed7953" ], [ 0.7777777777777778, "#fb9f3a" ], [ 0.8888888888888888, "#fdca26" ], [ 1.0, "#f0f921" ] ] }, "hoverlabel": { "align": "left" }, "plot_bgcolor": "#E5ECF6", "paper_bgcolor": "white", "shapedefaults": { "line": { "color": "#2a3f5f" } }, "autotypenumbers": "strict", "annotationdefaults": { "arrowhead": 0, "arrowcolor": "#2a3f5f", "arrowwidth": 1 } } }, "annotations": [ { "x": 14, "y": 50, "ax": 20, "ay": -30, "text": "Number of facilities", "arrowhead": 1, "showarrow": true }, { "x": 13, "y": 87, "ax": 10, "ay": -30, "text": "Maximum access possible with the potential location list", "arrowhead": 1, "showarrow": true } ], "plot_bgcolor": "white" } }, "height": null, "width": 1200, "user": { "profile_url": "https://chart-studio.plotly.com/~parvathykrishnank", "avatar_url": "https://storage.googleapis.com/plotly-prod-profiles/87.jpg", "background_url": "https://storage.googleapis.com/plotly-prod-profiles/bg-1.jpg", "bio": "", "nickname": "", "website": "", "stream_tokens": null, "feature_set_id": null, "csrf_token": null, "date_joined": "2018-02-14 20:49:52", "mapbox_access_tokens": null, "has_password": null, "username": "parvathykrishnank", "email": null, "is_active": null, "readonly": null, "is_dash_creator": null, "dash_created_count": null, "is_chart_creator": null, "charts_created_count": null } }, { "creation_time": "2024-04-16T16:45:02.176519Z", "comments": { "results": [], "count": 0 }, "parented": true, "embed_url": "https://chart-studio.plotly.com/~loulang/3.embed", "fid": "loulang:3", "filename": "Nejlepší střelci", "filetype": "plot", "img_url": "https://storage.googleapis.com/plotly-prod-images/loulang/3/9_L950IC18CUUT5N27JW09D9150JI4ZX.png", "image_urls": { "default": "https://storage.googleapis.com/plotly-prod-images/loulang/3/2_PAV4EGRQ3HJGGBPMJZKSKW3NMATPEE.png", "block-thumb": "https://storage.googleapis.com/plotly-prod-images/loulang/3/8_WG8EKXM93CDF1KZGYU8ZBWD7UMGNMI.png", "list-thumb": "https://storage.googleapis.com/plotly-prod-images/loulang/3/9_L950IC18CUUT5N27JW09D9150JI4ZX.png" }, "api_urls": { "files": "https://api.plotly.com/v2/files/loulang:3", "plots": "https://api.plotly.com/v2/plots/loulang:3", "parent": "https://api.plotly.com/v2/folders/home?user=loulang" }, "owner": "loulang", "parent": -1, "preview": "", "referencers": [], "references": [], "title": "", "views": 1, "web_url": "https://chart-studio.plotly.com/~loulang/3/", "world_readable": true, "date_modified": "2024-04-16T16:45:02.188Z", "stars": { "results": [], "count": 0 }, "collaborators": { "results": [], "count": 0 }, "subfolder_count": null, "refresh_interval": null, "organize_view_url": "https://chart-studio.plotly.com/~loulang/3/", "current_user_permission": "read", "is_theme": null, "is_template": false, "autosize": true, "caption": "", "figure": { "data": [ { "meta": { "columnNames": { "x": "Hráči", "y": "Góly" } }, "mode": "lines", "name": "Góly", "type": "scatter", "xsrc": "loulang:2:3533dc", "ysrc": "loulang:2:674402" }, { "meta": { "columnNames": { "x": "Hráči", "y": "Zápasy" } }, "mode": "lines", "name": "Zápasy", "type": "scatter", "xsrc": "loulang:2:3533dc", "ysrc": "loulang:2:129d87", "stackgroup": null } ], "frames": [], "layout": { "title": { "font": { "size": 22, "family": "Arial" }, "text": "<b>Nejlepší střelci</b>" }, "xaxis": { "type": "category", "range": [ 0, 11 ], "autorange": true }, "yaxis": { "type": "linear", "range": [ 36.27777777777778, 190.72222222222223 ], "title": { "text": "Celkový počet gólů" }, "autorange": true }, "autosize": true, "template": { "data": { "bar": [ { "type": "bar", "marker": { "colorbar": { "len": 0.2, "ticks": "inside", "ticklen": 6, "tickcolor": "rgb(237,237,237)", "outlinewidth": 0 } } } ], "table": [ { "type": "table", "cells": { "fill": { "color": "rgb(237,237,237)" }, "line": { "color": "white" } }, "header": { "fill": { "color": "rgb(217,217,217)" }, "line": { "color": "white" } } } ], "carpet": [ { "type": "carpet", "aaxis": { "gridcolor": "white", "linecolor": "white", "endlinecolor": "rgb(51,51,51)", "minorgridcolor": "white", "startlinecolor": "rgb(51,51,51)" }, "baxis": { "gridcolor": "white", "linecolor": "white", "endlinecolor": "rgb(51,51,51)", "minorgridcolor": "white", "startlinecolor": "rgb(51,51,51)" } } ], "mesh3d": [ { "type": "mesh3d", "colorbar": { "len": 0.2, "ticks": "inside", "ticklen": 6, "tickcolor": "rgb(237,237,237)", "outlinewidth": 0 } } ], "contour": [ { "type": "contour", "colorbar": { "len": 0.2, "ticks": "inside", "ticklen": 6, "tickcolor": "rgb(237,237,237)", "outlinewidth": 0 }, "autocolorscale": true } ], "heatmap": [ { "type": "heatmap", "colorbar": { "len": 0.2, "ticks": "inside", "ticklen": 6, "tickcolor": "rgb(237,237,237)", "outlinewidth": 0 }, "autocolorscale": true } ], "scatter": [ { "type": "scatter", "marker": { "colorbar": { "len": 0.2, "ticks": "inside", "ticklen": 6, "tickcolor": "rgb(237,237,237)", "outlinewidth": 0 } } } ], "surface": [ { "type": "surface", "colorbar": { "len": 0.2, "ticks": "inside", "ticklen": 6, "tickcolor": "rgb(237,237,237)", "outlinewidth": 0 } } ], "heatmapgl": [ { "type": "heatmapgl", "colorbar": { "len": 0.2, "ticks": "inside", "ticklen": 6, "tickcolor": "rgb(237,237,237)", "outlinewidth": 0 } } ], "histogram": [ { "type": "histogram", "marker": { "colorbar": { "len": 0.2, "ticks": "inside", "ticklen": 6, "tickcolor": "rgb(237,237,237)", "outlinewidth": 0 } } } ], "parcoords": [ { "line": { "colorbar": { "len": 0.2, "ticks": "inside", "ticklen": 6, "tickcolor": "rgb(237,237,237)", "outlinewidth": 0 } }, "type": "parcoords" } ], "scatter3d": [ { "type": "scatter3d", "marker": { "colorbar": { "len": 0.2, "ticks": "inside", "ticklen": 6, "tickcolor": "rgb(237,237,237)", "outlinewidth": 0 } } } ], "scattergl": [ { "type": "scattergl", "marker": { "colorbar": { "len": 0.2, "ticks": "inside", "ticklen": 6, "tickcolor": "rgb(237,237,237)", "outlinewidth": 0 } } } ], "choropleth": [ { "type": "choropleth", "colorbar": { "len": 0.2, "ticks": "inside", "ticklen": 6, "tickcolor": "rgb(237,237,237)", "outlinewidth": 0 } } ], "scattergeo": [ { "type": "scattergeo", "marker": { "colorbar": { "len": 0.2, "ticks": "inside", "ticklen": 6, "tickcolor": "rgb(237,237,237)", "outlinewidth": 0 } } } ], "histogram2d": [ { "type": "histogram2d", "colorbar": { "len": 0.2, "ticks": "inside", "ticklen": 6, "tickcolor": "rgb(237,237,237)", "outlinewidth": 0 }, "autocolorscale": true } ], "scatterpolar": [ { "type": "scatterpolar", "marker": { "colorbar": { "len": 0.2, "ticks": "inside", "ticklen": 6, "tickcolor": "rgb(237,237,237)", "outlinewidth": 0 } } } ], "contourcarpet": [ { "type": "contourcarpet", "colorbar": { "len": 0.2, "ticks": "inside", "ticklen": 6, "tickcolor": "rgb(237,237,237)", "outlinewidth": 0 } } ], "scattercarpet": [ { "type": "scattercarpet", "marker": { "colorbar": { "len": 0.2, "ticks": "inside", "ticklen": 6, "tickcolor": "rgb(237,237,237)", "outlinewidth": 0 } } } ], "scattermapbox": [ { "type": "scattermapbox", "marker": { "colorbar": { "len": 0.2, "ticks": "inside", "ticklen": 6, "tickcolor": "rgb(237,237,237)", "outlinewidth": 0 } } } ], "scatterpolargl": [ { "type": "scatterpolargl", "marker": { "colorbar": { "len": 0.2, "ticks": "inside", "ticklen": 6, "tickcolor": "rgb(237,237,237)", "outlinewidth": 0 } } } ], "scatterternary": [ { "type": "scatterternary", "marker": { "colorbar": { "len": 0.2, "ticks": "inside", "ticklen": 6, "tickcolor": "rgb(237,237,237)", "outlinewidth": 0 } } } ], "histogram2dcontour": [ { "type": "histogram2dcontour", "colorbar": { "len": 0.2, "ticks": "inside", "ticklen": 6, "tickcolor": "rgb(237,237,237)", "outlinewidth": 0 }, "autocolorscale": true } ] }, "layout": { "geo": { "bgcolor": "white", "showland": true, "lakecolor": "white", "landcolor": "rgb(237,237,237)", "showlakes": true, "subunitcolor": "white" }, "font": { "color": "rgb(51,51,51)" }, "polar": { "bgcolor": "rgb(237,237,237)", "radialaxis": { "ticks": "outside", "showgrid": true, "gridcolor": "white", "linecolor": "white", "tickcolor": "rgb(51,51,51)" }, "angularaxis": { "ticks": "outside", "showgrid": true, "gridcolor": "white", "linecolor": "white", "tickcolor": "rgb(51,51,51)" } }, "scene": { "xaxis": { "ticks": "outside", "showgrid": true, "gridcolor": "white", "gridwidth": 2, "linecolor": "white", "tickcolor": "rgb(51,51,51)", "zerolinecolor": "white", "showbackground": true, "backgroundcolor": "rgb(237,237,237)" }, "yaxis": { "ticks": "outside", "showgrid": true, "gridcolor": "white", "gridwidth": 2, "linecolor": "white", "tickcolor": "rgb(51,51,51)", "zerolinecolor": "white", "showbackground": true, "backgroundcolor": "rgb(237,237,237)" }, "zaxis": { "ticks": "outside", "showgrid": true, "gridcolor": "white", "gridwidth": 2, "linecolor": "white", "tickcolor": "rgb(51,51,51)", "zerolinecolor": "white", "showbackground": true, "backgroundcolor": "rgb(237,237,237)" } }, "xaxis": { "ticks": "outside", "showgrid": true, "gridcolor": "white", "linecolor": "white", "tickcolor": "rgb(51,51,51)", "automargin": true, "zerolinecolor": "white" }, "yaxis": { "ticks": "outside", "showgrid": true, "gridcolor": "white", "linecolor": "white", "tickcolor": "rgb(51,51,51)", "automargin": true, "zerolinecolor": "white" }, "ternary": { "aaxis": { "ticks": "outside", "showgrid": true, "gridcolor": "white", "linecolor": "white", "tickcolor": "rgb(51,51,51)" }, "baxis": { "ticks": "outside", "showgrid": true, "gridcolor": "white", "linecolor": "white", "tickcolor": "rgb(51,51,51)" }, "caxis": { "ticks": "outside", "showgrid": true, "gridcolor": "white", "linecolor": "white", "tickcolor": "rgb(51,51,51)" }, "bgcolor": "rgb(237,237,237)" }, "colorway": [ "#F8766D", "#A3A500", "#00BF7D", "#00B0F6", "#E76BF3" ], "hovermode": "closest", "colorscale": { "diverging": [ [ 0, "#40004b" ], [ 0.1, "#762a83" ], [ 0.2, "#9970ab" ], [ 0.3, "#c2a5cf" ], [ 0.4, "#e7d4e8" ], [ 0.5, "#f7f7f7" ], [ 0.6, "#d9f0d3" ], [ 0.7, "#a6dba0" ], [ 0.8, "#5aae61" ], [ 0.9, "#1b7837" ], [ 1, "#00441b" ] ], "sequential": [ [ 0, "rgb(20,44,66)" ], [ 1, "rgb(90,179,244)" ] ], "sequentialminus": [ [ 0, "rgb(20,44,66)" ], [ 1, "rgb(90,179,244)" ] ] }, "plot_bgcolor": "rgb(237,237,237)", "paper_bgcolor": "white", "shapedefaults": { "line": { "width": 0 }, "opacity": 0.3, "fillcolor": "black" }, "annotationdefaults": { "arrowhead": 0, "arrowwidth": 1 } }, "themeRef": "GGPLOT2" }, "paper_bgcolor": "rgb(255, 255, 255)" } }, "height": null, "width": null, "user": { "profile_url": "https://chart-studio.plotly.com/~loulang", "avatar_url": "https://storage.googleapis.com/plotly-prod-profiles/85.jpg", "background_url": "https://storage.googleapis.com/plotly-prod-profiles/bg-11.jpg", "bio": "", "nickname": "", "website": "", "stream_tokens": null, "feature_set_id": null, "csrf_token": null, "date_joined": "2024-04-16 07:25:11", "mapbox_access_tokens": null, "has_password": null, "username": "loulang", "email": null, "is_active": null, "readonly": null, "is_dash_creator": null, "dash_created_count": null, "is_chart_creator": null, "charts_created_count": null } }, { "creation_time": "2024-04-16T16:43:32.001672Z", "comments": { "results": [], "count": 0 }, "parented": true, "embed_url": "https://chart-studio.plotly.com/~seminkim/31.embed", "fid": "seminkim:31", "filename": "zero=0.0,seed=10", "filetype": "plot", "img_url": "https://storage.googleapis.com/plotly-prod-images/seminkim/31/9_EDUOLEUTAIDNYY3VTBVS2SCJU9G5P8.png", "image_urls": { "default": "https://storage.googleapis.com/plotly-prod-images/seminkim/31/2_2Y3YQI8ETX2I1D3R9GHA1YQH73PBYG.png", "block-thumb": "https://storage.googleapis.com/plotly-prod-images/seminkim/31/8_AUTWJA7C5J5BSHTFATPXR70HPDOI7P.png", "list-thumb": "https://storage.googleapis.com/plotly-prod-images/seminkim/31/9_EDUOLEUTAIDNYY3VTBVS2SCJU9G5P8.png" }, "api_urls": { "files": "https://api.plotly.com/v2/files/seminkim:31", "plots": "https://api.plotly.com/v2/plots/seminkim:31", "parent": "https://api.plotly.com/v2/folders/home?user=seminkim" }, "owner": "seminkim", "parent": -1, "preview": "", "referencers": [], "references": [], "title": "", "views": 1, "web_url": "https://chart-studio.plotly.com/~seminkim/31/", "world_readable": true, "date_modified": "2024-04-16T17:02:55.978Z", "stars": { "results": [], "count": 0 }, "collaborators": { "results": [], "count": 0 }, "subfolder_count": null, "refresh_interval": null, "organize_view_url": "https://chart-studio.plotly.com/~seminkim/31/", "current_user_permission": "read", "is_theme": null, "is_template": null, "autosize": true, "caption": "", "figure": { "data": [ { "mode": "markers", "name": "z0", "type": "scatter3d", "xsrc": "seminkim:59:261c72", "ysrc": "seminkim:59:fdfa5c", "zsrc": "seminkim:59:39e3fe", "marker": { "size": 3, "opacity": 0.5, "colorsrc": "seminkim:59:93d61c" } }, { "mode": "markers", "name": "z1", "type": "scatter3d", "xsrc": "seminkim:59:b20bf9", "ysrc": "seminkim:59:eb75b7", "zsrc": "seminkim:59:ec40c9", "marker": { "size": 3, "symbol": "x", "opacity": 0.5, "colorsrc": "seminkim:59:82fbe2" } }, { "line": { "color": "blue", "width": 1 }, "mode": "lines", "type": "scatter3d", "xsrc": "seminkim:59:b107b8", "ysrc": "seminkim:59:83257e", "zsrc": "seminkim:59:e9aaf0", "showlegend": false }, { "line": { "color": "blue", "width": 1 }, "mode": "lines", "type": "scatter3d", "xsrc": "seminkim:59:d942d3", "ysrc": "seminkim:59:446a3a", "zsrc": "seminkim:59:88d764", "showlegend": false }, { "line": { "color": "blue", "width": 1 }, "mode": "lines", "type": "scatter3d", "xsrc": "seminkim:59:c7fba0", "ysrc": "seminkim:59:85cca5", "zsrc": "seminkim:59:32ea2a", "showlegend": false }, { "line": { "color": "blue", "width": 1 }, "mode": "lines", "type": "scatter3d", "xsrc": "seminkim:59:47e5a9", "ysrc": "seminkim:59:f1f548", "zsrc": "seminkim:59:a58b55", "showlegend": false }, { "line": { "color": "blue", "width": 1 }, "mode": "lines", "type": "scatter3d", "xsrc": "seminkim:59:8cde33", "ysrc": "seminkim:59:5af9a5", "zsrc": "seminkim:59:095adf", "showlegend": false }, { "line": { "color": "blue", "width": 1 }, "mode": "lines", "type": "scatter3d", "xsrc": "seminkim:59:370738", "ysrc": "seminkim:59:636733", "zsrc": "seminkim:59:65dc09", "showlegend": false }, { "line": { "color": "blue", "width": 1 }, "mode": "lines", "type": "scatter3d", "xsrc": "seminkim:59:f5cd5d", "ysrc": "seminkim:59:a17476", "zsrc": "seminkim:59:d689a1", "showlegend": false }, { "line": { "color": "blue", "width": 1 }, "mode": "lines", "type": "scatter3d", "xsrc": "seminkim:59:77c101", "ysrc": "seminkim:59:310652", "zsrc": "seminkim:59:c161f6", "showlegend": false }, { "line": { "color": "blue", "width": 1 }, "mode": "lines", "type": "scatter3d", "xsrc": "seminkim:59:b0cca0", "ysrc": "seminkim:59:d31dfb", "zsrc": "seminkim:59:57080b", "showlegend": false }, { "line": { "color": "blue", "width": 1 }, "mode": "lines", "type": "scatter3d", "xsrc": "seminkim:59:b0cd27", "ysrc": "seminkim:59:9e66d7", "zsrc": "seminkim:59:770645", "showlegend": false }, { "line": { "color": "blue", "width": 1 }, "mode": "lines", "type": "scatter3d", "xsrc": "seminkim:59:6d9232", "ysrc": "seminkim:59:3b6a35", "zsrc": "seminkim:59:dbf317", "showlegend": false }, { "line": { "color": "blue", "width": 1 }, "mode": "lines", "type": "scatter3d", "xsrc": "seminkim:59:d54706", "ysrc": "seminkim:59:952ab3", "zsrc": "seminkim:59:aa8c0e", "showlegend": false }, { "line": { "color": "blue", "width": 1 }, "mode": "lines", "type": "scatter3d", "xsrc": "seminkim:59:c56e90", "ysrc": "seminkim:59:f2b2dd", "zsrc": "seminkim:59:61364e", "showlegend": false }, { "line": { "color": "blue", "width": 1 }, "mode": "lines", "type": "scatter3d", "xsrc": "seminkim:59:16a092", "ysrc": "seminkim:59:40773a", "zsrc": "seminkim:59:2233b9", "showlegend": false }, { "line": { "color": "blue", "width": 1 }, "mode": "lines", "type": "scatter3d", "xsrc": "seminkim:59:ee6694", "ysrc": "seminkim:59:ac0c8f", "zsrc": "seminkim:59:2e0adf", "showlegend": false }, { "line": { "color": "blue", "width": 1 }, "mode": "lines", "type": "scatter3d", "xsrc": "seminkim:59:54bf88", "ysrc": "seminkim:59:8f0048", "zsrc": "seminkim:59:0055aa", "showlegend": false }, { "line": { "color": "blue", "width": 1 }, "mode": "lines", "type": "scatter3d", "xsrc": "seminkim:59:7fd8d6", "ysrc": "seminkim:59:0ff021", "zsrc": "seminkim:59:4356d3", "showlegend": false }, { "line": { "color": "blue", "width": 1 }, "mode": "lines", "type": "scatter3d", "xsrc": "seminkim:59:3b416f", "ysrc": "seminkim:59:f17a00", "zsrc": "seminkim:59:d093a9", "showlegend": false }, { "line": { "color": "blue", "width": 1 }, "mode": "lines", "type": "scatter3d", "xsrc": "seminkim:59:ef32de", "ysrc": "seminkim:59:3f493c", "zsrc": "seminkim:59:aa6d1a", "showlegend": false }, { "line": { "color": "blue", "width": 1 }, "mode": "lines", "type": "scatter3d", "xsrc": "seminkim:59:e35500", "ysrc": "seminkim:59:863aac", "zsrc": "seminkim:59:ed91b7", "showlegend": false }, { "line": { "color": "blue", "width": 1 }, "mode": "lines", "type": "scatter3d", "xsrc": "seminkim:59:bc65bd", "ysrc": "seminkim:59:c34343", "zsrc": "seminkim:59:b760df", "showlegend": false }, { "line": { "color": "blue", "width": 1 }, "mode": "lines", "type": "scatter3d", "xsrc": "seminkim:59:76d042", "ysrc": "seminkim:59:b1da32", "zsrc": "seminkim:59:08d453", "showlegend": false }, { "line": { "color": "blue", "width": 1 }, "mode": "lines", "type": "scatter3d", "xsrc": "seminkim:59:95b73d", "ysrc": "seminkim:59:41c672", "zsrc": "seminkim:59:6bba92", "showlegend": false }, { "line": { "color": "blue", "width": 1 }, "mode": "lines", "type": "scatter3d", "xsrc": "seminkim:59:156807", "ysrc": "seminkim:59:24124e", "zsrc": "seminkim:59:f03e9c", "showlegend": false }, { "line": { "color": "blue", "width": 1 }, "mode": "lines", "type": "scatter3d", "xsrc": "seminkim:59:102ad6", "ysrc": "seminkim:59:f01dac", "zsrc": "seminkim:59:b99419", "showlegend": false }, { "line": { "color": "blue", "width": 1 }, "mode": "lines", "type": "scatter3d", "xsrc": "seminkim:59:705109", "ysrc": "seminkim:59:ea092b", "zsrc": "seminkim:59:fb82db", "showlegend": false }, { "line": { "color": "blue", "width": 1 }, "mode": "lines", "type": "scatter3d", "xsrc": "seminkim:59:d14696", "ysrc": "seminkim:59:32d8d3", "zsrc": "seminkim:59:23a8bb", "showlegend": false }, { "line": { "color": "blue", "width": 1 }, "mode": "lines", "type": "scatter3d", "xsrc": "seminkim:59:fc79e7", "ysrc": "seminkim:59:5a39bf", "zsrc": "seminkim:59:7f342b", "showlegend": false }, { "line": { "color": "blue", "width": 1 }, "mode": "lines", "type": "scatter3d", "xsrc": "seminkim:59:4f987a", "ysrc": "seminkim:59:72967a", "zsrc": "seminkim:59:e3700b", "showlegend": false }, { "line": { "color": "blue", "width": 1 }, "mode": "lines", "type": "scatter3d", "xsrc": "seminkim:59:7c86b3", "ysrc": "seminkim:59:2902f6", "zsrc": "seminkim:59:0f703d", "showlegend": false }, { "line": { "color": "blue", "width": 1 }, "mode": "lines", "type": "scatter3d", "xsrc": "seminkim:59:9ea7b7", "ysrc": "seminkim:59:d38e51", "zsrc": "seminkim:59:3c2d3b", "showlegend": false }, { "line": { "color": "blue", "width": 1 }, "mode": "lines", "type": "scatter3d", "xsrc": "seminkim:59:1a47fa", "ysrc": "seminkim:59:ad67ef", "zsrc": "seminkim:59:29f8ba", "showlegend": false }, { "line": { "color": "blue", "width": 1 }, "mode": "lines", "type": "scatter3d", "xsrc": "seminkim:59:50c8ee", "ysrc": "seminkim:59:903d55", "zsrc": "seminkim:59:4b3ca5", "showlegend": false }, { "line": { "color": "blue", "width": 1 }, "mode": "lines", "type": "scatter3d", "xsrc": "seminkim:59:ce921e", "ysrc": "seminkim:59:1f5c92", "zsrc": "seminkim:59:971020", "showlegend": false }, { "line": { "color": "blue", "width": 1 }, "mode": "lines", "type": "scatter3d", "xsrc": "seminkim:59:1926ee", "ysrc": "seminkim:59:f67eda", "zsrc": "seminkim:59:78b243", "showlegend": false }, { "line": { "color": "blue", "width": 1 }, "mode": "lines", "type": "scatter3d", "xsrc": "seminkim:59:2e2411", "ysrc": "seminkim:59:43ec56", "zsrc": "seminkim:59:d0461c", "showlegend": false }, { "line": { "color": "blue", "width": 1 }, "mode": "lines", "type": "scatter3d", "xsrc": "seminkim:59:9b432d", "ysrc": "seminkim:59:a9a6ae", "zsrc": "seminkim:59:71b6f4", "showlegend": false }, { "line": { "color": "blue", "width": 1 }, "mode": "lines", "type": "scatter3d", "xsrc": "seminkim:59:e83bde", "ysrc": "seminkim:59:21fb78", "zsrc": "seminkim:59:000662", "showlegend": false }, { "line": { "color": "blue", "width": 1 }, "mode": "lines", "type": "scatter3d", "xsrc": "seminkim:59:cbb454", "ysrc": "seminkim:59:890f7d", "zsrc": "seminkim:59:5bd680", "showlegend": false }, { "line": { "color": "blue", "width": 1 }, "mode": "lines", "type": "scatter3d", "xsrc": "seminkim:59:588175", "ysrc": "seminkim:59:8a68db", "zsrc": "seminkim:59:f2041f", "showlegend": false }, { "line": { "color": "blue", "width": 1 }, "mode": "lines", "type": "scatter3d", "xsrc": "seminkim:59:e941eb", "ysrc": "seminkim:59:563f2a", "zsrc": "seminkim:59:2108cc", "showlegend": false }, { "line": { "color": "blue", "width": 1 }, "mode": "lines", "type": "scatter3d", "xsrc": "seminkim:59:2c1325", "ysrc": "seminkim:59:698593", "zsrc": "seminkim:59:a3ad90", "showlegend": false }, { "line": { "color": "blue", "width": 1 }, "mode": "lines", "type": "scatter3d", "xsrc": "seminkim:59:02a9ba", "ysrc": "seminkim:59:c54dc6", "zsrc": "seminkim:59:c477b3", "showlegend": false }, { "line": { "color": "blue", "width": 1 }, "mode": "lines", "type": "scatter3d", "xsrc": "seminkim:59:8652fa", "ysrc": "seminkim:59:a78bb4", "zsrc": "seminkim:59:17d0cc", "showlegend": false }, { "line": { "color": "blue", "width": 1 }, "mode": "lines", "type": "scatter3d", "xsrc": "seminkim:59:c96478", "ysrc": "seminkim:59:05a476", "zsrc": "seminkim:59:e3aa09", "showlegend": false }, { "line": { "color": "blue", "width": 1 }, "mode": "lines", "type": "scatter3d", "xsrc": "seminkim:59:f3128e", "ysrc": "seminkim:59:9735c3", "zsrc": "seminkim:59:bc8a7b", "showlegend": false }, { "line": { "color": "blue", "width": 1 }, "mode": "lines", "type": "scatter3d", "xsrc": "seminkim:59:808c91", "ysrc": "seminkim:59:62b3d9", "zsrc": "seminkim:59:70676f", "showlegend": false }, { "line": { "color": "blue", "width": 1 }, "mode": "lines", "type": "scatter3d", "xsrc": "seminkim:59:0f14ff", "ysrc": "seminkim:59:96a646", "zsrc": "seminkim:59:1ff748", "showlegend": false }, { "line": { "color": "blue", "width": 1 }, "mode": "lines", "type": "scatter3d", "xsrc": "seminkim:59:021d33", "ysrc": "seminkim:59:83fed5", "zsrc": "seminkim:59:fa6f61", "showlegend": false }, { "line": { "color": "blue", "width": 1 }, "mode": "lines", "type": "scatter3d", "xsrc": "seminkim:59:f3c2ef", "ysrc": "seminkim:59:d63fcf", "zsrc": "seminkim:59:ec7ebc", "showlegend": false }, { "line": { "color": "red", "width": 1 }, "mode": "lines", "type": "scatter3d", "xsrc": "seminkim:59:580a71", "ysrc": "seminkim:59:da74da", "zsrc": "seminkim:59:ce8cd9", "showlegend": false }, { "line": { "color": "red", "width": 1 }, "mode": "lines", "type": "scatter3d", "xsrc": "seminkim:59:e7bfc0", "ysrc": "seminkim:59:dbe887", "zsrc": "seminkim:59:78e7b8", "showlegend": false }, { "line": { "color": "red", "width": 1 }, "mode": "lines", "type": "scatter3d", "xsrc": "seminkim:59:dcd740", "ysrc": "seminkim:59:888fd3", "zsrc": "seminkim:59:7c072e", "showlegend": false }, { "line": { "color": "red", "width": 1 }, "mode": "lines", "type": "scatter3d", "xsrc": "seminkim:59:3650f4", "ysrc": "seminkim:59:154e25", "zsrc": "seminkim:59:b1bdf0", "showlegend": false }, { "line": { "color": "red", "width": 1 }, "mode": "lines", "type": "scatter3d", "xsrc": "seminkim:59:85319e", "ysrc": "seminkim:59:248814", "zsrc": "seminkim:59:2e1009", "showlegend": false }, { "line": { "color": "red", "width": 1 }, "mode": "lines", "type": "scatter3d", "xsrc": "seminkim:59:af3d97", "ysrc": "seminkim:59:1e7211", "zsrc": "seminkim:59:cef6ca", "showlegend": false }, { "line": { "color": "red", "width": 1 }, "mode": "lines", "type": "scatter3d", "xsrc": "seminkim:59:6bc14d", "ysrc": "seminkim:59:d4d352", "zsrc": "seminkim:59:8202b8", "showlegend": false }, { "line": { "color": "red", "width": 1 }, "mode": "lines", "type": "scatter3d", "xsrc": "seminkim:59:b5ec98", "ysrc": "seminkim:59:8037a1", "zsrc": "seminkim:59:829363", "showlegend": false }, { "line": { "color": "red", "width": 1 }, "mode": "lines", "type": "scatter3d", "xsrc": "seminkim:59:c9718e", "ysrc": "seminkim:59:fb7055", "zsrc": "seminkim:59:e7b726", "showlegend": false }, { "line": { "color": "red", "width": 1 }, "mode": "lines", "type": "scatter3d", "xsrc": "seminkim:59:0334ea", "ysrc": "seminkim:59:631660", "zsrc": "seminkim:59:6c8b48", "showlegend": false }, { "line": { "color": "red", "width": 1 }, "mode": "lines", "type": "scatter3d", "xsrc": "seminkim:59:e17b65", "ysrc": "seminkim:59:11ccc1", "zsrc": "seminkim:59:c97b10", "showlegend": false }, { "line": { "color": "red", "width": 1 }, "mode": "lines", "type": "scatter3d", "xsrc": "seminkim:59:c12fd6", "ysrc": "seminkim:59:2a8f05", "zsrc": "seminkim:59:dbe94b", "showlegend": false }, { "line": { "color": "red", "width": 1 }, "mode": "lines", "type": "scatter3d", "xsrc": "seminkim:59:8fd4c1", "ysrc": "seminkim:59:a651c8", "zsrc": "seminkim:59:bedfe3", "showlegend": false }, { "line": { "color": "red", "width": 1 }, "mode": "lines", "type": "scatter3d", "xsrc": "seminkim:59:293e1a", "ysrc": "seminkim:59:e49e9e", "zsrc": "seminkim:59:e854c5", "showlegend": false }, { "line": { "color": "red", "width": 1 }, "mode": "lines", "type": "scatter3d", "xsrc": "seminkim:59:5d207b", "ysrc": "seminkim:59:9fc343", "zsrc": "seminkim:59:f74baa", "showlegend": false }, { "line": { "color": "red", "width": 1 }, "mode": "lines", "type": "scatter3d", "xsrc": "seminkim:59:e806bf", "ysrc": "seminkim:59:b0b26b", "zsrc": "seminkim:59:3c0735", "showlegend": false }, { "line": { "color": "red", "width": 1 }, "mode": "lines", "type": "scatter3d", "xsrc": "seminkim:59:2d3270", "ysrc": "seminkim:59:1fbb0c", "zsrc": "seminkim:59:795ace", "showlegend": false }, { "line": { "color": "red", "width": 1 }, "mode": "lines", "type": "scatter3d", "xsrc": "seminkim:59:873eed", "ysrc": "seminkim:59:f43fc0", "zsrc": "seminkim:59:382ad7", "showlegend": false }, { "line": { "color": "red", "width": 1 }, "mode": "lines", "type": "scatter3d", "xsrc": "seminkim:59:941dc9", "ysrc": "seminkim:59:cce680", "zsrc": "seminkim:59:aaf0e5", "showlegend": false }, { "line": { "color": "red", "width": 1 }, "mode": "lines", "type": "scatter3d", "xsrc": "seminkim:59:e82cb5", "ysrc": "seminkim:59:8302cd", "zsrc": "seminkim:59:38fe9f", "showlegend": false }, { "line": { "color": "red", "width": 1 }, "mode": "lines", "type": "scatter3d", "xsrc": "seminkim:59:382865", "ysrc": "seminkim:59:a742cd", "zsrc": "seminkim:59:d98a3f", "showlegend": false }, { "line": { "color": "red", "width": 1 }, "mode": "lines", "type": "scatter3d", "xsrc": "seminkim:59:e3308b", "ysrc": "seminkim:59:d24cd0", "zsrc": "seminkim:59:3f3604", "showlegend": false }, { "line": { "color": "red", "width": 1 }, "mode": "lines", "type": "scatter3d", "xsrc": "seminkim:59:330044", "ysrc": "seminkim:59:5b624b", "zsrc": "seminkim:59:b0c597", "showlegend": false }, { "line": { "color": "red", "width": 1 }, "mode": "lines", "type": "scatter3d", "xsrc": "seminkim:59:6e9328", "ysrc": "seminkim:59:844155", "zsrc": "seminkim:59:eb80bc", "showlegend": false }, { "line": { "color": "red", "width": 1 }, "mode": "lines", "type": "scatter3d", "xsrc": "seminkim:59:f33442", "ysrc": "seminkim:59:d4f905", "zsrc": "seminkim:59:f122da", "showlegend": false }, { "line": { "color": "red", "width": 1 }, "mode": "lines", "type": "scatter3d", "xsrc": "seminkim:59:f7076c", "ysrc": "seminkim:59:9487fe", "zsrc": "seminkim:59:d5a839", "showlegend": false }, { "line": { "color": "red", "width": 1 }, "mode": "lines", "type": "scatter3d", "xsrc": "seminkim:59:f2ff72", "ysrc": "seminkim:59:6d605f", "zsrc": "seminkim:59:1f3b54", "showlegend": false }, { "line": { "color": "red", "width": 1 }, "mode": "lines", "type": "scatter3d", "xsrc": "seminkim:59:23a469", "ysrc": "seminkim:59:2dac11", "zsrc": "seminkim:59:e31c67", "showlegend": false }, { "line": { "color": "red", "width": 1 }, "mode": "lines", "type": "scatter3d", "xsrc": "seminkim:59:566957", "ysrc": "seminkim:59:9e3c43", "zsrc": "seminkim:59:2c0b62", "showlegend": false }, { "line": { "color": "red", "width": 1 }, "mode": "lines", "type": "scatter3d", "xsrc": "seminkim:59:92f57e", "ysrc": "seminkim:59:8ffe9b", "zsrc": "seminkim:59:9d870b", "showlegend": false }, { "line": { "color": "red", "width": 1 }, "mode": "lines", "type": "scatter3d", "xsrc": "seminkim:59:55834b", "ysrc": "seminkim:59:a847da", "zsrc": "seminkim:59:208667", "showlegend": false }, { "line": { "color": "red", "width": 1 }, "mode": "lines", "type": "scatter3d", "xsrc": "seminkim:59:258a65", "ysrc": "seminkim:59:334c5d", "zsrc": "seminkim:59:c5ccb6", "showlegend": false }, { "line": { "color": "red", "width": 1 }, "mode": "lines", "type": "scatter3d", "xsrc": "seminkim:59:13ef7d", "ysrc": "seminkim:59:7ba390", "zsrc": "seminkim:59:909b43", "showlegend": false }, { "line": { "color": "red", "width": 1 }, "mode": "lines", "type": "scatter3d", "xsrc": "seminkim:59:67fa19", "ysrc": "seminkim:59:1ab1de", "zsrc": "seminkim:59:c6cd2f", "showlegend": false }, { "line": { "color": "red", "width": 1 }, "mode": "lines", "type": "scatter3d", "xsrc": "seminkim:59:337187", "ysrc": "seminkim:59:f5eb28", "zsrc": "seminkim:59:52a094", "showlegend": false }, { "line": { "color": "red", "width": 1 }, "mode": "lines", "type": "scatter3d", "xsrc": "seminkim:59:d1aa09", "ysrc": "seminkim:59:38d548", "zsrc": "seminkim:59:930276", "showlegend": false }, { "line": { "color": "red", "width": 1 }, "mode": "lines", "type": "scatter3d", "xsrc": "seminkim:59:f28a2f", "ysrc": "seminkim:59:2028d2", "zsrc": "seminkim:59:55771d", "showlegend": false }, { "line": { "color": "red", "width": 1 }, "mode": "lines", "type": "scatter3d", "xsrc": "seminkim:59:26fa00", "ysrc": "seminkim:59:de08ab", "zsrc": "seminkim:59:147b19", "showlegend": false }, { "line": { "color": "red", "width": 1 }, "mode": "lines", "type": "scatter3d", "xsrc": "seminkim:59:8e825e", "ysrc": "seminkim:59:2520eb", "zsrc": "seminkim:59:60fca3", "showlegend": false }, { "line": { "color": "red", "width": 1 }, "mode": "lines", "type": "scatter3d", "xsrc": "seminkim:59:ade290", "ysrc": "seminkim:59:c994c6", "zsrc": "seminkim:59:152bc4", "showlegend": false }, { "line": { "color": "red", "width": 1 }, "mode": "lines", "type": "scatter3d", "xsrc": "seminkim:59:c95f33", "ysrc": "seminkim:59:07ce49", "zsrc": "seminkim:59:2dcc76", "showlegend": false }, { "line": { "color": "red", "width": 1 }, "mode": "lines", "type": "scatter3d", "xsrc": "seminkim:59:32b138", "ysrc": "seminkim:59:25a851", "zsrc": "seminkim:59:547b26", "showlegend": false }, { "line": { "color": "red", "width": 1 }, "mode": "lines", "type": "scatter3d", "xsrc": "seminkim:59:5fdeda", "ysrc": "seminkim:59:06e9ba", "zsrc": "seminkim:59:b1323a", "showlegend": false }, { "line": { "color": "red", "width": 1 }, "mode": "lines", "type": "scatter3d", "xsrc": "seminkim:59:1bb24e", "ysrc": "seminkim:59:fdca05", "zsrc": "seminkim:59:0bf508", "showlegend": false }, { "line": { "color": "red", "width": 1 }, "mode": "lines", "type": "scatter3d", "xsrc": "seminkim:59:37af90", "ysrc": "seminkim:59:e01355", "zsrc": "seminkim:59:78a2f2", "showlegend": false }, { "line": { "color": "red", "width": 1 }, "mode": "lines", "type": "scatter3d", "xsrc": "seminkim:59:12dfeb", "ysrc": "seminkim:59:56399e", "zsrc": "seminkim:59:5ccbbf", "showlegend": false }, { "line": { "color": "red", "width": 1 }, "mode": "lines", "type": "scatter3d", "xsrc": "seminkim:59:02644a", "ysrc": "seminkim:59:9abeb9", "zsrc": "seminkim:59:3c67e0", "showlegend": false }, { "line": { "color": "red", "width": 1 }, "mode": "lines", "type": "scatter3d", "xsrc": "seminkim:59:11eef4", "ysrc": "seminkim:59:ccf35b", "zsrc": "seminkim:59:43c455", "showlegend": false }, { "line": { "color": "red", "width": 1 }, "mode": "lines", "type": "scatter3d", "xsrc": "seminkim:59:d2b9c0", "ysrc": "seminkim:59:e2c80b", "zsrc": "seminkim:59:cf9417", "showlegend": false }, { "line": { "color": "red", "width": 1 }, "mode": "lines", "type": "scatter3d", "xsrc": "seminkim:59:2c8aef", "ysrc": "seminkim:59:9083d2", "zsrc": "seminkim:59:0ae5c8", "showlegend": false }, { "line": { "color": "red", "width": 1 }, "mode": "lines", "type": "scatter3d", "xsrc": "seminkim:59:83edfc", "ysrc": "seminkim:59:7c03c8", "zsrc": "seminkim:59:bc629e", "showlegend": false }, { "line": { "color": "red", "width": 1 }, "mode": "lines", "type": "scatter3d", "xsrc": "seminkim:59:7f8502", "ysrc": "seminkim:59:593d18", "zsrc": "seminkim:59:560284", "showlegend": false }, { "line": { "color": "red", "width": 1 }, "mode": "lines", "type": "scatter3d", "xsrc": "seminkim:59:543317", "ysrc": "seminkim:59:5a1e16", "zsrc": "seminkim:59:c76c80", "showlegend": false }, { "line": { "color": "red", "width": 1 }, "mode": "lines", "type": "scatter3d", "xsrc": "seminkim:59:a2a0ac", "ysrc": "seminkim:59:2a47ec", "zsrc": "seminkim:59:c26f44", "showlegend": false }, { "line": { "color": "red", "width": 1 }, "mode": "lines", "type": "scatter3d", "xsrc": "seminkim:59:6e4d99", "ysrc": "seminkim:59:d9ad3f", "zsrc": "seminkim:59:c99b09", "showlegend": false }, { "line": { "color": "red", "width": 1 }, "mode": "lines", "type": "scatter3d", "xsrc": "seminkim:59:073a1b", "ysrc": "seminkim:59:9e49d7", "zsrc": "seminkim:59:00ad17", "showlegend": false }, { "line": { "color": "red", "width": 1 }, "mode": "lines", "type": "scatter3d", "xsrc": "seminkim:59:6ef4d3", "ysrc": "seminkim:59:cc8bd3", "zsrc": "seminkim:59:3e5358", "showlegend": false }, { "line": { "color": "red", "width": 1 }, "mode": "lines", "type": "scatter3d", "xsrc": "seminkim:59:90cf48", "ysrc": "seminkim:59:fd01db", "zsrc": "seminkim:59:ccec3f", "showlegend": false }, { "line": { "color": "red", "width": 1 }, "mode": "lines", "type": "scatter3d", "xsrc": "seminkim:59:98fdb3", "ysrc": "seminkim:59:193fee", "zsrc": "seminkim:59:8e04e9", "showlegend": false }, { "line": { "color": "red", "width": 1 }, "mode": "lines", "type": "scatter3d", "xsrc": "seminkim:59:8137b5", "ysrc": "seminkim:59:ac4b0d", "zsrc": "seminkim:59:551152", "showlegend": false }, { "line": { "color": "red", "width": 1 }, "mode": "lines", "type": "scatter3d", "xsrc": "seminkim:59:b19e76", "ysrc": "seminkim:59:2fdba9", "zsrc": "seminkim:59:5ecbf8", "showlegend": false }, { "line": { "color": "red", "width": 1 }, "mode": "lines", "type": "scatter3d", "xsrc": "seminkim:59:ea182f", "ysrc": "seminkim:59:e282fb", "zsrc": "seminkim:59:fa8cbe", "showlegend": false }, { "line": { "color": "red", "width": 1 }, "mode": "lines", "type": "scatter3d", "xsrc": "seminkim:59:2b6b3a", "ysrc": "seminkim:59:abe83b", "zsrc": "seminkim:59:8ec976", "showlegend": false }, { "line": { "color": "red", "width": 1 }, "mode": "lines", "type": "scatter3d", "xsrc": "seminkim:59:ea2c1f", "ysrc": "seminkim:59:084b3b", "zsrc": "seminkim:59:0a3c18", "showlegend": false }, { "line": { "color": "red", "width": 1 }, "mode": "lines", "type": "scatter3d", "xsrc": "seminkim:59:041835", "ysrc": "seminkim:59:35f384", "zsrc": "seminkim:59:6308c8", "showlegend": false }, { "line": { "color": "red", "width": 1 }, "mode": "lines", "type": "scatter3d", "xsrc": "seminkim:59:3dc58f", "ysrc": "seminkim:59:5693b6", "zsrc": "seminkim:59:3a8a1b", "showlegend": false }, { "line": { "color": "red", "width": 1 }, "mode": "lines", "type": "scatter3d", "xsrc": "seminkim:59:587fef", "ysrc": "seminkim:59:da9290", "zsrc": "seminkim:59:ecfd5b", "showlegend": false }, { "line": { "color": "red", "width": 1 }, "mode": "lines", "type": "scatter3d", "xsrc": "seminkim:59:4e2bd2", "ysrc": "seminkim:59:9db4fe", "zsrc": "seminkim:59:76bf6b", "showlegend": false }, { "line": { "color": "red", "width": 1 }, "mode": "lines", "type": "scatter3d", "xsrc": "seminkim:59:3d2a3a", "ysrc": "seminkim:59:2ed8fb", "zsrc": "seminkim:59:620af2", "showlegend": false }, { "line": { "color": "red", "width": 1 }, "mode": "lines", "type": "scatter3d", "xsrc": "seminkim:59:df9b13", "ysrc": "seminkim:59:18c5d8", "zsrc": "seminkim:59:0bfdab", "showlegend": false }, { "line": { "color": "red", "width": 1 }, "mode": "lines", "type": "scatter3d", "xsrc": "seminkim:59:c90911", "ysrc": "seminkim:59:6b9bfb", "zsrc": "seminkim:59:2669c7", "showlegend": false }, { "line": { "color": "red", "width": 1 }, "mode": "lines", "type": "scatter3d", "xsrc": "seminkim:59:a76241", "ysrc": "seminkim:59:f17b81", "zsrc": "seminkim:59:2ef3ed", "showlegend": false }, { "line": { "color": "red", "width": 1 }, "mode": "lines", "type": "scatter3d", "xsrc": "seminkim:59:5bc7b3", "ysrc": "seminkim:59:f2257f", "zsrc": "seminkim:59:e9b4f7", "showlegend": false }, { "line": { "color": "red", "width": 1 }, "mode": "lines", "type": "scatter3d", "xsrc": "seminkim:59:48578f", "ysrc": "seminkim:59:2dc120", "zsrc": "seminkim:59:ae861b", "showlegend": false }, { "line": { "color": "red", "width": 1 }, "mode": "lines", "type": "scatter3d", "xsrc": "seminkim:59:993a9d", "ysrc": "seminkim:59:a81259", "zsrc": "seminkim:59:39dbb4", "showlegend": false }, { "line": { "color": "red", "width": 1 }, "mode": "lines", "type": "scatter3d", "xsrc": "seminkim:59:2e487c", "ysrc": "seminkim:59:dae385", "zsrc": "seminkim:59:84700b", "showlegend": false }, { "line": { "color": "red", "width": 1 }, "mode": "lines", "type": "scatter3d", "xsrc": "seminkim:59:f55362", "ysrc": "seminkim:59:7c528f", "zsrc": "seminkim:59:dfc6b1", "showlegend": false }, { "line": { "color": "red", "width": 1 }, "mode": "lines", "type": "scatter3d", "xsrc": "seminkim:59:b865e7", "ysrc": "seminkim:59:ff5a72", "zsrc": "seminkim:59:19b676", "showlegend": false }, { "line": { "color": "red", "width": 1 }, "mode": "lines", "type": "scatter3d", "xsrc": "seminkim:59:96b26a", "ysrc": "seminkim:59:d77bef", "zsrc": "seminkim:59:6dd82f", "showlegend": false }, { "line": { "color": "red", "width": 1 }, "mode": "lines", "type": "scatter3d", "xsrc": "seminkim:59:902bf8", "ysrc": "seminkim:59:cd0c5a", "zsrc": "seminkim:59:79a65f", "showlegend": false }, { "line": { "color": "red", "width": 1 }, "mode": "lines", "type": "scatter3d", "xsrc": "seminkim:59:b894a2", "ysrc": "seminkim:59:13cdd7", "zsrc": "seminkim:59:db2590", "showlegend": false }, { "line": { "color": "red", "width": 1 }, "mode": "lines", "type": "scatter3d", "xsrc": "seminkim:59:e557dd", "ysrc": "seminkim:59:df897b", "zsrc": "seminkim:59:c8240c", "showlegend": false }, { "line": { "color": "red", "width": 1 }, "mode": "lines", "type": "scatter3d", "xsrc": "seminkim:59:a6573f", "ysrc": "seminkim:59:e40d7b", "zsrc": "seminkim:59:d62ad6", "showlegend": false }, { "line": { "color": "red", "width": 1 }, "mode": "lines", "type": "scatter3d", "xsrc": "seminkim:59:083845", "ysrc": "seminkim:59:2a2198", "zsrc": "seminkim:59:888aef", "showlegend": false }, { "line": { "color": "red", "width": 1 }, "mode": "lines", "type": "scatter3d", "xsrc": "seminkim:59:d7f462", "ysrc": "seminkim:59:1f4920", "zsrc": "seminkim:59:c0b695", "showlegend": false }, { "line": { "color": "red", "width": 1 }, "mode": "lines", "type": "scatter3d", "xsrc": "seminkim:59:995b36", "ysrc": "seminkim:59:76c9b2", "zsrc": "seminkim:59:8acc37", "showlegend": false }, { "line": { "color": "red", "width": 1 }, "mode": "lines", "type": "scatter3d", "xsrc": "seminkim:59:54db60", "ysrc": "seminkim:59:10f340", "zsrc": "seminkim:59:57da18", "showlegend": false }, { "line": { "color": "red", "width": 1 }, "mode": "lines", "type": "scatter3d", "xsrc": "seminkim:59:088743", "ysrc": "seminkim:59:08278a", "zsrc": "seminkim:59:7e8b76", "showlegend": false }, { "line": { "color": "red", "width": 1 }, "mode": "lines", "type": "scatter3d", "xsrc": "seminkim:59:eab71e", "ysrc": "seminkim:59:b88566", "zsrc": "seminkim:59:d894e6", "showlegend": false }, { "line": { "color": "red", "width": 1 }, "mode": "lines", "type": "scatter3d", "xsrc": "seminkim:59:3dd0c3", "ysrc": "seminkim:59:74fc2e", "zsrc": "seminkim:59:fc478f", "showlegend": false }, { "line": { "color": "red", "width": 1 }, "mode": "lines", "type": "scatter3d", "xsrc": "seminkim:59:9f8654", "ysrc": "seminkim:59:86789f", "zsrc": "seminkim:59:ab5260", "showlegend": false }, { "line": { "color": "red", "width": 1 }, "mode": "lines", "type": "scatter3d", "xsrc": "seminkim:59:ec49af", "ysrc": "seminkim:59:25cf72", "zsrc": "seminkim:59:4ec2d8", "showlegend": false }, { "line": { "color": "red", "width": 1 }, "mode": "lines", "type": "scatter3d", "xsrc": "seminkim:59:7504f6", "ysrc": "seminkim:59:2b060e", "zsrc": "seminkim:59:e3e74d", "showlegend": false }, { "line": { "color": "red", "width": 1 }, "mode": "lines", "type": "scatter3d", "xsrc": "seminkim:59:ad504e", "ysrc": "seminkim:59:b92400", "zsrc": "seminkim:59:d76e9e", "showlegend": false }, { "line": { "color": "red", "width": 1 }, "mode": "lines", "type": "scatter3d", "xsrc": "seminkim:59:c0b69d", "ysrc": "seminkim:59:343d19", "zsrc": "seminkim:59:cef1a7", "showlegend": false }, { "line": { "color": "red", "width": 1 }, "mode": "lines", "type": "scatter3d", "xsrc": "seminkim:59:b43c08", "ysrc": "seminkim:59:f6cd3f", "zsrc": "seminkim:59:38e610", "showlegend": false }, { "line": { "color": "red", "width": 1 }, "mode": "lines", "type": "scatter3d", "xsrc": "seminkim:59:82033f", "ysrc": "seminkim:59:970ede", "zsrc": "seminkim:59:aebdba", "showlegend": false }, { "line": { "color": "red", "width": 1 }, "mode": "lines", "type": "scatter3d", "xsrc": "seminkim:59:1b656e", "ysrc": "seminkim:59:e893b4", "zsrc": "seminkim:59:875331", "showlegend": false }, { "line": { "color": "red", "width": 1 }, "mode": "lines", "type": "scatter3d", "xsrc": "seminkim:59:85aed3", "ysrc": "seminkim:59:e34b70", "zsrc": "seminkim:59:5a0d29", "showlegend": false }, { "line": { "color": "red", "width": 1 }, "mode": "lines", "type": "scatter3d", "xsrc": "seminkim:59:37ad6b", "ysrc": "seminkim:59:dd600f", "zsrc": "seminkim:59:1641ea", "showlegend": false }, { "mode": "markers", "name": "Embedded Label", "type": "scatter3d", "xsrc": "seminkim:59:91e3ed", "ysrc": "seminkim:59:d0c258", "zsrc": "seminkim:59:ea8ca9", "marker": { "symbol": "diamond", "opacity": 0.5, "colorsrc": "seminkim:59:a6ce3a" } } ], "layout": { "scene": { "aspectmode": "data" }, "width": 800, "height": 600, "template": { "data": { "bar": [ { "type": "bar", "marker": { "line": { "color": "#E5ECF6", "width": 0.5 }, "pattern": { "size": 10, "fillmode": "overlay", "solidity": 0.2 } }, "error_x": { "color": "#2a3f5f" }, "error_y": { "color": "#2a3f5f" } } ], "pie": [ { "type": "pie", "automargin": true } ], "table": [ { "type": "table", "cells": { "fill": { "color": "#EBF0F8" }, "line": { "color": "white" } }, "header": { "fill": { "color": "#C8D4E3" }, "line": { "color": "white" } } } ], "carpet": [ { "type": "carpet", "aaxis": { "gridcolor": "white", "linecolor": "white", "endlinecolor": "#2a3f5f", "minorgridcolor": "white", "startlinecolor": "#2a3f5f" }, "baxis": { "gridcolor": "white", "linecolor": "white", "endlinecolor": "#2a3f5f", "minorgridcolor": "white", "startlinecolor": "#2a3f5f" } } ], "mesh3d": [ { "type": "mesh3d", "colorbar": { "ticks": "", "outlinewidth": 0 } } ], "contour": [ { "type": "contour", "colorbar": { "ticks": "", "outlinewidth": 0 }, "colorscale": [ [ 0.0, "#0d0887" ], [ 0.1111111111111111, "#46039f" ], [ 0.2222222222222222, "#7201a8" ], [ 0.3333333333333333, "#9c179e" ], [ 0.4444444444444444, "#bd3786" ], [ 0.5555555555555556, "#d8576b" ], [ 0.6666666666666666, "#ed7953" ], [ 0.7777777777777778, "#fb9f3a" ], [ 0.8888888888888888, "#fdca26" ], [ 1.0, "#f0f921" ] ] } ], "heatmap": [ { "type": "heatmap", "colorbar": { "ticks": "", "outlinewidth": 0 }, "colorscale": [ [ 0.0, "#0d0887" ], [ 0.1111111111111111, "#46039f" ], [ 0.2222222222222222, "#7201a8" ], [ 0.3333333333333333, "#9c179e" ], [ 0.4444444444444444, "#bd3786" ], [ 0.5555555555555556, "#d8576b" ], [ 0.6666666666666666, "#ed7953" ], [ 0.7777777777777778, "#fb9f3a" ], [ 0.8888888888888888, "#fdca26" ], [ 1.0, "#f0f921" ] ] } ], "scatter": [ { "type": "scatter", "fillpattern": { "size": 10, "fillmode": "overlay", "solidity": 0.2 } } ], "surface": [ { "type": "surface", "colorbar": { "ticks": "", "outlinewidth": 0 }, "colorscale": [ [ 0.0, "#0d0887" ], [ 0.1111111111111111, "#46039f" ], [ 0.2222222222222222, "#7201a8" ], [ 0.3333333333333333, "#9c179e" ], [ 0.4444444444444444, "#bd3786" ], [ 0.5555555555555556, "#d8576b" ], [ 0.6666666666666666, "#ed7953" ], [ 0.7777777777777778, "#fb9f3a" ], [ 0.8888888888888888, "#fdca26" ], [ 1.0, "#f0f921" ] ] } ], "barpolar": [ { "type": "barpolar", "marker": { "line": { "color": "#E5ECF6", "width": 0.5 }, "pattern": { "size": 10, "fillmode": "overlay", "solidity": 0.2 } } } ], "heatmapgl": [ { "type": "heatmapgl", "colorbar": { "ticks": "", "outlinewidth": 0 }, "colorscale": [ [ 0.0, "#0d0887" ], [ 0.1111111111111111, "#46039f" ], [ 0.2222222222222222, "#7201a8" ], [ 0.3333333333333333, "#9c179e" ], [ 0.4444444444444444, "#bd3786" ], [ 0.5555555555555556, "#d8576b" ], [ 0.6666666666666666, "#ed7953" ], [ 0.7777777777777778, "#fb9f3a" ], [ 0.8888888888888888, "#fdca26" ], [ 1.0, "#f0f921" ] ] } ], "histogram": [ { "type": "histogram", "marker": { "pattern": { "size": 10, "fillmode": "overlay", "solidity": 0.2 } } } ], "parcoords": [ { "line": { "colorbar": { "ticks": "", "outlinewidth": 0 } }, "type": "parcoords" } ], "scatter3d": [ { "line": { "colorbar": { "ticks": "", "outlinewidth": 0 } }, "type": "scatter3d", "marker": { "colorbar": { "ticks": "", "outlinewidth": 0 } } } ], "scattergl": [ { "type": "scattergl", "marker": { "colorbar": { "ticks": "", "outlinewidth": 0 } } } ], "choropleth": [ { "type": "choropleth", "colorbar": { "ticks": "", "outlinewidth": 0 } } ], "scattergeo": [ { "type": "scattergeo", "marker": { "colorbar": { "ticks": "", "outlinewidth": 0 } } } ], "histogram2d": [ { "type": "histogram2d", "colorbar": { "ticks": "", "outlinewidth": 0 }, "colorscale": [ [ 0.0, "#0d0887" ], [ 0.1111111111111111, "#46039f" ], [ 0.2222222222222222, "#7201a8" ], [ 0.3333333333333333, "#9c179e" ], [ 0.4444444444444444, "#bd3786" ], [ 0.5555555555555556, "#d8576b" ], [ 0.6666666666666666, "#ed7953" ], [ 0.7777777777777778, "#fb9f3a" ], [ 0.8888888888888888, "#fdca26" ], [ 1.0, "#f0f921" ] ] } ], "scatterpolar": [ { "type": "scatterpolar", "marker": { "colorbar": { "ticks": "", "outlinewidth": 0 } } } ], "contourcarpet": [ { "type": "contourcarpet", "colorbar": { "ticks": "", "outlinewidth": 0 } } ], "scattercarpet": [ { "type": "scattercarpet", "marker": { "colorbar": { "ticks": "", "outlinewidth": 0 } } } ], "scattermapbox": [ { "type": "scattermapbox", "marker": { "colorbar": { "ticks": "", "outlinewidth": 0 } } } ], "scatterpolargl": [ { "type": "scatterpolargl", "marker": { "colorbar": { "ticks": "", "outlinewidth": 0 } } } ], "scatterternary": [ { "type": "scatterternary", "marker": { "colorbar": { "ticks": "", "outlinewidth": 0 } } } ], "histogram2dcontour": [ { "type": "histogram2dcontour", "colorbar": { "ticks": "", "outlinewidth": 0 }, "colorscale": [ [ 0.0, "#0d0887" ], [ 0.1111111111111111, "#46039f" ], [ 0.2222222222222222, "#7201a8" ], [ 0.3333333333333333, "#9c179e" ], [ 0.4444444444444444, "#bd3786" ], [ 0.5555555555555556, "#d8576b" ], [ 0.6666666666666666, "#ed7953" ], [ 0.7777777777777778, "#fb9f3a" ], [ 0.8888888888888888, "#fdca26" ], [ 1.0, "#f0f921" ] ] } ] }, "layout": { "geo": { "bgcolor": "white", "showland": true, "lakecolor": "white", "landcolor": "#E5ECF6", "showlakes": true, "subunitcolor": "white" }, "font": { "color": "#2a3f5f" }, "polar": { "bgcolor": "#E5ECF6", "radialaxis": { "ticks": "", "gridcolor": "white", "linecolor": "white" }, "angularaxis": { "ticks": "", "gridcolor": "white", "linecolor": "white" } }, "scene": { "xaxis": { "ticks": "", "gridcolor": "white", "gridwidth": 2, "linecolor": "white", "zerolinecolor": "white", "showbackground": true, "backgroundcolor": "#E5ECF6" }, "yaxis": { "ticks": "", "gridcolor": "white", "gridwidth": 2, "linecolor": "white", "zerolinecolor": "white", "showbackground": true, "backgroundcolor": "#E5ECF6" }, "zaxis": { "ticks": "", "gridcolor": "white", "gridwidth": 2, "linecolor": "white", "zerolinecolor": "white", "showbackground": true, "backgroundcolor": "#E5ECF6" } }, "title": { "x": 0.05 }, "xaxis": { "ticks": "", "title": { "standoff": 15 }, "gridcolor": "white", "linecolor": "white", "automargin": true, "zerolinecolor": "white", "zerolinewidth": 2 }, "yaxis": { "ticks": "", "title": { "standoff": 15 }, "gridcolor": "white", "linecolor": "white", "automargin": true, "zerolinecolor": "white", "zerolinewidth": 2 }, "mapbox": { "style": "light" }, "ternary": { "aaxis": { "ticks": "", "gridcolor": "white", "linecolor": "white" }, "baxis": { "ticks": "", "gridcolor": "white", "linecolor": "white" }, "caxis": { "ticks": "", "gridcolor": "white", "linecolor": "white" }, "bgcolor": "#E5ECF6" }, "colorway": [ "#636efa", "#EF553B", "#00cc96", "#ab63fa", "#FFA15A", "#19d3f3", "#FF6692", "#B6E880", "#FF97FF", "#FECB52" ], "coloraxis": { "colorbar": { "ticks": "", "outlinewidth": 0 } }, "hovermode": "closest", "colorscale": { "diverging": [ [ 0, "#8e0152" ], [ 0.1, "#c51b7d" ], [ 0.2, "#de77ae" ], [ 0.3, "#f1b6da" ], [ 0.4, "#fde0ef" ], [ 0.5, "#f7f7f7" ], [ 0.6, "#e6f5d0" ], [ 0.7, "#b8e186" ], [ 0.8, "#7fbc41" ], [ 0.9, "#4d9221" ], [ 1, "#276419" ] ], "sequential": [ [ 0.0, "#0d0887" ], [ 0.1111111111111111, "#46039f" ], [ 0.2222222222222222, "#7201a8" ], [ 0.3333333333333333, "#9c179e" ], [ 0.4444444444444444, "#bd3786" ], [ 0.5555555555555556, "#d8576b" ], [ 0.6666666666666666, "#ed7953" ], [ 0.7777777777777778, "#fb9f3a" ], [ 0.8888888888888888, "#fdca26" ], [ 1.0, "#f0f921" ] ], "sequentialminus": [ [ 0.0, "#0d0887" ], [ 0.1111111111111111, "#46039f" ], [ 0.2222222222222222, "#7201a8" ], [ 0.3333333333333333, "#9c179e" ], [ 0.4444444444444444, "#bd3786" ], [ 0.5555555555555556, "#d8576b" ], [ 0.6666666666666666, "#ed7953" ], [ 0.7777777777777778, "#fb9f3a" ], [ 0.8888888888888888, "#fdca26" ], [ 1.0, "#f0f921" ] ] }, "hoverlabel": { "align": "left" }, "plot_bgcolor": "#E5ECF6", "paper_bgcolor": "white", "shapedefaults": { "line": { "color": "#2a3f5f" } }, "autotypenumbers": "strict", "annotationdefaults": { "arrowhead": 0, "arrowcolor": "#2a3f5f", "arrowwidth": 1 } } } } }, "height": 600, "width": 800, "user": { "profile_url": "https://chart-studio.plotly.com/~seminkim", "avatar_url": "https://storage.googleapis.com/plotly-prod-profiles/57.jpg", "background_url": "https://storage.googleapis.com/plotly-prod-profiles/bg-7.jpg", "bio": "", "nickname": "", "website": "", "stream_tokens": null, "feature_set_id": null, "csrf_token": null, "date_joined": "2024-04-16 16:28:54", "mapbox_access_tokens": null, "has_password": null, "username": "seminkim", "email": null, "is_active": null, "readonly": null, "is_dash_creator": null, "dash_created_count": null, "is_chart_creator": null, "charts_created_count": null } }, { "creation_time": "2024-04-16T16:41:38.060651Z", "comments": { "results": [], "count": 0 }, "parented": true, "embed_url": "https://chart-studio.plotly.com/~seminkim/29.embed", "fid": "seminkim:29", "filename": "zero=0.1,seed=10", "filetype": "plot", "img_url": "https://storage.googleapis.com/plotly-prod-images/seminkim/29/9_KBGDIES2WQKF2MKCB17OUEEQHTPVDF.png", "image_urls": { "default": "https://storage.googleapis.com/plotly-prod-images/seminkim/29/2_MNNTSS7HZL7PJIYU9GC5WMP5SS2QX6.png", "block-thumb": "https://storage.googleapis.com/plotly-prod-images/seminkim/29/8_2H9EEWLYXNUWFO9R43UYKAXSVT9VA1.png", "list-thumb": "https://storage.googleapis.com/plotly-prod-images/seminkim/29/9_KBGDIES2WQKF2MKCB17OUEEQHTPVDF.png" }, "api_urls": { "files": "https://api.plotly.com/v2/files/seminkim:29", "plots": "https://api.plotly.com/v2/plots/seminkim:29", "parent": "https://api.plotly.com/v2/folders/home?user=seminkim" }, "owner": "seminkim", "parent": -1, "preview": "", "referencers": [], "references": [], "title": "", "views": 1, "web_url": "https://chart-studio.plotly.com/~seminkim/29/", "world_readable": true, "date_modified": "2024-04-16T16:41:38.072Z", "stars": { "results": [], "count": 0 }, "collaborators": { "results": [], "count": 0 }, "subfolder_count": null, "refresh_interval": null, "organize_view_url": "https://chart-studio.plotly.com/~seminkim/29/", "current_user_permission": "read", "is_theme": null, "is_template": null, "autosize": true, "caption": "", "figure": { "data": [ { "mode": "markers", "type": "scatter3d", "xsrc": "seminkim:28:cb5b00", "ysrc": "seminkim:28:581755", "zsrc": "seminkim:28:6cb82b", "marker": { "size": 5, "opacity": 0.5, "colorsrc": "seminkim:28:904652" } } ], "layout": { "scene": { "aspectmode": "data" }, "width": 800, "height": 600, "template": { "data": { "bar": [ { "type": "bar", "marker": { "line": { "color": "#E5ECF6", "width": 0.5 }, "pattern": { "size": 10, "fillmode": "overlay", "solidity": 0.2 } }, "error_x": { "color": "#2a3f5f" }, "error_y": { "color": "#2a3f5f" } } ], "pie": [ { "type": "pie", "automargin": true } ], "table": [ { "type": "table", "cells": { "fill": { "color": "#EBF0F8" }, "line": { "color": "white" } }, "header": { "fill": { "color": "#C8D4E3" }, "line": { "color": "white" } } } ], "carpet": [ { "type": "carpet", "aaxis": { "gridcolor": "white", "linecolor": "white", "endlinecolor": "#2a3f5f", "minorgridcolor": "white", "startlinecolor": "#2a3f5f" }, "baxis": { "gridcolor": "white", "linecolor": "white", "endlinecolor": "#2a3f5f", "minorgridcolor": "white", "startlinecolor": "#2a3f5f" } } ], "mesh3d": [ { "type": "mesh3d", "colorbar": { "ticks": "", "outlinewidth": 0 } } ], "contour": [ { "type": "contour", "colorbar": { "ticks": "", "outlinewidth": 0 }, "colorscale": [ [ 0.0, "#0d0887" ], [ 0.1111111111111111, "#46039f" ], [ 0.2222222222222222, "#7201a8" ], [ 0.3333333333333333, "#9c179e" ], [ 0.4444444444444444, "#bd3786" ], [ 0.5555555555555556, "#d8576b" ], [ 0.6666666666666666, "#ed7953" ], [ 0.7777777777777778, "#fb9f3a" ], [ 0.8888888888888888, "#fdca26" ], [ 1.0, "#f0f921" ] ] } ], "heatmap": [ { "type": "heatmap", "colorbar": { "ticks": "", "outlinewidth": 0 }, "colorscale": [ [ 0.0, "#0d0887" ], [ 0.1111111111111111, "#46039f" ], [ 0.2222222222222222, "#7201a8" ], [ 0.3333333333333333, "#9c179e" ], [ 0.4444444444444444, "#bd3786" ], [ 0.5555555555555556, "#d8576b" ], [ 0.6666666666666666, "#ed7953" ], [ 0.7777777777777778, "#fb9f3a" ], [ 0.8888888888888888, "#fdca26" ], [ 1.0, "#f0f921" ] ] } ], "scatter": [ { "type": "scatter", "fillpattern": { "size": 10, "fillmode": "overlay", "solidity": 0.2 } } ], "surface": [ { "type": "surface", "colorbar": { "ticks": "", "outlinewidth": 0 }, "colorscale": [ [ 0.0, "#0d0887" ], [ 0.1111111111111111, "#46039f" ], [ 0.2222222222222222, "#7201a8" ], [ 0.3333333333333333, "#9c179e" ], [ 0.4444444444444444, "#bd3786" ], [ 0.5555555555555556, "#d8576b" ], [ 0.6666666666666666, "#ed7953" ], [ 0.7777777777777778, "#fb9f3a" ], [ 0.8888888888888888, "#fdca26" ], [ 1.0, "#f0f921" ] ] } ], "barpolar": [ { "type": "barpolar", "marker": { "line": { "color": "#E5ECF6", "width": 0.5 }, "pattern": { "size": 10, "fillmode": "overlay", "solidity": 0.2 } } } ], "heatmapgl": [ { "type": "heatmapgl", "colorbar": { "ticks": "", "outlinewidth": 0 }, "colorscale": [ [ 0.0, "#0d0887" ], [ 0.1111111111111111, "#46039f" ], [ 0.2222222222222222, "#7201a8" ], [ 0.3333333333333333, "#9c179e" ], [ 0.4444444444444444, "#bd3786" ], [ 0.5555555555555556, "#d8576b" ], [ 0.6666666666666666, "#ed7953" ], [ 0.7777777777777778, "#fb9f3a" ], [ 0.8888888888888888, "#fdca26" ], [ 1.0, "#f0f921" ] ] } ], "histogram": [ { "type": "histogram", "marker": { "pattern": { "size": 10, "fillmode": "overlay", "solidity": 0.2 } } } ], "parcoords": [ { "line": { "colorbar": { "ticks": "", "outlinewidth": 0 } }, "type": "parcoords" } ], "scatter3d": [ { "line": { "colorbar": { "ticks": "", "outlinewidth": 0 } }, "type": "scatter3d", "marker": { "colorbar": { "ticks": "", "outlinewidth": 0 } } } ], "scattergl": [ { "type": "scattergl", "marker": { "colorbar": { "ticks": "", "outlinewidth": 0 } } } ], "choropleth": [ { "type": "choropleth", "colorbar": { "ticks": "", "outlinewidth": 0 } } ], "scattergeo": [ { "type": "scattergeo", "marker": { "colorbar": { "ticks": "", "outlinewidth": 0 } } } ], "histogram2d": [ { "type": "histogram2d", "colorbar": { "ticks": "", "outlinewidth": 0 }, "colorscale": [ [ 0.0, "#0d0887" ], [ 0.1111111111111111, "#46039f" ], [ 0.2222222222222222, "#7201a8" ], [ 0.3333333333333333, "#9c179e" ], [ 0.4444444444444444, "#bd3786" ], [ 0.5555555555555556, "#d8576b" ], [ 0.6666666666666666, "#ed7953" ], [ 0.7777777777777778, "#fb9f3a" ], [ 0.8888888888888888, "#fdca26" ], [ 1.0, "#f0f921" ] ] } ], "scatterpolar": [ { "type": "scatterpolar", "marker": { "colorbar": { "ticks": "", "outlinewidth": 0 } } } ], "contourcarpet": [ { "type": "contourcarpet", "colorbar": { "ticks": "", "outlinewidth": 0 } } ], "scattercarpet": [ { "type": "scattercarpet", "marker": { "colorbar": { "ticks": "", "outlinewidth": 0 } } } ], "scattermapbox": [ { "type": "scattermapbox", "marker": { "colorbar": { "ticks": "", "outlinewidth": 0 } } } ], "scatterpolargl": [ { "type": "scatterpolargl", "marker": { "colorbar": { "ticks": "", "outlinewidth": 0 } } } ], "scatterternary": [ { "type": "scatterternary", "marker": { "colorbar": { "ticks": "", "outlinewidth": 0 } } } ], "histogram2dcontour": [ { "type": "histogram2dcontour", "colorbar": { "ticks": "", "outlinewidth": 0 }, "colorscale": [ [ 0.0, "#0d0887" ], [ 0.1111111111111111, "#46039f" ], [ 0.2222222222222222, "#7201a8" ], [ 0.3333333333333333, "#9c179e" ], [ 0.4444444444444444, "#bd3786" ], [ 0.5555555555555556, "#d8576b" ], [ 0.6666666666666666, "#ed7953" ], [ 0.7777777777777778, "#fb9f3a" ], [ 0.8888888888888888, "#fdca26" ], [ 1.0, "#f0f921" ] ] } ] }, "layout": { "geo": { "bgcolor": "white", "showland": true, "lakecolor": "white", "landcolor": "#E5ECF6", "showlakes": true, "subunitcolor": "white" }, "font": { "color": "#2a3f5f" }, "polar": { "bgcolor": "#E5ECF6", "radialaxis": { "ticks": "", "gridcolor": "white", "linecolor": "white" }, "angularaxis": { "ticks": "", "gridcolor": "white", "linecolor": "white" } }, "scene": { "xaxis": { "ticks": "", "gridcolor": "white", "gridwidth": 2, "linecolor": "white", "zerolinecolor": "white", "showbackground": true, "backgroundcolor": "#E5ECF6" }, "yaxis": { "ticks": "", "gridcolor": "white", "gridwidth": 2, "linecolor": "white", "zerolinecolor": "white", "showbackground": true, "backgroundcolor": "#E5ECF6" }, "zaxis": { "ticks": "", "gridcolor": "white", "gridwidth": 2, "linecolor": "white", "zerolinecolor": "white", "showbackground": true, "backgroundcolor": "#E5ECF6" } }, "title": { "x": 0.05 }, "xaxis": { "ticks": "", "title": { "standoff": 15 }, "gridcolor": "white", "linecolor": "white", "automargin": true, "zerolinecolor": "white", "zerolinewidth": 2 }, "yaxis": { "ticks": "", "title": { "standoff": 15 }, "gridcolor": "white", "linecolor": "white", "automargin": true, "zerolinecolor": "white", "zerolinewidth": 2 }, "mapbox": { "style": "light" }, "ternary": { "aaxis": { "ticks": "", "gridcolor": "white", "linecolor": "white" }, "baxis": { "ticks": "", "gridcolor": "white", "linecolor": "white" }, "caxis": { "ticks": "", "gridcolor": "white", "linecolor": "white" }, "bgcolor": "#E5ECF6" }, "colorway": [ "#636efa", "#EF553B", "#00cc96", "#ab63fa", "#FFA15A", "#19d3f3", "#FF6692", "#B6E880", "#FF97FF", "#FECB52" ], "coloraxis": { "colorbar": { "ticks": "", "outlinewidth": 0 } }, "hovermode": "closest", "colorscale": { "diverging": [ [ 0, "#8e0152" ], [ 0.1, "#c51b7d" ], [ 0.2, "#de77ae" ], [ 0.3, "#f1b6da" ], [ 0.4, "#fde0ef" ], [ 0.5, "#f7f7f7" ], [ 0.6, "#e6f5d0" ], [ 0.7, "#b8e186" ], [ 0.8, "#7fbc41" ], [ 0.9, "#4d9221" ], [ 1, "#276419" ] ], "sequential": [ [ 0.0, "#0d0887" ], [ 0.1111111111111111, "#46039f" ], [ 0.2222222222222222, "#7201a8" ], [ 0.3333333333333333, "#9c179e" ], [ 0.4444444444444444, "#bd3786" ], [ 0.5555555555555556, "#d8576b" ], [ 0.6666666666666666, "#ed7953" ], [ 0.7777777777777778, "#fb9f3a" ], [ 0.8888888888888888, "#fdca26" ], [ 1.0, "#f0f921" ] ], "sequentialminus": [ [ 0.0, "#0d0887" ], [ 0.1111111111111111, "#46039f" ], [ 0.2222222222222222, "#7201a8" ], [ 0.3333333333333333, "#9c179e" ], [ 0.4444444444444444, "#bd3786" ], [ 0.5555555555555556, "#d8576b" ], [ 0.6666666666666666, "#ed7953" ], [ 0.7777777777777778, "#fb9f3a" ], [ 0.8888888888888888, "#fdca26" ], [ 1.0, "#f0f921" ] ] }, "hoverlabel": { "align": "left" }, "plot_bgcolor": "#E5ECF6", "paper_bgcolor": "white", "shapedefaults": { "line": { "color": "#2a3f5f" } }, "autotypenumbers": "strict", "annotationdefaults": { "arrowhead": 0, "arrowcolor": "#2a3f5f", "arrowwidth": 1 } } } } }, "height": 600, "width": 800, "user": { "profile_url": "https://chart-studio.plotly.com/~seminkim", "avatar_url": "https://storage.googleapis.com/plotly-prod-profiles/57.jpg", "background_url": "https://storage.googleapis.com/plotly-prod-profiles/bg-7.jpg", "bio": "", "nickname": "", "website": "", "stream_tokens": null, "feature_set_id": null, "csrf_token": null, "date_joined": "2024-04-16 16:28:54", "mapbox_access_tokens": null, "has_password": null, "username": "seminkim", "email": null, "is_active": null, "readonly": null, "is_dash_creator": null, "dash_created_count": null, "is_chart_creator": null, "charts_created_count": null } }, { "creation_time": "2024-04-16T16:41:34.234536Z", "comments": { "results": [], "count": 0 }, "parented": true, "embed_url": "https://chart-studio.plotly.com/~seminkim/27.embed", "fid": "seminkim:27", "filename": "zero=0.1,seed=9", "filetype": "plot", "img_url": "https://storage.googleapis.com/plotly-prod-images/seminkim/27/9_K9ZHPFKM94PFDGNFEFWCT50IXFUUNB.png", "image_urls": { "default": "https://storage.googleapis.com/plotly-prod-images/seminkim/27/2_C27FXOEXZC70Z2C2RAIQDJJTOEU55P.png", "block-thumb": "https://storage.googleapis.com/plotly-prod-images/seminkim/27/8_GV68EBBVB0GODLEC44LZUX9QK4PF3I.png", "list-thumb": "https://storage.googleapis.com/plotly-prod-images/seminkim/27/9_K9ZHPFKM94PFDGNFEFWCT50IXFUUNB.png" }, "api_urls": { "files": "https://api.plotly.com/v2/files/seminkim:27", "plots": "https://api.plotly.com/v2/plots/seminkim:27", "parent": "https://api.plotly.com/v2/folders/home?user=seminkim" }, "owner": "seminkim", "parent": -1, "preview": "", "referencers": [], "references": [], "title": "", "views": 1, "web_url": "https://chart-studio.plotly.com/~seminkim/27/", "world_readable": true, "date_modified": "2024-04-16T16:41:34.247Z", "stars": { "results": [], "count": 0 }, "collaborators": { "results": [], "count": 0 }, "subfolder_count": null, "refresh_interval": null, "organize_view_url": "https://chart-studio.plotly.com/~seminkim/27/", "current_user_permission": "read", "is_theme": null, "is_template": null, "autosize": true, "caption": "", "figure": { "data": [ { "mode": "markers", "type": "scatter3d", "xsrc": "seminkim:26:aff5b7", "ysrc": "seminkim:26:319df2", "zsrc": "seminkim:26:e16270", "marker": { "size": 5, "opacity": 0.5, "colorsrc": "seminkim:26:e960a6" } } ], "layout": { "scene": { "aspectmode": "data" }, "width": 800, "height": 600, "template": { "data": { "bar": [ { "type": "bar", "marker": { "line": { "color": "#E5ECF6", "width": 0.5 }, "pattern": { "size": 10, "fillmode": "overlay", "solidity": 0.2 } }, "error_x": { "color": "#2a3f5f" }, "error_y": { "color": "#2a3f5f" } } ], "pie": [ { "type": "pie", "automargin": true } ], "table": [ { "type": "table", "cells": { "fill": { "color": "#EBF0F8" }, "line": { "color": "white" } }, "header": { "fill": { "color": "#C8D4E3" }, "line": { "color": "white" } } } ], "carpet": [ { "type": "carpet", "aaxis": { "gridcolor": "white", "linecolor": "white", "endlinecolor": "#2a3f5f", "minorgridcolor": "white", "startlinecolor": "#2a3f5f" }, "baxis": { "gridcolor": "white", "linecolor": "white", "endlinecolor": "#2a3f5f", "minorgridcolor": "white", "startlinecolor": "#2a3f5f" } } ], "mesh3d": [ { "type": "mesh3d", "colorbar": { "ticks": "", "outlinewidth": 0 } } ], "contour": [ { "type": "contour", "colorbar": { "ticks": "", "outlinewidth": 0 }, "colorscale": [ [ 0.0, "#0d0887" ], [ 0.1111111111111111, "#46039f" ], [ 0.2222222222222222, "#7201a8" ], [ 0.3333333333333333, "#9c179e" ], [ 0.4444444444444444, "#bd3786" ], [ 0.5555555555555556, "#d8576b" ], [ 0.6666666666666666, "#ed7953" ], [ 0.7777777777777778, "#fb9f3a" ], [ 0.8888888888888888, "#fdca26" ], [ 1.0, "#f0f921" ] ] } ], "heatmap": [ { "type": "heatmap", "colorbar": { "ticks": "", "outlinewidth": 0 }, "colorscale": [ [ 0.0, "#0d0887" ], [ 0.1111111111111111, "#46039f" ], [ 0.2222222222222222, "#7201a8" ], [ 0.3333333333333333, "#9c179e" ], [ 0.4444444444444444, "#bd3786" ], [ 0.5555555555555556, "#d8576b" ], [ 0.6666666666666666, "#ed7953" ], [ 0.7777777777777778, "#fb9f3a" ], [ 0.8888888888888888, "#fdca26" ], [ 1.0, "#f0f921" ] ] } ], "scatter": [ { "type": "scatter", "fillpattern": { "size": 10, "fillmode": "overlay", "solidity": 0.2 } } ], "surface": [ { "type": "surface", "colorbar": { "ticks": "", "outlinewidth": 0 }, "colorscale": [ [ 0.0, "#0d0887" ], [ 0.1111111111111111, "#46039f" ], [ 0.2222222222222222, "#7201a8" ], [ 0.3333333333333333, "#9c179e" ], [ 0.4444444444444444, "#bd3786" ], [ 0.5555555555555556, "#d8576b" ], [ 0.6666666666666666, "#ed7953" ], [ 0.7777777777777778, "#fb9f3a" ], [ 0.8888888888888888, "#fdca26" ], [ 1.0, "#f0f921" ] ] } ], "barpolar": [ { "type": "barpolar", "marker": { "line": { "color": "#E5ECF6", "width": 0.5 }, "pattern": { "size": 10, "fillmode": "overlay", "solidity": 0.2 } } } ], "heatmapgl": [ { "type": "heatmapgl", "colorbar": { "ticks": "", "outlinewidth": 0 }, "colorscale": [ [ 0.0, "#0d0887" ], [ 0.1111111111111111, "#46039f" ], [ 0.2222222222222222, "#7201a8" ], [ 0.3333333333333333, "#9c179e" ], [ 0.4444444444444444, "#bd3786" ], [ 0.5555555555555556, "#d8576b" ], [ 0.6666666666666666, "#ed7953" ], [ 0.7777777777777778, "#fb9f3a" ], [ 0.8888888888888888, "#fdca26" ], [ 1.0, "#f0f921" ] ] } ], "histogram": [ { "type": "histogram", "marker": { "pattern": { "size": 10, "fillmode": "overlay", "solidity": 0.2 } } } ], "parcoords": [ { "line": { "colorbar": { "ticks": "", "outlinewidth": 0 } }, "type": "parcoords" } ], "scatter3d": [ { "line": { "colorbar": { "ticks": "", "outlinewidth": 0 } }, "type": "scatter3d", "marker": { "colorbar": { "ticks": "", "outlinewidth": 0 } } } ], "scattergl": [ { "type": "scattergl", "marker": { "colorbar": { "ticks": "", "outlinewidth": 0 } } } ], "choropleth": [ { "type": "choropleth", "colorbar": { "ticks": "", "outlinewidth": 0 } } ], "scattergeo": [ { "type": "scattergeo", "marker": { "colorbar": { "ticks": "", "outlinewidth": 0 } } } ], "histogram2d": [ { "type": "histogram2d", "colorbar": { "ticks": "", "outlinewidth": 0 }, "colorscale": [ [ 0.0, "#0d0887" ], [ 0.1111111111111111, "#46039f" ], [ 0.2222222222222222, "#7201a8" ], [ 0.3333333333333333, "#9c179e" ], [ 0.4444444444444444, "#bd3786" ], [ 0.5555555555555556, "#d8576b" ], [ 0.6666666666666666, "#ed7953" ], [ 0.7777777777777778, "#fb9f3a" ], [ 0.8888888888888888, "#fdca26" ], [ 1.0, "#f0f921" ] ] } ], "scatterpolar": [ { "type": "scatterpolar", "marker": { "colorbar": { "ticks": "", "outlinewidth": 0 } } } ], "contourcarpet": [ { "type": "contourcarpet", "colorbar": { "ticks": "", "outlinewidth": 0 } } ], "scattercarpet": [ { "type": "scattercarpet", "marker": { "colorbar": { "ticks": "", "outlinewidth": 0 } } } ], "scattermapbox": [ { "type": "scattermapbox", "marker": { "colorbar": { "ticks": "", "outlinewidth": 0 } } } ], "scatterpolargl": [ { "type": "scatterpolargl", "marker": { "colorbar": { "ticks": "", "outlinewidth": 0 } } } ], "scatterternary": [ { "type": "scatterternary", "marker": { "colorbar": { "ticks": "", "outlinewidth": 0 } } } ], "histogram2dcontour": [ { "type": "histogram2dcontour", "colorbar": { "ticks": "", "outlinewidth": 0 }, "colorscale": [ [ 0.0, "#0d0887" ], [ 0.1111111111111111, "#46039f" ], [ 0.2222222222222222, "#7201a8" ], [ 0.3333333333333333, "#9c179e" ], [ 0.4444444444444444, "#bd3786" ], [ 0.5555555555555556, "#d8576b" ], [ 0.6666666666666666, "#ed7953" ], [ 0.7777777777777778, "#fb9f3a" ], [ 0.8888888888888888, "#fdca26" ], [ 1.0, "#f0f921" ] ] } ] }, "layout": { "geo": { "bgcolor": "white", "showland": true, "lakecolor": "white", "landcolor": "#E5ECF6", "showlakes": true, "subunitcolor": "white" }, "font": { "color": "#2a3f5f" }, "polar": { "bgcolor": "#E5ECF6", "radialaxis": { "ticks": "", "gridcolor": "white", "linecolor": "white" }, "angularaxis": { "ticks": "", "gridcolor": "white", "linecolor": "white" } }, "scene": { "xaxis": { "ticks": "", "gridcolor": "white", "gridwidth": 2, "linecolor": "white", "zerolinecolor": "white", "showbackground": true, "backgroundcolor": "#E5ECF6" }, "yaxis": { "ticks": "", "gridcolor": "white", "gridwidth": 2, "linecolor": "white", "zerolinecolor": "white", "showbackground": true, "backgroundcolor": "#E5ECF6" }, "zaxis": { "ticks": "", "gridcolor": "white", "gridwidth": 2, "linecolor": "white", "zerolinecolor": "white", "showbackground": true, "backgroundcolor": "#E5ECF6" } }, "title": { "x": 0.05 }, "xaxis": { "ticks": "", "title": { "standoff": 15 }, "gridcolor": "white", "linecolor": "white", "automargin": true, "zerolinecolor": "white", "zerolinewidth": 2 }, "yaxis": { "ticks": "", "title": { "standoff": 15 }, "gridcolor": "white", "linecolor": "white", "automargin": true, "zerolinecolor": "white", "zerolinewidth": 2 }, "mapbox": { "style": "light" }, "ternary": { "aaxis": { "ticks": "", "gridcolor": "white", "linecolor": "white" }, "baxis": { "ticks": "", "gridcolor": "white", "linecolor": "white" }, "caxis": { "ticks": "", "gridcolor": "white", "linecolor": "white" }, "bgcolor": "#E5ECF6" }, "colorway": [ "#636efa", "#EF553B", "#00cc96", "#ab63fa", "#FFA15A", "#19d3f3", "#FF6692", "#B6E880", "#FF97FF", "#FECB52" ], "coloraxis": { "colorbar": { "ticks": "", "outlinewidth": 0 } }, "hovermode": "closest", "colorscale": { "diverging": [ [ 0, "#8e0152" ], [ 0.1, "#c51b7d" ], [ 0.2, "#de77ae" ], [ 0.3, "#f1b6da" ], [ 0.4, "#fde0ef" ], [ 0.5, "#f7f7f7" ], [ 0.6, "#e6f5d0" ], [ 0.7, "#b8e186" ], [ 0.8, "#7fbc41" ], [ 0.9, "#4d9221" ], [ 1, "#276419" ] ], "sequential": [ [ 0.0, "#0d0887" ], [ 0.1111111111111111, "#46039f" ], [ 0.2222222222222222, "#7201a8" ], [ 0.3333333333333333, "#9c179e" ], [ 0.4444444444444444, "#bd3786" ], [ 0.5555555555555556, "#d8576b" ], [ 0.6666666666666666, "#ed7953" ], [ 0.7777777777777778, "#fb9f3a" ], [ 0.8888888888888888, "#fdca26" ], [ 1.0, "#f0f921" ] ], "sequentialminus": [ [ 0.0, "#0d0887" ], [ 0.1111111111111111, "#46039f" ], [ 0.2222222222222222, "#7201a8" ], [ 0.3333333333333333, "#9c179e" ], [ 0.4444444444444444, "#bd3786" ], [ 0.5555555555555556, "#d8576b" ], [ 0.6666666666666666, "#ed7953" ], [ 0.7777777777777778, "#fb9f3a" ], [ 0.8888888888888888, "#fdca26" ], [ 1.0, "#f0f921" ] ] }, "hoverlabel": { "align": "left" }, "plot_bgcolor": "#E5ECF6", "paper_bgcolor": "white", "shapedefaults": { "line": { "color": "#2a3f5f" } }, "autotypenumbers": "strict", "annotationdefaults": { "arrowhead": 0, "arrowcolor": "#2a3f5f", "arrowwidth": 1 } } } } }, "height": 600, "width": 800, "user": { "profile_url": "https://chart-studio.plotly.com/~seminkim", "avatar_url": "https://storage.googleapis.com/plotly-prod-profiles/57.jpg", "background_url": "https://storage.googleapis.com/plotly-prod-profiles/bg-7.jpg", "bio": "", "nickname": "", "website": "", "stream_tokens": null, "feature_set_id": null, "csrf_token": null, "date_joined": "2024-04-16 16:28:54", "mapbox_access_tokens": null, "has_password": null, "username": "seminkim", "email": null, "is_active": null, "readonly": null, "is_dash_creator": null, "dash_created_count": null, "is_chart_creator": null, "charts_created_count": null } }, { "creation_time": "2024-04-16T16:41:30.430693Z", "comments": { "results": [], "count": 0 }, "parented": true, "embed_url": "https://chart-studio.plotly.com/~seminkim/25.embed", "fid": "seminkim:25", "filename": "zero=0.1,seed=8", "filetype": "plot", "img_url": "https://storage.googleapis.com/plotly-prod-images/seminkim/25/9_2E431HY3UJYU6QDPFNMUUDQRJBL5FM.png", "image_urls": { "default": "https://storage.googleapis.com/plotly-prod-images/seminkim/25/2_HJFI933B16HE8ZRXBL1H68VUWURKXY.png", "block-thumb": "https://storage.googleapis.com/plotly-prod-images/seminkim/25/8_54JETGH84SPZN6AQ3VEVZ76D9MR0LA.png", "list-thumb": "https://storage.googleapis.com/plotly-prod-images/seminkim/25/9_2E431HY3UJYU6QDPFNMUUDQRJBL5FM.png" }, "api_urls": { "files": "https://api.plotly.com/v2/files/seminkim:25", "plots": "https://api.plotly.com/v2/plots/seminkim:25", "parent": "https://api.plotly.com/v2/folders/home?user=seminkim" }, "owner": "seminkim", "parent": -1, "preview": "", "referencers": [], "references": [], "title": "", "views": 1, "web_url": "https://chart-studio.plotly.com/~seminkim/25/", "world_readable": true, "date_modified": "2024-04-16T16:41:30.443Z", "stars": { "results": [], "count": 0 }, "collaborators": { "results": [], "count": 0 }, "subfolder_count": null, "refresh_interval": null, "organize_view_url": "https://chart-studio.plotly.com/~seminkim/25/", "current_user_permission": "read", "is_theme": null, "is_template": null, "autosize": true, "caption": "", "figure": { "data": [ { "mode": "markers", "type": "scatter3d", "xsrc": "seminkim:24:318886", "ysrc": "seminkim:24:45ab34", "zsrc": "seminkim:24:32828d", "marker": { "size": 5, "opacity": 0.5, "colorsrc": "seminkim:24:6acfa8" } } ], "layout": { "scene": { "aspectmode": "data" }, "width": 800, "height": 600, "template": { "data": { "bar": [ { "type": "bar", "marker": { "line": { "color": "#E5ECF6", "width": 0.5 }, "pattern": { "size": 10, "fillmode": "overlay", "solidity": 0.2 } }, "error_x": { "color": "#2a3f5f" }, "error_y": { "color": "#2a3f5f" } } ], "pie": [ { "type": "pie", "automargin": true } ], "table": [ { "type": "table", "cells": { "fill": { "color": "#EBF0F8" }, "line": { "color": "white" } }, "header": { "fill": { "color": "#C8D4E3" }, "line": { "color": "white" } } } ], "carpet": [ { "type": "carpet", "aaxis": { "gridcolor": "white", "linecolor": "white", "endlinecolor": "#2a3f5f", "minorgridcolor": "white", "startlinecolor": "#2a3f5f" }, "baxis": { "gridcolor": "white", "linecolor": "white", "endlinecolor": "#2a3f5f", "minorgridcolor": "white", "startlinecolor": "#2a3f5f" } } ], "mesh3d": [ { "type": "mesh3d", "colorbar": { "ticks": "", "outlinewidth": 0 } } ], "contour": [ { "type": "contour", "colorbar": { "ticks": "", "outlinewidth": 0 }, "colorscale": [ [ 0.0, "#0d0887" ], [ 0.1111111111111111, "#46039f" ], [ 0.2222222222222222, "#7201a8" ], [ 0.3333333333333333, "#9c179e" ], [ 0.4444444444444444, "#bd3786" ], [ 0.5555555555555556, "#d8576b" ], [ 0.6666666666666666, "#ed7953" ], [ 0.7777777777777778, "#fb9f3a" ], [ 0.8888888888888888, "#fdca26" ], [ 1.0, "#f0f921" ] ] } ], "heatmap": [ { "type": "heatmap", "colorbar": { "ticks": "", "outlinewidth": 0 }, "colorscale": [ [ 0.0, "#0d0887" ], [ 0.1111111111111111, "#46039f" ], [ 0.2222222222222222, "#7201a8" ], [ 0.3333333333333333, "#9c179e" ], [ 0.4444444444444444, "#bd3786" ], [ 0.5555555555555556, "#d8576b" ], [ 0.6666666666666666, "#ed7953" ], [ 0.7777777777777778, "#fb9f3a" ], [ 0.8888888888888888, "#fdca26" ], [ 1.0, "#f0f921" ] ] } ], "scatter": [ { "type": "scatter", "fillpattern": { "size": 10, "fillmode": "overlay", "solidity": 0.2 } } ], "surface": [ { "type": "surface", "colorbar": { "ticks": "", "outlinewidth": 0 }, "colorscale": [ [ 0.0, "#0d0887" ], [ 0.1111111111111111, "#46039f" ], [ 0.2222222222222222, "#7201a8" ], [ 0.3333333333333333, "#9c179e" ], [ 0.4444444444444444, "#bd3786" ], [ 0.5555555555555556, "#d8576b" ], [ 0.6666666666666666, "#ed7953" ], [ 0.7777777777777778, "#fb9f3a" ], [ 0.8888888888888888, "#fdca26" ], [ 1.0, "#f0f921" ] ] } ], "barpolar": [ { "type": "barpolar", "marker": { "line": { "color": "#E5ECF6", "width": 0.5 }, "pattern": { "size": 10, "fillmode": "overlay", "solidity": 0.2 } } } ], "heatmapgl": [ { "type": "heatmapgl", "colorbar": { "ticks": "", "outlinewidth": 0 }, "colorscale": [ [ 0.0, "#0d0887" ], [ 0.1111111111111111, "#46039f" ], [ 0.2222222222222222, "#7201a8" ], [ 0.3333333333333333, "#9c179e" ], [ 0.4444444444444444, "#bd3786" ], [ 0.5555555555555556, "#d8576b" ], [ 0.6666666666666666, "#ed7953" ], [ 0.7777777777777778, "#fb9f3a" ], [ 0.8888888888888888, "#fdca26" ], [ 1.0, "#f0f921" ] ] } ], "histogram": [ { "type": "histogram", "marker": { "pattern": { "size": 10, "fillmode": "overlay", "solidity": 0.2 } } } ], "parcoords": [ { "line": { "colorbar": { "ticks": "", "outlinewidth": 0 } }, "type": "parcoords" } ], "scatter3d": [ { "line": { "colorbar": { "ticks": "", "outlinewidth": 0 } }, "type": "scatter3d", "marker": { "colorbar": { "ticks": "", "outlinewidth": 0 } } } ], "scattergl": [ { "type": "scattergl", "marker": { "colorbar": { "ticks": "", "outlinewidth": 0 } } } ], "choropleth": [ { "type": "choropleth", "colorbar": { "ticks": "", "outlinewidth": 0 } } ], "scattergeo": [ { "type": "scattergeo", "marker": { "colorbar": { "ticks": "", "outlinewidth": 0 } } } ], "histogram2d": [ { "type": "histogram2d", "colorbar": { "ticks": "", "outlinewidth": 0 }, "colorscale": [ [ 0.0, "#0d0887" ], [ 0.1111111111111111, "#46039f" ], [ 0.2222222222222222, "#7201a8" ], [ 0.3333333333333333, "#9c179e" ], [ 0.4444444444444444, "#bd3786" ], [ 0.5555555555555556, "#d8576b" ], [ 0.6666666666666666, "#ed7953" ], [ 0.7777777777777778, "#fb9f3a" ], [ 0.8888888888888888, "#fdca26" ], [ 1.0, "#f0f921" ] ] } ], "scatterpolar": [ { "type": "scatterpolar", "marker": { "colorbar": { "ticks": "", "outlinewidth": 0 } } } ], "contourcarpet": [ { "type": "contourcarpet", "colorbar": { "ticks": "", "outlinewidth": 0 } } ], "scattercarpet": [ { "type": "scattercarpet", "marker": { "colorbar": { "ticks": "", "outlinewidth": 0 } } } ], "scattermapbox": [ { "type": "scattermapbox", "marker": { "colorbar": { "ticks": "", "outlinewidth": 0 } } } ], "scatterpolargl": [ { "type": "scatterpolargl", "marker": { "colorbar": { "ticks": "", "outlinewidth": 0 } } } ], "scatterternary": [ { "type": "scatterternary", "marker": { "colorbar": { "ticks": "", "outlinewidth": 0 } } } ], "histogram2dcontour": [ { "type": "histogram2dcontour", "colorbar": { "ticks": "", "outlinewidth": 0 }, "colorscale": [ [ 0.0, "#0d0887" ], [ 0.1111111111111111, "#46039f" ], [ 0.2222222222222222, "#7201a8" ], [ 0.3333333333333333, "#9c179e" ], [ 0.4444444444444444, "#bd3786" ], [ 0.5555555555555556, "#d8576b" ], [ 0.6666666666666666, "#ed7953" ], [ 0.7777777777777778, "#fb9f3a" ], [ 0.8888888888888888, "#fdca26" ], [ 1.0, "#f0f921" ] ] } ] }, "layout": { "geo": { "bgcolor": "white", "showland": true, "lakecolor": "white", "landcolor": "#E5ECF6", "showlakes": true, "subunitcolor": "white" }, "font": { "color": "#2a3f5f" }, "polar": { "bgcolor": "#E5ECF6", "radialaxis": { "ticks": "", "gridcolor": "white", "linecolor": "white" }, "angularaxis": { "ticks": "", "gridcolor": "white", "linecolor": "white" } }, "scene": { "xaxis": { "ticks": "", "gridcolor": "white", "gridwidth": 2, "linecolor": "white", "zerolinecolor": "white", "showbackground": true, "backgroundcolor": "#E5ECF6" }, "yaxis": { "ticks": "", "gridcolor": "white", "gridwidth": 2, "linecolor": "white", "zerolinecolor": "white", "showbackground": true, "backgroundcolor": "#E5ECF6" }, "zaxis": { "ticks": "", "gridcolor": "white", "gridwidth": 2, "linecolor": "white", "zerolinecolor": "white", "showbackground": true, "backgroundcolor": "#E5ECF6" } }, "title": { "x": 0.05 }, "xaxis": { "ticks": "", "title": { "standoff": 15 }, "gridcolor": "white", "linecolor": "white", "automargin": true, "zerolinecolor": "white", "zerolinewidth": 2 }, "yaxis": { "ticks": "", "title": { "standoff": 15 }, "gridcolor": "white", "linecolor": "white", "automargin": true, "zerolinecolor": "white", "zerolinewidth": 2 }, "mapbox": { "style": "light" }, "ternary": { "aaxis": { "ticks": "", "gridcolor": "white", "linecolor": "white" }, "baxis": { "ticks": "", "gridcolor": "white", "linecolor": "white" }, "caxis": { "ticks": "", "gridcolor": "white", "linecolor": "white" }, "bgcolor": "#E5ECF6" }, "colorway": [ "#636efa", "#EF553B", "#00cc96", "#ab63fa", "#FFA15A", "#19d3f3", "#FF6692", "#B6E880", "#FF97FF", "#FECB52" ], "coloraxis": { "colorbar": { "ticks": "", "outlinewidth": 0 } }, "hovermode": "closest", "colorscale": { "diverging": [ [ 0, "#8e0152" ], [ 0.1, "#c51b7d" ], [ 0.2, "#de77ae" ], [ 0.3, "#f1b6da" ], [ 0.4, "#fde0ef" ], [ 0.5, "#f7f7f7" ], [ 0.6, "#e6f5d0" ], [ 0.7, "#b8e186" ], [ 0.8, "#7fbc41" ], [ 0.9, "#4d9221" ], [ 1, "#276419" ] ], "sequential": [ [ 0.0, "#0d0887" ], [ 0.1111111111111111, "#46039f" ], [ 0.2222222222222222, "#7201a8" ], [ 0.3333333333333333, "#9c179e" ], [ 0.4444444444444444, "#bd3786" ], [ 0.5555555555555556, "#d8576b" ], [ 0.6666666666666666, "#ed7953" ], [ 0.7777777777777778, "#fb9f3a" ], [ 0.8888888888888888, "#fdca26" ], [ 1.0, "#f0f921" ] ], "sequentialminus": [ [ 0.0, "#0d0887" ], [ 0.1111111111111111, "#46039f" ], [ 0.2222222222222222, "#7201a8" ], [ 0.3333333333333333, "#9c179e" ], [ 0.4444444444444444, "#bd3786" ], [ 0.5555555555555556, "#d8576b" ], [ 0.6666666666666666, "#ed7953" ], [ 0.7777777777777778, "#fb9f3a" ], [ 0.8888888888888888, "#fdca26" ], [ 1.0, "#f0f921" ] ] }, "hoverlabel": { "align": "left" }, "plot_bgcolor": "#E5ECF6", "paper_bgcolor": "white", "shapedefaults": { "line": { "color": "#2a3f5f" } }, "autotypenumbers": "strict", "annotationdefaults": { "arrowhead": 0, "arrowcolor": "#2a3f5f", "arrowwidth": 1 } } } } }, "height": 600, "width": 800, "user": { "profile_url": "https://chart-studio.plotly.com/~seminkim", "avatar_url": "https://storage.googleapis.com/plotly-prod-profiles/57.jpg", "background_url": "https://storage.googleapis.com/plotly-prod-profiles/bg-7.jpg", "bio": "", "nickname": "", "website": "", "stream_tokens": null, "feature_set_id": null, "csrf_token": null, "date_joined": "2024-04-16 16:28:54", "mapbox_access_tokens": null, "has_password": null, "username": "seminkim", "email": null, "is_active": null, "readonly": null, "is_dash_creator": null, "dash_created_count": null, "is_chart_creator": null, "charts_created_count": null } }, { "creation_time": "2024-04-16T16:41:26.490335Z", "comments": { "results": [], "count": 0 }, "parented": true, "embed_url": "https://chart-studio.plotly.com/~seminkim/23.embed", "fid": "seminkim:23", "filename": "zero=0.1,seed=7", "filetype": "plot", "img_url": "https://storage.googleapis.com/plotly-prod-images/seminkim/23/9_2C886ABI0Z1P5EOZQH070VHTZ8GST7.png", "image_urls": { "default": "https://storage.googleapis.com/plotly-prod-images/seminkim/23/2_HR9J5CJLGJIPIBGO2D59BPQLG9J6QF.png", "block-thumb": "https://storage.googleapis.com/plotly-prod-images/seminkim/23/8_GRWH4CNH5PGGK9PCORB8ADGE1ZIXVN.png", "list-thumb": "https://storage.googleapis.com/plotly-prod-images/seminkim/23/9_2C886ABI0Z1P5EOZQH070VHTZ8GST7.png" }, "api_urls": { "files": "https://api.plotly.com/v2/files/seminkim:23", "plots": "https://api.plotly.com/v2/plots/seminkim:23", "parent": "https://api.plotly.com/v2/folders/home?user=seminkim" }, "owner": "seminkim", "parent": -1, "preview": "", "referencers": [], "references": [], "title": "", "views": 1, "web_url": "https://chart-studio.plotly.com/~seminkim/23/", "world_readable": true, "date_modified": "2024-04-16T16:41:26.503Z", "stars": { "results": [], "count": 0 }, "collaborators": { "results": [], "count": 0 }, "subfolder_count": null, "refresh_interval": null, "organize_view_url": "https://chart-studio.plotly.com/~seminkim/23/", "current_user_permission": "read", "is_theme": null, "is_template": null, "autosize": true, "caption": "", "figure": { "data": [ { "mode": "markers", "type": "scatter3d", "xsrc": "seminkim:22:518131", "ysrc": "seminkim:22:49564b", "zsrc": "seminkim:22:049731", "marker": { "size": 5, "opacity": 0.5, "colorsrc": "seminkim:22:4fcfd0" } } ], "layout": { "scene": { "aspectmode": "data" }, "width": 800, "height": 600, "template": { "data": { "bar": [ { "type": "bar", "marker": { "line": { "color": "#E5ECF6", "width": 0.5 }, "pattern": { "size": 10, "fillmode": "overlay", "solidity": 0.2 } }, "error_x": { "color": "#2a3f5f" }, "error_y": { "color": "#2a3f5f" } } ], "pie": [ { "type": "pie", "automargin": true } ], "table": [ { "type": "table", "cells": { "fill": { "color": "#EBF0F8" }, "line": { "color": "white" } }, "header": { "fill": { "color": "#C8D4E3" }, "line": { "color": "white" } } } ], "carpet": [ { "type": "carpet", "aaxis": { "gridcolor": "white", "linecolor": "white", "endlinecolor": "#2a3f5f", "minorgridcolor": "white", "startlinecolor": "#2a3f5f" }, "baxis": { "gridcolor": "white", "linecolor": "white", "endlinecolor": "#2a3f5f", "minorgridcolor": "white", "startlinecolor": "#2a3f5f" } } ], "mesh3d": [ { "type": "mesh3d", "colorbar": { "ticks": "", "outlinewidth": 0 } } ], "contour": [ { "type": "contour", "colorbar": { "ticks": "", "outlinewidth": 0 }, "colorscale": [ [ 0.0, "#0d0887" ], [ 0.1111111111111111, "#46039f" ], [ 0.2222222222222222, "#7201a8" ], [ 0.3333333333333333, "#9c179e" ], [ 0.4444444444444444, "#bd3786" ], [ 0.5555555555555556, "#d8576b" ], [ 0.6666666666666666, "#ed7953" ], [ 0.7777777777777778, "#fb9f3a" ], [ 0.8888888888888888, "#fdca26" ], [ 1.0, "#f0f921" ] ] } ], "heatmap": [ { "type": "heatmap", "colorbar": { "ticks": "", "outlinewidth": 0 }, "colorscale": [ [ 0.0, "#0d0887" ], [ 0.1111111111111111, "#46039f" ], [ 0.2222222222222222, "#7201a8" ], [ 0.3333333333333333, "#9c179e" ], [ 0.4444444444444444, "#bd3786" ], [ 0.5555555555555556, "#d8576b" ], [ 0.6666666666666666, "#ed7953" ], [ 0.7777777777777778, "#fb9f3a" ], [ 0.8888888888888888, "#fdca26" ], [ 1.0, "#f0f921" ] ] } ], "scatter": [ { "type": "scatter", "fillpattern": { "size": 10, "fillmode": "overlay", "solidity": 0.2 } } ], "surface": [ { "type": "surface", "colorbar": { "ticks": "", "outlinewidth": 0 }, "colorscale": [ [ 0.0, "#0d0887" ], [ 0.1111111111111111, "#46039f" ], [ 0.2222222222222222, "#7201a8" ], [ 0.3333333333333333, "#9c179e" ], [ 0.4444444444444444, "#bd3786" ], [ 0.5555555555555556, "#d8576b" ], [ 0.6666666666666666, "#ed7953" ], [ 0.7777777777777778, "#fb9f3a" ], [ 0.8888888888888888, "#fdca26" ], [ 1.0, "#f0f921" ] ] } ], "barpolar": [ { "type": "barpolar", "marker": { "line": { "color": "#E5ECF6", "width": 0.5 }, "pattern": { "size": 10, "fillmode": "overlay", "solidity": 0.2 } } } ], "heatmapgl": [ { "type": "heatmapgl", "colorbar": { "ticks": "", "outlinewidth": 0 }, "colorscale": [ [ 0.0, "#0d0887" ], [ 0.1111111111111111, "#46039f" ], [ 0.2222222222222222, "#7201a8" ], [ 0.3333333333333333, "#9c179e" ], [ 0.4444444444444444, "#bd3786" ], [ 0.5555555555555556, "#d8576b" ], [ 0.6666666666666666, "#ed7953" ], [ 0.7777777777777778, "#fb9f3a" ], [ 0.8888888888888888, "#fdca26" ], [ 1.0, "#f0f921" ] ] } ], "histogram": [ { "type": "histogram", "marker": { "pattern": { "size": 10, "fillmode": "overlay", "solidity": 0.2 } } } ], "parcoords": [ { "line": { "colorbar": { "ticks": "", "outlinewidth": 0 } }, "type": "parcoords" } ], "scatter3d": [ { "line": { "colorbar": { "ticks": "", "outlinewidth": 0 } }, "type": "scatter3d", "marker": { "colorbar": { "ticks": "", "outlinewidth": 0 } } } ], "scattergl": [ { "type": "scattergl", "marker": { "colorbar": { "ticks": "", "outlinewidth": 0 } } } ], "choropleth": [ { "type": "choropleth", "colorbar": { "ticks": "", "outlinewidth": 0 } } ], "scattergeo": [ { "type": "scattergeo", "marker": { "colorbar": { "ticks": "", "outlinewidth": 0 } } } ], "histogram2d": [ { "type": "histogram2d", "colorbar": { "ticks": "", "outlinewidth": 0 }, "colorscale": [ [ 0.0, "#0d0887" ], [ 0.1111111111111111, "#46039f" ], [ 0.2222222222222222, "#7201a8" ], [ 0.3333333333333333, "#9c179e" ], [ 0.4444444444444444, "#bd3786" ], [ 0.5555555555555556, "#d8576b" ], [ 0.6666666666666666, "#ed7953" ], [ 0.7777777777777778, "#fb9f3a" ], [ 0.8888888888888888, "#fdca26" ], [ 1.0, "#f0f921" ] ] } ], "scatterpolar": [ { "type": "scatterpolar", "marker": { "colorbar": { "ticks": "", "outlinewidth": 0 } } } ], "contourcarpet": [ { "type": "contourcarpet", "colorbar": { "ticks": "", "outlinewidth": 0 } } ], "scattercarpet": [ { "type": "scattercarpet", "marker": { "colorbar": { "ticks": "", "outlinewidth": 0 } } } ], "scattermapbox": [ { "type": "scattermapbox", "marker": { "colorbar": { "ticks": "", "outlinewidth": 0 } } } ], "scatterpolargl": [ { "type": "scatterpolargl", "marker": { "colorbar": { "ticks": "", "outlinewidth": 0 } } } ], "scatterternary": [ { "type": "scatterternary", "marker": { "colorbar": { "ticks": "", "outlinewidth": 0 } } } ], "histogram2dcontour": [ { "type": "histogram2dcontour", "colorbar": { "ticks": "", "outlinewidth": 0 }, "colorscale": [ [ 0.0, "#0d0887" ], [ 0.1111111111111111, "#46039f" ], [ 0.2222222222222222, "#7201a8" ], [ 0.3333333333333333, "#9c179e" ], [ 0.4444444444444444, "#bd3786" ], [ 0.5555555555555556, "#d8576b" ], [ 0.6666666666666666, "#ed7953" ], [ 0.7777777777777778, "#fb9f3a" ], [ 0.8888888888888888, "#fdca26" ], [ 1.0, "#f0f921" ] ] } ] }, "layout": { "geo": { "bgcolor": "white", "showland": true, "lakecolor": "white", "landcolor": "#E5ECF6", "showlakes": true, "subunitcolor": "white" }, "font": { "color": "#2a3f5f" }, "polar": { "bgcolor": "#E5ECF6", "radialaxis": { "ticks": "", "gridcolor": "white", "linecolor": "white" }, "angularaxis": { "ticks": "", "gridcolor": "white", "linecolor": "white" } }, "scene": { "xaxis": { "ticks": "", "gridcolor": "white", "gridwidth": 2, "linecolor": "white", "zerolinecolor": "white", "showbackground": true, "backgroundcolor": "#E5ECF6" }, "yaxis": { "ticks": "", "gridcolor": "white", "gridwidth": 2, "linecolor": "white", "zerolinecolor": "white", "showbackground": true, "backgroundcolor": "#E5ECF6" }, "zaxis": { "ticks": "", "gridcolor": "white", "gridwidth": 2, "linecolor": "white", "zerolinecolor": "white", "showbackground": true, "backgroundcolor": "#E5ECF6" } }, "title": { "x": 0.05 }, "xaxis": { "ticks": "", "title": { "standoff": 15 }, "gridcolor": "white", "linecolor": "white", "automargin": true, "zerolinecolor": "white", "zerolinewidth": 2 }, "yaxis": { "ticks": "", "title": { "standoff": 15 }, "gridcolor": "white", "linecolor": "white", "automargin": true, "zerolinecolor": "white", "zerolinewidth": 2 }, "mapbox": { "style": "light" }, "ternary": { "aaxis": { "ticks": "", "gridcolor": "white", "linecolor": "white" }, "baxis": { "ticks": "", "gridcolor": "white", "linecolor": "white" }, "caxis": { "ticks": "", "gridcolor": "white", "linecolor": "white" }, "bgcolor": "#E5ECF6" }, "colorway": [ "#636efa", "#EF553B", "#00cc96", "#ab63fa", "#FFA15A", "#19d3f3", "#FF6692", "#B6E880", "#FF97FF", "#FECB52" ], "coloraxis": { "colorbar": { "ticks": "", "outlinewidth": 0 } }, "hovermode": "closest", "colorscale": { "diverging": [ [ 0, "#8e0152" ], [ 0.1, "#c51b7d" ], [ 0.2, "#de77ae" ], [ 0.3, "#f1b6da" ], [ 0.4, "#fde0ef" ], [ 0.5, "#f7f7f7" ], [ 0.6, "#e6f5d0" ], [ 0.7, "#b8e186" ], [ 0.8, "#7fbc41" ], [ 0.9, "#4d9221" ], [ 1, "#276419" ] ], "sequential": [ [ 0.0, "#0d0887" ], [ 0.1111111111111111, "#46039f" ], [ 0.2222222222222222, "#7201a8" ], [ 0.3333333333333333, "#9c179e" ], [ 0.4444444444444444, "#bd3786" ], [ 0.5555555555555556, "#d8576b" ], [ 0.6666666666666666, "#ed7953" ], [ 0.7777777777777778, "#fb9f3a" ], [ 0.8888888888888888, "#fdca26" ], [ 1.0, "#f0f921" ] ], "sequentialminus": [ [ 0.0, "#0d0887" ], [ 0.1111111111111111, "#46039f" ], [ 0.2222222222222222, "#7201a8" ], [ 0.3333333333333333, "#9c179e" ], [ 0.4444444444444444, "#bd3786" ], [ 0.5555555555555556, "#d8576b" ], [ 0.6666666666666666, "#ed7953" ], [ 0.7777777777777778, "#fb9f3a" ], [ 0.8888888888888888, "#fdca26" ], [ 1.0, "#f0f921" ] ] }, "hoverlabel": { "align": "left" }, "plot_bgcolor": "#E5ECF6", "paper_bgcolor": "white", "shapedefaults": { "line": { "color": "#2a3f5f" } }, "autotypenumbers": "strict", "annotationdefaults": { "arrowhead": 0, "arrowcolor": "#2a3f5f", "arrowwidth": 1 } } } } }, "height": 600, "width": 800, "user": { "profile_url": "https://chart-studio.plotly.com/~seminkim", "avatar_url": "https://storage.googleapis.com/plotly-prod-profiles/57.jpg", "background_url": "https://storage.googleapis.com/plotly-prod-profiles/bg-7.jpg", "bio": "", "nickname": "", "website": "", "stream_tokens": null, "feature_set_id": null, "csrf_token": null, "date_joined": "2024-04-16 16:28:54", "mapbox_access_tokens": null, "has_password": null, "username": "seminkim", "email": null, "is_active": null, "readonly": null, "is_dash_creator": null, "dash_created_count": null, "is_chart_creator": null, "charts_created_count": null } }, { "creation_time": "2024-04-16T16:41:22.666156Z", "comments": { "results": [], "count": 0 }, "parented": true, "embed_url": "https://chart-studio.plotly.com/~seminkim/21.embed", "fid": "seminkim:21", "filename": "zero=0.1,seed=6", "filetype": "plot", "img_url": "https://storage.googleapis.com/plotly-prod-images/seminkim/21/9_ETX3L7FFJDPZD8IXZD6CDQIENMLU0O.png", "image_urls": { "default": "https://storage.googleapis.com/plotly-prod-images/seminkim/21/2_KQ8AM2TI5QE1D2AR3HCQHLEPX3B63D.png", "block-thumb": "https://storage.googleapis.com/plotly-prod-images/seminkim/21/8_I1O1GMSRHUC5K87PS9B6EF78K8SCEX.png", "list-thumb": "https://storage.googleapis.com/plotly-prod-images/seminkim/21/9_ETX3L7FFJDPZD8IXZD6CDQIENMLU0O.png" }, "api_urls": { "files": "https://api.plotly.com/v2/files/seminkim:21", "plots": "https://api.plotly.com/v2/plots/seminkim:21", "parent": "https://api.plotly.com/v2/folders/home?user=seminkim" }, "owner": "seminkim", "parent": -1, "preview": "", "referencers": [], "references": [], "title": "", "views": 1, "web_url": "https://chart-studio.plotly.com/~seminkim/21/", "world_readable": true, "date_modified": "2024-04-16T16:41:22.675Z", "stars": { "results": [], "count": 0 }, "collaborators": { "results": [], "count": 0 }, "subfolder_count": null, "refresh_interval": null, "organize_view_url": "https://chart-studio.plotly.com/~seminkim/21/", "current_user_permission": "read", "is_theme": null, "is_template": null, "autosize": true, "caption": "", "figure": { "data": [ { "mode": "markers", "type": "scatter3d", "xsrc": "seminkim:20:6e87ab", "ysrc": "seminkim:20:fbbb59", "zsrc": "seminkim:20:ae4eb9", "marker": { "size": 5, "opacity": 0.5, "colorsrc": "seminkim:20:d907c9" } } ], "layout": { "scene": { "aspectmode": "data" }, "width": 800, "height": 600, "template": { "data": { "bar": [ { "type": "bar", "marker": { "line": { "color": "#E5ECF6", "width": 0.5 }, "pattern": { "size": 10, "fillmode": "overlay", "solidity": 0.2 } }, "error_x": { "color": "#2a3f5f" }, "error_y": { "color": "#2a3f5f" } } ], "pie": [ { "type": "pie", "automargin": true } ], "table": [ { "type": "table", "cells": { "fill": { "color": "#EBF0F8" }, "line": { "color": "white" } }, "header": { "fill": { "color": "#C8D4E3" }, "line": { "color": "white" } } } ], "carpet": [ { "type": "carpet", "aaxis": { "gridcolor": "white", "linecolor": "white", "endlinecolor": "#2a3f5f", "minorgridcolor": "white", "startlinecolor": "#2a3f5f" }, "baxis": { "gridcolor": "white", "linecolor": "white", "endlinecolor": "#2a3f5f", "minorgridcolor": "white", "startlinecolor": "#2a3f5f" } } ], "mesh3d": [ { "type": "mesh3d", "colorbar": { "ticks": "", "outlinewidth": 0 } } ], "contour": [ { "type": "contour", "colorbar": { "ticks": "", "outlinewidth": 0 }, "colorscale": [ [ 0.0, "#0d0887" ], [ 0.1111111111111111, "#46039f" ], [ 0.2222222222222222, "#7201a8" ], [ 0.3333333333333333, "#9c179e" ], [ 0.4444444444444444, "#bd3786" ], [ 0.5555555555555556, "#d8576b" ], [ 0.6666666666666666, "#ed7953" ], [ 0.7777777777777778, "#fb9f3a" ], [ 0.8888888888888888, "#fdca26" ], [ 1.0, "#f0f921" ] ] } ], "heatmap": [ { "type": "heatmap", "colorbar": { "ticks": "", "outlinewidth": 0 }, "colorscale": [ [ 0.0, "#0d0887" ], [ 0.1111111111111111, "#46039f" ], [ 0.2222222222222222, "#7201a8" ], [ 0.3333333333333333, "#9c179e" ], [ 0.4444444444444444, "#bd3786" ], [ 0.5555555555555556, "#d8576b" ], [ 0.6666666666666666, "#ed7953" ], [ 0.7777777777777778, "#fb9f3a" ], [ 0.8888888888888888, "#fdca26" ], [ 1.0, "#f0f921" ] ] } ], "scatter": [ { "type": "scatter", "fillpattern": { "size": 10, "fillmode": "overlay", "solidity": 0.2 } } ], "surface": [ { "type": "surface", "colorbar": { "ticks": "", "outlinewidth": 0 }, "colorscale": [ [ 0.0, "#0d0887" ], [ 0.1111111111111111, "#46039f" ], [ 0.2222222222222222, "#7201a8" ], [ 0.3333333333333333, "#9c179e" ], [ 0.4444444444444444, "#bd3786" ], [ 0.5555555555555556, "#d8576b" ], [ 0.6666666666666666, "#ed7953" ], [ 0.7777777777777778, "#fb9f3a" ], [ 0.8888888888888888, "#fdca26" ], [ 1.0, "#f0f921" ] ] } ], "barpolar": [ { "type": "barpolar", "marker": { "line": { "color": "#E5ECF6", "width": 0.5 }, "pattern": { "size": 10, "fillmode": "overlay", "solidity": 0.2 } } } ], "heatmapgl": [ { "type": "heatmapgl", "colorbar": { "ticks": "", "outlinewidth": 0 }, "colorscale": [ [ 0.0, "#0d0887" ], [ 0.1111111111111111, "#46039f" ], [ 0.2222222222222222, "#7201a8" ], [ 0.3333333333333333, "#9c179e" ], [ 0.4444444444444444, "#bd3786" ], [ 0.5555555555555556, "#d8576b" ], [ 0.6666666666666666, "#ed7953" ], [ 0.7777777777777778, "#fb9f3a" ], [ 0.8888888888888888, "#fdca26" ], [ 1.0, "#f0f921" ] ] } ], "histogram": [ { "type": "histogram", "marker": { "pattern": { "size": 10, "fillmode": "overlay", "solidity": 0.2 } } } ], "parcoords": [ { "line": { "colorbar": { "ticks": "", "outlinewidth": 0 } }, "type": "parcoords" } ], "scatter3d": [ { "line": { "colorbar": { "ticks": "", "outlinewidth": 0 } }, "type": "scatter3d", "marker": { "colorbar": { "ticks": "", "outlinewidth": 0 } } } ], "scattergl": [ { "type": "scattergl", "marker": { "colorbar": { "ticks": "", "outlinewidth": 0 } } } ], "choropleth": [ { "type": "choropleth", "colorbar": { "ticks": "", "outlinewidth": 0 } } ], "scattergeo": [ { "type": "scattergeo", "marker": { "colorbar": { "ticks": "", "outlinewidth": 0 } } } ], "histogram2d": [ { "type": "histogram2d", "colorbar": { "ticks": "", "outlinewidth": 0 }, "colorscale": [ [ 0.0, "#0d0887" ], [ 0.1111111111111111, "#46039f" ], [ 0.2222222222222222, "#7201a8" ], [ 0.3333333333333333, "#9c179e" ], [ 0.4444444444444444, "#bd3786" ], [ 0.5555555555555556, "#d8576b" ], [ 0.6666666666666666, "#ed7953" ], [ 0.7777777777777778, "#fb9f3a" ], [ 0.8888888888888888, "#fdca26" ], [ 1.0, "#f0f921" ] ] } ], "scatterpolar": [ { "type": "scatterpolar", "marker": { "colorbar": { "ticks": "", "outlinewidth": 0 } } } ], "contourcarpet": [ { "type": "contourcarpet", "colorbar": { "ticks": "", "outlinewidth": 0 } } ], "scattercarpet": [ { "type": "scattercarpet", "marker": { "colorbar": { "ticks": "", "outlinewidth": 0 } } } ], "scattermapbox": [ { "type": "scattermapbox", "marker": { "colorbar": { "ticks": "", "outlinewidth": 0 } } } ], "scatterpolargl": [ { "type": "scatterpolargl", "marker": { "colorbar": { "ticks": "", "outlinewidth": 0 } } } ], "scatterternary": [ { "type": "scatterternary", "marker": { "colorbar": { "ticks": "", "outlinewidth": 0 } } } ], "histogram2dcontour": [ { "type": "histogram2dcontour", "colorbar": { "ticks": "", "outlinewidth": 0 }, "colorscale": [ [ 0.0, "#0d0887" ], [ 0.1111111111111111, "#46039f" ], [ 0.2222222222222222, "#7201a8" ], [ 0.3333333333333333, "#9c179e" ], [ 0.4444444444444444, "#bd3786" ], [ 0.5555555555555556, "#d8576b" ], [ 0.6666666666666666, "#ed7953" ], [ 0.7777777777777778, "#fb9f3a" ], [ 0.8888888888888888, "#fdca26" ], [ 1.0, "#f0f921" ] ] } ] }, "layout": { "geo": { "bgcolor": "white", "showland": true, "lakecolor": "white", "landcolor": "#E5ECF6", "showlakes": true, "subunitcolor": "white" }, "font": { "color": "#2a3f5f" }, "polar": { "bgcolor": "#E5ECF6", "radialaxis": { "ticks": "", "gridcolor": "white", "linecolor": "white" }, "angularaxis": { "ticks": "", "gridcolor": "white", "linecolor": "white" } }, "scene": { "xaxis": { "ticks": "", "gridcolor": "white", "gridwidth": 2, "linecolor": "white", "zerolinecolor": "white", "showbackground": true, "backgroundcolor": "#E5ECF6" }, "yaxis": { "ticks": "", "gridcolor": "white", "gridwidth": 2, "linecolor": "white", "zerolinecolor": "white", "showbackground": true, "backgroundcolor": "#E5ECF6" }, "zaxis": { "ticks": "", "gridcolor": "white", "gridwidth": 2, "linecolor": "white", "zerolinecolor": "white", "showbackground": true, "backgroundcolor": "#E5ECF6" } }, "title": { "x": 0.05 }, "xaxis": { "ticks": "", "title": { "standoff": 15 }, "gridcolor": "white", "linecolor": "white", "automargin": true, "zerolinecolor": "white", "zerolinewidth": 2 }, "yaxis": { "ticks": "", "title": { "standoff": 15 }, "gridcolor": "white", "linecolor": "white", "automargin": true, "zerolinecolor": "white", "zerolinewidth": 2 }, "mapbox": { "style": "light" }, "ternary": { "aaxis": { "ticks": "", "gridcolor": "white", "linecolor": "white" }, "baxis": { "ticks": "", "gridcolor": "white", "linecolor": "white" }, "caxis": { "ticks": "", "gridcolor": "white", "linecolor": "white" }, "bgcolor": "#E5ECF6" }, "colorway": [ "#636efa", "#EF553B", "#00cc96", "#ab63fa", "#FFA15A", "#19d3f3", "#FF6692", "#B6E880", "#FF97FF", "#FECB52" ], "coloraxis": { "colorbar": { "ticks": "", "outlinewidth": 0 } }, "hovermode": "closest", "colorscale": { "diverging": [ [ 0, "#8e0152" ], [ 0.1, "#c51b7d" ], [ 0.2, "#de77ae" ], [ 0.3, "#f1b6da" ], [ 0.4, "#fde0ef" ], [ 0.5, "#f7f7f7" ], [ 0.6, "#e6f5d0" ], [ 0.7, "#b8e186" ], [ 0.8, "#7fbc41" ], [ 0.9, "#4d9221" ], [ 1, "#276419" ] ], "sequential": [ [ 0.0, "#0d0887" ], [ 0.1111111111111111, "#46039f" ], [ 0.2222222222222222, "#7201a8" ], [ 0.3333333333333333, "#9c179e" ], [ 0.4444444444444444, "#bd3786" ], [ 0.5555555555555556, "#d8576b" ], [ 0.6666666666666666, "#ed7953" ], [ 0.7777777777777778, "#fb9f3a" ], [ 0.8888888888888888, "#fdca26" ], [ 1.0, "#f0f921" ] ], "sequentialminus": [ [ 0.0, "#0d0887" ], [ 0.1111111111111111, "#46039f" ], [ 0.2222222222222222, "#7201a8" ], [ 0.3333333333333333, "#9c179e" ], [ 0.4444444444444444, "#bd3786" ], [ 0.5555555555555556, "#d8576b" ], [ 0.6666666666666666, "#ed7953" ], [ 0.7777777777777778, "#fb9f3a" ], [ 0.8888888888888888, "#fdca26" ], [ 1.0, "#f0f921" ] ] }, "hoverlabel": { "align": "left" }, "plot_bgcolor": "#E5ECF6", "paper_bgcolor": "white", "shapedefaults": { "line": { "color": "#2a3f5f" } }, "autotypenumbers": "strict", "annotationdefaults": { "arrowhead": 0, "arrowcolor": "#2a3f5f", "arrowwidth": 1 } } } } }, "height": 600, "width": 800, "user": { "profile_url": "https://chart-studio.plotly.com/~seminkim", "avatar_url": "https://storage.googleapis.com/plotly-prod-profiles/57.jpg", "background_url": "https://storage.googleapis.com/plotly-prod-profiles/bg-7.jpg", "bio": "", "nickname": "", "website": "", "stream_tokens": null, "feature_set_id": null, "csrf_token": null, "date_joined": "2024-04-16 16:28:54", "mapbox_access_tokens": null, "has_password": null, "username": "seminkim", "email": null, "is_active": null, "readonly": null, "is_dash_creator": null, "dash_created_count": null, "is_chart_creator": null, "charts_created_count": null } }, { "creation_time": "2024-04-16T16:41:18.751088Z", "comments": { "results": [], "count": 0 }, "parented": true, "embed_url": "https://chart-studio.plotly.com/~seminkim/19.embed", "fid": "seminkim:19", "filename": "zero=0.1,seed=5", "filetype": "plot", "img_url": "https://storage.googleapis.com/plotly-prod-images/seminkim/19/9_QLQ3AJVK1EOVIKNZ7J15AGK52SXJFW.png", "image_urls": { "default": "https://storage.googleapis.com/plotly-prod-images/seminkim/19/2_BQBLF7TB3P5OCQJCY8N2WPGDKJJBWA.png", "block-thumb": "https://storage.googleapis.com/plotly-prod-images/seminkim/19/8_BTXILEZYX41K5LALMOSMZDNCIMTHNH.png", "list-thumb": "https://storage.googleapis.com/plotly-prod-images/seminkim/19/9_QLQ3AJVK1EOVIKNZ7J15AGK52SXJFW.png" }, "api_urls": { "files": "https://api.plotly.com/v2/files/seminkim:19", "plots": "https://api.plotly.com/v2/plots/seminkim:19", "parent": "https://api.plotly.com/v2/folders/home?user=seminkim" }, "owner": "seminkim", "parent": -1, "preview": "", "referencers": [], "references": [], "title": "", "views": 1, "web_url": "https://chart-studio.plotly.com/~seminkim/19/", "world_readable": true, "date_modified": "2024-04-16T16:41:18.762Z", "stars": { "results": [], "count": 0 }, "collaborators": { "results": [], "count": 0 }, "subfolder_count": null, "refresh_interval": null, "organize_view_url": "https://chart-studio.plotly.com/~seminkim/19/", "current_user_permission": "read", "is_theme": null, "is_template": null, "autosize": true, "caption": "", "figure": { "data": [ { "mode": "markers", "type": "scatter3d", "xsrc": "seminkim:18:671540", "ysrc": "seminkim:18:78805c", "zsrc": "seminkim:18:e76b23", "marker": { "size": 5, "opacity": 0.5, "colorsrc": "seminkim:18:4ff6af" } } ], "layout": { "scene": { "aspectmode": "data" }, "width": 800, "height": 600, "template": { "data": { "bar": [ { "type": "bar", "marker": { "line": { "color": "#E5ECF6", "width": 0.5 }, "pattern": { "size": 10, "fillmode": "overlay", "solidity": 0.2 } }, "error_x": { "color": "#2a3f5f" }, "error_y": { "color": "#2a3f5f" } } ], "pie": [ { "type": "pie", "automargin": true } ], "table": [ { "type": "table", "cells": { "fill": { "color": "#EBF0F8" }, "line": { "color": "white" } }, "header": { "fill": { "color": "#C8D4E3" }, "line": { "color": "white" } } } ], "carpet": [ { "type": "carpet", "aaxis": { "gridcolor": "white", "linecolor": "white", "endlinecolor": "#2a3f5f", "minorgridcolor": "white", "startlinecolor": "#2a3f5f" }, "baxis": { "gridcolor": "white", "linecolor": "white", "endlinecolor": "#2a3f5f", "minorgridcolor": "white", "startlinecolor": "#2a3f5f" } } ], "mesh3d": [ { "type": "mesh3d", "colorbar": { "ticks": "", "outlinewidth": 0 } } ], "contour": [ { "type": "contour", "colorbar": { "ticks": "", "outlinewidth": 0 }, "colorscale": [ [ 0.0, "#0d0887" ], [ 0.1111111111111111, "#46039f" ], [ 0.2222222222222222, "#7201a8" ], [ 0.3333333333333333, "#9c179e" ], [ 0.4444444444444444, "#bd3786" ], [ 0.5555555555555556, "#d8576b" ], [ 0.6666666666666666, "#ed7953" ], [ 0.7777777777777778, "#fb9f3a" ], [ 0.8888888888888888, "#fdca26" ], [ 1.0, "#f0f921" ] ] } ], "heatmap": [ { "type": "heatmap", "colorbar": { "ticks": "", "outlinewidth": 0 }, "colorscale": [ [ 0.0, "#0d0887" ], [ 0.1111111111111111, "#46039f" ], [ 0.2222222222222222, "#7201a8" ], [ 0.3333333333333333, "#9c179e" ], [ 0.4444444444444444, "#bd3786" ], [ 0.5555555555555556, "#d8576b" ], [ 0.6666666666666666, "#ed7953" ], [ 0.7777777777777778, "#fb9f3a" ], [ 0.8888888888888888, "#fdca26" ], [ 1.0, "#f0f921" ] ] } ], "scatter": [ { "type": "scatter", "fillpattern": { "size": 10, "fillmode": "overlay", "solidity": 0.2 } } ], "surface": [ { "type": "surface", "colorbar": { "ticks": "", "outlinewidth": 0 }, "colorscale": [ [ 0.0, "#0d0887" ], [ 0.1111111111111111, "#46039f" ], [ 0.2222222222222222, "#7201a8" ], [ 0.3333333333333333, "#9c179e" ], [ 0.4444444444444444, "#bd3786" ], [ 0.5555555555555556, "#d8576b" ], [ 0.6666666666666666, "#ed7953" ], [ 0.7777777777777778, "#fb9f3a" ], [ 0.8888888888888888, "#fdca26" ], [ 1.0, "#f0f921" ] ] } ], "barpolar": [ { "type": "barpolar", "marker": { "line": { "color": "#E5ECF6", "width": 0.5 }, "pattern": { "size": 10, "fillmode": "overlay", "solidity": 0.2 } } } ], "heatmapgl": [ { "type": "heatmapgl", "colorbar": { "ticks": "", "outlinewidth": 0 }, "colorscale": [ [ 0.0, "#0d0887" ], [ 0.1111111111111111, "#46039f" ], [ 0.2222222222222222, "#7201a8" ], [ 0.3333333333333333, "#9c179e" ], [ 0.4444444444444444, "#bd3786" ], [ 0.5555555555555556, "#d8576b" ], [ 0.6666666666666666, "#ed7953" ], [ 0.7777777777777778, "#fb9f3a" ], [ 0.8888888888888888, "#fdca26" ], [ 1.0, "#f0f921" ] ] } ], "histogram": [ { "type": "histogram", "marker": { "pattern": { "size": 10, "fillmode": "overlay", "solidity": 0.2 } } } ], "parcoords": [ { "line": { "colorbar": { "ticks": "", "outlinewidth": 0 } }, "type": "parcoords" } ], "scatter3d": [ { "line": { "colorbar": { "ticks": "", "outlinewidth": 0 } }, "type": "scatter3d", "marker": { "colorbar": { "ticks": "", "outlinewidth": 0 } } } ], "scattergl": [ { "type": "scattergl", "marker": { "colorbar": { "ticks": "", "outlinewidth": 0 } } } ], "choropleth": [ { "type": "choropleth", "colorbar": { "ticks": "", "outlinewidth": 0 } } ], "scattergeo": [ { "type": "scattergeo", "marker": { "colorbar": { "ticks": "", "outlinewidth": 0 } } } ], "histogram2d": [ { "type": "histogram2d", "colorbar": { "ticks": "", "outlinewidth": 0 }, "colorscale": [ [ 0.0, "#0d0887" ], [ 0.1111111111111111, "#46039f" ], [ 0.2222222222222222, "#7201a8" ], [ 0.3333333333333333, "#9c179e" ], [ 0.4444444444444444, "#bd3786" ], [ 0.5555555555555556, "#d8576b" ], [ 0.6666666666666666, "#ed7953" ], [ 0.7777777777777778, "#fb9f3a" ], [ 0.8888888888888888, "#fdca26" ], [ 1.0, "#f0f921" ] ] } ], "scatterpolar": [ { "type": "scatterpolar", "marker": { "colorbar": { "ticks": "", "outlinewidth": 0 } } } ], "contourcarpet": [ { "type": "contourcarpet", "colorbar": { "ticks": "", "outlinewidth": 0 } } ], "scattercarpet": [ { "type": "scattercarpet", "marker": { "colorbar": { "ticks": "", "outlinewidth": 0 } } } ], "scattermapbox": [ { "type": "scattermapbox", "marker": { "colorbar": { "ticks": "", "outlinewidth": 0 } } } ], "scatterpolargl": [ { "type": "scatterpolargl", "marker": { "colorbar": { "ticks": "", "outlinewidth": 0 } } } ], "scatterternary": [ { "type": "scatterternary", "marker": { "colorbar": { "ticks": "", "outlinewidth": 0 } } } ], "histogram2dcontour": [ { "type": "histogram2dcontour", "colorbar": { "ticks": "", "outlinewidth": 0 }, "colorscale": [ [ 0.0, "#0d0887" ], [ 0.1111111111111111, "#46039f" ], [ 0.2222222222222222, "#7201a8" ], [ 0.3333333333333333, "#9c179e" ], [ 0.4444444444444444, "#bd3786" ], [ 0.5555555555555556, "#d8576b" ], [ 0.6666666666666666, "#ed7953" ], [ 0.7777777777777778, "#fb9f3a" ], [ 0.8888888888888888, "#fdca26" ], [ 1.0, "#f0f921" ] ] } ] }, "layout": { "geo": { "bgcolor": "white", "showland": true, "lakecolor": "white", "landcolor": "#E5ECF6", "showlakes": true, "subunitcolor": "white" }, "font": { "color": "#2a3f5f" }, "polar": { "bgcolor": "#E5ECF6", "radialaxis": { "ticks": "", "gridcolor": "white", "linecolor": "white" }, "angularaxis": { "ticks": "", "gridcolor": "white", "linecolor": "white" } }, "scene": { "xaxis": { "ticks": "", "gridcolor": "white", "gridwidth": 2, "linecolor": "white", "zerolinecolor": "white", "showbackground": true, "backgroundcolor": "#E5ECF6" }, "yaxis": { "ticks": "", "gridcolor": "white", "gridwidth": 2, "linecolor": "white", "zerolinecolor": "white", "showbackground": true, "backgroundcolor": "#E5ECF6" }, "zaxis": { "ticks": "", "gridcolor": "white", "gridwidth": 2, "linecolor": "white", "zerolinecolor": "white", "showbackground": true, "backgroundcolor": "#E5ECF6" } }, "title": { "x": 0.05 }, "xaxis": { "ticks": "", "title": { "standoff": 15 }, "gridcolor": "white", "linecolor": "white", "automargin": true, "zerolinecolor": "white", "zerolinewidth": 2 }, "yaxis": { "ticks": "", "title": { "standoff": 15 }, "gridcolor": "white", "linecolor": "white", "automargin": true, "zerolinecolor": "white", "zerolinewidth": 2 }, "mapbox": { "style": "light" }, "ternary": { "aaxis": { "ticks": "", "gridcolor": "white", "linecolor": "white" }, "baxis": { "ticks": "", "gridcolor": "white", "linecolor": "white" }, "caxis": { "ticks": "", "gridcolor": "white", "linecolor": "white" }, "bgcolor": "#E5ECF6" }, "colorway": [ "#636efa", "#EF553B", "#00cc96", "#ab63fa", "#FFA15A", "#19d3f3", "#FF6692", "#B6E880", "#FF97FF", "#FECB52" ], "coloraxis": { "colorbar": { "ticks": "", "outlinewidth": 0 } }, "hovermode": "closest", "colorscale": { "diverging": [ [ 0, "#8e0152" ], [ 0.1, "#c51b7d" ], [ 0.2, "#de77ae" ], [ 0.3, "#f1b6da" ], [ 0.4, "#fde0ef" ], [ 0.5, "#f7f7f7" ], [ 0.6, "#e6f5d0" ], [ 0.7, "#b8e186" ], [ 0.8, "#7fbc41" ], [ 0.9, "#4d9221" ], [ 1, "#276419" ] ], "sequential": [ [ 0.0, "#0d0887" ], [ 0.1111111111111111, "#46039f" ], [ 0.2222222222222222, "#7201a8" ], [ 0.3333333333333333, "#9c179e" ], [ 0.4444444444444444, "#bd3786" ], [ 0.5555555555555556, "#d8576b" ], [ 0.6666666666666666, "#ed7953" ], [ 0.7777777777777778, "#fb9f3a" ], [ 0.8888888888888888, "#fdca26" ], [ 1.0, "#f0f921" ] ], "sequentialminus": [ [ 0.0, "#0d0887" ], [ 0.1111111111111111, "#46039f" ], [ 0.2222222222222222, "#7201a8" ], [ 0.3333333333333333, "#9c179e" ], [ 0.4444444444444444, "#bd3786" ], [ 0.5555555555555556, "#d8576b" ], [ 0.6666666666666666, "#ed7953" ], [ 0.7777777777777778, "#fb9f3a" ], [ 0.8888888888888888, "#fdca26" ], [ 1.0, "#f0f921" ] ] }, "hoverlabel": { "align": "left" }, "plot_bgcolor": "#E5ECF6", "paper_bgcolor": "white", "shapedefaults": { "line": { "color": "#2a3f5f" } }, "autotypenumbers": "strict", "annotationdefaults": { "arrowhead": 0, "arrowcolor": "#2a3f5f", "arrowwidth": 1 } } } } }, "height": 600, "width": 800, "user": { "profile_url": "https://chart-studio.plotly.com/~seminkim", "avatar_url": "https://storage.googleapis.com/plotly-prod-profiles/57.jpg", "background_url": "https://storage.googleapis.com/plotly-prod-profiles/bg-7.jpg", "bio": "", "nickname": "", "website": "", "stream_tokens": null, "feature_set_id": null, "csrf_token": null, "date_joined": "2024-04-16 16:28:54", "mapbox_access_tokens": null, "has_password": null, "username": "seminkim", "email": null, "is_active": null, "readonly": null, "is_dash_creator": null, "dash_created_count": null, "is_chart_creator": null, "charts_created_count": null } } ] }
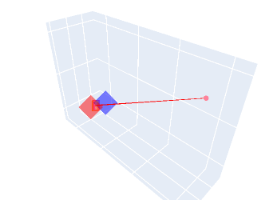
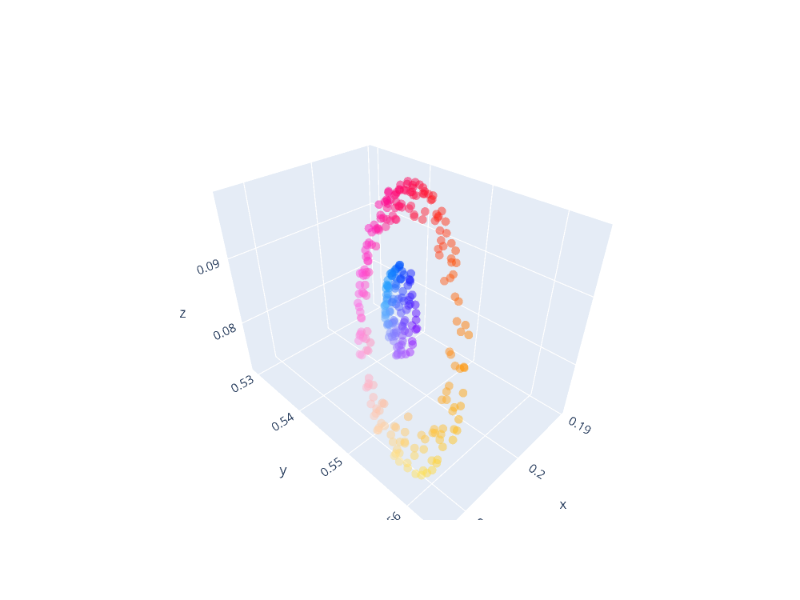