Plots List
Plots
This endpoint handles manipulation of Plotly plot files.
Reference
Authorization
Any user with or without a Plotly account may view public plots. For private plots, see authentication.
Actions
list
Listing all public plots can be done via a GET request to this endpoint.
By default, plots will be listed in order of date created. The order_by
query parameter is accepted at this endpoint. Currently, only ordering by
views is supported. It is possible to filter the plots by quality
with min_quality or max_quality as query parameter.
Example:
// GET https://api.plotly.com/v2/plots/ ---> 200

// GET https://api.plotly.com/v2/plots/?order_by=-views ---> 200

// GET https://api.plotly.com/v2/plots/?min_quality=5 ---> 200

// GET https://api.plotly.com/v2/plots/?max_quality=5 ---> 200
feed
Listing all handpicked feed plots can be done via a GET request to this endpoint. By default, plots will be listed in a random order.
Example:
// GET https://api.plotly.com/v2/plots/feed ---> 200
create
You can create new plot resources here. The only required field is 'figure'. Currently, the figure is restricted to only contain references to grid data. That is, this will fail if raw data arrays are passed in. To create and manipulate underlying grids for plots, see the grids endpoint.
Example:
// This fails because a figure field is required.
// POST https://api.plotly.com/v2/plots ---> 400 Bad Request
{}

// This fails because the figure has raw data
//POST https://api.plotly.com/v2/plots ---> 400 Bad Request
{
    "figure": {"data": [{"y": ['this', 'is', 'raw', 'data']}]}
}

// This succeeds because the figure has src keys, not raw data.
//POST https://api.plotly.com/v2/plots ---> 200 OK
{
    "figure": {"data": [{"ysrc": "sven:88:u8nd62"}]}
}
When creating a grid, you can optionally specify a source_fid to specify where a plot has come from:
- source_fid: the fid of a plot that was copied (and presumably edited) to produce this one
detail
There is a lot of meta information stored about plot files including filename, title, share_url, and content_url to name a few.
This information can only be reached with a GET to this endpoint.
Example:
// GET https://api.plotly.com/v2/plots/iheartgraphs:90
content
The contents of a plot can be downloaded via the content resource. The plot
content contains referenced grid/column data by default. If you wish to
return the raw grid/column data, the inline_data=true query must be included
in the request url. The Content-Type header will be appropriately set for the
response body.
Alternatively, you can set ?map_data=unreadable to append a mapping of
sources to data that belongs to grids which are unreadable for the
requestor. This is useful when you have read access to another users plot,
but that plot contains grid references which you don't have access to.
Examples:
// Returns referenced grid/column data
// GET https://api.plotly.com/v2/plots/iheartgraphs:90/content ---> 200 OK

// Returns full grid/column data
// GET https://api.plotly.com/v2/plots/iheartgraphs:90/content?inline_data=true ---> 200 OK

// Returns full grid/column data when requestor doesn't have permission
// to read the referenced grid.
// GET https://api.plotly.com/v2/plots/iheartgraphs:90/content?map_data=unreadable ---> 200 OK
GET /v2/plots?cursor=cj0xJnA9MjAyNC0wNC0xNisxNyUzQTAyJTNBNDkuMzEyNzIxJTJCMDAlM0EwMA%3D%3D&format=api
{ "next": "https://api.plotly.com/v2/plots?cursor=cD0yMDI0LTA0LTE2KzE3JTNBMDQlM0EwNy42NjY3MjklMkIwMCUzQTAw&format=api", "previous": "https://api.plotly.com/v2/plots?cursor=cj0xJnA9MjAyNC0wNC0xNisxOCUzQTUxJTNBMTUuMTA1Mzg2JTJCMDAlM0EwMA%3D%3D&format=api", "results": [ { "creation_time": "2024-04-16T18:51:15.105386Z", "comments": { "results": [], "count": 0 }, "parented": true, "embed_url": "https://chart-studio.plotly.com/~rschap/207.embed", "fid": "rschap:207", "filename": "RS 1 Flr Spec", "filetype": "plot", "img_url": "https://storage.googleapis.com/plotly-prod-images/rschap/207/9_6ZYM82WUCI6RCL7ZNBP17RZVHQ81ML.png", "image_urls": { "default": "https://storage.googleapis.com/plotly-prod-images/rschap/207/2_RGLUG7Q37N5V9NPWP6T67AW7Q68XN0.png", "block-thumb": "https://storage.googleapis.com/plotly-prod-images/rschap/207/8_N4ZLNLEWC584XKLSZYJ3QICC04JIH4.png", "list-thumb": "https://storage.googleapis.com/plotly-prod-images/rschap/207/9_6ZYM82WUCI6RCL7ZNBP17RZVHQ81ML.png" }, "api_urls": { "files": "https://api.plotly.com/v2/files/rschap:207", "plots": "https://api.plotly.com/v2/plots/rschap:207", "parent": "https://api.plotly.com/v2/folders/home?user=rschap" }, "owner": "rschap", "parent": -1, "preview": "", "referencers": [], "references": [], "title": "", "views": 1, "web_url": "https://chart-studio.plotly.com/~rschap/207/", "world_readable": true, "date_modified": "2024-04-16T18:51:15.116Z", "stars": { "results": [], "count": 0 }, "collaborators": { "results": [], "count": 0 }, "subfolder_count": null, "refresh_interval": null, "organize_view_url": "https://chart-studio.plotly.com/~rschap/207/", "current_user_permission": "read", "is_theme": null, "is_template": false, "autosize": true, "caption": "", "figure": { "data": [ { "meta": { "columnNames": { "x": "FLMS14896_1:101", "y": "B" } }, "mode": "lines", "name": "RS 1", "type": "scatter", "xsrc": "rschap:206:5c8456", "ysrc": "rschap:206:a0bde3" } ], "frames": [], "layout": { "title": { "text": "Fluorescence Spectrum RS 1" }, "xaxis": { "type": "linear", "range": [ 430, 600 ], "title": { "text": "Wavelength (nm)" }, "autorange": false }, "yaxis": { "type": "linear", "range": [ -3683.384444444445, 15000 ], "title": { "text": "Intensity " }, "autorange": false }, "autosize": true, "template": { "data": { "bar": [ { "type": "bar", "marker": { "colorbar": { "ticks": "", "outlinewidth": 0 } } } ], "table": [ { "type": "table", "cells": { "fill": { "color": "#EBF0F8" }, "line": { "color": "white" } }, "header": { "fill": { "color": "#C8D4E3" }, "line": { "color": "white" } } } ], "carpet": [ { "type": "carpet", "aaxis": { "gridcolor": "#C8D4E3", "linecolor": "#C8D4E3", "endlinecolor": "#2a3f5f", "minorgridcolor": "#C8D4E3", "startlinecolor": "#2a3f5f" }, "baxis": { "gridcolor": "#C8D4E3", "linecolor": "#C8D4E3", "endlinecolor": "#2a3f5f", "minorgridcolor": "#C8D4E3", "startlinecolor": "#2a3f5f" } } ], "mesh3d": [ { "type": "mesh3d", "colorbar": { "ticks": "", "outlinewidth": 0 } } ], "contour": [ { "type": "contour", "colorbar": { "ticks": "", "outlinewidth": 0 }, "autocolorscale": true } ], "heatmap": [ { "type": "heatmap", "colorbar": { "ticks": "", "outlinewidth": 0 }, "autocolorscale": true } ], "scatter": [ { "type": "scatter", "marker": { "colorbar": { "ticks": "", "outlinewidth": 0 } } } ], "surface": [ { "type": "surface", "colorbar": { "ticks": "", "outlinewidth": 0 } } ], "heatmapgl": [ { "type": "heatmapgl", "colorbar": { "ticks": "", "outlinewidth": 0 } } ], "histogram": [ { "type": "histogram", "marker": { "colorbar": { "ticks": "", "outlinewidth": 0 } } } ], "parcoords": [ { "line": { "colorbar": { "ticks": "", "outlinewidth": 0 } }, "type": "parcoords" } ], "scatter3d": [ { "type": "scatter3d", "marker": { "colorbar": { "ticks": "", "outlinewidth": 0 } } } ], "scattergl": [ { "type": "scattergl", "marker": { "colorbar": { "ticks": "", "outlinewidth": 0 } } } ], "choropleth": [ { "type": "choropleth", "colorbar": { "ticks": "", "outlinewidth": 0 } } ], "scattergeo": [ { "type": "scattergeo", "marker": { "colorbar": { "ticks": "", "outlinewidth": 0 } } } ], "histogram2d": [ { "type": "histogram2d", "colorbar": { "ticks": "", "outlinewidth": 0 }, "autocolorscale": true } ], "scatterpolar": [ { "type": "scatterpolar", "marker": { "colorbar": { "ticks": "", "outlinewidth": 0 } } } ], "contourcarpet": [ { "type": "contourcarpet", "colorbar": { "ticks": "", "outlinewidth": 0 } } ], "scattercarpet": [ { "type": "scattercarpet", "marker": { "colorbar": { "ticks": "", "outlinewidth": 0 } } } ], "scattermapbox": [ { "type": "scattermapbox", "marker": { "colorbar": { "ticks": "", "outlinewidth": 0 } } } ], "scatterpolargl": [ { "type": "scatterpolargl", "marker": { "colorbar": { "ticks": "", "outlinewidth": 0 } } } ], "scatterternary": [ { "type": "scatterternary", "marker": { "colorbar": { "ticks": "", "outlinewidth": 0 } } } ], "histogram2dcontour": [ { "type": "histogram2dcontour", "colorbar": { "ticks": "", "outlinewidth": 0 }, "autocolorscale": true } ] }, "layout": { "geo": { "bgcolor": "white", "showland": true, "lakecolor": "white", "landcolor": "white", "showlakes": true, "subunitcolor": "#C8D4E3" }, "font": { "color": "#2a3f5f" }, "polar": { "bgcolor": "white", "radialaxis": { "ticks": "", "gridcolor": "#EBF0F8", "linecolor": "#EBF0F8" }, "angularaxis": { "ticks": "", "gridcolor": "#EBF0F8", "linecolor": "#EBF0F8" } }, "scene": { "xaxis": { "ticks": "", "gridcolor": "#DFE8F3", "gridwidth": 2, "linecolor": "#EBF0F8", "zerolinecolor": "#EBF0F8", "showbackground": true, "backgroundcolor": "white" }, "yaxis": { "ticks": "", "gridcolor": "#DFE8F3", "gridwidth": 2, "linecolor": "#EBF0F8", "zerolinecolor": "#EBF0F8", "showbackground": true, "backgroundcolor": "white" }, "zaxis": { "ticks": "", "gridcolor": "#DFE8F3", "gridwidth": 2, "linecolor": "#EBF0F8", "zerolinecolor": "#EBF0F8", "showbackground": true, "backgroundcolor": "white" } }, "title": { "x": 0.05 }, "xaxis": { "ticks": "", "gridcolor": "#EBF0F8", "linecolor": "#EBF0F8", "automargin": true, "zerolinecolor": "#EBF0F8", "zerolinewidth": 2 }, "yaxis": { "ticks": "", "gridcolor": "#EBF0F8", "linecolor": "#EBF0F8", "automargin": true, "zerolinecolor": "#EBF0F8", "zerolinewidth": 2 }, "ternary": { "aaxis": { "ticks": "", "gridcolor": "#DFE8F3", "linecolor": "#A2B1C6" }, "baxis": { "ticks": "", "gridcolor": "#DFE8F3", "linecolor": "#A2B1C6" }, "caxis": { "ticks": "", "gridcolor": "#DFE8F3", "linecolor": "#A2B1C6" }, "bgcolor": "white" }, "colorway": [ "#636efa", "#EF553B", "#00cc96", "#ab63fa", "#19d3f3", "#e763fa", "#fecb52", "#ffa15a", "#ff6692", "#b6e880" ], "hovermode": "closest", "colorscale": { "diverging": [ [ 0, "#8e0152" ], [ 0.1, "#c51b7d" ], [ 0.2, "#de77ae" ], [ 0.3, "#f1b6da" ], [ 0.4, "#fde0ef" ], [ 0.5, "#f7f7f7" ], [ 0.6, "#e6f5d0" ], [ 0.7, "#b8e186" ], [ 0.8, "#7fbc41" ], [ 0.9, "#4d9221" ], [ 1, "#276419" ] ], "sequential": [ [ 0, "#0508b8" ], [ 0.0893854748603352, "#1910d8" ], [ 0.1787709497206704, "#3c19f0" ], [ 0.2681564245810056, "#6b1cfb" ], [ 0.3575418994413408, "#981cfd" ], [ 0.44692737430167595, "#bf1cfd" ], [ 0.5363128491620112, "#dd2bfd" ], [ 0.6256983240223464, "#f246fe" ], [ 0.7150837988826816, "#fc67fd" ], [ 0.8044692737430168, "#fe88fc" ], [ 0.8938547486033519, "#fea5fd" ], [ 0.9832402234636871, "#febefe" ], [ 1, "#fec3fe" ] ], "sequentialminus": [ [ 0, "#0508b8" ], [ 0.0893854748603352, "#1910d8" ], [ 0.1787709497206704, "#3c19f0" ], [ 0.2681564245810056, "#6b1cfb" ], [ 0.3575418994413408, "#981cfd" ], [ 0.44692737430167595, "#bf1cfd" ], [ 0.5363128491620112, "#dd2bfd" ], [ 0.6256983240223464, "#f246fe" ], [ 0.7150837988826816, "#fc67fd" ], [ 0.8044692737430168, "#fe88fc" ], [ 0.8938547486033519, "#fea5fd" ], [ 0.9832402234636871, "#febefe" ], [ 1, "#fec3fe" ] ] }, "plot_bgcolor": "white", "paper_bgcolor": "white", "shapedefaults": { "line": { "width": 0 }, "opacity": 0.4, "fillcolor": "#506784" }, "annotationdefaults": { "arrowhead": 0, "arrowcolor": "#506784", "arrowwidth": 1 } }, "themeRef": "PLOTLY_WHITE" } } }, "height": null, "width": null, "user": { "profile_url": "https://chart-studio.plotly.com/~rschap", "avatar_url": "https://storage.googleapis.com/plotly-prod-profiles/1.jpg", "background_url": "https://storage.googleapis.com/plotly-prod-profiles/bg-0.jpg", "bio": "", "nickname": "", "website": "", "stream_tokens": null, "feature_set_id": null, "csrf_token": null, "date_joined": "2021-09-30 16:39:55", "mapbox_access_tokens": null, "has_password": null, "username": "rschap", "email": null, "is_active": null, "readonly": null, "is_dash_creator": null, "dash_created_count": null, "is_chart_creator": null, "charts_created_count": null } }, { "creation_time": "2024-04-16T18:20:12.517633Z", "comments": { "results": [], "count": 0 }, "parented": true, "embed_url": "https://chart-studio.plotly.com/~556900/19.embed", "fid": "556900:19", "filename": "Plot 19", "filetype": "plot", "img_url": "https://storage.googleapis.com/plotly-prod-images/556900/19/9_AC8LYMEGS2E3WD42RQFV92YBC605ZE.png", "image_urls": { "default": "https://storage.googleapis.com/plotly-prod-images/556900/19/2_TNECB440IXTVWA2LAOFPX8P0J2HW3Q.png", "block-thumb": "https://storage.googleapis.com/plotly-prod-images/556900/19/8_0WS6KKHTHTC5CNBINQ5CWVMIF2WSLX.png", "list-thumb": "https://storage.googleapis.com/plotly-prod-images/556900/19/9_AC8LYMEGS2E3WD42RQFV92YBC605ZE.png" }, "api_urls": { "files": "https://api.plotly.com/v2/files/556900:19", "plots": "https://api.plotly.com/v2/plots/556900:19", "parent": "https://api.plotly.com/v2/folders/home?user=556900" }, "owner": "556900", "parent": -1, "preview": "", "referencers": [], "references": [], "title": "", "views": 4, "web_url": "https://chart-studio.plotly.com/~556900/19/", "world_readable": true, "date_modified": "2024-04-16T18:20:12.529Z", "stars": { "results": [], "count": 0 }, "collaborators": { "results": [], "count": 0 }, "subfolder_count": null, "refresh_interval": null, "organize_view_url": "https://chart-studio.plotly.com/~556900/19/", "current_user_permission": "read", "is_theme": null, "is_template": false, "autosize": true, "caption": "", "figure": { "data": [ { "uid": "406846", "meta": { "columnNames": { "x": "Time (s)", "y": "Trial 1 O2 gas" } }, "mode": "markers", "type": "scatter", "xsrc": "556900:18:6703a3", "ysrc": "556900:18:acc7bd" }, { "uid": "bc931b", "transforms": [ { "rms": "", "type": "fit", "inputUid": "406846", "regressor": "x", "parameters": [ { "hold": false, "name": "m", "error": 7.922978700818476e-05, "value": 0.0036842095979611905 }, { "hold": false, "name": "b", "error": 0.008290782995924433, "value": 4.395861117399709 } ], "regressand": "y", "correlation": "", "fitfunction": "m*x + b", "inputxrange": [], "outputxrange": [], "interpolation": 50 } ] }, { "uid": "4d76ca", "meta": { "columnNames": { "x": "Time (s)", "y": "Trial 2 O2 Gas" } }, "mode": "markers", "type": "scatter", "xsrc": "556900:18:6703a3", "ysrc": "556900:18:840718", "stackgroup": null }, { "uid": "1a6801", "meta": { "columnNames": { "x": "Time (s)", "y": "Trial 3 O2 gas" } }, "mode": "markers", "type": "scatter", "xsrc": "556900:18:6703a3", "ysrc": "556900:18:aaff35", "stackgroup": null }, { "uid": "18d2e5", "transforms": [ { "rms": "", "type": "fit", "inputUid": "1a6801", "regressor": "x", "parameters": [ { "hold": false, "name": "m", "error": 0.00032029639668124327, "value": 0.004726882748032143 }, { "hold": false, "name": "b", "error": 0.03351653487325734, "value": 4.4866188277852155 } ], "regressand": "y", "correlation": "", "fitfunction": "m*x + b", "inputxrange": [], "outputxrange": [], "interpolation": 50 } ] }, { "uid": "c9c956", "transforms": [ { "rms": "", "type": "fit", "inputUid": "4d76ca", "regressor": "x", "parameters": [ { "hold": false, "name": "m", "error": 0.00011565663625356182, "value": 0.003761204525983827 }, { "hold": false, "name": "b", "error": 0.012102570376946354, "value": 4.391723408877672 } ], "regressand": "y", "correlation": "", "fitfunction": "m*x + b", "inputxrange": [], "outputxrange": [], "interpolation": 50 } ] } ], "frames": [], "layout": { "title": { "text": "" }, "xaxis": { "type": "linear", "range": [ -11.233349777997043, 191.23334977799703 ], "title": { "text": "Time (s)" }, "autorange": true }, "yaxis": { "type": "linear", "range": [ 4.25040457411643, 5.394671046026505 ], "title": { "text": "O2 gas (%)" }, "autorange": true }, "autosize": true, "template": { "data": { "bar": [ { "type": "bar", "marker": { "colorbar": { "ticks": "", "outlinewidth": 0 } } } ], "table": [ { "type": "table", "cells": { "fill": { "color": "#EBF0F8" }, "line": { "color": "white" } }, "header": { "fill": { "color": "#C8D4E3" }, "line": { "color": "white" } } } ], "carpet": [ { "type": "carpet", "aaxis": { "gridcolor": "#C8D4E3", "linecolor": "#C8D4E3", "endlinecolor": "#2a3f5f", "minorgridcolor": "#C8D4E3", "startlinecolor": "#2a3f5f" }, "baxis": { "gridcolor": "#C8D4E3", "linecolor": "#C8D4E3", "endlinecolor": "#2a3f5f", "minorgridcolor": "#C8D4E3", "startlinecolor": "#2a3f5f" } } ], "mesh3d": [ { "type": "mesh3d", "colorbar": { "ticks": "", "outlinewidth": 0 } } ], "contour": [ { "type": "contour", "colorbar": { "ticks": "", "outlinewidth": 0 }, "autocolorscale": true } ], "heatmap": [ { "type": "heatmap", "colorbar": { "ticks": "", "outlinewidth": 0 }, "autocolorscale": true } ], "scatter": [ { "type": "scatter", "marker": { "colorbar": { "ticks": "", "outlinewidth": 0 } } } ], "surface": [ { "type": "surface", "colorbar": { "ticks": "", "outlinewidth": 0 } } ], "heatmapgl": [ { "type": "heatmapgl", "colorbar": { "ticks": "", "outlinewidth": 0 } } ], "histogram": [ { "type": "histogram", "marker": { "colorbar": { "ticks": "", "outlinewidth": 0 } } } ], "parcoords": [ { "line": { "colorbar": { "ticks": "", "outlinewidth": 0 } }, "type": "parcoords" } ], "scatter3d": [ { "type": "scatter3d", "marker": { "colorbar": { "ticks": "", "outlinewidth": 0 } } } ], "scattergl": [ { "type": "scattergl", "marker": { "colorbar": { "ticks": "", "outlinewidth": 0 } } } ], "choropleth": [ { "type": "choropleth", "colorbar": { "ticks": "", "outlinewidth": 0 } } ], "scattergeo": [ { "type": "scattergeo", "marker": { "colorbar": { "ticks": "", "outlinewidth": 0 } } } ], "histogram2d": [ { "type": "histogram2d", "colorbar": { "ticks": "", "outlinewidth": 0 }, "autocolorscale": true } ], "scatterpolar": [ { "type": "scatterpolar", "marker": { "colorbar": { "ticks": "", "outlinewidth": 0 } } } ], "contourcarpet": [ { "type": "contourcarpet", "colorbar": { "ticks": "", "outlinewidth": 0 } } ], "scattercarpet": [ { "type": "scattercarpet", "marker": { "colorbar": { "ticks": "", "outlinewidth": 0 } } } ], "scattermapbox": [ { "type": "scattermapbox", "marker": { "colorbar": { "ticks": "", "outlinewidth": 0 } } } ], "scatterpolargl": [ { "type": "scatterpolargl", "marker": { "colorbar": { "ticks": "", "outlinewidth": 0 } } } ], "scatterternary": [ { "type": "scatterternary", "marker": { "colorbar": { "ticks": "", "outlinewidth": 0 } } } ], "histogram2dcontour": [ { "type": "histogram2dcontour", "colorbar": { "ticks": "", "outlinewidth": 0 }, "autocolorscale": true } ] }, "layout": { "geo": { "bgcolor": "white", "showland": true, "lakecolor": "white", "landcolor": "white", "showlakes": true, "subunitcolor": "#C8D4E3" }, "font": { "color": "#2a3f5f" }, "polar": { "bgcolor": "white", "radialaxis": { "ticks": "", "gridcolor": "#EBF0F8", "linecolor": "#EBF0F8" }, "angularaxis": { "ticks": "", "gridcolor": "#EBF0F8", "linecolor": "#EBF0F8" } }, "scene": { "xaxis": { "ticks": "", "gridcolor": "#DFE8F3", "gridwidth": 2, "linecolor": "#EBF0F8", "zerolinecolor": "#EBF0F8", "showbackground": true, "backgroundcolor": "white" }, "yaxis": { "ticks": "", "gridcolor": "#DFE8F3", "gridwidth": 2, "linecolor": "#EBF0F8", "zerolinecolor": "#EBF0F8", "showbackground": true, "backgroundcolor": "white" }, "zaxis": { "ticks": "", "gridcolor": "#DFE8F3", "gridwidth": 2, "linecolor": "#EBF0F8", "zerolinecolor": "#EBF0F8", "showbackground": true, "backgroundcolor": "white" } }, "title": { "x": 0.05 }, "xaxis": { "ticks": "", "gridcolor": "#EBF0F8", "linecolor": "#EBF0F8", "automargin": true, "zerolinecolor": "#EBF0F8", "zerolinewidth": 2 }, "yaxis": { "ticks": "", "gridcolor": "#EBF0F8", "linecolor": "#EBF0F8", "automargin": true, "zerolinecolor": "#EBF0F8", "zerolinewidth": 2 }, "ternary": { "aaxis": { "ticks": "", "gridcolor": "#DFE8F3", "linecolor": "#A2B1C6" }, "baxis": { "ticks": "", "gridcolor": "#DFE8F3", "linecolor": "#A2B1C6" }, "caxis": { "ticks": "", "gridcolor": "#DFE8F3", "linecolor": "#A2B1C6" }, "bgcolor": "white" }, "colorway": [ "#636efa", "#EF553B", "#00cc96", "#ab63fa", "#19d3f3", "#e763fa", "#fecb52", "#ffa15a", "#ff6692", "#b6e880" ], "hovermode": "closest", "colorscale": { "diverging": [ [ 0, "#8e0152" ], [ 0.1, "#c51b7d" ], [ 0.2, "#de77ae" ], [ 0.3, "#f1b6da" ], [ 0.4, "#fde0ef" ], [ 0.5, "#f7f7f7" ], [ 0.6, "#e6f5d0" ], [ 0.7, "#b8e186" ], [ 0.8, "#7fbc41" ], [ 0.9, "#4d9221" ], [ 1, "#276419" ] ], "sequential": [ [ 0, "#0508b8" ], [ 0.0893854748603352, "#1910d8" ], [ 0.1787709497206704, "#3c19f0" ], [ 0.2681564245810056, "#6b1cfb" ], [ 0.3575418994413408, "#981cfd" ], [ 0.44692737430167595, "#bf1cfd" ], [ 0.5363128491620112, "#dd2bfd" ], [ 0.6256983240223464, "#f246fe" ], [ 0.7150837988826816, "#fc67fd" ], [ 0.8044692737430168, "#fe88fc" ], [ 0.8938547486033519, "#fea5fd" ], [ 0.9832402234636871, "#febefe" ], [ 1, "#fec3fe" ] ], "sequentialminus": [ [ 0, "#0508b8" ], [ 0.0893854748603352, "#1910d8" ], [ 0.1787709497206704, "#3c19f0" ], [ 0.2681564245810056, "#6b1cfb" ], [ 0.3575418994413408, "#981cfd" ], [ 0.44692737430167595, "#bf1cfd" ], [ 0.5363128491620112, "#dd2bfd" ], [ 0.6256983240223464, "#f246fe" ], [ 0.7150837988826816, "#fc67fd" ], [ 0.8044692737430168, "#fe88fc" ], [ 0.8938547486033519, "#fea5fd" ], [ 0.9832402234636871, "#febefe" ], [ 1, "#fec3fe" ] ] }, "plot_bgcolor": "white", "paper_bgcolor": "white", "shapedefaults": { "line": { "width": 0 }, "opacity": 0.4, "fillcolor": "#506784" }, "annotationdefaults": { "arrowhead": 0, "arrowcolor": "#506784", "arrowwidth": 1 } }, "themeRef": "PLOTLY_WHITE" } } }, "height": null, "width": null, "user": { "profile_url": "https://chart-studio.plotly.com/~556900", "avatar_url": "https://storage.googleapis.com/plotly-prod-profiles/68.jpg", "background_url": "https://storage.googleapis.com/plotly-prod-profiles/bg-7.jpg", "bio": "", "nickname": "", "website": "", "stream_tokens": null, "feature_set_id": null, "csrf_token": null, "date_joined": "2021-10-08 18:30:36", "mapbox_access_tokens": null, "has_password": null, "username": "556900", "email": null, "is_active": null, "readonly": null, "is_dash_creator": null, "dash_created_count": null, "is_chart_creator": null, "charts_created_count": null } }, { "creation_time": "2024-04-16T18:04:59.823163Z", "comments": { "results": [], "count": 0 }, "parented": true, "embed_url": "https://chart-studio.plotly.com/~abererahaman27/27.embed", "fid": "abererahaman27:27", "filename": "Plot 27", "filetype": "plot", "img_url": "https://storage.googleapis.com/plotly-prod-images/abererahaman27/27/9_9IY0PAUVBPXN6I9ILY0GREP03B0DTH.png", "image_urls": { "default": "https://storage.googleapis.com/plotly-prod-images/abererahaman27/27/2_L7WVGP4ALJ6JN3OT1H4SYT5K1MAGWM.png", "block-thumb": "https://storage.googleapis.com/plotly-prod-images/abererahaman27/27/8_6CCW8DNW01S2908XHZ2EGU3RN4JYX5.png", "list-thumb": "https://storage.googleapis.com/plotly-prod-images/abererahaman27/27/9_9IY0PAUVBPXN6I9ILY0GREP03B0DTH.png" }, "api_urls": { "files": "https://api.plotly.com/v2/files/abererahaman27:27", "plots": "https://api.plotly.com/v2/plots/abererahaman27:27", "parent": "https://api.plotly.com/v2/folders/home?user=abererahaman27" }, "owner": "abererahaman27", "parent": -1, "preview": "", "referencers": [], "references": [], "title": "", "views": 1, "web_url": "https://chart-studio.plotly.com/~abererahaman27/27/", "world_readable": true, "date_modified": "2024-04-16T18:04:59.838Z", "stars": { "results": [], "count": 0 }, "collaborators": { "results": [], "count": 0 }, "subfolder_count": null, "refresh_interval": null, "organize_view_url": "https://chart-studio.plotly.com/~abererahaman27/27/", "current_user_permission": "read", "is_theme": null, "is_template": false, "autosize": true, "caption": "", "figure": { "data": [ { "meta": { "columnNames": { "labels": "A", "values": "B" } }, "mode": "markers", "type": "pie", "labelssrc": "abererahaman27:26:8c2c39", "valuessrc": "abererahaman27:26:e2ed1b" } ], "frames": [], "layout": { "title": { "text": "Cell Phase Percentage" }, "xaxis": { "range": [ -1, 6 ], "autorange": true }, "yaxis": { "range": [ -1, 4 ], "autorange": true }, "autosize": true, "template": { "data": { "bar": [ { "type": "bar", "marker": { "colorbar": { "ticks": "", "outlinewidth": 0 } } } ], "table": [ { "type": "table", "cells": { "fill": { "color": "#EBF0F8" }, "line": { "color": "white" } }, "header": { "fill": { "color": "#C8D4E3" }, "line": { "color": "white" } } } ], "carpet": [ { "type": "carpet", "aaxis": { "gridcolor": "#C8D4E3", "linecolor": "#C8D4E3", "endlinecolor": "#2a3f5f", "minorgridcolor": "#C8D4E3", "startlinecolor": "#2a3f5f" }, "baxis": { "gridcolor": "#C8D4E3", "linecolor": "#C8D4E3", "endlinecolor": "#2a3f5f", "minorgridcolor": "#C8D4E3", "startlinecolor": "#2a3f5f" } } ], "mesh3d": [ { "type": "mesh3d", "colorbar": { "ticks": "", "outlinewidth": 0 } } ], "contour": [ { "type": "contour", "colorbar": { "ticks": "", "outlinewidth": 0 }, "autocolorscale": true } ], "heatmap": [ { "type": "heatmap", "colorbar": { "ticks": "", "outlinewidth": 0 }, "autocolorscale": true } ], "scatter": [ { "type": "scatter", "marker": { "colorbar": { "ticks": "", "outlinewidth": 0 } } } ], "surface": [ { "type": "surface", "colorbar": { "ticks": "", "outlinewidth": 0 } } ], "heatmapgl": [ { "type": "heatmapgl", "colorbar": { "ticks": "", "outlinewidth": 0 } } ], "histogram": [ { "type": "histogram", "marker": { "colorbar": { "ticks": "", "outlinewidth": 0 } } } ], "parcoords": [ { "line": { "colorbar": { "ticks": "", "outlinewidth": 0 } }, "type": "parcoords" } ], "scatter3d": [ { "type": "scatter3d", "marker": { "colorbar": { "ticks": "", "outlinewidth": 0 } } } ], "scattergl": [ { "type": "scattergl", "marker": { "colorbar": { "ticks": "", "outlinewidth": 0 } } } ], "choropleth": [ { "type": "choropleth", "colorbar": { "ticks": "", "outlinewidth": 0 } } ], "scattergeo": [ { "type": "scattergeo", "marker": { "colorbar": { "ticks": "", "outlinewidth": 0 } } } ], "histogram2d": [ { "type": "histogram2d", "colorbar": { "ticks": "", "outlinewidth": 0 }, "autocolorscale": true } ], "scatterpolar": [ { "type": "scatterpolar", "marker": { "colorbar": { "ticks": "", "outlinewidth": 0 } } } ], "contourcarpet": [ { "type": "contourcarpet", "colorbar": { "ticks": "", "outlinewidth": 0 } } ], "scattercarpet": [ { "type": "scattercarpet", "marker": { "colorbar": { "ticks": "", "outlinewidth": 0 } } } ], "scattermapbox": [ { "type": "scattermapbox", "marker": { "colorbar": { "ticks": "", "outlinewidth": 0 } } } ], "scatterpolargl": [ { "type": "scatterpolargl", "marker": { "colorbar": { "ticks": "", "outlinewidth": 0 } } } ], "scatterternary": [ { "type": "scatterternary", "marker": { "colorbar": { "ticks": "", "outlinewidth": 0 } } } ], "histogram2dcontour": [ { "type": "histogram2dcontour", "colorbar": { "ticks": "", "outlinewidth": 0 }, "autocolorscale": true } ] }, "layout": { "geo": { "bgcolor": "white", "showland": true, "lakecolor": "white", "landcolor": "white", "showlakes": true, "subunitcolor": "#C8D4E3" }, "font": { "color": "#2a3f5f" }, "polar": { "bgcolor": "white", "radialaxis": { "ticks": "", "gridcolor": "#EBF0F8", "linecolor": "#EBF0F8" }, "angularaxis": { "ticks": "", "gridcolor": "#EBF0F8", "linecolor": "#EBF0F8" } }, "scene": { "xaxis": { "ticks": "", "gridcolor": "#DFE8F3", "gridwidth": 2, "linecolor": "#EBF0F8", "zerolinecolor": "#EBF0F8", "showbackground": true, "backgroundcolor": "white" }, "yaxis": { "ticks": "", "gridcolor": "#DFE8F3", "gridwidth": 2, "linecolor": "#EBF0F8", "zerolinecolor": "#EBF0F8", "showbackground": true, "backgroundcolor": "white" }, "zaxis": { "ticks": "", "gridcolor": "#DFE8F3", "gridwidth": 2, "linecolor": "#EBF0F8", "zerolinecolor": "#EBF0F8", "showbackground": true, "backgroundcolor": "white" } }, "title": { "x": 0.05 }, "xaxis": { "ticks": "", "gridcolor": "#EBF0F8", "linecolor": "#EBF0F8", "automargin": true, "zerolinecolor": "#EBF0F8", "zerolinewidth": 2 }, "yaxis": { "ticks": "", "gridcolor": "#EBF0F8", "linecolor": "#EBF0F8", "automargin": true, "zerolinecolor": "#EBF0F8", "zerolinewidth": 2 }, "ternary": { "aaxis": { "ticks": "", "gridcolor": "#DFE8F3", "linecolor": "#A2B1C6" }, "baxis": { "ticks": "", "gridcolor": "#DFE8F3", "linecolor": "#A2B1C6" }, "caxis": { "ticks": "", "gridcolor": "#DFE8F3", "linecolor": "#A2B1C6" }, "bgcolor": "white" }, "colorway": [ "#636efa", "#EF553B", "#00cc96", "#ab63fa", "#19d3f3", "#e763fa", "#fecb52", "#ffa15a", "#ff6692", "#b6e880" ], "hovermode": "closest", "colorscale": { "diverging": [ [ 0, "#8e0152" ], [ 0.1, "#c51b7d" ], [ 0.2, "#de77ae" ], [ 0.3, "#f1b6da" ], [ 0.4, "#fde0ef" ], [ 0.5, "#f7f7f7" ], [ 0.6, "#e6f5d0" ], [ 0.7, "#b8e186" ], [ 0.8, "#7fbc41" ], [ 0.9, "#4d9221" ], [ 1, "#276419" ] ], "sequential": [ [ 0, "#0508b8" ], [ 0.0893854748603352, "#1910d8" ], [ 0.1787709497206704, "#3c19f0" ], [ 0.2681564245810056, "#6b1cfb" ], [ 0.3575418994413408, "#981cfd" ], [ 0.44692737430167595, "#bf1cfd" ], [ 0.5363128491620112, "#dd2bfd" ], [ 0.6256983240223464, "#f246fe" ], [ 0.7150837988826816, "#fc67fd" ], [ 0.8044692737430168, "#fe88fc" ], [ 0.8938547486033519, "#fea5fd" ], [ 0.9832402234636871, "#febefe" ], [ 1, "#fec3fe" ] ], "sequentialminus": [ [ 0, "#0508b8" ], [ 0.0893854748603352, "#1910d8" ], [ 0.1787709497206704, "#3c19f0" ], [ 0.2681564245810056, "#6b1cfb" ], [ 0.3575418994413408, "#981cfd" ], [ 0.44692737430167595, "#bf1cfd" ], [ 0.5363128491620112, "#dd2bfd" ], [ 0.6256983240223464, "#f246fe" ], [ 0.7150837988826816, "#fc67fd" ], [ 0.8044692737430168, "#fe88fc" ], [ 0.8938547486033519, "#fea5fd" ], [ 0.9832402234636871, "#febefe" ], [ 1, "#fec3fe" ] ] }, "plot_bgcolor": "white", "paper_bgcolor": "white", "shapedefaults": { "line": { "width": 0 }, "opacity": 0.4, "fillcolor": "#506784" }, "annotationdefaults": { "arrowhead": 0, "arrowcolor": "#506784", "arrowwidth": 1 } }, "themeRef": "PLOTLY_WHITE" } } }, "height": null, "width": null, "user": { "profile_url": "https://chart-studio.plotly.com/~abererahaman27", "avatar_url": "https://storage.googleapis.com/plotly-prod-profiles/8.jpg", "background_url": "https://storage.googleapis.com/plotly-prod-profiles/bg-10.jpg", "bio": "", "nickname": "", "website": "", "stream_tokens": null, "feature_set_id": null, "csrf_token": null, "date_joined": "2024-02-19 22:39:30", "mapbox_access_tokens": null, "has_password": null, "username": "abererahaman27", "email": null, "is_active": null, "readonly": null, "is_dash_creator": null, "dash_created_count": null, "is_chart_creator": null, "charts_created_count": null } }, { "creation_time": "2024-04-16T18:02:02.025584Z", "comments": { "results": [], "count": 0 }, "parented": true, "embed_url": "https://chart-studio.plotly.com/~mwellerRWTH/17.embed", "fid": "mwellerRWTH:17", "filename": "ThroughputRWTHCores", "filetype": "plot", "img_url": "https://storage.googleapis.com/plotly-prod-images/mwellerRWTH/17/9_UDL1ILME6V7IVI1VQYNSAMLPCFJZJ3.png", "image_urls": { "default": "https://storage.googleapis.com/plotly-prod-images/mwellerRWTH/17/2_OU5O2AM60IC36NDLD51NMJWEVNKU9K.png", "block-thumb": "https://storage.googleapis.com/plotly-prod-images/mwellerRWTH/17/8_BCYAN87GSA9ABNWF9VUUKC0G78O6YV.png", "list-thumb": "https://storage.googleapis.com/plotly-prod-images/mwellerRWTH/17/9_UDL1ILME6V7IVI1VQYNSAMLPCFJZJ3.png" }, "api_urls": { "files": "https://api.plotly.com/v2/files/mwellerRWTH:17", "plots": "https://api.plotly.com/v2/plots/mwellerRWTH:17", "parent": "https://api.plotly.com/v2/folders/home?user=mwellerRWTH" }, "owner": "mwellerRWTH", "parent": -1, "preview": "", "referencers": [], "references": [], "title": "", "views": 1, "web_url": "https://chart-studio.plotly.com/~mwellerRWTH/17/", "world_readable": true, "date_modified": "2024-04-16T18:36:21.648Z", "stars": { "results": [], "count": 0 }, "collaborators": { "results": [], "count": 0 }, "subfolder_count": null, "refresh_interval": null, "organize_view_url": "https://chart-studio.plotly.com/~mwellerRWTH/17/", "current_user_permission": "read", "is_theme": null, "is_template": false, "autosize": true, "caption": "", "figure": { "data": [ { "meta": { "columnNames": { "x": "cores", "y": "iorEasyWrite", "z": "cpn" } }, "mode": "markers", "name": "Cores total", "type": "bar", "xsrc": "mwellerRWTH:19:d05c65", "ysrc": "mwellerRWTH:19:71eef4", "zsrc": "mwellerRWTH:14:4f6d27", "contours": { "end": 14, "size": 2, "start": 2 }, "transpose": false, "transforms": [ { "meta": { "columnNames": { "groups": "cores" } }, "type": "aggregate", "enabled": true, "groupssrc": "mwellerRWTH:19:d05c65", "aggregations": [ { "func": "avg", "target": "x", "enabled": true }, { "func": "avg", "target": "y", "enabled": true } ] } ], "autocontour": true, "orientation": "v", "autocolorscale": true }, { "meta": { "columnNames": { "x": "cpn", "y": "iorEasyWrite" } }, "name": "Cores per Node", "type": "bar", "xsrc": "mwellerRWTH:19:14015e", "ysrc": "mwellerRWTH:19:71eef4", "xaxis": "x2", "yaxis": "y", "transforms": [ { "meta": { "columnNames": { "groups": "cpn" } }, "type": "aggregate", "groupssrc": "mwellerRWTH:19:14015e", "aggregations": [ { "func": "avg", "target": "x", "enabled": true }, { "func": "avg", "target": "y", "enabled": true } ] } ], "orientation": "v" }, { "meta": { "columnNames": { "x": "nodes", "y": "iorEasyWrite" } }, "name": "Nodes", "type": "bar", "xsrc": "mwellerRWTH:19:2f537e", "ysrc": "mwellerRWTH:19:71eef4", "xaxis": "x3", "yaxis": "y", "transforms": [ { "meta": { "columnNames": { "groups": "nodes" } }, "type": "aggregate", "groupssrc": "mwellerRWTH:19:2f537e", "aggregations": [ { "func": "avg", "target": "x", "enabled": true }, { "func": "avg", "target": "y", "enabled": true } ] } ], "orientation": "v" } ], "frames": [], "layout": { "title": { "text": "Throughput based on Cores in Aachen" }, "xaxis": { "type": "category", "range": [ -0.5, 4.5 ], "title": { "text": "Cores" }, "domain": [ 0, 0.33 ], "autorange": true, "fixedrange": false, "overlaying": false }, "yaxis": { "type": "linear", "range": [ 0, 0.2934515789473684 ], "title": { "text": "Average GiB/s" }, "domain": [ 0, 1 ], "autorange": true, "overlaying": false }, "legend": { "x": 0.8473801323808212, "y": 1.2091690544412608 }, "xaxis2": { "side": "bottom", "type": "category", "range": [ -0.5, 2.5 ], "title": { "text": "Cores per Node" }, "anchor": "y2", "domain": [ 0.33, 0.66 ], "autorange": true, "overlaying": false, "showticklabels": true }, "xaxis3": { "side": "bottom", "type": "category", "range": [ -0.5, 4.5 ], "title": { "text": "Nodes" }, "domain": [ 0.66, 1 ], "autorange": true, "overlaying": false }, "autosize": true, "template": { "data": { "bar": [ { "type": "bar", "marker": { "colorbar": { "ticks": "", "outlinewidth": 0 } } } ], "table": [ { "type": "table", "cells": { "fill": { "color": "#EBF0F8" }, "line": { "color": "white" } }, "header": { "fill": { "color": "#C8D4E3" }, "line": { "color": "white" } } } ], "carpet": [ { "type": "carpet", "aaxis": { "gridcolor": "#C8D4E3", "linecolor": "#C8D4E3", "endlinecolor": "#2a3f5f", "minorgridcolor": "#C8D4E3", "startlinecolor": "#2a3f5f" }, "baxis": { "gridcolor": "#C8D4E3", "linecolor": "#C8D4E3", "endlinecolor": "#2a3f5f", "minorgridcolor": "#C8D4E3", "startlinecolor": "#2a3f5f" } } ], "mesh3d": [ { "type": "mesh3d", "colorbar": { "ticks": "", "outlinewidth": 0 } } ], "contour": [ { "type": "contour", "colorbar": { "ticks": "", "outlinewidth": 0 }, "autocolorscale": true } ], "heatmap": [ { "type": "heatmap", "colorbar": { "ticks": "", "outlinewidth": 0 }, "autocolorscale": true } ], "scatter": [ { "type": "scatter", "marker": { "colorbar": { "ticks": "", "outlinewidth": 0 } } } ], "surface": [ { "type": "surface", "colorbar": { "ticks": "", "outlinewidth": 0 } } ], "heatmapgl": [ { "type": "heatmapgl", "colorbar": { "ticks": "", "outlinewidth": 0 } } ], "histogram": [ { "type": "histogram", "marker": { "colorbar": { "ticks": "", "outlinewidth": 0 } } } ], "parcoords": [ { "line": { "colorbar": { "ticks": "", "outlinewidth": 0 } }, "type": "parcoords" } ], "scatter3d": [ { "type": "scatter3d", "marker": { "colorbar": { "ticks": "", "outlinewidth": 0 } } } ], "scattergl": [ { "type": "scattergl", "marker": { "colorbar": { "ticks": "", "outlinewidth": 0 } } } ], "choropleth": [ { "type": "choropleth", "colorbar": { "ticks": "", "outlinewidth": 0 } } ], "scattergeo": [ { "type": "scattergeo", "marker": { "colorbar": { "ticks": "", "outlinewidth": 0 } } } ], "histogram2d": [ { "type": "histogram2d", "colorbar": { "ticks": "", "outlinewidth": 0 }, "autocolorscale": true } ], "scatterpolar": [ { "type": "scatterpolar", "marker": { "colorbar": { "ticks": "", "outlinewidth": 0 } } } ], "contourcarpet": [ { "type": "contourcarpet", "colorbar": { "ticks": "", "outlinewidth": 0 } } ], "scattercarpet": [ { "type": "scattercarpet", "marker": { "colorbar": { "ticks": "", "outlinewidth": 0 } } } ], "scattermapbox": [ { "type": "scattermapbox", "marker": { "colorbar": { "ticks": "", "outlinewidth": 0 } } } ], "scatterpolargl": [ { "type": "scatterpolargl", "marker": { "colorbar": { "ticks": "", "outlinewidth": 0 } } } ], "scatterternary": [ { "type": "scatterternary", "marker": { "colorbar": { "ticks": "", "outlinewidth": 0 } } } ], "histogram2dcontour": [ { "type": "histogram2dcontour", "colorbar": { "ticks": "", "outlinewidth": 0 }, "autocolorscale": true } ] }, "layout": { "geo": { "bgcolor": "white", "showland": true, "lakecolor": "white", "landcolor": "white", "showlakes": true, "subunitcolor": "#C8D4E3" }, "font": { "color": "#2a3f5f" }, "polar": { "bgcolor": "white", "radialaxis": { "ticks": "", "gridcolor": "#EBF0F8", "linecolor": "#EBF0F8" }, "angularaxis": { "ticks": "", "gridcolor": "#EBF0F8", "linecolor": "#EBF0F8" } }, "scene": { "xaxis": { "ticks": "", "gridcolor": "#DFE8F3", "gridwidth": 2, "linecolor": "#EBF0F8", "zerolinecolor": "#EBF0F8", "showbackground": true, "backgroundcolor": "white" }, "yaxis": { "ticks": "", "gridcolor": "#DFE8F3", "gridwidth": 2, "linecolor": "#EBF0F8", "zerolinecolor": "#EBF0F8", "showbackground": true, "backgroundcolor": "white" }, "zaxis": { "ticks": "", "gridcolor": "#DFE8F3", "gridwidth": 2, "linecolor": "#EBF0F8", "zerolinecolor": "#EBF0F8", "showbackground": true, "backgroundcolor": "white" } }, "title": { "x": 0.05 }, "xaxis": { "ticks": "", "gridcolor": "#EBF0F8", "linecolor": "#EBF0F8", "automargin": true, "zerolinecolor": "#EBF0F8", "zerolinewidth": 2 }, "yaxis": { "ticks": "", "gridcolor": "#EBF0F8", "linecolor": "#EBF0F8", "automargin": true, "zerolinecolor": "#EBF0F8", "zerolinewidth": 2 }, "ternary": { "aaxis": { "ticks": "", "gridcolor": "#DFE8F3", "linecolor": "#A2B1C6" }, "baxis": { "ticks": "", "gridcolor": "#DFE8F3", "linecolor": "#A2B1C6" }, "caxis": { "ticks": "", "gridcolor": "#DFE8F3", "linecolor": "#A2B1C6" }, "bgcolor": "white" }, "colorway": [ "#636efa", "#EF553B", "#00cc96", "#ab63fa", "#19d3f3", "#e763fa", "#fecb52", "#ffa15a", "#ff6692", "#b6e880" ], "hovermode": "closest", "colorscale": { "diverging": [ [ 0, "#8e0152" ], [ 0.1, "#c51b7d" ], [ 0.2, "#de77ae" ], [ 0.3, "#f1b6da" ], [ 0.4, "#fde0ef" ], [ 0.5, "#f7f7f7" ], [ 0.6, "#e6f5d0" ], [ 0.7, "#b8e186" ], [ 0.8, "#7fbc41" ], [ 0.9, "#4d9221" ], [ 1, "#276419" ] ], "sequential": [ [ 0, "#0508b8" ], [ 0.0893854748603352, "#1910d8" ], [ 0.1787709497206704, "#3c19f0" ], [ 0.2681564245810056, "#6b1cfb" ], [ 0.3575418994413408, "#981cfd" ], [ 0.44692737430167595, "#bf1cfd" ], [ 0.5363128491620112, "#dd2bfd" ], [ 0.6256983240223464, "#f246fe" ], [ 0.7150837988826816, "#fc67fd" ], [ 0.8044692737430168, "#fe88fc" ], [ 0.8938547486033519, "#fea5fd" ], [ 0.9832402234636871, "#febefe" ], [ 1, "#fec3fe" ] ], "sequentialminus": [ [ 0, "#0508b8" ], [ 0.0893854748603352, "#1910d8" ], [ 0.1787709497206704, "#3c19f0" ], [ 0.2681564245810056, "#6b1cfb" ], [ 0.3575418994413408, "#981cfd" ], [ 0.44692737430167595, "#bf1cfd" ], [ 0.5363128491620112, "#dd2bfd" ], [ 0.6256983240223464, "#f246fe" ], [ 0.7150837988826816, "#fc67fd" ], [ 0.8044692737430168, "#fe88fc" ], [ 0.8938547486033519, "#fea5fd" ], [ 0.9832402234636871, "#febefe" ], [ 1, "#fec3fe" ] ] }, "plot_bgcolor": "white", "paper_bgcolor": "white", "shapedefaults": { "line": { "width": 0 }, "opacity": 0.4, "fillcolor": "#506784" }, "annotationdefaults": { "arrowhead": 0, "arrowcolor": "#506784", "arrowwidth": 1 } }, "themeRef": "PLOTLY_WHITE" } } }, "height": null, "width": null, "user": { "profile_url": "https://chart-studio.plotly.com/~mwellerRWTH", "avatar_url": "https://storage.googleapis.com/plotly-prod-profiles/80.jpg", "background_url": "https://storage.googleapis.com/plotly-prod-profiles/bg-0.jpg", "bio": "", "nickname": "", "website": "", "stream_tokens": null, "feature_set_id": null, "csrf_token": null, "date_joined": "2024-04-15 13:43:46", "mapbox_access_tokens": null, "has_password": null, "username": "mwellerRWTH", "email": null, "is_active": null, "readonly": null, "is_dash_creator": null, "dash_created_count": null, "is_chart_creator": null, "charts_created_count": null } }, { "creation_time": "2024-04-16T18:00:32.450579Z", "comments": { "results": [], "count": 0 }, "parented": true, "embed_url": "https://chart-studio.plotly.com/~SriniNeru/59.embed", "fid": "SriniNeru:59", "filename": "Plot 59", "filetype": "plot", "img_url": "https://storage.googleapis.com/plotly-prod-images/SriniNeru/59/9_BFKJM0WVQE3YUG7CG0CLI5YGNV55T3.png", "image_urls": { "default": "https://storage.googleapis.com/plotly-prod-images/SriniNeru/59/2_A5ML4UUCC2Z1LNPSW71X5Z5OJ8Y3FP.png", "block-thumb": "https://storage.googleapis.com/plotly-prod-images/SriniNeru/59/8_XIN9TZL992B92A793HYJNFMFVATMS3.png", "list-thumb": "https://storage.googleapis.com/plotly-prod-images/SriniNeru/59/9_BFKJM0WVQE3YUG7CG0CLI5YGNV55T3.png" }, "api_urls": { "files": "https://api.plotly.com/v2/files/SriniNeru:59", "plots": "https://api.plotly.com/v2/plots/SriniNeru:59", "parent": "https://api.plotly.com/v2/folders/home?user=SriniNeru" }, "owner": "SriniNeru", "parent": -1, "preview": "", "referencers": [], "references": [], "title": "", "views": 2, "web_url": "https://chart-studio.plotly.com/~SriniNeru/59/", "world_readable": true, "date_modified": "2024-04-16T18:00:32.464Z", "stars": { "results": [], "count": 0 }, "collaborators": { "results": [], "count": 0 }, "subfolder_count": null, "refresh_interval": null, "organize_view_url": "https://chart-studio.plotly.com/~SriniNeru/59/", "current_user_permission": "read", "is_theme": null, "is_template": false, "autosize": true, "caption": "", "figure": { "data": [ { "meta": { "columnNames": { "x": "A", "y": "B" } }, "mode": "lines", "type": "scatter", "xsrc": "SriniNeru:58:6952cd", "ysrc": "SriniNeru:58:1f1a28" }, { "meta": { "columnNames": { "x": "A", "y": "C" } }, "mode": "lines", "type": "scatter", "xsrc": "SriniNeru:58:6952cd", "ysrc": "SriniNeru:58:d91198", "stackgroup": null }, { "meta": { "columnNames": { "x": "A", "y": "D" } }, "mode": "lines", "type": "scatter", "xsrc": "SriniNeru:58:6952cd", "ysrc": "SriniNeru:58:fd7199", "stackgroup": null }, { "meta": { "columnNames": { "x": "A", "y": "E" } }, "mode": "lines", "type": "scatter", "xsrc": "SriniNeru:58:6952cd", "ysrc": "SriniNeru:58:909b64", "stackgroup": null } ], "frames": [], "layout": { "xaxis": { "type": "linear", "range": [ -1, 1.0000000000000018 ], "autorange": true }, "yaxis": { "type": "linear", "range": [ -0.204754, 0.142706 ], "autorange": true }, "autosize": true, "template": { "data": { "bar": [ { "type": "bar", "marker": { "colorbar": { "ticks": "", "outlinewidth": 0 } } } ], "table": [ { "type": "table", "cells": { "fill": { "color": "#EBF0F8" }, "line": { "color": "white" } }, "header": { "fill": { "color": "#C8D4E3" }, "line": { "color": "white" } } } ], "carpet": [ { "type": "carpet", "aaxis": { "gridcolor": "#C8D4E3", "linecolor": "#C8D4E3", "endlinecolor": "#2a3f5f", "minorgridcolor": "#C8D4E3", "startlinecolor": "#2a3f5f" }, "baxis": { "gridcolor": "#C8D4E3", "linecolor": "#C8D4E3", "endlinecolor": "#2a3f5f", "minorgridcolor": "#C8D4E3", "startlinecolor": "#2a3f5f" } } ], "mesh3d": [ { "type": "mesh3d", "colorbar": { "ticks": "", "outlinewidth": 0 } } ], "contour": [ { "type": "contour", "colorbar": { "ticks": "", "outlinewidth": 0 }, "autocolorscale": true } ], "heatmap": [ { "type": "heatmap", "colorbar": { "ticks": "", "outlinewidth": 0 }, "autocolorscale": true } ], "scatter": [ { "type": "scatter", "marker": { "colorbar": { "ticks": "", "outlinewidth": 0 } } } ], "surface": [ { "type": "surface", "colorbar": { "ticks": "", "outlinewidth": 0 } } ], "heatmapgl": [ { "type": "heatmapgl", "colorbar": { "ticks": "", "outlinewidth": 0 } } ], "histogram": [ { "type": "histogram", "marker": { "colorbar": { "ticks": "", "outlinewidth": 0 } } } ], "parcoords": [ { "line": { "colorbar": { "ticks": "", "outlinewidth": 0 } }, "type": "parcoords" } ], "scatter3d": [ { "type": "scatter3d", "marker": { "colorbar": { "ticks": "", "outlinewidth": 0 } } } ], "scattergl": [ { "type": "scattergl", "marker": { "colorbar": { "ticks": "", "outlinewidth": 0 } } } ], "choropleth": [ { "type": "choropleth", "colorbar": { "ticks": "", "outlinewidth": 0 } } ], "scattergeo": [ { "type": "scattergeo", "marker": { "colorbar": { "ticks": "", "outlinewidth": 0 } } } ], "histogram2d": [ { "type": "histogram2d", "colorbar": { "ticks": "", "outlinewidth": 0 }, "autocolorscale": true } ], "scatterpolar": [ { "type": "scatterpolar", "marker": { "colorbar": { "ticks": "", "outlinewidth": 0 } } } ], "contourcarpet": [ { "type": "contourcarpet", "colorbar": { "ticks": "", "outlinewidth": 0 } } ], "scattercarpet": [ { "type": "scattercarpet", "marker": { "colorbar": { "ticks": "", "outlinewidth": 0 } } } ], "scattermapbox": [ { "type": "scattermapbox", "marker": { "colorbar": { "ticks": "", "outlinewidth": 0 } } } ], "scatterpolargl": [ { "type": "scatterpolargl", "marker": { "colorbar": { "ticks": "", "outlinewidth": 0 } } } ], "scatterternary": [ { "type": "scatterternary", "marker": { "colorbar": { "ticks": "", "outlinewidth": 0 } } } ], "histogram2dcontour": [ { "type": "histogram2dcontour", "colorbar": { "ticks": "", "outlinewidth": 0 }, "autocolorscale": true } ] }, "layout": { "geo": { "bgcolor": "white", "showland": true, "lakecolor": "white", "landcolor": "white", "showlakes": true, "subunitcolor": "#C8D4E3" }, "font": { "color": "#2a3f5f" }, "polar": { "bgcolor": "white", "radialaxis": { "ticks": "", "gridcolor": "#EBF0F8", "linecolor": "#EBF0F8" }, "angularaxis": { "ticks": "", "gridcolor": "#EBF0F8", "linecolor": "#EBF0F8" } }, "scene": { "xaxis": { "ticks": "", "gridcolor": "#DFE8F3", "gridwidth": 2, "linecolor": "#EBF0F8", "zerolinecolor": "#EBF0F8", "showbackground": true, "backgroundcolor": "white" }, "yaxis": { "ticks": "", "gridcolor": "#DFE8F3", "gridwidth": 2, "linecolor": "#EBF0F8", "zerolinecolor": "#EBF0F8", "showbackground": true, "backgroundcolor": "white" }, "zaxis": { "ticks": "", "gridcolor": "#DFE8F3", "gridwidth": 2, "linecolor": "#EBF0F8", "zerolinecolor": "#EBF0F8", "showbackground": true, "backgroundcolor": "white" } }, "title": { "x": 0.05 }, "xaxis": { "ticks": "", "gridcolor": "#EBF0F8", "linecolor": "#EBF0F8", "automargin": true, "zerolinecolor": "#EBF0F8", "zerolinewidth": 2 }, "yaxis": { "ticks": "", "gridcolor": "#EBF0F8", "linecolor": "#EBF0F8", "automargin": true, "zerolinecolor": "#EBF0F8", "zerolinewidth": 2 }, "ternary": { "aaxis": { "ticks": "", "gridcolor": "#DFE8F3", "linecolor": "#A2B1C6" }, "baxis": { "ticks": "", "gridcolor": "#DFE8F3", "linecolor": "#A2B1C6" }, "caxis": { "ticks": "", "gridcolor": "#DFE8F3", "linecolor": "#A2B1C6" }, "bgcolor": "white" }, "colorway": [ "#636efa", "#EF553B", "#00cc96", "#ab63fa", "#19d3f3", "#e763fa", "#fecb52", "#ffa15a", "#ff6692", "#b6e880" ], "hovermode": "closest", "colorscale": { "diverging": [ [ 0, "#8e0152" ], [ 0.1, "#c51b7d" ], [ 0.2, "#de77ae" ], [ 0.3, "#f1b6da" ], [ 0.4, "#fde0ef" ], [ 0.5, "#f7f7f7" ], [ 0.6, "#e6f5d0" ], [ 0.7, "#b8e186" ], [ 0.8, "#7fbc41" ], [ 0.9, "#4d9221" ], [ 1, "#276419" ] ], "sequential": [ [ 0, "#0508b8" ], [ 0.0893854748603352, "#1910d8" ], [ 0.1787709497206704, "#3c19f0" ], [ 0.2681564245810056, "#6b1cfb" ], [ 0.3575418994413408, "#981cfd" ], [ 0.44692737430167595, "#bf1cfd" ], [ 0.5363128491620112, "#dd2bfd" ], [ 0.6256983240223464, "#f246fe" ], [ 0.7150837988826816, "#fc67fd" ], [ 0.8044692737430168, "#fe88fc" ], [ 0.8938547486033519, "#fea5fd" ], [ 0.9832402234636871, "#febefe" ], [ 1, "#fec3fe" ] ], "sequentialminus": [ [ 0, "#0508b8" ], [ 0.0893854748603352, "#1910d8" ], [ 0.1787709497206704, "#3c19f0" ], [ 0.2681564245810056, "#6b1cfb" ], [ 0.3575418994413408, "#981cfd" ], [ 0.44692737430167595, "#bf1cfd" ], [ 0.5363128491620112, "#dd2bfd" ], [ 0.6256983240223464, "#f246fe" ], [ 0.7150837988826816, "#fc67fd" ], [ 0.8044692737430168, "#fe88fc" ], [ 0.8938547486033519, "#fea5fd" ], [ 0.9832402234636871, "#febefe" ], [ 1, "#fec3fe" ] ] }, "plot_bgcolor": "white", "paper_bgcolor": "white", "shapedefaults": { "line": { "width": 0 }, "opacity": 0.4, "fillcolor": "#506784" }, "annotationdefaults": { "arrowhead": 0, "arrowcolor": "#506784", "arrowwidth": 1 } }, "themeRef": "PLOTLY_WHITE" } } }, "height": null, "width": null, "user": { "profile_url": "https://chart-studio.plotly.com/~SriniNeru", "avatar_url": "https://storage.googleapis.com/plotly-prod-profiles/77.jpg", "background_url": "https://storage.googleapis.com/plotly-prod-profiles/bg-7.jpg", "bio": "", "nickname": "", "website": "", "stream_tokens": null, "feature_set_id": null, "csrf_token": null, "date_joined": "2022-10-04 05:08:13", "mapbox_access_tokens": null, "has_password": null, "username": "SriniNeru", "email": null, "is_active": null, "readonly": null, "is_dash_creator": null, "dash_created_count": null, "is_chart_creator": null, "charts_created_count": null } }, { "creation_time": "2024-04-16T17:54:27.485221Z", "comments": { "results": [], "count": 0 }, "parented": true, "embed_url": "https://chart-studio.plotly.com/~SriniNeru/57.embed", "fid": "SriniNeru:57", "filename": "Plot 57", "filetype": "plot", "img_url": "https://storage.googleapis.com/plotly-prod-images/SriniNeru/57/9_1TQA2SS2NLU4FGTAW0OF5FCTQXV4QR.png", "image_urls": { "default": "https://storage.googleapis.com/plotly-prod-images/SriniNeru/57/2_J7N3FBRGT0FAEEY7SNRXB3KNSW49B5.png", "block-thumb": "https://storage.googleapis.com/plotly-prod-images/SriniNeru/57/8_IHFDX7321GMN4SAWSICXJ12RZI5V6Q.png", "list-thumb": "https://storage.googleapis.com/plotly-prod-images/SriniNeru/57/9_1TQA2SS2NLU4FGTAW0OF5FCTQXV4QR.png" }, "api_urls": { "files": "https://api.plotly.com/v2/files/SriniNeru:57", "plots": "https://api.plotly.com/v2/plots/SriniNeru:57", "parent": "https://api.plotly.com/v2/folders/home?user=SriniNeru" }, "owner": "SriniNeru", "parent": -1, "preview": "", "referencers": [], "references": [], "title": "", "views": 2, "web_url": "https://chart-studio.plotly.com/~SriniNeru/57/", "world_readable": true, "date_modified": "2024-04-16T20:44:01.030Z", "stars": { "results": [], "count": 0 }, "collaborators": { "results": [], "count": 0 }, "subfolder_count": null, "refresh_interval": null, "organize_view_url": "https://chart-studio.plotly.com/~SriniNeru/57/", "current_user_permission": "read", "is_theme": null, "is_template": false, "autosize": true, "caption": "", "figure": { "data": [ { "meta": { "columnNames": { "x": "A", "y": "B" } }, "mode": "lines", "name": "serial 0.01", "type": "scatter", "xsrc": "SriniNeru:56:8b52ee", "ysrc": "SriniNeru:56:e5cedc" }, { "meta": { "columnNames": { "x": "A", "y": "C" } }, "mode": "lines", "name": "p = 2 threads", "type": "scatter", "xsrc": "SriniNeru:56:8b52ee", "ysrc": "SriniNeru:56:d8d433", "stackgroup": null }, { "meta": { "columnNames": { "x": "A", "y": "D" } }, "mode": "lines", "name": "p = 4 threads", "type": "scatter", "xsrc": "SriniNeru:56:8b52ee", "ysrc": "SriniNeru:56:d6d287", "stackgroup": null }, { "meta": { "columnNames": { "x": "A", "y": "E" } }, "mode": "lines", "name": "p = 8 threads", "type": "scatter", "xsrc": "SriniNeru:56:8b52ee", "ysrc": "SriniNeru:56:909358", "stackgroup": null } ], "frames": [], "layout": { "title": { "text": "PHI vs X (y = 0) Jacobi" }, "xaxis": { "type": "linear", "range": [ -1, 1.0000000000000018 ], "title": { "text": "x" }, "autorange": true }, "yaxis": { "type": "linear", "range": [ -0.007423555555555555, 0.14104755555555554 ], "title": { "text": "phi" }, "autorange": true }, "autosize": true, "template": { "data": { "bar": [ { "type": "bar", "marker": { "colorbar": { "ticks": "", "outlinewidth": 0 } } } ], "table": [ { "type": "table", "cells": { "fill": { "color": "#EBF0F8" }, "line": { "color": "white" } }, "header": { "fill": { "color": "#C8D4E3" }, "line": { "color": "white" } } } ], "carpet": [ { "type": "carpet", "aaxis": { "gridcolor": "#C8D4E3", "linecolor": "#C8D4E3", "endlinecolor": "#2a3f5f", "minorgridcolor": "#C8D4E3", "startlinecolor": "#2a3f5f" }, "baxis": { "gridcolor": "#C8D4E3", "linecolor": "#C8D4E3", "endlinecolor": "#2a3f5f", "minorgridcolor": "#C8D4E3", "startlinecolor": "#2a3f5f" } } ], "mesh3d": [ { "type": "mesh3d", "colorbar": { "ticks": "", "outlinewidth": 0 } } ], "contour": [ { "type": "contour", "colorbar": { "ticks": "", "outlinewidth": 0 }, "autocolorscale": true } ], "heatmap": [ { "type": "heatmap", "colorbar": { "ticks": "", "outlinewidth": 0 }, "autocolorscale": true } ], "scatter": [ { "type": "scatter", "marker": { "colorbar": { "ticks": "", "outlinewidth": 0 } } } ], "surface": [ { "type": "surface", "colorbar": { "ticks": "", "outlinewidth": 0 } } ], "heatmapgl": [ { "type": "heatmapgl", "colorbar": { "ticks": "", "outlinewidth": 0 } } ], "histogram": [ { "type": "histogram", "marker": { "colorbar": { "ticks": "", "outlinewidth": 0 } } } ], "parcoords": [ { "line": { "colorbar": { "ticks": "", "outlinewidth": 0 } }, "type": "parcoords" } ], "scatter3d": [ { "type": "scatter3d", "marker": { "colorbar": { "ticks": "", "outlinewidth": 0 } } } ], "scattergl": [ { "type": "scattergl", "marker": { "colorbar": { "ticks": "", "outlinewidth": 0 } } } ], "choropleth": [ { "type": "choropleth", "colorbar": { "ticks": "", "outlinewidth": 0 } } ], "scattergeo": [ { "type": "scattergeo", "marker": { "colorbar": { "ticks": "", "outlinewidth": 0 } } } ], "histogram2d": [ { "type": "histogram2d", "colorbar": { "ticks": "", "outlinewidth": 0 }, "autocolorscale": true } ], "scatterpolar": [ { "type": "scatterpolar", "marker": { "colorbar": { "ticks": "", "outlinewidth": 0 } } } ], "contourcarpet": [ { "type": "contourcarpet", "colorbar": { "ticks": "", "outlinewidth": 0 } } ], "scattercarpet": [ { "type": "scattercarpet", "marker": { "colorbar": { "ticks": "", "outlinewidth": 0 } } } ], "scattermapbox": [ { "type": "scattermapbox", "marker": { "colorbar": { "ticks": "", "outlinewidth": 0 } } } ], "scatterpolargl": [ { "type": "scatterpolargl", "marker": { "colorbar": { "ticks": "", "outlinewidth": 0 } } } ], "scatterternary": [ { "type": "scatterternary", "marker": { "colorbar": { "ticks": "", "outlinewidth": 0 } } } ], "histogram2dcontour": [ { "type": "histogram2dcontour", "colorbar": { "ticks": "", "outlinewidth": 0 }, "autocolorscale": true } ] }, "layout": { "geo": { "bgcolor": "white", "showland": true, "lakecolor": "white", "landcolor": "white", "showlakes": true, "subunitcolor": "#C8D4E3" }, "font": { "color": "#2a3f5f" }, "polar": { "bgcolor": "white", "radialaxis": { "ticks": "", "gridcolor": "#EBF0F8", "linecolor": "#EBF0F8" }, "angularaxis": { "ticks": "", "gridcolor": "#EBF0F8", "linecolor": "#EBF0F8" } }, "scene": { "xaxis": { "ticks": "", "gridcolor": "#DFE8F3", "gridwidth": 2, "linecolor": "#EBF0F8", "zerolinecolor": "#EBF0F8", "showbackground": true, "backgroundcolor": "white" }, "yaxis": { "ticks": "", "gridcolor": "#DFE8F3", "gridwidth": 2, "linecolor": "#EBF0F8", "zerolinecolor": "#EBF0F8", "showbackground": true, "backgroundcolor": "white" }, "zaxis": { "ticks": "", "gridcolor": "#DFE8F3", "gridwidth": 2, "linecolor": "#EBF0F8", "zerolinecolor": "#EBF0F8", "showbackground": true, "backgroundcolor": "white" } }, "title": { "x": 0.05 }, "xaxis": { "ticks": "", "gridcolor": "#EBF0F8", "linecolor": "#EBF0F8", "automargin": true, "zerolinecolor": "#EBF0F8", "zerolinewidth": 2 }, "yaxis": { "ticks": "", "gridcolor": "#EBF0F8", "linecolor": "#EBF0F8", "automargin": true, "zerolinecolor": "#EBF0F8", "zerolinewidth": 2 }, "ternary": { "aaxis": { "ticks": "", "gridcolor": "#DFE8F3", "linecolor": "#A2B1C6" }, "baxis": { "ticks": "", "gridcolor": "#DFE8F3", "linecolor": "#A2B1C6" }, "caxis": { "ticks": "", "gridcolor": "#DFE8F3", "linecolor": "#A2B1C6" }, "bgcolor": "white" }, "colorway": [ "#636efa", "#EF553B", "#00cc96", "#ab63fa", "#19d3f3", "#e763fa", "#fecb52", "#ffa15a", "#ff6692", "#b6e880" ], "hovermode": "closest", "colorscale": { "diverging": [ [ 0, "#8e0152" ], [ 0.1, "#c51b7d" ], [ 0.2, "#de77ae" ], [ 0.3, "#f1b6da" ], [ 0.4, "#fde0ef" ], [ 0.5, "#f7f7f7" ], [ 0.6, "#e6f5d0" ], [ 0.7, "#b8e186" ], [ 0.8, "#7fbc41" ], [ 0.9, "#4d9221" ], [ 1, "#276419" ] ], "sequential": [ [ 0, "#0508b8" ], [ 0.0893854748603352, "#1910d8" ], [ 0.1787709497206704, "#3c19f0" ], [ 0.2681564245810056, "#6b1cfb" ], [ 0.3575418994413408, "#981cfd" ], [ 0.44692737430167595, "#bf1cfd" ], [ 0.5363128491620112, "#dd2bfd" ], [ 0.6256983240223464, "#f246fe" ], [ 0.7150837988826816, "#fc67fd" ], [ 0.8044692737430168, "#fe88fc" ], [ 0.8938547486033519, "#fea5fd" ], [ 0.9832402234636871, "#febefe" ], [ 1, "#fec3fe" ] ], "sequentialminus": [ [ 0, "#0508b8" ], [ 0.0893854748603352, "#1910d8" ], [ 0.1787709497206704, "#3c19f0" ], [ 0.2681564245810056, "#6b1cfb" ], [ 0.3575418994413408, "#981cfd" ], [ 0.44692737430167595, "#bf1cfd" ], [ 0.5363128491620112, "#dd2bfd" ], [ 0.6256983240223464, "#f246fe" ], [ 0.7150837988826816, "#fc67fd" ], [ 0.8044692737430168, "#fe88fc" ], [ 0.8938547486033519, "#fea5fd" ], [ 0.9832402234636871, "#febefe" ], [ 1, "#fec3fe" ] ] }, "plot_bgcolor": "white", "paper_bgcolor": "white", "shapedefaults": { "line": { "width": 0 }, "opacity": 0.4, "fillcolor": "#506784" }, "annotationdefaults": { "arrowhead": 0, "arrowcolor": "#506784", "arrowwidth": 1 } }, "themeRef": "PLOTLY_WHITE" } } }, "height": null, "width": null, "user": { "profile_url": "https://chart-studio.plotly.com/~SriniNeru", "avatar_url": "https://storage.googleapis.com/plotly-prod-profiles/77.jpg", "background_url": "https://storage.googleapis.com/plotly-prod-profiles/bg-7.jpg", "bio": "", "nickname": "", "website": "", "stream_tokens": null, "feature_set_id": null, "csrf_token": null, "date_joined": "2022-10-04 05:08:13", "mapbox_access_tokens": null, "has_password": null, "username": "SriniNeru", "email": null, "is_active": null, "readonly": null, "is_dash_creator": null, "dash_created_count": null, "is_chart_creator": null, "charts_created_count": null } }, { "creation_time": "2024-04-16T17:40:26.876040Z", "comments": { "results": [], "count": 0 }, "parented": true, "embed_url": "https://chart-studio.plotly.com/~sauravshaw.d.coolman/1.embed", "fid": "sauravshaw.d.coolman:1", "filename": "Plot 1", "filetype": "plot", "img_url": "https://storage.googleapis.com/plotly-prod-images/sauravshaw.d.coolman/1/9_CV3092ML0VTSRMSKH1F7JRMTK60WDM.png", "image_urls": { "default": "https://storage.googleapis.com/plotly-prod-images/sauravshaw.d.coolman/1/2_GYYR1ZMZB79XZOMD348NI6YL327GCA.png", "block-thumb": "https://storage.googleapis.com/plotly-prod-images/sauravshaw.d.coolman/1/8_27ICE1RM9GXQ9W3L5MBLSJG4JZ2OSJ.png", "list-thumb": "https://storage.googleapis.com/plotly-prod-images/sauravshaw.d.coolman/1/9_CV3092ML0VTSRMSKH1F7JRMTK60WDM.png" }, "api_urls": { "files": "https://api.plotly.com/v2/files/sauravshaw.d.coolman:1", "plots": "https://api.plotly.com/v2/plots/sauravshaw.d.coolman:1", "parent": "https://api.plotly.com/v2/folders/home?user=sauravshaw.d.coolman" }, "owner": "sauravshaw.d.coolman", "parent": -1, "preview": "", "referencers": [], "references": [], "title": "", "views": 1, "web_url": "https://chart-studio.plotly.com/~sauravshaw.d.coolman/1/", "world_readable": true, "date_modified": "2024-04-16T18:02:55.887Z", "stars": { "results": [], "count": 0 }, "collaborators": { "results": [], "count": 0 }, "subfolder_count": null, "refresh_interval": null, "organize_view_url": "https://chart-studio.plotly.com/~sauravshaw.d.coolman/1/", "current_user_permission": "read", "is_theme": null, "is_template": false, "autosize": true, "caption": "", "figure": { "data": [ { "meta": { "columnNames": { "x": "C", "y": "A" } }, "mode": "lines", "name": "3 Servers", "type": "scatter", "xsrc": "sauravshaw.d.coolman:0:f5ac72", "ysrc": "sauravshaw.d.coolman:0:baa58d", "xaxis": "x", "orientation": "v" }, { "meta": { "columnNames": { "x": "C", "y": "E" } }, "mode": "lines", "name": "4 Servers", "type": "scatter", "xsrc": "sauravshaw.d.coolman:0:f5ac72", "ysrc": "sauravshaw.d.coolman:0:65c3b8" }, { "mode": "lines", "type": "scatter", "stackgroup": null } ], "frames": [], "layout": { "scene": { "aspectmode": "auto", "aspectratio": { "x": 1, "y": 1, "z": 1 } }, "title": { "text": "3 Servers Number of Threads vs Average latency" }, "xaxis": { "type": "linear", "range": [ 1, 128 ], "title": { "text": "Number Of Threads" }, "autorange": true }, "yaxis": { "type": "linear", "range": [ -46.12361111111112, 993.9286111111112 ], "title": { "text": "Average Latency" }, "autorange": true }, "autosize": true, "template": { "data": { "bar": [ { "type": "bar", "marker": { "colorbar": { "ticks": "", "outlinewidth": 0 } } } ], "table": [ { "type": "table", "cells": { "fill": { "color": "#EBF0F8" }, "line": { "color": "white" } }, "header": { "fill": { "color": "#C8D4E3" }, "line": { "color": "white" } } } ], "carpet": [ { "type": "carpet", "aaxis": { "gridcolor": "#C8D4E3", "linecolor": "#C8D4E3", "endlinecolor": "#2a3f5f", "minorgridcolor": "#C8D4E3", "startlinecolor": "#2a3f5f" }, "baxis": { "gridcolor": "#C8D4E3", "linecolor": "#C8D4E3", "endlinecolor": "#2a3f5f", "minorgridcolor": "#C8D4E3", "startlinecolor": "#2a3f5f" } } ], "mesh3d": [ { "type": "mesh3d", "colorbar": { "ticks": "", "outlinewidth": 0 } } ], "contour": [ { "type": "contour", "colorbar": { "ticks": "", "outlinewidth": 0 }, "autocolorscale": true } ], "heatmap": [ { "type": "heatmap", "colorbar": { "ticks": "", "outlinewidth": 0 }, "autocolorscale": true } ], "scatter": [ { "type": "scatter", "marker": { "colorbar": { "ticks": "", "outlinewidth": 0 } } } ], "surface": [ { "type": "surface", "colorbar": { "ticks": "", "outlinewidth": 0 } } ], "heatmapgl": [ { "type": "heatmapgl", "colorbar": { "ticks": "", "outlinewidth": 0 } } ], "histogram": [ { "type": "histogram", "marker": { "colorbar": { "ticks": "", "outlinewidth": 0 } } } ], "parcoords": [ { "line": { "colorbar": { "ticks": "", "outlinewidth": 0 } }, "type": "parcoords" } ], "scatter3d": [ { "type": "scatter3d", "marker": { "colorbar": { "ticks": "", "outlinewidth": 0 } } } ], "scattergl": [ { "type": "scattergl", "marker": { "colorbar": { "ticks": "", "outlinewidth": 0 } } } ], "choropleth": [ { "type": "choropleth", "colorbar": { "ticks": "", "outlinewidth": 0 } } ], "scattergeo": [ { "type": "scattergeo", "marker": { "colorbar": { "ticks": "", "outlinewidth": 0 } } } ], "histogram2d": [ { "type": "histogram2d", "colorbar": { "ticks": "", "outlinewidth": 0 }, "autocolorscale": true } ], "scatterpolar": [ { "type": "scatterpolar", "marker": { "colorbar": { "ticks": "", "outlinewidth": 0 } } } ], "contourcarpet": [ { "type": "contourcarpet", "colorbar": { "ticks": "", "outlinewidth": 0 } } ], "scattercarpet": [ { "type": "scattercarpet", "marker": { "colorbar": { "ticks": "", "outlinewidth": 0 } } } ], "scattermapbox": [ { "type": "scattermapbox", "marker": { "colorbar": { "ticks": "", "outlinewidth": 0 } } } ], "scatterpolargl": [ { "type": "scatterpolargl", "marker": { "colorbar": { "ticks": "", "outlinewidth": 0 } } } ], "scatterternary": [ { "type": "scatterternary", "marker": { "colorbar": { "ticks": "", "outlinewidth": 0 } } } ], "histogram2dcontour": [ { "type": "histogram2dcontour", "colorbar": { "ticks": "", "outlinewidth": 0 }, "autocolorscale": true } ] }, "layout": { "geo": { "bgcolor": "white", "showland": true, "lakecolor": "white", "landcolor": "white", "showlakes": true, "subunitcolor": "#C8D4E3" }, "font": { "color": "#2a3f5f" }, "polar": { "bgcolor": "white", "radialaxis": { "ticks": "", "gridcolor": "#EBF0F8", "linecolor": "#EBF0F8" }, "angularaxis": { "ticks": "", "gridcolor": "#EBF0F8", "linecolor": "#EBF0F8" } }, "scene": { "xaxis": { "ticks": "", "gridcolor": "#DFE8F3", "gridwidth": 2, "linecolor": "#EBF0F8", "zerolinecolor": "#EBF0F8", "showbackground": true, "backgroundcolor": "white" }, "yaxis": { "ticks": "", "gridcolor": "#DFE8F3", "gridwidth": 2, "linecolor": "#EBF0F8", "zerolinecolor": "#EBF0F8", "showbackground": true, "backgroundcolor": "white" }, "zaxis": { "ticks": "", "gridcolor": "#DFE8F3", "gridwidth": 2, "linecolor": "#EBF0F8", "zerolinecolor": "#EBF0F8", "showbackground": true, "backgroundcolor": "white" } }, "title": { "x": 0.05 }, "xaxis": { "ticks": "", "gridcolor": "#EBF0F8", "linecolor": "#EBF0F8", "automargin": true, "zerolinecolor": "#EBF0F8", "zerolinewidth": 2 }, "yaxis": { "ticks": "", "gridcolor": "#EBF0F8", "linecolor": "#EBF0F8", "automargin": true, "zerolinecolor": "#EBF0F8", "zerolinewidth": 2 }, "ternary": { "aaxis": { "ticks": "", "gridcolor": "#DFE8F3", "linecolor": "#A2B1C6" }, "baxis": { "ticks": "", "gridcolor": "#DFE8F3", "linecolor": "#A2B1C6" }, "caxis": { "ticks": "", "gridcolor": "#DFE8F3", "linecolor": "#A2B1C6" }, "bgcolor": "white" }, "colorway": [ "#636efa", "#EF553B", "#00cc96", "#ab63fa", "#19d3f3", "#e763fa", "#fecb52", "#ffa15a", "#ff6692", "#b6e880" ], "hovermode": "closest", "colorscale": { "diverging": [ [ 0, "#8e0152" ], [ 0.1, "#c51b7d" ], [ 0.2, "#de77ae" ], [ 0.3, "#f1b6da" ], [ 0.4, "#fde0ef" ], [ 0.5, "#f7f7f7" ], [ 0.6, "#e6f5d0" ], [ 0.7, "#b8e186" ], [ 0.8, "#7fbc41" ], [ 0.9, "#4d9221" ], [ 1, "#276419" ] ], "sequential": [ [ 0, "#0508b8" ], [ 0.0893854748603352, "#1910d8" ], [ 0.1787709497206704, "#3c19f0" ], [ 0.2681564245810056, "#6b1cfb" ], [ 0.3575418994413408, "#981cfd" ], [ 0.44692737430167595, "#bf1cfd" ], [ 0.5363128491620112, "#dd2bfd" ], [ 0.6256983240223464, "#f246fe" ], [ 0.7150837988826816, "#fc67fd" ], [ 0.8044692737430168, "#fe88fc" ], [ 0.8938547486033519, "#fea5fd" ], [ 0.9832402234636871, "#febefe" ], [ 1, "#fec3fe" ] ], "sequentialminus": [ [ 0, "#0508b8" ], [ 0.0893854748603352, "#1910d8" ], [ 0.1787709497206704, "#3c19f0" ], [ 0.2681564245810056, "#6b1cfb" ], [ 0.3575418994413408, "#981cfd" ], [ 0.44692737430167595, "#bf1cfd" ], [ 0.5363128491620112, "#dd2bfd" ], [ 0.6256983240223464, "#f246fe" ], [ 0.7150837988826816, "#fc67fd" ], [ 0.8044692737430168, "#fe88fc" ], [ 0.8938547486033519, "#fea5fd" ], [ 0.9832402234636871, "#febefe" ], [ 1, "#fec3fe" ] ] }, "plot_bgcolor": "white", "paper_bgcolor": "white", "shapedefaults": { "line": { "width": 0 }, "opacity": 0.4, "fillcolor": "#506784" }, "annotationdefaults": { "arrowhead": 0, "arrowcolor": "#506784", "arrowwidth": 1 } }, "themeRef": "PLOTLY_WHITE" } } }, "height": null, "width": null, "user": { "profile_url": "https://chart-studio.plotly.com/~sauravshaw.d.coolman", "avatar_url": "https://storage.googleapis.com/plotly-prod-profiles/27.jpg", "background_url": "https://storage.googleapis.com/plotly-prod-profiles/bg-2.jpg", "bio": "", "nickname": "", "website": "", "stream_tokens": null, "feature_set_id": null, "csrf_token": null, "date_joined": "2024-04-16 17:40:04", "mapbox_access_tokens": null, "has_password": null, "username": "sauravshaw.d.coolman", "email": null, "is_active": null, "readonly": null, "is_dash_creator": null, "dash_created_count": null, "is_chart_creator": null, "charts_created_count": null } }, { "creation_time": "2024-04-16T17:29:33.777679Z", "comments": { "results": [], "count": 0 }, "parented": true, "embed_url": "https://chart-studio.plotly.com/~loulang/7.embed", "fid": "loulang:7", "filename": "Účast podle zemí", "filetype": "plot", "img_url": "https://storage.googleapis.com/plotly-prod-images/loulang/7/9_9OUX9ZXH3C5QLBLAK61T3H7IILEP13.png", "image_urls": { "default": "https://storage.googleapis.com/plotly-prod-images/loulang/7/2_SAV4ZEDX7KUBNCGQ6G6GJ1I4KRBL6C.png", "block-thumb": "https://storage.googleapis.com/plotly-prod-images/loulang/7/8_1WCKSG8K93XCAZAN9V9MWHPLDQUOW5.png", "list-thumb": "https://storage.googleapis.com/plotly-prod-images/loulang/7/9_9OUX9ZXH3C5QLBLAK61T3H7IILEP13.png" }, "api_urls": { "files": "https://api.plotly.com/v2/files/loulang:7", "plots": "https://api.plotly.com/v2/plots/loulang:7", "parent": "https://api.plotly.com/v2/folders/home?user=loulang" }, "owner": "loulang", "parent": -1, "preview": "", "referencers": [], "references": [], "title": "", "views": 2, "web_url": "https://chart-studio.plotly.com/~loulang/7/", "world_readable": true, "date_modified": "2024-04-16T17:29:33.790Z", "stars": { "results": [], "count": 0 }, "collaborators": { "results": [], "count": 0 }, "subfolder_count": null, "refresh_interval": null, "organize_view_url": "https://chart-studio.plotly.com/~loulang/7/", "current_user_permission": "read", "is_theme": null, "is_template": false, "autosize": true, "caption": "", "figure": { "data": [ { "meta": { "columnNames": { "z": "Účast", "locations": "Země" } }, "mode": "markers", "type": "choropleth", "zsrc": "loulang:6:4e9d77", "colorbar": { "title": { "text": "Účast" } }, "locationmode": "country names", "locationssrc": "loulang:6:7502e6" } ], "frames": [], "layout": { "geo": { "center": { "lat": 49.33429350068318, "lon": 19.37278836607339 }, "fitbounds": false, "projection": { "scale": 4.708724868021859, "rotation": { "lon": 19.37278836607339 } } }, "title": { "font": { "size": 22, "family": "Arial" }, "text": "<b>Počet účastí podle zemí</b>" }, "xaxis": { "range": [ -1, 6 ], "autorange": true }, "yaxis": { "range": [ -1, 4 ], "autorange": true }, "margin": { "b": 50 }, "autosize": true, "template": { "data": { "bar": [ { "type": "bar", "marker": { "colorbar": { "ticks": "outside", "ticklen": 8, "tickcolor": "rgb(36,36,36)", "tickwidth": 2, "outlinewidth": 0 } } } ], "table": [ { "type": "table", "cells": { "fill": { "color": "rgb(231,231,240)" }, "line": { "color": "white" } }, "header": { "fill": { "color": "rgb(183,183,191)" }, "line": { "color": "white" } } } ], "carpet": [ { "type": "carpet", "aaxis": { "gridcolor": "white", "linecolor": "white", "endlinecolor": "rgb(36,36,36)", "minorgridcolor": "white", "startlinecolor": "rgb(36,36,36)" }, "baxis": { "gridcolor": "white", "linecolor": "white", "endlinecolor": "rgb(36,36,36)", "minorgridcolor": "white", "startlinecolor": "rgb(36,36,36)" } } ], "mesh3d": [ { "type": "mesh3d", "colorbar": { "ticks": "outside", "ticklen": 8, "tickcolor": "rgb(36,36,36)", "tickwidth": 2, "outlinewidth": 0 } } ], "contour": [ { "type": "contour", "colorbar": { "ticks": "outside", "ticklen": 8, "tickcolor": "rgb(36,36,36)", "tickwidth": 2, "outlinewidth": 0 }, "autocolorscale": true } ], "heatmap": [ { "type": "heatmap", "colorbar": { "ticks": "outside", "ticklen": 8, "tickcolor": "rgb(36,36,36)", "tickwidth": 2, "outlinewidth": 0 }, "autocolorscale": true } ], "scatter": [ { "type": "scatter", "marker": { "colorbar": { "ticks": "outside", "ticklen": 8, "tickcolor": "rgb(36,36,36)", "tickwidth": 2, "outlinewidth": 0 } } } ], "surface": [ { "type": "surface", "colorbar": { "ticks": "outside", "ticklen": 8, "tickcolor": "rgb(36,36,36)", "tickwidth": 2, "outlinewidth": 0 } } ], "heatmapgl": [ { "type": "heatmapgl", "colorbar": { "ticks": "outside", "ticklen": 8, "tickcolor": "rgb(36,36,36)", "tickwidth": 2, "outlinewidth": 0 } } ], "histogram": [ { "type": "histogram", "marker": { "colorbar": { "ticks": "outside", "ticklen": 8, "tickcolor": "rgb(36,36,36)", "tickwidth": 2, "outlinewidth": 0 } } } ], "parcoords": [ { "line": { "colorbar": { "ticks": "outside", "ticklen": 8, "tickcolor": "rgb(36,36,36)", "tickwidth": 2, "outlinewidth": 0 } }, "type": "parcoords" } ], "scatter3d": [ { "type": "scatter3d", "marker": { "colorbar": { "ticks": "outside", "ticklen": 8, "tickcolor": "rgb(36,36,36)", "tickwidth": 2, "outlinewidth": 0 } } } ], "scattergl": [ { "type": "scattergl", "marker": { "colorbar": { "ticks": "outside", "ticklen": 8, "tickcolor": "rgb(36,36,36)", "tickwidth": 2, "outlinewidth": 0 } } } ], "choropleth": [ { "type": "choropleth", "colorbar": { "ticks": "outside", "ticklen": 8, "tickcolor": "rgb(36,36,36)", "tickwidth": 2, "outlinewidth": 0 } } ], "scattergeo": [ { "type": "scattergeo", "marker": { "colorbar": { "ticks": "outside", "ticklen": 8, "tickcolor": "rgb(36,36,36)", "tickwidth": 2, "outlinewidth": 0 } } } ], "histogram2d": [ { "type": "histogram2d", "colorbar": { "ticks": "outside", "ticklen": 8, "tickcolor": "rgb(36,36,36)", "tickwidth": 2, "outlinewidth": 0 }, "autocolorscale": true } ], "scatterpolar": [ { "type": "scatterpolar", "marker": { "colorbar": { "ticks": "outside", "ticklen": 8, "tickcolor": "rgb(36,36,36)", "tickwidth": 2, "outlinewidth": 0 } } } ], "contourcarpet": [ { "type": "contourcarpet", "colorbar": { "ticks": "outside", "ticklen": 8, "tickcolor": "rgb(36,36,36)", "tickwidth": 2, "outlinewidth": 0 } } ], "scattercarpet": [ { "type": "scattercarpet", "marker": { "colorbar": { "ticks": "outside", "ticklen": 8, "tickcolor": "rgb(36,36,36)", "tickwidth": 2, "outlinewidth": 0 } } } ], "scattermapbox": [ { "type": "scattermapbox", "marker": { "colorbar": { "ticks": "outside", "ticklen": 8, "tickcolor": "rgb(36,36,36)", "tickwidth": 2, "outlinewidth": 0 } } } ], "scatterpolargl": [ { "type": "scatterpolargl", "marker": { "colorbar": { "ticks": "outside", "ticklen": 8, "tickcolor": "rgb(36,36,36)", "tickwidth": 2, "outlinewidth": 0 } } } ], "scatterternary": [ { "type": "scatterternary", "marker": { "colorbar": { "ticks": "outside", "ticklen": 8, "tickcolor": "rgb(36,36,36)", "tickwidth": 2, "outlinewidth": 0 } } } ], "histogram2dcontour": [ { "type": "histogram2dcontour", "colorbar": { "ticks": "outside", "ticklen": 8, "tickcolor": "rgb(36,36,36)", "tickwidth": 2, "outlinewidth": 0 }, "autocolorscale": true } ] }, "layout": { "geo": { "bgcolor": "white", "showland": true, "lakecolor": "white", "landcolor": "rgb(234,234,242)", "showlakes": true, "subunitcolor": "white" }, "font": { "color": "rgb(36,36,36)" }, "polar": { "bgcolor": "rgb(234,234,242)", "radialaxis": { "ticks": "", "showgrid": true, "gridcolor": "white", "linecolor": "white" }, "angularaxis": { "ticks": "", "showgrid": true, "gridcolor": "white", "linecolor": "white" } }, "scene": { "xaxis": { "ticks": "", "showgrid": true, "gridcolor": "white", "gridwidth": 2, "linecolor": "white", "zerolinecolor": "white", "showbackground": true, "backgroundcolor": "rgb(234,234,242)" }, "yaxis": { "ticks": "", "showgrid": true, "gridcolor": "white", "gridwidth": 2, "linecolor": "white", "zerolinecolor": "white", "showbackground": true, "backgroundcolor": "rgb(234,234,242)" }, "zaxis": { "ticks": "", "showgrid": true, "gridcolor": "white", "gridwidth": 2, "linecolor": "white", "zerolinecolor": "white", "showbackground": true, "backgroundcolor": "rgb(234,234,242)" } }, "xaxis": { "ticks": "", "showgrid": true, "gridcolor": "white", "linecolor": "white", "automargin": true, "zerolinecolor": "white" }, "yaxis": { "ticks": "", "showgrid": true, "gridcolor": "white", "linecolor": "white", "automargin": true, "zerolinecolor": "white" }, "ternary": { "aaxis": { "ticks": "", "showgrid": true, "gridcolor": "white", "linecolor": "white" }, "baxis": { "ticks": "", "showgrid": true, "gridcolor": "white", "linecolor": "white" }, "caxis": { "ticks": "", "showgrid": true, "gridcolor": "white", "linecolor": "white" }, "bgcolor": "rgb(234,234,242)" }, "colorway": [ "rgb(76,114,176)", "rgb(221,132,82)", "rgb(85,168,104)", "rgb(196,78,82)", "rgb(129,114,179)", "rgb(147,120,96)", "rgb(218,139,195)", "rgb(140,140,140)", "rgb(204,185,116)", "rgb(100,181,205)" ], "hovermode": "closest", "colorscale": { "diverging": [ [ 0, "#67001f" ], [ 0.1, "#b2182b" ], [ 0.2, "#d6604d" ], [ 0.3, "#f4a582" ], [ 0.4, "#fddbc7" ], [ 0.5, "#f7f7f7" ], [ 0.6, "#d1e5f0" ], [ 0.7, "#92c5de" ], [ 0.8, "#4393c3" ], [ 0.9, "#2166ac" ], [ 1, "#053061" ] ], "sequential": [ [ 0, "rgb(2,4,25)" ], [ 0.06274509803921569, "rgb(24,15,41)" ], [ 0.12549019607843137, "rgb(47,23,57)" ], [ 0.18823529411764706, "rgb(71,28,72)" ], [ 0.25098039215686274, "rgb(97,30,82)" ], [ 0.3137254901960784, "rgb(123,30,89)" ], [ 0.3764705882352941, "rgb(150,27,91)" ], [ 0.4392156862745098, "rgb(177,22,88)" ], [ 0.5019607843137255, "rgb(203,26,79)" ], [ 0.5647058823529412, "rgb(223,47,67)" ], [ 0.6274509803921569, "rgb(236,76,61)" ], [ 0.6901960784313725, "rgb(242,107,73)" ], [ 0.7529411764705882, "rgb(244,135,95)" ], [ 0.8156862745098039, "rgb(245,162,122)" ], [ 0.8784313725490196, "rgb(246,188,153)" ], [ 0.9411764705882353, "rgb(247,212,187)" ], [ 1, "rgb(250,234,220)" ] ], "sequentialminus": [ [ 0, "rgb(2,4,25)" ], [ 0.06274509803921569, "rgb(24,15,41)" ], [ 0.12549019607843137, "rgb(47,23,57)" ], [ 0.18823529411764706, "rgb(71,28,72)" ], [ 0.25098039215686274, "rgb(97,30,82)" ], [ 0.3137254901960784, "rgb(123,30,89)" ], [ 0.3764705882352941, "rgb(150,27,91)" ], [ 0.4392156862745098, "rgb(177,22,88)" ], [ 0.5019607843137255, "rgb(203,26,79)" ], [ 0.5647058823529412, "rgb(223,47,67)" ], [ 0.6274509803921569, "rgb(236,76,61)" ], [ 0.6901960784313725, "rgb(242,107,73)" ], [ 0.7529411764705882, "rgb(244,135,95)" ], [ 0.8156862745098039, "rgb(245,162,122)" ], [ 0.8784313725490196, "rgb(246,188,153)" ], [ 0.9411764705882353, "rgb(247,212,187)" ], [ 1, "rgb(250,234,220)" ] ] }, "plot_bgcolor": "rgb(234,234,242)", "paper_bgcolor": "white", "shapedefaults": { "line": { "width": 0 }, "opacity": 0.5, "fillcolor": "rgb(67,103,167)" }, "annotationdefaults": { "arrowcolor": "rgb(67,103,167)" } }, "themeRef": "SEABORN" }, "colorscale": { "sequential": [ [ 0, "#fff7ec" ], [ 0.125, "#fee8c8" ], [ 0.25, "#fdd49e" ], [ 0.375, "#fdbb84" ], [ 0.5, "#fc8d59" ], [ 0.625, "#ef6548" ], [ 0.75, "#d7301f" ], [ 0.875, "#b30000" ], [ 1, "#7f0000" ] ], "sequentialminus": [ [ 0, "#020419" ], [ 0.0625, "#180f29" ], [ 0.125, "#2f1739" ], [ 0.1875, "#471c48" ], [ 0.25, "#611e52" ], [ 0.3125, "#7b1e59" ], [ 0.375, "#961b5b" ], [ 0.4375, "#b11658" ], [ 0.5, "#cb1a4f" ], [ 0.5625, "#df2f43" ], [ 0.625, "#ec4c3d" ], [ 0.6875, "#f26b49" ], [ 0.75, "#f4875f" ], [ 0.8125, "#f5a27a" ], [ 0.875, "#f6bc99" ], [ 0.9375, "#f7d4bb" ], [ 1, "#faeadc" ] ] } } }, "height": null, "width": null, "user": { "profile_url": "https://chart-studio.plotly.com/~loulang", "avatar_url": "https://storage.googleapis.com/plotly-prod-profiles/85.jpg", "background_url": "https://storage.googleapis.com/plotly-prod-profiles/bg-11.jpg", "bio": "", "nickname": "", "website": "", "stream_tokens": null, "feature_set_id": null, "csrf_token": null, "date_joined": "2024-04-16 07:25:11", "mapbox_access_tokens": null, "has_password": null, "username": "loulang", "email": null, "is_active": null, "readonly": null, "is_dash_creator": null, "dash_created_count": null, "is_chart_creator": null, "charts_created_count": null } }, { "creation_time": "2024-04-16T17:16:42.691865Z", "comments": { "results": [], "count": 0 }, "parented": true, "embed_url": "https://chart-studio.plotly.com/~Chuanyun/15.embed", "fid": "Chuanyun:15", "filename": "Number_of_Studios_by_Identity", "filetype": "plot", "img_url": "https://storage.googleapis.com/plotly-prod-images/Chuanyun/15/9_GBFCZWDW2X1IWDBEKBHDM2MYRZTEK8.png", "image_urls": { "default": "https://storage.googleapis.com/plotly-prod-images/Chuanyun/15/2_HSMCUPSVDM0FA95VQYHK5HT54W52QL.png", "block-thumb": "https://storage.googleapis.com/plotly-prod-images/Chuanyun/15/8_VPOCQZ2Y9O77OXLIUC08FPNEKTHRQ2.png", "list-thumb": "https://storage.googleapis.com/plotly-prod-images/Chuanyun/15/9_GBFCZWDW2X1IWDBEKBHDM2MYRZTEK8.png" }, "api_urls": { "files": "https://api.plotly.com/v2/files/Chuanyun:15", "plots": "https://api.plotly.com/v2/plots/Chuanyun:15", "parent": "https://api.plotly.com/v2/folders/home?user=Chuanyun" }, "owner": "Chuanyun", "parent": -1, "preview": "", "referencers": [], "references": [], "title": "", "views": 115, "web_url": "https://chart-studio.plotly.com/~Chuanyun/15/", "world_readable": true, "date_modified": "2024-04-16T17:17:02.385Z", "stars": { "results": [], "count": 0 }, "collaborators": { "results": [], "count": 0 }, "subfolder_count": null, "refresh_interval": null, "organize_view_url": "https://chart-studio.plotly.com/~Chuanyun/15/", "current_user_permission": "read", "is_theme": null, "is_template": null, "autosize": true, "caption": "", "figure": { "data": [ { "name": "therapist", "type": "bar", "xsrc": "Chuanyun:16:370496", "ysrc": "Chuanyun:16:b1397b", "xaxis": "x", "yaxis": "y", "marker": { "color": "lightcoral", "pattern": { "shape": "" } }, "showlegend": true, "legendgroup": "therapist", "offsetgroup": "therapist", "orientation": "v", "textposition": "auto", "hovertemplate": "identity=%{x}<br>Count=%{y}<extra></extra>", "alignmentgroup": "True" }, { "name": "trainer", "type": "bar", "xsrc": "Chuanyun:16:0aee83", "ysrc": "Chuanyun:16:7e3cf9", "xaxis": "x", "yaxis": "y", "marker": { "color": "darkred", "pattern": { "shape": "" } }, "showlegend": true, "legendgroup": "trainer", "offsetgroup": "trainer", "orientation": "v", "textposition": "auto", "hovertemplate": "identity=%{x}<br>Count=%{y}<extra></extra>", "alignmentgroup": "True" }, { "name": "dealer", "type": "bar", "xsrc": "Chuanyun:16:54bc5f", "ysrc": "Chuanyun:16:c42221", "xaxis": "x", "yaxis": "y", "marker": { "color": "blue", "pattern": { "shape": "" } }, "showlegend": true, "legendgroup": "dealer", "offsetgroup": "dealer", "orientation": "v", "textposition": "auto", "hovertemplate": "identity=%{x}<br>Count=%{y}<extra></extra>", "alignmentgroup": "True" } ], "layout": { "title": { "text": "Number of Studios by Identity" }, "xaxis": { "title": { "text": "identity" }, "anchor": "y", "domain": [ 0.0, 1.0 ], "categoryarray": [ "therapist", "trainer", "dealer" ], "categoryorder": "array" }, "yaxis": { "title": { "text": "Count" }, "anchor": "x", "domain": [ 0.0, 1.0 ] }, "legend": { "title": { "text": "identity" }, "tracegroupgap": 0 }, "barmode": "relative", "template": { "data": { "bar": [ { "type": "bar", "marker": { "line": { "color": "#E5ECF6", "width": 0.5 }, "pattern": { "size": 10, "fillmode": "overlay", "solidity": 0.2 } }, "error_x": { "color": "#2a3f5f" }, "error_y": { "color": "#2a3f5f" } } ], "pie": [ { "type": "pie", "automargin": true } ], "table": [ { "type": "table", "cells": { "fill": { "color": "#EBF0F8" }, "line": { "color": "white" } }, "header": { "fill": { "color": "#C8D4E3" }, "line": { "color": "white" } } } ], "carpet": [ { "type": "carpet", "aaxis": { "gridcolor": "white", "linecolor": "white", "endlinecolor": "#2a3f5f", "minorgridcolor": "white", "startlinecolor": "#2a3f5f" }, "baxis": { "gridcolor": "white", "linecolor": "white", "endlinecolor": "#2a3f5f", "minorgridcolor": "white", "startlinecolor": "#2a3f5f" } } ], "mesh3d": [ { "type": "mesh3d", "colorbar": { "ticks": "", "outlinewidth": 0 } } ], "contour": [ { "type": "contour", "colorbar": { "ticks": "", "outlinewidth": 0 }, "colorscale": [ [ 0.0, "#0d0887" ], [ 0.1111111111111111, "#46039f" ], [ 0.2222222222222222, "#7201a8" ], [ 0.3333333333333333, "#9c179e" ], [ 0.4444444444444444, "#bd3786" ], [ 0.5555555555555556, "#d8576b" ], [ 0.6666666666666666, "#ed7953" ], [ 0.7777777777777778, "#fb9f3a" ], [ 0.8888888888888888, "#fdca26" ], [ 1.0, "#f0f921" ] ] } ], "heatmap": [ { "type": "heatmap", "colorbar": { "ticks": "", "outlinewidth": 0 }, "colorscale": [ [ 0.0, "#0d0887" ], [ 0.1111111111111111, "#46039f" ], [ 0.2222222222222222, "#7201a8" ], [ 0.3333333333333333, "#9c179e" ], [ 0.4444444444444444, "#bd3786" ], [ 0.5555555555555556, "#d8576b" ], [ 0.6666666666666666, "#ed7953" ], [ 0.7777777777777778, "#fb9f3a" ], [ 0.8888888888888888, "#fdca26" ], [ 1.0, "#f0f921" ] ] } ], "scatter": [ { "type": "scatter", "fillpattern": { "size": 10, "fillmode": "overlay", "solidity": 0.2 } } ], "surface": [ { "type": "surface", "colorbar": { "ticks": "", "outlinewidth": 0 }, "colorscale": [ [ 0.0, "#0d0887" ], [ 0.1111111111111111, "#46039f" ], [ 0.2222222222222222, "#7201a8" ], [ 0.3333333333333333, "#9c179e" ], [ 0.4444444444444444, "#bd3786" ], [ 0.5555555555555556, "#d8576b" ], [ 0.6666666666666666, "#ed7953" ], [ 0.7777777777777778, "#fb9f3a" ], [ 0.8888888888888888, "#fdca26" ], [ 1.0, "#f0f921" ] ] } ], "barpolar": [ { "type": "barpolar", "marker": { "line": { "color": "#E5ECF6", "width": 0.5 }, "pattern": { "size": 10, "fillmode": "overlay", "solidity": 0.2 } } } ], "heatmapgl": [ { "type": "heatmapgl", "colorbar": { "ticks": "", "outlinewidth": 0 }, "colorscale": [ [ 0.0, "#0d0887" ], [ 0.1111111111111111, "#46039f" ], [ 0.2222222222222222, "#7201a8" ], [ 0.3333333333333333, "#9c179e" ], [ 0.4444444444444444, "#bd3786" ], [ 0.5555555555555556, "#d8576b" ], [ 0.6666666666666666, "#ed7953" ], [ 0.7777777777777778, "#fb9f3a" ], [ 0.8888888888888888, "#fdca26" ], [ 1.0, "#f0f921" ] ] } ], "histogram": [ { "type": "histogram", "marker": { "pattern": { "size": 10, "fillmode": "overlay", "solidity": 0.2 } } } ], "parcoords": [ { "line": { "colorbar": { "ticks": "", "outlinewidth": 0 } }, "type": "parcoords" } ], "scatter3d": [ { "line": { "colorbar": { "ticks": "", "outlinewidth": 0 } }, "type": "scatter3d", "marker": { "colorbar": { "ticks": "", "outlinewidth": 0 } } } ], "scattergl": [ { "type": "scattergl", "marker": { "colorbar": { "ticks": "", "outlinewidth": 0 } } } ], "choropleth": [ { "type": "choropleth", "colorbar": { "ticks": "", "outlinewidth": 0 } } ], "scattergeo": [ { "type": "scattergeo", "marker": { "colorbar": { "ticks": "", "outlinewidth": 0 } } } ], "histogram2d": [ { "type": "histogram2d", "colorbar": { "ticks": "", "outlinewidth": 0 }, "colorscale": [ [ 0.0, "#0d0887" ], [ 0.1111111111111111, "#46039f" ], [ 0.2222222222222222, "#7201a8" ], [ 0.3333333333333333, "#9c179e" ], [ 0.4444444444444444, "#bd3786" ], [ 0.5555555555555556, "#d8576b" ], [ 0.6666666666666666, "#ed7953" ], [ 0.7777777777777778, "#fb9f3a" ], [ 0.8888888888888888, "#fdca26" ], [ 1.0, "#f0f921" ] ] } ], "scatterpolar": [ { "type": "scatterpolar", "marker": { "colorbar": { "ticks": "", "outlinewidth": 0 } } } ], "contourcarpet": [ { "type": "contourcarpet", "colorbar": { "ticks": "", "outlinewidth": 0 } } ], "scattercarpet": [ { "type": "scattercarpet", "marker": { "colorbar": { "ticks": "", "outlinewidth": 0 } } } ], "scattermapbox": [ { "type": "scattermapbox", "marker": { "colorbar": { "ticks": "", "outlinewidth": 0 } } } ], "scatterpolargl": [ { "type": "scatterpolargl", "marker": { "colorbar": { "ticks": "", "outlinewidth": 0 } } } ], "scatterternary": [ { "type": "scatterternary", "marker": { "colorbar": { "ticks": "", "outlinewidth": 0 } } } ], "histogram2dcontour": [ { "type": "histogram2dcontour", "colorbar": { "ticks": "", "outlinewidth": 0 }, "colorscale": [ [ 0.0, "#0d0887" ], [ 0.1111111111111111, "#46039f" ], [ 0.2222222222222222, "#7201a8" ], [ 0.3333333333333333, "#9c179e" ], [ 0.4444444444444444, "#bd3786" ], [ 0.5555555555555556, "#d8576b" ], [ 0.6666666666666666, "#ed7953" ], [ 0.7777777777777778, "#fb9f3a" ], [ 0.8888888888888888, "#fdca26" ], [ 1.0, "#f0f921" ] ] } ] }, "layout": { "geo": { "bgcolor": "white", "showland": true, "lakecolor": "white", "landcolor": "#E5ECF6", "showlakes": true, "subunitcolor": "white" }, "font": { "color": "#2a3f5f" }, "polar": { "bgcolor": "#E5ECF6", "radialaxis": { "ticks": "", "gridcolor": "white", "linecolor": "white" }, "angularaxis": { "ticks": "", "gridcolor": "white", "linecolor": "white" } }, "scene": { "xaxis": { "ticks": "", "gridcolor": "white", "gridwidth": 2, "linecolor": "white", "zerolinecolor": "white", "showbackground": true, "backgroundcolor": "#E5ECF6" }, "yaxis": { "ticks": "", "gridcolor": "white", "gridwidth": 2, "linecolor": "white", "zerolinecolor": "white", "showbackground": true, "backgroundcolor": "#E5ECF6" }, "zaxis": { "ticks": "", "gridcolor": "white", "gridwidth": 2, "linecolor": "white", "zerolinecolor": "white", "showbackground": true, "backgroundcolor": "#E5ECF6" } }, "title": { "x": 0.05 }, "xaxis": { "ticks": "", "title": { "standoff": 15 }, "gridcolor": "white", "linecolor": "white", "automargin": true, "zerolinecolor": "white", "zerolinewidth": 2 }, "yaxis": { "ticks": "", "title": { "standoff": 15 }, "gridcolor": "white", "linecolor": "white", "automargin": true, "zerolinecolor": "white", "zerolinewidth": 2 }, "mapbox": { "style": "light" }, "ternary": { "aaxis": { "ticks": "", "gridcolor": "white", "linecolor": "white" }, "baxis": { "ticks": "", "gridcolor": "white", "linecolor": "white" }, "caxis": { "ticks": "", "gridcolor": "white", "linecolor": "white" }, "bgcolor": "#E5ECF6" }, "colorway": [ "#636efa", "#EF553B", "#00cc96", "#ab63fa", "#FFA15A", "#19d3f3", "#FF6692", "#B6E880", "#FF97FF", "#FECB52" ], "coloraxis": { "colorbar": { "ticks": "", "outlinewidth": 0 } }, "hovermode": "closest", "colorscale": { "diverging": [ [ 0, "#8e0152" ], [ 0.1, "#c51b7d" ], [ 0.2, "#de77ae" ], [ 0.3, "#f1b6da" ], [ 0.4, "#fde0ef" ], [ 0.5, "#f7f7f7" ], [ 0.6, "#e6f5d0" ], [ 0.7, "#b8e186" ], [ 0.8, "#7fbc41" ], [ 0.9, "#4d9221" ], [ 1, "#276419" ] ], "sequential": [ [ 0.0, "#0d0887" ], [ 0.1111111111111111, "#46039f" ], [ 0.2222222222222222, "#7201a8" ], [ 0.3333333333333333, "#9c179e" ], [ 0.4444444444444444, "#bd3786" ], [ 0.5555555555555556, "#d8576b" ], [ 0.6666666666666666, "#ed7953" ], [ 0.7777777777777778, "#fb9f3a" ], [ 0.8888888888888888, "#fdca26" ], [ 1.0, "#f0f921" ] ], "sequentialminus": [ [ 0.0, "#0d0887" ], [ 0.1111111111111111, "#46039f" ], [ 0.2222222222222222, "#7201a8" ], [ 0.3333333333333333, "#9c179e" ], [ 0.4444444444444444, "#bd3786" ], [ 0.5555555555555556, "#d8576b" ], [ 0.6666666666666666, "#ed7953" ], [ 0.7777777777777778, "#fb9f3a" ], [ 0.8888888888888888, "#fdca26" ], [ 1.0, "#f0f921" ] ] }, "hoverlabel": { "align": "left" }, "plot_bgcolor": "#E5ECF6", "paper_bgcolor": "white", "shapedefaults": { "line": { "color": "#2a3f5f" } }, "autotypenumbers": "strict", "annotationdefaults": { "arrowhead": 0, "arrowcolor": "#2a3f5f", "arrowwidth": 1 } } } } }, "height": null, "width": null, "user": { "profile_url": "https://chart-studio.plotly.com/~Chuanyun", "avatar_url": "https://storage.googleapis.com/plotly-prod-profiles/53.jpg", "background_url": "https://storage.googleapis.com/plotly-prod-profiles/bg-7.jpg", "bio": "", "nickname": "", "website": "", "stream_tokens": null, "feature_set_id": null, "csrf_token": null, "date_joined": "2024-03-29 06:55:48", "mapbox_access_tokens": null, "has_password": null, "username": "Chuanyun", "email": null, "is_active": null, "readonly": null, "is_dash_creator": null, "dash_created_count": null, "is_chart_creator": null, "charts_created_count": null } }, { "creation_time": "2024-04-16T17:04:07.666729Z", "comments": { "results": [], "count": 0 }, "parented": true, "embed_url": "https://chart-studio.plotly.com/~loulang/5.embed", "fid": "loulang:5", "filename": "Kluby podle odehraných zápasů", "filetype": "plot", "img_url": "https://storage.googleapis.com/plotly-prod-images/loulang/5/9_IC22D3NB9CW3R9W7NOD1B6KIMHD2IH.png", "image_urls": { "default": "https://storage.googleapis.com/plotly-prod-images/loulang/5/2_1SPI0WU5YUB19406OSP7U04261H229.png", "block-thumb": "https://storage.googleapis.com/plotly-prod-images/loulang/5/8_VXGSCMPSKMVXTWDW7HLO7K9WYGYKZA.png", "list-thumb": "https://storage.googleapis.com/plotly-prod-images/loulang/5/9_IC22D3NB9CW3R9W7NOD1B6KIMHD2IH.png" }, "api_urls": { "files": "https://api.plotly.com/v2/files/loulang:5", "plots": "https://api.plotly.com/v2/plots/loulang:5", "parent": "https://api.plotly.com/v2/folders/home?user=loulang" }, "owner": "loulang", "parent": -1, "preview": "", "referencers": [], "references": [], "title": "", "views": 2, "web_url": "https://chart-studio.plotly.com/~loulang/5/", "world_readable": true, "date_modified": "2024-04-16T17:04:07.677Z", "stars": { "results": [], "count": 0 }, "collaborators": { "results": [], "count": 0 }, "subfolder_count": null, "refresh_interval": null, "organize_view_url": "https://chart-studio.plotly.com/~loulang/5/", "current_user_permission": "read", "is_theme": null, "is_template": false, "autosize": true, "caption": "", "figure": { "data": [ { "meta": { "columnNames": { "x": "Played", "y": "Club" } }, "mode": "markers", "type": "bar", "xsrc": "loulang:4:ad76fe", "ysrc": "loulang:4:125558", "orientation": "h" } ], "frames": [], "layout": { "title": { "font": { "size": 22, "family": "Arial" }, "text": "<b>Kluby s nejvíce odehranými zápasy</b>" }, "xaxis": { "type": "linear", "range": [ 0, 501.05263157894734 ], "title": { "text": "Počet odehraných zápasů" }, "autorange": true }, "yaxis": { "type": "category", "range": [ -0.5, 8.5 ], "title": { "text": "" }, "autorange": true }, "autosize": true, "template": { "data": { "bar": [ { "type": "bar", "marker": { "colorbar": { "len": 0.2, "ticks": "inside", "ticklen": 6, "tickcolor": "rgb(237,237,237)", "outlinewidth": 0 } } } ], "table": [ { "type": "table", "cells": { "fill": { "color": "rgb(237,237,237)" }, "line": { "color": "white" } }, "header": { "fill": { "color": "rgb(217,217,217)" }, "line": { "color": "white" } } } ], "carpet": [ { "type": "carpet", "aaxis": { "gridcolor": "white", "linecolor": "white", "endlinecolor": "rgb(51,51,51)", "minorgridcolor": "white", "startlinecolor": "rgb(51,51,51)" }, "baxis": { "gridcolor": "white", "linecolor": "white", "endlinecolor": "rgb(51,51,51)", "minorgridcolor": "white", "startlinecolor": "rgb(51,51,51)" } } ], "mesh3d": [ { "type": "mesh3d", "colorbar": { "len": 0.2, "ticks": "inside", "ticklen": 6, "tickcolor": "rgb(237,237,237)", "outlinewidth": 0 } } ], "contour": [ { "type": "contour", "colorbar": { "len": 0.2, "ticks": "inside", "ticklen": 6, "tickcolor": "rgb(237,237,237)", "outlinewidth": 0 }, "autocolorscale": true } ], "heatmap": [ { "type": "heatmap", "colorbar": { "len": 0.2, "ticks": "inside", "ticklen": 6, "tickcolor": "rgb(237,237,237)", "outlinewidth": 0 }, "autocolorscale": true } ], "scatter": [ { "type": "scatter", "marker": { "colorbar": { "len": 0.2, "ticks": "inside", "ticklen": 6, "tickcolor": "rgb(237,237,237)", "outlinewidth": 0 } } } ], "surface": [ { "type": "surface", "colorbar": { "len": 0.2, "ticks": "inside", "ticklen": 6, "tickcolor": "rgb(237,237,237)", "outlinewidth": 0 } } ], "heatmapgl": [ { "type": "heatmapgl", "colorbar": { "len": 0.2, "ticks": "inside", "ticklen": 6, "tickcolor": "rgb(237,237,237)", "outlinewidth": 0 } } ], "histogram": [ { "type": "histogram", "marker": { "colorbar": { "len": 0.2, "ticks": "inside", "ticklen": 6, "tickcolor": "rgb(237,237,237)", "outlinewidth": 0 } } } ], "parcoords": [ { "line": { "colorbar": { "len": 0.2, "ticks": "inside", "ticklen": 6, "tickcolor": "rgb(237,237,237)", "outlinewidth": 0 } }, "type": "parcoords" } ], "scatter3d": [ { "type": "scatter3d", "marker": { "colorbar": { "len": 0.2, "ticks": "inside", "ticklen": 6, "tickcolor": "rgb(237,237,237)", "outlinewidth": 0 } } } ], "scattergl": [ { "type": "scattergl", "marker": { "colorbar": { "len": 0.2, "ticks": "inside", "ticklen": 6, "tickcolor": "rgb(237,237,237)", "outlinewidth": 0 } } } ], "choropleth": [ { "type": "choropleth", "colorbar": { "len": 0.2, "ticks": "inside", "ticklen": 6, "tickcolor": "rgb(237,237,237)", "outlinewidth": 0 } } ], "scattergeo": [ { "type": "scattergeo", "marker": { "colorbar": { "len": 0.2, "ticks": "inside", "ticklen": 6, "tickcolor": "rgb(237,237,237)", "outlinewidth": 0 } } } ], "histogram2d": [ { "type": "histogram2d", "colorbar": { "len": 0.2, "ticks": "inside", "ticklen": 6, "tickcolor": "rgb(237,237,237)", "outlinewidth": 0 }, "autocolorscale": true } ], "scatterpolar": [ { "type": "scatterpolar", "marker": { "colorbar": { "len": 0.2, "ticks": "inside", "ticklen": 6, "tickcolor": "rgb(237,237,237)", "outlinewidth": 0 } } } ], "contourcarpet": [ { "type": "contourcarpet", "colorbar": { "len": 0.2, "ticks": "inside", "ticklen": 6, "tickcolor": "rgb(237,237,237)", "outlinewidth": 0 } } ], "scattercarpet": [ { "type": "scattercarpet", "marker": { "colorbar": { "len": 0.2, "ticks": "inside", "ticklen": 6, "tickcolor": "rgb(237,237,237)", "outlinewidth": 0 } } } ], "scattermapbox": [ { "type": "scattermapbox", "marker": { "colorbar": { "len": 0.2, "ticks": "inside", "ticklen": 6, "tickcolor": "rgb(237,237,237)", "outlinewidth": 0 } } } ], "scatterpolargl": [ { "type": "scatterpolargl", "marker": { "colorbar": { "len": 0.2, "ticks": "inside", "ticklen": 6, "tickcolor": "rgb(237,237,237)", "outlinewidth": 0 } } } ], "scatterternary": [ { "type": "scatterternary", "marker": { "colorbar": { "len": 0.2, "ticks": "inside", "ticklen": 6, "tickcolor": "rgb(237,237,237)", "outlinewidth": 0 } } } ], "histogram2dcontour": [ { "type": "histogram2dcontour", "colorbar": { "len": 0.2, "ticks": "inside", "ticklen": 6, "tickcolor": "rgb(237,237,237)", "outlinewidth": 0 }, "autocolorscale": true } ] }, "layout": { "geo": { "bgcolor": "white", "showland": true, "lakecolor": "white", "landcolor": "rgb(237,237,237)", "showlakes": true, "subunitcolor": "white" }, "font": { "color": "rgb(51,51,51)" }, "polar": { "bgcolor": "rgb(237,237,237)", "radialaxis": { "ticks": "outside", "showgrid": true, "gridcolor": "white", "linecolor": "white", "tickcolor": "rgb(51,51,51)" }, "angularaxis": { "ticks": "outside", "showgrid": true, "gridcolor": "white", "linecolor": "white", "tickcolor": "rgb(51,51,51)" } }, "scene": { "xaxis": { "ticks": "outside", "showgrid": true, "gridcolor": "white", "gridwidth": 2, "linecolor": "white", "tickcolor": "rgb(51,51,51)", "zerolinecolor": "white", "showbackground": true, "backgroundcolor": "rgb(237,237,237)" }, "yaxis": { "ticks": "outside", "showgrid": true, "gridcolor": "white", "gridwidth": 2, "linecolor": "white", "tickcolor": "rgb(51,51,51)", "zerolinecolor": "white", "showbackground": true, "backgroundcolor": "rgb(237,237,237)" }, "zaxis": { "ticks": "outside", "showgrid": true, "gridcolor": "white", "gridwidth": 2, "linecolor": "white", "tickcolor": "rgb(51,51,51)", "zerolinecolor": "white", "showbackground": true, "backgroundcolor": "rgb(237,237,237)" } }, "xaxis": { "ticks": "outside", "showgrid": true, "gridcolor": "white", "linecolor": "white", "tickcolor": "rgb(51,51,51)", "automargin": true, "zerolinecolor": "white" }, "yaxis": { "ticks": "outside", "showgrid": true, "gridcolor": "white", "linecolor": "white", "tickcolor": "rgb(51,51,51)", "automargin": true, "zerolinecolor": "white" }, "ternary": { "aaxis": { "ticks": "outside", "showgrid": true, "gridcolor": "white", "linecolor": "white", "tickcolor": "rgb(51,51,51)" }, "baxis": { "ticks": "outside", "showgrid": true, "gridcolor": "white", "linecolor": "white", "tickcolor": "rgb(51,51,51)" }, "caxis": { "ticks": "outside", "showgrid": true, "gridcolor": "white", "linecolor": "white", "tickcolor": "rgb(51,51,51)" }, "bgcolor": "rgb(237,237,237)" }, "colorway": [ "#F8766D", "#A3A500", "#00BF7D", "#00B0F6", "#E76BF3" ], "hovermode": "closest", "colorscale": { "diverging": [ [ 0, "#40004b" ], [ 0.1, "#762a83" ], [ 0.2, "#9970ab" ], [ 0.3, "#c2a5cf" ], [ 0.4, "#e7d4e8" ], [ 0.5, "#f7f7f7" ], [ 0.6, "#d9f0d3" ], [ 0.7, "#a6dba0" ], [ 0.8, "#5aae61" ], [ 0.9, "#1b7837" ], [ 1, "#00441b" ] ], "sequential": [ [ 0, "rgb(20,44,66)" ], [ 1, "rgb(90,179,244)" ] ], "sequentialminus": [ [ 0, "rgb(20,44,66)" ], [ 1, "rgb(90,179,244)" ] ] }, "plot_bgcolor": "rgb(237,237,237)", "paper_bgcolor": "white", "shapedefaults": { "line": { "width": 0 }, "opacity": 0.3, "fillcolor": "black" }, "annotationdefaults": { "arrowhead": 0, "arrowwidth": 1 } }, "themeRef": "GGPLOT2" } } }, "height": null, "width": null, "user": { "profile_url": "https://chart-studio.plotly.com/~loulang", "avatar_url": "https://storage.googleapis.com/plotly-prod-profiles/85.jpg", "background_url": "https://storage.googleapis.com/plotly-prod-profiles/bg-11.jpg", "bio": "", "nickname": "", "website": "", "stream_tokens": null, "feature_set_id": null, "csrf_token": null, "date_joined": "2024-04-16 07:25:11", "mapbox_access_tokens": null, "has_password": null, "username": "loulang", "email": null, "is_active": null, "readonly": null, "is_dash_creator": null, "dash_created_count": null, "is_chart_creator": null, "charts_created_count": null } } ] }
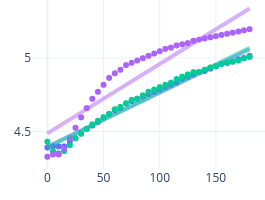
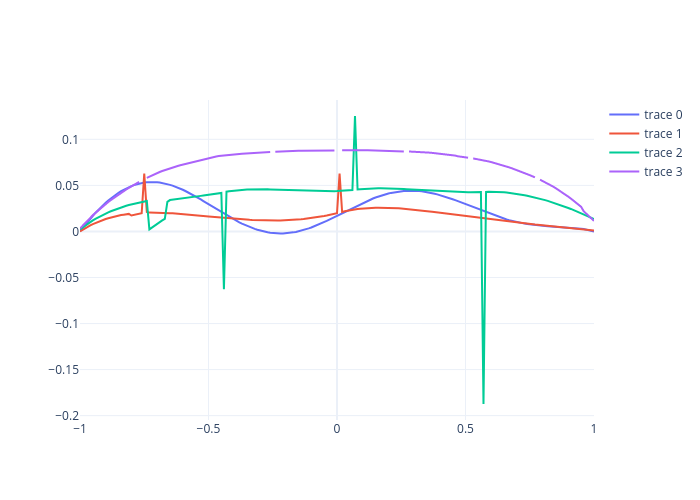
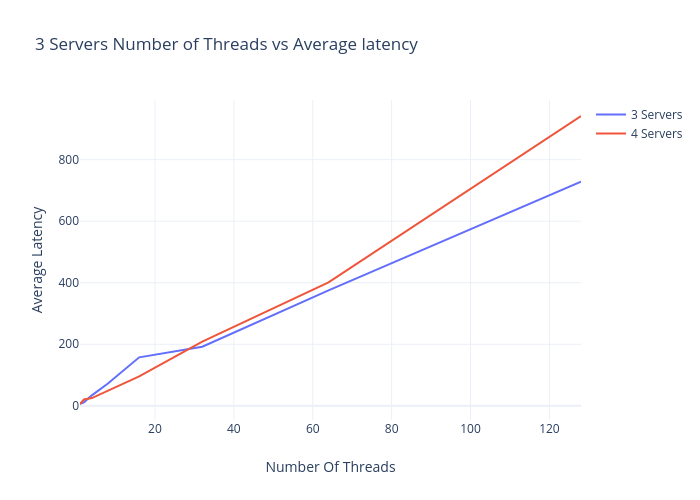