Plots


Jump to API response

This endpoint handles manipulation of Plotly plot files.

Reference

Authorization


Any user with or without a Plotly account may view public plots. For private plots, see authentication.

Actions


list

Listing all public plots can be done via a GET request to this endpoint. By default, plots will be listed in order of date created. The order_by query parameter is accepted at this endpoint. Currently, only ordering by views is supported. It is possible to filter the plots by quality with min_quality or max_quality as query parameter.

Example:

// GET https://api.plotly.com/v2/plots/ ---> 200

// GET https://api.plotly.com/v2/plots/?order_by=-views ---> 200

// GET https://api.plotly.com/v2/plots/?min_quality=5 ---> 200

// GET https://api.plotly.com/v2/plots/?max_quality=5 ---> 200

feed

Listing all handpicked feed plots can be done via a GET request to this endpoint. By default, plots will be listed in a random order.

Example:

// GET https://api.plotly.com/v2/plots/feed ---> 200

create

You can create new plot resources here. The only required field is 'figure'. Currently, the figure is restricted to only contain references to grid data. That is, this will fail if raw data arrays are passed in. To create and manipulate underlying grids for plots, see the grids endpoint.

Example:

// This fails because a figure field is required.
// POST https://api.plotly.com/v2/plots ---> 400 Bad Request
{}

// This fails because the figure has raw data
//POST https://api.plotly.com/v2/plots ---> 400 Bad Request
{
    "figure": {"data": [{"y": ['this', 'is', 'raw', 'data']}]}
}

// This succeeds because the figure has src keys, not raw data.
//POST https://api.plotly.com/v2/plots ---> 200 OK
{
    "figure": {"data": [{"ysrc": "sven:88:u8nd62"}]}
}

When creating a grid, you can optionally specify a source_fid to specify where a plot has come from:

  • source_fid: the fid of a plot that was copied (and presumably edited) to produce this one

detail

There is a lot of meta information stored about plot files including filename, title, share_url, and content_url to name a few.

This information can only be reached with a GET to this endpoint.

Example:

// GET https://api.plotly.com/v2/plots/iheartgraphs:90

content

The contents of a plot can be downloaded via the content resource. The plot content contains referenced grid/column data by default. If you wish to return the raw grid/column data, the inline_data=true query must be included in the request url. The Content-Type header will be appropriately set for the response body.

Alternatively, you can set ?map_data=unreadable to append a mapping of sources to data that belongs to grids which are unreadable for the requestor. This is useful when you have read access to another users plot, but that plot contains grid references which you don't have access to.

Examples:

// Returns referenced grid/column data
// GET https://api.plotly.com/v2/plots/iheartgraphs:90/content ---> 200 OK

// Returns full grid/column data
// GET https://api.plotly.com/v2/plots/iheartgraphs:90/content?inline_data=true ---> 200 OK

// Returns full grid/column data when requestor doesn't have permission
// to read the referenced grid.
// GET https://api.plotly.com/v2/plots/iheartgraphs:90/content?map_data=unreadable ---> 200 OK

GET /v2/plots?cursor=cj0xJnA9MjAyNC0wNC0xOCsxMyUzQTEyJTNBMTQuNjkxNjYyJTJCMDAlM0EwMA%3D%3D&format=api
HTTP 200 OK
Allow: GET, POST, HEAD, OPTIONS
Content-Type: application/json
Vary: Accept

{
    "next": "https://api.plotly.com/v2/plots?cursor=cD0yMDI0LTA0LTE4KzEzJTNBMTYlM0ExNS4xNTY0MTklMkIwMCUzQTAw&format=api",
    "previous": "https://api.plotly.com/v2/plots?cursor=cj0xJnA9MjAyNC0wNC0xOCsxNCUzQTI4JTNBMDUuOTc1NzgyJTJCMDAlM0EwMA%3D%3D&format=api",
    "results": [
        {
            "creation_time": "2024-04-18T14:28:05.975782Z",
            "comments": {
                "results": [],
                "count": 0
            },
            "parented": true,
            "embed_url": "https://chart-studio.plotly.com/~shahhaard5/1.embed",
            "fid": "shahhaard5:1",
            "filename": "Plot 1",
            "filetype": "plot",
            "img_url": "https://storage.googleapis.com/plotly-prod-images/shahhaard5/1/9_2LQ67FY2MNAN664660THBSFHLI262N.png",
            "image_urls": {
                "default": "https://storage.googleapis.com/plotly-prod-images/shahhaard5/1/2_CTUP4A7HU8K1H908YRRBDHJC87DXRN.png",
                "block-thumb": "https://storage.googleapis.com/plotly-prod-images/shahhaard5/1/8_6AC2TDUZBU9AP3P7Z8SWLF9DC6VX4N.png",
                "list-thumb": "https://storage.googleapis.com/plotly-prod-images/shahhaard5/1/9_2LQ67FY2MNAN664660THBSFHLI262N.png"
            },
            "api_urls": {
                "files": "https://api.plotly.com/v2/files/shahhaard5:1",
                "plots": "https://api.plotly.com/v2/plots/shahhaard5:1",
                "parent": "https://api.plotly.com/v2/folders/home?user=shahhaard5"
            },
            "owner": "shahhaard5",
            "parent": -1,
            "preview": "",
            "referencers": [],
            "references": [],
            "title": "",
            "views": 1,
            "web_url": "https://chart-studio.plotly.com/~shahhaard5/1/",
            "world_readable": true,
            "date_modified": "2024-04-19T11:35:06.100Z",
            "stars": {
                "results": [],
                "count": 0
            },
            "collaborators": {
                "results": [],
                "count": 0
            },
            "subfolder_count": null,
            "refresh_interval": null,
            "organize_view_url": "https://chart-studio.plotly.com/~shahhaard5/1/",
            "current_user_permission": "read",
            "is_theme": null,
            "is_template": false,
            "autosize": true,
            "caption": "",
            "figure": {
                "data": [
                    {
                        "uid": "c6225b",
                        "meta": {
                            "columnNames": {
                                "x": "H",
                                "y": "C"
                            }
                        },
                        "mode": "markers",
                        "type": "scatter",
                        "xsrc": "shahhaard5:0:43dcd8",
                        "ysrc": "shahhaard5:0:4c561b",
                        "xaxis": "x2",
                        "yaxis": "y2"
                    }
                ],
                "frames": [],
                "layout": {
                    "title": {
                        "text": "Stress VS Strain using  FDM (PLA)"
                    },
                    "xaxis": {
                        "type": "linear",
                        "range": [
                            -1.9,
                            33.01618654426311
                        ],
                        "title": {
                            "text": "stress"
                        },
                        "autorange": false
                    },
                    "yaxis": {
                        "type": "linear",
                        "range": [
                            7.138421073454403,
                            36.48923591126963
                        ],
                        "title": {
                            "text": "strain"
                        },
                        "autorange": true
                    },
                    "xaxis2": {
                        "side": "top",
                        "type": "linear",
                        "range": [
                            -0.01660160361028685,
                            0.29007160361028683
                        ],
                        "title": {
                            "text": "Strain"
                        },
                        "autorange": true,
                        "overlaying": "x"
                    },
                    "yaxis2": {
                        "side": "left",
                        "type": "linear",
                        "range": [
                            -2.2357935714285713,
                            33.35002357142857
                        ],
                        "title": {
                            "text": "Stress"
                        },
                        "autorange": true,
                        "overlaying": "y"
                    },
                    "autosize": true,
                    "template": {
                        "data": {
                            "bar": [
                                {
                                    "type": "bar",
                                    "marker": {
                                        "colorbar": {
                                            "ticks": "",
                                            "outlinewidth": 0
                                        }
                                    }
                                }
                            ],
                            "table": [
                                {
                                    "type": "table",
                                    "cells": {
                                        "fill": {
                                            "color": "#EBF0F8"
                                        },
                                        "line": {
                                            "color": "white"
                                        }
                                    },
                                    "header": {
                                        "fill": {
                                            "color": "#C8D4E3"
                                        },
                                        "line": {
                                            "color": "white"
                                        }
                                    }
                                }
                            ],
                            "carpet": [
                                {
                                    "type": "carpet",
                                    "aaxis": {
                                        "gridcolor": "#C8D4E3",
                                        "linecolor": "#C8D4E3",
                                        "endlinecolor": "#2a3f5f",
                                        "minorgridcolor": "#C8D4E3",
                                        "startlinecolor": "#2a3f5f"
                                    },
                                    "baxis": {
                                        "gridcolor": "#C8D4E3",
                                        "linecolor": "#C8D4E3",
                                        "endlinecolor": "#2a3f5f",
                                        "minorgridcolor": "#C8D4E3",
                                        "startlinecolor": "#2a3f5f"
                                    }
                                }
                            ],
                            "mesh3d": [
                                {
                                    "type": "mesh3d",
                                    "colorbar": {
                                        "ticks": "",
                                        "outlinewidth": 0
                                    }
                                }
                            ],
                            "contour": [
                                {
                                    "type": "contour",
                                    "colorbar": {
                                        "ticks": "",
                                        "outlinewidth": 0
                                    },
                                    "autocolorscale": true
                                }
                            ],
                            "heatmap": [
                                {
                                    "type": "heatmap",
                                    "colorbar": {
                                        "ticks": "",
                                        "outlinewidth": 0
                                    },
                                    "autocolorscale": true
                                }
                            ],
                            "scatter": [
                                {
                                    "type": "scatter",
                                    "marker": {
                                        "colorbar": {
                                            "ticks": "",
                                            "outlinewidth": 0
                                        }
                                    }
                                }
                            ],
                            "surface": [
                                {
                                    "type": "surface",
                                    "colorbar": {
                                        "ticks": "",
                                        "outlinewidth": 0
                                    }
                                }
                            ],
                            "heatmapgl": [
                                {
                                    "type": "heatmapgl",
                                    "colorbar": {
                                        "ticks": "",
                                        "outlinewidth": 0
                                    }
                                }
                            ],
                            "histogram": [
                                {
                                    "type": "histogram",
                                    "marker": {
                                        "colorbar": {
                                            "ticks": "",
                                            "outlinewidth": 0
                                        }
                                    }
                                }
                            ],
                            "parcoords": [
                                {
                                    "line": {
                                        "colorbar": {
                                            "ticks": "",
                                            "outlinewidth": 0
                                        }
                                    },
                                    "type": "parcoords"
                                }
                            ],
                            "scatter3d": [
                                {
                                    "type": "scatter3d",
                                    "marker": {
                                        "colorbar": {
                                            "ticks": "",
                                            "outlinewidth": 0
                                        }
                                    }
                                }
                            ],
                            "scattergl": [
                                {
                                    "type": "scattergl",
                                    "marker": {
                                        "colorbar": {
                                            "ticks": "",
                                            "outlinewidth": 0
                                        }
                                    }
                                }
                            ],
                            "choropleth": [
                                {
                                    "type": "choropleth",
                                    "colorbar": {
                                        "ticks": "",
                                        "outlinewidth": 0
                                    }
                                }
                            ],
                            "scattergeo": [
                                {
                                    "type": "scattergeo",
                                    "marker": {
                                        "colorbar": {
                                            "ticks": "",
                                            "outlinewidth": 0
                                        }
                                    }
                                }
                            ],
                            "histogram2d": [
                                {
                                    "type": "histogram2d",
                                    "colorbar": {
                                        "ticks": "",
                                        "outlinewidth": 0
                                    },
                                    "autocolorscale": true
                                }
                            ],
                            "scatterpolar": [
                                {
                                    "type": "scatterpolar",
                                    "marker": {
                                        "colorbar": {
                                            "ticks": "",
                                            "outlinewidth": 0
                                        }
                                    }
                                }
                            ],
                            "contourcarpet": [
                                {
                                    "type": "contourcarpet",
                                    "colorbar": {
                                        "ticks": "",
                                        "outlinewidth": 0
                                    }
                                }
                            ],
                            "scattercarpet": [
                                {
                                    "type": "scattercarpet",
                                    "marker": {
                                        "colorbar": {
                                            "ticks": "",
                                            "outlinewidth": 0
                                        }
                                    }
                                }
                            ],
                            "scattermapbox": [
                                {
                                    "type": "scattermapbox",
                                    "marker": {
                                        "colorbar": {
                                            "ticks": "",
                                            "outlinewidth": 0
                                        }
                                    }
                                }
                            ],
                            "scatterpolargl": [
                                {
                                    "type": "scatterpolargl",
                                    "marker": {
                                        "colorbar": {
                                            "ticks": "",
                                            "outlinewidth": 0
                                        }
                                    }
                                }
                            ],
                            "scatterternary": [
                                {
                                    "type": "scatterternary",
                                    "marker": {
                                        "colorbar": {
                                            "ticks": "",
                                            "outlinewidth": 0
                                        }
                                    }
                                }
                            ],
                            "histogram2dcontour": [
                                {
                                    "type": "histogram2dcontour",
                                    "colorbar": {
                                        "ticks": "",
                                        "outlinewidth": 0
                                    },
                                    "autocolorscale": true
                                }
                            ]
                        },
                        "layout": {
                            "geo": {
                                "bgcolor": "white",
                                "showland": true,
                                "lakecolor": "white",
                                "landcolor": "white",
                                "showlakes": true,
                                "subunitcolor": "#C8D4E3"
                            },
                            "font": {
                                "color": "#2a3f5f"
                            },
                            "polar": {
                                "bgcolor": "white",
                                "radialaxis": {
                                    "ticks": "",
                                    "gridcolor": "#EBF0F8",
                                    "linecolor": "#EBF0F8"
                                },
                                "angularaxis": {
                                    "ticks": "",
                                    "gridcolor": "#EBF0F8",
                                    "linecolor": "#EBF0F8"
                                }
                            },
                            "scene": {
                                "xaxis": {
                                    "ticks": "",
                                    "gridcolor": "#DFE8F3",
                                    "gridwidth": 2,
                                    "linecolor": "#EBF0F8",
                                    "zerolinecolor": "#EBF0F8",
                                    "showbackground": true,
                                    "backgroundcolor": "white"
                                },
                                "yaxis": {
                                    "ticks": "",
                                    "gridcolor": "#DFE8F3",
                                    "gridwidth": 2,
                                    "linecolor": "#EBF0F8",
                                    "zerolinecolor": "#EBF0F8",
                                    "showbackground": true,
                                    "backgroundcolor": "white"
                                },
                                "zaxis": {
                                    "ticks": "",
                                    "gridcolor": "#DFE8F3",
                                    "gridwidth": 2,
                                    "linecolor": "#EBF0F8",
                                    "zerolinecolor": "#EBF0F8",
                                    "showbackground": true,
                                    "backgroundcolor": "white"
                                }
                            },
                            "title": {
                                "x": 0.05
                            },
                            "xaxis": {
                                "ticks": "",
                                "gridcolor": "#EBF0F8",
                                "linecolor": "#EBF0F8",
                                "automargin": true,
                                "zerolinecolor": "#EBF0F8",
                                "zerolinewidth": 2
                            },
                            "yaxis": {
                                "ticks": "",
                                "gridcolor": "#EBF0F8",
                                "linecolor": "#EBF0F8",
                                "automargin": true,
                                "zerolinecolor": "#EBF0F8",
                                "zerolinewidth": 2
                            },
                            "ternary": {
                                "aaxis": {
                                    "ticks": "",
                                    "gridcolor": "#DFE8F3",
                                    "linecolor": "#A2B1C6"
                                },
                                "baxis": {
                                    "ticks": "",
                                    "gridcolor": "#DFE8F3",
                                    "linecolor": "#A2B1C6"
                                },
                                "caxis": {
                                    "ticks": "",
                                    "gridcolor": "#DFE8F3",
                                    "linecolor": "#A2B1C6"
                                },
                                "bgcolor": "white"
                            },
                            "colorway": [
                                "#636efa",
                                "#EF553B",
                                "#00cc96",
                                "#ab63fa",
                                "#19d3f3",
                                "#e763fa",
                                "#fecb52",
                                "#ffa15a",
                                "#ff6692",
                                "#b6e880"
                            ],
                            "hovermode": "closest",
                            "colorscale": {
                                "diverging": [
                                    [
                                        0,
                                        "#8e0152"
                                    ],
                                    [
                                        0.1,
                                        "#c51b7d"
                                    ],
                                    [
                                        0.2,
                                        "#de77ae"
                                    ],
                                    [
                                        0.3,
                                        "#f1b6da"
                                    ],
                                    [
                                        0.4,
                                        "#fde0ef"
                                    ],
                                    [
                                        0.5,
                                        "#f7f7f7"
                                    ],
                                    [
                                        0.6,
                                        "#e6f5d0"
                                    ],
                                    [
                                        0.7,
                                        "#b8e186"
                                    ],
                                    [
                                        0.8,
                                        "#7fbc41"
                                    ],
                                    [
                                        0.9,
                                        "#4d9221"
                                    ],
                                    [
                                        1,
                                        "#276419"
                                    ]
                                ],
                                "sequential": [
                                    [
                                        0,
                                        "#0508b8"
                                    ],
                                    [
                                        0.0893854748603352,
                                        "#1910d8"
                                    ],
                                    [
                                        0.1787709497206704,
                                        "#3c19f0"
                                    ],
                                    [
                                        0.2681564245810056,
                                        "#6b1cfb"
                                    ],
                                    [
                                        0.3575418994413408,
                                        "#981cfd"
                                    ],
                                    [
                                        0.44692737430167595,
                                        "#bf1cfd"
                                    ],
                                    [
                                        0.5363128491620112,
                                        "#dd2bfd"
                                    ],
                                    [
                                        0.6256983240223464,
                                        "#f246fe"
                                    ],
                                    [
                                        0.7150837988826816,
                                        "#fc67fd"
                                    ],
                                    [
                                        0.8044692737430168,
                                        "#fe88fc"
                                    ],
                                    [
                                        0.8938547486033519,
                                        "#fea5fd"
                                    ],
                                    [
                                        0.9832402234636871,
                                        "#febefe"
                                    ],
                                    [
                                        1,
                                        "#fec3fe"
                                    ]
                                ],
                                "sequentialminus": [
                                    [
                                        0,
                                        "#0508b8"
                                    ],
                                    [
                                        0.0893854748603352,
                                        "#1910d8"
                                    ],
                                    [
                                        0.1787709497206704,
                                        "#3c19f0"
                                    ],
                                    [
                                        0.2681564245810056,
                                        "#6b1cfb"
                                    ],
                                    [
                                        0.3575418994413408,
                                        "#981cfd"
                                    ],
                                    [
                                        0.44692737430167595,
                                        "#bf1cfd"
                                    ],
                                    [
                                        0.5363128491620112,
                                        "#dd2bfd"
                                    ],
                                    [
                                        0.6256983240223464,
                                        "#f246fe"
                                    ],
                                    [
                                        0.7150837988826816,
                                        "#fc67fd"
                                    ],
                                    [
                                        0.8044692737430168,
                                        "#fe88fc"
                                    ],
                                    [
                                        0.8938547486033519,
                                        "#fea5fd"
                                    ],
                                    [
                                        0.9832402234636871,
                                        "#febefe"
                                    ],
                                    [
                                        1,
                                        "#fec3fe"
                                    ]
                                ]
                            },
                            "plot_bgcolor": "white",
                            "paper_bgcolor": "white",
                            "shapedefaults": {
                                "line": {
                                    "width": 0
                                },
                                "opacity": 0.4,
                                "fillcolor": "#506784"
                            },
                            "annotationdefaults": {
                                "arrowhead": 0,
                                "arrowcolor": "#506784",
                                "arrowwidth": 1
                            }
                        },
                        "themeRef": "PLOTLY_WHITE"
                    }
                }
            },
            "height": null,
            "width": null,
            "user": {
                "profile_url": "https://chart-studio.plotly.com/~shahhaard5",
                "avatar_url": "https://storage.googleapis.com/plotly-prod-profiles/5.jpg",
                "background_url": "https://storage.googleapis.com/plotly-prod-profiles/bg-8.jpg",
                "bio": "",
                "nickname": "",
                "website": "",
                "stream_tokens": null,
                "feature_set_id": null,
                "csrf_token": null,
                "date_joined": "2024-04-18 14:27:38",
                "mapbox_access_tokens": null,
                "has_password": null,
                "username": "shahhaard5",
                "email": null,
                "is_active": null,
                "readonly": null,
                "is_dash_creator": null,
                "dash_created_count": null,
                "is_chart_creator": null,
                "charts_created_count": null
            }
        },
        {
            "creation_time": "2024-04-18T14:25:24.480156Z",
            "comments": {
                "results": [],
                "count": 0
            },
            "parented": true,
            "embed_url": "https://chart-studio.plotly.com/~cedma.santos/1.embed",
            "fid": "cedma.santos:1",
            "filename": "Plot 1",
            "filetype": "plot",
            "img_url": "https://storage.googleapis.com/plotly-prod-images/cedma.santos/1/9_E3X04JEAJFRNCIJAJX5A1J500DC6P4.png",
            "image_urls": {
                "default": "https://storage.googleapis.com/plotly-prod-images/cedma.santos/1/2_7QL69G3KUQ65Z3J3EVPL634R98G2X8.png",
                "block-thumb": "https://storage.googleapis.com/plotly-prod-images/cedma.santos/1/8_E2T8L57EQ3Q40TIA5SUOJ9S3G9X9ZO.png",
                "list-thumb": "https://storage.googleapis.com/plotly-prod-images/cedma.santos/1/9_E3X04JEAJFRNCIJAJX5A1J500DC6P4.png"
            },
            "api_urls": {
                "files": "https://api.plotly.com/v2/files/cedma.santos:1",
                "plots": "https://api.plotly.com/v2/plots/cedma.santos:1",
                "parent": "https://api.plotly.com/v2/folders/home?user=cedma.santos"
            },
            "owner": "cedma.santos",
            "parent": -1,
            "preview": "",
            "referencers": [],
            "references": [],
            "title": "",
            "views": 1,
            "web_url": "https://chart-studio.plotly.com/~cedma.santos/1/",
            "world_readable": true,
            "date_modified": "2024-04-18T14:25:24.492Z",
            "stars": {
                "results": [],
                "count": 0
            },
            "collaborators": {
                "results": [],
                "count": 0
            },
            "subfolder_count": null,
            "refresh_interval": null,
            "organize_view_url": "https://chart-studio.plotly.com/~cedma.santos/1/",
            "current_user_permission": "read",
            "is_theme": null,
            "is_template": false,
            "autosize": true,
            "caption": "",
            "figure": {
                "data": [
                    {
                        "meta": {
                            "columnNames": {
                                "x": "A",
                                "y": "B"
                            }
                        },
                        "name": "%{meta.columnNames.y}",
                        "type": "bar",
                        "xsrc": "cedma.santos:0:7b90d3",
                        "ysrc": "cedma.santos:0:cff660",
                        "orientation": "v"
                    }
                ],
                "frames": [],
                "layout": {
                    "title": {
                        "text": "PreferĂȘncias de plataforma da turma"
                    },
                    "xaxis": {
                        "type": "category",
                        "range": [
                            -0.5,
                            3.5
                        ],
                        "title": {
                            "text": "Nome_plataforma"
                        },
                        "autorange": true
                    },
                    "yaxis": {
                        "type": "linear",
                        "range": [
                            0,
                            12.631578947368421
                        ],
                        "title": {
                            "text": "PreferĂȘncia da turma"
                        },
                        "autorange": true
                    },
                    "barmode": "group",
                    "autosize": true,
                    "template": {
                        "data": {
                            "bar": [
                                {
                                    "type": "bar",
                                    "marker": {
                                        "colorbar": {
                                            "ticks": "",
                                            "outlinewidth": 0
                                        }
                                    }
                                }
                            ],
                            "table": [
                                {
                                    "type": "table",
                                    "cells": {
                                        "fill": {
                                            "color": "#EBF0F8"
                                        },
                                        "line": {
                                            "color": "white"
                                        }
                                    },
                                    "header": {
                                        "fill": {
                                            "color": "#C8D4E3"
                                        },
                                        "line": {
                                            "color": "white"
                                        }
                                    }
                                }
                            ],
                            "carpet": [
                                {
                                    "type": "carpet",
                                    "aaxis": {
                                        "gridcolor": "#C8D4E3",
                                        "linecolor": "#C8D4E3",
                                        "endlinecolor": "#2a3f5f",
                                        "minorgridcolor": "#C8D4E3",
                                        "startlinecolor": "#2a3f5f"
                                    },
                                    "baxis": {
                                        "gridcolor": "#C8D4E3",
                                        "linecolor": "#C8D4E3",
                                        "endlinecolor": "#2a3f5f",
                                        "minorgridcolor": "#C8D4E3",
                                        "startlinecolor": "#2a3f5f"
                                    }
                                }
                            ],
                            "mesh3d": [
                                {
                                    "type": "mesh3d",
                                    "colorbar": {
                                        "ticks": "",
                                        "outlinewidth": 0
                                    }
                                }
                            ],
                            "contour": [
                                {
                                    "type": "contour",
                                    "colorbar": {
                                        "ticks": "",
                                        "outlinewidth": 0
                                    },
                                    "autocolorscale": true
                                }
                            ],
                            "heatmap": [
                                {
                                    "type": "heatmap",
                                    "colorbar": {
                                        "ticks": "",
                                        "outlinewidth": 0
                                    },
                                    "autocolorscale": true
                                }
                            ],
                            "scatter": [
                                {
                                    "type": "scatter",
                                    "marker": {
                                        "colorbar": {
                                            "ticks": "",
                                            "outlinewidth": 0
                                        }
                                    }
                                }
                            ],
                            "surface": [
                                {
                                    "type": "surface",
                                    "colorbar": {
                                        "ticks": "",
                                        "outlinewidth": 0
                                    }
                                }
                            ],
                            "heatmapgl": [
                                {
                                    "type": "heatmapgl",
                                    "colorbar": {
                                        "ticks": "",
                                        "outlinewidth": 0
                                    }
                                }
                            ],
                            "histogram": [
                                {
                                    "type": "histogram",
                                    "marker": {
                                        "colorbar": {
                                            "ticks": "",
                                            "outlinewidth": 0
                                        }
                                    }
                                }
                            ],
                            "parcoords": [
                                {
                                    "line": {
                                        "colorbar": {
                                            "ticks": "",
                                            "outlinewidth": 0
                                        }
                                    },
                                    "type": "parcoords"
                                }
                            ],
                            "scatter3d": [
                                {
                                    "type": "scatter3d",
                                    "marker": {
                                        "colorbar": {
                                            "ticks": "",
                                            "outlinewidth": 0
                                        }
                                    }
                                }
                            ],
                            "scattergl": [
                                {
                                    "type": "scattergl",
                                    "marker": {
                                        "colorbar": {
                                            "ticks": "",
                                            "outlinewidth": 0
                                        }
                                    }
                                }
                            ],
                            "choropleth": [
                                {
                                    "type": "choropleth",
                                    "colorbar": {
                                        "ticks": "",
                                        "outlinewidth": 0
                                    }
                                }
                            ],
                            "scattergeo": [
                                {
                                    "type": "scattergeo",
                                    "marker": {
                                        "colorbar": {
                                            "ticks": "",
                                            "outlinewidth": 0
                                        }
                                    }
                                }
                            ],
                            "histogram2d": [
                                {
                                    "type": "histogram2d",
                                    "colorbar": {
                                        "ticks": "",
                                        "outlinewidth": 0
                                    },
                                    "autocolorscale": true
                                }
                            ],
                            "scatterpolar": [
                                {
                                    "type": "scatterpolar",
                                    "marker": {
                                        "colorbar": {
                                            "ticks": "",
                                            "outlinewidth": 0
                                        }
                                    }
                                }
                            ],
                            "contourcarpet": [
                                {
                                    "type": "contourcarpet",
                                    "colorbar": {
                                        "ticks": "",
                                        "outlinewidth": 0
                                    }
                                }
                            ],
                            "scattercarpet": [
                                {
                                    "type": "scattercarpet",
                                    "marker": {
                                        "colorbar": {
                                            "ticks": "",
                                            "outlinewidth": 0
                                        }
                                    }
                                }
                            ],
                            "scattermapbox": [
                                {
                                    "type": "scattermapbox",
                                    "marker": {
                                        "colorbar": {
                                            "ticks": "",
                                            "outlinewidth": 0
                                        }
                                    }
                                }
                            ],
                            "scatterpolargl": [
                                {
                                    "type": "scatterpolargl",
                                    "marker": {
                                        "colorbar": {
                                            "ticks": "",
                                            "outlinewidth": 0
                                        }
                                    }
                                }
                            ],
                            "scatterternary": [
                                {
                                    "type": "scatterternary",
                                    "marker": {
                                        "colorbar": {
                                            "ticks": "",
                                            "outlinewidth": 0
                                        }
                                    }
                                }
                            ],
                            "histogram2dcontour": [
                                {
                                    "type": "histogram2dcontour",
                                    "colorbar": {
                                        "ticks": "",
                                        "outlinewidth": 0
                                    },
                                    "autocolorscale": true
                                }
                            ]
                        },
                        "layout": {
                            "geo": {
                                "bgcolor": "white",
                                "showland": true,
                                "lakecolor": "white",
                                "landcolor": "white",
                                "showlakes": true,
                                "subunitcolor": "#C8D4E3"
                            },
                            "font": {
                                "color": "#2a3f5f"
                            },
                            "polar": {
                                "bgcolor": "white",
                                "radialaxis": {
                                    "ticks": "",
                                    "gridcolor": "#EBF0F8",
                                    "linecolor": "#EBF0F8"
                                },
                                "angularaxis": {
                                    "ticks": "",
                                    "gridcolor": "#EBF0F8",
                                    "linecolor": "#EBF0F8"
                                }
                            },
                            "scene": {
                                "xaxis": {
                                    "ticks": "",
                                    "gridcolor": "#DFE8F3",
                                    "gridwidth": 2,
                                    "linecolor": "#EBF0F8",
                                    "zerolinecolor": "#EBF0F8",
                                    "showbackground": true,
                                    "backgroundcolor": "white"
                                },
                                "yaxis": {
                                    "ticks": "",
                                    "gridcolor": "#DFE8F3",
                                    "gridwidth": 2,
                                    "linecolor": "#EBF0F8",
                                    "zerolinecolor": "#EBF0F8",
                                    "showbackground": true,
                                    "backgroundcolor": "white"
                                },
                                "zaxis": {
                                    "ticks": "",
                                    "gridcolor": "#DFE8F3",
                                    "gridwidth": 2,
                                    "linecolor": "#EBF0F8",
                                    "zerolinecolor": "#EBF0F8",
                                    "showbackground": true,
                                    "backgroundcolor": "white"
                                }
                            },
                            "title": {
                                "x": 0.05
                            },
                            "xaxis": {
                                "ticks": "",
                                "gridcolor": "#EBF0F8",
                                "linecolor": "#EBF0F8",
                                "automargin": true,
                                "zerolinecolor": "#EBF0F8",
                                "zerolinewidth": 2
                            },
                            "yaxis": {
                                "ticks": "",
                                "gridcolor": "#EBF0F8",
                                "linecolor": "#EBF0F8",
                                "automargin": true,
                                "zerolinecolor": "#EBF0F8",
                                "zerolinewidth": 2
                            },
                            "ternary": {
                                "aaxis": {
                                    "ticks": "",
                                    "gridcolor": "#DFE8F3",
                                    "linecolor": "#A2B1C6"
                                },
                                "baxis": {
                                    "ticks": "",
                                    "gridcolor": "#DFE8F3",
                                    "linecolor": "#A2B1C6"
                                },
                                "caxis": {
                                    "ticks": "",
                                    "gridcolor": "#DFE8F3",
                                    "linecolor": "#A2B1C6"
                                },
                                "bgcolor": "white"
                            },
                            "colorway": [
                                "#636efa",
                                "#EF553B",
                                "#00cc96",
                                "#ab63fa",
                                "#19d3f3",
                                "#e763fa",
                                "#fecb52",
                                "#ffa15a",
                                "#ff6692",
                                "#b6e880"
                            ],
                            "hovermode": "closest",
                            "colorscale": {
                                "diverging": [
                                    [
                                        0,
                                        "#8e0152"
                                    ],
                                    [
                                        0.1,
                                        "#c51b7d"
                                    ],
                                    [
                                        0.2,
                                        "#de77ae"
                                    ],
                                    [
                                        0.3,
                                        "#f1b6da"
                                    ],
                                    [
                                        0.4,
                                        "#fde0ef"
                                    ],
                                    [
                                        0.5,
                                        "#f7f7f7"
                                    ],
                                    [
                                        0.6,
                                        "#e6f5d0"
                                    ],
                                    [
                                        0.7,
                                        "#b8e186"
                                    ],
                                    [
                                        0.8,
                                        "#7fbc41"
                                    ],
                                    [
                                        0.9,
                                        "#4d9221"
                                    ],
                                    [
                                        1,
                                        "#276419"
                                    ]
                                ],
                                "sequential": [
                                    [
                                        0,
                                        "#0508b8"
                                    ],
                                    [
                                        0.0893854748603352,
                                        "#1910d8"
                                    ],
                                    [
                                        0.1787709497206704,
                                        "#3c19f0"
                                    ],
                                    [
                                        0.2681564245810056,
                                        "#6b1cfb"
                                    ],
                                    [
                                        0.3575418994413408,
                                        "#981cfd"
                                    ],
                                    [
                                        0.44692737430167595,
                                        "#bf1cfd"
                                    ],
                                    [
                                        0.5363128491620112,
                                        "#dd2bfd"
                                    ],
                                    [
                                        0.6256983240223464,
                                        "#f246fe"
                                    ],
                                    [
                                        0.7150837988826816,
                                        "#fc67fd"
                                    ],
                                    [
                                        0.8044692737430168,
                                        "#fe88fc"
                                    ],
                                    [
                                        0.8938547486033519,
                                        "#fea5fd"
                                    ],
                                    [
                                        0.9832402234636871,
                                        "#febefe"
                                    ],
                                    [
                                        1,
                                        "#fec3fe"
                                    ]
                                ],
                                "sequentialminus": [
                                    [
                                        0,
                                        "#0508b8"
                                    ],
                                    [
                                        0.0893854748603352,
                                        "#1910d8"
                                    ],
                                    [
                                        0.1787709497206704,
                                        "#3c19f0"
                                    ],
                                    [
                                        0.2681564245810056,
                                        "#6b1cfb"
                                    ],
                                    [
                                        0.3575418994413408,
                                        "#981cfd"
                                    ],
                                    [
                                        0.44692737430167595,
                                        "#bf1cfd"
                                    ],
                                    [
                                        0.5363128491620112,
                                        "#dd2bfd"
                                    ],
                                    [
                                        0.6256983240223464,
                                        "#f246fe"
                                    ],
                                    [
                                        0.7150837988826816,
                                        "#fc67fd"
                                    ],
                                    [
                                        0.8044692737430168,
                                        "#fe88fc"
                                    ],
                                    [
                                        0.8938547486033519,
                                        "#fea5fd"
                                    ],
                                    [
                                        0.9832402234636871,
                                        "#febefe"
                                    ],
                                    [
                                        1,
                                        "#fec3fe"
                                    ]
                                ]
                            },
                            "plot_bgcolor": "white",
                            "paper_bgcolor": "white",
                            "shapedefaults": {
                                "line": {
                                    "width": 0
                                },
                                "opacity": 0.4,
                                "fillcolor": "#506784"
                            },
                            "annotationdefaults": {
                                "arrowhead": 0,
                                "arrowcolor": "#506784",
                                "arrowwidth": 1
                            }
                        },
                        "themeRef": "PLOTLY_WHITE"
                    }
                }
            },
            "height": null,
            "width": null,
            "user": {
                "profile_url": "https://chart-studio.plotly.com/~cedma.santos",
                "avatar_url": "https://storage.googleapis.com/plotly-prod-profiles/68.jpg",
                "background_url": "https://storage.googleapis.com/plotly-prod-profiles/bg-4.jpg",
                "bio": "",
                "nickname": "",
                "website": "",
                "stream_tokens": null,
                "feature_set_id": null,
                "csrf_token": null,
                "date_joined": "2024-04-18 14:16:33",
                "mapbox_access_tokens": null,
                "has_password": null,
                "username": "cedma.santos",
                "email": null,
                "is_active": null,
                "readonly": null,
                "is_dash_creator": null,
                "dash_created_count": null,
                "is_chart_creator": null,
                "charts_created_count": null
            }
        },
        {
            "creation_time": "2024-04-18T13:55:11.303487Z",
            "comments": {
                "results": [],
                "count": 0
            },
            "parented": true,
            "embed_url": "https://chart-studio.plotly.com/~labheshnp888/8.embed",
            "fid": "labheshnp888:8",
            "filename": "MFB",
            "filetype": "plot",
            "img_url": "https://storage.googleapis.com/plotly-prod-images/labheshnp888/8/9_GKK2N4JF5H2OLZJQNS4B74KZAHDU1O.png",
            "image_urls": {
                "default": "https://storage.googleapis.com/plotly-prod-images/labheshnp888/8/2_H0AG1VQ4JG6XZ7CKLRAKSPMYJY0O3T.png",
                "block-thumb": "https://storage.googleapis.com/plotly-prod-images/labheshnp888/8/8_9JN44R61V1YTWJNXPCRSUO5D5ZVVYU.png",
                "list-thumb": "https://storage.googleapis.com/plotly-prod-images/labheshnp888/8/9_GKK2N4JF5H2OLZJQNS4B74KZAHDU1O.png"
            },
            "api_urls": {
                "files": "https://api.plotly.com/v2/files/labheshnp888:8",
                "plots": "https://api.plotly.com/v2/plots/labheshnp888:8",
                "parent": "https://api.plotly.com/v2/folders/home?user=labheshnp888"
            },
            "owner": "labheshnp888",
            "parent": -1,
            "preview": "",
            "referencers": [],
            "references": [],
            "title": "",
            "views": 1,
            "web_url": "https://chart-studio.plotly.com/~labheshnp888/8/",
            "world_readable": true,
            "date_modified": "2024-04-18T13:55:11.315Z",
            "stars": {
                "results": [],
                "count": 0
            },
            "collaborators": {
                "results": [],
                "count": 0
            },
            "subfolder_count": null,
            "refresh_interval": null,
            "organize_view_url": "https://chart-studio.plotly.com/~labheshnp888/8/",
            "current_user_permission": "read",
            "is_theme": null,
            "is_template": false,
            "autosize": true,
            "caption": "",
            "figure": {
                "data": [
                    {
                        "meta": {
                            "columnNames": {
                                "x": "A",
                                "y": "B"
                            }
                        },
                        "mode": "lines",
                        "name": "test",
                        "type": "scatter",
                        "xsrc": "labheshnp888:7:244444",
                        "ysrc": "labheshnp888:7:4767ef"
                    },
                    {
                        "meta": {
                            "columnNames": {
                                "x": "G",
                                "y": "D"
                            }
                        },
                        "mode": "lines",
                        "name": "simulation",
                        "type": "scatter",
                        "xsrc": "labheshnp888:7:012166",
                        "ysrc": "labheshnp888:7:603ae2",
                        "stackgroup": null
                    }
                ],
                "frames": [],
                "layout": {
                    "xaxis": {
                        "type": "linear",
                        "range": [
                            -19.6292,
                            103
                        ],
                        "title": {
                            "text": "Crank angle (deg)"
                        },
                        "autorange": true
                    },
                    "yaxis": {
                        "type": "linear",
                        "range": [
                            -0.046285111111111124,
                            1.0550571111111111
                        ],
                        "title": {
                            "text": "MFB"
                        },
                        "autorange": true
                    },
                    "autosize": true,
                    "dragmode": "pan",
                    "template": {
                        "data": {
                            "bar": [
                                {
                                    "type": "bar",
                                    "marker": {
                                        "colorbar": {
                                            "ticks": "",
                                            "outlinewidth": 0
                                        }
                                    }
                                }
                            ],
                            "table": [
                                {
                                    "type": "table",
                                    "cells": {
                                        "fill": {
                                            "color": "#EBF0F8"
                                        },
                                        "line": {
                                            "color": "white"
                                        }
                                    },
                                    "header": {
                                        "fill": {
                                            "color": "#C8D4E3"
                                        },
                                        "line": {
                                            "color": "white"
                                        }
                                    }
                                }
                            ],
                            "carpet": [
                                {
                                    "type": "carpet",
                                    "aaxis": {
                                        "gridcolor": "#C8D4E3",
                                        "linecolor": "#C8D4E3",
                                        "endlinecolor": "#2a3f5f",
                                        "minorgridcolor": "#C8D4E3",
                                        "startlinecolor": "#2a3f5f"
                                    },
                                    "baxis": {
                                        "gridcolor": "#C8D4E3",
                                        "linecolor": "#C8D4E3",
                                        "endlinecolor": "#2a3f5f",
                                        "minorgridcolor": "#C8D4E3",
                                        "startlinecolor": "#2a3f5f"
                                    }
                                }
                            ],
                            "mesh3d": [
                                {
                                    "type": "mesh3d",
                                    "colorbar": {
                                        "ticks": "",
                                        "outlinewidth": 0
                                    }
                                }
                            ],
                            "contour": [
                                {
                                    "type": "contour",
                                    "colorbar": {
                                        "ticks": "",
                                        "outlinewidth": 0
                                    },
                                    "autocolorscale": true
                                }
                            ],
                            "heatmap": [
                                {
                                    "type": "heatmap",
                                    "colorbar": {
                                        "ticks": "",
                                        "outlinewidth": 0
                                    },
                                    "autocolorscale": true
                                }
                            ],
                            "scatter": [
                                {
                                    "type": "scatter",
                                    "marker": {
                                        "colorbar": {
                                            "ticks": "",
                                            "outlinewidth": 0
                                        }
                                    }
                                }
                            ],
                            "surface": [
                                {
                                    "type": "surface",
                                    "colorbar": {
                                        "ticks": "",
                                        "outlinewidth": 0
                                    }
                                }
                            ],
                            "heatmapgl": [
                                {
                                    "type": "heatmapgl",
                                    "colorbar": {
                                        "ticks": "",
                                        "outlinewidth": 0
                                    }
                                }
                            ],
                            "histogram": [
                                {
                                    "type": "histogram",
                                    "marker": {
                                        "colorbar": {
                                            "ticks": "",
                                            "outlinewidth": 0
                                        }
                                    }
                                }
                            ],
                            "parcoords": [
                                {
                                    "line": {
                                        "colorbar": {
                                            "ticks": "",
                                            "outlinewidth": 0
                                        }
                                    },
                                    "type": "parcoords"
                                }
                            ],
                            "scatter3d": [
                                {
                                    "type": "scatter3d",
                                    "marker": {
                                        "colorbar": {
                                            "ticks": "",
                                            "outlinewidth": 0
                                        }
                                    }
                                }
                            ],
                            "scattergl": [
                                {
                                    "type": "scattergl",
                                    "marker": {
                                        "colorbar": {
                                            "ticks": "",
                                            "outlinewidth": 0
                                        }
                                    }
                                }
                            ],
                            "choropleth": [
                                {
                                    "type": "choropleth",
                                    "colorbar": {
                                        "ticks": "",
                                        "outlinewidth": 0
                                    }
                                }
                            ],
                            "scattergeo": [
                                {
                                    "type": "scattergeo",
                                    "marker": {
                                        "colorbar": {
                                            "ticks": "",
                                            "outlinewidth": 0
                                        }
                                    }
                                }
                            ],
                            "histogram2d": [
                                {
                                    "type": "histogram2d",
                                    "colorbar": {
                                        "ticks": "",
                                        "outlinewidth": 0
                                    },
                                    "autocolorscale": true
                                }
                            ],
                            "scatterpolar": [
                                {
                                    "type": "scatterpolar",
                                    "marker": {
                                        "colorbar": {
                                            "ticks": "",
                                            "outlinewidth": 0
                                        }
                                    }
                                }
                            ],
                            "contourcarpet": [
                                {
                                    "type": "contourcarpet",
                                    "colorbar": {
                                        "ticks": "",
                                        "outlinewidth": 0
                                    }
                                }
                            ],
                            "scattercarpet": [
                                {
                                    "type": "scattercarpet",
                                    "marker": {
                                        "colorbar": {
                                            "ticks": "",
                                            "outlinewidth": 0
                                        }
                                    }
                                }
                            ],
                            "scattermapbox": [
                                {
                                    "type": "scattermapbox",
                                    "marker": {
                                        "colorbar": {
                                            "ticks": "",
                                            "outlinewidth": 0
                                        }
                                    }
                                }
                            ],
                            "scatterpolargl": [
                                {
                                    "type": "scatterpolargl",
                                    "marker": {
                                        "colorbar": {
                                            "ticks": "",
                                            "outlinewidth": 0
                                        }
                                    }
                                }
                            ],
                            "scatterternary": [
                                {
                                    "type": "scatterternary",
                                    "marker": {
                                        "colorbar": {
                                            "ticks": "",
                                            "outlinewidth": 0
                                        }
                                    }
                                }
                            ],
                            "histogram2dcontour": [
                                {
                                    "type": "histogram2dcontour",
                                    "colorbar": {
                                        "ticks": "",
                                        "outlinewidth": 0
                                    },
                                    "autocolorscale": true
                                }
                            ]
                        },
                        "layout": {
                            "geo": {
                                "bgcolor": "white",
                                "showland": true,
                                "lakecolor": "white",
                                "landcolor": "white",
                                "showlakes": true,
                                "subunitcolor": "#C8D4E3"
                            },
                            "font": {
                                "color": "#2a3f5f"
                            },
                            "polar": {
                                "bgcolor": "white",
                                "radialaxis": {
                                    "ticks": "",
                                    "gridcolor": "#EBF0F8",
                                    "linecolor": "#EBF0F8"
                                },
                                "angularaxis": {
                                    "ticks": "",
                                    "gridcolor": "#EBF0F8",
                                    "linecolor": "#EBF0F8"
                                }
                            },
                            "scene": {
                                "xaxis": {
                                    "ticks": "",
                                    "gridcolor": "#DFE8F3",
                                    "gridwidth": 2,
                                    "linecolor": "#EBF0F8",
                                    "zerolinecolor": "#EBF0F8",
                                    "showbackground": true,
                                    "backgroundcolor": "white"
                                },
                                "yaxis": {
                                    "ticks": "",
                                    "gridcolor": "#DFE8F3",
                                    "gridwidth": 2,
                                    "linecolor": "#EBF0F8",
                                    "zerolinecolor": "#EBF0F8",
                                    "showbackground": true,
                                    "backgroundcolor": "white"
                                },
                                "zaxis": {
                                    "ticks": "",
                                    "gridcolor": "#DFE8F3",
                                    "gridwidth": 2,
                                    "linecolor": "#EBF0F8",
                                    "zerolinecolor": "#EBF0F8",
                                    "showbackground": true,
                                    "backgroundcolor": "white"
                                }
                            },
                            "title": {
                                "x": 0.05
                            },
                            "xaxis": {
                                "ticks": "",
                                "gridcolor": "#EBF0F8",
                                "linecolor": "#EBF0F8",
                                "automargin": true,
                                "zerolinecolor": "#EBF0F8",
                                "zerolinewidth": 2
                            },
                            "yaxis": {
                                "ticks": "",
                                "gridcolor": "#EBF0F8",
                                "linecolor": "#EBF0F8",
                                "automargin": true,
                                "zerolinecolor": "#EBF0F8",
                                "zerolinewidth": 2
                            },
                            "ternary": {
                                "aaxis": {
                                    "ticks": "",
                                    "gridcolor": "#DFE8F3",
                                    "linecolor": "#A2B1C6"
                                },
                                "baxis": {
                                    "ticks": "",
                                    "gridcolor": "#DFE8F3",
                                    "linecolor": "#A2B1C6"
                                },
                                "caxis": {
                                    "ticks": "",
                                    "gridcolor": "#DFE8F3",
                                    "linecolor": "#A2B1C6"
                                },
                                "bgcolor": "white"
                            },
                            "colorway": [
                                "#636efa",
                                "#EF553B",
                                "#00cc96",
                                "#ab63fa",
                                "#19d3f3",
                                "#e763fa",
                                "#fecb52",
                                "#ffa15a",
                                "#ff6692",
                                "#b6e880"
                            ],
                            "hovermode": "closest",
                            "colorscale": {
                                "diverging": [
                                    [
                                        0,
                                        "#8e0152"
                                    ],
                                    [
                                        0.1,
                                        "#c51b7d"
                                    ],
                                    [
                                        0.2,
                                        "#de77ae"
                                    ],
                                    [
                                        0.3,
                                        "#f1b6da"
                                    ],
                                    [
                                        0.4,
                                        "#fde0ef"
                                    ],
                                    [
                                        0.5,
                                        "#f7f7f7"
                                    ],
                                    [
                                        0.6,
                                        "#e6f5d0"
                                    ],
                                    [
                                        0.7,
                                        "#b8e186"
                                    ],
                                    [
                                        0.8,
                                        "#7fbc41"
                                    ],
                                    [
                                        0.9,
                                        "#4d9221"
                                    ],
                                    [
                                        1,
                                        "#276419"
                                    ]
                                ],
                                "sequential": [
                                    [
                                        0,
                                        "#0508b8"
                                    ],
                                    [
                                        0.0893854748603352,
                                        "#1910d8"
                                    ],
                                    [
                                        0.1787709497206704,
                                        "#3c19f0"
                                    ],
                                    [
                                        0.2681564245810056,
                                        "#6b1cfb"
                                    ],
                                    [
                                        0.3575418994413408,
                                        "#981cfd"
                                    ],
                                    [
                                        0.44692737430167595,
                                        "#bf1cfd"
                                    ],
                                    [
                                        0.5363128491620112,
                                        "#dd2bfd"
                                    ],
                                    [
                                        0.6256983240223464,
                                        "#f246fe"
                                    ],
                                    [
                                        0.7150837988826816,
                                        "#fc67fd"
                                    ],
                                    [
                                        0.8044692737430168,
                                        "#fe88fc"
                                    ],
                                    [
                                        0.8938547486033519,
                                        "#fea5fd"
                                    ],
                                    [
                                        0.9832402234636871,
                                        "#febefe"
                                    ],
                                    [
                                        1,
                                        "#fec3fe"
                                    ]
                                ],
                                "sequentialminus": [
                                    [
                                        0,
                                        "#0508b8"
                                    ],
                                    [
                                        0.0893854748603352,
                                        "#1910d8"
                                    ],
                                    [
                                        0.1787709497206704,
                                        "#3c19f0"
                                    ],
                                    [
                                        0.2681564245810056,
                                        "#6b1cfb"
                                    ],
                                    [
                                        0.3575418994413408,
                                        "#981cfd"
                                    ],
                                    [
                                        0.44692737430167595,
                                        "#bf1cfd"
                                    ],
                                    [
                                        0.5363128491620112,
                                        "#dd2bfd"
                                    ],
                                    [
                                        0.6256983240223464,
                                        "#f246fe"
                                    ],
                                    [
                                        0.7150837988826816,
                                        "#fc67fd"
                                    ],
                                    [
                                        0.8044692737430168,
                                        "#fe88fc"
                                    ],
                                    [
                                        0.8938547486033519,
                                        "#fea5fd"
                                    ],
                                    [
                                        0.9832402234636871,
                                        "#febefe"
                                    ],
                                    [
                                        1,
                                        "#fec3fe"
                                    ]
                                ]
                            },
                            "plot_bgcolor": "white",
                            "paper_bgcolor": "white",
                            "shapedefaults": {
                                "line": {
                                    "width": 0
                                },
                                "opacity": 0.4,
                                "fillcolor": "#506784"
                            },
                            "annotationdefaults": {
                                "arrowhead": 0,
                                "arrowcolor": "#506784",
                                "arrowwidth": 1
                            }
                        },
                        "themeRef": "PLOTLY_WHITE"
                    },
                    "hovermode": "x"
                }
            },
            "height": null,
            "width": null,
            "user": {
                "profile_url": "https://chart-studio.plotly.com/~labheshnp888",
                "avatar_url": "https://storage.googleapis.com/plotly-prod-profiles/12.jpg",
                "background_url": "https://storage.googleapis.com/plotly-prod-profiles/bg-3.jpg",
                "bio": "",
                "nickname": "",
                "website": "",
                "stream_tokens": null,
                "feature_set_id": null,
                "csrf_token": null,
                "date_joined": "2024-04-18 09:24:15",
                "mapbox_access_tokens": null,
                "has_password": null,
                "username": "labheshnp888",
                "email": null,
                "is_active": null,
                "readonly": null,
                "is_dash_creator": null,
                "dash_created_count": null,
                "is_chart_creator": null,
                "charts_created_count": null
            }
        },
        {
            "creation_time": "2024-04-18T13:52:40.432436Z",
            "comments": {
                "results": [],
                "count": 0
            },
            "parented": true,
            "embed_url": "https://chart-studio.plotly.com/~peter.capcara/147.embed",
            "fid": "peter.capcara:147",
            "filename": "Plot 147",
            "filetype": "plot",
            "img_url": "https://storage.googleapis.com/plotly-prod-images/peter.capcara/147/9_XFZVPUC1ACMZ10XJ0EG13ATI01MMM7.png",
            "image_urls": {
                "default": "https://storage.googleapis.com/plotly-prod-images/peter.capcara/147/2_31XWDNM8BUKQ75JLQX4F1B5L0YUL82.png",
                "block-thumb": "https://storage.googleapis.com/plotly-prod-images/peter.capcara/147/8_G9XCQTI5N6JV1BLGOJDE0YDUQN4ORO.png",
                "list-thumb": "https://storage.googleapis.com/plotly-prod-images/peter.capcara/147/9_XFZVPUC1ACMZ10XJ0EG13ATI01MMM7.png"
            },
            "api_urls": {
                "files": "https://api.plotly.com/v2/files/peter.capcara:147",
                "plots": "https://api.plotly.com/v2/plots/peter.capcara:147",
                "parent": "https://api.plotly.com/v2/folders/home?user=peter.capcara"
            },
            "owner": "peter.capcara",
            "parent": -1,
            "preview": "",
            "referencers": [],
            "references": [],
            "title": "",
            "views": 3,
            "web_url": "https://chart-studio.plotly.com/~peter.capcara/147/",
            "world_readable": true,
            "date_modified": "2024-04-18T13:52:40.445Z",
            "stars": {
                "results": [],
                "count": 0
            },
            "collaborators": {
                "results": [],
                "count": 0
            },
            "subfolder_count": null,
            "refresh_interval": null,
            "organize_view_url": "https://chart-studio.plotly.com/~peter.capcara/147/",
            "current_user_permission": "read",
            "is_theme": null,
            "is_template": null,
            "autosize": true,
            "caption": "",
            "figure": {
                "data": [
                    {
                        "uid": "a1a8b8",
                        "asrc": "peter.capcara:146:c18913",
                        "bsrc": "peter.capcara:146:516250",
                        "csrc": "peter.capcara:146:ca1afd",
                        "fill": "toself",
                        "line": {
                            "color": "#444"
                        },
                        "mode": "lines",
                        "name": "PD",
                        "text": "PD",
                        "type": "scatterternary",
                        "subplot": "ternary",
                        "fillcolor": "#8dd3c7"
                    },
                    {
                        "uid": "c72344",
                        "asrc": "peter.capcara:146:601181",
                        "bsrc": "peter.capcara:146:67f1e9",
                        "csrc": "peter.capcara:146:7f14cb",
                        "fill": "toself",
                        "line": {
                            "color": "#444"
                        },
                        "mode": "lines",
                        "name": "D1",
                        "text": "D1",
                        "type": "scatterternary",
                        "subplot": "ternary",
                        "fillcolor": "#ffffb3"
                    },
                    {
                        "uid": "3eab74",
                        "asrc": "peter.capcara:146:01ae88",
                        "bsrc": "peter.capcara:146:ba2ded",
                        "csrc": "peter.capcara:146:8c8e8b",
                        "fill": "toself",
                        "line": {
                            "color": "#444"
                        },
                        "mode": "lines",
                        "name": "D2",
                        "text": "D2",
                        "type": "scatterternary",
                        "subplot": "ternary",
                        "fillcolor": "#bebada"
                    },
                    {
                        "uid": "b9dc9f",
                        "asrc": "peter.capcara:146:ac59d4",
                        "bsrc": "peter.capcara:146:ddc78d",
                        "csrc": "peter.capcara:146:10f1fa",
                        "fill": "toself",
                        "line": {
                            "color": "#444"
                        },
                        "mode": "lines",
                        "name": "DT",
                        "text": "DT",
                        "type": "scatterternary",
                        "subplot": "ternary",
                        "fillcolor": "#fb8072"
                    },
                    {
                        "uid": "381ad2",
                        "asrc": "peter.capcara:146:d0bd14",
                        "bsrc": "peter.capcara:146:45b7fc",
                        "csrc": "peter.capcara:146:85e07b",
                        "fill": "toself",
                        "line": {
                            "color": "#444"
                        },
                        "mode": "lines",
                        "name": "T1",
                        "text": "T1",
                        "type": "scatterternary",
                        "subplot": "ternary",
                        "fillcolor": "#80b1d3"
                    },
                    {
                        "uid": "8cc163",
                        "asrc": "peter.capcara:146:df2619",
                        "bsrc": "peter.capcara:146:ea69e3",
                        "csrc": "peter.capcara:146:1d7001",
                        "fill": "toself",
                        "line": {
                            "color": "#444"
                        },
                        "mode": "lines",
                        "name": "T2",
                        "text": "T2",
                        "type": "scatterternary",
                        "subplot": "ternary",
                        "fillcolor": "#fdb462"
                    },
                    {
                        "uid": "6f33dc",
                        "asrc": "peter.capcara:146:4d6f27",
                        "bsrc": "peter.capcara:146:6f236a",
                        "csrc": "peter.capcara:146:82263b",
                        "fill": "toself",
                        "line": {
                            "color": "#444"
                        },
                        "mode": "lines",
                        "name": "T3",
                        "text": "T3",
                        "type": "scatterternary",
                        "opacity": 0.5,
                        "subplot": "ternary",
                        "fillcolor": "#b3de69"
                    },
                    {
                        "asrc": "peter.capcara:146:c12e0b",
                        "bsrc": "peter.capcara:146:f0a66c",
                        "csrc": "peter.capcara:146:0c8c51",
                        "mode": "markers",
                        "name": "3264",
                        "type": "scatterternary",
                        "marker": {
                            "size": 10,
                            "color": "blue",
                            "symbol": "diamond"
                        },
                        "subplot": "ternary"
                    },
                    {
                        "asrc": "peter.capcara:146:190408",
                        "bsrc": "peter.capcara:146:04a9d9",
                        "csrc": "peter.capcara:146:5fea95",
                        "mode": "markers",
                        "name": "38",
                        "type": "scatterternary",
                        "marker": {
                            "size": 10,
                            "color": "blue",
                            "symbol": "diamond"
                        },
                        "subplot": "ternary"
                    },
                    {
                        "asrc": "peter.capcara:146:697f7f",
                        "bsrc": "peter.capcara:146:8c99d6",
                        "csrc": "peter.capcara:146:46dc10",
                        "mode": "markers",
                        "name": "37",
                        "type": "scatterternary",
                        "marker": {
                            "size": 10,
                            "color": "blue",
                            "symbol": "diamond"
                        },
                        "subplot": "ternary"
                    },
                    {
                        "asrc": "peter.capcara:146:e599c5",
                        "bsrc": "peter.capcara:146:431eb1",
                        "csrc": "peter.capcara:146:fe9800",
                        "mode": "markers",
                        "name": "36",
                        "type": "scatterternary",
                        "marker": {
                            "size": 10,
                            "color": "blue",
                            "symbol": "diamond"
                        },
                        "subplot": "ternary"
                    },
                    {
                        "asrc": "peter.capcara:146:af843b",
                        "bsrc": "peter.capcara:146:7c7e2b",
                        "csrc": "peter.capcara:146:8fe57d",
                        "mode": "markers",
                        "name": "35",
                        "type": "scatterternary",
                        "marker": {
                            "size": 10,
                            "color": "blue",
                            "symbol": "diamond"
                        },
                        "subplot": "ternary"
                    },
                    {
                        "asrc": "peter.capcara:146:0936ca",
                        "bsrc": "peter.capcara:146:77ab45",
                        "csrc": "peter.capcara:146:feb9e0",
                        "mode": "markers",
                        "name": "34",
                        "type": "scatterternary",
                        "marker": {
                            "size": 10,
                            "color": "blue",
                            "symbol": "diamond"
                        },
                        "subplot": "ternary"
                    },
                    {
                        "asrc": "peter.capcara:146:e7108f",
                        "bsrc": "peter.capcara:146:740d0e",
                        "csrc": "peter.capcara:146:1cce7d",
                        "mode": "markers",
                        "name": "33",
                        "type": "scatterternary",
                        "marker": {
                            "size": 10,
                            "color": "blue",
                            "symbol": "diamond"
                        },
                        "subplot": "ternary"
                    },
                    {
                        "asrc": "peter.capcara:146:281735",
                        "bsrc": "peter.capcara:146:6fc394",
                        "csrc": "peter.capcara:146:9ccb47",
                        "mode": "markers",
                        "name": "32",
                        "type": "scatterternary",
                        "marker": {
                            "size": 10,
                            "color": "blue",
                            "symbol": "diamond"
                        },
                        "subplot": "ternary"
                    },
                    {
                        "asrc": "peter.capcara:146:3cd455",
                        "bsrc": "peter.capcara:146:5a014b",
                        "csrc": "peter.capcara:146:d04418",
                        "mode": "markers",
                        "name": "31",
                        "type": "scatterternary",
                        "marker": {
                            "size": 10,
                            "color": "blue",
                            "symbol": "diamond"
                        },
                        "subplot": "ternary"
                    },
                    {
                        "asrc": "peter.capcara:146:ca1825",
                        "bsrc": "peter.capcara:146:cc3267",
                        "csrc": "peter.capcara:146:33ceab",
                        "mode": "markers",
                        "name": "phd",
                        "type": "scatterternary",
                        "marker": {
                            "size": 10,
                            "color": "blue",
                            "symbol": "diamond"
                        },
                        "subplot": "ternary"
                    },
                    {
                        "type": "table",
                        "cells": {
                            "fill": {
                                "color": "lavender"
                            },
                            "align": "left",
                            "valuessrc": "peter.capcara:146:b13857"
                        },
                        "domain": {
                            "x": [
                                0.0,
                                1.0
                            ],
                            "y": [
                                0.0,
                                0.255
                            ]
                        },
                        "header": {
                            "fill": {
                                "color": "paleturquoise"
                            },
                            "align": "left",
                            "valuessrc": "peter.capcara:146:f6220c"
                        },
                        "columnwidthsrc": "peter.capcara:146:8d6441"
                    }
                ],
                "layout": {
                    "title": {
                        "text": "Duval Triangle for DGA Interpretation"
                    },
                    "height": 1000,
                    "ternary": {
                        "sum": 100,
                        "aaxis": {
                            "min": 0.01,
                            "ticks": "outside",
                            "title": {
                                "text": "CH4(Methane)"
                            },
                            "linewidth": 2,
                            "ticksuffix": "%"
                        },
                        "baxis": {
                            "min": 0.01,
                            "ticks": "outside",
                            "title": {
                                "text": "C2H2(Acetylene)"
                            },
                            "linewidth": 2,
                            "ticksuffix": "%"
                        },
                        "caxis": {
                            "min": 0.01,
                            "ticks": "outside",
                            "title": {
                                "text": "C2H4(Ethylene)"
                            },
                            "linewidth": 2,
                            "ticksuffix": "%"
                        },
                        "domain": {
                            "x": [
                                0.0,
                                1.0
                            ],
                            "y": [
                                0.405,
                                1.0
                            ]
                        }
                    },
                    "autosize": true,
                    "template": {
                        "data": {
                            "bar": [
                                {
                                    "type": "bar",
                                    "marker": {
                                        "line": {
                                            "color": "#E5ECF6",
                                            "width": 0.5
                                        },
                                        "pattern": {
                                            "size": 10,
                                            "fillmode": "overlay",
                                            "solidity": 0.2
                                        }
                                    },
                                    "error_x": {
                                        "color": "#2a3f5f"
                                    },
                                    "error_y": {
                                        "color": "#2a3f5f"
                                    }
                                }
                            ],
                            "pie": [
                                {
                                    "type": "pie",
                                    "automargin": true
                                }
                            ],
                            "table": [
                                {
                                    "type": "table",
                                    "cells": {
                                        "fill": {
                                            "color": "#EBF0F8"
                                        },
                                        "line": {
                                            "color": "white"
                                        }
                                    },
                                    "header": {
                                        "fill": {
                                            "color": "#C8D4E3"
                                        },
                                        "line": {
                                            "color": "white"
                                        }
                                    }
                                }
                            ],
                            "carpet": [
                                {
                                    "type": "carpet",
                                    "aaxis": {
                                        "gridcolor": "white",
                                        "linecolor": "white",
                                        "endlinecolor": "#2a3f5f",
                                        "minorgridcolor": "white",
                                        "startlinecolor": "#2a3f5f"
                                    },
                                    "baxis": {
                                        "gridcolor": "white",
                                        "linecolor": "white",
                                        "endlinecolor": "#2a3f5f",
                                        "minorgridcolor": "white",
                                        "startlinecolor": "#2a3f5f"
                                    }
                                }
                            ],
                            "mesh3d": [
                                {
                                    "type": "mesh3d",
                                    "colorbar": {
                                        "ticks": "",
                                        "outlinewidth": 0
                                    }
                                }
                            ],
                            "contour": [
                                {
                                    "type": "contour",
                                    "colorbar": {
                                        "ticks": "",
                                        "outlinewidth": 0
                                    },
                                    "colorscale": [
                                        [
                                            0.0,
                                            "#0d0887"
                                        ],
                                        [
                                            0.1111111111111111,
                                            "#46039f"
                                        ],
                                        [
                                            0.2222222222222222,
                                            "#7201a8"
                                        ],
                                        [
                                            0.3333333333333333,
                                            "#9c179e"
                                        ],
                                        [
                                            0.4444444444444444,
                                            "#bd3786"
                                        ],
                                        [
                                            0.5555555555555556,
                                            "#d8576b"
                                        ],
                                        [
                                            0.6666666666666666,
                                            "#ed7953"
                                        ],
                                        [
                                            0.7777777777777778,
                                            "#fb9f3a"
                                        ],
                                        [
                                            0.8888888888888888,
                                            "#fdca26"
                                        ],
                                        [
                                            1.0,
                                            "#f0f921"
                                        ]
                                    ]
                                }
                            ],
                            "heatmap": [
                                {
                                    "type": "heatmap",
                                    "colorbar": {
                                        "ticks": "",
                                        "outlinewidth": 0
                                    },
                                    "colorscale": [
                                        [
                                            0.0,
                                            "#0d0887"
                                        ],
                                        [
                                            0.1111111111111111,
                                            "#46039f"
                                        ],
                                        [
                                            0.2222222222222222,
                                            "#7201a8"
                                        ],
                                        [
                                            0.3333333333333333,
                                            "#9c179e"
                                        ],
                                        [
                                            0.4444444444444444,
                                            "#bd3786"
                                        ],
                                        [
                                            0.5555555555555556,
                                            "#d8576b"
                                        ],
                                        [
                                            0.6666666666666666,
                                            "#ed7953"
                                        ],
                                        [
                                            0.7777777777777778,
                                            "#fb9f3a"
                                        ],
                                        [
                                            0.8888888888888888,
                                            "#fdca26"
                                        ],
                                        [
                                            1.0,
                                            "#f0f921"
                                        ]
                                    ]
                                }
                            ],
                            "scatter": [
                                {
                                    "type": "scatter",
                                    "fillpattern": {
                                        "size": 10,
                                        "fillmode": "overlay",
                                        "solidity": 0.2
                                    }
                                }
                            ],
                            "surface": [
                                {
                                    "type": "surface",
                                    "colorbar": {
                                        "ticks": "",
                                        "outlinewidth": 0
                                    },
                                    "colorscale": [
                                        [
                                            0.0,
                                            "#0d0887"
                                        ],
                                        [
                                            0.1111111111111111,
                                            "#46039f"
                                        ],
                                        [
                                            0.2222222222222222,
                                            "#7201a8"
                                        ],
                                        [
                                            0.3333333333333333,
                                            "#9c179e"
                                        ],
                                        [
                                            0.4444444444444444,
                                            "#bd3786"
                                        ],
                                        [
                                            0.5555555555555556,
                                            "#d8576b"
                                        ],
                                        [
                                            0.6666666666666666,
                                            "#ed7953"
                                        ],
                                        [
                                            0.7777777777777778,
                                            "#fb9f3a"
                                        ],
                                        [
                                            0.8888888888888888,
                                            "#fdca26"
                                        ],
                                        [
                                            1.0,
                                            "#f0f921"
                                        ]
                                    ]
                                }
                            ],
                            "barpolar": [
                                {
                                    "type": "barpolar",
                                    "marker": {
                                        "line": {
                                            "color": "#E5ECF6",
                                            "width": 0.5
                                        },
                                        "pattern": {
                                            "size": 10,
                                            "fillmode": "overlay",
                                            "solidity": 0.2
                                        }
                                    }
                                }
                            ],
                            "heatmapgl": [
                                {
                                    "type": "heatmapgl",
                                    "colorbar": {
                                        "ticks": "",
                                        "outlinewidth": 0
                                    },
                                    "colorscale": [
                                        [
                                            0.0,
                                            "#0d0887"
                                        ],
                                        [
                                            0.1111111111111111,
                                            "#46039f"
                                        ],
                                        [
                                            0.2222222222222222,
                                            "#7201a8"
                                        ],
                                        [
                                            0.3333333333333333,
                                            "#9c179e"
                                        ],
                                        [
                                            0.4444444444444444,
                                            "#bd3786"
                                        ],
                                        [
                                            0.5555555555555556,
                                            "#d8576b"
                                        ],
                                        [
                                            0.6666666666666666,
                                            "#ed7953"
                                        ],
                                        [
                                            0.7777777777777778,
                                            "#fb9f3a"
                                        ],
                                        [
                                            0.8888888888888888,
                                            "#fdca26"
                                        ],
                                        [
                                            1.0,
                                            "#f0f921"
                                        ]
                                    ]
                                }
                            ],
                            "histogram": [
                                {
                                    "type": "histogram",
                                    "marker": {
                                        "pattern": {
                                            "size": 10,
                                            "fillmode": "overlay",
                                            "solidity": 0.2
                                        }
                                    }
                                }
                            ],
                            "parcoords": [
                                {
                                    "line": {
                                        "colorbar": {
                                            "ticks": "",
                                            "outlinewidth": 0
                                        }
                                    },
                                    "type": "parcoords"
                                }
                            ],
                            "scatter3d": [
                                {
                                    "line": {
                                        "colorbar": {
                                            "ticks": "",
                                            "outlinewidth": 0
                                        }
                                    },
                                    "type": "scatter3d",
                                    "marker": {
                                        "colorbar": {
                                            "ticks": "",
                                            "outlinewidth": 0
                                        }
                                    }
                                }
                            ],
                            "scattergl": [
                                {
                                    "type": "scattergl",
                                    "marker": {
                                        "colorbar": {
                                            "ticks": "",
                                            "outlinewidth": 0
                                        }
                                    }
                                }
                            ],
                            "choropleth": [
                                {
                                    "type": "choropleth",
                                    "colorbar": {
                                        "ticks": "",
                                        "outlinewidth": 0
                                    }
                                }
                            ],
                            "scattergeo": [
                                {
                                    "type": "scattergeo",
                                    "marker": {
                                        "colorbar": {
                                            "ticks": "",
                                            "outlinewidth": 0
                                        }
                                    }
                                }
                            ],
                            "histogram2d": [
                                {
                                    "type": "histogram2d",
                                    "colorbar": {
                                        "ticks": "",
                                        "outlinewidth": 0
                                    },
                                    "colorscale": [
                                        [
                                            0.0,
                                            "#0d0887"
                                        ],
                                        [
                                            0.1111111111111111,
                                            "#46039f"
                                        ],
                                        [
                                            0.2222222222222222,
                                            "#7201a8"
                                        ],
                                        [
                                            0.3333333333333333,
                                            "#9c179e"
                                        ],
                                        [
                                            0.4444444444444444,
                                            "#bd3786"
                                        ],
                                        [
                                            0.5555555555555556,
                                            "#d8576b"
                                        ],
                                        [
                                            0.6666666666666666,
                                            "#ed7953"
                                        ],
                                        [
                                            0.7777777777777778,
                                            "#fb9f3a"
                                        ],
                                        [
                                            0.8888888888888888,
                                            "#fdca26"
                                        ],
                                        [
                                            1.0,
                                            "#f0f921"
                                        ]
                                    ]
                                }
                            ],
                            "scatterpolar": [
                                {
                                    "type": "scatterpolar",
                                    "marker": {
                                        "colorbar": {
                                            "ticks": "",
                                            "outlinewidth": 0
                                        }
                                    }
                                }
                            ],
                            "contourcarpet": [
                                {
                                    "type": "contourcarpet",
                                    "colorbar": {
                                        "ticks": "",
                                        "outlinewidth": 0
                                    }
                                }
                            ],
                            "scattercarpet": [
                                {
                                    "type": "scattercarpet",
                                    "marker": {
                                        "colorbar": {
                                            "ticks": "",
                                            "outlinewidth": 0
                                        }
                                    }
                                }
                            ],
                            "scattermapbox": [
                                {
                                    "type": "scattermapbox",
                                    "marker": {
                                        "colorbar": {
                                            "ticks": "",
                                            "outlinewidth": 0
                                        }
                                    }
                                }
                            ],
                            "scatterpolargl": [
                                {
                                    "type": "scatterpolargl",
                                    "marker": {
                                        "colorbar": {
                                            "ticks": "",
                                            "outlinewidth": 0
                                        }
                                    }
                                }
                            ],
                            "scatterternary": [
                                {
                                    "type": "scatterternary",
                                    "marker": {
                                        "colorbar": {
                                            "ticks": "",
                                            "outlinewidth": 0
                                        }
                                    }
                                }
                            ],
                            "histogram2dcontour": [
                                {
                                    "type": "histogram2dcontour",
                                    "colorbar": {
                                        "ticks": "",
                                        "outlinewidth": 0
                                    },
                                    "colorscale": [
                                        [
                                            0.0,
                                            "#0d0887"
                                        ],
                                        [
                                            0.1111111111111111,
                                            "#46039f"
                                        ],
                                        [
                                            0.2222222222222222,
                                            "#7201a8"
                                        ],
                                        [
                                            0.3333333333333333,
                                            "#9c179e"
                                        ],
                                        [
                                            0.4444444444444444,
                                            "#bd3786"
                                        ],
                                        [
                                            0.5555555555555556,
                                            "#d8576b"
                                        ],
                                        [
                                            0.6666666666666666,
                                            "#ed7953"
                                        ],
                                        [
                                            0.7777777777777778,
                                            "#fb9f3a"
                                        ],
                                        [
                                            0.8888888888888888,
                                            "#fdca26"
                                        ],
                                        [
                                            1.0,
                                            "#f0f921"
                                        ]
                                    ]
                                }
                            ]
                        },
                        "layout": {
                            "geo": {
                                "bgcolor": "white",
                                "showland": true,
                                "lakecolor": "white",
                                "landcolor": "#E5ECF6",
                                "showlakes": true,
                                "subunitcolor": "white"
                            },
                            "font": {
                                "color": "#2a3f5f"
                            },
                            "polar": {
                                "bgcolor": "#E5ECF6",
                                "radialaxis": {
                                    "ticks": "",
                                    "gridcolor": "white",
                                    "linecolor": "white"
                                },
                                "angularaxis": {
                                    "ticks": "",
                                    "gridcolor": "white",
                                    "linecolor": "white"
                                }
                            },
                            "scene": {
                                "xaxis": {
                                    "ticks": "",
                                    "gridcolor": "white",
                                    "gridwidth": 2,
                                    "linecolor": "white",
                                    "zerolinecolor": "white",
                                    "showbackground": true,
                                    "backgroundcolor": "#E5ECF6"
                                },
                                "yaxis": {
                                    "ticks": "",
                                    "gridcolor": "white",
                                    "gridwidth": 2,
                                    "linecolor": "white",
                                    "zerolinecolor": "white",
                                    "showbackground": true,
                                    "backgroundcolor": "#E5ECF6"
                                },
                                "zaxis": {
                                    "ticks": "",
                                    "gridcolor": "white",
                                    "gridwidth": 2,
                                    "linecolor": "white",
                                    "zerolinecolor": "white",
                                    "showbackground": true,
                                    "backgroundcolor": "#E5ECF6"
                                }
                            },
                            "title": {
                                "x": 0.05
                            },
                            "xaxis": {
                                "ticks": "",
                                "title": {
                                    "standoff": 15
                                },
                                "gridcolor": "white",
                                "linecolor": "white",
                                "automargin": true,
                                "zerolinecolor": "white",
                                "zerolinewidth": 2
                            },
                            "yaxis": {
                                "ticks": "",
                                "title": {
                                    "standoff": 15
                                },
                                "gridcolor": "white",
                                "linecolor": "white",
                                "automargin": true,
                                "zerolinecolor": "white",
                                "zerolinewidth": 2
                            },
                            "mapbox": {
                                "style": "light"
                            },
                            "ternary": {
                                "aaxis": {
                                    "ticks": "",
                                    "gridcolor": "white",
                                    "linecolor": "white"
                                },
                                "baxis": {
                                    "ticks": "",
                                    "gridcolor": "white",
                                    "linecolor": "white"
                                },
                                "caxis": {
                                    "ticks": "",
                                    "gridcolor": "white",
                                    "linecolor": "white"
                                },
                                "bgcolor": "#E5ECF6"
                            },
                            "colorway": [
                                "#636efa",
                                "#EF553B",
                                "#00cc96",
                                "#ab63fa",
                                "#FFA15A",
                                "#19d3f3",
                                "#FF6692",
                                "#B6E880",
                                "#FF97FF",
                                "#FECB52"
                            ],
                            "coloraxis": {
                                "colorbar": {
                                    "ticks": "",
                                    "outlinewidth": 0
                                }
                            },
                            "hovermode": "closest",
                            "colorscale": {
                                "diverging": [
                                    [
                                        0,
                                        "#8e0152"
                                    ],
                                    [
                                        0.1,
                                        "#c51b7d"
                                    ],
                                    [
                                        0.2,
                                        "#de77ae"
                                    ],
                                    [
                                        0.3,
                                        "#f1b6da"
                                    ],
                                    [
                                        0.4,
                                        "#fde0ef"
                                    ],
                                    [
                                        0.5,
                                        "#f7f7f7"
                                    ],
                                    [
                                        0.6,
                                        "#e6f5d0"
                                    ],
                                    [
                                        0.7,
                                        "#b8e186"
                                    ],
                                    [
                                        0.8,
                                        "#7fbc41"
                                    ],
                                    [
                                        0.9,
                                        "#4d9221"
                                    ],
                                    [
                                        1,
                                        "#276419"
                                    ]
                                ],
                                "sequential": [
                                    [
                                        0.0,
                                        "#0d0887"
                                    ],
                                    [
                                        0.1111111111111111,
                                        "#46039f"
                                    ],
                                    [
                                        0.2222222222222222,
                                        "#7201a8"
                                    ],
                                    [
                                        0.3333333333333333,
                                        "#9c179e"
                                    ],
                                    [
                                        0.4444444444444444,
                                        "#bd3786"
                                    ],
                                    [
                                        0.5555555555555556,
                                        "#d8576b"
                                    ],
                                    [
                                        0.6666666666666666,
                                        "#ed7953"
                                    ],
                                    [
                                        0.7777777777777778,
                                        "#fb9f3a"
                                    ],
                                    [
                                        0.8888888888888888,
                                        "#fdca26"
                                    ],
                                    [
                                        1.0,
                                        "#f0f921"
                                    ]
                                ],
                                "sequentialminus": [
                                    [
                                        0.0,
                                        "#0d0887"
                                    ],
                                    [
                                        0.1111111111111111,
                                        "#46039f"
                                    ],
                                    [
                                        0.2222222222222222,
                                        "#7201a8"
                                    ],
                                    [
                                        0.3333333333333333,
                                        "#9c179e"
                                    ],
                                    [
                                        0.4444444444444444,
                                        "#bd3786"
                                    ],
                                    [
                                        0.5555555555555556,
                                        "#d8576b"
                                    ],
                                    [
                                        0.6666666666666666,
                                        "#ed7953"
                                    ],
                                    [
                                        0.7777777777777778,
                                        "#fb9f3a"
                                    ],
                                    [
                                        0.8888888888888888,
                                        "#fdca26"
                                    ],
                                    [
                                        1.0,
                                        "#f0f921"
                                    ]
                                ]
                            },
                            "hoverlabel": {
                                "align": "left"
                            },
                            "plot_bgcolor": "#E5ECF6",
                            "paper_bgcolor": "white",
                            "shapedefaults": {
                                "line": {
                                    "color": "#2a3f5f"
                                }
                            },
                            "autotypenumbers": "strict",
                            "annotationdefaults": {
                                "arrowhead": 0,
                                "arrowcolor": "#2a3f5f",
                                "arrowwidth": 1
                            }
                        }
                    },
                    "showlegend": true
                }
            },
            "height": 1000,
            "width": null,
            "user": {
                "profile_url": "https://chart-studio.plotly.com/~peter.capcara",
                "avatar_url": "https://storage.googleapis.com/plotly-prod-profiles/41.jpg",
                "background_url": "https://storage.googleapis.com/plotly-prod-profiles/bg-0.jpg",
                "bio": "",
                "nickname": "",
                "website": "",
                "stream_tokens": null,
                "feature_set_id": null,
                "csrf_token": null,
                "date_joined": "2024-04-08 08:11:51",
                "mapbox_access_tokens": null,
                "has_password": null,
                "username": "peter.capcara",
                "email": null,
                "is_active": null,
                "readonly": null,
                "is_dash_creator": null,
                "dash_created_count": null,
                "is_chart_creator": null,
                "charts_created_count": null
            }
        },
        {
            "creation_time": "2024-04-18T13:44:34.369670Z",
            "comments": {
                "results": [],
                "count": 0
            },
            "parented": true,
            "embed_url": "https://chart-studio.plotly.com/~labheshnp888/6.embed",
            "fid": "labheshnp888:6",
            "filename": "Temp_validation",
            "filetype": "plot",
            "img_url": "https://storage.googleapis.com/plotly-prod-images/labheshnp888/6/9_KRRA38LT1PSVGHF5Y7D96PR3TYK5S0.png",
            "image_urls": {
                "default": "https://storage.googleapis.com/plotly-prod-images/labheshnp888/6/2_177VE2WR2AY4QVGCHY9L7TIJZJIZFJ.png",
                "block-thumb": "https://storage.googleapis.com/plotly-prod-images/labheshnp888/6/8_ERUT4UMUAJ8KY17XTOP48X7NUXA2OI.png",
                "list-thumb": "https://storage.googleapis.com/plotly-prod-images/labheshnp888/6/9_KRRA38LT1PSVGHF5Y7D96PR3TYK5S0.png"
            },
            "api_urls": {
                "files": "https://api.plotly.com/v2/files/labheshnp888:6",
                "plots": "https://api.plotly.com/v2/plots/labheshnp888:6",
                "parent": "https://api.plotly.com/v2/folders/home?user=labheshnp888"
            },
            "owner": "labheshnp888",
            "parent": -1,
            "preview": "",
            "referencers": [],
            "references": [],
            "title": "",
            "views": 1,
            "web_url": "https://chart-studio.plotly.com/~labheshnp888/6/",
            "world_readable": true,
            "date_modified": "2024-04-18T13:55:22.107Z",
            "stars": {
                "results": [],
                "count": 0
            },
            "collaborators": {
                "results": [],
                "count": 0
            },
            "subfolder_count": null,
            "refresh_interval": null,
            "organize_view_url": "https://chart-studio.plotly.com/~labheshnp888/6/",
            "current_user_permission": "read",
            "is_theme": null,
            "is_template": false,
            "autosize": true,
            "caption": "",
            "figure": {
                "data": [
                    {
                        "meta": {
                            "columnNames": {
                                "x": "A",
                                "y": "B"
                            }
                        },
                        "mode": "lines",
                        "name": "simulation",
                        "type": "scatter",
                        "xsrc": "labheshnp888:5:6a326f",
                        "ysrc": "labheshnp888:5:0045b2"
                    },
                    {
                        "meta": {
                            "columnNames": {
                                "x": "D",
                                "y": "C"
                            }
                        },
                        "mode": "lines",
                        "name": "test",
                        "type": "scatter",
                        "xsrc": "labheshnp888:5:a80b0d",
                        "ysrc": "labheshnp888:5:242bac",
                        "stackgroup": null
                    }
                ],
                "frames": [],
                "layout": {
                    "title": {
                        "text": "Click to enter Plot title"
                    },
                    "xaxis": {
                        "type": "linear",
                        "range": [
                            -180.441,
                            720
                        ],
                        "title": {
                            "text": "Crank angle (deg)"
                        },
                        "autorange": true
                    },
                    "yaxis": {
                        "type": "linear",
                        "range": [
                            228.20440555555555,
                            1703.8302944444445
                        ],
                        "title": {
                            "text": "Temperature (celsius)"
                        },
                        "autorange": true
                    },
                    "legend": {
                        "x": 0.4447933884297521,
                        "y": 0.9141221374045801
                    },
                    "autosize": true,
                    "template": {
                        "data": {
                            "bar": [
                                {
                                    "type": "bar",
                                    "marker": {
                                        "colorbar": {
                                            "ticks": "",
                                            "outlinewidth": 0
                                        }
                                    }
                                }
                            ],
                            "table": [
                                {
                                    "type": "table",
                                    "cells": {
                                        "fill": {
                                            "color": "#EBF0F8"
                                        },
                                        "line": {
                                            "color": "white"
                                        }
                                    },
                                    "header": {
                                        "fill": {
                                            "color": "#C8D4E3"
                                        },
                                        "line": {
                                            "color": "white"
                                        }
                                    }
                                }
                            ],
                            "carpet": [
                                {
                                    "type": "carpet",
                                    "aaxis": {
                                        "gridcolor": "#C8D4E3",
                                        "linecolor": "#C8D4E3",
                                        "endlinecolor": "#2a3f5f",
                                        "minorgridcolor": "#C8D4E3",
                                        "startlinecolor": "#2a3f5f"
                                    },
                                    "baxis": {
                                        "gridcolor": "#C8D4E3",
                                        "linecolor": "#C8D4E3",
                                        "endlinecolor": "#2a3f5f",
                                        "minorgridcolor": "#C8D4E3",
                                        "startlinecolor": "#2a3f5f"
                                    }
                                }
                            ],
                            "mesh3d": [
                                {
                                    "type": "mesh3d",
                                    "colorbar": {
                                        "ticks": "",
                                        "outlinewidth": 0
                                    }
                                }
                            ],
                            "contour": [
                                {
                                    "type": "contour",
                                    "colorbar": {
                                        "ticks": "",
                                        "outlinewidth": 0
                                    },
                                    "autocolorscale": true
                                }
                            ],
                            "heatmap": [
                                {
                                    "type": "heatmap",
                                    "colorbar": {
                                        "ticks": "",
                                        "outlinewidth": 0
                                    },
                                    "autocolorscale": true
                                }
                            ],
                            "scatter": [
                                {
                                    "type": "scatter",
                                    "marker": {
                                        "colorbar": {
                                            "ticks": "",
                                            "outlinewidth": 0
                                        }
                                    }
                                }
                            ],
                            "surface": [
                                {
                                    "type": "surface",
                                    "colorbar": {
                                        "ticks": "",
                                        "outlinewidth": 0
                                    }
                                }
                            ],
                            "heatmapgl": [
                                {
                                    "type": "heatmapgl",
                                    "colorbar": {
                                        "ticks": "",
                                        "outlinewidth": 0
                                    }
                                }
                            ],
                            "histogram": [
                                {
                                    "type": "histogram",
                                    "marker": {
                                        "colorbar": {
                                            "ticks": "",
                                            "outlinewidth": 0
                                        }
                                    }
                                }
                            ],
                            "parcoords": [
                                {
                                    "line": {
                                        "colorbar": {
                                            "ticks": "",
                                            "outlinewidth": 0
                                        }
                                    },
                                    "type": "parcoords"
                                }
                            ],
                            "scatter3d": [
                                {
                                    "type": "scatter3d",
                                    "marker": {
                                        "colorbar": {
                                            "ticks": "",
                                            "outlinewidth": 0
                                        }
                                    }
                                }
                            ],
                            "scattergl": [
                                {
                                    "type": "scattergl",
                                    "marker": {
                                        "colorbar": {
                                            "ticks": "",
                                            "outlinewidth": 0
                                        }
                                    }
                                }
                            ],
                            "choropleth": [
                                {
                                    "type": "choropleth",
                                    "colorbar": {
                                        "ticks": "",
                                        "outlinewidth": 0
                                    }
                                }
                            ],
                            "scattergeo": [
                                {
                                    "type": "scattergeo",
                                    "marker": {
                                        "colorbar": {
                                            "ticks": "",
                                            "outlinewidth": 0
                                        }
                                    }
                                }
                            ],
                            "histogram2d": [
                                {
                                    "type": "histogram2d",
                                    "colorbar": {
                                        "ticks": "",
                                        "outlinewidth": 0
                                    },
                                    "autocolorscale": true
                                }
                            ],
                            "scatterpolar": [
                                {
                                    "type": "scatterpolar",
                                    "marker": {
                                        "colorbar": {
                                            "ticks": "",
                                            "outlinewidth": 0
                                        }
                                    }
                                }
                            ],
                            "contourcarpet": [
                                {
                                    "type": "contourcarpet",
                                    "colorbar": {
                                        "ticks": "",
                                        "outlinewidth": 0
                                    }
                                }
                            ],
                            "scattercarpet": [
                                {
                                    "type": "scattercarpet",
                                    "marker": {
                                        "colorbar": {
                                            "ticks": "",
                                            "outlinewidth": 0
                                        }
                                    }
                                }
                            ],
                            "scattermapbox": [
                                {
                                    "type": "scattermapbox",
                                    "marker": {
                                        "colorbar": {
                                            "ticks": "",
                                            "outlinewidth": 0
                                        }
                                    }
                                }
                            ],
                            "scatterpolargl": [
                                {
                                    "type": "scatterpolargl",
                                    "marker": {
                                        "colorbar": {
                                            "ticks": "",
                                            "outlinewidth": 0
                                        }
                                    }
                                }
                            ],
                            "scatterternary": [
                                {
                                    "type": "scatterternary",
                                    "marker": {
                                        "colorbar": {
                                            "ticks": "",
                                            "outlinewidth": 0
                                        }
                                    }
                                }
                            ],
                            "histogram2dcontour": [
                                {
                                    "type": "histogram2dcontour",
                                    "colorbar": {
                                        "ticks": "",
                                        "outlinewidth": 0
                                    },
                                    "autocolorscale": true
                                }
                            ]
                        },
                        "layout": {
                            "geo": {
                                "bgcolor": "white",
                                "showland": true,
                                "lakecolor": "white",
                                "landcolor": "white",
                                "showlakes": true,
                                "subunitcolor": "#C8D4E3"
                            },
                            "font": {
                                "color": "#2a3f5f"
                            },
                            "polar": {
                                "bgcolor": "white",
                                "radialaxis": {
                                    "ticks": "",
                                    "gridcolor": "#EBF0F8",
                                    "linecolor": "#EBF0F8"
                                },
                                "angularaxis": {
                                    "ticks": "",
                                    "gridcolor": "#EBF0F8",
                                    "linecolor": "#EBF0F8"
                                }
                            },
                            "scene": {
                                "xaxis": {
                                    "ticks": "",
                                    "gridcolor": "#DFE8F3",
                                    "gridwidth": 2,
                                    "linecolor": "#EBF0F8",
                                    "zerolinecolor": "#EBF0F8",
                                    "showbackground": true,
                                    "backgroundcolor": "white"
                                },
                                "yaxis": {
                                    "ticks": "",
                                    "gridcolor": "#DFE8F3",
                                    "gridwidth": 2,
                                    "linecolor": "#EBF0F8",
                                    "zerolinecolor": "#EBF0F8",
                                    "showbackground": true,
                                    "backgroundcolor": "white"
                                },
                                "zaxis": {
                                    "ticks": "",
                                    "gridcolor": "#DFE8F3",
                                    "gridwidth": 2,
                                    "linecolor": "#EBF0F8",
                                    "zerolinecolor": "#EBF0F8",
                                    "showbackground": true,
                                    "backgroundcolor": "white"
                                }
                            },
                            "title": {
                                "x": 0.05
                            },
                            "xaxis": {
                                "ticks": "",
                                "gridcolor": "#EBF0F8",
                                "linecolor": "#EBF0F8",
                                "automargin": true,
                                "zerolinecolor": "#EBF0F8",
                                "zerolinewidth": 2
                            },
                            "yaxis": {
                                "ticks": "",
                                "gridcolor": "#EBF0F8",
                                "linecolor": "#EBF0F8",
                                "automargin": true,
                                "zerolinecolor": "#EBF0F8",
                                "zerolinewidth": 2
                            },
                            "ternary": {
                                "aaxis": {
                                    "ticks": "",
                                    "gridcolor": "#DFE8F3",
                                    "linecolor": "#A2B1C6"
                                },
                                "baxis": {
                                    "ticks": "",
                                    "gridcolor": "#DFE8F3",
                                    "linecolor": "#A2B1C6"
                                },
                                "caxis": {
                                    "ticks": "",
                                    "gridcolor": "#DFE8F3",
                                    "linecolor": "#A2B1C6"
                                },
                                "bgcolor": "white"
                            },
                            "colorway": [
                                "#636efa",
                                "#EF553B",
                                "#00cc96",
                                "#ab63fa",
                                "#19d3f3",
                                "#e763fa",
                                "#fecb52",
                                "#ffa15a",
                                "#ff6692",
                                "#b6e880"
                            ],
                            "hovermode": "closest",
                            "colorscale": {
                                "diverging": [
                                    [
                                        0,
                                        "#8e0152"
                                    ],
                                    [
                                        0.1,
                                        "#c51b7d"
                                    ],
                                    [
                                        0.2,
                                        "#de77ae"
                                    ],
                                    [
                                        0.3,
                                        "#f1b6da"
                                    ],
                                    [
                                        0.4,
                                        "#fde0ef"
                                    ],
                                    [
                                        0.5,
                                        "#f7f7f7"
                                    ],
                                    [
                                        0.6,
                                        "#e6f5d0"
                                    ],
                                    [
                                        0.7,
                                        "#b8e186"
                                    ],
                                    [
                                        0.8,
                                        "#7fbc41"
                                    ],
                                    [
                                        0.9,
                                        "#4d9221"
                                    ],
                                    [
                                        1,
                                        "#276419"
                                    ]
                                ],
                                "sequential": [
                                    [
                                        0,
                                        "#0508b8"
                                    ],
                                    [
                                        0.0893854748603352,
                                        "#1910d8"
                                    ],
                                    [
                                        0.1787709497206704,
                                        "#3c19f0"
                                    ],
                                    [
                                        0.2681564245810056,
                                        "#6b1cfb"
                                    ],
                                    [
                                        0.3575418994413408,
                                        "#981cfd"
                                    ],
                                    [
                                        0.44692737430167595,
                                        "#bf1cfd"
                                    ],
                                    [
                                        0.5363128491620112,
                                        "#dd2bfd"
                                    ],
                                    [
                                        0.6256983240223464,
                                        "#f246fe"
                                    ],
                                    [
                                        0.7150837988826816,
                                        "#fc67fd"
                                    ],
                                    [
                                        0.8044692737430168,
                                        "#fe88fc"
                                    ],
                                    [
                                        0.8938547486033519,
                                        "#fea5fd"
                                    ],
                                    [
                                        0.9832402234636871,
                                        "#febefe"
                                    ],
                                    [
                                        1,
                                        "#fec3fe"
                                    ]
                                ],
                                "sequentialminus": [
                                    [
                                        0,
                                        "#0508b8"
                                    ],
                                    [
                                        0.0893854748603352,
                                        "#1910d8"
                                    ],
                                    [
                                        0.1787709497206704,
                                        "#3c19f0"
                                    ],
                                    [
                                        0.2681564245810056,
                                        "#6b1cfb"
                                    ],
                                    [
                                        0.3575418994413408,
                                        "#981cfd"
                                    ],
                                    [
                                        0.44692737430167595,
                                        "#bf1cfd"
                                    ],
                                    [
                                        0.5363128491620112,
                                        "#dd2bfd"
                                    ],
                                    [
                                        0.6256983240223464,
                                        "#f246fe"
                                    ],
                                    [
                                        0.7150837988826816,
                                        "#fc67fd"
                                    ],
                                    [
                                        0.8044692737430168,
                                        "#fe88fc"
                                    ],
                                    [
                                        0.8938547486033519,
                                        "#fea5fd"
                                    ],
                                    [
                                        0.9832402234636871,
                                        "#febefe"
                                    ],
                                    [
                                        1,
                                        "#fec3fe"
                                    ]
                                ]
                            },
                            "plot_bgcolor": "white",
                            "paper_bgcolor": "white",
                            "shapedefaults": {
                                "line": {
                                    "width": 0
                                },
                                "opacity": 0.4,
                                "fillcolor": "#506784"
                            },
                            "annotationdefaults": {
                                "arrowhead": 0,
                                "arrowcolor": "#506784",
                                "arrowwidth": 1
                            }
                        },
                        "themeRef": "PLOTLY_WHITE"
                    }
                }
            },
            "height": null,
            "width": null,
            "user": {
                "profile_url": "https://chart-studio.plotly.com/~labheshnp888",
                "avatar_url": "https://storage.googleapis.com/plotly-prod-profiles/12.jpg",
                "background_url": "https://storage.googleapis.com/plotly-prod-profiles/bg-3.jpg",
                "bio": "",
                "nickname": "",
                "website": "",
                "stream_tokens": null,
                "feature_set_id": null,
                "csrf_token": null,
                "date_joined": "2024-04-18 09:24:15",
                "mapbox_access_tokens": null,
                "has_password": null,
                "username": "labheshnp888",
                "email": null,
                "is_active": null,
                "readonly": null,
                "is_dash_creator": null,
                "dash_created_count": null,
                "is_chart_creator": null,
                "charts_created_count": null
            }
        },
        {
            "creation_time": "2024-04-18T13:35:21.966101Z",
            "comments": {
                "results": [],
                "count": 0
            },
            "parented": true,
            "embed_url": "https://chart-studio.plotly.com/~shaker2549/0.embed",
            "fid": "shaker2549:0",
            "filename": "plot from API",
            "filetype": "plot",
            "img_url": "https://storage.googleapis.com/plotly-prod-images/shaker2549/0/9_DLSHQI43GP8P41V20RFMDDSI0F6SK5.png",
            "image_urls": {
                "default": "https://storage.googleapis.com/plotly-prod-images/shaker2549/0/2_WJJFRPUXJ78MOC5N61HELWWKHKXOUV.png",
                "block-thumb": "https://storage.googleapis.com/plotly-prod-images/shaker2549/0/8_BQXB6978J7CJJ93C4WDQ6PVPOELKEI.png",
                "list-thumb": "https://storage.googleapis.com/plotly-prod-images/shaker2549/0/9_DLSHQI43GP8P41V20RFMDDSI0F6SK5.png"
            },
            "api_urls": {
                "files": "https://api.plotly.com/v2/files/shaker2549:0",
                "plots": "https://api.plotly.com/v2/plots/shaker2549:0",
                "parent": "https://api.plotly.com/v2/folders/home?user=shaker2549"
            },
            "owner": "shaker2549",
            "parent": -1,
            "preview": "",
            "referencers": [],
            "references": [],
            "title": "",
            "views": 1,
            "web_url": "https://chart-studio.plotly.com/~shaker2549/0/",
            "world_readable": true,
            "date_modified": "2024-04-18T13:35:22.312Z",
            "stars": {
                "results": [],
                "count": 0
            },
            "collaborators": {
                "results": [],
                "count": 0
            },
            "subfolder_count": null,
            "refresh_interval": null,
            "organize_view_url": "https://chart-studio.plotly.com/~shaker2549/0/",
            "current_user_permission": "read",
            "is_theme": null,
            "is_template": null,
            "autosize": true,
            "caption": "",
            "figure": {
                "data": [
                    {
                        "mode": "lines markers",
                        "type": "scatter",
                        "xsrc": "shaker2549:1:de51a7",
                        "ysrc": "shaker2549:1:d2cf19"
                    }
                ],
                "layout": {}
            },
            "height": null,
            "width": null,
            "user": {
                "profile_url": "https://chart-studio.plotly.com/~shaker2549",
                "avatar_url": "https://storage.googleapis.com/plotly-prod-profiles/88.jpg",
                "background_url": "https://storage.googleapis.com/plotly-prod-profiles/bg-0.jpg",
                "bio": "",
                "nickname": "",
                "website": "",
                "stream_tokens": null,
                "feature_set_id": null,
                "csrf_token": null,
                "date_joined": "2024-04-18 13:30:28",
                "mapbox_access_tokens": null,
                "has_password": null,
                "username": "shaker2549",
                "email": null,
                "is_active": null,
                "readonly": null,
                "is_dash_creator": null,
                "dash_created_count": null,
                "is_chart_creator": null,
                "charts_created_count": null
            }
        },
        {
            "creation_time": "2024-04-18T13:28:03.388533Z",
            "comments": {
                "results": [],
                "count": 0
            },
            "parented": true,
            "embed_url": "https://chart-studio.plotly.com/~tanyadathe/4.embed",
            "fid": "tanyadathe:4",
            "filename": "DPY plates 10d 4.3a + 9.2a",
            "filetype": "plot",
            "img_url": "https://api.plotly.com/v2/files/tanyadathe:4/image?image_name=list-thumb",
            "image_urls": {
                "default": "https://api.plotly.com/v2/files/tanyadathe:4/image?image_name=default",
                "block-thumb": "https://api.plotly.com/v2/files/tanyadathe:4/image?image_name=block-thumb",
                "list-thumb": "https://api.plotly.com/v2/files/tanyadathe:4/image?image_name=list-thumb"
            },
            "api_urls": {
                "files": "https://api.plotly.com/v2/files/tanyadathe:4",
                "plots": "https://api.plotly.com/v2/plots/tanyadathe:4",
                "parent": "https://api.plotly.com/v2/folders/home?user=tanyadathe"
            },
            "owner": "tanyadathe",
            "parent": -1,
            "preview": "",
            "referencers": [],
            "references": [],
            "title": "",
            "views": 1,
            "web_url": "https://chart-studio.plotly.com/~tanyadathe/4/",
            "world_readable": true,
            "date_modified": "2024-04-18T14:45:36.043Z",
            "stars": {
                "results": [],
                "count": 0
            },
            "collaborators": {
                "results": [],
                "count": 0
            },
            "subfolder_count": null,
            "refresh_interval": null,
            "organize_view_url": "https://chart-studio.plotly.com/~tanyadathe/4/",
            "current_user_permission": "read",
            "is_theme": null,
            "is_template": true,
            "autosize": true,
            "caption": "",
            "figure": {
                "data": [
                    {
                        "line": {
                            "shape": "linear",
                            "width": 2,
                            "smoothing": 1.3
                        },
                        "meta": {
                            "columnNames": {
                                "x": "RT(minutes) - NOT USED BY IMPORT",
                                "y": "TIC"
                            }
                        },
                        "mode": "lines",
                        "name": "WT 10d",
                        "type": "scatter",
                        "xsrc": "tanyadathe:0:44cb3f",
                        "ysrc": "tanyadathe:0:f775ee",
                        "visible": true
                    },
                    {
                        "meta": {
                            "columnNames": {
                                "x": "RT(minutes) - NOT USED BY IMPORT",
                                "y": "TIC"
                            }
                        },
                        "mode": "lines",
                        "name": "9.2a c6.6 10d",
                        "type": "scatter",
                        "xsrc": "tanyadathe:1:fcb50a",
                        "ysrc": "tanyadathe:1:dafa1f",
                        "yaxis": "y2",
                        "stackgroup": null
                    },
                    {
                        "meta": {
                            "columnNames": {
                                "x": "RT(minutes) - NOT USED BY IMPORT",
                                "y": "TIC"
                            }
                        },
                        "mode": "lines",
                        "name": "4.3a c1.4 10d",
                        "type": "scatter",
                        "xsrc": "tanyadathe:2:642a27",
                        "ysrc": "tanyadathe:2:550fcb",
                        "yaxis": "y3",
                        "stackgroup": null
                    },
                    {
                        "meta": {
                            "columnNames": {
                                "x": "RT(minutes) - NOT USED BY IMPORT",
                                "y": "TIC"
                            }
                        },
                        "mode": "lines",
                        "name": "4.3a c1.5 10d",
                        "type": "scatter",
                        "xsrc": "tanyadathe:3:c9da25",
                        "ysrc": "tanyadathe:3:e6f4d5",
                        "yaxis": "y4",
                        "stackgroup": null
                    }
                ],
                "frames": [],
                "layout": {
                    "title": {
                        "x": 0.5,
                        "font": {
                            "size": 50
                        },
                        "text": "DPY plates"
                    },
                    "xaxis": {
                        "type": "linear",
                        "range": [
                            0,
                            31.01
                        ],
                        "title": {
                            "font": {
                                "size": 40
                            },
                            "text": "time [min]"
                        },
                        "anchor": "free",
                        "domain": [
                            0,
                            1
                        ],
                        "tickfont": {
                            "size": 25
                        },
                        "zeroline": true,
                        "autorange": true,
                        "showticklabels": true
                    },
                    "yaxis": {
                        "type": "linear",
                        "range": [
                            -94.03777777777778,
                            1786.7177777777779
                        ],
                        "title": {
                            "font": {
                                "size": 40
                            },
                            "text": "TIC"
                        },
                        "autorange": false,
                        "showticklabels": false
                    },
                    "legend": {
                        "x": 0.8476366435719784,
                        "y": 1.1938144329896907,
                        "font": {
                            "size": 25
                        },
                        "title": {
                            "font": {
                                "size": 1
                            },
                            "text": "<br>"
                        },
                        "valign": "middle",
                        "xanchor": "left",
                        "yanchor": "auto",
                        "itemsizing": "trace",
                        "traceorder": "normal",
                        "borderwidth": 1,
                        "orientation": "v",
                        "tracegroupgap": 10
                    },
                    "margin": {
                        "b": 80
                    },
                    "yaxis2": {
                        "side": "right",
                        "type": "linear",
                        "range": [
                            -236.91261340206188,
                            1310.597386597938
                        ],
                        "showgrid": false,
                        "zeroline": false,
                        "autorange": false,
                        "overlaying": "y",
                        "showticklabels": false
                    },
                    "yaxis3": {
                        "side": "right",
                        "type": "linear",
                        "range": [
                            -381.0019625112917,
                            1091.982906504065
                        ],
                        "showgrid": false,
                        "zeroline": false,
                        "autorange": false,
                        "overlaying": "y",
                        "showticklabels": false
                    },
                    "yaxis4": {
                        "side": "right",
                        "type": "linear",
                        "range": [
                            -421.6310240549828,
                            745.2223092783504
                        ],
                        "showgrid": false,
                        "zeroline": false,
                        "autorange": false,
                        "overlaying": "y",
                        "showticklabels": false
                    },
                    "modebar": {
                        "orientation": "h"
                    },
                    "autosize": true,
                    "showlegend": true
                }
            },
            "height": null,
            "width": null,
            "user": {
                "profile_url": "https://chart-studio.plotly.com/~tanyadathe",
                "avatar_url": "https://storage.googleapis.com/plotly-prod-profiles/19.jpg",
                "background_url": "https://storage.googleapis.com/plotly-prod-profiles/bg-13.jpg",
                "bio": "",
                "nickname": "",
                "website": "",
                "stream_tokens": null,
                "feature_set_id": null,
                "csrf_token": null,
                "date_joined": "2024-04-18 11:33:05",
                "mapbox_access_tokens": null,
                "has_password": null,
                "username": "tanyadathe",
                "email": null,
                "is_active": null,
                "readonly": null,
                "is_dash_creator": null,
                "dash_created_count": null,
                "is_chart_creator": null,
                "charts_created_count": null
            }
        },
        {
            "creation_time": "2024-04-18T13:23:00.702510Z",
            "comments": {
                "results": [],
                "count": 0
            },
            "parented": true,
            "embed_url": "https://chart-studio.plotly.com/~adam.kwiatkowski.fizyk/1.embed",
            "fid": "adam.kwiatkowski.fizyk:1",
            "filename": "wykres testowy",
            "filetype": "plot",
            "img_url": "https://storage.googleapis.com/plotly-prod-images/adam.kwiatkowski.fizyk/1/9_G6Q0I3D5IMVXCCZDE4CET7PGR5DOM5.png",
            "image_urls": {
                "default": "https://storage.googleapis.com/plotly-prod-images/adam.kwiatkowski.fizyk/1/2_9MPMRB0QRDZ6AD14EBE3OPD8F0IF82.png",
                "block-thumb": "https://storage.googleapis.com/plotly-prod-images/adam.kwiatkowski.fizyk/1/8_PE8KA9IJUNDBRQRO8WA5OB1IOS2K1G.png",
                "list-thumb": "https://storage.googleapis.com/plotly-prod-images/adam.kwiatkowski.fizyk/1/9_G6Q0I3D5IMVXCCZDE4CET7PGR5DOM5.png"
            },
            "api_urls": {
                "files": "https://api.plotly.com/v2/files/adam.kwiatkowski.fizyk:1",
                "plots": "https://api.plotly.com/v2/plots/adam.kwiatkowski.fizyk:1",
                "parent": "https://api.plotly.com/v2/folders/home?user=adam.kwiatkowski.fizyk"
            },
            "owner": "adam.kwiatkowski.fizyk",
            "parent": -1,
            "preview": "",
            "referencers": [],
            "references": [],
            "title": "",
            "views": 1,
            "web_url": "https://chart-studio.plotly.com/~adam.kwiatkowski.fizyk/1/",
            "world_readable": true,
            "date_modified": "2024-04-18T13:23:00.714Z",
            "stars": {
                "results": [],
                "count": 0
            },
            "collaborators": {
                "results": [],
                "count": 0
            },
            "subfolder_count": null,
            "refresh_interval": null,
            "organize_view_url": "https://chart-studio.plotly.com/~adam.kwiatkowski.fizyk/1/",
            "current_user_permission": "read",
            "is_theme": null,
            "is_template": false,
            "autosize": true,
            "caption": "",
            "figure": {
                "data": [
                    {
                        "line": {
                            "color": "rgb(250, 99, 99)"
                        },
                        "meta": {
                            "columnNames": {
                                "x": "A",
                                "y": "B"
                            }
                        },
                        "mode": "lines",
                        "type": "scatter",
                        "xsrc": "adam.kwiatkowski.fizyk:0:f0995d",
                        "ysrc": "adam.kwiatkowski.fizyk:0:342e00"
                    }
                ],
                "frames": [],
                "layout": {
                    "title": {
                        "text": "ZaleĆŒnoƛć poƂoĆŒenia od czasu"
                    },
                    "xaxis": {
                        "type": "linear",
                        "range": [
                            0,
                            20
                        ],
                        "title": {
                            "font": {
                                "size": 18
                            },
                            "text": "Czas (s)"
                        },
                        "nticks": 38,
                        "tickfont": {
                            "size": 18
                        },
                        "autorange": true,
                        "gridcolor": "rgb(200, 200, 200)",
                        "fixedrange": false,
                        "zerolinecolor": "rgb(151, 163, 163)"
                    },
                    "yaxis": {
                        "type": "linear",
                        "range": [
                            -0.5555555555555556,
                            10.555555555555555
                        ],
                        "title": {
                            "font": {
                                "size": 18
                            },
                            "text": "Prędkoƛć (m/s)"
                        },
                        "tickfont": {
                            "size": 18
                        },
                        "autorange": true,
                        "zerolinecolor": "rgb(151, 163, 163)"
                    },
                    "autosize": true,
                    "template": {
                        "data": {
                            "bar": [
                                {
                                    "type": "bar",
                                    "marker": {
                                        "colorbar": {
                                            "ticks": "",
                                            "outlinewidth": 0
                                        }
                                    }
                                }
                            ],
                            "table": [
                                {
                                    "type": "table",
                                    "cells": {
                                        "fill": {
                                            "color": "#EBF0F8"
                                        },
                                        "line": {
                                            "color": "white"
                                        }
                                    },
                                    "header": {
                                        "fill": {
                                            "color": "#C8D4E3"
                                        },
                                        "line": {
                                            "color": "white"
                                        }
                                    }
                                }
                            ],
                            "carpet": [
                                {
                                    "type": "carpet",
                                    "aaxis": {
                                        "gridcolor": "#C8D4E3",
                                        "linecolor": "#C8D4E3",
                                        "endlinecolor": "#2a3f5f",
                                        "minorgridcolor": "#C8D4E3",
                                        "startlinecolor": "#2a3f5f"
                                    },
                                    "baxis": {
                                        "gridcolor": "#C8D4E3",
                                        "linecolor": "#C8D4E3",
                                        "endlinecolor": "#2a3f5f",
                                        "minorgridcolor": "#C8D4E3",
                                        "startlinecolor": "#2a3f5f"
                                    }
                                }
                            ],
                            "mesh3d": [
                                {
                                    "type": "mesh3d",
                                    "colorbar": {
                                        "ticks": "",
                                        "outlinewidth": 0
                                    }
                                }
                            ],
                            "contour": [
                                {
                                    "type": "contour",
                                    "colorbar": {
                                        "ticks": "",
                                        "outlinewidth": 0
                                    },
                                    "autocolorscale": true
                                }
                            ],
                            "heatmap": [
                                {
                                    "type": "heatmap",
                                    "colorbar": {
                                        "ticks": "",
                                        "outlinewidth": 0
                                    },
                                    "autocolorscale": true
                                }
                            ],
                            "scatter": [
                                {
                                    "type": "scatter",
                                    "marker": {
                                        "colorbar": {
                                            "ticks": "",
                                            "outlinewidth": 0
                                        }
                                    }
                                }
                            ],
                            "surface": [
                                {
                                    "type": "surface",
                                    "colorbar": {
                                        "ticks": "",
                                        "outlinewidth": 0
                                    }
                                }
                            ],
                            "heatmapgl": [
                                {
                                    "type": "heatmapgl",
                                    "colorbar": {
                                        "ticks": "",
                                        "outlinewidth": 0
                                    }
                                }
                            ],
                            "histogram": [
                                {
                                    "type": "histogram",
                                    "marker": {
                                        "colorbar": {
                                            "ticks": "",
                                            "outlinewidth": 0
                                        }
                                    }
                                }
                            ],
                            "parcoords": [
                                {
                                    "line": {
                                        "colorbar": {
                                            "ticks": "",
                                            "outlinewidth": 0
                                        }
                                    },
                                    "type": "parcoords"
                                }
                            ],
                            "scatter3d": [
                                {
                                    "type": "scatter3d",
                                    "marker": {
                                        "colorbar": {
                                            "ticks": "",
                                            "outlinewidth": 0
                                        }
                                    }
                                }
                            ],
                            "scattergl": [
                                {
                                    "type": "scattergl",
                                    "marker": {
                                        "colorbar": {
                                            "ticks": "",
                                            "outlinewidth": 0
                                        }
                                    }
                                }
                            ],
                            "choropleth": [
                                {
                                    "type": "choropleth",
                                    "colorbar": {
                                        "ticks": "",
                                        "outlinewidth": 0
                                    }
                                }
                            ],
                            "scattergeo": [
                                {
                                    "type": "scattergeo",
                                    "marker": {
                                        "colorbar": {
                                            "ticks": "",
                                            "outlinewidth": 0
                                        }
                                    }
                                }
                            ],
                            "histogram2d": [
                                {
                                    "type": "histogram2d",
                                    "colorbar": {
                                        "ticks": "",
                                        "outlinewidth": 0
                                    },
                                    "autocolorscale": true
                                }
                            ],
                            "scatterpolar": [
                                {
                                    "type": "scatterpolar",
                                    "marker": {
                                        "colorbar": {
                                            "ticks": "",
                                            "outlinewidth": 0
                                        }
                                    }
                                }
                            ],
                            "contourcarpet": [
                                {
                                    "type": "contourcarpet",
                                    "colorbar": {
                                        "ticks": "",
                                        "outlinewidth": 0
                                    }
                                }
                            ],
                            "scattercarpet": [
                                {
                                    "type": "scattercarpet",
                                    "marker": {
                                        "colorbar": {
                                            "ticks": "",
                                            "outlinewidth": 0
                                        }
                                    }
                                }
                            ],
                            "scattermapbox": [
                                {
                                    "type": "scattermapbox",
                                    "marker": {
                                        "colorbar": {
                                            "ticks": "",
                                            "outlinewidth": 0
                                        }
                                    }
                                }
                            ],
                            "scatterpolargl": [
                                {
                                    "type": "scatterpolargl",
                                    "marker": {
                                        "colorbar": {
                                            "ticks": "",
                                            "outlinewidth": 0
                                        }
                                    }
                                }
                            ],
                            "scatterternary": [
                                {
                                    "type": "scatterternary",
                                    "marker": {
                                        "colorbar": {
                                            "ticks": "",
                                            "outlinewidth": 0
                                        }
                                    }
                                }
                            ],
                            "histogram2dcontour": [
                                {
                                    "type": "histogram2dcontour",
                                    "colorbar": {
                                        "ticks": "",
                                        "outlinewidth": 0
                                    },
                                    "autocolorscale": true
                                }
                            ]
                        },
                        "layout": {
                            "geo": {
                                "bgcolor": "white",
                                "showland": true,
                                "lakecolor": "white",
                                "landcolor": "white",
                                "showlakes": true,
                                "subunitcolor": "#C8D4E3"
                            },
                            "font": {
                                "color": "#2a3f5f"
                            },
                            "polar": {
                                "bgcolor": "white",
                                "radialaxis": {
                                    "ticks": "",
                                    "gridcolor": "#EBF0F8",
                                    "linecolor": "#EBF0F8"
                                },
                                "angularaxis": {
                                    "ticks": "",
                                    "gridcolor": "#EBF0F8",
                                    "linecolor": "#EBF0F8"
                                }
                            },
                            "scene": {
                                "xaxis": {
                                    "ticks": "",
                                    "gridcolor": "#DFE8F3",
                                    "gridwidth": 2,
                                    "linecolor": "#EBF0F8",
                                    "zerolinecolor": "#EBF0F8",
                                    "showbackground": true,
                                    "backgroundcolor": "white"
                                },
                                "yaxis": {
                                    "ticks": "",
                                    "gridcolor": "#DFE8F3",
                                    "gridwidth": 2,
                                    "linecolor": "#EBF0F8",
                                    "zerolinecolor": "#EBF0F8",
                                    "showbackground": true,
                                    "backgroundcolor": "white"
                                },
                                "zaxis": {
                                    "ticks": "",
                                    "gridcolor": "#DFE8F3",
                                    "gridwidth": 2,
                                    "linecolor": "#EBF0F8",
                                    "zerolinecolor": "#EBF0F8",
                                    "showbackground": true,
                                    "backgroundcolor": "white"
                                }
                            },
                            "title": {
                                "x": 0.05
                            },
                            "xaxis": {
                                "ticks": "",
                                "gridcolor": "#EBF0F8",
                                "linecolor": "#EBF0F8",
                                "automargin": true,
                                "zerolinecolor": "#EBF0F8",
                                "zerolinewidth": 2
                            },
                            "yaxis": {
                                "ticks": "",
                                "gridcolor": "#EBF0F8",
                                "linecolor": "#EBF0F8",
                                "automargin": true,
                                "zerolinecolor": "#EBF0F8",
                                "zerolinewidth": 2
                            },
                            "ternary": {
                                "aaxis": {
                                    "ticks": "",
                                    "gridcolor": "#DFE8F3",
                                    "linecolor": "#A2B1C6"
                                },
                                "baxis": {
                                    "ticks": "",
                                    "gridcolor": "#DFE8F3",
                                    "linecolor": "#A2B1C6"
                                },
                                "caxis": {
                                    "ticks": "",
                                    "gridcolor": "#DFE8F3",
                                    "linecolor": "#A2B1C6"
                                },
                                "bgcolor": "white"
                            },
                            "colorway": [
                                "#636efa",
                                "#EF553B",
                                "#00cc96",
                                "#ab63fa",
                                "#19d3f3",
                                "#e763fa",
                                "#fecb52",
                                "#ffa15a",
                                "#ff6692",
                                "#b6e880"
                            ],
                            "hovermode": "closest",
                            "colorscale": {
                                "diverging": [
                                    [
                                        0,
                                        "#8e0152"
                                    ],
                                    [
                                        0.1,
                                        "#c51b7d"
                                    ],
                                    [
                                        0.2,
                                        "#de77ae"
                                    ],
                                    [
                                        0.3,
                                        "#f1b6da"
                                    ],
                                    [
                                        0.4,
                                        "#fde0ef"
                                    ],
                                    [
                                        0.5,
                                        "#f7f7f7"
                                    ],
                                    [
                                        0.6,
                                        "#e6f5d0"
                                    ],
                                    [
                                        0.7,
                                        "#b8e186"
                                    ],
                                    [
                                        0.8,
                                        "#7fbc41"
                                    ],
                                    [
                                        0.9,
                                        "#4d9221"
                                    ],
                                    [
                                        1,
                                        "#276419"
                                    ]
                                ],
                                "sequential": [
                                    [
                                        0,
                                        "#0508b8"
                                    ],
                                    [
                                        0.0893854748603352,
                                        "#1910d8"
                                    ],
                                    [
                                        0.1787709497206704,
                                        "#3c19f0"
                                    ],
                                    [
                                        0.2681564245810056,
                                        "#6b1cfb"
                                    ],
                                    [
                                        0.3575418994413408,
                                        "#981cfd"
                                    ],
                                    [
                                        0.44692737430167595,
                                        "#bf1cfd"
                                    ],
                                    [
                                        0.5363128491620112,
                                        "#dd2bfd"
                                    ],
                                    [
                                        0.6256983240223464,
                                        "#f246fe"
                                    ],
                                    [
                                        0.7150837988826816,
                                        "#fc67fd"
                                    ],
                                    [
                                        0.8044692737430168,
                                        "#fe88fc"
                                    ],
                                    [
                                        0.8938547486033519,
                                        "#fea5fd"
                                    ],
                                    [
                                        0.9832402234636871,
                                        "#febefe"
                                    ],
                                    [
                                        1,
                                        "#fec3fe"
                                    ]
                                ],
                                "sequentialminus": [
                                    [
                                        0,
                                        "#0508b8"
                                    ],
                                    [
                                        0.0893854748603352,
                                        "#1910d8"
                                    ],
                                    [
                                        0.1787709497206704,
                                        "#3c19f0"
                                    ],
                                    [
                                        0.2681564245810056,
                                        "#6b1cfb"
                                    ],
                                    [
                                        0.3575418994413408,
                                        "#981cfd"
                                    ],
                                    [
                                        0.44692737430167595,
                                        "#bf1cfd"
                                    ],
                                    [
                                        0.5363128491620112,
                                        "#dd2bfd"
                                    ],
                                    [
                                        0.6256983240223464,
                                        "#f246fe"
                                    ],
                                    [
                                        0.7150837988826816,
                                        "#fc67fd"
                                    ],
                                    [
                                        0.8044692737430168,
                                        "#fe88fc"
                                    ],
                                    [
                                        0.8938547486033519,
                                        "#fea5fd"
                                    ],
                                    [
                                        0.9832402234636871,
                                        "#febefe"
                                    ],
                                    [
                                        1,
                                        "#fec3fe"
                                    ]
                                ]
                            },
                            "plot_bgcolor": "white",
                            "paper_bgcolor": "white",
                            "shapedefaults": {
                                "line": {
                                    "width": 0
                                },
                                "opacity": 0.4,
                                "fillcolor": "#506784"
                            },
                            "annotationdefaults": {
                                "arrowhead": 0,
                                "arrowcolor": "#506784",
                                "arrowwidth": 1
                            }
                        },
                        "themeRef": "PLOTLY_WHITE"
                    }
                }
            },
            "height": null,
            "width": null,
            "user": {
                "profile_url": "https://chart-studio.plotly.com/~adam.kwiatkowski.fizyk",
                "avatar_url": "https://storage.googleapis.com/plotly-prod-profiles/83.jpg",
                "background_url": "https://storage.googleapis.com/plotly-prod-profiles/bg-9.jpg",
                "bio": "",
                "nickname": "",
                "website": "",
                "stream_tokens": null,
                "feature_set_id": null,
                "csrf_token": null,
                "date_joined": "2024-04-18 13:22:06",
                "mapbox_access_tokens": null,
                "has_password": null,
                "username": "adam.kwiatkowski.fizyk",
                "email": null,
                "is_active": null,
                "readonly": null,
                "is_dash_creator": null,
                "dash_created_count": null,
                "is_chart_creator": null,
                "charts_created_count": null
            }
        },
        {
            "creation_time": "2024-04-18T13:20:26.380748Z",
            "comments": {
                "results": [],
                "count": 0
            },
            "parented": true,
            "embed_url": "https://chart-studio.plotly.com/~albamartinezp/1.embed",
            "fid": "albamartinezp:1",
            "filename": "Plot 1",
            "filetype": "plot",
            "img_url": "https://storage.googleapis.com/plotly-prod-images/albamartinezp/1/9_2FVXAC5ID801NNOHBQ82PG2PU3NB0T.png",
            "image_urls": {
                "default": "https://storage.googleapis.com/plotly-prod-images/albamartinezp/1/2_FPI744NWNQ4AQ289CRC3V1W6AYOUQ9.png",
                "block-thumb": "https://storage.googleapis.com/plotly-prod-images/albamartinezp/1/8_2XV9AF0KOIFNPLYCBAX8HCP7R7YPIR.png",
                "list-thumb": "https://storage.googleapis.com/plotly-prod-images/albamartinezp/1/9_2FVXAC5ID801NNOHBQ82PG2PU3NB0T.png"
            },
            "api_urls": {
                "files": "https://api.plotly.com/v2/files/albamartinezp:1",
                "plots": "https://api.plotly.com/v2/plots/albamartinezp:1",
                "parent": "https://api.plotly.com/v2/folders/home?user=albamartinezp"
            },
            "owner": "albamartinezp",
            "parent": -1,
            "preview": "",
            "referencers": [],
            "references": [],
            "title": "",
            "views": 1,
            "web_url": "https://chart-studio.plotly.com/~albamartinezp/1/",
            "world_readable": true,
            "date_modified": "2024-04-18T13:32:40.554Z",
            "stars": {
                "results": [],
                "count": 0
            },
            "collaborators": {
                "results": [],
                "count": 0
            },
            "subfolder_count": null,
            "refresh_interval": null,
            "organize_view_url": "https://chart-studio.plotly.com/~albamartinezp/1/",
            "current_user_permission": "read",
            "is_theme": null,
            "is_template": false,
            "autosize": true,
            "caption": "",
            "figure": {
                "data": [
                    {
                        "meta": {
                            "columnNames": {
                                "x": "A",
                                "y": "C"
                            }
                        },
                        "name": "Normal",
                        "type": "bar",
                        "xsrc": "albamartinezp:0:3df773",
                        "ysrc": "albamartinezp:0:d549b5",
                        "xaxis": "x",
                        "yaxis": "y",
                        "marker": {
                            "line": {
                                "color": "rgb(107, 107, 110)",
                                "width": 1
                            },
                            "color": "rgb(135, 135, 136)"
                        }
                    },
                    {
                        "meta": {
                            "columnNames": {
                                "x": "A",
                                "y": "B"
                            }
                        },
                        "name": "Cancer",
                        "type": "bar",
                        "xsrc": "albamartinezp:0:3df773",
                        "ysrc": "albamartinezp:0:078d45",
                        "marker": {
                            "line": {
                                "color": "rgb(155, 204, 141)",
                                "width": 1
                            },
                            "color": "rgb(182, 220, 170)",
                            "opacity": 1
                        },
                        "orientation": "v"
                    }
                ],
                "frames": [],
                "layout": {
                    "font": {
                        "color": "rgb(11, 10, 10)"
                    },
                    "title": {
                        "text": ""
                    },
                    "xaxis": {
                        "type": "category",
                        "range": [
                            -0.5,
                            30.5
                        ],
                        "title": {
                            "font": {
                                "size": 11,
                                "family": "Times New Roman"
                            },
                            "text": "<br>"
                        },
                        "anchor": "y",
                        "domain": [
                            0,
                            0.875
                        ],
                        "tickfont": {
                            "size": 20
                        },
                        "autorange": true,
                        "fixedrange": true
                    },
                    "yaxis": {
                        "side": "left",
                        "type": "linear",
                        "range": [
                            0,
                            431.57894736842104
                        ],
                        "title": {
                            "font": {
                                "size": 43,
                                "family": "Times New Roman"
                            },
                            "text": "Median MMP14 expression"
                        },
                        "domain": [
                            0.25,
                            1
                        ],
                        "showline": true,
                        "zeroline": true,
                        "autorange": true
                    },
                    "legend": {
                        "x": 0.9199999999999999,
                        "y": 1,
                        "font": {
                            "size": 29,
                            "family": "Times New Roman"
                        },
                        "valign": "middle",
                        "borderwidth": 0,
                        "orientation": "v"
                    },
                    "autosize": true
                }
            },
            "height": null,
            "width": null,
            "user": {
                "profile_url": "https://chart-studio.plotly.com/~albamartinezp",
                "avatar_url": "https://storage.googleapis.com/plotly-prod-profiles/80.jpg",
                "background_url": "https://storage.googleapis.com/plotly-prod-profiles/bg-5.jpg",
                "bio": "",
                "nickname": "",
                "website": "",
                "stream_tokens": null,
                "feature_set_id": null,
                "csrf_token": null,
                "date_joined": "2024-04-18 12:50:36",
                "mapbox_access_tokens": null,
                "has_password": null,
                "username": "albamartinezp",
                "email": null,
                "is_active": null,
                "readonly": null,
                "is_dash_creator": null,
                "dash_created_count": null,
                "is_chart_creator": null,
                "charts_created_count": null
            }
        },
        {
            "creation_time": "2024-04-18T13:16:15.156419Z",
            "comments": {
                "results": [],
                "count": 0
            },
            "parented": true,
            "embed_url": "https://chart-studio.plotly.com/~peter.capcara/145.embed",
            "fid": "peter.capcara:145",
            "filename": "Plot 145",
            "filetype": "plot",
            "img_url": "https://storage.googleapis.com/plotly-prod-images/peter.capcara/145/9_W0Z34S4RT31KK72YB41ALXXW3NPDGI.png",
            "image_urls": {
                "default": "https://storage.googleapis.com/plotly-prod-images/peter.capcara/145/2_3R9BR1VQFHPP27CU83ZH73FUO19Q4Q.png",
                "block-thumb": "https://storage.googleapis.com/plotly-prod-images/peter.capcara/145/8_6EIWW1C8EBFB4ICN7EQDXLTGDK2KV6.png",
                "list-thumb": "https://storage.googleapis.com/plotly-prod-images/peter.capcara/145/9_W0Z34S4RT31KK72YB41ALXXW3NPDGI.png"
            },
            "api_urls": {
                "files": "https://api.plotly.com/v2/files/peter.capcara:145",
                "plots": "https://api.plotly.com/v2/plots/peter.capcara:145",
                "parent": "https://api.plotly.com/v2/folders/home?user=peter.capcara"
            },
            "owner": "peter.capcara",
            "parent": -1,
            "preview": "",
            "referencers": [],
            "references": [],
            "title": "",
            "views": 2,
            "web_url": "https://chart-studio.plotly.com/~peter.capcara/145/",
            "world_readable": true,
            "date_modified": "2024-04-18T13:16:15.167Z",
            "stars": {
                "results": [],
                "count": 0
            },
            "collaborators": {
                "results": [],
                "count": 0
            },
            "subfolder_count": null,
            "refresh_interval": null,
            "organize_view_url": "https://chart-studio.plotly.com/~peter.capcara/145/",
            "current_user_permission": "read",
            "is_theme": null,
            "is_template": null,
            "autosize": true,
            "caption": "",
            "figure": {
                "data": [
                    {
                        "uid": "a1a8b8",
                        "asrc": "peter.capcara:144:18b484",
                        "bsrc": "peter.capcara:144:1d40fe",
                        "csrc": "peter.capcara:144:6b8f5f",
                        "fill": "toself",
                        "line": {
                            "color": "#444"
                        },
                        "mode": "lines",
                        "name": "PD",
                        "text": "PD",
                        "type": "scatterternary",
                        "subplot": "ternary",
                        "fillcolor": "#8dd3c7"
                    },
                    {
                        "uid": "c72344",
                        "asrc": "peter.capcara:144:eb908f",
                        "bsrc": "peter.capcara:144:73536c",
                        "csrc": "peter.capcara:144:4174e9",
                        "fill": "toself",
                        "line": {
                            "color": "#444"
                        },
                        "mode": "lines",
                        "name": "D1",
                        "text": "D1",
                        "type": "scatterternary",
                        "subplot": "ternary",
                        "fillcolor": "#ffffb3"
                    },
                    {
                        "uid": "3eab74",
                        "asrc": "peter.capcara:144:571843",
                        "bsrc": "peter.capcara:144:e8df24",
                        "csrc": "peter.capcara:144:59b190",
                        "fill": "toself",
                        "line": {
                            "color": "#444"
                        },
                        "mode": "lines",
                        "name": "D2",
                        "text": "D2",
                        "type": "scatterternary",
                        "subplot": "ternary",
                        "fillcolor": "#bebada"
                    },
                    {
                        "uid": "b9dc9f",
                        "asrc": "peter.capcara:144:243eb8",
                        "bsrc": "peter.capcara:144:db12b0",
                        "csrc": "peter.capcara:144:1ff5fe",
                        "fill": "toself",
                        "line": {
                            "color": "#444"
                        },
                        "mode": "lines",
                        "name": "DT",
                        "text": "DT",
                        "type": "scatterternary",
                        "subplot": "ternary",
                        "fillcolor": "#fb8072"
                    },
                    {
                        "uid": "381ad2",
                        "asrc": "peter.capcara:144:1a7431",
                        "bsrc": "peter.capcara:144:657e28",
                        "csrc": "peter.capcara:144:469e71",
                        "fill": "toself",
                        "line": {
                            "color": "#444"
                        },
                        "mode": "lines",
                        "name": "T1",
                        "text": "T1",
                        "type": "scatterternary",
                        "subplot": "ternary",
                        "fillcolor": "#80b1d3"
                    },
                    {
                        "uid": "8cc163",
                        "asrc": "peter.capcara:144:2c58c7",
                        "bsrc": "peter.capcara:144:b9df0e",
                        "csrc": "peter.capcara:144:02a46e",
                        "fill": "toself",
                        "line": {
                            "color": "#444"
                        },
                        "mode": "lines",
                        "name": "T2",
                        "text": "T2",
                        "type": "scatterternary",
                        "subplot": "ternary",
                        "fillcolor": "#fdb462"
                    },
                    {
                        "uid": "6f33dc",
                        "asrc": "peter.capcara:144:99ae46",
                        "bsrc": "peter.capcara:144:c240ee",
                        "csrc": "peter.capcara:144:33ce03",
                        "fill": "toself",
                        "line": {
                            "color": "#444"
                        },
                        "mode": "lines",
                        "name": "T3",
                        "text": "T3",
                        "type": "scatterternary",
                        "opacity": 0.5,
                        "subplot": "ternary",
                        "fillcolor": "#b3de69"
                    },
                    {
                        "asrc": "peter.capcara:144:0460fe",
                        "bsrc": "peter.capcara:144:de0421",
                        "csrc": "peter.capcara:144:4ebdf1",
                        "mode": "markers",
                        "name": "3264",
                        "type": "scatterternary",
                        "marker": {
                            "size": 10,
                            "color": "blue",
                            "symbol": "diamond"
                        },
                        "subplot": "ternary"
                    },
                    {
                        "asrc": "peter.capcara:144:2ff631",
                        "bsrc": "peter.capcara:144:fd317e",
                        "csrc": "peter.capcara:144:6b74a3",
                        "mode": "markers",
                        "name": "38",
                        "type": "scatterternary",
                        "marker": {
                            "size": 10,
                            "color": "blue",
                            "symbol": "diamond"
                        },
                        "subplot": "ternary"
                    },
                    {
                        "asrc": "peter.capcara:144:217a2a",
                        "bsrc": "peter.capcara:144:2cc3d9",
                        "csrc": "peter.capcara:144:57d8dd",
                        "mode": "markers",
                        "name": "37",
                        "type": "scatterternary",
                        "marker": {
                            "size": 10,
                            "color": "blue",
                            "symbol": "diamond"
                        },
                        "subplot": "ternary"
                    },
                    {
                        "asrc": "peter.capcara:144:b6288c",
                        "bsrc": "peter.capcara:144:8a89e7",
                        "csrc": "peter.capcara:144:8e443a",
                        "mode": "markers",
                        "name": "36",
                        "type": "scatterternary",
                        "marker": {
                            "size": 10,
                            "color": "blue",
                            "symbol": "diamond"
                        },
                        "subplot": "ternary"
                    },
                    {
                        "asrc": "peter.capcara:144:241a88",
                        "bsrc": "peter.capcara:144:da509a",
                        "csrc": "peter.capcara:144:949b8d",
                        "mode": "markers",
                        "name": "35",
                        "type": "scatterternary",
                        "marker": {
                            "size": 10,
                            "color": "blue",
                            "symbol": "diamond"
                        },
                        "subplot": "ternary"
                    },
                    {
                        "asrc": "peter.capcara:144:bd775f",
                        "bsrc": "peter.capcara:144:be0cff",
                        "csrc": "peter.capcara:144:9365b9",
                        "mode": "markers",
                        "name": "34",
                        "type": "scatterternary",
                        "marker": {
                            "size": 10,
                            "color": "blue",
                            "symbol": "diamond"
                        },
                        "subplot": "ternary"
                    },
                    {
                        "asrc": "peter.capcara:144:4abd5f",
                        "bsrc": "peter.capcara:144:cb8c40",
                        "csrc": "peter.capcara:144:7fa93c",
                        "mode": "markers",
                        "name": "33",
                        "type": "scatterternary",
                        "marker": {
                            "size": 10,
                            "color": "blue",
                            "symbol": "diamond"
                        },
                        "subplot": "ternary"
                    },
                    {
                        "asrc": "peter.capcara:144:c94455",
                        "bsrc": "peter.capcara:144:d11601",
                        "csrc": "peter.capcara:144:4c7872",
                        "mode": "markers",
                        "name": "32",
                        "type": "scatterternary",
                        "marker": {
                            "size": 10,
                            "color": "blue",
                            "symbol": "diamond"
                        },
                        "subplot": "ternary"
                    },
                    {
                        "asrc": "peter.capcara:144:f6870e",
                        "bsrc": "peter.capcara:144:72cbef",
                        "csrc": "peter.capcara:144:d59645",
                        "mode": "markers",
                        "name": "31",
                        "type": "scatterternary",
                        "marker": {
                            "size": 10,
                            "color": "blue",
                            "symbol": "diamond"
                        },
                        "subplot": "ternary"
                    },
                    {
                        "asrc": "peter.capcara:144:5cf9d6",
                        "bsrc": "peter.capcara:144:9a3a0f",
                        "csrc": "peter.capcara:144:d4371d",
                        "mode": "markers",
                        "name": "phd",
                        "type": "scatterternary",
                        "marker": {
                            "size": 10,
                            "color": "blue",
                            "symbol": "diamond"
                        },
                        "subplot": "ternary"
                    },
                    {
                        "type": "table",
                        "cells": {
                            "fill": {
                                "color": "lavender"
                            },
                            "align": "left",
                            "valuessrc": "peter.capcara:144:ce5c5e"
                        },
                        "domain": {
                            "x": [
                                0.0,
                                1.0
                            ],
                            "y": [
                                0.0,
                                0.255
                            ]
                        },
                        "header": {
                            "fill": {
                                "color": "paleturquoise"
                            },
                            "align": "left",
                            "valuessrc": "peter.capcara:144:d6e1c1"
                        },
                        "columnwidthsrc": "peter.capcara:144:23eabf"
                    }
                ],
                "layout": {
                    "title": {
                        "text": "Duval Triangle for DGA Interpretation"
                    },
                    "height": 1000,
                    "ternary": {
                        "sum": 100,
                        "aaxis": {
                            "min": 0.01,
                            "ticks": "outside",
                            "title": {
                                "text": "CH4(Methane)"
                            },
                            "linewidth": 2,
                            "ticksuffix": "%"
                        },
                        "baxis": {
                            "min": 0.01,
                            "ticks": "outside",
                            "title": {
                                "text": "C2H2(Acetylene)"
                            },
                            "linewidth": 2,
                            "ticksuffix": "%"
                        },
                        "caxis": {
                            "min": 0.01,
                            "ticks": "outside",
                            "title": {
                                "text": "C2H4(Ethylene)"
                            },
                            "linewidth": 2,
                            "ticksuffix": "%"
                        },
                        "domain": {
                            "x": [
                                0.0,
                                1.0
                            ],
                            "y": [
                                0.405,
                                1.0
                            ]
                        }
                    },
                    "autosize": true,
                    "template": {
                        "data": {
                            "bar": [
                                {
                                    "type": "bar",
                                    "marker": {
                                        "line": {
                                            "color": "#E5ECF6",
                                            "width": 0.5
                                        },
                                        "pattern": {
                                            "size": 10,
                                            "fillmode": "overlay",
                                            "solidity": 0.2
                                        }
                                    },
                                    "error_x": {
                                        "color": "#2a3f5f"
                                    },
                                    "error_y": {
                                        "color": "#2a3f5f"
                                    }
                                }
                            ],
                            "pie": [
                                {
                                    "type": "pie",
                                    "automargin": true
                                }
                            ],
                            "table": [
                                {
                                    "type": "table",
                                    "cells": {
                                        "fill": {
                                            "color": "#EBF0F8"
                                        },
                                        "line": {
                                            "color": "white"
                                        }
                                    },
                                    "header": {
                                        "fill": {
                                            "color": "#C8D4E3"
                                        },
                                        "line": {
                                            "color": "white"
                                        }
                                    }
                                }
                            ],
                            "carpet": [
                                {
                                    "type": "carpet",
                                    "aaxis": {
                                        "gridcolor": "white",
                                        "linecolor": "white",
                                        "endlinecolor": "#2a3f5f",
                                        "minorgridcolor": "white",
                                        "startlinecolor": "#2a3f5f"
                                    },
                                    "baxis": {
                                        "gridcolor": "white",
                                        "linecolor": "white",
                                        "endlinecolor": "#2a3f5f",
                                        "minorgridcolor": "white",
                                        "startlinecolor": "#2a3f5f"
                                    }
                                }
                            ],
                            "mesh3d": [
                                {
                                    "type": "mesh3d",
                                    "colorbar": {
                                        "ticks": "",
                                        "outlinewidth": 0
                                    }
                                }
                            ],
                            "contour": [
                                {
                                    "type": "contour",
                                    "colorbar": {
                                        "ticks": "",
                                        "outlinewidth": 0
                                    },
                                    "colorscale": [
                                        [
                                            0.0,
                                            "#0d0887"
                                        ],
                                        [
                                            0.1111111111111111,
                                            "#46039f"
                                        ],
                                        [
                                            0.2222222222222222,
                                            "#7201a8"
                                        ],
                                        [
                                            0.3333333333333333,
                                            "#9c179e"
                                        ],
                                        [
                                            0.4444444444444444,
                                            "#bd3786"
                                        ],
                                        [
                                            0.5555555555555556,
                                            "#d8576b"
                                        ],
                                        [
                                            0.6666666666666666,
                                            "#ed7953"
                                        ],
                                        [
                                            0.7777777777777778,
                                            "#fb9f3a"
                                        ],
                                        [
                                            0.8888888888888888,
                                            "#fdca26"
                                        ],
                                        [
                                            1.0,
                                            "#f0f921"
                                        ]
                                    ]
                                }
                            ],
                            "heatmap": [
                                {
                                    "type": "heatmap",
                                    "colorbar": {
                                        "ticks": "",
                                        "outlinewidth": 0
                                    },
                                    "colorscale": [
                                        [
                                            0.0,
                                            "#0d0887"
                                        ],
                                        [
                                            0.1111111111111111,
                                            "#46039f"
                                        ],
                                        [
                                            0.2222222222222222,
                                            "#7201a8"
                                        ],
                                        [
                                            0.3333333333333333,
                                            "#9c179e"
                                        ],
                                        [
                                            0.4444444444444444,
                                            "#bd3786"
                                        ],
                                        [
                                            0.5555555555555556,
                                            "#d8576b"
                                        ],
                                        [
                                            0.6666666666666666,
                                            "#ed7953"
                                        ],
                                        [
                                            0.7777777777777778,
                                            "#fb9f3a"
                                        ],
                                        [
                                            0.8888888888888888,
                                            "#fdca26"
                                        ],
                                        [
                                            1.0,
                                            "#f0f921"
                                        ]
                                    ]
                                }
                            ],
                            "scatter": [
                                {
                                    "type": "scatter",
                                    "fillpattern": {
                                        "size": 10,
                                        "fillmode": "overlay",
                                        "solidity": 0.2
                                    }
                                }
                            ],
                            "surface": [
                                {
                                    "type": "surface",
                                    "colorbar": {
                                        "ticks": "",
                                        "outlinewidth": 0
                                    },
                                    "colorscale": [
                                        [
                                            0.0,
                                            "#0d0887"
                                        ],
                                        [
                                            0.1111111111111111,
                                            "#46039f"
                                        ],
                                        [
                                            0.2222222222222222,
                                            "#7201a8"
                                        ],
                                        [
                                            0.3333333333333333,
                                            "#9c179e"
                                        ],
                                        [
                                            0.4444444444444444,
                                            "#bd3786"
                                        ],
                                        [
                                            0.5555555555555556,
                                            "#d8576b"
                                        ],
                                        [
                                            0.6666666666666666,
                                            "#ed7953"
                                        ],
                                        [
                                            0.7777777777777778,
                                            "#fb9f3a"
                                        ],
                                        [
                                            0.8888888888888888,
                                            "#fdca26"
                                        ],
                                        [
                                            1.0,
                                            "#f0f921"
                                        ]
                                    ]
                                }
                            ],
                            "barpolar": [
                                {
                                    "type": "barpolar",
                                    "marker": {
                                        "line": {
                                            "color": "#E5ECF6",
                                            "width": 0.5
                                        },
                                        "pattern": {
                                            "size": 10,
                                            "fillmode": "overlay",
                                            "solidity": 0.2
                                        }
                                    }
                                }
                            ],
                            "heatmapgl": [
                                {
                                    "type": "heatmapgl",
                                    "colorbar": {
                                        "ticks": "",
                                        "outlinewidth": 0
                                    },
                                    "colorscale": [
                                        [
                                            0.0,
                                            "#0d0887"
                                        ],
                                        [
                                            0.1111111111111111,
                                            "#46039f"
                                        ],
                                        [
                                            0.2222222222222222,
                                            "#7201a8"
                                        ],
                                        [
                                            0.3333333333333333,
                                            "#9c179e"
                                        ],
                                        [
                                            0.4444444444444444,
                                            "#bd3786"
                                        ],
                                        [
                                            0.5555555555555556,
                                            "#d8576b"
                                        ],
                                        [
                                            0.6666666666666666,
                                            "#ed7953"
                                        ],
                                        [
                                            0.7777777777777778,
                                            "#fb9f3a"
                                        ],
                                        [
                                            0.8888888888888888,
                                            "#fdca26"
                                        ],
                                        [
                                            1.0,
                                            "#f0f921"
                                        ]
                                    ]
                                }
                            ],
                            "histogram": [
                                {
                                    "type": "histogram",
                                    "marker": {
                                        "pattern": {
                                            "size": 10,
                                            "fillmode": "overlay",
                                            "solidity": 0.2
                                        }
                                    }
                                }
                            ],
                            "parcoords": [
                                {
                                    "line": {
                                        "colorbar": {
                                            "ticks": "",
                                            "outlinewidth": 0
                                        }
                                    },
                                    "type": "parcoords"
                                }
                            ],
                            "scatter3d": [
                                {
                                    "line": {
                                        "colorbar": {
                                            "ticks": "",
                                            "outlinewidth": 0
                                        }
                                    },
                                    "type": "scatter3d",
                                    "marker": {
                                        "colorbar": {
                                            "ticks": "",
                                            "outlinewidth": 0
                                        }
                                    }
                                }
                            ],
                            "scattergl": [
                                {
                                    "type": "scattergl",
                                    "marker": {
                                        "colorbar": {
                                            "ticks": "",
                                            "outlinewidth": 0
                                        }
                                    }
                                }
                            ],
                            "choropleth": [
                                {
                                    "type": "choropleth",
                                    "colorbar": {
                                        "ticks": "",
                                        "outlinewidth": 0
                                    }
                                }
                            ],
                            "scattergeo": [
                                {
                                    "type": "scattergeo",
                                    "marker": {
                                        "colorbar": {
                                            "ticks": "",
                                            "outlinewidth": 0
                                        }
                                    }
                                }
                            ],
                            "histogram2d": [
                                {
                                    "type": "histogram2d",
                                    "colorbar": {
                                        "ticks": "",
                                        "outlinewidth": 0
                                    },
                                    "colorscale": [
                                        [
                                            0.0,
                                            "#0d0887"
                                        ],
                                        [
                                            0.1111111111111111,
                                            "#46039f"
                                        ],
                                        [
                                            0.2222222222222222,
                                            "#7201a8"
                                        ],
                                        [
                                            0.3333333333333333,
                                            "#9c179e"
                                        ],
                                        [
                                            0.4444444444444444,
                                            "#bd3786"
                                        ],
                                        [
                                            0.5555555555555556,
                                            "#d8576b"
                                        ],
                                        [
                                            0.6666666666666666,
                                            "#ed7953"
                                        ],
                                        [
                                            0.7777777777777778,
                                            "#fb9f3a"
                                        ],
                                        [
                                            0.8888888888888888,
                                            "#fdca26"
                                        ],
                                        [
                                            1.0,
                                            "#f0f921"
                                        ]
                                    ]
                                }
                            ],
                            "scatterpolar": [
                                {
                                    "type": "scatterpolar",
                                    "marker": {
                                        "colorbar": {
                                            "ticks": "",
                                            "outlinewidth": 0
                                        }
                                    }
                                }
                            ],
                            "contourcarpet": [
                                {
                                    "type": "contourcarpet",
                                    "colorbar": {
                                        "ticks": "",
                                        "outlinewidth": 0
                                    }
                                }
                            ],
                            "scattercarpet": [
                                {
                                    "type": "scattercarpet",
                                    "marker": {
                                        "colorbar": {
                                            "ticks": "",
                                            "outlinewidth": 0
                                        }
                                    }
                                }
                            ],
                            "scattermapbox": [
                                {
                                    "type": "scattermapbox",
                                    "marker": {
                                        "colorbar": {
                                            "ticks": "",
                                            "outlinewidth": 0
                                        }
                                    }
                                }
                            ],
                            "scatterpolargl": [
                                {
                                    "type": "scatterpolargl",
                                    "marker": {
                                        "colorbar": {
                                            "ticks": "",
                                            "outlinewidth": 0
                                        }
                                    }
                                }
                            ],
                            "scatterternary": [
                                {
                                    "type": "scatterternary",
                                    "marker": {
                                        "colorbar": {
                                            "ticks": "",
                                            "outlinewidth": 0
                                        }
                                    }
                                }
                            ],
                            "histogram2dcontour": [
                                {
                                    "type": "histogram2dcontour",
                                    "colorbar": {
                                        "ticks": "",
                                        "outlinewidth": 0
                                    },
                                    "colorscale": [
                                        [
                                            0.0,
                                            "#0d0887"
                                        ],
                                        [
                                            0.1111111111111111,
                                            "#46039f"
                                        ],
                                        [
                                            0.2222222222222222,
                                            "#7201a8"
                                        ],
                                        [
                                            0.3333333333333333,
                                            "#9c179e"
                                        ],
                                        [
                                            0.4444444444444444,
                                            "#bd3786"
                                        ],
                                        [
                                            0.5555555555555556,
                                            "#d8576b"
                                        ],
                                        [
                                            0.6666666666666666,
                                            "#ed7953"
                                        ],
                                        [
                                            0.7777777777777778,
                                            "#fb9f3a"
                                        ],
                                        [
                                            0.8888888888888888,
                                            "#fdca26"
                                        ],
                                        [
                                            1.0,
                                            "#f0f921"
                                        ]
                                    ]
                                }
                            ]
                        },
                        "layout": {
                            "geo": {
                                "bgcolor": "white",
                                "showland": true,
                                "lakecolor": "white",
                                "landcolor": "#E5ECF6",
                                "showlakes": true,
                                "subunitcolor": "white"
                            },
                            "font": {
                                "color": "#2a3f5f"
                            },
                            "polar": {
                                "bgcolor": "#E5ECF6",
                                "radialaxis": {
                                    "ticks": "",
                                    "gridcolor": "white",
                                    "linecolor": "white"
                                },
                                "angularaxis": {
                                    "ticks": "",
                                    "gridcolor": "white",
                                    "linecolor": "white"
                                }
                            },
                            "scene": {
                                "xaxis": {
                                    "ticks": "",
                                    "gridcolor": "white",
                                    "gridwidth": 2,
                                    "linecolor": "white",
                                    "zerolinecolor": "white",
                                    "showbackground": true,
                                    "backgroundcolor": "#E5ECF6"
                                },
                                "yaxis": {
                                    "ticks": "",
                                    "gridcolor": "white",
                                    "gridwidth": 2,
                                    "linecolor": "white",
                                    "zerolinecolor": "white",
                                    "showbackground": true,
                                    "backgroundcolor": "#E5ECF6"
                                },
                                "zaxis": {
                                    "ticks": "",
                                    "gridcolor": "white",
                                    "gridwidth": 2,
                                    "linecolor": "white",
                                    "zerolinecolor": "white",
                                    "showbackground": true,
                                    "backgroundcolor": "#E5ECF6"
                                }
                            },
                            "title": {
                                "x": 0.05
                            },
                            "xaxis": {
                                "ticks": "",
                                "title": {
                                    "standoff": 15
                                },
                                "gridcolor": "white",
                                "linecolor": "white",
                                "automargin": true,
                                "zerolinecolor": "white",
                                "zerolinewidth": 2
                            },
                            "yaxis": {
                                "ticks": "",
                                "title": {
                                    "standoff": 15
                                },
                                "gridcolor": "white",
                                "linecolor": "white",
                                "automargin": true,
                                "zerolinecolor": "white",
                                "zerolinewidth": 2
                            },
                            "mapbox": {
                                "style": "light"
                            },
                            "ternary": {
                                "aaxis": {
                                    "ticks": "",
                                    "gridcolor": "white",
                                    "linecolor": "white"
                                },
                                "baxis": {
                                    "ticks": "",
                                    "gridcolor": "white",
                                    "linecolor": "white"
                                },
                                "caxis": {
                                    "ticks": "",
                                    "gridcolor": "white",
                                    "linecolor": "white"
                                },
                                "bgcolor": "#E5ECF6"
                            },
                            "colorway": [
                                "#636efa",
                                "#EF553B",
                                "#00cc96",
                                "#ab63fa",
                                "#FFA15A",
                                "#19d3f3",
                                "#FF6692",
                                "#B6E880",
                                "#FF97FF",
                                "#FECB52"
                            ],
                            "coloraxis": {
                                "colorbar": {
                                    "ticks": "",
                                    "outlinewidth": 0
                                }
                            },
                            "hovermode": "closest",
                            "colorscale": {
                                "diverging": [
                                    [
                                        0,
                                        "#8e0152"
                                    ],
                                    [
                                        0.1,
                                        "#c51b7d"
                                    ],
                                    [
                                        0.2,
                                        "#de77ae"
                                    ],
                                    [
                                        0.3,
                                        "#f1b6da"
                                    ],
                                    [
                                        0.4,
                                        "#fde0ef"
                                    ],
                                    [
                                        0.5,
                                        "#f7f7f7"
                                    ],
                                    [
                                        0.6,
                                        "#e6f5d0"
                                    ],
                                    [
                                        0.7,
                                        "#b8e186"
                                    ],
                                    [
                                        0.8,
                                        "#7fbc41"
                                    ],
                                    [
                                        0.9,
                                        "#4d9221"
                                    ],
                                    [
                                        1,
                                        "#276419"
                                    ]
                                ],
                                "sequential": [
                                    [
                                        0.0,
                                        "#0d0887"
                                    ],
                                    [
                                        0.1111111111111111,
                                        "#46039f"
                                    ],
                                    [
                                        0.2222222222222222,
                                        "#7201a8"
                                    ],
                                    [
                                        0.3333333333333333,
                                        "#9c179e"
                                    ],
                                    [
                                        0.4444444444444444,
                                        "#bd3786"
                                    ],
                                    [
                                        0.5555555555555556,
                                        "#d8576b"
                                    ],
                                    [
                                        0.6666666666666666,
                                        "#ed7953"
                                    ],
                                    [
                                        0.7777777777777778,
                                        "#fb9f3a"
                                    ],
                                    [
                                        0.8888888888888888,
                                        "#fdca26"
                                    ],
                                    [
                                        1.0,
                                        "#f0f921"
                                    ]
                                ],
                                "sequentialminus": [
                                    [
                                        0.0,
                                        "#0d0887"
                                    ],
                                    [
                                        0.1111111111111111,
                                        "#46039f"
                                    ],
                                    [
                                        0.2222222222222222,
                                        "#7201a8"
                                    ],
                                    [
                                        0.3333333333333333,
                                        "#9c179e"
                                    ],
                                    [
                                        0.4444444444444444,
                                        "#bd3786"
                                    ],
                                    [
                                        0.5555555555555556,
                                        "#d8576b"
                                    ],
                                    [
                                        0.6666666666666666,
                                        "#ed7953"
                                    ],
                                    [
                                        0.7777777777777778,
                                        "#fb9f3a"
                                    ],
                                    [
                                        0.8888888888888888,
                                        "#fdca26"
                                    ],
                                    [
                                        1.0,
                                        "#f0f921"
                                    ]
                                ]
                            },
                            "hoverlabel": {
                                "align": "left"
                            },
                            "plot_bgcolor": "#E5ECF6",
                            "paper_bgcolor": "white",
                            "shapedefaults": {
                                "line": {
                                    "color": "#2a3f5f"
                                }
                            },
                            "autotypenumbers": "strict",
                            "annotationdefaults": {
                                "arrowhead": 0,
                                "arrowcolor": "#2a3f5f",
                                "arrowwidth": 1
                            }
                        }
                    },
                    "showlegend": true
                }
            },
            "height": 1000,
            "width": null,
            "user": {
                "profile_url": "https://chart-studio.plotly.com/~peter.capcara",
                "avatar_url": "https://storage.googleapis.com/plotly-prod-profiles/41.jpg",
                "background_url": "https://storage.googleapis.com/plotly-prod-profiles/bg-0.jpg",
                "bio": "",
                "nickname": "",
                "website": "",
                "stream_tokens": null,
                "feature_set_id": null,
                "csrf_token": null,
                "date_joined": "2024-04-08 08:11:51",
                "mapbox_access_tokens": null,
                "has_password": null,
                "username": "peter.capcara",
                "email": null,
                "is_active": null,
                "readonly": null,
                "is_dash_creator": null,
                "dash_created_count": null,
                "is_chart_creator": null,
                "charts_created_count": null
            }
        }
    ]
}
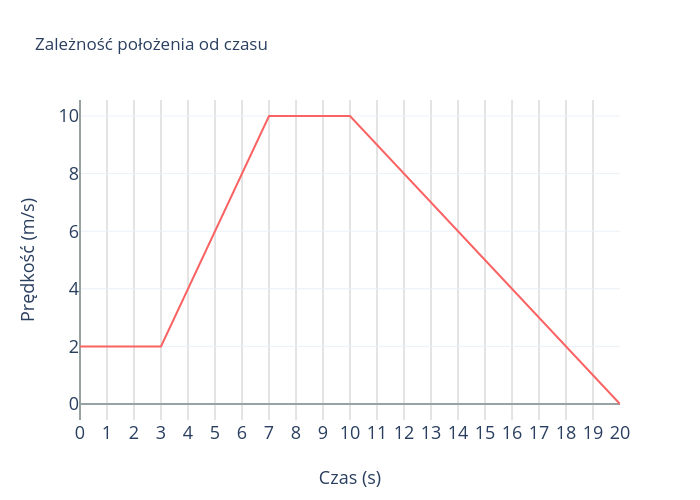