Plots List
Plots
This endpoint handles manipulation of Plotly plot files.
Reference
Authorization
Any user with or without a Plotly account may view public plots. For private plots, see authentication.
Actions
list
Listing all public plots can be done via a GET request to this endpoint.
By default, plots will be listed in order of date created. The order_by
query parameter is accepted at this endpoint. Currently, only ordering by
views is supported. It is possible to filter the plots by quality
with min_quality or max_quality as query parameter.
Example:
// GET https://api.plotly.com/v2/plots/ ---> 200

// GET https://api.plotly.com/v2/plots/?order_by=-views ---> 200

// GET https://api.plotly.com/v2/plots/?min_quality=5 ---> 200

// GET https://api.plotly.com/v2/plots/?max_quality=5 ---> 200
feed
Listing all handpicked feed plots can be done via a GET request to this endpoint. By default, plots will be listed in a random order.
Example:
// GET https://api.plotly.com/v2/plots/feed ---> 200
create
You can create new plot resources here. The only required field is 'figure'. Currently, the figure is restricted to only contain references to grid data. That is, this will fail if raw data arrays are passed in. To create and manipulate underlying grids for plots, see the grids endpoint.
Example:
// This fails because a figure field is required.
// POST https://api.plotly.com/v2/plots ---> 400 Bad Request
{}

// This fails because the figure has raw data
//POST https://api.plotly.com/v2/plots ---> 400 Bad Request
{
    "figure": {"data": [{"y": ['this', 'is', 'raw', 'data']}]}
}

// This succeeds because the figure has src keys, not raw data.
//POST https://api.plotly.com/v2/plots ---> 200 OK
{
    "figure": {"data": [{"ysrc": "sven:88:u8nd62"}]}
}
When creating a grid, you can optionally specify a source_fid to specify where a plot has come from:
- source_fid: the fid of a plot that was copied (and presumably edited) to produce this one
detail
There is a lot of meta information stored about plot files including filename, title, share_url, and content_url to name a few.
This information can only be reached with a GET to this endpoint.
Example:
// GET https://api.plotly.com/v2/plots/iheartgraphs:90
content
The contents of a plot can be downloaded via the content resource. The plot
content contains referenced grid/column data by default. If you wish to
return the raw grid/column data, the inline_data=true query must be included
in the request url. The Content-Type header will be appropriately set for the
response body.
Alternatively, you can set ?map_data=unreadable to append a mapping of
sources to data that belongs to grids which are unreadable for the
requestor. This is useful when you have read access to another users plot,
but that plot contains grid references which you don't have access to.
Examples:
// Returns referenced grid/column data
// GET https://api.plotly.com/v2/plots/iheartgraphs:90/content ---> 200 OK

// Returns full grid/column data
// GET https://api.plotly.com/v2/plots/iheartgraphs:90/content?inline_data=true ---> 200 OK

// Returns full grid/column data when requestor doesn't have permission
// to read the referenced grid.
// GET https://api.plotly.com/v2/plots/iheartgraphs:90/content?map_data=unreadable ---> 200 OK
GET /v2/plots?cursor=cj0xJnA9MjAyNC0wNC0yMiswNyUzQTU5JTNBMTEuMzM4MzkwJTJCMDAlM0EwMA%3D%3D&format=api
{ "next": "https://api.plotly.com/v2/plots?cursor=cD0yMDI0LTA0LTIyKzA3JTNBNTklM0ExNi4wMDU3OTclMkIwMCUzQTAw&format=api", "previous": "https://api.plotly.com/v2/plots?cursor=cj0xJnA9MjAyNC0wNC0yMiswOCUzQTU0JTNBMTAuMTM4NzEzJTJCMDAlM0EwMA%3D%3D&format=api", "results": [ { "creation_time": "2024-04-22T08:54:10.138713Z", "comments": { "results": [], "count": 0 }, "parented": true, "embed_url": "https://chart-studio.plotly.com/~peter.capcara/209.embed", "fid": "peter.capcara:209", "filename": "Plot 209", "filetype": "plot", "img_url": "https://storage.googleapis.com/plotly-prod-images/peter.capcara/209/9_FWYIOUMJZK95GSCOYZAB00FHGD9TPH.png", "image_urls": { "default": "https://storage.googleapis.com/plotly-prod-images/peter.capcara/209/2_1A3ELUF7I0H9TOSWG1D5X8S1Q0JF8Z.png", "block-thumb": "https://storage.googleapis.com/plotly-prod-images/peter.capcara/209/8_BISIL103UL1ERXYE0J63QJNV390179.png", "list-thumb": "https://storage.googleapis.com/plotly-prod-images/peter.capcara/209/9_FWYIOUMJZK95GSCOYZAB00FHGD9TPH.png" }, "api_urls": { "files": "https://api.plotly.com/v2/files/peter.capcara:209", "plots": "https://api.plotly.com/v2/plots/peter.capcara:209", "parent": "https://api.plotly.com/v2/folders/home?user=peter.capcara" }, "owner": "peter.capcara", "parent": -1, "preview": "", "referencers": [], "references": [], "title": "", "views": 2, "web_url": "https://chart-studio.plotly.com/~peter.capcara/209/", "world_readable": true, "date_modified": "2024-04-22T08:54:10.151Z", "stars": { "results": [], "count": 0 }, "collaborators": { "results": [], "count": 0 }, "subfolder_count": null, "refresh_interval": null, "organize_view_url": "https://chart-studio.plotly.com/~peter.capcara/209/", "current_user_permission": "read", "is_theme": null, "is_template": null, "autosize": true, "caption": "", "figure": { "data": [ { "uid": "a1a8b8", "asrc": "peter.capcara:208:f1f1fa", "bsrc": "peter.capcara:208:671983", "csrc": "peter.capcara:208:e1459e", "fill": "toself", "line": { "color": "#444" }, "mode": "lines", "name": "PD", "text": "PD", "type": "scatterternary", "subplot": "ternary", "fillcolor": "#8dd3c7" }, { "uid": "c72344", "asrc": "peter.capcara:208:2fb4f3", "bsrc": "peter.capcara:208:ccf238", "csrc": "peter.capcara:208:4db0c5", "fill": "toself", "line": { "color": "#444" }, "mode": "lines", "name": "D1", "text": "D1", "type": "scatterternary", "subplot": "ternary", "fillcolor": "#ffffb3" }, { "uid": "3eab74", "asrc": "peter.capcara:208:968f53", "bsrc": "peter.capcara:208:c70bf9", "csrc": "peter.capcara:208:bd11d2", "fill": "toself", "line": { "color": "#444" }, "mode": "lines", "name": "D2", "text": "D2", "type": "scatterternary", "subplot": "ternary", "fillcolor": "#bebada" }, { "uid": "b9dc9f", "asrc": "peter.capcara:208:0a5505", "bsrc": "peter.capcara:208:6e14be", "csrc": "peter.capcara:208:b88756", "fill": "toself", "line": { "color": "#444" }, "mode": "lines", "name": "DT", "text": "DT", "type": "scatterternary", "subplot": "ternary", "fillcolor": "#fb8072" }, { "uid": "381ad2", "asrc": "peter.capcara:208:1e1474", "bsrc": "peter.capcara:208:c5dda5", "csrc": "peter.capcara:208:30a433", "fill": "toself", "line": { "color": "#444" }, "mode": "lines", "name": "T1", "text": "T1", "type": "scatterternary", "subplot": "ternary", "fillcolor": "#80b1d3" }, { "uid": "8cc163", "asrc": "peter.capcara:208:04c517", "bsrc": "peter.capcara:208:fd0a49", "csrc": "peter.capcara:208:ff94ec", "fill": "toself", "line": { "color": "#444" }, "mode": "lines", "name": "T2", "text": "T2", "type": "scatterternary", "subplot": "ternary", "fillcolor": "#fdb462" }, { "uid": "6f33dc", "asrc": "peter.capcara:208:3b8b6e", "bsrc": "peter.capcara:208:9f296c", "csrc": "peter.capcara:208:964c23", "fill": "toself", "line": { "color": "#444" }, "mode": "lines", "name": "T3", "text": "T3", "type": "scatterternary", "opacity": 0.5, "subplot": "ternary", "fillcolor": "#b3de69" }, { "asrc": "peter.capcara:208:58a449", "bsrc": "peter.capcara:208:f1e21a", "csrc": "peter.capcara:208:b77152", "mode": "markers", "name": "2656", "type": "scatterternary", "marker": { "size": 10, "color": "rgb(0,0,255)", "symbol": "star" }, "subplot": "ternary" }, { "asrc": "peter.capcara:208:8ab5aa", "bsrc": "peter.capcara:208:e7e6f5", "csrc": "peter.capcara:208:799203", "mode": "markers", "name": "2655", "type": "scatterternary", "marker": { "size": 10, "color": "rgb(0,0,245)", "symbol": "star" }, "subplot": "ternary" }, { "asrc": "peter.capcara:208:603d9d", "bsrc": "peter.capcara:208:631d39", "csrc": "peter.capcara:208:e7ed3e", "mode": "markers", "name": "2654", "type": "scatterternary", "marker": { "size": 10, "color": "rgb(0,0,235)", "symbol": "star" }, "subplot": "ternary" }, { "asrc": "peter.capcara:208:700d8e", "bsrc": "peter.capcara:208:a172e7", "csrc": "peter.capcara:208:3997b2", "mode": "markers", "name": "2653", "type": "scatterternary", "marker": { "size": 10, "color": "rgb(0,0,225)", "symbol": "star" }, "subplot": "ternary" }, { "asrc": "peter.capcara:208:9f0603", "bsrc": "peter.capcara:208:b5585e", "csrc": "peter.capcara:208:5a7d9d", "mode": "markers", "name": "2652", "type": "scatterternary", "marker": { "size": 10, "color": "rgb(0,0,215)", "symbol": "star" }, "subplot": "ternary" }, { "asrc": "peter.capcara:208:fff07a", "bsrc": "peter.capcara:208:bd62e0", "csrc": "peter.capcara:208:628d9e", "mode": "markers", "name": "2651", "type": "scatterternary", "marker": { "size": 10, "color": "rgb(0,0,205)", "symbol": "star" }, "subplot": "ternary" }, { "asrc": "peter.capcara:208:d72e17", "bsrc": "peter.capcara:208:28f687", "csrc": "peter.capcara:208:c72c68", "mode": "markers", "name": "2650", "type": "scatterternary", "marker": { "size": 10, "color": "rgb(0,0,195)", "symbol": "star" }, "subplot": "ternary" }, { "asrc": "peter.capcara:208:d2d290", "bsrc": "peter.capcara:208:91adcd", "csrc": "peter.capcara:208:e55319", "mode": "markers", "name": "2649", "type": "scatterternary", "marker": { "size": 10, "color": "rgb(0,0,185)", "symbol": "star" }, "subplot": "ternary" }, { "asrc": "peter.capcara:208:fdf37f", "bsrc": "peter.capcara:208:0e6264", "csrc": "peter.capcara:208:2f6011", "mode": "markers", "name": "2648", "type": "scatterternary", "marker": { "size": 10, "color": "rgb(0,0,175)", "symbol": "star" }, "subplot": "ternary" }, { "asrc": "peter.capcara:208:bc4888", "bsrc": "peter.capcara:208:754e6d", "csrc": "peter.capcara:208:5b18a0", "mode": "markers", "name": "2647", "type": "scatterternary", "marker": { "size": 10, "color": "rgb(0,0,165)", "symbol": "star" }, "subplot": "ternary" }, { "asrc": "peter.capcara:208:3b0fa1", "bsrc": "peter.capcara:208:4e41e4", "csrc": "peter.capcara:208:0c2fff", "mode": "markers", "name": "2646", "type": "scatterternary", "marker": { "size": 10, "color": "rgb(0,0,155)", "symbol": "star" }, "subplot": "ternary" }, { "asrc": "peter.capcara:208:494218", "bsrc": "peter.capcara:208:b5be7a", "csrc": "peter.capcara:208:b78423", "mode": "markers", "name": "2645", "type": "scatterternary", "marker": { "size": 10, "color": "rgb(0,0,145)", "symbol": "star" }, "subplot": "ternary" }, { "asrc": "peter.capcara:208:d49d8e", "bsrc": "peter.capcara:208:bb4546", "csrc": "peter.capcara:208:dd638c", "mode": "markers", "name": "2644", "type": "scatterternary", "marker": { "size": 10, "color": "rgb(0,0,135)", "symbol": "star" }, "subplot": "ternary" }, { "asrc": "peter.capcara:208:88b350", "bsrc": "peter.capcara:208:7664c2", "csrc": "peter.capcara:208:b5cb87", "mode": "markers", "name": "2643", "type": "scatterternary", "marker": { "size": 10, "color": "rgb(0,0,125)", "symbol": "star" }, "subplot": "ternary" }, { "asrc": "peter.capcara:208:53519a", "bsrc": "peter.capcara:208:99dbb6", "csrc": "peter.capcara:208:044933", "mode": "markers", "name": "2642", "type": "scatterternary", "marker": { "size": 10, "color": "rgb(0,0,115)", "symbol": "star" }, "subplot": "ternary" }, { "asrc": "peter.capcara:208:08a780", "bsrc": "peter.capcara:208:4fc21d", "csrc": "peter.capcara:208:b0878a", "mode": "markers", "name": "2641", "type": "scatterternary", "marker": { "size": 10, "color": "rgb(0,0,105)", "symbol": "star" }, "subplot": "ternary" }, { "asrc": "peter.capcara:208:704633", "bsrc": "peter.capcara:208:83e568", "csrc": "peter.capcara:208:31b5f4", "mode": "markers", "name": "2640", "type": "scatterternary", "marker": { "size": 10, "color": "rgb(0,0,95)", "symbol": "star" }, "subplot": "ternary" }, { "asrc": "peter.capcara:208:12c6ca", "bsrc": "peter.capcara:208:1dbcf5", "csrc": "peter.capcara:208:96af26", "mode": "markers", "name": "2639", "type": "scatterternary", "marker": { "size": 10, "color": "rgb(0,0,85)", "symbol": "star" }, "subplot": "ternary" }, { "asrc": "peter.capcara:208:154da6", "bsrc": "peter.capcara:208:0d2a19", "csrc": "peter.capcara:208:61050e", "mode": "markers", "name": "2638", "type": "scatterternary", "marker": { "size": 10, "color": "rgb(0,0,75)", "symbol": "star" }, "subplot": "ternary" }, { "asrc": "peter.capcara:208:f01cb0", "bsrc": "peter.capcara:208:0998c9", "csrc": "peter.capcara:208:417615", "mode": "markers", "name": "2637", "type": "scatterternary", "marker": { "size": 10, "color": "rgb(0,0,65)", "symbol": "star" }, "subplot": "ternary" }, { "asrc": "peter.capcara:208:5326fa", "bsrc": "peter.capcara:208:7bceb3", "csrc": "peter.capcara:208:f8f883", "mode": "markers", "name": "2636", "type": "scatterternary", "marker": { "size": 10, "color": "rgb(0,0,55)", "symbol": "star" }, "subplot": "ternary" }, { "asrc": "peter.capcara:208:1afc86", "bsrc": "peter.capcara:208:805843", "csrc": "peter.capcara:208:4478b0", "mode": "markers", "name": "2635", "type": "scatterternary", "marker": { "size": 10, "color": "rgb(0,0,45)", "symbol": "star" }, "subplot": "ternary" }, { "asrc": "peter.capcara:208:e23bad", "bsrc": "peter.capcara:208:7ef87f", "csrc": "peter.capcara:208:91b822", "mode": "markers", "name": "2634", "type": "scatterternary", "marker": { "size": 10, "color": "rgb(0,0,35)", "symbol": "star" }, "subplot": "ternary" }, { "asrc": "peter.capcara:208:2a9b65", "bsrc": "peter.capcara:208:4e193a", "csrc": "peter.capcara:208:26f5f7", "mode": "markers", "name": "2633", "type": "scatterternary", "marker": { "size": 10, "color": "rgb(0,0,25)", "symbol": "star" }, "subplot": "ternary" }, { "asrc": "peter.capcara:208:e433c0", "bsrc": "peter.capcara:208:6b253b", "csrc": "peter.capcara:208:6558bd", "mode": "markers", "name": "2632", "type": "scatterternary", "marker": { "size": 10, "color": "rgb(0,0,15)", "symbol": "star" }, "subplot": "ternary" }, { "asrc": "peter.capcara:208:e42fd8", "bsrc": "peter.capcara:208:849ff1", "csrc": "peter.capcara:208:f79cb9", "mode": "markers", "name": "2631", "type": "scatterternary", "marker": { "size": 10, "color": "rgb(0,0,5)", "symbol": "star" }, "subplot": "ternary" }, { "asrc": "peter.capcara:208:7d822b", "bsrc": "peter.capcara:208:0e0f2e", "csrc": "peter.capcara:208:2164b9", "mode": "markers", "name": "2630", "type": "scatterternary", "marker": { "size": 10, "color": "rgb(0,255,0)", "symbol": "star" }, "subplot": "ternary" }, { "asrc": "peter.capcara:208:5582aa", "bsrc": "peter.capcara:208:8aa9e7", "csrc": "peter.capcara:208:31d441", "mode": "markers", "name": "2629", "type": "scatterternary", "marker": { "size": 10, "color": "rgb(0,245,0)", "symbol": "star" }, "subplot": "ternary" }, { "asrc": "peter.capcara:208:95143e", "bsrc": "peter.capcara:208:cf5dc2", "csrc": "peter.capcara:208:d79dc9", "mode": "markers", "name": "2628", "type": "scatterternary", "marker": { "size": 10, "color": "rgb(0,235,0)", "symbol": "star" }, "subplot": "ternary" }, { "asrc": "peter.capcara:208:9504f3", "bsrc": "peter.capcara:208:c62f29", "csrc": "peter.capcara:208:1567d7", "mode": "markers", "name": "2627", "type": "scatterternary", "marker": { "size": 10, "color": "rgb(0,225,0)", "symbol": "star" }, "subplot": "ternary" }, { "asrc": "peter.capcara:208:fb67e6", "bsrc": "peter.capcara:208:56b28b", "csrc": "peter.capcara:208:6b0d88", "mode": "markers", "name": "2626", "type": "scatterternary", "marker": { "size": 10, "color": "rgb(0,215,0)", "symbol": "star" }, "subplot": "ternary" }, { "asrc": "peter.capcara:208:daa235", "bsrc": "peter.capcara:208:0d91be", "csrc": "peter.capcara:208:c85a5a", "mode": "markers", "name": "2625", "type": "scatterternary", "marker": { "size": 10, "color": "rgb(0,205,0)", "symbol": "star" }, "subplot": "ternary" }, { "asrc": "peter.capcara:208:3ae8b4", "bsrc": "peter.capcara:208:ca45da", "csrc": "peter.capcara:208:fa00d6", "mode": "markers", "name": "2624", "type": "scatterternary", "marker": { "size": 10, "color": "rgb(0,195,0)", "symbol": "star" }, "subplot": "ternary" }, { "asrc": "peter.capcara:208:844787", "bsrc": "peter.capcara:208:656834", "csrc": "peter.capcara:208:013937", "mode": "markers", "name": "2623", "type": "scatterternary", "marker": { "size": 10, "color": "rgb(0,185,0)", "symbol": "star" }, "subplot": "ternary" }, { "type": "table", "cells": { "fill": { "color": "lavender" }, "align": "left", "valuessrc": "peter.capcara:208:20e76d" }, "domain": { "x": [ 0.0, 1.0 ], "y": [ 0.0, 0.255 ] }, "header": { "fill": { "color": "paleturquoise" }, "align": "left", "valuessrc": "peter.capcara:208:7a7a56" }, "columnwidthsrc": "peter.capcara:208:93d9af" } ], "layout": { "title": { "text": "Duval Triangle for DGA Interpretation" }, "height": 1000, "ternary": { "sum": 100, "aaxis": { "min": 0.01, "ticks": "outside", "title": { "text": "CH4(Methane)" }, "linewidth": 2, "ticksuffix": "%" }, "baxis": { "min": 0.01, "ticks": "outside", "title": { "text": "C2H2(Acetylene)" }, "linewidth": 2, "ticksuffix": "%" }, "caxis": { "min": 0.01, "ticks": "outside", "title": { "text": "C2H4(Ethylene)" }, "linewidth": 2, "ticksuffix": "%" }, "domain": { "x": [ 0.0, 1.0 ], "y": [ 0.405, 1.0 ] } }, "autosize": true, "template": { "data": { "bar": [ { "type": "bar", "marker": { "line": { "color": "#E5ECF6", "width": 0.5 }, "pattern": { "size": 10, "fillmode": "overlay", "solidity": 0.2 } }, "error_x": { "color": "#2a3f5f" }, "error_y": { "color": "#2a3f5f" } } ], "pie": [ { "type": "pie", "automargin": true } ], "table": [ { "type": "table", "cells": { "fill": { "color": "#EBF0F8" }, "line": { "color": "white" } }, "header": { "fill": { "color": "#C8D4E3" }, "line": { "color": "white" } } } ], "carpet": [ { "type": "carpet", "aaxis": { "gridcolor": "white", "linecolor": "white", "endlinecolor": "#2a3f5f", "minorgridcolor": "white", "startlinecolor": "#2a3f5f" }, "baxis": { "gridcolor": "white", "linecolor": "white", "endlinecolor": "#2a3f5f", "minorgridcolor": "white", "startlinecolor": "#2a3f5f" } } ], "mesh3d": [ { "type": "mesh3d", "colorbar": { "ticks": "", "outlinewidth": 0 } } ], "contour": [ { "type": "contour", "colorbar": { "ticks": "", "outlinewidth": 0 }, "colorscale": [ [ 0.0, "#0d0887" ], [ 0.1111111111111111, "#46039f" ], [ 0.2222222222222222, "#7201a8" ], [ 0.3333333333333333, "#9c179e" ], [ 0.4444444444444444, "#bd3786" ], [ 0.5555555555555556, "#d8576b" ], [ 0.6666666666666666, "#ed7953" ], [ 0.7777777777777778, "#fb9f3a" ], [ 0.8888888888888888, "#fdca26" ], [ 1.0, "#f0f921" ] ] } ], "heatmap": [ { "type": "heatmap", "colorbar": { "ticks": "", "outlinewidth": 0 }, "colorscale": [ [ 0.0, "#0d0887" ], [ 0.1111111111111111, "#46039f" ], [ 0.2222222222222222, "#7201a8" ], [ 0.3333333333333333, "#9c179e" ], [ 0.4444444444444444, "#bd3786" ], [ 0.5555555555555556, "#d8576b" ], [ 0.6666666666666666, "#ed7953" ], [ 0.7777777777777778, "#fb9f3a" ], [ 0.8888888888888888, "#fdca26" ], [ 1.0, "#f0f921" ] ] } ], "scatter": [ { "type": "scatter", "fillpattern": { "size": 10, "fillmode": "overlay", "solidity": 0.2 } } ], "surface": [ { "type": "surface", "colorbar": { "ticks": "", "outlinewidth": 0 }, "colorscale": [ [ 0.0, "#0d0887" ], [ 0.1111111111111111, "#46039f" ], [ 0.2222222222222222, "#7201a8" ], [ 0.3333333333333333, "#9c179e" ], [ 0.4444444444444444, "#bd3786" ], [ 0.5555555555555556, "#d8576b" ], [ 0.6666666666666666, "#ed7953" ], [ 0.7777777777777778, "#fb9f3a" ], [ 0.8888888888888888, "#fdca26" ], [ 1.0, "#f0f921" ] ] } ], "barpolar": [ { "type": "barpolar", "marker": { "line": { "color": "#E5ECF6", "width": 0.5 }, "pattern": { "size": 10, "fillmode": "overlay", "solidity": 0.2 } } } ], "heatmapgl": [ { "type": "heatmapgl", "colorbar": { "ticks": "", "outlinewidth": 0 }, "colorscale": [ [ 0.0, "#0d0887" ], [ 0.1111111111111111, "#46039f" ], [ 0.2222222222222222, "#7201a8" ], [ 0.3333333333333333, "#9c179e" ], [ 0.4444444444444444, "#bd3786" ], [ 0.5555555555555556, "#d8576b" ], [ 0.6666666666666666, "#ed7953" ], [ 0.7777777777777778, "#fb9f3a" ], [ 0.8888888888888888, "#fdca26" ], [ 1.0, "#f0f921" ] ] } ], "histogram": [ { "type": "histogram", "marker": { "pattern": { "size": 10, "fillmode": "overlay", "solidity": 0.2 } } } ], "parcoords": [ { "line": { "colorbar": { "ticks": "", "outlinewidth": 0 } }, "type": "parcoords" } ], "scatter3d": [ { "line": { "colorbar": { "ticks": "", "outlinewidth": 0 } }, "type": "scatter3d", "marker": { "colorbar": { "ticks": "", "outlinewidth": 0 } } } ], "scattergl": [ { "type": "scattergl", "marker": { "colorbar": { "ticks": "", "outlinewidth": 0 } } } ], "choropleth": [ { "type": "choropleth", "colorbar": { "ticks": "", "outlinewidth": 0 } } ], "scattergeo": [ { "type": "scattergeo", "marker": { "colorbar": { "ticks": "", "outlinewidth": 0 } } } ], "histogram2d": [ { "type": "histogram2d", "colorbar": { "ticks": "", "outlinewidth": 0 }, "colorscale": [ [ 0.0, "#0d0887" ], [ 0.1111111111111111, "#46039f" ], [ 0.2222222222222222, "#7201a8" ], [ 0.3333333333333333, "#9c179e" ], [ 0.4444444444444444, "#bd3786" ], [ 0.5555555555555556, "#d8576b" ], [ 0.6666666666666666, "#ed7953" ], [ 0.7777777777777778, "#fb9f3a" ], [ 0.8888888888888888, "#fdca26" ], [ 1.0, "#f0f921" ] ] } ], "scatterpolar": [ { "type": "scatterpolar", "marker": { "colorbar": { "ticks": "", "outlinewidth": 0 } } } ], "contourcarpet": [ { "type": "contourcarpet", "colorbar": { "ticks": "", "outlinewidth": 0 } } ], "scattercarpet": [ { "type": "scattercarpet", "marker": { "colorbar": { "ticks": "", "outlinewidth": 0 } } } ], "scattermapbox": [ { "type": "scattermapbox", "marker": { "colorbar": { "ticks": "", "outlinewidth": 0 } } } ], "scatterpolargl": [ { "type": "scatterpolargl", "marker": { "colorbar": { "ticks": "", "outlinewidth": 0 } } } ], "scatterternary": [ { "type": "scatterternary", "marker": { "colorbar": { "ticks": "", "outlinewidth": 0 } } } ], "histogram2dcontour": [ { "type": "histogram2dcontour", "colorbar": { "ticks": "", "outlinewidth": 0 }, "colorscale": [ [ 0.0, "#0d0887" ], [ 0.1111111111111111, "#46039f" ], [ 0.2222222222222222, "#7201a8" ], [ 0.3333333333333333, "#9c179e" ], [ 0.4444444444444444, "#bd3786" ], [ 0.5555555555555556, "#d8576b" ], [ 0.6666666666666666, "#ed7953" ], [ 0.7777777777777778, "#fb9f3a" ], [ 0.8888888888888888, "#fdca26" ], [ 1.0, "#f0f921" ] ] } ] }, "layout": { "geo": { "bgcolor": "white", "showland": true, "lakecolor": "white", "landcolor": "#E5ECF6", "showlakes": true, "subunitcolor": "white" }, "font": { "color": "#2a3f5f" }, "polar": { "bgcolor": "#E5ECF6", "radialaxis": { "ticks": "", "gridcolor": "white", "linecolor": "white" }, "angularaxis": { "ticks": "", "gridcolor": "white", "linecolor": "white" } }, "scene": { "xaxis": { "ticks": "", "gridcolor": "white", "gridwidth": 2, "linecolor": "white", "zerolinecolor": "white", "showbackground": true, "backgroundcolor": "#E5ECF6" }, "yaxis": { "ticks": "", "gridcolor": "white", "gridwidth": 2, "linecolor": "white", "zerolinecolor": "white", "showbackground": true, "backgroundcolor": "#E5ECF6" }, "zaxis": { "ticks": "", "gridcolor": "white", "gridwidth": 2, "linecolor": "white", "zerolinecolor": "white", "showbackground": true, "backgroundcolor": "#E5ECF6" } }, "title": { "x": 0.05 }, "xaxis": { "ticks": "", "title": { "standoff": 15 }, "gridcolor": "white", "linecolor": "white", "automargin": true, "zerolinecolor": "white", "zerolinewidth": 2 }, "yaxis": { "ticks": "", "title": { "standoff": 15 }, "gridcolor": "white", "linecolor": "white", "automargin": true, "zerolinecolor": "white", "zerolinewidth": 2 }, "mapbox": { "style": "light" }, "ternary": { "aaxis": { "ticks": "", "gridcolor": "white", "linecolor": "white" }, "baxis": { "ticks": "", "gridcolor": "white", "linecolor": "white" }, "caxis": { "ticks": "", "gridcolor": "white", "linecolor": "white" }, "bgcolor": "#E5ECF6" }, "colorway": [ "#636efa", "#EF553B", "#00cc96", "#ab63fa", "#FFA15A", "#19d3f3", "#FF6692", "#B6E880", "#FF97FF", "#FECB52" ], "coloraxis": { "colorbar": { "ticks": "", "outlinewidth": 0 } }, "hovermode": "closest", "colorscale": { "diverging": [ [ 0, "#8e0152" ], [ 0.1, "#c51b7d" ], [ 0.2, "#de77ae" ], [ 0.3, "#f1b6da" ], [ 0.4, "#fde0ef" ], [ 0.5, "#f7f7f7" ], [ 0.6, "#e6f5d0" ], [ 0.7, "#b8e186" ], [ 0.8, "#7fbc41" ], [ 0.9, "#4d9221" ], [ 1, "#276419" ] ], "sequential": [ [ 0.0, "#0d0887" ], [ 0.1111111111111111, "#46039f" ], [ 0.2222222222222222, "#7201a8" ], [ 0.3333333333333333, "#9c179e" ], [ 0.4444444444444444, "#bd3786" ], [ 0.5555555555555556, "#d8576b" ], [ 0.6666666666666666, "#ed7953" ], [ 0.7777777777777778, "#fb9f3a" ], [ 0.8888888888888888, "#fdca26" ], [ 1.0, "#f0f921" ] ], "sequentialminus": [ [ 0.0, "#0d0887" ], [ 0.1111111111111111, "#46039f" ], [ 0.2222222222222222, "#7201a8" ], [ 0.3333333333333333, "#9c179e" ], [ 0.4444444444444444, "#bd3786" ], [ 0.5555555555555556, "#d8576b" ], [ 0.6666666666666666, "#ed7953" ], [ 0.7777777777777778, "#fb9f3a" ], [ 0.8888888888888888, "#fdca26" ], [ 1.0, "#f0f921" ] ] }, "hoverlabel": { "align": "left" }, "plot_bgcolor": "#E5ECF6", "paper_bgcolor": "white", "shapedefaults": { "line": { "color": "#2a3f5f" } }, "autotypenumbers": "strict", "annotationdefaults": { "arrowhead": 0, "arrowcolor": "#2a3f5f", "arrowwidth": 1 } } }, "showlegend": true } }, "height": 1000, "width": null, "user": { "profile_url": "https://chart-studio.plotly.com/~peter.capcara", "avatar_url": "https://storage.googleapis.com/plotly-prod-profiles/41.jpg", "background_url": "https://storage.googleapis.com/plotly-prod-profiles/bg-0.jpg", "bio": "", "nickname": "", "website": "", "stream_tokens": null, "feature_set_id": null, "csrf_token": null, "date_joined": "2024-04-08 08:11:51", "mapbox_access_tokens": null, "has_password": null, "username": "peter.capcara", "email": null, "is_active": null, "readonly": null, "is_dash_creator": null, "dash_created_count": null, "is_chart_creator": null, "charts_created_count": null } }, { "creation_time": "2024-04-22T08:42:49.362382Z", "comments": { "results": [], "count": 0 }, "parented": true, "embed_url": "https://chart-studio.plotly.com/~Sam_C./38.embed", "fid": "Sam_C.:38", "filename": "Chronogramme Team Fortress 2 - 250324 VerbatimsPlot", "filetype": "plot", "img_url": "https://storage.googleapis.com/plotly-prod-images/Sam_C./38/9_QJEK6QQ5X2Z3YC5RPFCI4MAKZN9PI5.png", "image_urls": { "default": "https://storage.googleapis.com/plotly-prod-images/Sam_C./38/2_OMZZOATYBFA2O4U95RBSCRGLG5E6ZS.png", "block-thumb": "https://storage.googleapis.com/plotly-prod-images/Sam_C./38/8_U1F9IO3F9YILW40U1XHU85CADR3HTG.png", "list-thumb": "https://storage.googleapis.com/plotly-prod-images/Sam_C./38/9_QJEK6QQ5X2Z3YC5RPFCI4MAKZN9PI5.png" }, "api_urls": { "files": "https://api.plotly.com/v2/files/Sam_C.:38", "plots": "https://api.plotly.com/v2/plots/Sam_C.:38", "parent": "https://api.plotly.com/v2/folders/home?user=Sam_C." }, "owner": "Sam_C.", "parent": -1, "preview": "", "referencers": [], "references": [], "title": "", "views": 2, "web_url": "https://chart-studio.plotly.com/~Sam_C./38/", "world_readable": true, "date_modified": "2024-04-24T13:47:09.320Z", "stars": { "results": [], "count": 0 }, "collaborators": { "results": [], "count": 0 }, "subfolder_count": null, "refresh_interval": null, "organize_view_url": "https://chart-studio.plotly.com/~Sam_C./38/", "current_user_permission": "read", "is_theme": null, "is_template": true, "autosize": true, "caption": "", "figure": { "data": [ { "fill": "none", "line": { "color": "rgb(29, 186, 17)", "shape": "hv", "width": 4 }, "meta": { "columnNames": { "x": "A", "y": "B", "text": "" } }, "mode": "lines", "type": "scatter", "xsrc": "Sam_C.:22:744dd8", "ysrc": "Sam_C.:22:c51028", "error_x": { "type": "percent", "color": "rgb(229, 50, 6)", "value": 10, "width": 4, "visible": false, "symmetric": true, "thickness": 2 }, "hoverinfo": "x+y+text", "hoverlabel": { "align": "auto" }, "connectgaps": true, "orientation": "v", "hovertemplate": "" } ], "frames": [], "layout": { "font": { "family": "Open Sans" }, "title": { "text": "Chronogramme d'une session de jeu sur Team Fortress 2 - 250324" }, "xaxis": { "type": "category", "range": [ 0, 8 ], "title": { "text": "Temps en heures et minutes (00:00:00)" }, "showgrid": false, "autorange": true }, "yaxis": { "type": "linear", "range": [ 0.022192979762827303, 8.099343940122456 ], "title": { "text": "Échelle de la sensation de présence (de 0 à 8)" }, "showgrid": false, "autorange": true }, "modebar": { "orientation": "h" }, "autosize": true, "dragmode": "zoom", "template": { "data": { "bar": [ { "type": "bar", "marker": { "colorbar": { "ticks": "", "outlinewidth": 0 } } } ], "table": [ { "type": "table", "cells": { "fill": { "color": "#EBF0F8" }, "line": { "color": "white" } }, "header": { "fill": { "color": "#C8D4E3" }, "line": { "color": "white" } } } ], "carpet": [ { "type": "carpet", "aaxis": { "gridcolor": "#C8D4E3", "linecolor": "#C8D4E3", "endlinecolor": "#2a3f5f", "minorgridcolor": "#C8D4E3", "startlinecolor": "#2a3f5f" }, "baxis": { "gridcolor": "#C8D4E3", "linecolor": "#C8D4E3", "endlinecolor": "#2a3f5f", "minorgridcolor": "#C8D4E3", "startlinecolor": "#2a3f5f" } } ], "mesh3d": [ { "type": "mesh3d", "colorbar": { "ticks": "", "outlinewidth": 0 } } ], "contour": [ { "type": "contour", "colorbar": { "ticks": "", "outlinewidth": 0 }, "autocolorscale": true } ], "heatmap": [ { "type": "heatmap", "colorbar": { "ticks": "", "outlinewidth": 0 }, "autocolorscale": true } ], "scatter": [ { "type": "scatter", "marker": { "colorbar": { "ticks": "", "outlinewidth": 0 } } } ], "surface": [ { "type": "surface", "colorbar": { "ticks": "", "outlinewidth": 0 } } ], "heatmapgl": [ { "type": "heatmapgl", "colorbar": { "ticks": "", "outlinewidth": 0 } } ], "histogram": [ { "type": "histogram", "marker": { "colorbar": { "ticks": "", "outlinewidth": 0 } } } ], "parcoords": [ { "line": { "colorbar": { "ticks": "", "outlinewidth": 0 } }, "type": "parcoords" } ], "scatter3d": [ { "type": "scatter3d", "marker": { "colorbar": { "ticks": "", "outlinewidth": 0 } } } ], "scattergl": [ { "type": "scattergl", "marker": { "colorbar": { "ticks": "", "outlinewidth": 0 } } } ], "choropleth": [ { "type": "choropleth", "colorbar": { "ticks": "", "outlinewidth": 0 } } ], "scattergeo": [ { "type": "scattergeo", "marker": { "colorbar": { "ticks": "", "outlinewidth": 0 } } } ], "histogram2d": [ { "type": "histogram2d", "colorbar": { "ticks": "", "outlinewidth": 0 }, "autocolorscale": true } ], "scatterpolar": [ { "type": "scatterpolar", "marker": { "colorbar": { "ticks": "", "outlinewidth": 0 } } } ], "contourcarpet": [ { "type": "contourcarpet", "colorbar": { "ticks": "", "outlinewidth": 0 } } ], "scattercarpet": [ { "type": "scattercarpet", "marker": { "colorbar": { "ticks": "", "outlinewidth": 0 } } } ], "scattermapbox": [ { "type": "scattermapbox", "marker": { "colorbar": { "ticks": "", "outlinewidth": 0 } } } ], "scatterpolargl": [ { "type": "scatterpolargl", "marker": { "colorbar": { "ticks": "", "outlinewidth": 0 } } } ], "scatterternary": [ { "type": "scatterternary", "marker": { "colorbar": { "ticks": "", "outlinewidth": 0 } } } ], "histogram2dcontour": [ { "type": "histogram2dcontour", "colorbar": { "ticks": "", "outlinewidth": 0 }, "autocolorscale": true } ] }, "layout": { "geo": { "bgcolor": "white", "showland": true, "lakecolor": "white", "landcolor": "white", "showlakes": true, "subunitcolor": "#C8D4E3" }, "font": { "color": "#2a3f5f" }, "polar": { "bgcolor": "white", "radialaxis": { "ticks": "", "gridcolor": "#EBF0F8", "linecolor": "#EBF0F8" }, "angularaxis": { "ticks": "", "gridcolor": "#EBF0F8", "linecolor": "#EBF0F8" } }, "scene": { "xaxis": { "ticks": "", "gridcolor": "#DFE8F3", "gridwidth": 2, "linecolor": "#EBF0F8", "zerolinecolor": "#EBF0F8", "showbackground": true, "backgroundcolor": "white" }, "yaxis": { "ticks": "", "gridcolor": "#DFE8F3", "gridwidth": 2, "linecolor": "#EBF0F8", "zerolinecolor": "#EBF0F8", "showbackground": true, "backgroundcolor": "white" }, "zaxis": { "ticks": "", "gridcolor": "#DFE8F3", "gridwidth": 2, "linecolor": "#EBF0F8", "zerolinecolor": "#EBF0F8", "showbackground": true, "backgroundcolor": "white" } }, "title": { "x": 0.05 }, "xaxis": { "ticks": "", "gridcolor": "#EBF0F8", "linecolor": "#EBF0F8", "automargin": true, "zerolinecolor": "#EBF0F8", "zerolinewidth": 2 }, "yaxis": { "ticks": "", "gridcolor": "#EBF0F8", "linecolor": "#EBF0F8", "automargin": true, "zerolinecolor": "#EBF0F8", "zerolinewidth": 2 }, "ternary": { "aaxis": { "ticks": "", "gridcolor": "#DFE8F3", "linecolor": "#A2B1C6" }, "baxis": { "ticks": "", "gridcolor": "#DFE8F3", "linecolor": "#A2B1C6" }, "caxis": { "ticks": "", "gridcolor": "#DFE8F3", "linecolor": "#A2B1C6" }, "bgcolor": "white" }, "colorway": [ "#636efa", "#EF553B", "#00cc96", "#ab63fa", "#19d3f3", "#e763fa", "#fecb52", "#ffa15a", "#ff6692", "#b6e880" ], "hovermode": "closest", "colorscale": { "diverging": [ [ 0, "#8e0152" ], [ 0.1, "#c51b7d" ], [ 0.2, "#de77ae" ], [ 0.3, "#f1b6da" ], [ 0.4, "#fde0ef" ], [ 0.5, "#f7f7f7" ], [ 0.6, "#e6f5d0" ], [ 0.7, "#b8e186" ], [ 0.8, "#7fbc41" ], [ 0.9, "#4d9221" ], [ 1, "#276419" ] ], "sequential": [ [ 0, "#0508b8" ], [ 0.0893854748603352, "#1910d8" ], [ 0.1787709497206704, "#3c19f0" ], [ 0.2681564245810056, "#6b1cfb" ], [ 0.3575418994413408, "#981cfd" ], [ 0.44692737430167595, "#bf1cfd" ], [ 0.5363128491620112, "#dd2bfd" ], [ 0.6256983240223464, "#f246fe" ], [ 0.7150837988826816, "#fc67fd" ], [ 0.8044692737430168, "#fe88fc" ], [ 0.8938547486033519, "#fea5fd" ], [ 0.9832402234636871, "#febefe" ], [ 1, "#fec3fe" ] ], "sequentialminus": [ [ 0, "#0508b8" ], [ 0.0893854748603352, "#1910d8" ], [ 0.1787709497206704, "#3c19f0" ], [ 0.2681564245810056, "#6b1cfb" ], [ 0.3575418994413408, "#981cfd" ], [ 0.44692737430167595, "#bf1cfd" ], [ 0.5363128491620112, "#dd2bfd" ], [ 0.6256983240223464, "#f246fe" ], [ 0.7150837988826816, "#fc67fd" ], [ 0.8044692737430168, "#fe88fc" ], [ 0.8938547486033519, "#fea5fd" ], [ 0.9832402234636871, "#febefe" ], [ 1, "#fec3fe" ] ] }, "plot_bgcolor": "white", "paper_bgcolor": "white", "shapedefaults": { "line": { "width": 0 }, "opacity": 0.4, "fillcolor": "#506784" }, "annotationdefaults": { "arrowhead": 0, "arrowcolor": "#506784", "arrowwidth": 1 } }, "themeRef": "PLOTLY_WHITE" }, "showlegend": false, "annotations": [ { "x": 1.0136916368985258, "y": 6.971741677339576, "ax": -14, "ay": -45, "font": { "size": 12, "family": "Arial" }, "text": "Retrouve ses réflexes de jeu, se remet à <br>utiliser les commandes vocales pour donner <br>\ndes informations à ses coéquipier.", "arrowhead": 4, "arrowsize": 1.5, "arrowcolor": "rgb(0, 0, 0)", "arrowwidth": 1 }, { "x": 2.0100462851585643, "y": 4.978104197871657, "ax": -168, "ay": 76, "font": { "size": 12, "family": "Arial" }, "text": "Sa sensation de présence à baisser<br>à cause du tableau qui est tombé <br>\n(changement environnemental).", "arrowhead": 4, "arrowsize": 1.5, "arrowcolor": "rgb(0, 0, 0)", "arrowwidth": 1 }, { "x": 3.017541167081888, "y": 3.04694252815347, "ax": -253, "ay": 61, "font": { "size": 12, "family": "Arial" }, "text": "Il en a marre de jouer, le jeu ne lui donne <br>pas envie de partir malgré le manque de <br>\nfun (character controller plaisant, \"tu peux <br>\ndésactiver ton cerveau\").<br>", "arrowhead": 4, "arrowsize": 1.5, "arrowcolor": "rgb(0, 0, 0)", "arrowwidth": 1 }, { "x": 4.003591099203388, "y": 1.9835875238687688, "ax": -158, "ay": 54, "font": { "size": 12, "family": "Arial" }, "text": "La longueur de la partie, la map, <br>les joueurs et le temps de respawn <br>\nsont des facteurs qui lui font <br>\nbaisser sa sensation de présence.", "arrowhead": 4, "arrowsize": 1.5, "arrowcolor": "rgb(0, 0, 0)", "arrowwidth": 1 }, { "x": 4.994932642314948, "y": 1.0048306748515918, "ax": -87, "ay": 39, "font": { "size": 12, "family": "Arial" }, "text": "Quitte la map d'exaspération, <br>et décide de changer de carte.", "arrowhead": 4, "arrowsize": 1.5, "arrowcolor": "rgb(0, 0, 0)", "arrowwidth": 1 }, { "x": 6.011270084708505, "y": 2.9686281032225077, "ax": -40, "ay": -62, "font": { "size": 12, "family": "Arial" }, "text": "Va sur une nouvelle map + fun, <br>meurt toujours aussi souvent.", "arrowhead": 4, "arrowsize": 1.5, "arrowcolor": "rgb(0, 0, 0)", "arrowwidth": 1 }, { "x": 7.009783153240805, "y": 1.0138431966782668, "ax": -77, "ay": 44, "font": { "size": 12, "family": "Arial" }, "text": "Envie d'arrêter à ce moment-là et <br>ma demande à été accepté d'office.<br>", "arrowhead": 4, "arrowsize": 1.5, "arrowcolor": "rgb(0, 0, 0)", "arrowwidth": 1 } ] } }, "height": null, "width": null, "user": { "profile_url": "https://chart-studio.plotly.com/~Sam_C.", "avatar_url": "https://storage.googleapis.com/plotly-prod-profiles/4.jpg", "background_url": "https://storage.googleapis.com/plotly-prod-profiles/bg-11.jpg", "bio": "", "nickname": "Axergonomie", "website": "", "stream_tokens": null, "feature_set_id": null, "csrf_token": null, "date_joined": "2024-03-28 09:52:41", "mapbox_access_tokens": null, "has_password": null, "username": "Sam_C.", "email": null, "is_active": null, "readonly": null, "is_dash_creator": null, "dash_created_count": null, "is_chart_creator": null, "charts_created_count": null } }, { "creation_time": "2024-04-22T08:41:56.411107Z", "comments": { "results": [], "count": 0 }, "parented": true, "embed_url": "https://chart-studio.plotly.com/~GioF/1.embed", "fid": "GioF:1", "filename": "Plot 1", "filetype": "plot", "img_url": "https://storage.googleapis.com/plotly-prod-images/GioF/1/9_FP7CRF47846I44LYMG932P85HKKCNA.png", "image_urls": { "default": "https://storage.googleapis.com/plotly-prod-images/GioF/1/2_PRXHWOU5XNWJMIEFLUB5WRCHOHDHS0.png", "block-thumb": "https://storage.googleapis.com/plotly-prod-images/GioF/1/8_19V3TN7YPFQEZ0GMN15ZBWIKA9AJ0K.png", "list-thumb": "https://storage.googleapis.com/plotly-prod-images/GioF/1/9_FP7CRF47846I44LYMG932P85HKKCNA.png" }, "api_urls": { "files": "https://api.plotly.com/v2/files/GioF:1", "plots": "https://api.plotly.com/v2/plots/GioF:1", "parent": "https://api.plotly.com/v2/folders/home?user=GioF" }, "owner": "GioF", "parent": -1, "preview": "", "referencers": [], "references": [], "title": "", "views": 1, "web_url": "https://chart-studio.plotly.com/~GioF/1/", "world_readable": true, "date_modified": "2024-04-22T08:59:44.832Z", "stars": { "results": [], "count": 0 }, "collaborators": { "results": [], "count": 0 }, "subfolder_count": null, "refresh_interval": null, "organize_view_url": "https://chart-studio.plotly.com/~GioF/1/", "current_user_permission": "read", "is_theme": null, "is_template": false, "autosize": true, "caption": "", "figure": { "data": [ { "line": { "width": 2 }, "meta": { "columnNames": { "x": "A", "y": "B" } }, "mode": "markers+lines", "name": "<b>Full-time police</b>", "type": "scatter", "xsrc": "GioF:0:02a450", "ysrc": "GioF:0:62ca54", "marker": { "size": 6, "color": "#636efa", "maxdisplayed": 0 }, "error_x": { "type": "percent", "color": "#636efa", "value": 10, "width": 4, "visible": false, "symmetric": false, "thickness": 2, "valueminus": 10 }, "opacity": 1, "visible": true, "showlegend": true, "orientation": "v" }, { "meta": { "columnNames": { "x": "A", "y": "C" } }, "mode": "markers+lines", "name": "<b>Homicides</b>", "type": "scatter", "xsrc": "GioF:0:02a450", "ysrc": "GioF:0:2a2dd9", "xaxis": "x", "yaxis": "y", "orientation": "v" } ], "frames": [], "layout": { "font": { "size": 14 }, "title": { "text": "<b>Full-time Police and Homicides from 1961 to 1973 in Detroit, Michigan USA</b>" }, "xaxis": { "side": "bottom", "type": "linear", "range": [ 1961, 1973 ], "title": { "text": "Years" }, "anchor": "y", "domain": [ 0, 1 ], "autorange": false }, "yaxis": { "type": "linear", "range": [ -16.398655687923387, 415.1086556879234 ], "title": { "text": "Number of Homicides and Full-time Police" }, "autorange": true }, "autosize": true, "template": { "data": { "bar": [ { "type": "bar", "marker": { "colorbar": { "ticks": "", "outlinewidth": 0 } } } ], "table": [ { "type": "table", "cells": { "fill": { "color": "#EBF0F8" }, "line": { "color": "white" } }, "header": { "fill": { "color": "#C8D4E3" }, "line": { "color": "white" } } } ], "carpet": [ { "type": "carpet", "aaxis": { "gridcolor": "#C8D4E3", "linecolor": "#C8D4E3", "endlinecolor": "#2a3f5f", "minorgridcolor": "#C8D4E3", "startlinecolor": "#2a3f5f" }, "baxis": { "gridcolor": "#C8D4E3", "linecolor": "#C8D4E3", "endlinecolor": "#2a3f5f", "minorgridcolor": "#C8D4E3", "startlinecolor": "#2a3f5f" } } ], "mesh3d": [ { "type": "mesh3d", "colorbar": { "ticks": "", "outlinewidth": 0 } } ], "contour": [ { "type": "contour", "colorbar": { "ticks": "", "outlinewidth": 0 }, "autocolorscale": true } ], "heatmap": [ { "type": "heatmap", "colorbar": { "ticks": "", "outlinewidth": 0 }, "autocolorscale": true } ], "scatter": [ { "type": "scatter", "marker": { "colorbar": { "ticks": "", "outlinewidth": 0 } } } ], "surface": [ { "type": "surface", "colorbar": { "ticks": "", "outlinewidth": 0 } } ], "heatmapgl": [ { "type": "heatmapgl", "colorbar": { "ticks": "", "outlinewidth": 0 } } ], "histogram": [ { "type": "histogram", "marker": { "colorbar": { "ticks": "", "outlinewidth": 0 } } } ], "parcoords": [ { "line": { "colorbar": { "ticks": "", "outlinewidth": 0 } }, "type": "parcoords" } ], "scatter3d": [ { "type": "scatter3d", "marker": { "colorbar": { "ticks": "", "outlinewidth": 0 } } } ], "scattergl": [ { "type": "scattergl", "marker": { "colorbar": { "ticks": "", "outlinewidth": 0 } } } ], "choropleth": [ { "type": "choropleth", "colorbar": { "ticks": "", "outlinewidth": 0 } } ], "scattergeo": [ { "type": "scattergeo", "marker": { "colorbar": { "ticks": "", "outlinewidth": 0 } } } ], "histogram2d": [ { "type": "histogram2d", "colorbar": { "ticks": "", "outlinewidth": 0 }, "autocolorscale": true } ], "scatterpolar": [ { "type": "scatterpolar", "marker": { "colorbar": { "ticks": "", "outlinewidth": 0 } } } ], "contourcarpet": [ { "type": "contourcarpet", "colorbar": { "ticks": "", "outlinewidth": 0 } } ], "scattercarpet": [ { "type": "scattercarpet", "marker": { "colorbar": { "ticks": "", "outlinewidth": 0 } } } ], "scattermapbox": [ { "type": "scattermapbox", "marker": { "colorbar": { "ticks": "", "outlinewidth": 0 } } } ], "scatterpolargl": [ { "type": "scatterpolargl", "marker": { "colorbar": { "ticks": "", "outlinewidth": 0 } } } ], "scatterternary": [ { "type": "scatterternary", "marker": { "colorbar": { "ticks": "", "outlinewidth": 0 } } } ], "histogram2dcontour": [ { "type": "histogram2dcontour", "colorbar": { "ticks": "", "outlinewidth": 0 }, "autocolorscale": true } ] }, "layout": { "geo": { "bgcolor": "white", "showland": true, "lakecolor": "white", "landcolor": "white", "showlakes": true, "subunitcolor": "#C8D4E3" }, "font": { "color": "#2a3f5f" }, "polar": { "bgcolor": "white", "radialaxis": { "ticks": "", "gridcolor": "#EBF0F8", "linecolor": "#EBF0F8" }, "angularaxis": { "ticks": "", "gridcolor": "#EBF0F8", "linecolor": "#EBF0F8" } }, "scene": { "xaxis": { "ticks": "", "gridcolor": "#DFE8F3", "gridwidth": 2, "linecolor": "#EBF0F8", "zerolinecolor": "#EBF0F8", "showbackground": true, "backgroundcolor": "white" }, "yaxis": { "ticks": "", "gridcolor": "#DFE8F3", "gridwidth": 2, "linecolor": "#EBF0F8", "zerolinecolor": "#EBF0F8", "showbackground": true, "backgroundcolor": "white" }, "zaxis": { "ticks": "", "gridcolor": "#DFE8F3", "gridwidth": 2, "linecolor": "#EBF0F8", "zerolinecolor": "#EBF0F8", "showbackground": true, "backgroundcolor": "white" } }, "title": { "x": 0.05 }, "xaxis": { "ticks": "", "gridcolor": "#EBF0F8", "linecolor": "#EBF0F8", "automargin": true, "zerolinecolor": "#EBF0F8", "zerolinewidth": 2 }, "yaxis": { "ticks": "", "gridcolor": "#EBF0F8", "linecolor": "#EBF0F8", "automargin": true, "zerolinecolor": "#EBF0F8", "zerolinewidth": 2 }, "ternary": { "aaxis": { "ticks": "", "gridcolor": "#DFE8F3", "linecolor": "#A2B1C6" }, "baxis": { "ticks": "", "gridcolor": "#DFE8F3", "linecolor": "#A2B1C6" }, "caxis": { "ticks": "", "gridcolor": "#DFE8F3", "linecolor": "#A2B1C6" }, "bgcolor": "white" }, "colorway": [ "#636efa", "#EF553B", "#00cc96", "#ab63fa", "#19d3f3", "#e763fa", "#fecb52", "#ffa15a", "#ff6692", "#b6e880" ], "hovermode": "closest", "colorscale": { "diverging": [ [ 0, "#8e0152" ], [ 0.1, "#c51b7d" ], [ 0.2, "#de77ae" ], [ 0.3, "#f1b6da" ], [ 0.4, "#fde0ef" ], [ 0.5, "#f7f7f7" ], [ 0.6, "#e6f5d0" ], [ 0.7, "#b8e186" ], [ 0.8, "#7fbc41" ], [ 0.9, "#4d9221" ], [ 1, "#276419" ] ], "sequential": [ [ 0, "#0508b8" ], [ 0.0893854748603352, "#1910d8" ], [ 0.1787709497206704, "#3c19f0" ], [ 0.2681564245810056, "#6b1cfb" ], [ 0.3575418994413408, "#981cfd" ], [ 0.44692737430167595, "#bf1cfd" ], [ 0.5363128491620112, "#dd2bfd" ], [ 0.6256983240223464, "#f246fe" ], [ 0.7150837988826816, "#fc67fd" ], [ 0.8044692737430168, "#fe88fc" ], [ 0.8938547486033519, "#fea5fd" ], [ 0.9832402234636871, "#febefe" ], [ 1, "#fec3fe" ] ], "sequentialminus": [ [ 0, "#0508b8" ], [ 0.0893854748603352, "#1910d8" ], [ 0.1787709497206704, "#3c19f0" ], [ 0.2681564245810056, "#6b1cfb" ], [ 0.3575418994413408, "#981cfd" ], [ 0.44692737430167595, "#bf1cfd" ], [ 0.5363128491620112, "#dd2bfd" ], [ 0.6256983240223464, "#f246fe" ], [ 0.7150837988826816, "#fc67fd" ], [ 0.8044692737430168, "#fe88fc" ], [ 0.8938547486033519, "#fea5fd" ], [ 0.9832402234636871, "#febefe" ], [ 1, "#fec3fe" ] ] }, "plot_bgcolor": "white", "paper_bgcolor": "white", "shapedefaults": { "line": { "width": 0 }, "opacity": 0.4, "fillcolor": "#506784" }, "annotationdefaults": { "arrowhead": 0, "arrowcolor": "#506784", "arrowwidth": 1 } }, "themeRef": "PLOTLY_WHITE" } } }, "height": null, "width": null, "user": { "profile_url": "https://chart-studio.plotly.com/~GioF", "avatar_url": "https://storage.googleapis.com/plotly-prod-profiles/71.jpg", "background_url": "https://storage.googleapis.com/plotly-prod-profiles/bg-1.jpg", "bio": "", "nickname": "", "website": "", "stream_tokens": null, "feature_set_id": null, "csrf_token": null, "date_joined": "2024-04-22 08:37:15", "mapbox_access_tokens": null, "has_password": null, "username": "GioF", "email": null, "is_active": null, "readonly": null, "is_dash_creator": null, "dash_created_count": null, "is_chart_creator": null, "charts_created_count": null } }, { "creation_time": "2024-04-22T08:36:31.999677Z", "comments": { "results": [], "count": 0 }, "parented": true, "embed_url": "https://chart-studio.plotly.com/~n11283378/5.embed", "fid": "n11283378:5", "filename": "Plot 5", "filetype": "plot", "img_url": "https://storage.googleapis.com/plotly-prod-images/n11283378/5/9_9C6K0S8J8PQCCWDQI1FTUAR8N3BS3F.png", "image_urls": { "default": "https://storage.googleapis.com/plotly-prod-images/n11283378/5/2_TGRUM3OIH1Z17JEG9CP7ITUJE2GNNZ.png", "block-thumb": "https://storage.googleapis.com/plotly-prod-images/n11283378/5/8_NF0NUQ0UE4T5NFC38TWIEAADM9KOA1.png", "list-thumb": "https://storage.googleapis.com/plotly-prod-images/n11283378/5/9_9C6K0S8J8PQCCWDQI1FTUAR8N3BS3F.png" }, "api_urls": { "files": "https://api.plotly.com/v2/files/n11283378:5", "plots": "https://api.plotly.com/v2/plots/n11283378:5", "parent": "https://api.plotly.com/v2/folders/home?user=n11283378" }, "owner": "n11283378", "parent": -1, "preview": "", "referencers": [], "references": [], "title": "", "views": 1, "web_url": "https://chart-studio.plotly.com/~n11283378/5/", "world_readable": true, "date_modified": "2024-04-22T11:16:25.185Z", "stars": { "results": [], "count": 0 }, "collaborators": { "results": [], "count": 0 }, "subfolder_count": null, "refresh_interval": null, "organize_view_url": "https://chart-studio.plotly.com/~n11283378/5/", "current_user_permission": "read", "is_theme": null, "is_template": false, "autosize": true, "caption": "", "figure": { "data": [ { "hole": 0, "meta": { "columnNames": { "text": "labels", "labels": "labels", "values": "values" } }, "mode": "markers", "pull": 0, "sort": true, "type": "pie", "marker": { "line": { "width": 2 } }, "textsrc": "n11283378:4:7b040c", "rotation": 0, "textfont": { "size": 30, "color": "rgb(239, 236, 236)", "family": "Roboto" }, "textinfo": "percent+text", "direction": "counterclockwise", "hoverinfo": "percent+label+value", "labelssrc": "n11283378:4:7b040c", "valuessrc": "n11283378:4:0bec6f", "hoverlabel": { "align": "auto" }, "orientation": "v", "textposition": "auto", "texttemplate": "", "time_created": "2024-04-18T06:13:36.409", "hovertemplate": "", "insidetextfont": { "size": "14", "color": "#FFFFFF" }, "insidetextorientation": "auto" } ], "frames": [], "layout": { "font": { "color": "rgb(4, 0, 0)" }, "xaxis": { "range": [ -1, 6 ], "autorange": true }, "yaxis": { "range": [ -1, 4 ], "autorange": true }, "legend": { "x": 1, "y": 1, "font": { "size": 25, "color": "rgb(26, 185, 247)" } }, "margin": { "b": 64, "l": 81, "t": 93 }, "autosize": true, "template": { "data": { "bar": [ { "type": "bar", "marker": { "colorbar": { "ticks": "", "outlinewidth": 0 } } } ], "table": [ { "type": "table", "cells": { "fill": { "color": "#506784" }, "line": { "color": "rgb(17,17,17)" } }, "header": { "fill": { "color": "#2a3f5f" }, "line": { "color": "rgb(17,17,17)" } } } ], "carpet": [ { "type": "carpet", "aaxis": { "gridcolor": "#506784", "linecolor": "#506784", "endlinecolor": "#A2B1C6", "minorgridcolor": "#506784", "startlinecolor": "#A2B1C6" }, "baxis": { "gridcolor": "#506784", "linecolor": "#506784", "endlinecolor": "#A2B1C6", "minorgridcolor": "#506784", "startlinecolor": "#A2B1C6" } } ], "mesh3d": [ { "type": "mesh3d", "colorbar": { "ticks": "", "outlinewidth": 0 } } ], "contour": [ { "type": "contour", "colorbar": { "ticks": "", "outlinewidth": 0 }, "autocolorscale": true } ], "heatmap": [ { "type": "heatmap", "colorbar": { "ticks": "", "outlinewidth": 0 }, "autocolorscale": true } ], "scatter": [ { "type": "scatter", "marker": { "colorbar": { "ticks": "", "outlinewidth": 0 } } } ], "surface": [ { "type": "surface", "colorbar": { "ticks": "", "outlinewidth": 0 } } ], "heatmapgl": [ { "type": "heatmapgl", "colorbar": { "ticks": "", "outlinewidth": 0 } } ], "histogram": [ { "type": "histogram", "marker": { "colorbar": { "ticks": "", "outlinewidth": 0 } } } ], "parcoords": [ { "line": { "colorbar": { "ticks": "", "outlinewidth": 0 } }, "type": "parcoords" } ], "scatter3d": [ { "type": "scatter3d", "marker": { "colorbar": { "ticks": "", "outlinewidth": 0 } } } ], "scattergl": [ { "type": "scattergl", "marker": { "colorbar": { "ticks": "", "outlinewidth": 0 } } } ], "choropleth": [ { "type": "choropleth", "colorbar": { "ticks": "", "outlinewidth": 0 } } ], "scattergeo": [ { "type": "scattergeo", "marker": { "colorbar": { "ticks": "", "outlinewidth": 0 } } } ], "histogram2d": [ { "type": "histogram2d", "colorbar": { "ticks": "", "outlinewidth": 0 }, "autocolorscale": true } ], "scatterpolar": [ { "type": "scatterpolar", "marker": { "colorbar": { "ticks": "", "outlinewidth": 0 } } } ], "contourcarpet": [ { "type": "contourcarpet", "colorbar": { "ticks": "", "outlinewidth": 0 } } ], "scattercarpet": [ { "type": "scattercarpet", "marker": { "colorbar": { "ticks": "", "outlinewidth": 0 } } } ], "scattermapbox": [ { "type": "scattermapbox", "marker": { "colorbar": { "ticks": "", "outlinewidth": 0 } } } ], "scatterpolargl": [ { "type": "scatterpolargl", "marker": { "colorbar": { "ticks": "", "outlinewidth": 0 } } } ], "scatterternary": [ { "type": "scatterternary", "marker": { "colorbar": { "ticks": "", "outlinewidth": 0 } } } ], "histogram2dcontour": [ { "type": "histogram2dcontour", "colorbar": { "ticks": "", "outlinewidth": 0 }, "autocolorscale": true } ] }, "layout": { "geo": { "bgcolor": "rgb(17,17,17)", "showland": true, "lakecolor": "rgb(17,17,17)", "landcolor": "rgb(17,17,17)", "showlakes": true, "subunitcolor": "#506784" }, "font": { "color": "#f2f5fa" }, "polar": { "bgcolor": "rgb(17,17,17)", "radialaxis": { "ticks": "", "gridcolor": "#506784", "linecolor": "#506784" }, "angularaxis": { "ticks": "", "gridcolor": "#506784", "linecolor": "#506784" } }, "scene": { "xaxis": { "ticks": "", "gridcolor": "#506784", "gridwidth": 2, "linecolor": "#506784", "zerolinecolor": "#C8D4E3", "showbackground": true, "backgroundcolor": "rgb(17,17,17)" }, "yaxis": { "ticks": "", "gridcolor": "#506784", "gridwidth": 2, "linecolor": "#506784", "zerolinecolor": "#C8D4E3", "showbackground": true, "backgroundcolor": "rgb(17,17,17)" }, "zaxis": { "ticks": "", "gridcolor": "#506784", "gridwidth": 2, "linecolor": "#506784", "zerolinecolor": "#C8D4E3", "showbackground": true, "backgroundcolor": "rgb(17,17,17)" } }, "title": { "x": 0.05 }, "xaxis": { "ticks": "", "gridcolor": "#283442", "linecolor": "#506784", "automargin": true, "zerolinecolor": "#283442", "zerolinewidth": 2 }, "yaxis": { "ticks": "", "gridcolor": "#283442", "linecolor": "#506784", "automargin": true, "zerolinecolor": "#283442", "zerolinewidth": 2 }, "ternary": { "aaxis": { "ticks": "", "gridcolor": "#506784", "linecolor": "#506784" }, "baxis": { "ticks": "", "gridcolor": "#506784", "linecolor": "#506784" }, "caxis": { "ticks": "", "gridcolor": "#506784", "linecolor": "#506784" }, "bgcolor": "rgb(17,17,17)" }, "colorway": [ "#636efa", "#EF553B", "#00cc96", "#ab63fa", "#19d3f3", "#e763fa", "#fecb52", "#ffa15a", "#ff6692", "#b6e880" ], "hovermode": "closest", "colorscale": { "diverging": [ [ 0, "#8e0152" ], [ 0.1, "#c51b7d" ], [ 0.2, "#de77ae" ], [ 0.3, "#f1b6da" ], [ 0.4, "#fde0ef" ], [ 0.5, "#f7f7f7" ], [ 0.6, "#e6f5d0" ], [ 0.7, "#b8e186" ], [ 0.8, "#7fbc41" ], [ 0.9, "#4d9221" ], [ 1, "#276419" ] ], "sequential": [ [ 0, "#0508b8" ], [ 0.0893854748603352, "#1910d8" ], [ 0.1787709497206704, "#3c19f0" ], [ 0.2681564245810056, "#6b1cfb" ], [ 0.3575418994413408, "#981cfd" ], [ 0.44692737430167595, "#bf1cfd" ], [ 0.5363128491620112, "#dd2bfd" ], [ 0.6256983240223464, "#f246fe" ], [ 0.7150837988826816, "#fc67fd" ], [ 0.8044692737430168, "#fe88fc" ], [ 0.8938547486033519, "#fea5fd" ], [ 0.9832402234636871, "#febefe" ], [ 1, "#fec3fe" ] ], "sequentialminus": [ [ 0, "#0508b8" ], [ 0.0893854748603352, "#1910d8" ], [ 0.1787709497206704, "#3c19f0" ], [ 0.2681564245810056, "#6b1cfb" ], [ 0.3575418994413408, "#981cfd" ], [ 0.44692737430167595, "#bf1cfd" ], [ 0.5363128491620112, "#dd2bfd" ], [ 0.6256983240223464, "#f246fe" ], [ 0.7150837988826816, "#fc67fd" ], [ 0.8044692737430168, "#fe88fc" ], [ 0.8938547486033519, "#fea5fd" ], [ 0.9832402234636871, "#febefe" ], [ 1, "#fec3fe" ] ] }, "plot_bgcolor": "rgb(17,17,17)", "paper_bgcolor": "rgb(17,17,17)", "shapedefaults": { "line": { "width": 0 }, "opacity": 0.4, "fillcolor": "#f2f5fa" }, "sliderdefaults": { "bgcolor": "#C8D4E3", "tickwidth": 0, "bordercolor": "rgb(17,17,17)", "borderwidth": 1 }, "annotationdefaults": { "arrowhead": 0, "arrowcolor": "#f2f5fa", "arrowwidth": 1 }, "updatemenudefaults": { "bgcolor": "#506784", "borderwidth": 0 } }, "themeRef": "PLOTLY_DARK" }, "colorscale": { "sequential": [ [ 0, "#0508b8" ], [ 0.08333333333333333, "#1910d8" ], [ 0.16666666666666666, "#3c19f0" ], [ 0.25, "#6b1cfb" ], [ 0.3333333333333333, "#981cfd" ], [ 0.4166666666666667, "#bf1cfd" ], [ 0.5, "#dd2bfd" ], [ 0.5833333333333334, "#f246fe" ], [ 0.6666666666666666, "#fc67fd" ], [ 0.75, "#fe88fc" ], [ 0.8333333333333334, "#fea5fd" ], [ 0.9166666666666666, "#febefe" ], [ 1, "#fec3fe" ] ], "sequentialminus": [ [ 0, "#0508b8" ], [ 0.08333333333333333, "#1910d8" ], [ 0.16666666666666666, "#3c19f0" ], [ 0.25, "#6b1cfb" ], [ 0.3333333333333333, "#981cfd" ], [ 0.4166666666666667, "#bf1cfd" ], [ 0.5, "#dd2bfd" ], [ 0.5833333333333334, "#f246fe" ], [ 0.6666666666666666, "#fc67fd" ], [ 0.75, "#fe88fc" ], [ 0.8333333333333334, "#fea5fd" ], [ 0.9166666666666666, "#febefe" ], [ 1, "#fec3fe" ] ] }, "hoverlabel": { "font": { "size": 13 } }, "showlegend": true, "annotations": [], "piecolorway": [ "rgb(3, 5, 18)", "rgb(25, 25, 51)", "rgb(44, 42, 87)", "rgb(58, 60, 125)", "rgb(62, 83, 160)", "rgb(62, 109, 178)", "rgb(72, 134, 187)", "rgb(89, 159, 196)", "rgb(114, 184, 205)", "rgb(149, 207, 216)", "rgb(192, 229, 232)", "rgb(234, 252, 253)" ] } }, "height": null, "width": null, "user": { "profile_url": "https://chart-studio.plotly.com/~n11283378", "avatar_url": "https://storage.googleapis.com/plotly-prod-profiles/80.jpg", "background_url": "https://storage.googleapis.com/plotly-prod-profiles/bg-12.jpg", "bio": "", "nickname": "", "website": "", "stream_tokens": null, "feature_set_id": null, "csrf_token": null, "date_joined": "2024-04-22 03:14:56", "mapbox_access_tokens": null, "has_password": null, "username": "n11283378", "email": null, "is_active": null, "readonly": null, "is_dash_creator": null, "dash_created_count": null, "is_chart_creator": null, "charts_created_count": null } }, { "creation_time": "2024-04-22T08:35:24.559660Z", "comments": { "results": [], "count": 0 }, "parented": true, "embed_url": "https://chart-studio.plotly.com/~MFMechenich/84.embed", "fid": "MFMechenich:84", "filename": "CoSD - ZEV EVSE Ports - Bar", "filetype": "plot", "img_url": "https://storage.googleapis.com/plotly-prod-images/MFMechenich/84/9_CEF883ZJK6661B6TGL8C41X6Z1ZNAN.png", "image_urls": { "default": "https://storage.googleapis.com/plotly-prod-images/MFMechenich/84/2_25NGKLPI3I2SF2EZLZG5ATTJAQ4O9G.png", "block-thumb": "https://storage.googleapis.com/plotly-prod-images/MFMechenich/84/8_OB6E9M9QCFDVK9FI5M8PAZO4GCPZDS.png", "list-thumb": "https://storage.googleapis.com/plotly-prod-images/MFMechenich/84/9_CEF883ZJK6661B6TGL8C41X6Z1ZNAN.png" }, "api_urls": { "files": "https://api.plotly.com/v2/files/MFMechenich:84", "plots": "https://api.plotly.com/v2/plots/MFMechenich:84", "parent": "https://api.plotly.com/v2/folders/home?user=MFMechenich" }, "owner": "MFMechenich", "parent": -1, "preview": "", "referencers": [], "references": [], "title": "", "views": 1, "web_url": "https://chart-studio.plotly.com/~MFMechenich/84/", "world_readable": true, "date_modified": "2024-04-22T08:49:27.182Z", "stars": { "results": [], "count": 0 }, "collaborators": { "results": [], "count": 0 }, "subfolder_count": null, "refresh_interval": null, "organize_view_url": "https://chart-studio.plotly.com/~MFMechenich/84/", "current_user_permission": "read", "is_theme": null, "is_template": false, "autosize": true, "caption": "", "figure": { "data": [ { "meta": { "columnNames": { "x": "Year Private", "y": "Value Private" } }, "mode": "markers", "type": "bar", "xsrc": "MFMechenich:83:38d50d", "ysrc": "MFMechenich:83:e35fe1", "transforms": [ { "meta": { "columnNames": { "groups": "Type Private" } }, "type": "groupby", "styles": [ { "value": { "name": "L2 (Private)", "legendgroup": "" }, "target": "L2" }, { "value": { "name": "DC Fast (Private)" }, "target": "DC Fast" } ], "groupssrc": "MFMechenich:83:88de87" } ], "orientation": "v" }, { "meta": { "columnNames": { "x": "Year Public", "y": "Value Public" } }, "type": "bar", "xsrc": "MFMechenich:83:d026dd", "ysrc": "MFMechenich:83:737394", "transforms": [ { "meta": { "columnNames": { "groups": "Type Public" } }, "type": "groupby", "styles": [ { "value": { "name": "L2 (Public)" }, "target": "L2" }, { "value": { "name": "DC Fast (Public)" }, "target": "DC Fast" } ], "groupssrc": "MFMechenich:83:08409e" } ], "orientation": "v" } ], "frames": [], "layout": { "title": { "text": "ZEV EVSE Ports" }, "xaxis": { "type": "linear", "range": [ 2018.6, 2023.4 ], "tickmode": "linear", "autorange": true }, "yaxis": { "type": "linear", "range": [ 0, 1936.842105263158 ], "autorange": true }, "bargap": 0.19999999999999996, "barmode": "relative", "autosize": true, "template": { "data": { "bar": [ { "type": "bar", "marker": { "colorbar": { "ticks": "", "outlinewidth": 0 } } } ], "table": [ { "type": "table", "cells": { "fill": { "color": "#EBF0F8" }, "line": { "color": "white" } }, "header": { "fill": { "color": "#C8D4E3" }, "line": { "color": "white" } } } ], "carpet": [ { "type": "carpet", "aaxis": { "gridcolor": "#C8D4E3", "linecolor": "#C8D4E3", "endlinecolor": "#2a3f5f", "minorgridcolor": "#C8D4E3", "startlinecolor": "#2a3f5f" }, "baxis": { "gridcolor": "#C8D4E3", "linecolor": "#C8D4E3", "endlinecolor": "#2a3f5f", "minorgridcolor": "#C8D4E3", "startlinecolor": "#2a3f5f" } } ], "mesh3d": [ { "type": "mesh3d", "colorbar": { "ticks": "", "outlinewidth": 0 } } ], "contour": [ { "type": "contour", "colorbar": { "ticks": "", "outlinewidth": 0 }, "autocolorscale": true } ], "heatmap": [ { "type": "heatmap", "colorbar": { "ticks": "", "outlinewidth": 0 }, "autocolorscale": true } ], "scatter": [ { "type": "scatter", "marker": { "colorbar": { "ticks": "", "outlinewidth": 0 } } } ], "surface": [ { "type": "surface", "colorbar": { "ticks": "", "outlinewidth": 0 } } ], "heatmapgl": [ { "type": "heatmapgl", "colorbar": { "ticks": "", "outlinewidth": 0 } } ], "histogram": [ { "type": "histogram", "marker": { "colorbar": { "ticks": "", "outlinewidth": 0 } } } ], "parcoords": [ { "line": { "colorbar": { "ticks": "", "outlinewidth": 0 } }, "type": "parcoords" } ], "scatter3d": [ { "type": "scatter3d", "marker": { "colorbar": { "ticks": "", "outlinewidth": 0 } } } ], "scattergl": [ { "type": "scattergl", "marker": { "colorbar": { "ticks": "", "outlinewidth": 0 } } } ], "choropleth": [ { "type": "choropleth", "colorbar": { "ticks": "", "outlinewidth": 0 } } ], "scattergeo": [ { "type": "scattergeo", "marker": { "colorbar": { "ticks": "", "outlinewidth": 0 } } } ], "histogram2d": [ { "type": "histogram2d", "colorbar": { "ticks": "", "outlinewidth": 0 }, "autocolorscale": true } ], "scatterpolar": [ { "type": "scatterpolar", "marker": { "colorbar": { "ticks": "", "outlinewidth": 0 } } } ], "contourcarpet": [ { "type": "contourcarpet", "colorbar": { "ticks": "", "outlinewidth": 0 } } ], "scattercarpet": [ { "type": "scattercarpet", "marker": { "colorbar": { "ticks": "", "outlinewidth": 0 } } } ], "scattermapbox": [ { "type": "scattermapbox", "marker": { "colorbar": { "ticks": "", "outlinewidth": 0 } } } ], "scatterpolargl": [ { "type": "scatterpolargl", "marker": { "colorbar": { "ticks": "", "outlinewidth": 0 } } } ], "scatterternary": [ { "type": "scatterternary", "marker": { "colorbar": { "ticks": "", "outlinewidth": 0 } } } ], "histogram2dcontour": [ { "type": "histogram2dcontour", "colorbar": { "ticks": "", "outlinewidth": 0 }, "autocolorscale": true } ] }, "layout": { "geo": { "bgcolor": "white", "showland": true, "lakecolor": "white", "landcolor": "white", "showlakes": true, "subunitcolor": "#C8D4E3" }, "font": { "color": "#2a3f5f" }, "polar": { "bgcolor": "white", "radialaxis": { "ticks": "", "gridcolor": "#EBF0F8", "linecolor": "#EBF0F8" }, "angularaxis": { "ticks": "", "gridcolor": "#EBF0F8", "linecolor": "#EBF0F8" } }, "scene": { "xaxis": { "ticks": "", "gridcolor": "#DFE8F3", "gridwidth": 2, "linecolor": "#EBF0F8", "zerolinecolor": "#EBF0F8", "showbackground": true, "backgroundcolor": "white" }, "yaxis": { "ticks": "", "gridcolor": "#DFE8F3", "gridwidth": 2, "linecolor": "#EBF0F8", "zerolinecolor": "#EBF0F8", "showbackground": true, "backgroundcolor": "white" }, "zaxis": { "ticks": "", "gridcolor": "#DFE8F3", "gridwidth": 2, "linecolor": "#EBF0F8", "zerolinecolor": "#EBF0F8", "showbackground": true, "backgroundcolor": "white" } }, "title": { "x": 0.05 }, "xaxis": { "ticks": "", "gridcolor": "#EBF0F8", "linecolor": "#EBF0F8", "automargin": true, "zerolinecolor": "#EBF0F8", "zerolinewidth": 2 }, "yaxis": { "ticks": "", "gridcolor": "#EBF0F8", "linecolor": "#EBF0F8", "automargin": true, "zerolinecolor": "#EBF0F8", "zerolinewidth": 2 }, "ternary": { "aaxis": { "ticks": "", "gridcolor": "#DFE8F3", "linecolor": "#A2B1C6" }, "baxis": { "ticks": "", "gridcolor": "#DFE8F3", "linecolor": "#A2B1C6" }, "caxis": { "ticks": "", "gridcolor": "#DFE8F3", "linecolor": "#A2B1C6" }, "bgcolor": "white" }, "colorway": [ "#636efa", "#EF553B", "#00cc96", "#ab63fa", "#19d3f3", "#e763fa", "#fecb52", "#ffa15a", "#ff6692", "#b6e880" ], "hovermode": "closest", "colorscale": { "diverging": [ [ 0, "#8e0152" ], [ 0.1, "#c51b7d" ], [ 0.2, "#de77ae" ], [ 0.3, "#f1b6da" ], [ 0.4, "#fde0ef" ], [ 0.5, "#f7f7f7" ], [ 0.6, "#e6f5d0" ], [ 0.7, "#b8e186" ], [ 0.8, "#7fbc41" ], [ 0.9, "#4d9221" ], [ 1, "#276419" ] ], "sequential": [ [ 0, "#0508b8" ], [ 0.0893854748603352, "#1910d8" ], [ 0.1787709497206704, "#3c19f0" ], [ 0.2681564245810056, "#6b1cfb" ], [ 0.3575418994413408, "#981cfd" ], [ 0.44692737430167595, "#bf1cfd" ], [ 0.5363128491620112, "#dd2bfd" ], [ 0.6256983240223464, "#f246fe" ], [ 0.7150837988826816, "#fc67fd" ], [ 0.8044692737430168, "#fe88fc" ], [ 0.8938547486033519, "#fea5fd" ], [ 0.9832402234636871, "#febefe" ], [ 1, "#fec3fe" ] ], "sequentialminus": [ [ 0, "#0508b8" ], [ 0.0893854748603352, "#1910d8" ], [ 0.1787709497206704, "#3c19f0" ], [ 0.2681564245810056, "#6b1cfb" ], [ 0.3575418994413408, "#981cfd" ], [ 0.44692737430167595, "#bf1cfd" ], [ 0.5363128491620112, "#dd2bfd" ], [ 0.6256983240223464, "#f246fe" ], [ 0.7150837988826816, "#fc67fd" ], [ 0.8044692737430168, "#fe88fc" ], [ 0.8938547486033519, "#fea5fd" ], [ 0.9832402234636871, "#febefe" ], [ 1, "#fec3fe" ] ] }, "plot_bgcolor": "white", "paper_bgcolor": "white", "shapedefaults": { "line": { "width": 0 }, "opacity": 0.4, "fillcolor": "#506784" }, "annotationdefaults": { "arrowhead": 0, "arrowcolor": "#506784", "arrowwidth": 1 } }, "themeRef": "PLOTLY_WHITE" } } }, "height": null, "width": null, "user": { "profile_url": "https://chart-studio.plotly.com/~MFMechenich", "avatar_url": "https://storage.googleapis.com/plotly-prod-profiles/5.jpg", "background_url": "https://storage.googleapis.com/plotly-prod-profiles/bg-5.jpg", "bio": "", "nickname": "", "website": "", "stream_tokens": null, "feature_set_id": null, "csrf_token": null, "date_joined": "2023-06-27 12:50:39", "mapbox_access_tokens": null, "has_password": null, "username": "MFMechenich", "email": null, "is_active": null, "readonly": null, "is_dash_creator": null, "dash_created_count": null, "is_chart_creator": null, "charts_created_count": null } }, { "creation_time": "2024-04-22T08:31:34.867047Z", "comments": { "results": [], "count": 0 }, "parented": true, "embed_url": "https://chart-studio.plotly.com/~MFMechenich/82.embed", "fid": "MFMechenich:82", "filename": "CoSD - ZEV Charging Stations - Bar", "filetype": "plot", "img_url": "https://storage.googleapis.com/plotly-prod-images/MFMechenich/82/9_MTR698Q920G0DX4VRCIWLDVNUKTZUI.png", "image_urls": { "default": "https://storage.googleapis.com/plotly-prod-images/MFMechenich/82/2_2E0JAZO7GJNQV5HJ5XEGW7XB9BRE38.png", "block-thumb": "https://storage.googleapis.com/plotly-prod-images/MFMechenich/82/8_2HXA902XNO1IR7ICI5ACI5AOX7OLIN.png", "list-thumb": "https://storage.googleapis.com/plotly-prod-images/MFMechenich/82/9_MTR698Q920G0DX4VRCIWLDVNUKTZUI.png" }, "api_urls": { "files": "https://api.plotly.com/v2/files/MFMechenich:82", "plots": "https://api.plotly.com/v2/plots/MFMechenich:82", "parent": "https://api.plotly.com/v2/folders/home?user=MFMechenich" }, "owner": "MFMechenich", "parent": -1, "preview": "", "referencers": [], "references": [], "title": "", "views": 1, "web_url": "https://chart-studio.plotly.com/~MFMechenich/82/", "world_readable": true, "date_modified": "2024-04-22T08:34:58.373Z", "stars": { "results": [], "count": 0 }, "collaborators": { "results": [], "count": 0 }, "subfolder_count": null, "refresh_interval": null, "organize_view_url": "https://chart-studio.plotly.com/~MFMechenich/82/", "current_user_permission": "read", "is_theme": null, "is_template": false, "autosize": true, "caption": "", "figure": { "data": [ { "meta": { "columnNames": { "x": "Year Private", "y": "Value Private" } }, "mode": "markers", "type": "bar", "xsrc": "MFMechenich:81:38d50d", "ysrc": "MFMechenich:81:e35fe1", "transforms": [ { "meta": { "columnNames": { "groups": "Type Private" } }, "type": "groupby", "styles": [ { "value": { "name": "L2 (Private)", "legendgroup": "" }, "target": "L2" }, { "value": { "name": "DC Fast (Private)" }, "target": "DC Fast" } ], "groupssrc": "MFMechenich:81:88de87" } ], "orientation": "v" }, { "meta": { "columnNames": { "x": "Year Public", "y": "Value Public" } }, "type": "bar", "xsrc": "MFMechenich:81:d026dd", "ysrc": "MFMechenich:81:737394", "transforms": [ { "meta": { "columnNames": { "groups": "Type Public" } }, "type": "groupby", "styles": [ { "value": { "name": "L2 (Public)" }, "target": "L2" }, { "value": { "name": "DC Fast (Public)" }, "target": "DC Fast" } ], "groupssrc": "MFMechenich:81:08409e" } ], "orientation": "v" } ], "frames": [], "layout": { "title": { "text": "ZEV Charging Stations" }, "xaxis": { "type": "linear", "range": [ 2018.6, 2023.4 ], "tickmode": "linear", "autorange": true }, "yaxis": { "type": "linear", "range": [ 0, 665.2631578947369 ], "autorange": true }, "bargap": 0.19999999999999996, "barmode": "relative", "autosize": true, "template": { "data": { "bar": [ { "type": "bar", "marker": { "colorbar": { "ticks": "", "outlinewidth": 0 } } } ], "table": [ { "type": "table", "cells": { "fill": { "color": "#EBF0F8" }, "line": { "color": "white" } }, "header": { "fill": { "color": "#C8D4E3" }, "line": { "color": "white" } } } ], "carpet": [ { "type": "carpet", "aaxis": { "gridcolor": "#C8D4E3", "linecolor": "#C8D4E3", "endlinecolor": "#2a3f5f", "minorgridcolor": "#C8D4E3", "startlinecolor": "#2a3f5f" }, "baxis": { "gridcolor": "#C8D4E3", "linecolor": "#C8D4E3", "endlinecolor": "#2a3f5f", "minorgridcolor": "#C8D4E3", "startlinecolor": "#2a3f5f" } } ], "mesh3d": [ { "type": "mesh3d", "colorbar": { "ticks": "", "outlinewidth": 0 } } ], "contour": [ { "type": "contour", "colorbar": { "ticks": "", "outlinewidth": 0 }, "autocolorscale": true } ], "heatmap": [ { "type": "heatmap", "colorbar": { "ticks": "", "outlinewidth": 0 }, "autocolorscale": true } ], "scatter": [ { "type": "scatter", "marker": { "colorbar": { "ticks": "", "outlinewidth": 0 } } } ], "surface": [ { "type": "surface", "colorbar": { "ticks": "", "outlinewidth": 0 } } ], "heatmapgl": [ { "type": "heatmapgl", "colorbar": { "ticks": "", "outlinewidth": 0 } } ], "histogram": [ { "type": "histogram", "marker": { "colorbar": { "ticks": "", "outlinewidth": 0 } } } ], "parcoords": [ { "line": { "colorbar": { "ticks": "", "outlinewidth": 0 } }, "type": "parcoords" } ], "scatter3d": [ { "type": "scatter3d", "marker": { "colorbar": { "ticks": "", "outlinewidth": 0 } } } ], "scattergl": [ { "type": "scattergl", "marker": { "colorbar": { "ticks": "", "outlinewidth": 0 } } } ], "choropleth": [ { "type": "choropleth", "colorbar": { "ticks": "", "outlinewidth": 0 } } ], "scattergeo": [ { "type": "scattergeo", "marker": { "colorbar": { "ticks": "", "outlinewidth": 0 } } } ], "histogram2d": [ { "type": "histogram2d", "colorbar": { "ticks": "", "outlinewidth": 0 }, "autocolorscale": true } ], "scatterpolar": [ { "type": "scatterpolar", "marker": { "colorbar": { "ticks": "", "outlinewidth": 0 } } } ], "contourcarpet": [ { "type": "contourcarpet", "colorbar": { "ticks": "", "outlinewidth": 0 } } ], "scattercarpet": [ { "type": "scattercarpet", "marker": { "colorbar": { "ticks": "", "outlinewidth": 0 } } } ], "scattermapbox": [ { "type": "scattermapbox", "marker": { "colorbar": { "ticks": "", "outlinewidth": 0 } } } ], "scatterpolargl": [ { "type": "scatterpolargl", "marker": { "colorbar": { "ticks": "", "outlinewidth": 0 } } } ], "scatterternary": [ { "type": "scatterternary", "marker": { "colorbar": { "ticks": "", "outlinewidth": 0 } } } ], "histogram2dcontour": [ { "type": "histogram2dcontour", "colorbar": { "ticks": "", "outlinewidth": 0 }, "autocolorscale": true } ] }, "layout": { "geo": { "bgcolor": "white", "showland": true, "lakecolor": "white", "landcolor": "white", "showlakes": true, "subunitcolor": "#C8D4E3" }, "font": { "color": "#2a3f5f" }, "polar": { "bgcolor": "white", "radialaxis": { "ticks": "", "gridcolor": "#EBF0F8", "linecolor": "#EBF0F8" }, "angularaxis": { "ticks": "", "gridcolor": "#EBF0F8", "linecolor": "#EBF0F8" } }, "scene": { "xaxis": { "ticks": "", "gridcolor": "#DFE8F3", "gridwidth": 2, "linecolor": "#EBF0F8", "zerolinecolor": "#EBF0F8", "showbackground": true, "backgroundcolor": "white" }, "yaxis": { "ticks": "", "gridcolor": "#DFE8F3", "gridwidth": 2, "linecolor": "#EBF0F8", "zerolinecolor": "#EBF0F8", "showbackground": true, "backgroundcolor": "white" }, "zaxis": { "ticks": "", "gridcolor": "#DFE8F3", "gridwidth": 2, "linecolor": "#EBF0F8", "zerolinecolor": "#EBF0F8", "showbackground": true, "backgroundcolor": "white" } }, "title": { "x": 0.05 }, "xaxis": { "ticks": "", "gridcolor": "#EBF0F8", "linecolor": "#EBF0F8", "automargin": true, "zerolinecolor": "#EBF0F8", "zerolinewidth": 2 }, "yaxis": { "ticks": "", "gridcolor": "#EBF0F8", "linecolor": "#EBF0F8", "automargin": true, "zerolinecolor": "#EBF0F8", "zerolinewidth": 2 }, "ternary": { "aaxis": { "ticks": "", "gridcolor": "#DFE8F3", "linecolor": "#A2B1C6" }, "baxis": { "ticks": "", "gridcolor": "#DFE8F3", "linecolor": "#A2B1C6" }, "caxis": { "ticks": "", "gridcolor": "#DFE8F3", "linecolor": "#A2B1C6" }, "bgcolor": "white" }, "colorway": [ "#636efa", "#EF553B", "#00cc96", "#ab63fa", "#19d3f3", "#e763fa", "#fecb52", "#ffa15a", "#ff6692", "#b6e880" ], "hovermode": "closest", "colorscale": { "diverging": [ [ 0, "#8e0152" ], [ 0.1, "#c51b7d" ], [ 0.2, "#de77ae" ], [ 0.3, "#f1b6da" ], [ 0.4, "#fde0ef" ], [ 0.5, "#f7f7f7" ], [ 0.6, "#e6f5d0" ], [ 0.7, "#b8e186" ], [ 0.8, "#7fbc41" ], [ 0.9, "#4d9221" ], [ 1, "#276419" ] ], "sequential": [ [ 0, "#0508b8" ], [ 0.0893854748603352, "#1910d8" ], [ 0.1787709497206704, "#3c19f0" ], [ 0.2681564245810056, "#6b1cfb" ], [ 0.3575418994413408, "#981cfd" ], [ 0.44692737430167595, "#bf1cfd" ], [ 0.5363128491620112, "#dd2bfd" ], [ 0.6256983240223464, "#f246fe" ], [ 0.7150837988826816, "#fc67fd" ], [ 0.8044692737430168, "#fe88fc" ], [ 0.8938547486033519, "#fea5fd" ], [ 0.9832402234636871, "#febefe" ], [ 1, "#fec3fe" ] ], "sequentialminus": [ [ 0, "#0508b8" ], [ 0.0893854748603352, "#1910d8" ], [ 0.1787709497206704, "#3c19f0" ], [ 0.2681564245810056, "#6b1cfb" ], [ 0.3575418994413408, "#981cfd" ], [ 0.44692737430167595, "#bf1cfd" ], [ 0.5363128491620112, "#dd2bfd" ], [ 0.6256983240223464, "#f246fe" ], [ 0.7150837988826816, "#fc67fd" ], [ 0.8044692737430168, "#fe88fc" ], [ 0.8938547486033519, "#fea5fd" ], [ 0.9832402234636871, "#febefe" ], [ 1, "#fec3fe" ] ] }, "plot_bgcolor": "white", "paper_bgcolor": "white", "shapedefaults": { "line": { "width": 0 }, "opacity": 0.4, "fillcolor": "#506784" }, "annotationdefaults": { "arrowhead": 0, "arrowcolor": "#506784", "arrowwidth": 1 } }, "themeRef": "PLOTLY_WHITE" } } }, "height": null, "width": null, "user": { "profile_url": "https://chart-studio.plotly.com/~MFMechenich", "avatar_url": "https://storage.googleapis.com/plotly-prod-profiles/5.jpg", "background_url": "https://storage.googleapis.com/plotly-prod-profiles/bg-5.jpg", "bio": "", "nickname": "", "website": "", "stream_tokens": null, "feature_set_id": null, "csrf_token": null, "date_joined": "2023-06-27 12:50:39", "mapbox_access_tokens": null, "has_password": null, "username": "MFMechenich", "email": null, "is_active": null, "readonly": null, "is_dash_creator": null, "dash_created_count": null, "is_chart_creator": null, "charts_created_count": null } }, { "creation_time": "2024-04-22T08:23:32.324575Z", "comments": { "results": [], "count": 0 }, "parented": true, "embed_url": "https://chart-studio.plotly.com/~StylersAndris/3.embed", "fid": "StylersAndris:3", "filename": "Plot 3", "filetype": "plot", "img_url": "https://storage.googleapis.com/plotly-prod-images/StylersAndris/3/9_YCM468WPXTJVNNBMTX05DVUVA2PO04.png", "image_urls": { "default": "https://storage.googleapis.com/plotly-prod-images/StylersAndris/3/2_3U3SYAWTQUHC1AE8NMCH84CKJ93EZB.png", "block-thumb": "https://storage.googleapis.com/plotly-prod-images/StylersAndris/3/8_IN1Q2HY8KDIE469AHC4L9F7BS3V6P0.png", "list-thumb": "https://storage.googleapis.com/plotly-prod-images/StylersAndris/3/9_YCM468WPXTJVNNBMTX05DVUVA2PO04.png" }, "api_urls": { "files": "https://api.plotly.com/v2/files/StylersAndris:3", "plots": "https://api.plotly.com/v2/plots/StylersAndris:3", "parent": "https://api.plotly.com/v2/folders/home?user=StylersAndris" }, "owner": "StylersAndris", "parent": -1, "preview": "", "referencers": [], "references": [], "title": "", "views": 2, "web_url": "https://chart-studio.plotly.com/~StylersAndris/3/", "world_readable": true, "date_modified": "2024-04-22T08:23:32.336Z", "stars": { "results": [], "count": 0 }, "collaborators": { "results": [], "count": 0 }, "subfolder_count": null, "refresh_interval": null, "organize_view_url": "https://chart-studio.plotly.com/~StylersAndris/3/", "current_user_permission": "read", "is_theme": null, "is_template": false, "autosize": true, "caption": "", "figure": { "data": [ { "meta": { "columnNames": { "labels": "A", "values": "B" } }, "mode": "markers", "type": "pie", "labelssrc": "StylersAndris:2:05f131", "valuessrc": "StylersAndris:2:0f52bb" } ], "frames": [], "layout": { "title": { "x": 0.5, "font": { "family": "Balto" }, "text": "Gender" }, "xaxis": { "range": [ -1, 6 ], "autorange": true }, "yaxis": { "range": [ -1, 4 ], "autorange": true }, "legend": { "x": 0.5, "y": -0.1, "xanchor": "center", "orientation": "h" }, "margin": { "l": 100, "r": 100, "pad": 0 }, "modebar": { "orientation": "h" }, "autosize": true, "template": { "data": { "bar": [ { "type": "bar", "marker": { "colorbar": { "ticks": "", "outlinewidth": 0 } } } ], "table": [ { "type": "table", "cells": { "fill": { "color": "#EBF0F8" }, "line": { "color": "white" } }, "header": { "fill": { "color": "#C8D4E3" }, "line": { "color": "white" } } } ], "carpet": [ { "type": "carpet", "aaxis": { "gridcolor": "#C8D4E3", "linecolor": "#C8D4E3", "endlinecolor": "#2a3f5f", "minorgridcolor": "#C8D4E3", "startlinecolor": "#2a3f5f" }, "baxis": { "gridcolor": "#C8D4E3", "linecolor": "#C8D4E3", "endlinecolor": "#2a3f5f", "minorgridcolor": "#C8D4E3", "startlinecolor": "#2a3f5f" } } ], "mesh3d": [ { "type": "mesh3d", "colorbar": { "ticks": "", "outlinewidth": 0 } } ], "contour": [ { "type": "contour", "colorbar": { "ticks": "", "outlinewidth": 0 }, "autocolorscale": true } ], "heatmap": [ { "type": "heatmap", "colorbar": { "ticks": "", "outlinewidth": 0 }, "autocolorscale": true } ], "scatter": [ { "type": "scatter", "marker": { "colorbar": { "ticks": "", "outlinewidth": 0 } } } ], "surface": [ { "type": "surface", "colorbar": { "ticks": "", "outlinewidth": 0 } } ], "heatmapgl": [ { "type": "heatmapgl", "colorbar": { "ticks": "", "outlinewidth": 0 } } ], "histogram": [ { "type": "histogram", "marker": { "colorbar": { "ticks": "", "outlinewidth": 0 } } } ], "parcoords": [ { "line": { "colorbar": { "ticks": "", "outlinewidth": 0 } }, "type": "parcoords" } ], "scatter3d": [ { "type": "scatter3d", "marker": { "colorbar": { "ticks": "", "outlinewidth": 0 } } } ], "scattergl": [ { "type": "scattergl", "marker": { "colorbar": { "ticks": "", "outlinewidth": 0 } } } ], "choropleth": [ { "type": "choropleth", "colorbar": { "ticks": "", "outlinewidth": 0 } } ], "scattergeo": [ { "type": "scattergeo", "marker": { "colorbar": { "ticks": "", "outlinewidth": 0 } } } ], "histogram2d": [ { "type": "histogram2d", "colorbar": { "ticks": "", "outlinewidth": 0 }, "autocolorscale": true } ], "scatterpolar": [ { "type": "scatterpolar", "marker": { "colorbar": { "ticks": "", "outlinewidth": 0 } } } ], "contourcarpet": [ { "type": "contourcarpet", "colorbar": { "ticks": "", "outlinewidth": 0 } } ], "scattercarpet": [ { "type": "scattercarpet", "marker": { "colorbar": { "ticks": "", "outlinewidth": 0 } } } ], "scattermapbox": [ { "type": "scattermapbox", "marker": { "colorbar": { "ticks": "", "outlinewidth": 0 } } } ], "scatterpolargl": [ { "type": "scatterpolargl", "marker": { "colorbar": { "ticks": "", "outlinewidth": 0 } } } ], "scatterternary": [ { "type": "scatterternary", "marker": { "colorbar": { "ticks": "", "outlinewidth": 0 } } } ], "histogram2dcontour": [ { "type": "histogram2dcontour", "colorbar": { "ticks": "", "outlinewidth": 0 }, "autocolorscale": true } ] }, "layout": { "geo": { "bgcolor": "white", "showland": true, "lakecolor": "white", "landcolor": "white", "showlakes": true, "subunitcolor": "#C8D4E3" }, "font": { "color": "#2a3f5f" }, "polar": { "bgcolor": "white", "radialaxis": { "ticks": "", "gridcolor": "#EBF0F8", "linecolor": "#EBF0F8" }, "angularaxis": { "ticks": "", "gridcolor": "#EBF0F8", "linecolor": "#EBF0F8" } }, "scene": { "xaxis": { "ticks": "", "gridcolor": "#DFE8F3", "gridwidth": 2, "linecolor": "#EBF0F8", "zerolinecolor": "#EBF0F8", "showbackground": true, "backgroundcolor": "white" }, "yaxis": { "ticks": "", "gridcolor": "#DFE8F3", "gridwidth": 2, "linecolor": "#EBF0F8", "zerolinecolor": "#EBF0F8", "showbackground": true, "backgroundcolor": "white" }, "zaxis": { "ticks": "", "gridcolor": "#DFE8F3", "gridwidth": 2, "linecolor": "#EBF0F8", "zerolinecolor": "#EBF0F8", "showbackground": true, "backgroundcolor": "white" } }, "title": { "x": 0.05 }, "xaxis": { "ticks": "", "gridcolor": "#EBF0F8", "linecolor": "#EBF0F8", "automargin": true, "zerolinecolor": "#EBF0F8", "zerolinewidth": 2 }, "yaxis": { "ticks": "", "gridcolor": "#EBF0F8", "linecolor": "#EBF0F8", "automargin": true, "zerolinecolor": "#EBF0F8", "zerolinewidth": 2 }, "ternary": { "aaxis": { "ticks": "", "gridcolor": "#DFE8F3", "linecolor": "#A2B1C6" }, "baxis": { "ticks": "", "gridcolor": "#DFE8F3", "linecolor": "#A2B1C6" }, "caxis": { "ticks": "", "gridcolor": "#DFE8F3", "linecolor": "#A2B1C6" }, "bgcolor": "white" }, "colorway": [ "#636efa", "#EF553B", "#00cc96", "#ab63fa", "#19d3f3", "#e763fa", "#fecb52", "#ffa15a", "#ff6692", "#b6e880" ], "hovermode": "closest", "colorscale": { "diverging": [ [ 0, "#8e0152" ], [ 0.1, "#c51b7d" ], [ 0.2, "#de77ae" ], [ 0.3, "#f1b6da" ], [ 0.4, "#fde0ef" ], [ 0.5, "#f7f7f7" ], [ 0.6, "#e6f5d0" ], [ 0.7, "#b8e186" ], [ 0.8, "#7fbc41" ], [ 0.9, "#4d9221" ], [ 1, "#276419" ] ], "sequential": [ [ 0, "#0508b8" ], [ 0.0893854748603352, "#1910d8" ], [ 0.1787709497206704, "#3c19f0" ], [ 0.2681564245810056, "#6b1cfb" ], [ 0.3575418994413408, "#981cfd" ], [ 0.44692737430167595, "#bf1cfd" ], [ 0.5363128491620112, "#dd2bfd" ], [ 0.6256983240223464, "#f246fe" ], [ 0.7150837988826816, "#fc67fd" ], [ 0.8044692737430168, "#fe88fc" ], [ 0.8938547486033519, "#fea5fd" ], [ 0.9832402234636871, "#febefe" ], [ 1, "#fec3fe" ] ], "sequentialminus": [ [ 0, "#0508b8" ], [ 0.0893854748603352, "#1910d8" ], [ 0.1787709497206704, "#3c19f0" ], [ 0.2681564245810056, "#6b1cfb" ], [ 0.3575418994413408, "#981cfd" ], [ 0.44692737430167595, "#bf1cfd" ], [ 0.5363128491620112, "#dd2bfd" ], [ 0.6256983240223464, "#f246fe" ], [ 0.7150837988826816, "#fc67fd" ], [ 0.8044692737430168, "#fe88fc" ], [ 0.8938547486033519, "#fea5fd" ], [ 0.9832402234636871, "#febefe" ], [ 1, "#fec3fe" ] ] }, "plot_bgcolor": "white", "paper_bgcolor": "white", "shapedefaults": { "line": { "width": 0 }, "opacity": 0.4, "fillcolor": "#506784" }, "annotationdefaults": { "arrowhead": 0, "arrowcolor": "#506784", "arrowwidth": 1 } }, "themeRef": "PLOTLY_WHITE" } } }, "height": null, "width": null, "user": { "profile_url": "https://chart-studio.plotly.com/~StylersAndris", "avatar_url": "https://storage.googleapis.com/plotly-prod-profiles/61.jpg", "background_url": "https://storage.googleapis.com/plotly-prod-profiles/bg-4.jpg", "bio": "", "nickname": "", "website": "", "stream_tokens": null, "feature_set_id": null, "csrf_token": null, "date_joined": "2024-04-18 06:45:24", "mapbox_access_tokens": null, "has_password": null, "username": "StylersAndris", "email": null, "is_active": null, "readonly": null, "is_dash_creator": null, "dash_created_count": null, "is_chart_creator": null, "charts_created_count": null } }, { "creation_time": "2024-04-22T08:11:46.870468Z", "comments": { "results": [], "count": 0 }, "parented": true, "embed_url": "https://chart-studio.plotly.com/~Graphy095/3.embed", "fid": "Graphy095:3", "filename": "Plot 3", "filetype": "plot", "img_url": "https://storage.googleapis.com/plotly-prod-images/Graphy095/3/9_FW9V2NP7RWD15TKTBUPFLB61IO0UTL.png", "image_urls": { "default": "https://storage.googleapis.com/plotly-prod-images/Graphy095/3/2_ACMJPR4OT1H444UWKYDWD8HBOYIEIE.png", "block-thumb": "https://storage.googleapis.com/plotly-prod-images/Graphy095/3/8_1UQ0S1LQDO5U0N7IR182GX781THP8F.png", "list-thumb": "https://storage.googleapis.com/plotly-prod-images/Graphy095/3/9_FW9V2NP7RWD15TKTBUPFLB61IO0UTL.png" }, "api_urls": { "files": "https://api.plotly.com/v2/files/Graphy095:3", "plots": "https://api.plotly.com/v2/plots/Graphy095:3", "parent": "https://api.plotly.com/v2/folders/home?user=Graphy095" }, "owner": "Graphy095", "parent": -1, "preview": "", "referencers": [], "references": [], "title": "", "views": 1, "web_url": "https://chart-studio.plotly.com/~Graphy095/3/", "world_readable": true, "date_modified": "2024-04-22T08:11:46.881Z", "stars": { "results": [], "count": 0 }, "collaborators": { "results": [], "count": 0 }, "subfolder_count": null, "refresh_interval": null, "organize_view_url": "https://chart-studio.plotly.com/~Graphy095/3/", "current_user_permission": "read", "is_theme": null, "is_template": false, "autosize": true, "caption": "", "figure": { "data": [ { "meta": { "columnNames": { "x": "pH Level", "y": "Rate of Reaction" } }, "mode": "lines", "type": "scatter", "xsrc": "Graphy095:2:75fc94", "ysrc": "Graphy095:2:cd133e" } ], "frames": [], "layout": { "title": { "text": "Rate of Reaction vs pH levels" }, "xaxis": { "type": "linear", "range": [ 1, 12 ], "title": { "text": "pH Level" }, "autorange": true }, "yaxis": { "type": "linear", "range": [ 0.8333333333333333, 4.166666666666667 ], "title": { "text": "Rate of Reaction" }, "autorange": true }, "autosize": true, "template": { "data": { "bar": [ { "type": "bar", "marker": { "colorbar": { "ticks": "", "outlinewidth": 0 } } } ], "table": [ { "type": "table", "cells": { "fill": { "color": "#EBF0F8" }, "line": { "color": "white" } }, "header": { "fill": { "color": "#C8D4E3" }, "line": { "color": "white" } } } ], "carpet": [ { "type": "carpet", "aaxis": { "gridcolor": "#C8D4E3", "linecolor": "#C8D4E3", "endlinecolor": "#2a3f5f", "minorgridcolor": "#C8D4E3", "startlinecolor": "#2a3f5f" }, "baxis": { "gridcolor": "#C8D4E3", "linecolor": "#C8D4E3", "endlinecolor": "#2a3f5f", "minorgridcolor": "#C8D4E3", "startlinecolor": "#2a3f5f" } } ], "mesh3d": [ { "type": "mesh3d", "colorbar": { "ticks": "", "outlinewidth": 0 } } ], "contour": [ { "type": "contour", "colorbar": { "ticks": "", "outlinewidth": 0 }, "autocolorscale": true } ], "heatmap": [ { "type": "heatmap", "colorbar": { "ticks": "", "outlinewidth": 0 }, "autocolorscale": true } ], "scatter": [ { "type": "scatter", "marker": { "colorbar": { "ticks": "", "outlinewidth": 0 } } } ], "surface": [ { "type": "surface", "colorbar": { "ticks": "", "outlinewidth": 0 } } ], "heatmapgl": [ { "type": "heatmapgl", "colorbar": { "ticks": "", "outlinewidth": 0 } } ], "histogram": [ { "type": "histogram", "marker": { "colorbar": { "ticks": "", "outlinewidth": 0 } } } ], "parcoords": [ { "line": { "colorbar": { "ticks": "", "outlinewidth": 0 } }, "type": "parcoords" } ], "scatter3d": [ { "type": "scatter3d", "marker": { "colorbar": { "ticks": "", "outlinewidth": 0 } } } ], "scattergl": [ { "type": "scattergl", "marker": { "colorbar": { "ticks": "", "outlinewidth": 0 } } } ], "choropleth": [ { "type": "choropleth", "colorbar": { "ticks": "", "outlinewidth": 0 } } ], "scattergeo": [ { "type": "scattergeo", "marker": { "colorbar": { "ticks": "", "outlinewidth": 0 } } } ], "histogram2d": [ { "type": "histogram2d", "colorbar": { "ticks": "", "outlinewidth": 0 }, "autocolorscale": true } ], "scatterpolar": [ { "type": "scatterpolar", "marker": { "colorbar": { "ticks": "", "outlinewidth": 0 } } } ], "contourcarpet": [ { "type": "contourcarpet", "colorbar": { "ticks": "", "outlinewidth": 0 } } ], "scattercarpet": [ { "type": "scattercarpet", "marker": { "colorbar": { "ticks": "", "outlinewidth": 0 } } } ], "scattermapbox": [ { "type": "scattermapbox", "marker": { "colorbar": { "ticks": "", "outlinewidth": 0 } } } ], "scatterpolargl": [ { "type": "scatterpolargl", "marker": { "colorbar": { "ticks": "", "outlinewidth": 0 } } } ], "scatterternary": [ { "type": "scatterternary", "marker": { "colorbar": { "ticks": "", "outlinewidth": 0 } } } ], "histogram2dcontour": [ { "type": "histogram2dcontour", "colorbar": { "ticks": "", "outlinewidth": 0 }, "autocolorscale": true } ] }, "layout": { "geo": { "bgcolor": "white", "showland": true, "lakecolor": "white", "landcolor": "white", "showlakes": true, "subunitcolor": "#C8D4E3" }, "font": { "color": "#2a3f5f" }, "polar": { "bgcolor": "white", "radialaxis": { "ticks": "", "gridcolor": "#EBF0F8", "linecolor": "#EBF0F8" }, "angularaxis": { "ticks": "", "gridcolor": "#EBF0F8", "linecolor": "#EBF0F8" } }, "scene": { "xaxis": { "ticks": "", "gridcolor": "#DFE8F3", "gridwidth": 2, "linecolor": "#EBF0F8", "zerolinecolor": "#EBF0F8", "showbackground": true, "backgroundcolor": "white" }, "yaxis": { "ticks": "", "gridcolor": "#DFE8F3", "gridwidth": 2, "linecolor": "#EBF0F8", "zerolinecolor": "#EBF0F8", "showbackground": true, "backgroundcolor": "white" }, "zaxis": { "ticks": "", "gridcolor": "#DFE8F3", "gridwidth": 2, "linecolor": "#EBF0F8", "zerolinecolor": "#EBF0F8", "showbackground": true, "backgroundcolor": "white" } }, "title": { "x": 0.05 }, "xaxis": { "ticks": "", "gridcolor": "#EBF0F8", "linecolor": "#EBF0F8", "automargin": true, "zerolinecolor": "#EBF0F8", "zerolinewidth": 2 }, "yaxis": { "ticks": "", "gridcolor": "#EBF0F8", "linecolor": "#EBF0F8", "automargin": true, "zerolinecolor": "#EBF0F8", "zerolinewidth": 2 }, "ternary": { "aaxis": { "ticks": "", "gridcolor": "#DFE8F3", "linecolor": "#A2B1C6" }, "baxis": { "ticks": "", "gridcolor": "#DFE8F3", "linecolor": "#A2B1C6" }, "caxis": { "ticks": "", "gridcolor": "#DFE8F3", "linecolor": "#A2B1C6" }, "bgcolor": "white" }, "colorway": [ "#636efa", "#EF553B", "#00cc96", "#ab63fa", "#19d3f3", "#e763fa", "#fecb52", "#ffa15a", "#ff6692", "#b6e880" ], "hovermode": "closest", "colorscale": { "diverging": [ [ 0, "#8e0152" ], [ 0.1, "#c51b7d" ], [ 0.2, "#de77ae" ], [ 0.3, "#f1b6da" ], [ 0.4, "#fde0ef" ], [ 0.5, "#f7f7f7" ], [ 0.6, "#e6f5d0" ], [ 0.7, "#b8e186" ], [ 0.8, "#7fbc41" ], [ 0.9, "#4d9221" ], [ 1, "#276419" ] ], "sequential": [ [ 0, "#0508b8" ], [ 0.0893854748603352, "#1910d8" ], [ 0.1787709497206704, "#3c19f0" ], [ 0.2681564245810056, "#6b1cfb" ], [ 0.3575418994413408, "#981cfd" ], [ 0.44692737430167595, "#bf1cfd" ], [ 0.5363128491620112, "#dd2bfd" ], [ 0.6256983240223464, "#f246fe" ], [ 0.7150837988826816, "#fc67fd" ], [ 0.8044692737430168, "#fe88fc" ], [ 0.8938547486033519, "#fea5fd" ], [ 0.9832402234636871, "#febefe" ], [ 1, "#fec3fe" ] ], "sequentialminus": [ [ 0, "#0508b8" ], [ 0.0893854748603352, "#1910d8" ], [ 0.1787709497206704, "#3c19f0" ], [ 0.2681564245810056, "#6b1cfb" ], [ 0.3575418994413408, "#981cfd" ], [ 0.44692737430167595, "#bf1cfd" ], [ 0.5363128491620112, "#dd2bfd" ], [ 0.6256983240223464, "#f246fe" ], [ 0.7150837988826816, "#fc67fd" ], [ 0.8044692737430168, "#fe88fc" ], [ 0.8938547486033519, "#fea5fd" ], [ 0.9832402234636871, "#febefe" ], [ 1, "#fec3fe" ] ] }, "plot_bgcolor": "white", "paper_bgcolor": "white", "shapedefaults": { "line": { "width": 0 }, "opacity": 0.4, "fillcolor": "#506784" }, "annotationdefaults": { "arrowhead": 0, "arrowcolor": "#506784", "arrowwidth": 1 } }, "themeRef": "PLOTLY_WHITE" } } }, "height": null, "width": null, "user": { "profile_url": "https://chart-studio.plotly.com/~Graphy095", "avatar_url": "https://storage.googleapis.com/plotly-prod-profiles/99.jpg", "background_url": "https://storage.googleapis.com/plotly-prod-profiles/bg-1.jpg", "bio": "", "nickname": "", "website": "", "stream_tokens": null, "feature_set_id": null, "csrf_token": null, "date_joined": "2024-04-22 07:53:30", "mapbox_access_tokens": null, "has_password": null, "username": "Graphy095", "email": null, "is_active": null, "readonly": null, "is_dash_creator": null, "dash_created_count": null, "is_chart_creator": null, "charts_created_count": null } }, { "creation_time": "2024-04-22T08:04:11.788012Z", "comments": { "results": [], "count": 0 }, "parented": true, "embed_url": "https://chart-studio.plotly.com/~Sam_C./37.embed", "fid": "Sam_C.:37", "filename": "Chronogramme Murder By Numbers - 290324 Verbatims Plot", "filetype": "plot", "img_url": "https://storage.googleapis.com/plotly-prod-images/Sam_C./37/9_D2ONN0VPJ2JW8YUZNV5CGIC5CG7FK4.png", "image_urls": { "default": "https://storage.googleapis.com/plotly-prod-images/Sam_C./37/2_R7LX8N3E58RKCJ8D96V4K71MP5X2QX.png", "block-thumb": "https://storage.googleapis.com/plotly-prod-images/Sam_C./37/8_SQQAOE97VL88ZQV2LWHSZI4JOAFQES.png", "list-thumb": "https://storage.googleapis.com/plotly-prod-images/Sam_C./37/9_D2ONN0VPJ2JW8YUZNV5CGIC5CG7FK4.png" }, "api_urls": { "files": "https://api.plotly.com/v2/files/Sam_C.:37", "plots": "https://api.plotly.com/v2/plots/Sam_C.:37", "parent": "https://api.plotly.com/v2/folders/home?user=Sam_C." }, "owner": "Sam_C.", "parent": -1, "preview": "", "referencers": [], "references": [], "title": "", "views": 2, "web_url": "https://chart-studio.plotly.com/~Sam_C./37/", "world_readable": true, "date_modified": "2024-04-24T13:46:45.707Z", "stars": { "results": [], "count": 0 }, "collaborators": { "results": [], "count": 0 }, "subfolder_count": null, "refresh_interval": null, "organize_view_url": "https://chart-studio.plotly.com/~Sam_C./37/", "current_user_permission": "read", "is_theme": null, "is_template": true, "autosize": true, "caption": "", "figure": { "data": [ { "fill": "none", "line": { "color": "rgb(29, 186, 17)", "shape": "hv", "width": 4 }, "meta": { "columnNames": { "x": "A", "y": "B", "text": "" } }, "mode": "lines", "type": "scatter", "xsrc": "Sam_C.:20:d2ab1d", "ysrc": "Sam_C.:20:49dbc0", "error_x": { "type": "percent", "color": "rgb(229, 50, 6)", "value": 10, "width": 4, "visible": false, "symmetric": true, "thickness": 2 }, "hoverinfo": "x+y+text", "hoverlabel": { "align": "auto" }, "connectgaps": true, "orientation": "v", "hovertemplate": "" } ], "frames": [], "layout": { "font": { "family": "Open Sans" }, "title": { "text": "Chronogramme d'une session de jeu sur Murder By Numbers - 290324" }, "xaxis": { "type": "category", "range": [ -0.36308007730862335, 17 ], "title": { "text": "Temps en heures et minutes (00:00:00)" }, "showgrid": false, "autorange": true }, "yaxis": { "type": "linear", "range": [ 1.2449809468309907, 8.07047607515815 ], "title": { "text": "Échelle de la sensation de présence (de 0 à 8)" }, "showgrid": false, "autorange": true }, "modebar": { "orientation": "h" }, "autosize": true, "dragmode": "zoom", "template": { "data": { "bar": [ { "type": "bar", "marker": { "colorbar": { "ticks": "", "outlinewidth": 0 } } } ], "table": [ { "type": "table", "cells": { "fill": { "color": "#EBF0F8" }, "line": { "color": "white" } }, "header": { "fill": { "color": "#C8D4E3" }, "line": { "color": "white" } } } ], "carpet": [ { "type": "carpet", "aaxis": { "gridcolor": "#C8D4E3", "linecolor": "#C8D4E3", "endlinecolor": "#2a3f5f", "minorgridcolor": "#C8D4E3", "startlinecolor": "#2a3f5f" }, "baxis": { "gridcolor": "#C8D4E3", "linecolor": "#C8D4E3", "endlinecolor": "#2a3f5f", "minorgridcolor": "#C8D4E3", "startlinecolor": "#2a3f5f" } } ], "mesh3d": [ { "type": "mesh3d", "colorbar": { "ticks": "", "outlinewidth": 0 } } ], "contour": [ { "type": "contour", "colorbar": { "ticks": "", "outlinewidth": 0 }, "autocolorscale": true } ], "heatmap": [ { "type": "heatmap", "colorbar": { "ticks": "", "outlinewidth": 0 }, "autocolorscale": true } ], "scatter": [ { "type": "scatter", "marker": { "colorbar": { "ticks": "", "outlinewidth": 0 } } } ], "surface": [ { "type": "surface", "colorbar": { "ticks": "", "outlinewidth": 0 } } ], "heatmapgl": [ { "type": "heatmapgl", "colorbar": { "ticks": "", "outlinewidth": 0 } } ], "histogram": [ { "type": "histogram", "marker": { "colorbar": { "ticks": "", "outlinewidth": 0 } } } ], "parcoords": [ { "line": { "colorbar": { "ticks": "", "outlinewidth": 0 } }, "type": "parcoords" } ], "scatter3d": [ { "type": "scatter3d", "marker": { "colorbar": { "ticks": "", "outlinewidth": 0 } } } ], "scattergl": [ { "type": "scattergl", "marker": { "colorbar": { "ticks": "", "outlinewidth": 0 } } } ], "choropleth": [ { "type": "choropleth", "colorbar": { "ticks": "", "outlinewidth": 0 } } ], "scattergeo": [ { "type": "scattergeo", "marker": { "colorbar": { "ticks": "", "outlinewidth": 0 } } } ], "histogram2d": [ { "type": "histogram2d", "colorbar": { "ticks": "", "outlinewidth": 0 }, "autocolorscale": true } ], "scatterpolar": [ { "type": "scatterpolar", "marker": { "colorbar": { "ticks": "", "outlinewidth": 0 } } } ], "contourcarpet": [ { "type": "contourcarpet", "colorbar": { "ticks": "", "outlinewidth": 0 } } ], "scattercarpet": [ { "type": "scattercarpet", "marker": { "colorbar": { "ticks": "", "outlinewidth": 0 } } } ], "scattermapbox": [ { "type": "scattermapbox", "marker": { "colorbar": { "ticks": "", "outlinewidth": 0 } } } ], "scatterpolargl": [ { "type": "scatterpolargl", "marker": { "colorbar": { "ticks": "", "outlinewidth": 0 } } } ], "scatterternary": [ { "type": "scatterternary", "marker": { "colorbar": { "ticks": "", "outlinewidth": 0 } } } ], "histogram2dcontour": [ { "type": "histogram2dcontour", "colorbar": { "ticks": "", "outlinewidth": 0 }, "autocolorscale": true } ] }, "layout": { "geo": { "bgcolor": "white", "showland": true, "lakecolor": "white", "landcolor": "white", "showlakes": true, "subunitcolor": "#C8D4E3" }, "font": { "color": "#2a3f5f" }, "polar": { "bgcolor": "white", "radialaxis": { "ticks": "", "gridcolor": "#EBF0F8", "linecolor": "#EBF0F8" }, "angularaxis": { "ticks": "", "gridcolor": "#EBF0F8", "linecolor": "#EBF0F8" } }, "scene": { "xaxis": { "ticks": "", "gridcolor": "#DFE8F3", "gridwidth": 2, "linecolor": "#EBF0F8", "zerolinecolor": "#EBF0F8", "showbackground": true, "backgroundcolor": "white" }, "yaxis": { "ticks": "", "gridcolor": "#DFE8F3", "gridwidth": 2, "linecolor": "#EBF0F8", "zerolinecolor": "#EBF0F8", "showbackground": true, "backgroundcolor": "white" }, "zaxis": { "ticks": "", "gridcolor": "#DFE8F3", "gridwidth": 2, "linecolor": "#EBF0F8", "zerolinecolor": "#EBF0F8", "showbackground": true, "backgroundcolor": "white" } }, "title": { "x": 0.05 }, "xaxis": { "ticks": "", "gridcolor": "#EBF0F8", "linecolor": "#EBF0F8", "automargin": true, "zerolinecolor": "#EBF0F8", "zerolinewidth": 2 }, "yaxis": { "ticks": "", "gridcolor": "#EBF0F8", "linecolor": "#EBF0F8", "automargin": true, "zerolinecolor": "#EBF0F8", "zerolinewidth": 2 }, "ternary": { "aaxis": { "ticks": "", "gridcolor": "#DFE8F3", "linecolor": "#A2B1C6" }, "baxis": { "ticks": "", "gridcolor": "#DFE8F3", "linecolor": "#A2B1C6" }, "caxis": { "ticks": "", "gridcolor": "#DFE8F3", "linecolor": "#A2B1C6" }, "bgcolor": "white" }, "colorway": [ "#636efa", "#EF553B", "#00cc96", "#ab63fa", "#19d3f3", "#e763fa", "#fecb52", "#ffa15a", "#ff6692", "#b6e880" ], "hovermode": "closest", "colorscale": { "diverging": [ [ 0, "#8e0152" ], [ 0.1, "#c51b7d" ], [ 0.2, "#de77ae" ], [ 0.3, "#f1b6da" ], [ 0.4, "#fde0ef" ], [ 0.5, "#f7f7f7" ], [ 0.6, "#e6f5d0" ], [ 0.7, "#b8e186" ], [ 0.8, "#7fbc41" ], [ 0.9, "#4d9221" ], [ 1, "#276419" ] ], "sequential": [ [ 0, "#0508b8" ], [ 0.0893854748603352, "#1910d8" ], [ 0.1787709497206704, "#3c19f0" ], [ 0.2681564245810056, "#6b1cfb" ], [ 0.3575418994413408, "#981cfd" ], [ 0.44692737430167595, "#bf1cfd" ], [ 0.5363128491620112, "#dd2bfd" ], [ 0.6256983240223464, "#f246fe" ], [ 0.7150837988826816, "#fc67fd" ], [ 0.8044692737430168, "#fe88fc" ], [ 0.8938547486033519, "#fea5fd" ], [ 0.9832402234636871, "#febefe" ], [ 1, "#fec3fe" ] ], "sequentialminus": [ [ 0, "#0508b8" ], [ 0.0893854748603352, "#1910d8" ], [ 0.1787709497206704, "#3c19f0" ], [ 0.2681564245810056, "#6b1cfb" ], [ 0.3575418994413408, "#981cfd" ], [ 0.44692737430167595, "#bf1cfd" ], [ 0.5363128491620112, "#dd2bfd" ], [ 0.6256983240223464, "#f246fe" ], [ 0.7150837988826816, "#fc67fd" ], [ 0.8044692737430168, "#fe88fc" ], [ 0.8938547486033519, "#fea5fd" ], [ 0.9832402234636871, "#febefe" ], [ 1, "#fec3fe" ] ] }, "plot_bgcolor": "white", "paper_bgcolor": "white", "shapedefaults": { "line": { "width": 0 }, "opacity": 0.4, "fillcolor": "#506784" }, "annotationdefaults": { "arrowhead": 0, "arrowcolor": "#506784", "arrowwidth": 1 } }, "themeRef": "PLOTLY_WHITE" }, "showlegend": false, "annotations": [ { "x": 1.0136691513001435, "y": 4.97454873256219, "ax": -17, "ay": -45, "font": { "size": 12, "family": "Arial" }, "text": "Cette musique en particulier, <br>je l'apprécie bien. Ça m'a <br>\naidé à rentrer dedans.", "arrowhead": 4, "arrowsize": 1.5, "arrowcolor": "rgb(0, 0, 0)", "arrowwidth": 1 }, { "x": 2.0100307929176293, "y": 6.009848699528456, "ax": -33, "ay": -65, "font": { "size": 12, "family": "Arial" }, "text": "Le fait qu'il y est des interventions <br>extérieur fait que j'ai dû me <br>\nconcentrer + pour m'impliquer.<br>", "arrowhead": 4, "arrowsize": 1.5, "arrowcolor": "rgb(0, 0, 0)", "arrowwidth": 1 }, { "x": 3.0175709042585566, "y": 5.010108543755271, "ax": -104, "ay": 152, "font": { "size": 12, "family": "Arial" }, "text": "ça a commencé a y avoir des discussions <br>externes, ça a réduit mon implication dans <br>\nle jeu mais ça a grandement augmenter <br>\nmon appréciation du jeu.", "arrowhead": 4, "arrowsize": 1.5, "arrowcolor": "rgb(0, 0, 0)", "arrowwidth": 1 }, { "x": 4.003606342977327, "y": 7.011656564804092, "ax": -26, "ay": -54, "font": { "size": 12, "family": "Arial" }, "text": "Là j'ai fait une erreur, ça m'a <br>forcé à me concentrer beaucoup +.<br>", "arrowhead": 4, "arrowsize": 1.5, "arrowcolor": "rgb(0, 0, 0)", "arrowwidth": 1 }, { "x": 4.994918852235738, "y": 6.008916816422375, "ax": -40, "ay": 122, "font": { "size": 12, "family": "Arial" }, "text": "J'ai moins besoin de me concentrer <br>mais je suis + impliqué dans le jeu.", "arrowhead": 4, "arrowsize": 1.5, "arrowcolor": "rgb(0, 0, 0)", "arrowwidth": 1 }, { "x": 6.011297501607205, "y": 3.994209119161591, "ax": -228, "ay": 150, "font": { "size": 12, "family": "Arial" }, "text": "Frustration. Parce que le <br>gameplay a repris.", "arrowhead": 4, "arrowsize": 1.5, "arrowcolor": "rgb(0, 0, 0)", "arrowwidth": 1 }, { "x": 7.009809859621494, "y": 6.001778019811217, "ax": 2, "ay": -69, "font": { "size": 12, "family": "Arial" }, "text": "là y a des conversations, et je recommence <br>à compter. Du coup je retourne sur une <br>\nconcentration un peu + haute.<br>", "arrowhead": 4, "arrowsize": 1.5, "arrowcolor": "rgb(0, 0, 0)", "arrowwidth": 1 }, { "x": 7.993522528526477, "y": 5.031623450467326, "ax": 4, "ay": 53, "font": { "size": 12, "family": "Arial" }, "text": "Là, les conversations <br>commencent carrément <br>\nà parler d'autres jeux.", "arrowhead": 4, "arrowsize": 1.5, "arrowcolor": "rgb(0, 0, 0)", "arrowwidth": 1 }, { "x": 9.002701329142068, "y": 3.041223670610473, "ax": -155, "ay": -6, "font": { "size": 12, "family": "Arial" }, "text": "Là avec [redacted], on est en train de <br>parler d'à quelle point le jeu provoque <br>\nde la frustration en interrompant <br>\nl'histoire avec du Picross.", "arrowhead": 4, "arrowsize": 1.5, "arrowcolor": "rgb(0, 0, 0)", "arrowwidth": 1 }, { "x": 10.012680112952756, "y": 2.0356571151619587, "ax": -173, "ay": 25, "font": { "size": 12, "family": "Arial" }, "text": "Tu te rappelle quand je te disais que le <br>jeu il frustre ? Ben là en l'occurrence, <br>\nl'histoire deviens très moralisatrice, <br>\nsexiste, thème années 80.", "arrowhead": 4, "arrowsize": 1.5, "arrowcolor": "rgb(0, 0, 0)", "arrowwidth": 1 }, { "x": 11.009351455059843, "y": 4.984468475048803, "ax": -67, "ay": -58, "font": { "size": 12, "family": "Arial" }, "text": "A partir d'ici, le gameplay reprend. <br>Encore une fois, je suis obligé de <br>\nme concentrer +.", "arrowhead": 4, "arrowsize": 1.5, "arrowcolor": "rgb(0, 0, 0)", "arrowwidth": 1 }, { "x": 12.01797132199734, "y": 6.982451604206989, "ax": -44, "ay": -55, "font": { "size": 12, "family": "Arial" }, "text": "Là, je vois bien que j'avais de + en + de mal <br>à me concentrer. Du coup j'ai été obligé de <br>\nmettre encore + d'effort cognitif.<br>", "arrowhead": 4, "arrowsize": 1.5, "arrowcolor": "rgb(0, 0, 0)", "arrowwidth": 1 }, { "x": 13.004617262617682, "y": 4.024220512551318, "ax": -21, "ay": 59, "font": { "size": 12, "family": "Arial" }, "text": "[redacted] vient à mon secours, ça me <br>permet de moins réfléchir et de <br>\nbeaucoup + profiter du jeu.", "arrowhead": 4, "arrowsize": 1.5, "arrowcolor": "rgb(0, 0, 0)", "arrowwidth": 1 }, { "x": 14.00672954500991, "y": 4.9871594971566084, "ax": 0, "ay": -71, "font": { "family": "Arial" }, "text": "Là, j'avais utilisé un <br>indice parce que <br>\nj'arrive de moins <br>\nen moins à me <br>\nconcentrer.", "arrowhead": 4, "arrowsize": 1.5, "arrowcolor": "rgb(0, 0, 0)", "arrowwidth": 1 }, { "x": 15.006708538881878, "y": 5.994367653431241, "ax": 19, "ay": -104, "font": { "family": "Arial" }, "text": "Là, tu m'a dit qu'après celui-là, <br>on arrêtait. Du coup j'étais content.", "arrowhead": 4, "arrowsize": 1.5, "arrowcolor": "rgb(0, 0, 0)", "arrowwidth": 1 }, { "x": 16.006687532753844, "y": 1.9910339689978918, "ax": -154, "ay": 8, "font": { "family": "Arial" }, "text": "Le fait de juste me dire que j'aurais <br>+ a être confronté au gameplay, <br>\nça m'a permis de + apprécier le jeu <br>\nsans chercher à me concentrer.", "arrowhead": 4, "arrowsize": 1.5, "arrowcolor": "rgb(0, 0, 0)", "arrowwidth": 1 } ] } }, "height": null, "width": null, "user": { "profile_url": "https://chart-studio.plotly.com/~Sam_C.", "avatar_url": "https://storage.googleapis.com/plotly-prod-profiles/4.jpg", "background_url": "https://storage.googleapis.com/plotly-prod-profiles/bg-11.jpg", "bio": "", "nickname": "Axergonomie", "website": "", "stream_tokens": null, "feature_set_id": null, "csrf_token": null, "date_joined": "2024-03-28 09:52:41", "mapbox_access_tokens": null, "has_password": null, "username": "Sam_C.", "email": null, "is_active": null, "readonly": null, "is_dash_creator": null, "dash_created_count": null, "is_chart_creator": null, "charts_created_count": null } }, { "creation_time": "2024-04-22T07:59:16.005797Z", "comments": { "results": [], "count": 0 }, "parented": true, "embed_url": "https://chart-studio.plotly.com/~Sam_C./36.embed", "fid": "Sam_C.:36", "filename": "Chronogramme Inscryption - 020424 Verbatims Plot", "filetype": "plot", "img_url": "https://storage.googleapis.com/plotly-prod-images/Sam_C./36/9_3W7771VUZC143W6GWT0E6VQVLTIO15.png", "image_urls": { "default": "https://storage.googleapis.com/plotly-prod-images/Sam_C./36/2_L2HN33UKIE6A8B1DMCOBPSPFVSTMEG.png", "block-thumb": "https://storage.googleapis.com/plotly-prod-images/Sam_C./36/8_MYHEMKZUISFBSQO32BQ5LT0LL3O4XI.png", "list-thumb": "https://storage.googleapis.com/plotly-prod-images/Sam_C./36/9_3W7771VUZC143W6GWT0E6VQVLTIO15.png" }, "api_urls": { "files": "https://api.plotly.com/v2/files/Sam_C.:36", "plots": "https://api.plotly.com/v2/plots/Sam_C.:36", "parent": "https://api.plotly.com/v2/folders/home?user=Sam_C." }, "owner": "Sam_C.", "parent": -1, "preview": "", "referencers": [], "references": [], "title": "", "views": 2, "web_url": "https://chart-studio.plotly.com/~Sam_C./36/", "world_readable": true, "date_modified": "2024-04-24T13:48:57.450Z", "stars": { "results": [], "count": 0 }, "collaborators": { "results": [], "count": 0 }, "subfolder_count": null, "refresh_interval": null, "organize_view_url": "https://chart-studio.plotly.com/~Sam_C./36/", "current_user_permission": "read", "is_theme": null, "is_template": true, "autosize": true, "caption": "", "figure": { "data": [ { "fill": "none", "line": { "color": "rgb(29, 186, 17)", "shape": "hv", "width": 4 }, "meta": { "columnNames": { "x": "A", "y": "B", "text": "" } }, "mode": "lines", "type": "scatter", "xsrc": "Sam_C.:18:35f9f2", "ysrc": "Sam_C.:18:ff9bd2", "error_x": { "type": "percent", "color": "rgb(229, 50, 6)", "value": 10, "width": 4, "visible": false, "symmetric": true, "thickness": 2 }, "hoverinfo": "x+y+text", "hoverlabel": { "align": "auto" }, "connectgaps": true, "orientation": "v", "hovertemplate": "" } ], "frames": [], "layout": { "font": { "family": "Open Sans" }, "title": { "text": "Chronogramme d'une session de jeu sur Inscryption - 020424" }, "xaxis": { "type": "category", "range": [ -1.25988425909375, 37.34594423896726 ], "title": { "text": "Temps en heures et minutes (00:00:00)" }, "showgrid": false, "autorange": true }, "yaxis": { "type": "linear", "range": [ -0.007672333027496037, 12.234561720334588 ], "title": { "text": "Échelle de la sensation de présence (de 0 à 8)" }, "showgrid": false, "autorange": true }, "modebar": { "orientation": "h" }, "autosize": true, "dragmode": "zoom", "template": { "data": { "bar": [ { "type": "bar", "marker": { "colorbar": { "ticks": "", "outlinewidth": 0 } } } ], "table": [ { "type": "table", "cells": { "fill": { "color": "#EBF0F8" }, "line": { "color": "white" } }, "header": { "fill": { "color": "#C8D4E3" }, "line": { "color": "white" } } } ], "carpet": [ { "type": "carpet", "aaxis": { "gridcolor": "#C8D4E3", "linecolor": "#C8D4E3", "endlinecolor": "#2a3f5f", "minorgridcolor": "#C8D4E3", "startlinecolor": "#2a3f5f" }, "baxis": { "gridcolor": "#C8D4E3", "linecolor": "#C8D4E3", "endlinecolor": "#2a3f5f", "minorgridcolor": "#C8D4E3", "startlinecolor": "#2a3f5f" } } ], "mesh3d": [ { "type": "mesh3d", "colorbar": { "ticks": "", "outlinewidth": 0 } } ], "contour": [ { "type": "contour", "colorbar": { "ticks": "", "outlinewidth": 0 }, "autocolorscale": true } ], "heatmap": [ { "type": "heatmap", "colorbar": { "ticks": "", "outlinewidth": 0 }, "autocolorscale": true } ], "scatter": [ { "type": "scatter", "marker": { "colorbar": { "ticks": "", "outlinewidth": 0 } } } ], "surface": [ { "type": "surface", "colorbar": { "ticks": "", "outlinewidth": 0 } } ], "heatmapgl": [ { "type": "heatmapgl", "colorbar": { "ticks": "", "outlinewidth": 0 } } ], "histogram": [ { "type": "histogram", "marker": { "colorbar": { "ticks": "", "outlinewidth": 0 } } } ], "parcoords": [ { "line": { "colorbar": { "ticks": "", "outlinewidth": 0 } }, "type": "parcoords" } ], "scatter3d": [ { "type": "scatter3d", "marker": { "colorbar": { "ticks": "", "outlinewidth": 0 } } } ], "scattergl": [ { "type": "scattergl", "marker": { "colorbar": { "ticks": "", "outlinewidth": 0 } } } ], "choropleth": [ { "type": "choropleth", "colorbar": { "ticks": "", "outlinewidth": 0 } } ], "scattergeo": [ { "type": "scattergeo", "marker": { "colorbar": { "ticks": "", "outlinewidth": 0 } } } ], "histogram2d": [ { "type": "histogram2d", "colorbar": { "ticks": "", "outlinewidth": 0 }, "autocolorscale": true } ], "scatterpolar": [ { "type": "scatterpolar", "marker": { "colorbar": { "ticks": "", "outlinewidth": 0 } } } ], "contourcarpet": [ { "type": "contourcarpet", "colorbar": { "ticks": "", "outlinewidth": 0 } } ], "scattercarpet": [ { "type": "scattercarpet", "marker": { "colorbar": { "ticks": "", "outlinewidth": 0 } } } ], "scattermapbox": [ { "type": "scattermapbox", "marker": { "colorbar": { "ticks": "", "outlinewidth": 0 } } } ], "scatterpolargl": [ { "type": "scatterpolargl", "marker": { "colorbar": { "ticks": "", "outlinewidth": 0 } } } ], "scatterternary": [ { "type": "scatterternary", "marker": { "colorbar": { "ticks": "", "outlinewidth": 0 } } } ], "histogram2dcontour": [ { "type": "histogram2dcontour", "colorbar": { "ticks": "", "outlinewidth": 0 }, "autocolorscale": true } ] }, "layout": { "geo": { "bgcolor": "white", "showland": true, "lakecolor": "white", "landcolor": "white", "showlakes": true, "subunitcolor": "#C8D4E3" }, "font": { "color": "#2a3f5f" }, "polar": { "bgcolor": "white", "radialaxis": { "ticks": "", "gridcolor": "#EBF0F8", "linecolor": "#EBF0F8" }, "angularaxis": { "ticks": "", "gridcolor": "#EBF0F8", "linecolor": "#EBF0F8" } }, "scene": { "xaxis": { "ticks": "", "gridcolor": "#DFE8F3", "gridwidth": 2, "linecolor": "#EBF0F8", "zerolinecolor": "#EBF0F8", "showbackground": true, "backgroundcolor": "white" }, "yaxis": { "ticks": "", "gridcolor": "#DFE8F3", "gridwidth": 2, "linecolor": "#EBF0F8", "zerolinecolor": "#EBF0F8", "showbackground": true, "backgroundcolor": "white" }, "zaxis": { "ticks": "", "gridcolor": "#DFE8F3", "gridwidth": 2, "linecolor": "#EBF0F8", "zerolinecolor": "#EBF0F8", "showbackground": true, "backgroundcolor": "white" } }, "title": { "x": 0.05 }, "xaxis": { "ticks": "", "gridcolor": "#EBF0F8", "linecolor": "#EBF0F8", "automargin": true, "zerolinecolor": "#EBF0F8", "zerolinewidth": 2 }, "yaxis": { "ticks": "", "gridcolor": "#EBF0F8", "linecolor": "#EBF0F8", "automargin": true, "zerolinecolor": "#EBF0F8", "zerolinewidth": 2 }, "ternary": { "aaxis": { "ticks": "", "gridcolor": "#DFE8F3", "linecolor": "#A2B1C6" }, "baxis": { "ticks": "", "gridcolor": "#DFE8F3", "linecolor": "#A2B1C6" }, "caxis": { "ticks": "", "gridcolor": "#DFE8F3", "linecolor": "#A2B1C6" }, "bgcolor": "white" }, "colorway": [ "#636efa", "#EF553B", "#00cc96", "#ab63fa", "#19d3f3", "#e763fa", "#fecb52", "#ffa15a", "#ff6692", "#b6e880" ], "hovermode": "closest", "colorscale": { "diverging": [ [ 0, "#8e0152" ], [ 0.1, "#c51b7d" ], [ 0.2, "#de77ae" ], [ 0.3, "#f1b6da" ], [ 0.4, "#fde0ef" ], [ 0.5, "#f7f7f7" ], [ 0.6, "#e6f5d0" ], [ 0.7, "#b8e186" ], [ 0.8, "#7fbc41" ], [ 0.9, "#4d9221" ], [ 1, "#276419" ] ], "sequential": [ [ 0, "#0508b8" ], [ 0.0893854748603352, "#1910d8" ], [ 0.1787709497206704, "#3c19f0" ], [ 0.2681564245810056, "#6b1cfb" ], [ 0.3575418994413408, "#981cfd" ], [ 0.44692737430167595, "#bf1cfd" ], [ 0.5363128491620112, "#dd2bfd" ], [ 0.6256983240223464, "#f246fe" ], [ 0.7150837988826816, "#fc67fd" ], [ 0.8044692737430168, "#fe88fc" ], [ 0.8938547486033519, "#fea5fd" ], [ 0.9832402234636871, "#febefe" ], [ 1, "#fec3fe" ] ], "sequentialminus": [ [ 0, "#0508b8" ], [ 0.0893854748603352, "#1910d8" ], [ 0.1787709497206704, "#3c19f0" ], [ 0.2681564245810056, "#6b1cfb" ], [ 0.3575418994413408, "#981cfd" ], [ 0.44692737430167595, "#bf1cfd" ], [ 0.5363128491620112, "#dd2bfd" ], [ 0.6256983240223464, "#f246fe" ], [ 0.7150837988826816, "#fc67fd" ], [ 0.8044692737430168, "#fe88fc" ], [ 0.8938547486033519, "#fea5fd" ], [ 0.9832402234636871, "#febefe" ], [ 1, "#fec3fe" ] ] }, "plot_bgcolor": "white", "paper_bgcolor": "white", "shapedefaults": { "line": { "width": 0 }, "opacity": 0.4, "fillcolor": "#506784" }, "annotationdefaults": { "arrowhead": 0, "arrowcolor": "#506784", "arrowwidth": 1 } }, "themeRef": "PLOTLY_WHITE" }, "showlegend": false, "annotations": [ { "x": 1.0136691513001432, "y": 7.96792807610288, "ax": -10, "ay": -43, "font": { "size": 10, "family": "Arial" }, "text": "Parce que ça c'est + un <br>moment de jeu qu'avant, <br>\nlà y a une musique.<br>", "arrowhead": 4, "arrowsize": 1.5, "arrowcolor": "rgb(0, 0, 0)", "arrowwidth": 1 }, { "x": 2.010013588532821, "y": 5.992239850307681, "ax": -31, "ay": 57, "font": { "size": 10, "family": "Arial" }, "text": "Ok, là j'ai le droit à <br>une deuxième action.<br>\n<br>", "arrowhead": 4, "arrowsize": 1.5, "arrowcolor": "rgb(0, 0, 0)", "arrowwidth": 1 }, { "x": 3.0176308522964166, "y": 6.9593599608368, "ax": -1, "ay": -155, "font": { "size": 10, "family": "Arial" }, "text": "Je suis concentré mais différemment, <br>là c'est pas une question que je parle pas.<br>", "arrowhead": 4, "arrowsize": 1.5, "arrowcolor": "rgb(0, 0, 0)", "arrowwidth": 1 }, { "x": 4.003569603500555, "y": 7.9928321095545485, "ax": 16, "ay": -43, "font": { "size": 10, "family": "Arial" }, "text": "Actuellement, je <br>suis face à un <br>\ncombat de boss.<br>", "arrowhead": 4, "arrowsize": 1.5, "arrowcolor": "rgb(0, 0, 0)", "arrowwidth": 1 }, { "x": 4.99500024455309, "y": 4.990339729330372, "ax": -97, "ay": 57, "font": { "size": 10, "family": "Arial" }, "text": "J'ai atteint un premier objectif d'une <br>certaine manière qui était de battre <br>\nle premier boss.<br>", "arrowhead": 4, "arrowsize": 1.5, "arrowcolor": "rgb(0, 0, 0)", "arrowwidth": 1 }, { "x": 6.011276230790905, "y": 7.008775385724907, "ax": 46, "ay": -79, "font": { "size": 10, "family": "Arial" }, "text": "Parce que du coup, <br>je viens d'avoir <br>\nma récompense.", "arrowhead": 4, "arrowsize": 1.5, "arrowcolor": "rgb(0, 0, 0)", "arrowwidth": 1 }, { "x": 7.009945725246155, "y": 6.015249011296475, "ax": -150, "ay": 205, "font": { "size": 10, "family": "Arial" }, "text": "Parce que je m'attendais <br>pas à réussir le truc, <br>\nsur la dernière carte, <br>\nj'ai choppé la carte qui fallait.<br>", "arrowhead": 4, "arrowsize": 1.5, "arrowcolor": "rgb(0, 0, 0)", "arrowwidth": 1 }, { "x": 7.993572101777286, "y": 5.017698239856047, "ax": -14, "ay": 118, "font": { "size": 10, "family": "Arial" }, "text": "Quand je me suis rendu compte <br>des cartes overpétés qu'on m'a <br>\ndonné, de 1 j'ai eu du bol, <br>\nde 2 on me donne des cartes <br>\nqui me permet de pulvériser le jeu. ", "arrowhead": 4, "arrowsize": 1.5, "arrowcolor": "rgb(0, 0, 0)", "arrowwidth": 1 }, { "x": 9.002634599711511, "y": 6.025299699948143, "ax": -19, "ay": -50, "font": { "size": 10, "family": "Arial" }, "text": "Maintenant y a <br>quand même <br>\ndu challenge <br>\nà affronter. ", "arrowhead": 4, "arrowsize": 1.5, "arrowcolor": "rgb(0, 0, 0)", "arrowwidth": 1 }, { "x": 10.012564238148116, "y": 6.9811177120804215, "ax": -18, "ay": -150, "font": { "size": 10, "family": "Arial" }, "text": "Du coup, je première action <br>ok j'ai eu ma récompense,<br>\nok deuxième truc je dois<br>\nfaire une action dans ce jeu.<br>", "arrowhead": 4, "arrowsize": 1.5, "arrowcolor": "rgb(0, 0, 0)", "arrowwidth": 1 }, { "x": 11.009351455059843, "y": 4.984468475048803, "ax": -40, "ay": 36, "font": { "size": 10, "family": "Arial" }, "text": "Puis là, j'ai <br>détruit le jeu.", "arrowhead": 4, "arrowsize": 1.5, "arrowcolor": "rgb(0, 0, 0)", "arrowwidth": 1 }, { "x": 12.01792521498663, "y": 5.975446089582163, "ax": -3, "ay": -123, "font": { "size": 10, "family": "Arial" }, "text": "Je suis sorti de l'état <br>\"ahah c'était marrant\".<br>", "arrowhead": 4, "arrowsize": 1.5, "arrowcolor": "rgb(0, 0, 0)", "arrowwidth": 1 }, { "x": 13.004488018187411, "y": 5.010395807694502, "ax": -18, "ay": 77, "font": { "size": 10, "family": "Arial" }, "text": "Parce que je me remet <br>à rouler sur le jeu.<br>", "arrowhead": 4, "arrowsize": 1.5, "arrowcolor": "rgb(0, 0, 0)", "arrowwidth": 1 }, { "x": 14.017494681089293, "y": 5.961719048688082, "ax": 9, "ay": -204, "font": { "size": 10, "family": "Arial" }, "text": "Parce que je me reconcentre <br>malgré tout, je dois <br>\ncontinuer de réfléchir,<br>", "arrowhead": 4, "arrowsize": 1.5, "arrowcolor": "rgb(0, 0, 0)", "arrowwidth": 1 }, { "x": 15.02109753344347, "y": 3.010387417388236, "ax": -106, "ay": 88, "font": { "size": 10, "family": "Arial" }, "text": "Parce que quelqu'un <br>est rentré dans la pièce.<br>", "arrowhead": 4, "arrowsize": 1.5, "arrowcolor": "rgb(0, 0, 0)", "arrowwidth": 1 }, { "x": 16.02470038579765, "y": 4.983468676515661, "ax": -8, "ay": -66, "font": { "size": 10, "family": "Arial" }, "text": "Je remet ma <br>pensée dans <br>\nle jeu.<br>", "arrowhead": 4, "arrowsize": 1.5, "arrowcolor": "rgb(0, 0, 0)", "arrowwidth": 1 }, { "x": 17.02830323815183, "y": 4.0052183043432406, "ax": -15, "ay": 67, "font": { "size": 10, "family": "Arial" }, "text": "Quand j'ai bu.", "arrowhead": 4, "arrowsize": 1.5, "arrowcolor": "rgb(0, 0, 0)", "arrowwidth": 1 }, { "x": 18.03190609050601, "y": 5.961719048688082, "ax": -56, "ay": -108, "font": { "size": 10, "family": "Arial" }, "text": "Les feux de camps <br>c'est compliqué, <br>\nc'est de l'aléatoire.<br>", "arrowhead": 4, "arrowsize": 1.5, "arrowcolor": "rgb(0, 0, 0)", "arrowwidth": 1 }, { "x": 19.035508942860186, "y": 6.9731304504256695, "ax": -25, "ay": -146, "font": { "size": 10, "family": "Arial" }, "text": "Parce que je suis dans <br>une situation délicate <br>\ndans ce que je pense.<br>", "arrowhead": 4, "arrowsize": 1.5, "arrowcolor": "rgb(0, 0, 0)", "arrowwidth": 1 }, { "x": 20.039111795214367, "y": 6.044621622600999, "ax": -65, "ay": 216, "font": { "size": 10, "family": "Arial" }, "text": "Je rigole parce que je crois <br>me rendre que non ça va aller.<br>", "arrowhead": 4, "arrowsize": 1.5, "arrowcolor": "rgb(0, 0, 0)", "arrowwidth": 1 }, { "x": 20.985365913148307, "y": 6.9731304504256695, "ax": -1, "ay": -60, "font": { "size": 10, "family": "Arial" }, "text": "Parce que je re-réfléchis, <br>je suis à nouveau dans <br>\nle jeu, davantage <br>\nqu'avant.", "arrowhead": 4, "arrowsize": 1.5, "arrowcolor": "rgb(0, 0, 0)", "arrowwidth": 1 }, { "x": 22.046317499922726, "y": 5.9948800782532485, "ax": -13, "ay": 35, "font": { "size": 10, "family": "Arial" }, "text": "Parce que je suis plus <br>autant concentré.", "arrowhead": 4, "arrowsize": 1.5, "arrowcolor": "rgb(0, 0, 0)", "arrowwidth": 1 }, { "x": 23.021245985066784, "y": 6.9731304504256695, "ax": -2, "ay": -136, "font": { "size": 10, "family": "Arial" }, "text": "Parce que difficulté <br>plus élevé.", "arrowhead": 4, "arrowsize": 1.5, "arrowcolor": "rgb(0, 0, 0)", "arrowwidth": 1 }, { "x": 23.996174470210843, "y": 5.9948800782532485, "ax": -57, "ay": 179, "font": { "size": 10, "family": "Arial" }, "text": "Challenge relevé, <br>respiration, et donc <br>\nmoins de pression", "arrowhead": 4, "arrowsize": 1.5, "arrowcolor": "rgb(0, 0, 0)", "arrowwidth": 1 }, { "x": 25.028451689775142, "y": 5.0000491912982445, "ax": 34, "ay": 55, "font": { "size": 10, "family": "Arial" }, "text": "Je viens de me rendre compte <br>d'une autre combo très forte <br>\nque je peux faire.<br>", "arrowhead": 4, "arrowsize": 1.5, "arrowcolor": "rgb(0, 0, 0)", "arrowwidth": 1 }, { "x": 26.0033801749192, "y": 5.961719048688082, "ax": -18, "ay": -33, "font": { "size": 10, "family": "Arial" }, "text": "Choix à faire.", "arrowhead": 4, "arrowsize": 1.5, "arrowcolor": "rgb(0, 0, 0)", "arrowwidth": 1 }, { "x": 26.978308660063263, "y": 6.9565499356430855, "ax": -54, "ay": -53, "font": { "size": 10, "family": "Arial" }, "text": "Parce qu'une solution simple <br>ne peut pas être trouvé, <br>\nje dois faire une <br>\nconcession simple,", "arrowhead": 4, "arrowsize": 1.5, "arrowcolor": "rgb(0, 0, 0)", "arrowwidth": 1 }, { "x": 27.98191151241744, "y": 8.00112236694584, "ax": -31, "ay": -112, "font": { "size": 10, "family": "Arial" }, "text": "J'ai dû mettre en pause beaucoup <br>de choses, et là je suis complètement <br>\ndans ma prise de décision.", "arrowhead": 4, "arrowsize": 1.5, "arrowcolor": "rgb(0, 0, 0)", "arrowwidth": 1 }, { "x": 29.01418873198174, "y": 3.0269679321708196, "ax": -107, "ay": 25, "font": { "size": 10, "family": "Arial" }, "text": "Quelqu'un est rentré.<br>", "arrowhead": 4, "arrowsize": 1.5, "arrowcolor": "rgb(0, 0, 0)", "arrowwidth": 1 }, { "x": 30.01779158433592, "y": 6.9731304504256695, "ax": -20, "ay": -93, "font": { "size": 10, "family": "Arial" }, "text": "Je suis dans <br>l'attente, je <br>\nsuis pas<br>\ndans l'activité.", "arrowhead": 4, "arrowsize": 1.5, "arrowcolor": "rgb(0, 0, 0)", "arrowwidth": 1 }, { "x": 31.021394436690098, "y": 7.9679613373806735, "ax": -32, "ay": -161, "font": { "size": 10, "family": "Arial" }, "text": "J'ai peur, et je suis pas dans <br>la situation la plus facile du monde.<br>", "arrowhead": 4, "arrowsize": 1.5, "arrowcolor": "rgb(0, 0, 0)", "arrowwidth": 1 }, { "x": 32.053671656254394, "y": 3.0269679321708196, "ax": -185, "ay": 81, "font": { "size": 10, "family": "Arial" }, "text": "Y a eu un mouvement <br>dans la salle.<br>", "arrowhead": 4, "arrowsize": 1.5, "arrowcolor": "rgb(0, 0, 0)", "arrowwidth": 1 }, { "x": 33.02860014139846, "y": 6.9897109652082525, "ax": 3, "ay": -153, "font": { "size": 10, "family": "Arial" }, "text": "Ma pensée direct est revenue <br>dans le jeu, je me suis permis <br>\ncette déconcentration.<br>", "arrowhead": 4, "arrowsize": 1.5, "arrowcolor": "rgb(0, 0, 0)", "arrowwidth": 1 }, { "x": 34.032202993752634, "y": 7.970428751401494, "ax": 44, "ay": -51, "font": { "size": 10, "family": "Arial" }, "text": "ça faisait un moment que <br>j'était à 7 et que j'étais <br>\ndans cette concentration.<br>", "arrowhead": 4, "arrowsize": 1.5, "arrowcolor": "rgb(0, 0, 0)", "arrowwidth": 1 }, { "x": 35.03580584610682, "y": 4.01089525948112, "ax": -42, "ay": 81, "font": { "size": 10, "family": "Arial" }, "text": "Parce que je suis entre, <br>je pense au jeu et le jeu <br>\nm'a trahi et m'a fait du mal.<br>", "arrowhead": 4, "arrowsize": 1.5, "arrowcolor": "rgb(0, 0, 0)", "arrowwidth": 1 }, { "x": 35.98205996404076, "y": 0.9862516198197226, "ax": -112, "ay": 26, "font": { "size": 10, "family": "Arial" }, "text": "J'ai accepté la défaite <br>qui vient de se passer.", "arrowhead": 4, "arrowsize": 1.5, "arrowcolor": "rgb(0, 0, 0)", "arrowwidth": 1 } ] } }, "height": null, "width": null, "user": { "profile_url": "https://chart-studio.plotly.com/~Sam_C.", "avatar_url": "https://storage.googleapis.com/plotly-prod-profiles/4.jpg", "background_url": "https://storage.googleapis.com/plotly-prod-profiles/bg-11.jpg", "bio": "", "nickname": "Axergonomie", "website": "", "stream_tokens": null, "feature_set_id": null, "csrf_token": null, "date_joined": "2024-03-28 09:52:41", "mapbox_access_tokens": null, "has_password": null, "username": "Sam_C.", "email": null, "is_active": null, "readonly": null, "is_dash_creator": null, "dash_created_count": null, "is_chart_creator": null, "charts_created_count": null } } ] }
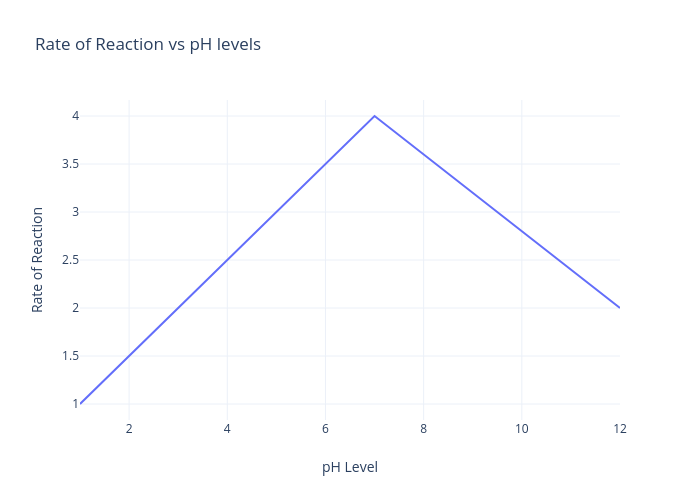