Plots List
Plots
This endpoint handles manipulation of Plotly plot files.
Reference
Authorization
Any user with or without a Plotly account may view public plots. For private plots, see authentication.
Actions
list
Listing all public plots can be done via a GET request to this endpoint.
By default, plots will be listed in order of date created. The order_by
query parameter is accepted at this endpoint. Currently, only ordering by
views is supported. It is possible to filter the plots by quality
with min_quality or max_quality as query parameter.
Example:
// GET https://api.plotly.com/v2/plots/ ---> 200

// GET https://api.plotly.com/v2/plots/?order_by=-views ---> 200

// GET https://api.plotly.com/v2/plots/?min_quality=5 ---> 200

// GET https://api.plotly.com/v2/plots/?max_quality=5 ---> 200
feed
Listing all handpicked feed plots can be done via a GET request to this endpoint. By default, plots will be listed in a random order.
Example:
// GET https://api.plotly.com/v2/plots/feed ---> 200
create
You can create new plot resources here. The only required field is 'figure'. Currently, the figure is restricted to only contain references to grid data. That is, this will fail if raw data arrays are passed in. To create and manipulate underlying grids for plots, see the grids endpoint.
Example:
// This fails because a figure field is required.
// POST https://api.plotly.com/v2/plots ---> 400 Bad Request
{}

// This fails because the figure has raw data
//POST https://api.plotly.com/v2/plots ---> 400 Bad Request
{
    "figure": {"data": [{"y": ['this', 'is', 'raw', 'data']}]}
}

// This succeeds because the figure has src keys, not raw data.
//POST https://api.plotly.com/v2/plots ---> 200 OK
{
    "figure": {"data": [{"ysrc": "sven:88:u8nd62"}]}
}
When creating a grid, you can optionally specify a source_fid to specify where a plot has come from:
- source_fid: the fid of a plot that was copied (and presumably edited) to produce this one
detail
There is a lot of meta information stored about plot files including filename, title, share_url, and content_url to name a few.
This information can only be reached with a GET to this endpoint.
Example:
// GET https://api.plotly.com/v2/plots/iheartgraphs:90
content
The contents of a plot can be downloaded via the content resource. The plot
content contains referenced grid/column data by default. If you wish to
return the raw grid/column data, the inline_data=true query must be included
in the request url. The Content-Type header will be appropriately set for the
response body.
Alternatively, you can set ?map_data=unreadable to append a mapping of
sources to data that belongs to grids which are unreadable for the
requestor. This is useful when you have read access to another users plot,
but that plot contains grid references which you don't have access to.
Examples:
// Returns referenced grid/column data
// GET https://api.plotly.com/v2/plots/iheartgraphs:90/content ---> 200 OK

// Returns full grid/column data
// GET https://api.plotly.com/v2/plots/iheartgraphs:90/content?inline_data=true ---> 200 OK

// Returns full grid/column data when requestor doesn't have permission
// to read the referenced grid.
// GET https://api.plotly.com/v2/plots/iheartgraphs:90/content?map_data=unreadable ---> 200 OK
GET /v2/plots?cursor=cj0xJnA9MjAyNS0wNi0xMCsxMyUzQTE2JTNBNDguNTYyNjMyJTJCMDAlM0EwMA%3D%3D&format=api
{ "next": "https://api.plotly.com/v2/plots?cursor=cD0yMDI1LTA2LTEwKzEzJTNBMjElM0E1My42NDM0OTQlMkIwMCUzQTAw&format=api", "previous": "https://api.plotly.com/v2/plots?cursor=cj0xJnA9MjAyNS0wNi0xMCsxNCUzQTMyJTNBMjYuMTQwMDI0JTJCMDAlM0EwMA%3D%3D&format=api", "results": [ { "creation_time": "2025-06-10T14:32:26.140024Z", "comments": { "results": [], "count": 0 }, "parented": true, "embed_url": "https://chart-studio.plotly.com/~sarahaxe/68.embed", "fid": "sarahaxe:68", "filename": "sample2", "filetype": "plot", "img_url": "https://api.plotly.com/v2/files/sarahaxe:68/image?image_name=list-thumb", "image_urls": { "default": "https://storage.googleapis.com/plotly-prod-images/sarahaxe/68/2_NPNLM754636IIZN7DZ2LKEEGK9WG3F.png", "block-thumb": "https://storage.googleapis.com/plotly-prod-images/sarahaxe/68/8_SFS4MWSMBN5U5XDZDZZ9HQ5YKZD444.png", "list-thumb": "https://api.plotly.com/v2/files/sarahaxe:68/image?image_name=list-thumb" }, "api_urls": { "files": "https://api.plotly.com/v2/files/sarahaxe:68", "plots": "https://api.plotly.com/v2/plots/sarahaxe:68", "parent": "https://api.plotly.com/v2/folders/home?user=sarahaxe" }, "owner": "sarahaxe", "parent": -1, "preview": "", "referencers": [], "references": [], "title": "", "views": 15, "web_url": "https://chart-studio.plotly.com/~sarahaxe/68/", "world_readable": true, "date_modified": "2025-06-10T14:32:26.151Z", "stars": { "results": [], "count": 0 }, "collaborators": { "results": [], "count": 0 }, "subfolder_count": null, "refresh_interval": null, "organize_view_url": "https://chart-studio.plotly.com/~sarahaxe/68/", "current_user_permission": "read", "is_theme": null, "is_template": null, "autosize": true, "caption": "", "figure": { "data": [ { "name": "", "type": "histogram", "xsrc": "sarahaxe:67:442ed2", "xaxis": "x", "yaxis": "y", "marker": { "color": "rgb(51,83,91)", "pattern": { "shape": "" } }, "bingroup": "x", "showlegend": false, "legendgroup": "", "offsetgroup": "", "orientation": "v", "hovertemplate": "<b>Total Number of Awards</b>: %{y:,.0f}<extra></extra>", "alignmentgroup": "True" } ], "layout": { "width": 900, "xaxis": { "title": { "text": "Business Operation Period" }, "anchor": "y", "domain": [ 0.0, 1.0 ], "ticktext": [ "<1 year", "1-2 years", "3-5 years", "6-9 years", ">10 years" ], "tickvals": [ "Less than one year (or not yet in operation)", "Between 1 and 2 years", "Between 3 and 5 years", "Between 6 and 9 years", "10 years or more" ], "categoryarray": [ "Less than one year (or not yet in operation)", "Between 1 and 2 years", "Between 3 and 5 years", "Between 6 and 9 years", "10 years or more" ], "categoryorder": "array" }, "yaxis": { "title": { "text": "Number of Awards" }, "anchor": "x", "domain": [ 0.0, 1.0 ] }, "height": 450, "legend": { "tracegroupgap": 0 }, "margin": { "t": 60 }, "barmode": "relative", "template": { "data": { "bar": [ { "type": "bar", "marker": { "line": { "color": "white", "width": 0.5 }, "pattern": { "size": 10, "fillmode": "overlay", "solidity": 0.2 } }, "error_x": { "color": "rgb(36,36,36)" }, "error_y": { "color": "rgb(36,36,36)" } } ], "pie": [ { "type": "pie", "automargin": true } ], "table": [ { "type": "table", "cells": { "fill": { "color": "rgb(237,237,237)" }, "line": { "color": "white" } }, "header": { "fill": { "color": "rgb(217,217,217)" }, "line": { "color": "white" } } } ], "carpet": [ { "type": "carpet", "aaxis": { "gridcolor": "white", "linecolor": "white", "endlinecolor": "rgb(36,36,36)", "minorgridcolor": "white", "startlinecolor": "rgb(36,36,36)" }, "baxis": { "gridcolor": "white", "linecolor": "white", "endlinecolor": "rgb(36,36,36)", "minorgridcolor": "white", "startlinecolor": "rgb(36,36,36)" } } ], "mesh3d": [ { "type": "mesh3d", "colorbar": { "ticks": "outside", "tickcolor": "rgb(36,36,36)", "outlinewidth": 1 } } ], "contour": [ { "type": "contour", "colorbar": { "ticks": "outside", "tickcolor": "rgb(36,36,36)", "outlinewidth": 1 }, "colorscale": [ [ 0.0, "#440154" ], [ 0.1111111111111111, "#482878" ], [ 0.2222222222222222, "#3e4989" ], [ 0.3333333333333333, "#31688e" ], [ 0.4444444444444444, "#26828e" ], [ 0.5555555555555556, "#1f9e89" ], [ 0.6666666666666666, "#35b779" ], [ 0.7777777777777778, "#6ece58" ], [ 0.8888888888888888, "#b5de2b" ], [ 1.0, "#fde725" ] ] } ], "heatmap": [ { "type": "heatmap", "colorbar": { "ticks": "outside", "tickcolor": "rgb(36,36,36)", "outlinewidth": 1 }, "colorscale": [ [ 0.0, "#440154" ], [ 0.1111111111111111, "#482878" ], [ 0.2222222222222222, "#3e4989" ], [ 0.3333333333333333, "#31688e" ], [ 0.4444444444444444, "#26828e" ], [ 0.5555555555555556, "#1f9e89" ], [ 0.6666666666666666, "#35b779" ], [ 0.7777777777777778, "#6ece58" ], [ 0.8888888888888888, "#b5de2b" ], [ 1.0, "#fde725" ] ] } ], "scatter": [ { "type": "scatter", "fillpattern": { "size": 10, "fillmode": "overlay", "solidity": 0.2 } } ], "surface": [ { "type": "surface", "colorbar": { "ticks": "outside", "tickcolor": "rgb(36,36,36)", "outlinewidth": 1 }, "colorscale": [ [ 0.0, "#440154" ], [ 0.1111111111111111, "#482878" ], [ 0.2222222222222222, "#3e4989" ], [ 0.3333333333333333, "#31688e" ], [ 0.4444444444444444, "#26828e" ], [ 0.5555555555555556, "#1f9e89" ], [ 0.6666666666666666, "#35b779" ], [ 0.7777777777777778, "#6ece58" ], [ 0.8888888888888888, "#b5de2b" ], [ 1.0, "#fde725" ] ] } ], "barpolar": [ { "type": "barpolar", "marker": { "line": { "color": "white", "width": 0.5 }, "pattern": { "size": 10, "fillmode": "overlay", "solidity": 0.2 } } } ], "heatmapgl": [ { "type": "heatmapgl", "colorbar": { "ticks": "outside", "tickcolor": "rgb(36,36,36)", "outlinewidth": 1 }, "colorscale": [ [ 0.0, "#440154" ], [ 0.1111111111111111, "#482878" ], [ 0.2222222222222222, "#3e4989" ], [ 0.3333333333333333, "#31688e" ], [ 0.4444444444444444, "#26828e" ], [ 0.5555555555555556, "#1f9e89" ], [ 0.6666666666666666, "#35b779" ], [ 0.7777777777777778, "#6ece58" ], [ 0.8888888888888888, "#b5de2b" ], [ 1.0, "#fde725" ] ] } ], "histogram": [ { "type": "histogram", "marker": { "line": { "color": "white", "width": 0.6 } } } ], "parcoords": [ { "line": { "colorbar": { "ticks": "outside", "tickcolor": "rgb(36,36,36)", "outlinewidth": 1 } }, "type": "parcoords" } ], "scatter3d": [ { "line": { "colorbar": { "ticks": "outside", "tickcolor": "rgb(36,36,36)", "outlinewidth": 1 } }, "type": "scatter3d", "marker": { "colorbar": { "ticks": "outside", "tickcolor": "rgb(36,36,36)", "outlinewidth": 1 } } } ], "scattergl": [ { "type": "scattergl", "marker": { "colorbar": { "ticks": "outside", "tickcolor": "rgb(36,36,36)", "outlinewidth": 1 } } } ], "choropleth": [ { "type": "choropleth", "colorbar": { "ticks": "outside", "tickcolor": "rgb(36,36,36)", "outlinewidth": 1 } } ], "scattergeo": [ { "type": "scattergeo", "marker": { "colorbar": { "ticks": "outside", "tickcolor": "rgb(36,36,36)", "outlinewidth": 1 } } } ], "histogram2d": [ { "type": "histogram2d", "colorbar": { "ticks": "outside", "tickcolor": "rgb(36,36,36)", "outlinewidth": 1 }, "colorscale": [ [ 0.0, "#440154" ], [ 0.1111111111111111, "#482878" ], [ 0.2222222222222222, "#3e4989" ], [ 0.3333333333333333, "#31688e" ], [ 0.4444444444444444, "#26828e" ], [ 0.5555555555555556, "#1f9e89" ], [ 0.6666666666666666, "#35b779" ], [ 0.7777777777777778, "#6ece58" ], [ 0.8888888888888888, "#b5de2b" ], [ 1.0, "#fde725" ] ] } ], "scatterpolar": [ { "type": "scatterpolar", "marker": { "colorbar": { "ticks": "outside", "tickcolor": "rgb(36,36,36)", "outlinewidth": 1 } } } ], "contourcarpet": [ { "type": "contourcarpet", "colorbar": { "ticks": "outside", "tickcolor": "rgb(36,36,36)", "outlinewidth": 1 } } ], "scattercarpet": [ { "type": "scattercarpet", "marker": { "colorbar": { "ticks": "outside", "tickcolor": "rgb(36,36,36)", "outlinewidth": 1 } } } ], "scattermapbox": [ { "type": "scattermapbox", "marker": { "colorbar": { "ticks": "outside", "tickcolor": "rgb(36,36,36)", "outlinewidth": 1 } } } ], "scatterpolargl": [ { "type": "scatterpolargl", "marker": { "colorbar": { "ticks": "outside", "tickcolor": "rgb(36,36,36)", "outlinewidth": 1 } } } ], "scatterternary": [ { "type": "scatterternary", "marker": { "colorbar": { "ticks": "outside", "tickcolor": "rgb(36,36,36)", "outlinewidth": 1 } } } ], "histogram2dcontour": [ { "type": "histogram2dcontour", "colorbar": { "ticks": "outside", "tickcolor": "rgb(36,36,36)", "outlinewidth": 1 }, "colorscale": [ [ 0.0, "#440154" ], [ 0.1111111111111111, "#482878" ], [ 0.2222222222222222, "#3e4989" ], [ 0.3333333333333333, "#31688e" ], [ 0.4444444444444444, "#26828e" ], [ 0.5555555555555556, "#1f9e89" ], [ 0.6666666666666666, "#35b779" ], [ 0.7777777777777778, "#6ece58" ], [ 0.8888888888888888, "#b5de2b" ], [ 1.0, "#fde725" ] ] } ] }, "layout": { "geo": { "bgcolor": "white", "showland": true, "lakecolor": "white", "landcolor": "white", "showlakes": true, "subunitcolor": "white" }, "font": { "color": "rgb(36,36,36)" }, "polar": { "bgcolor": "white", "radialaxis": { "ticks": "outside", "showgrid": false, "showline": true, "gridcolor": "rgb(232,232,232)", "linecolor": "rgb(36,36,36)" }, "angularaxis": { "ticks": "outside", "showgrid": false, "showline": true, "gridcolor": "rgb(232,232,232)", "linecolor": "rgb(36,36,36)" } }, "scene": { "xaxis": { "ticks": "outside", "showgrid": false, "showline": true, "zeroline": false, "gridcolor": "rgb(232,232,232)", "gridwidth": 2, "linecolor": "rgb(36,36,36)", "zerolinecolor": "rgb(36,36,36)", "showbackground": true, "backgroundcolor": "white" }, "yaxis": { "ticks": "outside", "showgrid": false, "showline": true, "zeroline": false, "gridcolor": "rgb(232,232,232)", "gridwidth": 2, "linecolor": "rgb(36,36,36)", "zerolinecolor": "rgb(36,36,36)", "showbackground": true, "backgroundcolor": "white" }, "zaxis": { "ticks": "outside", "showgrid": false, "showline": true, "zeroline": false, "gridcolor": "rgb(232,232,232)", "gridwidth": 2, "linecolor": "rgb(36,36,36)", "zerolinecolor": "rgb(36,36,36)", "showbackground": true, "backgroundcolor": "white" } }, "title": { "x": 0.05 }, "xaxis": { "ticks": "outside", "title": { "standoff": 15 }, "showgrid": false, "showline": true, "zeroline": false, "gridcolor": "rgb(232,232,232)", "linecolor": "rgb(36,36,36)", "automargin": true, "zerolinecolor": "rgb(36,36,36)" }, "yaxis": { "ticks": "outside", "title": { "standoff": 15 }, "showgrid": false, "showline": true, "zeroline": false, "gridcolor": "rgb(232,232,232)", "linecolor": "rgb(36,36,36)", "automargin": true, "zerolinecolor": "rgb(36,36,36)" }, "mapbox": { "style": "light" }, "ternary": { "aaxis": { "ticks": "outside", "showgrid": false, "showline": true, "gridcolor": "rgb(232,232,232)", "linecolor": "rgb(36,36,36)" }, "baxis": { "ticks": "outside", "showgrid": false, "showline": true, "gridcolor": "rgb(232,232,232)", "linecolor": "rgb(36,36,36)" }, "caxis": { "ticks": "outside", "showgrid": false, "showline": true, "gridcolor": "rgb(232,232,232)", "linecolor": "rgb(36,36,36)" }, "bgcolor": "white" }, "colorway": [ "#1F77B4", "#FF7F0E", "#2CA02C", "#D62728", "#9467BD", "#8C564B", "#E377C2", "#7F7F7F", "#BCBD22", "#17BECF" ], "coloraxis": { "colorbar": { "ticks": "outside", "tickcolor": "rgb(36,36,36)", "outlinewidth": 1 } }, "hovermode": "closest", "colorscale": { "diverging": [ [ 0.0, "rgb(103,0,31)" ], [ 0.1, "rgb(178,24,43)" ], [ 0.2, "rgb(214,96,77)" ], [ 0.3, "rgb(244,165,130)" ], [ 0.4, "rgb(253,219,199)" ], [ 0.5, "rgb(247,247,247)" ], [ 0.6, "rgb(209,229,240)" ], [ 0.7, "rgb(146,197,222)" ], [ 0.8, "rgb(67,147,195)" ], [ 0.9, "rgb(33,102,172)" ], [ 1.0, "rgb(5,48,97)" ] ], "sequential": [ [ 0.0, "#440154" ], [ 0.1111111111111111, "#482878" ], [ 0.2222222222222222, "#3e4989" ], [ 0.3333333333333333, "#31688e" ], [ 0.4444444444444444, "#26828e" ], [ 0.5555555555555556, "#1f9e89" ], [ 0.6666666666666666, "#35b779" ], [ 0.7777777777777778, "#6ece58" ], [ 0.8888888888888888, "#b5de2b" ], [ 1.0, "#fde725" ] ], "sequentialminus": [ [ 0.0, "#440154" ], [ 0.1111111111111111, "#482878" ], [ 0.2222222222222222, "#3e4989" ], [ 0.3333333333333333, "#31688e" ], [ 0.4444444444444444, "#26828e" ], [ 0.5555555555555556, "#1f9e89" ], [ 0.6666666666666666, "#35b779" ], [ 0.7777777777777778, "#6ece58" ], [ 0.8888888888888888, "#b5de2b" ], [ 1.0, "#fde725" ] ] }, "hoverlabel": { "align": "left" }, "plot_bgcolor": "white", "paper_bgcolor": "white", "shapedefaults": { "line": { "width": 0 }, "opacity": 0.3, "fillcolor": "black" }, "autotypenumbers": "strict", "annotationdefaults": { "arrowhead": 0, "arrowwidth": 1 } } } } }, "height": 450, "width": 900, "user": { "profile_url": "https://chart-studio.plotly.com/~sarahaxe", "avatar_url": "https://storage.googleapis.com/plotly-prod-profiles/31.jpg", "background_url": "https://storage.googleapis.com/plotly-prod-profiles/bg-9.jpg", "bio": "", "nickname": "", "website": "", "stream_tokens": null, "feature_set_id": null, "csrf_token": null, "date_joined": "2025-04-10 00:42:15", "mapbox_access_tokens": null, "has_password": null, "username": "sarahaxe", "email": null, "is_active": null, "readonly": null, "is_dash_creator": null, "dash_created_count": null, "is_chart_creator": null, "charts_created_count": null } }, { "creation_time": "2025-06-10T14:32:14.948400Z", "comments": { "results": [], "count": 0 }, "parented": true, "embed_url": "https://chart-studio.plotly.com/~sarahaxe/66.embed", "fid": "sarahaxe:66", "filename": "sample1", "filetype": "plot", "img_url": "https://api.plotly.com/v2/files/sarahaxe:66/image?image_name=list-thumb", "image_urls": { "default": "https://storage.googleapis.com/plotly-prod-images/sarahaxe/66/2_6Y0KMRW9DO9R2WYUIZK7GSANY02YJ6.png", "block-thumb": "https://storage.googleapis.com/plotly-prod-images/sarahaxe/66/8_6EY9YYXRM470XVHCU8YQEOO3HZZKBQ.png", "list-thumb": "https://api.plotly.com/v2/files/sarahaxe:66/image?image_name=list-thumb" }, "api_urls": { "files": "https://api.plotly.com/v2/files/sarahaxe:66", "plots": "https://api.plotly.com/v2/plots/sarahaxe:66", "parent": "https://api.plotly.com/v2/folders/home?user=sarahaxe" }, "owner": "sarahaxe", "parent": -1, "preview": "", "referencers": [], "references": [], "title": "", "views": 16, "web_url": "https://chart-studio.plotly.com/~sarahaxe/66/", "world_readable": true, "date_modified": "2025-06-10T14:32:14.960Z", "stars": { "results": [], "count": 0 }, "collaborators": { "results": [], "count": 0 }, "subfolder_count": null, "refresh_interval": null, "organize_view_url": "https://chart-studio.plotly.com/~sarahaxe/66/", "current_user_permission": "read", "is_theme": null, "is_template": null, "autosize": true, "caption": "", "figure": { "data": [ { "name": "", "type": "histogram", "xsrc": "sarahaxe:65:f9e39d", "ysrc": "sarahaxe:65:204b92", "xaxis": "x", "yaxis": "y", "marker": { "color": "rgb(51,83,91)", "pattern": { "shape": "" } }, "bingroup": "x", "histfunc": "sum", "showlegend": false, "legendgroup": "", "offsetgroup": "", "orientation": "v", "hovertemplate": "<b>Total Award Amount</b>: $%{y:,.0f}<extra></extra>", "alignmentgroup": "True" } ], "layout": { "width": 900, "xaxis": { "title": { "text": "Business Operation Period" }, "anchor": "y", "domain": [ 0.0, 1.0 ], "ticktext": [ "<1 year", "1-2 years", "3-5 years", "6-9 years", ">10 years" ], "tickvals": [ "Less than one year (or not yet in operation)", "Between 1 and 2 years", "Between 3 and 5 years", "Between 6 and 9 years", "10 years or more" ], "categoryarray": [ "Less than one year (or not yet in operation)", "Between 1 and 2 years", "Between 3 and 5 years", "Between 6 and 9 years", "10 years or more" ], "categoryorder": "array" }, "yaxis": { "title": { "text": "Award Amount" }, "anchor": "x", "domain": [ 0.0, 1.0 ], "showgrid": true, "tickprefix": "$" }, "height": 450, "legend": { "tracegroupgap": 0 }, "margin": { "t": 60 }, "barmode": "relative", "template": { "data": { "bar": [ { "type": "bar", "marker": { "line": { "color": "white", "width": 0.5 }, "pattern": { "size": 10, "fillmode": "overlay", "solidity": 0.2 } }, "error_x": { "color": "rgb(36,36,36)" }, "error_y": { "color": "rgb(36,36,36)" } } ], "pie": [ { "type": "pie", "automargin": true } ], "table": [ { "type": "table", "cells": { "fill": { "color": "rgb(237,237,237)" }, "line": { "color": "white" } }, "header": { "fill": { "color": "rgb(217,217,217)" }, "line": { "color": "white" } } } ], "carpet": [ { "type": "carpet", "aaxis": { "gridcolor": "white", "linecolor": "white", "endlinecolor": "rgb(36,36,36)", "minorgridcolor": "white", "startlinecolor": "rgb(36,36,36)" }, "baxis": { "gridcolor": "white", "linecolor": "white", "endlinecolor": "rgb(36,36,36)", "minorgridcolor": "white", "startlinecolor": "rgb(36,36,36)" } } ], "mesh3d": [ { "type": "mesh3d", "colorbar": { "ticks": "outside", "tickcolor": "rgb(36,36,36)", "outlinewidth": 1 } } ], "contour": [ { "type": "contour", "colorbar": { "ticks": "outside", "tickcolor": "rgb(36,36,36)", "outlinewidth": 1 }, "colorscale": [ [ 0.0, "#440154" ], [ 0.1111111111111111, "#482878" ], [ 0.2222222222222222, "#3e4989" ], [ 0.3333333333333333, "#31688e" ], [ 0.4444444444444444, "#26828e" ], [ 0.5555555555555556, "#1f9e89" ], [ 0.6666666666666666, "#35b779" ], [ 0.7777777777777778, "#6ece58" ], [ 0.8888888888888888, "#b5de2b" ], [ 1.0, "#fde725" ] ] } ], "heatmap": [ { "type": "heatmap", "colorbar": { "ticks": "outside", "tickcolor": "rgb(36,36,36)", "outlinewidth": 1 }, "colorscale": [ [ 0.0, "#440154" ], [ 0.1111111111111111, "#482878" ], [ 0.2222222222222222, "#3e4989" ], [ 0.3333333333333333, "#31688e" ], [ 0.4444444444444444, "#26828e" ], [ 0.5555555555555556, "#1f9e89" ], [ 0.6666666666666666, "#35b779" ], [ 0.7777777777777778, "#6ece58" ], [ 0.8888888888888888, "#b5de2b" ], [ 1.0, "#fde725" ] ] } ], "scatter": [ { "type": "scatter", "fillpattern": { "size": 10, "fillmode": "overlay", "solidity": 0.2 } } ], "surface": [ { "type": "surface", "colorbar": { "ticks": "outside", "tickcolor": "rgb(36,36,36)", "outlinewidth": 1 }, "colorscale": [ [ 0.0, "#440154" ], [ 0.1111111111111111, "#482878" ], [ 0.2222222222222222, "#3e4989" ], [ 0.3333333333333333, "#31688e" ], [ 0.4444444444444444, "#26828e" ], [ 0.5555555555555556, "#1f9e89" ], [ 0.6666666666666666, "#35b779" ], [ 0.7777777777777778, "#6ece58" ], [ 0.8888888888888888, "#b5de2b" ], [ 1.0, "#fde725" ] ] } ], "barpolar": [ { "type": "barpolar", "marker": { "line": { "color": "white", "width": 0.5 }, "pattern": { "size": 10, "fillmode": "overlay", "solidity": 0.2 } } } ], "heatmapgl": [ { "type": "heatmapgl", "colorbar": { "ticks": "outside", "tickcolor": "rgb(36,36,36)", "outlinewidth": 1 }, "colorscale": [ [ 0.0, "#440154" ], [ 0.1111111111111111, "#482878" ], [ 0.2222222222222222, "#3e4989" ], [ 0.3333333333333333, "#31688e" ], [ 0.4444444444444444, "#26828e" ], [ 0.5555555555555556, "#1f9e89" ], [ 0.6666666666666666, "#35b779" ], [ 0.7777777777777778, "#6ece58" ], [ 0.8888888888888888, "#b5de2b" ], [ 1.0, "#fde725" ] ] } ], "histogram": [ { "type": "histogram", "marker": { "line": { "color": "white", "width": 0.6 } } } ], "parcoords": [ { "line": { "colorbar": { "ticks": "outside", "tickcolor": "rgb(36,36,36)", "outlinewidth": 1 } }, "type": "parcoords" } ], "scatter3d": [ { "line": { "colorbar": { "ticks": "outside", "tickcolor": "rgb(36,36,36)", "outlinewidth": 1 } }, "type": "scatter3d", "marker": { "colorbar": { "ticks": "outside", "tickcolor": "rgb(36,36,36)", "outlinewidth": 1 } } } ], "scattergl": [ { "type": "scattergl", "marker": { "colorbar": { "ticks": "outside", "tickcolor": "rgb(36,36,36)", "outlinewidth": 1 } } } ], "choropleth": [ { "type": "choropleth", "colorbar": { "ticks": "outside", "tickcolor": "rgb(36,36,36)", "outlinewidth": 1 } } ], "scattergeo": [ { "type": "scattergeo", "marker": { "colorbar": { "ticks": "outside", "tickcolor": "rgb(36,36,36)", "outlinewidth": 1 } } } ], "histogram2d": [ { "type": "histogram2d", "colorbar": { "ticks": "outside", "tickcolor": "rgb(36,36,36)", "outlinewidth": 1 }, "colorscale": [ [ 0.0, "#440154" ], [ 0.1111111111111111, "#482878" ], [ 0.2222222222222222, "#3e4989" ], [ 0.3333333333333333, "#31688e" ], [ 0.4444444444444444, "#26828e" ], [ 0.5555555555555556, "#1f9e89" ], [ 0.6666666666666666, "#35b779" ], [ 0.7777777777777778, "#6ece58" ], [ 0.8888888888888888, "#b5de2b" ], [ 1.0, "#fde725" ] ] } ], "scatterpolar": [ { "type": "scatterpolar", "marker": { "colorbar": { "ticks": "outside", "tickcolor": "rgb(36,36,36)", "outlinewidth": 1 } } } ], "contourcarpet": [ { "type": "contourcarpet", "colorbar": { "ticks": "outside", "tickcolor": "rgb(36,36,36)", "outlinewidth": 1 } } ], "scattercarpet": [ { "type": "scattercarpet", "marker": { "colorbar": { "ticks": "outside", "tickcolor": "rgb(36,36,36)", "outlinewidth": 1 } } } ], "scattermapbox": [ { "type": "scattermapbox", "marker": { "colorbar": { "ticks": "outside", "tickcolor": "rgb(36,36,36)", "outlinewidth": 1 } } } ], "scatterpolargl": [ { "type": "scatterpolargl", "marker": { "colorbar": { "ticks": "outside", "tickcolor": "rgb(36,36,36)", "outlinewidth": 1 } } } ], "scatterternary": [ { "type": "scatterternary", "marker": { "colorbar": { "ticks": "outside", "tickcolor": "rgb(36,36,36)", "outlinewidth": 1 } } } ], "histogram2dcontour": [ { "type": "histogram2dcontour", "colorbar": { "ticks": "outside", "tickcolor": "rgb(36,36,36)", "outlinewidth": 1 }, "colorscale": [ [ 0.0, "#440154" ], [ 0.1111111111111111, "#482878" ], [ 0.2222222222222222, "#3e4989" ], [ 0.3333333333333333, "#31688e" ], [ 0.4444444444444444, "#26828e" ], [ 0.5555555555555556, "#1f9e89" ], [ 0.6666666666666666, "#35b779" ], [ 0.7777777777777778, "#6ece58" ], [ 0.8888888888888888, "#b5de2b" ], [ 1.0, "#fde725" ] ] } ] }, "layout": { "geo": { "bgcolor": "white", "showland": true, "lakecolor": "white", "landcolor": "white", "showlakes": true, "subunitcolor": "white" }, "font": { "color": "rgb(36,36,36)" }, "polar": { "bgcolor": "white", "radialaxis": { "ticks": "outside", "showgrid": false, "showline": true, "gridcolor": "rgb(232,232,232)", "linecolor": "rgb(36,36,36)" }, "angularaxis": { "ticks": "outside", "showgrid": false, "showline": true, "gridcolor": "rgb(232,232,232)", "linecolor": "rgb(36,36,36)" } }, "scene": { "xaxis": { "ticks": "outside", "showgrid": false, "showline": true, "zeroline": false, "gridcolor": "rgb(232,232,232)", "gridwidth": 2, "linecolor": "rgb(36,36,36)", "zerolinecolor": "rgb(36,36,36)", "showbackground": true, "backgroundcolor": "white" }, "yaxis": { "ticks": "outside", "showgrid": false, "showline": true, "zeroline": false, "gridcolor": "rgb(232,232,232)", "gridwidth": 2, "linecolor": "rgb(36,36,36)", "zerolinecolor": "rgb(36,36,36)", "showbackground": true, "backgroundcolor": "white" }, "zaxis": { "ticks": "outside", "showgrid": false, "showline": true, "zeroline": false, "gridcolor": "rgb(232,232,232)", "gridwidth": 2, "linecolor": "rgb(36,36,36)", "zerolinecolor": "rgb(36,36,36)", "showbackground": true, "backgroundcolor": "white" } }, "title": { "x": 0.05 }, "xaxis": { "ticks": "outside", "title": { "standoff": 15 }, "showgrid": false, "showline": true, "zeroline": false, "gridcolor": "rgb(232,232,232)", "linecolor": "rgb(36,36,36)", "automargin": true, "zerolinecolor": "rgb(36,36,36)" }, "yaxis": { "ticks": "outside", "title": { "standoff": 15 }, "showgrid": false, "showline": true, "zeroline": false, "gridcolor": "rgb(232,232,232)", "linecolor": "rgb(36,36,36)", "automargin": true, "zerolinecolor": "rgb(36,36,36)" }, "mapbox": { "style": "light" }, "ternary": { "aaxis": { "ticks": "outside", "showgrid": false, "showline": true, "gridcolor": "rgb(232,232,232)", "linecolor": "rgb(36,36,36)" }, "baxis": { "ticks": "outside", "showgrid": false, "showline": true, "gridcolor": "rgb(232,232,232)", "linecolor": "rgb(36,36,36)" }, "caxis": { "ticks": "outside", "showgrid": false, "showline": true, "gridcolor": "rgb(232,232,232)", "linecolor": "rgb(36,36,36)" }, "bgcolor": "white" }, "colorway": [ "#1F77B4", "#FF7F0E", "#2CA02C", "#D62728", "#9467BD", "#8C564B", "#E377C2", "#7F7F7F", "#BCBD22", "#17BECF" ], "coloraxis": { "colorbar": { "ticks": "outside", "tickcolor": "rgb(36,36,36)", "outlinewidth": 1 } }, "hovermode": "closest", "colorscale": { "diverging": [ [ 0.0, "rgb(103,0,31)" ], [ 0.1, "rgb(178,24,43)" ], [ 0.2, "rgb(214,96,77)" ], [ 0.3, "rgb(244,165,130)" ], [ 0.4, "rgb(253,219,199)" ], [ 0.5, "rgb(247,247,247)" ], [ 0.6, "rgb(209,229,240)" ], [ 0.7, "rgb(146,197,222)" ], [ 0.8, "rgb(67,147,195)" ], [ 0.9, "rgb(33,102,172)" ], [ 1.0, "rgb(5,48,97)" ] ], "sequential": [ [ 0.0, "#440154" ], [ 0.1111111111111111, "#482878" ], [ 0.2222222222222222, "#3e4989" ], [ 0.3333333333333333, "#31688e" ], [ 0.4444444444444444, "#26828e" ], [ 0.5555555555555556, "#1f9e89" ], [ 0.6666666666666666, "#35b779" ], [ 0.7777777777777778, "#6ece58" ], [ 0.8888888888888888, "#b5de2b" ], [ 1.0, "#fde725" ] ], "sequentialminus": [ [ 0.0, "#440154" ], [ 0.1111111111111111, "#482878" ], [ 0.2222222222222222, "#3e4989" ], [ 0.3333333333333333, "#31688e" ], [ 0.4444444444444444, "#26828e" ], [ 0.5555555555555556, "#1f9e89" ], [ 0.6666666666666666, "#35b779" ], [ 0.7777777777777778, "#6ece58" ], [ 0.8888888888888888, "#b5de2b" ], [ 1.0, "#fde725" ] ] }, "hoverlabel": { "align": "left" }, "plot_bgcolor": "white", "paper_bgcolor": "white", "shapedefaults": { "line": { "width": 0 }, "opacity": 0.3, "fillcolor": "black" }, "autotypenumbers": "strict", "annotationdefaults": { "arrowhead": 0, "arrowwidth": 1 } } } } }, "height": 450, "width": 900, "user": { "profile_url": "https://chart-studio.plotly.com/~sarahaxe", "avatar_url": "https://storage.googleapis.com/plotly-prod-profiles/31.jpg", "background_url": "https://storage.googleapis.com/plotly-prod-profiles/bg-9.jpg", "bio": "", "nickname": "", "website": "", "stream_tokens": null, "feature_set_id": null, "csrf_token": null, "date_joined": "2025-04-10 00:42:15", "mapbox_access_tokens": null, "has_password": null, "username": "sarahaxe", "email": null, "is_active": null, "readonly": null, "is_dash_creator": null, "dash_created_count": null, "is_chart_creator": null, "charts_created_count": null } }, { "creation_time": "2025-06-10T14:21:24.567512Z", "comments": { "results": [], "count": 0 }, "parented": true, "embed_url": "https://chart-studio.plotly.com/~noah.irwin/13.embed", "fid": "noah.irwin:13", "filename": "Plot 13", "filetype": "plot", "img_url": "https://api.plotly.com/v2/files/noah.irwin:13/image?image_name=list-thumb", "image_urls": { "default": "https://api.plotly.com/v2/files/noah.irwin:13/image?image_name=default", "block-thumb": "https://storage.googleapis.com/plotly-prod-images/noah.irwin/13/8_SH2WHGXLALEFERVA4ZIX3NMHGZBO8G.png", "list-thumb": "https://api.plotly.com/v2/files/noah.irwin:13/image?image_name=list-thumb" }, "api_urls": { "files": "https://api.plotly.com/v2/files/noah.irwin:13", "plots": "https://api.plotly.com/v2/plots/noah.irwin:13", "parent": "https://api.plotly.com/v2/folders/home?user=noah.irwin" }, "owner": "noah.irwin", "parent": -1, "preview": "", "referencers": [], "references": [], "title": "", "views": 0, "web_url": "https://chart-studio.plotly.com/~noah.irwin/13/", "world_readable": true, "date_modified": "2025-06-10T21:57:04.067Z", "stars": { "results": [], "count": 0 }, "collaborators": { "results": [], "count": 0 }, "subfolder_count": null, "refresh_interval": null, "organize_view_url": "https://chart-studio.plotly.com/~noah.irwin/13/", "current_user_permission": "read", "is_theme": null, "is_template": false, "autosize": true, "caption": "", "figure": { "data": [ { "uid": "d70feb", "meta": { "columnNames": { "x": "B", "y": "A", "text": "" } }, "mode": "markers", "name": "Average Highest Ethanol Produced (%)", "type": "scatter", "xsrc": "noah.irwin:12:5714ab", "ysrc": "noah.irwin:12:525ade", "marker": { "size": 6, "color": "rgb(0, 88, 224)" }, "error_x": { "type": "percent", "color": "#636efa", "value": 10, "width": 4, "visible": false, "symmetric": true, "thickness": 2 }, "cliponaxis": true }, { "uid": "012e0a", "line": { "color": "rgb(0, 88, 224)", "width": 3 }, "name": "Line of best fit: Average Highest Ethanol Produced (%)", "transforms": [ { "rms": 0.03077893528280108, "type": "fit", "xmid": "1.000mL", "ymid": 0.4786285714285712, "inputUid": "d70feb", "regressor": "x", "parameters": [ { "hold": false, "name": "m", "error": 0.010405179244110985, "value": 0.17451428571428623 }, { "hold": false, "name": "b", "error": 0.023841260752858338, "value": 0.12959999999999863 } ], "regressand": "y", "correlation": 0.9964638651831697, "fitfunction": "m*x + b", "inputxrange": [], "outputxrange": [], "interpolation": 0 } ] } ], "frames": [], "layout": { "font": { "size": 13 }, "title": { "text": "100% Cellulase amount (mL) on average ethanol produced via anaerobic fermentation of glucose by S. Cerevisiae" }, "xaxis": { "type": "category", "range": [ -0.49190938511326854, 4.491909385113269 ], "title": { "font": { "size": 16 }, "text": "100% Cellulase Amount (mL)" }, "autorange": true, "gridwidth": 2, "showspikes": false }, "yaxis": { "type": "linear", "range": [ -0.05594633273703041, 0.8789463327370304 ], "title": { "font": { "size": 16 }, "text": "Average Highest Ethanol Produced (%)" }, "autorange": true, "showspikes": false }, "autosize": true, "dragmode": "zoom", "template": { "data": { "bar": [ { "type": "bar", "marker": { "colorbar": { "ticks": "", "outlinewidth": 0 } } } ], "table": [ { "type": "table", "cells": { "fill": { "color": "#EBF0F8" }, "line": { "color": "white" } }, "header": { "fill": { "color": "#C8D4E3" }, "line": { "color": "white" } } } ], "carpet": [ { "type": "carpet", "aaxis": { "gridcolor": "#C8D4E3", "linecolor": "#C8D4E3", "endlinecolor": "#2a3f5f", "minorgridcolor": "#C8D4E3", "startlinecolor": "#2a3f5f" }, "baxis": { "gridcolor": "#C8D4E3", "linecolor": "#C8D4E3", "endlinecolor": "#2a3f5f", "minorgridcolor": "#C8D4E3", "startlinecolor": "#2a3f5f" } } ], "mesh3d": [ { "type": "mesh3d", "colorbar": { "ticks": "", "outlinewidth": 0 } } ], "contour": [ { "type": "contour", "colorbar": { "ticks": "", "outlinewidth": 0 }, "autocolorscale": true } ], "heatmap": [ { "type": "heatmap", "colorbar": { "ticks": "", "outlinewidth": 0 }, "autocolorscale": true } ], "scatter": [ { "type": "scatter", "marker": { "colorbar": { "ticks": "", "outlinewidth": 0 } } } ], "surface": [ { "type": "surface", "colorbar": { "ticks": "", "outlinewidth": 0 } } ], "heatmapgl": [ { "type": "heatmapgl", "colorbar": { "ticks": "", "outlinewidth": 0 } } ], "histogram": [ { "type": "histogram", "marker": { "colorbar": { "ticks": "", "outlinewidth": 0 } } } ], "parcoords": [ { "line": { "colorbar": { "ticks": "", "outlinewidth": 0 } }, "type": "parcoords" } ], "scatter3d": [ { "type": "scatter3d", "marker": { "colorbar": { "ticks": "", "outlinewidth": 0 } } } ], "scattergl": [ { "type": "scattergl", "marker": { "colorbar": { "ticks": "", "outlinewidth": 0 } } } ], "choropleth": [ { "type": "choropleth", "colorbar": { "ticks": "", "outlinewidth": 0 } } ], "scattergeo": [ { "type": "scattergeo", "marker": { "colorbar": { "ticks": "", "outlinewidth": 0 } } } ], "histogram2d": [ { "type": "histogram2d", "colorbar": { "ticks": "", "outlinewidth": 0 }, "autocolorscale": true } ], "scatterpolar": [ { "type": "scatterpolar", "marker": { "colorbar": { "ticks": "", "outlinewidth": 0 } } } ], "contourcarpet": [ { "type": "contourcarpet", "colorbar": { "ticks": "", "outlinewidth": 0 } } ], "scattercarpet": [ { "type": "scattercarpet", "marker": { "colorbar": { "ticks": "", "outlinewidth": 0 } } } ], "scattermapbox": [ { "type": "scattermapbox", "marker": { "colorbar": { "ticks": "", "outlinewidth": 0 } } } ], "scatterpolargl": [ { "type": "scatterpolargl", "marker": { "colorbar": { "ticks": "", "outlinewidth": 0 } } } ], "scatterternary": [ { "type": "scatterternary", "marker": { "colorbar": { "ticks": "", "outlinewidth": 0 } } } ], "histogram2dcontour": [ { "type": "histogram2dcontour", "colorbar": { "ticks": "", "outlinewidth": 0 }, "autocolorscale": true } ] }, "layout": { "geo": { "bgcolor": "white", "showland": true, "lakecolor": "white", "landcolor": "white", "showlakes": true, "subunitcolor": "#C8D4E3" }, "font": { "color": "#2a3f5f" }, "polar": { "bgcolor": "white", "radialaxis": { "ticks": "", "gridcolor": "#EBF0F8", "linecolor": "#EBF0F8" }, "angularaxis": { "ticks": "", "gridcolor": "#EBF0F8", "linecolor": "#EBF0F8" } }, "scene": { "xaxis": { "ticks": "", "gridcolor": "#DFE8F3", "gridwidth": 2, "linecolor": "#EBF0F8", "zerolinecolor": "#EBF0F8", "showbackground": true, "backgroundcolor": "white" }, "yaxis": { "ticks": "", "gridcolor": "#DFE8F3", "gridwidth": 2, "linecolor": "#EBF0F8", "zerolinecolor": "#EBF0F8", "showbackground": true, "backgroundcolor": "white" }, "zaxis": { "ticks": "", "gridcolor": "#DFE8F3", "gridwidth": 2, "linecolor": "#EBF0F8", "zerolinecolor": "#EBF0F8", "showbackground": true, "backgroundcolor": "white" } }, "title": { "x": 0.05 }, "xaxis": { "ticks": "", "gridcolor": "#EBF0F8", "linecolor": "#EBF0F8", "automargin": true, "zerolinecolor": "#EBF0F8", "zerolinewidth": 2 }, "yaxis": { "ticks": "", "gridcolor": "#EBF0F8", "linecolor": "#EBF0F8", "automargin": true, "zerolinecolor": "#EBF0F8", "zerolinewidth": 2 }, "ternary": { "aaxis": { "ticks": "", "gridcolor": "#DFE8F3", "linecolor": "#A2B1C6" }, "baxis": { "ticks": "", "gridcolor": "#DFE8F3", "linecolor": "#A2B1C6" }, "caxis": { "ticks": "", "gridcolor": "#DFE8F3", "linecolor": "#A2B1C6" }, "bgcolor": "white" }, "colorway": [ "#636efa", "#EF553B", "#00cc96", "#ab63fa", "#19d3f3", "#e763fa", "#fecb52", "#ffa15a", "#ff6692", "#b6e880" ], "hovermode": "closest", "colorscale": { "diverging": [ [ 0, "#8e0152" ], [ 0.1, "#c51b7d" ], [ 0.2, "#de77ae" ], [ 0.3, "#f1b6da" ], [ 0.4, "#fde0ef" ], [ 0.5, "#f7f7f7" ], [ 0.6, "#e6f5d0" ], [ 0.7, "#b8e186" ], [ 0.8, "#7fbc41" ], [ 0.9, "#4d9221" ], [ 1, "#276419" ] ], "sequential": [ [ 0, "#0508b8" ], [ 0.0893854748603352, "#1910d8" ], [ 0.1787709497206704, "#3c19f0" ], [ 0.2681564245810056, "#6b1cfb" ], [ 0.3575418994413408, "#981cfd" ], [ 0.44692737430167595, "#bf1cfd" ], [ 0.5363128491620112, "#dd2bfd" ], [ 0.6256983240223464, "#f246fe" ], [ 0.7150837988826816, "#fc67fd" ], [ 0.8044692737430168, "#fe88fc" ], [ 0.8938547486033519, "#fea5fd" ], [ 0.9832402234636871, "#febefe" ], [ 1, "#fec3fe" ] ], "sequentialminus": [ [ 0, "#0508b8" ], [ 0.0893854748603352, "#1910d8" ], [ 0.1787709497206704, "#3c19f0" ], [ 0.2681564245810056, "#6b1cfb" ], [ 0.3575418994413408, "#981cfd" ], [ 0.44692737430167595, "#bf1cfd" ], [ 0.5363128491620112, "#dd2bfd" ], [ 0.6256983240223464, "#f246fe" ], [ 0.7150837988826816, "#fc67fd" ], [ 0.8044692737430168, "#fe88fc" ], [ 0.8938547486033519, "#fea5fd" ], [ 0.9832402234636871, "#febefe" ], [ 1, "#fec3fe" ] ] }, "plot_bgcolor": "white", "paper_bgcolor": "white", "shapedefaults": { "line": { "width": 0 }, "opacity": 0.4, "fillcolor": "#506784" }, "annotationdefaults": { "arrowhead": 0, "arrowcolor": "#506784", "arrowwidth": 1 } }, "themeRef": "PLOTLY_WHITE" } } }, "height": null, "width": null, "user": { "profile_url": "https://chart-studio.plotly.com/~noah.irwin", "avatar_url": "https://storage.googleapis.com/plotly-prod-profiles/41.jpg", "background_url": "https://storage.googleapis.com/plotly-prod-profiles/bg-14.jpg", "bio": "", "nickname": "", "website": "", "stream_tokens": null, "feature_set_id": null, "csrf_token": null, "date_joined": "2025-06-06 00:24:36", "mapbox_access_tokens": null, "has_password": null, "username": "noah.irwin", "email": null, "is_active": null, "readonly": null, "is_dash_creator": null, "dash_created_count": null, "is_chart_creator": null, "charts_created_count": null } }, { "creation_time": "2025-06-10T13:52:11.417700Z", "comments": { "results": [], "count": 0 }, "parented": true, "embed_url": "https://chart-studio.plotly.com/~williamphung/13.embed", "fid": "williamphung:13", "filename": "data2", "filetype": "plot", "img_url": "https://api.plotly.com/v2/files/williamphung:13/image?image_name=list-thumb", "image_urls": { "default": "https://api.plotly.com/v2/files/williamphung:13/image?image_name=default", "block-thumb": "https://storage.googleapis.com/plotly-prod-images/williamphung/13/8_SYJX9G769QG2AAMLN95MG3DS79WJO5.png", "list-thumb": "https://api.plotly.com/v2/files/williamphung:13/image?image_name=list-thumb" }, "api_urls": { "files": "https://api.plotly.com/v2/files/williamphung:13", "plots": "https://api.plotly.com/v2/plots/williamphung:13", "parent": "https://api.plotly.com/v2/folders/home?user=williamphung" }, "owner": "williamphung", "parent": -1, "preview": "", "referencers": [], "references": [], "title": "", "views": 0, "web_url": "https://chart-studio.plotly.com/~williamphung/13/", "world_readable": true, "date_modified": "2025-06-10T13:54:26.525Z", "stars": { "results": [], "count": 0 }, "collaborators": { "results": [], "count": 0 }, "subfolder_count": null, "refresh_interval": null, "organize_view_url": "https://chart-studio.plotly.com/~williamphung/13/", "current_user_permission": "read", "is_theme": null, "is_template": false, "autosize": true, "caption": "", "figure": { "data": [ { "uid": "ece609", "meta": { "columnNames": { "x": "A", "y": "B" } }, "mode": "markers", "name": "Data Points", "type": "scatter", "xsrc": "williamphung:12:91e216", "ysrc": "williamphung:12:6e89dc" }, { "uid": "717350", "transforms": [ { "rms": "", "type": "fit", "inputUid": "ece609", "regressor": "x", "parameters": [ { "hold": true, "name": "m", "error": 5.309284182490668e-20, "value": 0.0020000000000000005 }, { "hold": true, "name": "b", "error": 1.02676669455063e-16, "value": -1.1110616529098921e-16 } ], "regressand": "y", "correlation": "", "fitfunction": "m*x + b", "inputxrange": [], "outputxrange": [], "interpolation": 50 } ] } ], "frames": [], "layout": { "title": { "text": "Data2 KMnO4" }, "xaxis": { "type": "linear", "range": [ -50.16297821238634, 850.1629782123863 ], "title": { "text": "Amount of KMnO4 added." }, "autorange": true }, "yaxis": { "type": "linear", "range": [ -0.13387314439946021, 1.7338731443994604 ], "title": { "text": "Absorbance (au)" }, "autorange": true }, "autosize": true, "template": { "data": { "bar": [ { "type": "bar", "marker": { "colorbar": { "ticks": "", "outlinewidth": 0 } } } ], "table": [ { "type": "table", "cells": { "fill": { "color": "#EBF0F8" }, "line": { "color": "white" } }, "header": { "fill": { "color": "#C8D4E3" }, "line": { "color": "white" } } } ], "carpet": [ { "type": "carpet", "aaxis": { "gridcolor": "#C8D4E3", "linecolor": "#C8D4E3", "endlinecolor": "#2a3f5f", "minorgridcolor": "#C8D4E3", "startlinecolor": "#2a3f5f" }, "baxis": { "gridcolor": "#C8D4E3", "linecolor": "#C8D4E3", "endlinecolor": "#2a3f5f", "minorgridcolor": "#C8D4E3", "startlinecolor": "#2a3f5f" } } ], "mesh3d": [ { "type": "mesh3d", "colorbar": { "ticks": "", "outlinewidth": 0 } } ], "contour": [ { "type": "contour", "colorbar": { "ticks": "", "outlinewidth": 0 }, "autocolorscale": true } ], "heatmap": [ { "type": "heatmap", "colorbar": { "ticks": "", "outlinewidth": 0 }, "autocolorscale": true } ], "scatter": [ { "type": "scatter", "marker": { "colorbar": { "ticks": "", "outlinewidth": 0 } } } ], "surface": [ { "type": "surface", "colorbar": { "ticks": "", "outlinewidth": 0 } } ], "heatmapgl": [ { "type": "heatmapgl", "colorbar": { "ticks": "", "outlinewidth": 0 } } ], "histogram": [ { "type": "histogram", "marker": { "colorbar": { "ticks": "", "outlinewidth": 0 } } } ], "parcoords": [ { "line": { "colorbar": { "ticks": "", "outlinewidth": 0 } }, "type": "parcoords" } ], "scatter3d": [ { "type": "scatter3d", "marker": { "colorbar": { "ticks": "", "outlinewidth": 0 } } } ], "scattergl": [ { "type": "scattergl", "marker": { "colorbar": { "ticks": "", "outlinewidth": 0 } } } ], "choropleth": [ { "type": "choropleth", "colorbar": { "ticks": "", "outlinewidth": 0 } } ], "scattergeo": [ { "type": "scattergeo", "marker": { "colorbar": { "ticks": "", "outlinewidth": 0 } } } ], "histogram2d": [ { "type": "histogram2d", "colorbar": { "ticks": "", "outlinewidth": 0 }, "autocolorscale": true } ], "scatterpolar": [ { "type": "scatterpolar", "marker": { "colorbar": { "ticks": "", "outlinewidth": 0 } } } ], "contourcarpet": [ { "type": "contourcarpet", "colorbar": { "ticks": "", "outlinewidth": 0 } } ], "scattercarpet": [ { "type": "scattercarpet", "marker": { "colorbar": { "ticks": "", "outlinewidth": 0 } } } ], "scattermapbox": [ { "type": "scattermapbox", "marker": { "colorbar": { "ticks": "", "outlinewidth": 0 } } } ], "scatterpolargl": [ { "type": "scatterpolargl", "marker": { "colorbar": { "ticks": "", "outlinewidth": 0 } } } ], "scatterternary": [ { "type": "scatterternary", "marker": { "colorbar": { "ticks": "", "outlinewidth": 0 } } } ], "histogram2dcontour": [ { "type": "histogram2dcontour", "colorbar": { "ticks": "", "outlinewidth": 0 }, "autocolorscale": true } ] }, "layout": { "geo": { "bgcolor": "white", "showland": true, "lakecolor": "white", "landcolor": "white", "showlakes": true, "subunitcolor": "#C8D4E3" }, "font": { "color": "#2a3f5f" }, "polar": { "bgcolor": "white", "radialaxis": { "ticks": "", "gridcolor": "#EBF0F8", "linecolor": "#EBF0F8" }, "angularaxis": { "ticks": "", "gridcolor": "#EBF0F8", "linecolor": "#EBF0F8" } }, "scene": { "xaxis": { "ticks": "", "gridcolor": "#DFE8F3", "gridwidth": 2, "linecolor": "#EBF0F8", "zerolinecolor": "#EBF0F8", "showbackground": true, "backgroundcolor": "white" }, "yaxis": { "ticks": "", "gridcolor": "#DFE8F3", "gridwidth": 2, "linecolor": "#EBF0F8", "zerolinecolor": "#EBF0F8", "showbackground": true, "backgroundcolor": "white" }, "zaxis": { "ticks": "", "gridcolor": "#DFE8F3", "gridwidth": 2, "linecolor": "#EBF0F8", "zerolinecolor": "#EBF0F8", "showbackground": true, "backgroundcolor": "white" } }, "title": { "x": 0.05 }, "xaxis": { "ticks": "", "gridcolor": "#EBF0F8", "linecolor": "#EBF0F8", "automargin": true, "zerolinecolor": "#EBF0F8", "zerolinewidth": 2 }, "yaxis": { "ticks": "", "gridcolor": "#EBF0F8", "linecolor": "#EBF0F8", "automargin": true, "zerolinecolor": "#EBF0F8", "zerolinewidth": 2 }, "ternary": { "aaxis": { "ticks": "", "gridcolor": "#DFE8F3", "linecolor": "#A2B1C6" }, "baxis": { "ticks": "", "gridcolor": "#DFE8F3", "linecolor": "#A2B1C6" }, "caxis": { "ticks": "", "gridcolor": "#DFE8F3", "linecolor": "#A2B1C6" }, "bgcolor": "white" }, "colorway": [ "#636efa", "#EF553B", "#00cc96", "#ab63fa", "#19d3f3", "#e763fa", "#fecb52", "#ffa15a", "#ff6692", "#b6e880" ], "hovermode": "closest", "colorscale": { "diverging": [ [ 0, "#8e0152" ], [ 0.1, "#c51b7d" ], [ 0.2, "#de77ae" ], [ 0.3, "#f1b6da" ], [ 0.4, "#fde0ef" ], [ 0.5, "#f7f7f7" ], [ 0.6, "#e6f5d0" ], [ 0.7, "#b8e186" ], [ 0.8, "#7fbc41" ], [ 0.9, "#4d9221" ], [ 1, "#276419" ] ], "sequential": [ [ 0, "#0508b8" ], [ 0.0893854748603352, "#1910d8" ], [ 0.1787709497206704, "#3c19f0" ], [ 0.2681564245810056, "#6b1cfb" ], [ 0.3575418994413408, "#981cfd" ], [ 0.44692737430167595, "#bf1cfd" ], [ 0.5363128491620112, "#dd2bfd" ], [ 0.6256983240223464, "#f246fe" ], [ 0.7150837988826816, "#fc67fd" ], [ 0.8044692737430168, "#fe88fc" ], [ 0.8938547486033519, "#fea5fd" ], [ 0.9832402234636871, "#febefe" ], [ 1, "#fec3fe" ] ], "sequentialminus": [ [ 0, "#0508b8" ], [ 0.0893854748603352, "#1910d8" ], [ 0.1787709497206704, "#3c19f0" ], [ 0.2681564245810056, "#6b1cfb" ], [ 0.3575418994413408, "#981cfd" ], [ 0.44692737430167595, "#bf1cfd" ], [ 0.5363128491620112, "#dd2bfd" ], [ 0.6256983240223464, "#f246fe" ], [ 0.7150837988826816, "#fc67fd" ], [ 0.8044692737430168, "#fe88fc" ], [ 0.8938547486033519, "#fea5fd" ], [ 0.9832402234636871, "#febefe" ], [ 1, "#fec3fe" ] ] }, "plot_bgcolor": "white", "paper_bgcolor": "white", "shapedefaults": { "line": { "width": 0 }, "opacity": 0.4, "fillcolor": "#506784" }, "annotationdefaults": { "arrowhead": 0, "arrowcolor": "#506784", "arrowwidth": 1 } }, "themeRef": "PLOTLY_WHITE" }, "annotations": [ { "ax": -83, "ay": -63, "text": "y=0.0020000000000000005x+(-1.1110616529098921e-16)" } ] } }, "height": null, "width": null, "user": { "profile_url": "https://chart-studio.plotly.com/~williamphung", "avatar_url": "https://storage.googleapis.com/plotly-prod-profiles/10.jpg", "background_url": "https://storage.googleapis.com/plotly-prod-profiles/bg-3.jpg", "bio": "", "nickname": "", "website": "", "stream_tokens": null, "feature_set_id": null, "csrf_token": null, "date_joined": "2021-09-19 23:53:43", "mapbox_access_tokens": null, "has_password": null, "username": "williamphung", "email": null, "is_active": null, "readonly": null, "is_dash_creator": null, "dash_created_count": null, "is_chart_creator": null, "charts_created_count": null } }, { "creation_time": "2025-06-10T13:43:59.509857Z", "comments": { "results": [], "count": 0 }, "parented": true, "embed_url": "https://chart-studio.plotly.com/~sanazafsharian/9.embed", "fid": "sanazafsharian:9", "filename": "depth and draft angle", "filetype": "plot", "img_url": "https://api.plotly.com/v2/files/sanazafsharian:9/image?image_name=list-thumb", "image_urls": { "default": "https://api.plotly.com/v2/files/sanazafsharian:9/image?image_name=default", "block-thumb": "https://storage.googleapis.com/plotly-prod-images/sanazafsharian/9/8_NQVVORGX0YC9T4GQWMOUG0HFFMX4BG.png", "list-thumb": "https://api.plotly.com/v2/files/sanazafsharian:9/image?image_name=list-thumb" }, "api_urls": { "files": "https://api.plotly.com/v2/files/sanazafsharian:9", "plots": "https://api.plotly.com/v2/plots/sanazafsharian:9", "parent": "https://api.plotly.com/v2/folders/home?user=sanazafsharian" }, "owner": "sanazafsharian", "parent": -1, "preview": "", "referencers": [], "references": [], "title": "", "views": 0, "web_url": "https://chart-studio.plotly.com/~sanazafsharian/9/", "world_readable": true, "date_modified": "2025-06-11T07:21:54.778Z", "stars": { "results": [], "count": 0 }, "collaborators": { "results": [], "count": 0 }, "subfolder_count": null, "refresh_interval": null, "organize_view_url": "https://chart-studio.plotly.com/~sanazafsharian/9/", "current_user_permission": "read", "is_theme": null, "is_template": false, "autosize": false, "caption": "", "figure": { "data": [ { "line": { "dash": "solid", "color": "rgb(155, 156, 178)", "width": 4 }, "meta": { "columnNames": { "x": "A", "y": "Uncoated paperboard", "cells": { "values": "Uncoated paperboard" }, "header": { "values": "A" }, "labels": "Uncoated paperboard", "values": "A", "error_y": { "array": "error 1" } } }, "mode": "lines", "name": "<b>Uncoated paperboard-depth</b>", "type": "scatter", "xsrc": "sanazafsharian:8:afd880", "ysrc": "sanazafsharian:8:16b159", "cells": { "meta": { "columnNames": { "values": "Uncoated paperboard" } }, "valuessrc": "sanazafsharian:8:16b159*" }, "yaxis": "y", "header": { "meta": { "columnNames": { "values": "A" } }, "valuessrc": "sanazafsharian:8:afd880" }, "error_y": { "meta": { "columnNames": { "array": "error 1" } }, "type": "data", "color": "rgb(23, 23, 24)", "width": 3, "visible": true, "arraysrc": "sanazafsharian:8:b9b67c", "symmetric": true, "thickness": 2 }, "labelssrc": "sanazafsharian:8:16b159", "valuessrc": "sanazafsharian:8:afd880", "connectgaps": false, "orientation": "v" }, { "line": { "color": "rgb(72, 16, 7)", "width": 4 }, "meta": { "columnNames": { "x": "A", "y": "Uncoated paperboard + plastic layer", "error_y": { "array": "error 3" } } }, "mode": "lines", "name": "<b>Uncoated paperbaord + plastic layer-depth</b>", "type": "scatter", "xsrc": "sanazafsharian:8:afd880", "ysrc": "sanazafsharian:8:41e64e", "yaxis": "y", "error_y": { "meta": { "columnNames": { "array": "error 3" } }, "type": "data", "width": 3, "visible": true, "arraysrc": "sanazafsharian:8:59b001", "symmetric": true }, "orientation": "v" }, { "line": { "width": 4 }, "meta": { "columnNames": { "x": "A", "y": "PET-coated paperboard", "error_y": { "array": "error 5" } } }, "mode": "lines", "name": "<b>PET-coated paperboard-depth</b>", "type": "scatter", "xsrc": "sanazafsharian:8:afd880", "ysrc": "sanazafsharian:8:c8133d", "error_y": { "meta": { "columnNames": { "array": "error 5" } }, "type": "data", "width": 3, "visible": true, "arraysrc": "sanazafsharian:8:8364aa", "symmetric": true, "thickness": 2 }, "orientation": "v" }, { "meta": { "columnNames": { "x": "A", "y": "D", "error_y": { "array": "error 2" } } }, "mode": "lines", "name": "<b>Uncoated paperboard-draft angle</b>", "type": "bar", "xsrc": "sanazafsharian:8:afd880", "ysrc": "sanazafsharian:8:2cb6ed", "marker": { "color": "rgb(99, 110, 250)" }, "error_y": { "meta": { "columnNames": { "array": "error 2" } }, "type": "data", "width": 3, "visible": true, "arraysrc": "sanazafsharian:8:d6bfa8", "symmetric": true }, "orientation": "v" }, { "meta": { "columnNames": { "x": "A", "y": "H", "error_y": { "array": "error 4" } } }, "mode": "lines", "name": "<b>Uncoated paperboard + plastic layer-draft angle</b>", "type": "bar", "xsrc": "sanazafsharian:8:afd880", "ysrc": "sanazafsharian:8:c0151c", "marker": { "color": "rgb(239, 85, 59)" }, "error_y": { "meta": { "columnNames": { "array": "error 4" } }, "type": "data", "width": 3, "visible": true, "arraysrc": "sanazafsharian:8:c9761b", "symmetric": true }, "orientation": "v" }, { "meta": { "columnNames": { "x": "A", "y": "L", "error_y": { "array": "error 6" } } }, "mode": "lines", "name": "<b>PET-coated paperboard-draft angle</b>", "type": "bar", "xsrc": "sanazafsharian:8:afd880", "ysrc": "sanazafsharian:8:197a0e", "marker": { "color": "rgb(143, 195, 167)" }, "error_y": { "meta": { "columnNames": { "array": "error 6" } }, "type": "data", "width": 3, "visible": true, "arraysrc": "sanazafsharian:8:a5227f", "symmetric": true }, "orientation": "v" } ], "frames": [], "layout": { "scene": { "aspectmode": "auto", "aspectratio": { "x": 1, "y": 1, "z": 1 } }, "title": { "x": 0.05, "font": { "size": 34 }, "text": "<b>Percentage change in depth and draft angle in mid-width direction as compared with reference values (No MFC)</b>" }, "width": 2100, "xaxis": { "type": "category", "dtick": 1, "range": [ -0.5, 5.5 ], "tick0": 1, "title": { "font": { "size": 14 }, "text": "Click to enter X axis title" }, "tickfont": { "size": 24 }, "tickmode": "linear", "autorange": true, "tickangle": "auto" }, "yaxis": { "type": "linear", "range": [ -10.461111111111112, 48.76111111111111 ], "title": { "font": { "size": 25 }, "text": "<b>Percentage change in depth and draft angle (%)</b><br>" }, "tickfont": { "size": 20 }, "autorange": true, "tickangle": "auto" }, "height": 1400, "legend": { "x": 1.0142384750869742, "y": 0.6350699044869387, "font": { "size": 23 }, "bgcolor": "rgb(240, 219, 219)", "xanchor": "left", "borderwidth": 2 }, "autosize": false, "colorway": [ "#3366cc", "#dc3912", "#ff9900", "#109618", "#990099", "#0099c6", "#dd4477", "#66aa00", "#b82e2e", "#316395" ], "template": { "data": { "bar": [ { "type": "bar", "marker": { "colorbar": { "ticks": "", "outlinewidth": 0 } } } ], "table": [ { "type": "table", "cells": { "fill": { "color": "#EBF0F8" }, "line": { "color": "white" } }, "header": { "fill": { "color": "#C8D4E3" }, "line": { "color": "white" } } } ], "carpet": [ { "type": "carpet", "aaxis": { "gridcolor": "#C8D4E3", "linecolor": "#C8D4E3", "endlinecolor": "#2a3f5f", "minorgridcolor": "#C8D4E3", "startlinecolor": "#2a3f5f" }, "baxis": { "gridcolor": "#C8D4E3", "linecolor": "#C8D4E3", "endlinecolor": "#2a3f5f", "minorgridcolor": "#C8D4E3", "startlinecolor": "#2a3f5f" } } ], "mesh3d": [ { "type": "mesh3d", "colorbar": { "ticks": "", "outlinewidth": 0 } } ], "contour": [ { "type": "contour", "colorbar": { "ticks": "", "outlinewidth": 0 }, "autocolorscale": true } ], "heatmap": [ { "type": "heatmap", "colorbar": { "ticks": "", "outlinewidth": 0 }, "autocolorscale": true } ], "scatter": [ { "type": "scatter", "marker": { "colorbar": { "ticks": "", "outlinewidth": 0 } } } ], "surface": [ { "type": "surface", "colorbar": { "ticks": "", "outlinewidth": 0 } } ], "heatmapgl": [ { "type": "heatmapgl", "colorbar": { "ticks": "", "outlinewidth": 0 } } ], "histogram": [ { "type": "histogram", "marker": { "colorbar": { "ticks": "", "outlinewidth": 0 } } } ], "parcoords": [ { "line": { "colorbar": { "ticks": "", "outlinewidth": 0 } }, "type": "parcoords" } ], "scatter3d": [ { "type": "scatter3d", "marker": { "colorbar": { "ticks": "", "outlinewidth": 0 } } } ], "scattergl": [ { "type": "scattergl", "marker": { "colorbar": { "ticks": "", "outlinewidth": 0 } } } ], "choropleth": [ { "type": "choropleth", "colorbar": { "ticks": "", "outlinewidth": 0 } } ], "scattergeo": [ { "type": "scattergeo", "marker": { "colorbar": { "ticks": "", "outlinewidth": 0 } } } ], "histogram2d": [ { "type": "histogram2d", "colorbar": { "ticks": "", "outlinewidth": 0 }, "autocolorscale": true } ], "scatterpolar": [ { "type": "scatterpolar", "marker": { "colorbar": { "ticks": "", "outlinewidth": 0 } } } ], "contourcarpet": [ { "type": "contourcarpet", "colorbar": { "ticks": "", "outlinewidth": 0 } } ], "scattercarpet": [ { "type": "scattercarpet", "marker": { "colorbar": { "ticks": "", "outlinewidth": 0 } } } ], "scattermapbox": [ { "type": "scattermapbox", "marker": { "colorbar": { "ticks": "", "outlinewidth": 0 } } } ], "scatterpolargl": [ { "type": "scatterpolargl", "marker": { "colorbar": { "ticks": "", "outlinewidth": 0 } } } ], "scatterternary": [ { "type": "scatterternary", "marker": { "colorbar": { "ticks": "", "outlinewidth": 0 } } } ], "histogram2dcontour": [ { "type": "histogram2dcontour", "colorbar": { "ticks": "", "outlinewidth": 0 }, "autocolorscale": true } ] }, "layout": { "geo": { "bgcolor": "white", "showland": true, "lakecolor": "white", "landcolor": "white", "showlakes": true, "subunitcolor": "#C8D4E3" }, "font": { "color": "#2a3f5f" }, "polar": { "bgcolor": "white", "radialaxis": { "ticks": "", "gridcolor": "#EBF0F8", "linecolor": "#EBF0F8" }, "angularaxis": { "ticks": "", "gridcolor": "#EBF0F8", "linecolor": "#EBF0F8" } }, "scene": { "xaxis": { "ticks": "", "gridcolor": "#DFE8F3", "gridwidth": 2, "linecolor": "#EBF0F8", "zerolinecolor": "#EBF0F8", "showbackground": true, "backgroundcolor": "white" }, "yaxis": { "ticks": "", "gridcolor": "#DFE8F3", "gridwidth": 2, "linecolor": "#EBF0F8", "zerolinecolor": "#EBF0F8", "showbackground": true, "backgroundcolor": "white" }, "zaxis": { "ticks": "", "gridcolor": "#DFE8F3", "gridwidth": 2, "linecolor": "#EBF0F8", "zerolinecolor": "#EBF0F8", "showbackground": true, "backgroundcolor": "white" } }, "title": { "x": 0.05 }, "xaxis": { "ticks": "", "gridcolor": "#EBF0F8", "linecolor": "#EBF0F8", "automargin": true, "zerolinecolor": "#EBF0F8", "zerolinewidth": 2 }, "yaxis": { "ticks": "", "gridcolor": "#EBF0F8", "linecolor": "#EBF0F8", "automargin": true, "zerolinecolor": "#EBF0F8", "zerolinewidth": 2 }, "ternary": { "aaxis": { "ticks": "", "gridcolor": "#DFE8F3", "linecolor": "#A2B1C6" }, "baxis": { "ticks": "", "gridcolor": "#DFE8F3", "linecolor": "#A2B1C6" }, "caxis": { "ticks": "", "gridcolor": "#DFE8F3", "linecolor": "#A2B1C6" }, "bgcolor": "white" }, "colorway": [ "#636efa", "#EF553B", "#00cc96", "#ab63fa", "#19d3f3", "#e763fa", "#fecb52", "#ffa15a", "#ff6692", "#b6e880" ], "hovermode": "closest", "colorscale": { "diverging": [ [ 0, "#8e0152" ], [ 0.1, "#c51b7d" ], [ 0.2, "#de77ae" ], [ 0.3, "#f1b6da" ], [ 0.4, "#fde0ef" ], [ 0.5, "#f7f7f7" ], [ 0.6, "#e6f5d0" ], [ 0.7, "#b8e186" ], [ 0.8, "#7fbc41" ], [ 0.9, "#4d9221" ], [ 1, "#276419" ] ], "sequential": [ [ 0, "#0508b8" ], [ 0.0893854748603352, "#1910d8" ], [ 0.1787709497206704, "#3c19f0" ], [ 0.2681564245810056, "#6b1cfb" ], [ 0.3575418994413408, "#981cfd" ], [ 0.44692737430167595, "#bf1cfd" ], [ 0.5363128491620112, "#dd2bfd" ], [ 0.6256983240223464, "#f246fe" ], [ 0.7150837988826816, "#fc67fd" ], [ 0.8044692737430168, "#fe88fc" ], [ 0.8938547486033519, "#fea5fd" ], [ 0.9832402234636871, "#febefe" ], [ 1, "#fec3fe" ] ], "sequentialminus": [ [ 0, "#0508b8" ], [ 0.0893854748603352, "#1910d8" ], [ 0.1787709497206704, "#3c19f0" ], [ 0.2681564245810056, "#6b1cfb" ], [ 0.3575418994413408, "#981cfd" ], [ 0.44692737430167595, "#bf1cfd" ], [ 0.5363128491620112, "#dd2bfd" ], [ 0.6256983240223464, "#f246fe" ], [ 0.7150837988826816, "#fc67fd" ], [ 0.8044692737430168, "#fe88fc" ], [ 0.8938547486033519, "#fea5fd" ], [ 0.9832402234636871, "#febefe" ], [ 1, "#fec3fe" ] ] }, "plot_bgcolor": "white", "paper_bgcolor": "white", "shapedefaults": { "line": { "width": 0 }, "opacity": 0.4, "fillcolor": "#506784" }, "annotationdefaults": { "arrowhead": 0, "arrowcolor": "#506784", "arrowwidth": 1 } }, "themeRef": "PLOTLY_WHITE" }, "colorscale": { "diverging": [ [ 0, "#9e0142" ], [ 0.1, "#d53e4f" ], [ 0.2, "#f46d43" ], [ 0.3, "#fdae61" ], [ 0.4, "#fee08b" ], [ 0.5, "#ffffbf" ], [ 0.6, "#e6f598" ], [ 0.7, "#abdda4" ], [ 0.8, "#66c2a5" ], [ 0.9, "#3288bd" ], [ 1, "#5e4fa2" ] ], "sequential": [ [ 0, "#fcfbfd" ], [ 0.125, "#efedf5" ], [ 0.25, "#dadaeb" ], [ 0.375, "#bcbddc" ], [ 0.5, "#9e9ac8" ], [ 0.625, "#807dba" ], [ 0.75, "#6a51a3" ], [ 0.875, "#54278f" ], [ 1, "#3f007d" ] ], "sequentialminus": [ [ 0, "#fff7fb" ], [ 0.125, "#ece7f2" ], [ 0.25, "#d0d1e6" ], [ 0.375, "#a6bddb" ], [ 0.5, "#74a9cf" ], [ 0.625, "#3690c0" ], [ 0.75, "#0570b0" ], [ 0.875, "#045a8d" ], [ 1, "#023858" ] ] }, "paper_bgcolor": "rgb(250, 246, 246)" } }, "height": 1400, "width": 2100, "user": { "profile_url": "https://chart-studio.plotly.com/~sanazafsharian", "avatar_url": "https://storage.googleapis.com/plotly-prod-profiles/79.jpg", "background_url": "https://storage.googleapis.com/plotly-prod-profiles/bg-6.jpg", "bio": "", "nickname": "", "website": "", "stream_tokens": null, "feature_set_id": null, "csrf_token": null, "date_joined": "2025-05-30 11:17:43", "mapbox_access_tokens": null, "has_password": null, "username": "sanazafsharian", "email": null, "is_active": null, "readonly": null, "is_dash_creator": null, "dash_created_count": null, "is_chart_creator": null, "charts_created_count": null } }, { "creation_time": "2025-06-10T13:42:36.484560Z", "comments": { "results": [], "count": 0 }, "parented": true, "embed_url": "https://chart-studio.plotly.com/~williamphung/11.embed", "fid": "williamphung:11", "filename": "Plot 11", "filetype": "plot", "img_url": "https://api.plotly.com/v2/files/williamphung:11/image?image_name=list-thumb", "image_urls": { "default": "https://api.plotly.com/v2/files/williamphung:11/image?image_name=default", "block-thumb": "https://storage.googleapis.com/plotly-prod-images/williamphung/11/8_9617OBTJ4VJW1ZD8DKRSNQ4U30UN6J.png", "list-thumb": "https://api.plotly.com/v2/files/williamphung:11/image?image_name=list-thumb" }, "api_urls": { "files": "https://api.plotly.com/v2/files/williamphung:11", "plots": "https://api.plotly.com/v2/plots/williamphung:11", "parent": "https://api.plotly.com/v2/folders/home?user=williamphung" }, "owner": "williamphung", "parent": -1, "preview": "", "referencers": [], "references": [], "title": "", "views": 0, "web_url": "https://chart-studio.plotly.com/~williamphung/11/", "world_readable": true, "date_modified": "2025-06-10T13:42:36.497Z", "stars": { "results": [], "count": 0 }, "collaborators": { "results": [], "count": 0 }, "subfolder_count": null, "refresh_interval": null, "organize_view_url": "https://chart-studio.plotly.com/~williamphung/11/", "current_user_permission": "read", "is_theme": null, "is_template": false, "autosize": true, "caption": "", "figure": { "data": [ { "uid": "dba6b8", "meta": { "columnNames": { "x": "A", "y": "B" } }, "mode": "markers", "name": "Growth", "type": "scatter", "xsrc": "williamphung:10:00c131", "ysrc": "williamphung:10:ed3a7e", "opacity": 1, "visible": true }, { "uid": "5bb916", "transforms": [ { "rms": "", "type": "fit", "inputUid": "dba6b8", "regressor": "x", "parameters": [ { "hold": false, "name": "m", "error": 0, "value": 0.002 }, { "hold": false, "name": "b", "error": 0, "value": 0 } ], "regressand": "y", "correlation": "", "fitfunction": "m*x + b", "inputxrange": [], "outputxrange": [], "interpolation": 50 } ] } ], "frames": [], "layout": { "title": { "text": "Potassium Promanganate" }, "xaxis": { "type": "linear", "range": [ -39.98008959681434, 679.9800895968143 ], "title": { "text": "Amount of Potassium Promaganate Added in mL" }, "autorange": true }, "yaxis": { "type": "linear", "range": [ -0.10709851551956817, 1.3870985155195683 ], "title": { "text": "Absorbance (uM)" }, "autorange": true }, "autosize": true, "template": { "data": { "bar": [ { "type": "bar", "marker": { "colorbar": { "ticks": "", "outlinewidth": 0 } } } ], "table": [ { "type": "table", "cells": { "fill": { "color": "#EBF0F8" }, "line": { "color": "white" } }, "header": { "fill": { "color": "#C8D4E3" }, "line": { "color": "white" } } } ], "carpet": [ { "type": "carpet", "aaxis": { "gridcolor": "#C8D4E3", "linecolor": "#C8D4E3", "endlinecolor": "#2a3f5f", "minorgridcolor": "#C8D4E3", "startlinecolor": "#2a3f5f" }, "baxis": { "gridcolor": "#C8D4E3", "linecolor": "#C8D4E3", "endlinecolor": "#2a3f5f", "minorgridcolor": "#C8D4E3", "startlinecolor": "#2a3f5f" } } ], "mesh3d": [ { "type": "mesh3d", "colorbar": { "ticks": "", "outlinewidth": 0 } } ], "contour": [ { "type": "contour", "colorbar": { "ticks": "", "outlinewidth": 0 }, "autocolorscale": true } ], "heatmap": [ { "type": "heatmap", "colorbar": { "ticks": "", "outlinewidth": 0 }, "autocolorscale": true } ], "scatter": [ { "type": "scatter", "marker": { "colorbar": { "ticks": "", "outlinewidth": 0 } } } ], "surface": [ { "type": "surface", "colorbar": { "ticks": "", "outlinewidth": 0 } } ], "heatmapgl": [ { "type": "heatmapgl", "colorbar": { "ticks": "", "outlinewidth": 0 } } ], "histogram": [ { "type": "histogram", "marker": { "colorbar": { "ticks": "", "outlinewidth": 0 } } } ], "parcoords": [ { "line": { "colorbar": { "ticks": "", "outlinewidth": 0 } }, "type": "parcoords" } ], "scatter3d": [ { "type": "scatter3d", "marker": { "colorbar": { "ticks": "", "outlinewidth": 0 } } } ], "scattergl": [ { "type": "scattergl", "marker": { "colorbar": { "ticks": "", "outlinewidth": 0 } } } ], "choropleth": [ { "type": "choropleth", "colorbar": { "ticks": "", "outlinewidth": 0 } } ], "scattergeo": [ { "type": "scattergeo", "marker": { "colorbar": { "ticks": "", "outlinewidth": 0 } } } ], "histogram2d": [ { "type": "histogram2d", "colorbar": { "ticks": "", "outlinewidth": 0 }, "autocolorscale": true } ], "scatterpolar": [ { "type": "scatterpolar", "marker": { "colorbar": { "ticks": "", "outlinewidth": 0 } } } ], "contourcarpet": [ { "type": "contourcarpet", "colorbar": { "ticks": "", "outlinewidth": 0 } } ], "scattercarpet": [ { "type": "scattercarpet", "marker": { "colorbar": { "ticks": "", "outlinewidth": 0 } } } ], "scattermapbox": [ { "type": "scattermapbox", "marker": { "colorbar": { "ticks": "", "outlinewidth": 0 } } } ], "scatterpolargl": [ { "type": "scatterpolargl", "marker": { "colorbar": { "ticks": "", "outlinewidth": 0 } } } ], "scatterternary": [ { "type": "scatterternary", "marker": { "colorbar": { "ticks": "", "outlinewidth": 0 } } } ], "histogram2dcontour": [ { "type": "histogram2dcontour", "colorbar": { "ticks": "", "outlinewidth": 0 }, "autocolorscale": true } ] }, "layout": { "geo": { "bgcolor": "white", "showland": true, "lakecolor": "white", "landcolor": "white", "showlakes": true, "subunitcolor": "#C8D4E3" }, "font": { "color": "#2a3f5f" }, "polar": { "bgcolor": "white", "radialaxis": { "ticks": "", "gridcolor": "#EBF0F8", "linecolor": "#EBF0F8" }, "angularaxis": { "ticks": "", "gridcolor": "#EBF0F8", "linecolor": "#EBF0F8" } }, "scene": { "xaxis": { "ticks": "", "gridcolor": "#DFE8F3", "gridwidth": 2, "linecolor": "#EBF0F8", "zerolinecolor": "#EBF0F8", "showbackground": true, "backgroundcolor": "white" }, "yaxis": { "ticks": "", "gridcolor": "#DFE8F3", "gridwidth": 2, "linecolor": "#EBF0F8", "zerolinecolor": "#EBF0F8", "showbackground": true, "backgroundcolor": "white" }, "zaxis": { "ticks": "", "gridcolor": "#DFE8F3", "gridwidth": 2, "linecolor": "#EBF0F8", "zerolinecolor": "#EBF0F8", "showbackground": true, "backgroundcolor": "white" } }, "title": { "x": 0.05 }, "xaxis": { "ticks": "", "gridcolor": "#EBF0F8", "linecolor": "#EBF0F8", "automargin": true, "zerolinecolor": "#EBF0F8", "zerolinewidth": 2 }, "yaxis": { "ticks": "", "gridcolor": "#EBF0F8", "linecolor": "#EBF0F8", "automargin": true, "zerolinecolor": "#EBF0F8", "zerolinewidth": 2 }, "ternary": { "aaxis": { "ticks": "", "gridcolor": "#DFE8F3", "linecolor": "#A2B1C6" }, "baxis": { "ticks": "", "gridcolor": "#DFE8F3", "linecolor": "#A2B1C6" }, "caxis": { "ticks": "", "gridcolor": "#DFE8F3", "linecolor": "#A2B1C6" }, "bgcolor": "white" }, "colorway": [ "#636efa", "#EF553B", "#00cc96", "#ab63fa", "#19d3f3", "#e763fa", "#fecb52", "#ffa15a", "#ff6692", "#b6e880" ], "hovermode": "closest", "colorscale": { "diverging": [ [ 0, "#8e0152" ], [ 0.1, "#c51b7d" ], [ 0.2, "#de77ae" ], [ 0.3, "#f1b6da" ], [ 0.4, "#fde0ef" ], [ 0.5, "#f7f7f7" ], [ 0.6, "#e6f5d0" ], [ 0.7, "#b8e186" ], [ 0.8, "#7fbc41" ], [ 0.9, "#4d9221" ], [ 1, "#276419" ] ], "sequential": [ [ 0, "#0508b8" ], [ 0.0893854748603352, "#1910d8" ], [ 0.1787709497206704, "#3c19f0" ], [ 0.2681564245810056, "#6b1cfb" ], [ 0.3575418994413408, "#981cfd" ], [ 0.44692737430167595, "#bf1cfd" ], [ 0.5363128491620112, "#dd2bfd" ], [ 0.6256983240223464, "#f246fe" ], [ 0.7150837988826816, "#fc67fd" ], [ 0.8044692737430168, "#fe88fc" ], [ 0.8938547486033519, "#fea5fd" ], [ 0.9832402234636871, "#febefe" ], [ 1, "#fec3fe" ] ], "sequentialminus": [ [ 0, "#0508b8" ], [ 0.0893854748603352, "#1910d8" ], [ 0.1787709497206704, "#3c19f0" ], [ 0.2681564245810056, "#6b1cfb" ], [ 0.3575418994413408, "#981cfd" ], [ 0.44692737430167595, "#bf1cfd" ], [ 0.5363128491620112, "#dd2bfd" ], [ 0.6256983240223464, "#f246fe" ], [ 0.7150837988826816, "#fc67fd" ], [ 0.8044692737430168, "#fe88fc" ], [ 0.8938547486033519, "#fea5fd" ], [ 0.9832402234636871, "#febefe" ], [ 1, "#fec3fe" ] ] }, "plot_bgcolor": "white", "paper_bgcolor": "white", "shapedefaults": { "line": { "width": 0 }, "opacity": 0.4, "fillcolor": "#506784" }, "annotationdefaults": { "arrowhead": 0, "arrowcolor": "#506784", "arrowwidth": 1 } }, "themeRef": "PLOTLY_WHITE" }, "annotations": [ { "font": { "size": 15 }, "text": "y=0.002x" } ] } }, "height": null, "width": null, "user": { "profile_url": "https://chart-studio.plotly.com/~williamphung", "avatar_url": "https://storage.googleapis.com/plotly-prod-profiles/10.jpg", "background_url": "https://storage.googleapis.com/plotly-prod-profiles/bg-3.jpg", "bio": "", "nickname": "", "website": "", "stream_tokens": null, "feature_set_id": null, "csrf_token": null, "date_joined": "2021-09-19 23:53:43", "mapbox_access_tokens": null, "has_password": null, "username": "williamphung", "email": null, "is_active": null, "readonly": null, "is_dash_creator": null, "dash_created_count": null, "is_chart_creator": null, "charts_created_count": null } }, { "creation_time": "2025-06-10T13:39:10.474090Z", "comments": { "results": [], "count": 0 }, "parented": true, "embed_url": "https://chart-studio.plotly.com/~baldassa.simone/22.embed", "fid": "baldassa.simone:22", "filename": "grafico_tracciabilita_compatto", "filetype": "plot", "img_url": "https://api.plotly.com/v2/files/baldassa.simone:22/image?image_name=list-thumb", "image_urls": { "default": "https://api.plotly.com/v2/files/baldassa.simone:22/image?image_name=default", "block-thumb": "https://storage.googleapis.com/plotly-prod-images/baldassa.simone/22/8_LX8TCGMJ6NQOXTL82X3W9DHRZJ9NWW.png", "list-thumb": "https://api.plotly.com/v2/files/baldassa.simone:22/image?image_name=list-thumb" }, "api_urls": { "files": "https://api.plotly.com/v2/files/baldassa.simone:22", "plots": "https://api.plotly.com/v2/plots/baldassa.simone:22", "parent": "https://api.plotly.com/v2/folders/home?user=baldassa.simone" }, "owner": "baldassa.simone", "parent": -1, "preview": "", "referencers": [], "references": [], "title": "", "views": 0, "web_url": "https://chart-studio.plotly.com/~baldassa.simone/22/", "world_readable": true, "date_modified": "2025-06-10T13:47:14.939Z", "stars": { "results": [], "count": 0 }, "collaborators": { "results": [], "count": 0 }, "subfolder_count": null, "refresh_interval": null, "organize_view_url": "https://chart-studio.plotly.com/~baldassa.simone/22/", "current_user_permission": "read", "is_theme": null, "is_template": null, "autosize": true, "caption": "", "figure": { "data": [], "layout": { "width": 600, "xaxis": { "visible": false }, "yaxis": { "visible": false }, "height": 335, "margin": { "b": 20, "l": 20, "r": 20, "t": 20 }, "shapes": [ { "x0": -5.0, "x1": 5.0, "y0": 5, "y1": 0, "line": { "color": "black" }, "type": "rect", "fillcolor": "lightblue" }, { "x0": -5.0, "x1": 5.0, "y0": 0, "y1": -5, "line": { "color": "black" }, "type": "rect", "fillcolor": "lightblue" }, { "x0": -5.0, "x1": 5.0, "y0": -5, "y1": -10, "line": { "color": "black" }, "type": "rect", "fillcolor": "lightblue" }, { "x0": -150, "x1": 150, "y0": -160, "y1": -110, "line": { "color": "black" }, "type": "rect", "fillcolor": "lightgreen" }, { "x0": -5.0, "x1": 5.0, "y0": -10, "y1": -15, "line": { "color": "black" }, "type": "rect", "fillcolor": "lightblue" }, { "x0": -5.0, "x1": 5.0, "y0": -15, "y1": -20, "line": { "color": "black" }, "type": "rect", "fillcolor": "lightblue" }, { "x0": -150, "x1": 150, "y0": -170, "y1": -120, "line": { "color": "black" }, "type": "rect", "fillcolor": "lightgreen" }, { "x0": -5.0, "x1": 5.0, "y0": -20, "y1": -25, "line": { "color": "black" }, "type": "rect", "fillcolor": "lightblue" }, { "x0": -5.0, "x1": 5.0, "y0": -25, "y1": -30, "line": { "color": "black" }, "type": "rect", "fillcolor": "lightblue" } ], "template": { "data": { "bar": [ { "type": "bar", "marker": { "line": { "color": "#E5ECF6", "width": 0.5 }, "pattern": { "size": 10, "fillmode": "overlay", "solidity": 0.2 } }, "error_x": { "color": "#2a3f5f" }, "error_y": { "color": "#2a3f5f" } } ], "pie": [ { "type": "pie", "automargin": true } ], "table": [ { "type": "table", "cells": { "fill": { "color": "#EBF0F8" }, "line": { "color": "white" } }, "header": { "fill": { "color": "#C8D4E3" }, "line": { "color": "white" } } } ], "carpet": [ { "type": "carpet", "aaxis": { "gridcolor": "white", "linecolor": "white", "endlinecolor": "#2a3f5f", "minorgridcolor": "white", "startlinecolor": "#2a3f5f" }, "baxis": { "gridcolor": "white", "linecolor": "white", "endlinecolor": "#2a3f5f", "minorgridcolor": "white", "startlinecolor": "#2a3f5f" } } ], "mesh3d": [ { "type": "mesh3d", "colorbar": { "ticks": "", "outlinewidth": 0 } } ], "contour": [ { "type": "contour", "colorbar": { "ticks": "", "outlinewidth": 0 }, "colorscale": [ [ 0.0, "#0d0887" ], [ 0.1111111111111111, "#46039f" ], [ 0.2222222222222222, "#7201a8" ], [ 0.3333333333333333, "#9c179e" ], [ 0.4444444444444444, "#bd3786" ], [ 0.5555555555555556, "#d8576b" ], [ 0.6666666666666666, "#ed7953" ], [ 0.7777777777777778, "#fb9f3a" ], [ 0.8888888888888888, "#fdca26" ], [ 1.0, "#f0f921" ] ] } ], "heatmap": [ { "type": "heatmap", "colorbar": { "ticks": "", "outlinewidth": 0 }, "colorscale": [ [ 0.0, "#0d0887" ], [ 0.1111111111111111, "#46039f" ], [ 0.2222222222222222, "#7201a8" ], [ 0.3333333333333333, "#9c179e" ], [ 0.4444444444444444, "#bd3786" ], [ 0.5555555555555556, "#d8576b" ], [ 0.6666666666666666, "#ed7953" ], [ 0.7777777777777778, "#fb9f3a" ], [ 0.8888888888888888, "#fdca26" ], [ 1.0, "#f0f921" ] ] } ], "scatter": [ { "type": "scatter", "fillpattern": { "size": 10, "fillmode": "overlay", "solidity": 0.2 } } ], "surface": [ { "type": "surface", "colorbar": { "ticks": "", "outlinewidth": 0 }, "colorscale": [ [ 0.0, "#0d0887" ], [ 0.1111111111111111, "#46039f" ], [ 0.2222222222222222, "#7201a8" ], [ 0.3333333333333333, "#9c179e" ], [ 0.4444444444444444, "#bd3786" ], [ 0.5555555555555556, "#d8576b" ], [ 0.6666666666666666, "#ed7953" ], [ 0.7777777777777778, "#fb9f3a" ], [ 0.8888888888888888, "#fdca26" ], [ 1.0, "#f0f921" ] ] } ], "barpolar": [ { "type": "barpolar", "marker": { "line": { "color": "#E5ECF6", "width": 0.5 }, "pattern": { "size": 10, "fillmode": "overlay", "solidity": 0.2 } } } ], "heatmapgl": [ { "type": "heatmapgl", "colorbar": { "ticks": "", "outlinewidth": 0 }, "colorscale": [ [ 0.0, "#0d0887" ], [ 0.1111111111111111, "#46039f" ], [ 0.2222222222222222, "#7201a8" ], [ 0.3333333333333333, "#9c179e" ], [ 0.4444444444444444, "#bd3786" ], [ 0.5555555555555556, "#d8576b" ], [ 0.6666666666666666, "#ed7953" ], [ 0.7777777777777778, "#fb9f3a" ], [ 0.8888888888888888, "#fdca26" ], [ 1.0, "#f0f921" ] ] } ], "histogram": [ { "type": "histogram", "marker": { "pattern": { "size": 10, "fillmode": "overlay", "solidity": 0.2 } } } ], "parcoords": [ { "line": { "colorbar": { "ticks": "", "outlinewidth": 0 } }, "type": "parcoords" } ], "scatter3d": [ { "line": { "colorbar": { "ticks": "", "outlinewidth": 0 } }, "type": "scatter3d", "marker": { "colorbar": { "ticks": "", "outlinewidth": 0 } } } ], "scattergl": [ { "type": "scattergl", "marker": { "colorbar": { "ticks": "", "outlinewidth": 0 } } } ], "choropleth": [ { "type": "choropleth", "colorbar": { "ticks": "", "outlinewidth": 0 } } ], "scattergeo": [ { "type": "scattergeo", "marker": { "colorbar": { "ticks": "", "outlinewidth": 0 } } } ], "histogram2d": [ { "type": "histogram2d", "colorbar": { "ticks": "", "outlinewidth": 0 }, "colorscale": [ [ 0.0, "#0d0887" ], [ 0.1111111111111111, "#46039f" ], [ 0.2222222222222222, "#7201a8" ], [ 0.3333333333333333, "#9c179e" ], [ 0.4444444444444444, "#bd3786" ], [ 0.5555555555555556, "#d8576b" ], [ 0.6666666666666666, "#ed7953" ], [ 0.7777777777777778, "#fb9f3a" ], [ 0.8888888888888888, "#fdca26" ], [ 1.0, "#f0f921" ] ] } ], "scatterpolar": [ { "type": "scatterpolar", "marker": { "colorbar": { "ticks": "", "outlinewidth": 0 } } } ], "contourcarpet": [ { "type": "contourcarpet", "colorbar": { "ticks": "", "outlinewidth": 0 } } ], "scattercarpet": [ { "type": "scattercarpet", "marker": { "colorbar": { "ticks": "", "outlinewidth": 0 } } } ], "scattermapbox": [ { "type": "scattermapbox", "marker": { "colorbar": { "ticks": "", "outlinewidth": 0 } } } ], "scatterpolargl": [ { "type": "scatterpolargl", "marker": { "colorbar": { "ticks": "", "outlinewidth": 0 } } } ], "scatterternary": [ { "type": "scatterternary", "marker": { "colorbar": { "ticks": "", "outlinewidth": 0 } } } ], "histogram2dcontour": [ { "type": "histogram2dcontour", "colorbar": { "ticks": "", "outlinewidth": 0 }, "colorscale": [ [ 0.0, "#0d0887" ], [ 0.1111111111111111, "#46039f" ], [ 0.2222222222222222, "#7201a8" ], [ 0.3333333333333333, "#9c179e" ], [ 0.4444444444444444, "#bd3786" ], [ 0.5555555555555556, "#d8576b" ], [ 0.6666666666666666, "#ed7953" ], [ 0.7777777777777778, "#fb9f3a" ], [ 0.8888888888888888, "#fdca26" ], [ 1.0, "#f0f921" ] ] } ] }, "layout": { "geo": { "bgcolor": "white", "showland": true, "lakecolor": "white", "landcolor": "#E5ECF6", "showlakes": true, "subunitcolor": "white" }, "font": { "color": "#2a3f5f" }, "polar": { "bgcolor": "#E5ECF6", "radialaxis": { "ticks": "", "gridcolor": "white", "linecolor": "white" }, "angularaxis": { "ticks": "", "gridcolor": "white", "linecolor": "white" } }, "scene": { "xaxis": { "ticks": "", "gridcolor": "white", "gridwidth": 2, "linecolor": "white", "zerolinecolor": "white", "showbackground": true, "backgroundcolor": "#E5ECF6" }, "yaxis": { "ticks": "", "gridcolor": "white", "gridwidth": 2, "linecolor": "white", "zerolinecolor": "white", "showbackground": true, "backgroundcolor": "#E5ECF6" }, "zaxis": { "ticks": "", "gridcolor": "white", "gridwidth": 2, "linecolor": "white", "zerolinecolor": "white", "showbackground": true, "backgroundcolor": "#E5ECF6" } }, "title": { "x": 0.05 }, "xaxis": { "ticks": "", "title": { "standoff": 15 }, "gridcolor": "white", "linecolor": "white", "automargin": true, "zerolinecolor": "white", "zerolinewidth": 2 }, "yaxis": { "ticks": "", "title": { "standoff": 15 }, "gridcolor": "white", "linecolor": "white", "automargin": true, "zerolinecolor": "white", "zerolinewidth": 2 }, "mapbox": { "style": "light" }, "ternary": { "aaxis": { "ticks": "", "gridcolor": "white", "linecolor": "white" }, "baxis": { "ticks": "", "gridcolor": "white", "linecolor": "white" }, "caxis": { "ticks": "", "gridcolor": "white", "linecolor": "white" }, "bgcolor": "#E5ECF6" }, "colorway": [ "#636efa", "#EF553B", "#00cc96", "#ab63fa", "#FFA15A", "#19d3f3", "#FF6692", "#B6E880", "#FF97FF", "#FECB52" ], "coloraxis": { "colorbar": { "ticks": "", "outlinewidth": 0 } }, "hovermode": "closest", "colorscale": { "diverging": [ [ 0, "#8e0152" ], [ 0.1, "#c51b7d" ], [ 0.2, "#de77ae" ], [ 0.3, "#f1b6da" ], [ 0.4, "#fde0ef" ], [ 0.5, "#f7f7f7" ], [ 0.6, "#e6f5d0" ], [ 0.7, "#b8e186" ], [ 0.8, "#7fbc41" ], [ 0.9, "#4d9221" ], [ 1, "#276419" ] ], "sequential": [ [ 0.0, "#0d0887" ], [ 0.1111111111111111, "#46039f" ], [ 0.2222222222222222, "#7201a8" ], [ 0.3333333333333333, "#9c179e" ], [ 0.4444444444444444, "#bd3786" ], [ 0.5555555555555556, "#d8576b" ], [ 0.6666666666666666, "#ed7953" ], [ 0.7777777777777778, "#fb9f3a" ], [ 0.8888888888888888, "#fdca26" ], [ 1.0, "#f0f921" ] ], "sequentialminus": [ [ 0.0, "#0d0887" ], [ 0.1111111111111111, "#46039f" ], [ 0.2222222222222222, "#7201a8" ], [ 0.3333333333333333, "#9c179e" ], [ 0.4444444444444444, "#bd3786" ], [ 0.5555555555555556, "#d8576b" ], [ 0.6666666666666666, "#ed7953" ], [ 0.7777777777777778, "#fb9f3a" ], [ 0.8888888888888888, "#fdca26" ], [ 1.0, "#f0f921" ] ] }, "hoverlabel": { "align": "left" }, "plot_bgcolor": "#E5ECF6", "paper_bgcolor": "white", "shapedefaults": { "line": { "color": "#2a3f5f" } }, "autotypenumbers": "strict", "annotationdefaults": { "arrowhead": 0, "arrowcolor": "#2a3f5f", "arrowwidth": 1 } } }, "annotations": [ { "x": 0, "y": 2.5, "font": { "size": 12 }, "text": "Farm 1<br>Region A<br>Batch: Milk consignment 1", "showarrow": false }, { "x": 0, "y": -5, "ax": 0, "ay": -35, "text": "", "arrowhead": 2, "showarrow": true }, { "x": 0, "y": -2.5, "font": { "size": 12 }, "text": "Collection company<br>Region A<br>Batch: Milk consignment 6", "showarrow": false }, { "x": 0, "y": -10, "ax": 0, "ay": -40, "text": "", "arrowhead": 2, "showarrow": true }, { "x": 0, "y": -7.5, "font": { "size": 12 }, "text": "Milk supplier<br>Region A<br>Batch: Milk batch 1", "showarrow": false }, { "x": 0, "y": -15, "ax": 0, "ay": -45, "text": "", "arrowhead": 2, "showarrow": true }, { "x": 0, "y": -135.0, "font": { "size": 11 }, "text": "Sample<br>Batch: Milk batch 1<br>Date: 2024-12-07<br>Type: Own check<br>Pathogen: Negative", "showarrow": false }, { "x": 0, "y": -10, "ax": 0, "ay": -100, "text": "", "arrowhead": 2, "showarrow": true }, { "x": 0, "y": -12.5, "font": { "size": 12 }, "text": "Cheese producer 1<br>Region B<br>Batch: Cheese batch 1", "showarrow": false }, { "x": 0, "y": -20, "ax": 0, "ay": -50, "text": "", "arrowhead": 2, "showarrow": true }, { "x": 0, "y": -17.5, "font": { "size": 12 }, "text": "Wholesaler 1<br>Region B<br>Batch: Cheese batch 1", "showarrow": false }, { "x": 0, "y": -25, "ax": 0, "ay": -55, "text": "", "arrowhead": 2, "showarrow": true }, { "x": 0, "y": -145.0, "font": { "size": 11 }, "text": "Sample<br>Batch: Cheese batch 1<br>Date: 2024-12-12<br>Type: Own check<br>Pathogen: Negative", "showarrow": false }, { "x": 0, "y": -20, "ax": 0, "ay": -110, "text": "", "arrowhead": 2, "showarrow": true }, { "x": 0, "y": -22.5, "font": { "size": 12 }, "text": "Wholesaler 4<br>Region B<br>Batch: Cheese batch 1", "showarrow": false }, { "x": 0, "y": -30, "ax": 0, "ay": -60, "text": "", "arrowhead": 2, "showarrow": true }, { "x": 0, "y": -27.5, "font": { "size": 12 }, "text": "Wholesalers in region B<br>Region B<br>Batch: Cheese batch 1", "showarrow": false } ] } }, "height": 335, "width": 600, "user": { "profile_url": "https://chart-studio.plotly.com/~baldassa.simone", "avatar_url": "https://storage.googleapis.com/plotly-prod-profiles/33.jpg", "background_url": "https://storage.googleapis.com/plotly-prod-profiles/bg-1.jpg", "bio": "", "nickname": "", "website": "", "stream_tokens": null, "feature_set_id": null, "csrf_token": null, "date_joined": "2025-04-23 08:46:06", "mapbox_access_tokens": null, "has_password": null, "username": "baldassa.simone", "email": null, "is_active": null, "readonly": null, "is_dash_creator": null, "dash_created_count": null, "is_chart_creator": null, "charts_created_count": null } }, { "creation_time": "2025-06-10T13:35:34.779608Z", "comments": { "results": [], "count": 0 }, "parented": true, "embed_url": "https://chart-studio.plotly.com/~Osss/1.embed", "fid": "Osss:1", "filename": "Plot 1", "filetype": "plot", "img_url": "https://api.plotly.com/v2/files/Osss:1/image?image_name=list-thumb", "image_urls": { "default": "https://api.plotly.com/v2/files/Osss:1/image?image_name=default", "block-thumb": "https://api.plotly.com/v2/files/Osss:1/image?image_name=block-thumb", "list-thumb": "https://api.plotly.com/v2/files/Osss:1/image?image_name=list-thumb" }, "api_urls": { "files": "https://api.plotly.com/v2/files/Osss:1", "plots": "https://api.plotly.com/v2/plots/Osss:1", "parent": "https://api.plotly.com/v2/folders/home?user=Osss" }, "owner": "Osss", "parent": -1, "preview": "", "referencers": [], "references": [], "title": "", "views": 0, "web_url": "https://chart-studio.plotly.com/~Osss/1/", "world_readable": true, "date_modified": "2025-06-10T13:35:34.794Z", "stars": { "results": [], "count": 0 }, "collaborators": { "results": [], "count": 0 }, "subfolder_count": null, "refresh_interval": null, "organize_view_url": "https://chart-studio.plotly.com/~Osss/1/", "current_user_permission": "read", "is_theme": null, "is_template": false, "autosize": true, "caption": "", "figure": { "data": [ { "meta": { "columnNames": { "x": "A", "y": "B" } }, "mode": "markers", "type": "scatter", "xsrc": "Osss:0:8bfee3", "ysrc": "Osss:0:e02338" } ], "frames": [], "layout": { "xaxis": { "type": "linear", "range": [ 4.11360294117647, 4.78639705882353 ], "title": { "text": "wind speed (m/s)" }, "autorange": false }, "yaxis": { "type": "linear", "range": [ 2.6226566757493193, 2.967343324250681 ], "title": { "text": "volt before suction (v)" }, "autorange": false }, "autosize": true, "template": { "data": { "bar": [ { "type": "bar", "marker": { "colorbar": { "ticks": "", "outlinewidth": 0 } } } ], "table": [ { "type": "table", "cells": { "fill": { "color": "#EBF0F8" }, "line": { "color": "white" } }, "header": { "fill": { "color": "#C8D4E3" }, "line": { "color": "white" } } } ], "carpet": [ { "type": "carpet", "aaxis": { "gridcolor": "#C8D4E3", "linecolor": "#C8D4E3", "endlinecolor": "#2a3f5f", "minorgridcolor": "#C8D4E3", "startlinecolor": "#2a3f5f" }, "baxis": { "gridcolor": "#C8D4E3", "linecolor": "#C8D4E3", "endlinecolor": "#2a3f5f", "minorgridcolor": "#C8D4E3", "startlinecolor": "#2a3f5f" } } ], "mesh3d": [ { "type": "mesh3d", "colorbar": { "ticks": "", "outlinewidth": 0 } } ], "contour": [ { "type": "contour", "colorbar": { "ticks": "", "outlinewidth": 0 }, "autocolorscale": true } ], "heatmap": [ { "type": "heatmap", "colorbar": { "ticks": "", "outlinewidth": 0 }, "autocolorscale": true } ], "scatter": [ { "type": "scatter", "marker": { "colorbar": { "ticks": "", "outlinewidth": 0 } } } ], "surface": [ { "type": "surface", "colorbar": { "ticks": "", "outlinewidth": 0 } } ], "heatmapgl": [ { "type": "heatmapgl", "colorbar": { "ticks": "", "outlinewidth": 0 } } ], "histogram": [ { "type": "histogram", "marker": { "colorbar": { "ticks": "", "outlinewidth": 0 } } } ], "parcoords": [ { "line": { "colorbar": { "ticks": "", "outlinewidth": 0 } }, "type": "parcoords" } ], "scatter3d": [ { "type": "scatter3d", "marker": { "colorbar": { "ticks": "", "outlinewidth": 0 } } } ], "scattergl": [ { "type": "scattergl", "marker": { "colorbar": { "ticks": "", "outlinewidth": 0 } } } ], "choropleth": [ { "type": "choropleth", "colorbar": { "ticks": "", "outlinewidth": 0 } } ], "scattergeo": [ { "type": "scattergeo", "marker": { "colorbar": { "ticks": "", "outlinewidth": 0 } } } ], "histogram2d": [ { "type": "histogram2d", "colorbar": { "ticks": "", "outlinewidth": 0 }, "autocolorscale": true } ], "scatterpolar": [ { "type": "scatterpolar", "marker": { "colorbar": { "ticks": "", "outlinewidth": 0 } } } ], "contourcarpet": [ { "type": "contourcarpet", "colorbar": { "ticks": "", "outlinewidth": 0 } } ], "scattercarpet": [ { "type": "scattercarpet", "marker": { "colorbar": { "ticks": "", "outlinewidth": 0 } } } ], "scattermapbox": [ { "type": "scattermapbox", "marker": { "colorbar": { "ticks": "", "outlinewidth": 0 } } } ], "scatterpolargl": [ { "type": "scatterpolargl", "marker": { "colorbar": { "ticks": "", "outlinewidth": 0 } } } ], "scatterternary": [ { "type": "scatterternary", "marker": { "colorbar": { "ticks": "", "outlinewidth": 0 } } } ], "histogram2dcontour": [ { "type": "histogram2dcontour", "colorbar": { "ticks": "", "outlinewidth": 0 }, "autocolorscale": true } ] }, "layout": { "geo": { "bgcolor": "white", "showland": true, "lakecolor": "white", "landcolor": "white", "showlakes": true, "subunitcolor": "#C8D4E3" }, "font": { "color": "#2a3f5f" }, "polar": { "bgcolor": "white", "radialaxis": { "ticks": "", "gridcolor": "#EBF0F8", "linecolor": "#EBF0F8" }, "angularaxis": { "ticks": "", "gridcolor": "#EBF0F8", "linecolor": "#EBF0F8" } }, "scene": { "xaxis": { "ticks": "", "gridcolor": "#DFE8F3", "gridwidth": 2, "linecolor": "#EBF0F8", "zerolinecolor": "#EBF0F8", "showbackground": true, "backgroundcolor": "white" }, "yaxis": { "ticks": "", "gridcolor": "#DFE8F3", "gridwidth": 2, "linecolor": "#EBF0F8", "zerolinecolor": "#EBF0F8", "showbackground": true, "backgroundcolor": "white" }, "zaxis": { "ticks": "", "gridcolor": "#DFE8F3", "gridwidth": 2, "linecolor": "#EBF0F8", "zerolinecolor": "#EBF0F8", "showbackground": true, "backgroundcolor": "white" } }, "title": { "x": 0.05 }, "xaxis": { "ticks": "", "gridcolor": "#EBF0F8", "linecolor": "#EBF0F8", "automargin": true, "zerolinecolor": "#EBF0F8", "zerolinewidth": 2 }, "yaxis": { "ticks": "", "gridcolor": "#EBF0F8", "linecolor": "#EBF0F8", "automargin": true, "zerolinecolor": "#EBF0F8", "zerolinewidth": 2 }, "ternary": { "aaxis": { "ticks": "", "gridcolor": "#DFE8F3", "linecolor": "#A2B1C6" }, "baxis": { "ticks": "", "gridcolor": "#DFE8F3", "linecolor": "#A2B1C6" }, "caxis": { "ticks": "", "gridcolor": "#DFE8F3", "linecolor": "#A2B1C6" }, "bgcolor": "white" }, "colorway": [ "#636efa", "#EF553B", "#00cc96", "#ab63fa", "#19d3f3", "#e763fa", "#fecb52", "#ffa15a", "#ff6692", "#b6e880" ], "hovermode": "closest", "colorscale": { "diverging": [ [ 0, "#8e0152" ], [ 0.1, "#c51b7d" ], [ 0.2, "#de77ae" ], [ 0.3, "#f1b6da" ], [ 0.4, "#fde0ef" ], [ 0.5, "#f7f7f7" ], [ 0.6, "#e6f5d0" ], [ 0.7, "#b8e186" ], [ 0.8, "#7fbc41" ], [ 0.9, "#4d9221" ], [ 1, "#276419" ] ], "sequential": [ [ 0, "#0508b8" ], [ 0.0893854748603352, "#1910d8" ], [ 0.1787709497206704, "#3c19f0" ], [ 0.2681564245810056, "#6b1cfb" ], [ 0.3575418994413408, "#981cfd" ], [ 0.44692737430167595, "#bf1cfd" ], [ 0.5363128491620112, "#dd2bfd" ], [ 0.6256983240223464, "#f246fe" ], [ 0.7150837988826816, "#fc67fd" ], [ 0.8044692737430168, "#fe88fc" ], [ 0.8938547486033519, "#fea5fd" ], [ 0.9832402234636871, "#febefe" ], [ 1, "#fec3fe" ] ], "sequentialminus": [ [ 0, "#0508b8" ], [ 0.0893854748603352, "#1910d8" ], [ 0.1787709497206704, "#3c19f0" ], [ 0.2681564245810056, "#6b1cfb" ], [ 0.3575418994413408, "#981cfd" ], [ 0.44692737430167595, "#bf1cfd" ], [ 0.5363128491620112, "#dd2bfd" ], [ 0.6256983240223464, "#f246fe" ], [ 0.7150837988826816, "#fc67fd" ], [ 0.8044692737430168, "#fe88fc" ], [ 0.8938547486033519, "#fea5fd" ], [ 0.9832402234636871, "#febefe" ], [ 1, "#fec3fe" ] ] }, "plot_bgcolor": "white", "paper_bgcolor": "white", "shapedefaults": { "line": { "width": 0 }, "opacity": 0.4, "fillcolor": "#506784" }, "annotationdefaults": { "arrowhead": 0, "arrowcolor": "#506784", "arrowwidth": 1 } }, "themeRef": "PLOTLY_WHITE" } } }, "height": null, "width": null, "user": { "profile_url": "https://chart-studio.plotly.com/~Osss", "avatar_url": "https://storage.googleapis.com/plotly-prod-profiles/76.jpg", "background_url": "https://storage.googleapis.com/plotly-prod-profiles/bg-12.jpg", "bio": "", "nickname": "", "website": "", "stream_tokens": null, "feature_set_id": null, "csrf_token": null, "date_joined": "2025-06-10 13:34:19", "mapbox_access_tokens": null, "has_password": null, "username": "Osss", "email": null, "is_active": null, "readonly": null, "is_dash_creator": null, "dash_created_count": null, "is_chart_creator": null, "charts_created_count": null } }, { "creation_time": "2025-06-10T13:28:25.025348Z", "comments": { "results": [], "count": 0 }, "parented": true, "embed_url": "https://chart-studio.plotly.com/~fy83xiza/1.embed", "fid": "fy83xiza:1", "filename": "Plot 1", "filetype": "plot", "img_url": "https://api.plotly.com/v2/files/fy83xiza:1/image?image_name=list-thumb", "image_urls": { "default": "https://storage.googleapis.com/plotly-prod-images/fy83xiza/1/2_WBPURW2AK7C6KCOP8TDI2F604NIC99.png", "block-thumb": "https://api.plotly.com/v2/files/fy83xiza:1/image?image_name=block-thumb", "list-thumb": "https://api.plotly.com/v2/files/fy83xiza:1/image?image_name=list-thumb" }, "api_urls": { "files": "https://api.plotly.com/v2/files/fy83xiza:1", "plots": "https://api.plotly.com/v2/plots/fy83xiza:1", "parent": "https://api.plotly.com/v2/folders/home?user=fy83xiza" }, "owner": "fy83xiza", "parent": -1, "preview": "", "referencers": [], "references": [], "title": "", "views": 0, "web_url": "https://chart-studio.plotly.com/~fy83xiza/1/", "world_readable": true, "date_modified": "2025-06-10T13:28:25.038Z", "stars": { "results": [], "count": 0 }, "collaborators": { "results": [], "count": 0 }, "subfolder_count": null, "refresh_interval": null, "organize_view_url": "https://chart-studio.plotly.com/~fy83xiza/1/", "current_user_permission": "read", "is_theme": null, "is_template": false, "autosize": true, "caption": "", "figure": { "data": [ { "meta": { "columnNames": { "x": "A", "y": "B", "marker": { "color": "A" } } }, "mode": "markers", "type": "bar", "xsrc": "fy83xiza:0:d3c059", "ysrc": "fy83xiza:0:49d266", "marker": { "meta": { "columnNames": { "color": "A" } }, "colorsrc": "fy83xiza:0:d3c059" }, "orientation": "v" } ], "frames": [], "layout": { "title": { "text": "Least Used Features" }, "xaxis": { "type": "linear", "range": [ 13, 26 ], "autorange": true }, "yaxis": { "type": "category", "range": [ -0.22222222222222227, 4.222222222222222 ], "autorange": true }, "barmode": "group", "template": { "data": { "bar": [ { "type": "bar", "marker": { "colorbar": { "ticks": "", "outlinewidth": 0 } } } ], "table": [ { "type": "table", "cells": { "fill": { "color": "#EBF0F8" }, "line": { "color": "white" } }, "header": { "fill": { "color": "#C8D4E3" }, "line": { "color": "white" } } } ], "carpet": [ { "type": "carpet", "aaxis": { "gridcolor": "#C8D4E3", "linecolor": "#C8D4E3", "endlinecolor": "#2a3f5f", "minorgridcolor": "#C8D4E3", "startlinecolor": "#2a3f5f" }, "baxis": { "gridcolor": "#C8D4E3", "linecolor": "#C8D4E3", "endlinecolor": "#2a3f5f", "minorgridcolor": "#C8D4E3", "startlinecolor": "#2a3f5f" } } ], "mesh3d": [ { "type": "mesh3d", "colorbar": { "ticks": "", "outlinewidth": 0 } } ], "contour": [ { "type": "contour", "colorbar": { "ticks": "", "outlinewidth": 0 }, "autocolorscale": true } ], "heatmap": [ { "type": "heatmap", "colorbar": { "ticks": "", "outlinewidth": 0 }, "autocolorscale": true } ], "scatter": [ { "type": "scatter", "marker": { "colorbar": { "ticks": "", "outlinewidth": 0 } } } ], "surface": [ { "type": "surface", "colorbar": { "ticks": "", "outlinewidth": 0 } } ], "heatmapgl": [ { "type": "heatmapgl", "colorbar": { "ticks": "", "outlinewidth": 0 } } ], "histogram": [ { "type": "histogram", "marker": { "colorbar": { "ticks": "", "outlinewidth": 0 } } } ], "parcoords": [ { "line": { "colorbar": { "ticks": "", "outlinewidth": 0 } }, "type": "parcoords" } ], "scatter3d": [ { "type": "scatter3d", "marker": { "colorbar": { "ticks": "", "outlinewidth": 0 } } } ], "scattergl": [ { "type": "scattergl", "marker": { "colorbar": { "ticks": "", "outlinewidth": 0 } } } ], "choropleth": [ { "type": "choropleth", "colorbar": { "ticks": "", "outlinewidth": 0 } } ], "scattergeo": [ { "type": "scattergeo", "marker": { "colorbar": { "ticks": "", "outlinewidth": 0 } } } ], "histogram2d": [ { "type": "histogram2d", "colorbar": { "ticks": "", "outlinewidth": 0 }, "autocolorscale": true } ], "scatterpolar": [ { "type": "scatterpolar", "marker": { "colorbar": { "ticks": "", "outlinewidth": 0 } } } ], "contourcarpet": [ { "type": "contourcarpet", "colorbar": { "ticks": "", "outlinewidth": 0 } } ], "scattercarpet": [ { "type": "scattercarpet", "marker": { "colorbar": { "ticks": "", "outlinewidth": 0 } } } ], "scattermapbox": [ { "type": "scattermapbox", "marker": { "colorbar": { "ticks": "", "outlinewidth": 0 } } } ], "scatterpolargl": [ { "type": "scatterpolargl", "marker": { "colorbar": { "ticks": "", "outlinewidth": 0 } } } ], "scatterternary": [ { "type": "scatterternary", "marker": { "colorbar": { "ticks": "", "outlinewidth": 0 } } } ], "histogram2dcontour": [ { "type": "histogram2dcontour", "colorbar": { "ticks": "", "outlinewidth": 0 }, "autocolorscale": true } ] }, "layout": { "geo": { "bgcolor": "white", "showland": true, "lakecolor": "white", "landcolor": "white", "showlakes": true, "subunitcolor": "#C8D4E3" }, "font": { "color": "#2a3f5f" }, "polar": { "bgcolor": "white", "radialaxis": { "ticks": "", "gridcolor": "#EBF0F8", "linecolor": "#EBF0F8" }, "angularaxis": { "ticks": "", "gridcolor": "#EBF0F8", "linecolor": "#EBF0F8" } }, "scene": { "xaxis": { "ticks": "", "gridcolor": "#DFE8F3", "gridwidth": 2, "linecolor": "#EBF0F8", "zerolinecolor": "#EBF0F8", "showbackground": true, "backgroundcolor": "white" }, "yaxis": { "ticks": "", "gridcolor": "#DFE8F3", "gridwidth": 2, "linecolor": "#EBF0F8", "zerolinecolor": "#EBF0F8", "showbackground": true, "backgroundcolor": "white" }, "zaxis": { "ticks": "", "gridcolor": "#DFE8F3", "gridwidth": 2, "linecolor": "#EBF0F8", "zerolinecolor": "#EBF0F8", "showbackground": true, "backgroundcolor": "white" } }, "title": { "x": 0.05 }, "xaxis": { "ticks": "", "gridcolor": "#EBF0F8", "linecolor": "#EBF0F8", "automargin": true, "zerolinecolor": "#EBF0F8", "zerolinewidth": 2 }, "yaxis": { "ticks": "", "gridcolor": "#EBF0F8", "linecolor": "#EBF0F8", "automargin": true, "zerolinecolor": "#EBF0F8", "zerolinewidth": 2 }, "ternary": { "aaxis": { "ticks": "", "gridcolor": "#DFE8F3", "linecolor": "#A2B1C6" }, "baxis": { "ticks": "", "gridcolor": "#DFE8F3", "linecolor": "#A2B1C6" }, "caxis": { "ticks": "", "gridcolor": "#DFE8F3", "linecolor": "#A2B1C6" }, "bgcolor": "white" }, "colorway": [ "#636efa", "#EF553B", "#00cc96", "#ab63fa", "#19d3f3", "#e763fa", "#fecb52", "#ffa15a", "#ff6692", "#b6e880" ], "hovermode": "closest", "colorscale": { "diverging": [ [ 0, "#8e0152" ], [ 0.1, "#c51b7d" ], [ 0.2, "#de77ae" ], [ 0.3, "#f1b6da" ], [ 0.4, "#fde0ef" ], [ 0.5, "#f7f7f7" ], [ 0.6, "#e6f5d0" ], [ 0.7, "#b8e186" ], [ 0.8, "#7fbc41" ], [ 0.9, "#4d9221" ], [ 1, "#276419" ] ], "sequential": [ [ 0, "#0508b8" ], [ 0.0893854748603352, "#1910d8" ], [ 0.1787709497206704, "#3c19f0" ], [ 0.2681564245810056, "#6b1cfb" ], [ 0.3575418994413408, "#981cfd" ], [ 0.44692737430167595, "#bf1cfd" ], [ 0.5363128491620112, "#dd2bfd" ], [ 0.6256983240223464, "#f246fe" ], [ 0.7150837988826816, "#fc67fd" ], [ 0.8044692737430168, "#fe88fc" ], [ 0.8938547486033519, "#fea5fd" ], [ 0.9832402234636871, "#febefe" ], [ 1, "#fec3fe" ] ], "sequentialminus": [ [ 0, "#0508b8" ], [ 0.0893854748603352, "#1910d8" ], [ 0.1787709497206704, "#3c19f0" ], [ 0.2681564245810056, "#6b1cfb" ], [ 0.3575418994413408, "#981cfd" ], [ 0.44692737430167595, "#bf1cfd" ], [ 0.5363128491620112, "#dd2bfd" ], [ 0.6256983240223464, "#f246fe" ], [ 0.7150837988826816, "#fc67fd" ], [ 0.8044692737430168, "#fe88fc" ], [ 0.8938547486033519, "#fea5fd" ], [ 0.9832402234636871, "#febefe" ], [ 1, "#fec3fe" ] ] }, "plot_bgcolor": "white", "paper_bgcolor": "white", "shapedefaults": { "line": { "width": 0 }, "opacity": 0.4, "fillcolor": "#506784" }, "annotationdefaults": { "arrowhead": 0, "arrowcolor": "#506784", "arrowwidth": 1 } }, "themeRef": "PLOTLY_WHITE" }, "bargroupgap": 0.14 } }, "height": null, "width": null, "user": { "profile_url": "https://chart-studio.plotly.com/~fy83xiza", "avatar_url": "https://storage.googleapis.com/plotly-prod-profiles/66.jpg", "background_url": "https://storage.googleapis.com/plotly-prod-profiles/bg-10.jpg", "bio": "", "nickname": "", "website": "", "stream_tokens": null, "feature_set_id": null, "csrf_token": null, "date_joined": "2025-06-10 09:35:38", "mapbox_access_tokens": null, "has_password": null, "username": "fy83xiza", "email": null, "is_active": null, "readonly": null, "is_dash_creator": null, "dash_created_count": null, "is_chart_creator": null, "charts_created_count": null } }, { "creation_time": "2025-06-10T13:21:53.643494Z", "comments": { "results": [], "count": 0 }, "parented": true, "embed_url": "https://chart-studio.plotly.com/~SchatzJ/1.embed", "fid": "SchatzJ:1", "filename": "Niederschlagshöhen - Kreis Viersen - Test_1", "filetype": "plot", "img_url": "https://api.plotly.com/v2/files/SchatzJ:1/image?image_name=list-thumb", "image_urls": { "default": "https://api.plotly.com/v2/files/SchatzJ:1/image?image_name=default", "block-thumb": "https://storage.googleapis.com/plotly-prod-images/SchatzJ/1/8_DKLTTAMRZG9Z79HA1KHLGKM1QIA4OM.png", "list-thumb": "https://api.plotly.com/v2/files/SchatzJ:1/image?image_name=list-thumb" }, "api_urls": { "files": "https://api.plotly.com/v2/files/SchatzJ:1", "plots": "https://api.plotly.com/v2/plots/SchatzJ:1", "parent": "https://api.plotly.com/v2/folders/home?user=SchatzJ" }, "owner": "SchatzJ", "parent": -1, "preview": "", "referencers": [], "references": [], "title": "", "views": 0, "web_url": "https://chart-studio.plotly.com/~SchatzJ/1/", "world_readable": true, "date_modified": "2025-06-10T13:21:53.654Z", "stars": { "results": [], "count": 0 }, "collaborators": { "results": [], "count": 0 }, "subfolder_count": null, "refresh_interval": null, "organize_view_url": "https://chart-studio.plotly.com/~SchatzJ/1/", "current_user_permission": "read", "is_theme": null, "is_template": false, "autosize": true, "caption": "", "figure": { "data": [ { "meta": { "columnNames": { "x": "data.0.x", "y": "data.0.y" } }, "name": "Monatliche Niederschlagssummen", "type": "bar", "xsrc": "SchatzJ:0:e2d439", "ysrc": "SchatzJ:0:dc3d1f", "visible": false, "hovertemplate": "Datum = %{x} <br>Niederschlag = mm%{y:.2f}" }, { "meta": { "columnNames": { "x": "data.1.x", "y": "data.1.y" } }, "mode": "lines", "name": "Trendlinie ab 1952", "type": "scatter", "xsrc": "SchatzJ:0:f663f0", "ysrc": "SchatzJ:0:3c418a", "visible": false, "hovertemplate": "Datum = %{x} <br>Niederschlag = mm%{y:.2f}" }, { "meta": { "columnNames": { "x": "data.2.x", "y": "data.2.y" } }, "mode": "lines", "name": "Trendlinie ab 1990", "type": "scatter", "xsrc": "SchatzJ:0:a41002", "ysrc": "SchatzJ:0:c02551", "visible": false, "hovertemplate": "Datum = %{x} <br>Niederschlag = mm%{y:.2f}" }, { "meta": { "columnNames": { "x": "data.3.x", "y": "data.3.y" } }, "name": "Frühling", "type": "bar", "xsrc": "SchatzJ:0:c1d8ff", "ysrc": "SchatzJ:0:16a308", "visible": false, "hovertemplate": "Datum = %{x} <br>Niederschlag = mm%{y:.2f}" }, { "meta": { "columnNames": { "x": "data.4.x", "y": "data.4.y" } }, "name": "Sommer", "type": "bar", "xsrc": "SchatzJ:0:210783", "ysrc": "SchatzJ:0:26d1f4", "visible": false, "hovertemplate": "Datum = %{x} <br>Niederschlag = mm%{y:.2f}" }, { "meta": { "columnNames": { "x": "data.5.x", "y": "data.5.y" } }, "name": "Herbst", "type": "bar", "xsrc": "SchatzJ:0:e7e1ba", "ysrc": "SchatzJ:0:38fd61", "visible": false, "hovertemplate": "Datum = %{x} <br>Niederschlag = mm%{y:.2f}" }, { "meta": { "columnNames": { "x": "data.6.x", "y": "data.6.y" } }, "name": "Winter", "type": "bar", "xsrc": "SchatzJ:0:16223a", "ysrc": "SchatzJ:0:a1846b", "visible": false, "hovertemplate": "Datum = %{x} <br>Niederschlag = mm%{y:.2f}" }, { "meta": { "columnNames": { "x": "data.7.x", "y": "data.7.y" } }, "name": "Jährliche Niederschlagssummen", "type": "bar", "xsrc": "SchatzJ:0:5af478", "ysrc": "SchatzJ:0:d46d3e", "visible": true, "hovertemplate": "Datum = %{x} <br>Niederschlag = mm%{y:.2f}" }, { "meta": { "columnNames": { "x": "data.8.x", "y": "data.8.y" } }, "mode": "lines", "name": "Trendlinie ab 1952", "type": "scatter", "xsrc": "SchatzJ:0:2d5498", "ysrc": "SchatzJ:0:555ed6", "visible": true, "hovertemplate": "Datum = %{x} <br>Niederschlag = mm%{y:.2f}" }, { "meta": { "columnNames": { "x": "data.9.x", "y": "data.9.y" } }, "mode": "lines", "name": "Trendlinie ab 1990", "type": "scatter", "xsrc": "SchatzJ:0:8010e8", "ysrc": "SchatzJ:0:6fb02f", "visible": true, "hovertemplate": "Datum = %{x} <br>Niederschlag = mm%{y:.2f}" }, { "meta": { "columnNames": { "x": "data.10.x", "y": "data.10.y" } }, "mode": "lines", "name": "Trendlinie Frühling", "type": "scatter", "xsrc": "SchatzJ:0:d4867c", "ysrc": "SchatzJ:0:c17e46", "visible": false, "hovertemplate": "Datum = %{x} <br>Niederschlag = mm%{y:.2f}" }, { "meta": { "columnNames": { "x": "data.11.x", "y": "data.11.y" } }, "mode": "lines", "name": "Trendlinie Sommer", "type": "scatter", "xsrc": "SchatzJ:0:27db18", "ysrc": "SchatzJ:0:6293c6", "visible": false, "hovertemplate": "Datum = %{x} <br>Niederschlag = mm%{y:.2f}" }, { "meta": { "columnNames": { "x": "data.12.x", "y": "data.12.y" } }, "mode": "lines", "name": "Trendlinie Herbst", "type": "scatter", "xsrc": "SchatzJ:0:7903a0", "ysrc": "SchatzJ:0:78cb0c", "visible": false, "hovertemplate": "Datum = %{x} <br>Niederschlag = mm%{y:.2f}" }, { "meta": { "columnNames": { "x": "data.13.x", "y": "data.13.y" } }, "mode": "lines", "name": "Trendlinie Winter", "type": "scatter", "xsrc": "SchatzJ:0:989c6f", "ysrc": "SchatzJ:0:e9ce9a", "visible": false, "hovertemplate": "Datum = %{x} <br>Niederschlag = mm%{y:.2f}" } ], "frames": [], "layout": { "title": { "x": 0.5, "text": "Niederschlagshöhen" }, "xaxis": { "type": "date", "range": [ "1953-07-02 12:00", "2023-07-02 12:00" ], "showgrid": false, "autorange": true }, "yaxis": { "type": "linear", "range": [ 0, 1128.5263157894735 ], "title": { "text": "mm" }, "showgrid": false, "autorange": true }, "legend": { "x": 0.7677477477477478, "y": 1.0847457627118644 }, "template": { "data": { "bar": [ { "type": "bar", "marker": { "line": { "color": "#E5ECF6", "width": 0.5 }, "pattern": { "size": 10, "fillmode": "overlay", "solidity": 0.2 } }, "error_x": { "color": "#2a3f5f" }, "error_y": { "color": "#2a3f5f" } } ], "pie": [ { "type": "pie", "automargin": true } ], "table": [ { "type": "table", "cells": { "fill": { "color": "#EBF0F8" }, "line": { "color": "white" } }, "header": { "fill": { "color": "#C8D4E3" }, "line": { "color": "white" } } } ], "carpet": [ { "type": "carpet", "aaxis": { "gridcolor": "white", "linecolor": "white", "endlinecolor": "#2a3f5f", "minorgridcolor": "white", "startlinecolor": "#2a3f5f" }, "baxis": { "gridcolor": "white", "linecolor": "white", "endlinecolor": "#2a3f5f", "minorgridcolor": "white", "startlinecolor": "#2a3f5f" } } ], "mesh3d": [ { "type": "mesh3d", "colorbar": { "ticks": "", "outlinewidth": 0 } } ], "contour": [ { "type": "contour", "colorbar": { "ticks": "", "outlinewidth": 0 }, "colorscale": [ [ 0, "#0d0887" ], [ 0.1111111111111111, "#46039f" ], [ 0.2222222222222222, "#7201a8" ], [ 0.3333333333333333, "#9c179e" ], [ 0.4444444444444444, "#bd3786" ], [ 0.5555555555555556, "#d8576b" ], [ 0.6666666666666666, "#ed7953" ], [ 0.7777777777777778, "#fb9f3a" ], [ 0.8888888888888888, "#fdca26" ], [ 1, "#f0f921" ] ] } ], "heatmap": [ { "type": "heatmap", "colorbar": { "ticks": "", "outlinewidth": 0 }, "colorscale": [ [ 0, "#0d0887" ], [ 0.1111111111111111, "#46039f" ], [ 0.2222222222222222, "#7201a8" ], [ 0.3333333333333333, "#9c179e" ], [ 0.4444444444444444, "#bd3786" ], [ 0.5555555555555556, "#d8576b" ], [ 0.6666666666666666, "#ed7953" ], [ 0.7777777777777778, "#fb9f3a" ], [ 0.8888888888888888, "#fdca26" ], [ 1, "#f0f921" ] ] } ], "scatter": [ { "type": "scatter", "fillpattern": { "size": 10, "fillmode": "overlay", "solidity": 0.2 } } ], "surface": [ { "type": "surface", "colorbar": { "ticks": "", "outlinewidth": 0 }, "colorscale": [ [ 0, "#0d0887" ], [ 0.1111111111111111, "#46039f" ], [ 0.2222222222222222, "#7201a8" ], [ 0.3333333333333333, "#9c179e" ], [ 0.4444444444444444, "#bd3786" ], [ 0.5555555555555556, "#d8576b" ], [ 0.6666666666666666, "#ed7953" ], [ 0.7777777777777778, "#fb9f3a" ], [ 0.8888888888888888, "#fdca26" ], [ 1, "#f0f921" ] ] } ], "barpolar": [ { "type": "barpolar", "marker": { "line": { "color": "#E5ECF6", "width": 0.5 }, "pattern": { "size": 10, "fillmode": "overlay", "solidity": 0.2 } } } ], "heatmapgl": [ { "type": "heatmapgl", "colorbar": { "ticks": "", "outlinewidth": 0 }, "colorscale": [ [ 0, "#0d0887" ], [ 0.1111111111111111, "#46039f" ], [ 0.2222222222222222, "#7201a8" ], [ 0.3333333333333333, "#9c179e" ], [ 0.4444444444444444, "#bd3786" ], [ 0.5555555555555556, "#d8576b" ], [ 0.6666666666666666, "#ed7953" ], [ 0.7777777777777778, "#fb9f3a" ], [ 0.8888888888888888, "#fdca26" ], [ 1, "#f0f921" ] ] } ], "histogram": [ { "type": "histogram", "marker": { "pattern": { "size": 10, "fillmode": "overlay", "solidity": 0.2 } } } ], "parcoords": [ { "line": { "colorbar": { "ticks": "", "outlinewidth": 0 } }, "type": "parcoords" } ], "scatter3d": [ { "line": { "colorbar": { "ticks": "", "outlinewidth": 0 } }, "type": "scatter3d", "marker": { "colorbar": { "ticks": "", "outlinewidth": 0 } } } ], "scattergl": [ { "type": "scattergl", "marker": { "colorbar": { "ticks": "", "outlinewidth": 0 } } } ], "choropleth": [ { "type": "choropleth", "colorbar": { "ticks": "", "outlinewidth": 0 } } ], "scattergeo": [ { "type": "scattergeo", "marker": { "colorbar": { "ticks": "", "outlinewidth": 0 } } } ], "histogram2d": [ { "type": "histogram2d", "colorbar": { "ticks": "", "outlinewidth": 0 }, "colorscale": [ [ 0, "#0d0887" ], [ 0.1111111111111111, "#46039f" ], [ 0.2222222222222222, "#7201a8" ], [ 0.3333333333333333, "#9c179e" ], [ 0.4444444444444444, "#bd3786" ], [ 0.5555555555555556, "#d8576b" ], [ 0.6666666666666666, "#ed7953" ], [ 0.7777777777777778, "#fb9f3a" ], [ 0.8888888888888888, "#fdca26" ], [ 1, "#f0f921" ] ] } ], "scatterpolar": [ { "type": "scatterpolar", "marker": { "colorbar": { "ticks": "", "outlinewidth": 0 } } } ], "contourcarpet": [ { "type": "contourcarpet", "colorbar": { "ticks": "", "outlinewidth": 0 } } ], "scattercarpet": [ { "type": "scattercarpet", "marker": { "colorbar": { "ticks": "", "outlinewidth": 0 } } } ], "scattermapbox": [ { "type": "scattermapbox", "marker": { "colorbar": { "ticks": "", "outlinewidth": 0 } } } ], "scatterpolargl": [ { "type": "scatterpolargl", "marker": { "colorbar": { "ticks": "", "outlinewidth": 0 } } } ], "scatterternary": [ { "type": "scatterternary", "marker": { "colorbar": { "ticks": "", "outlinewidth": 0 } } } ], "histogram2dcontour": [ { "type": "histogram2dcontour", "colorbar": { "ticks": "", "outlinewidth": 0 }, "colorscale": [ [ 0, "#0d0887" ], [ 0.1111111111111111, "#46039f" ], [ 0.2222222222222222, "#7201a8" ], [ 0.3333333333333333, "#9c179e" ], [ 0.4444444444444444, "#bd3786" ], [ 0.5555555555555556, "#d8576b" ], [ 0.6666666666666666, "#ed7953" ], [ 0.7777777777777778, "#fb9f3a" ], [ 0.8888888888888888, "#fdca26" ], [ 1, "#f0f921" ] ] } ] }, "layout": { "geo": { "bgcolor": "white", "showland": true, "lakecolor": "white", "landcolor": "#E5ECF6", "showlakes": true, "subunitcolor": "white" }, "font": { "color": "#2a3f5f" }, "polar": { "bgcolor": "#E5ECF6", "radialaxis": { "ticks": "", "gridcolor": "white", "linecolor": "white" }, "angularaxis": { "ticks": "", "gridcolor": "white", "linecolor": "white" } }, "scene": { "xaxis": { "ticks": "", "gridcolor": "white", "gridwidth": 2, "linecolor": "white", "zerolinecolor": "white", "showbackground": true, "backgroundcolor": "#E5ECF6" }, "yaxis": { "ticks": "", "gridcolor": "white", "gridwidth": 2, "linecolor": "white", "zerolinecolor": "white", "showbackground": true, "backgroundcolor": "#E5ECF6" }, "zaxis": { "ticks": "", "gridcolor": "white", "gridwidth": 2, "linecolor": "white", "zerolinecolor": "white", "showbackground": true, "backgroundcolor": "#E5ECF6" } }, "title": { "x": 0.05 }, "xaxis": { "ticks": "", "title": { "standoff": 15 }, "gridcolor": "white", "linecolor": "white", "automargin": true, "zerolinecolor": "white", "zerolinewidth": 2 }, "yaxis": { "ticks": "", "title": { "standoff": 15 }, "gridcolor": "white", "linecolor": "white", "automargin": true, "zerolinecolor": "white", "zerolinewidth": 2 }, "mapbox": { "style": "light" }, "ternary": { "aaxis": { "ticks": "", "gridcolor": "white", "linecolor": "white" }, "baxis": { "ticks": "", "gridcolor": "white", "linecolor": "white" }, "caxis": { "ticks": "", "gridcolor": "white", "linecolor": "white" }, "bgcolor": "#E5ECF6" }, "colorway": [ "#636efa", "#EF553B", "#00cc96", "#ab63fa", "#FFA15A", "#19d3f3", "#FF6692", "#B6E880", "#FF97FF", "#FECB52" ], "coloraxis": { "colorbar": { "ticks": "", "outlinewidth": 0 } }, "hovermode": "closest", "colorscale": { "diverging": [ [ 0, "#8e0152" ], [ 0.1, "#c51b7d" ], [ 0.2, "#de77ae" ], [ 0.3, "#f1b6da" ], [ 0.4, "#fde0ef" ], [ 0.5, "#f7f7f7" ], [ 0.6, "#e6f5d0" ], [ 0.7, "#b8e186" ], [ 0.8, "#7fbc41" ], [ 0.9, "#4d9221" ], [ 1, "#276419" ] ], "sequential": [ [ 0, "#0d0887" ], [ 0.1111111111111111, "#46039f" ], [ 0.2222222222222222, "#7201a8" ], [ 0.3333333333333333, "#9c179e" ], [ 0.4444444444444444, "#bd3786" ], [ 0.5555555555555556, "#d8576b" ], [ 0.6666666666666666, "#ed7953" ], [ 0.7777777777777778, "#fb9f3a" ], [ 0.8888888888888888, "#fdca26" ], [ 1, "#f0f921" ] ], "sequentialminus": [ [ 0, "#0d0887" ], [ 0.1111111111111111, "#46039f" ], [ 0.2222222222222222, "#7201a8" ], [ 0.3333333333333333, "#9c179e" ], [ 0.4444444444444444, "#bd3786" ], [ 0.5555555555555556, "#d8576b" ], [ 0.6666666666666666, "#ed7953" ], [ 0.7777777777777778, "#fb9f3a" ], [ 0.8888888888888888, "#fdca26" ], [ 1, "#f0f921" ] ] }, "hoverlabel": { "align": "left" }, "plot_bgcolor": "#E5ECF6", "paper_bgcolor": "white", "shapedefaults": { "line": { "color": "#2a3f5f" } }, "autotypenumbers": "strict", "annotationdefaults": { "arrowhead": 0, "arrowcolor": "#2a3f5f", "arrowwidth": 1 } } }, "hoverlabel": { "font": { "size": 10 }, "bgcolor": "rgb(0, 0, 0, 0 )", "bordercolor": "whitesmoke" }, "showlegend": true, "updatemenus": [ { "x": 0.3, "y": 1.2, "active": 1, "buttons": [ { "args": [ { "visible": [ true, true, true, false, false, false, false, false, false, false, false, false, false, false ] } ], "label": "Monatssummen der Niederschlagshöhe", "method": "restyle", "visible": true }, { "args": [ { "visible": [ false, false, false, false, false, false, false, true, true, true, false, false, false, false ] } ], "label": "Jahressummen der Niederschlagshöhe", "method": "restyle", "visible": true }, { "args": [ { "visible": [ false, false, false, true, true, true, true, false, false, false, false, false, false, false ] } ], "label": "Saisonale Summen der Niederschlagshöhe", "method": "restyle", "visible": true }, { "args": [ { "visible": [ false, false, false, true, false, false, false, false, false, false, true, false, false, false ] } ], "label": "Trendlinien der saisonalen Niederschlagshöhe - Frühling", "method": "restyle", "visible": true }, { "args": [ { "visible": [ false, false, false, false, true, false, false, false, false, false, false, true, false, false ] } ], "label": "Trendlinien der saisonalen Niederschlagshöhe - Sommer", "method": "restyle", "visible": true }, { "args": [ { "visible": [ false, false, false, false, false, true, false, false, false, false, false, false, true, false ] } ], "label": "Trendlinien der saisonalen Niederschlagshöhe - Herbst", "method": "restyle", "visible": true }, { "args": [ { "visible": [ false, false, false, false, false, false, true, false, false, false, false, false, false, true ] } ], "label": "Trendlinien der saisonalen Niederschlagshöhe - Winter", "method": "restyle", "visible": true } ], "xanchor": "left", "yanchor": "top", "direction": "down", "showactive": true } ], "plot_bgcolor": "rgb(255, 255, 255)" } }, "height": null, "width": null, "user": { "profile_url": "https://chart-studio.plotly.com/~SchatzJ", "avatar_url": "https://storage.googleapis.com/plotly-prod-profiles/56.jpg", "background_url": "https://storage.googleapis.com/plotly-prod-profiles/bg-11.jpg", "bio": "", "nickname": "", "website": "", "stream_tokens": null, "feature_set_id": null, "csrf_token": null, "date_joined": "2025-04-16 12:09:22", "mapbox_access_tokens": null, "has_password": null, "username": "SchatzJ", "email": null, "is_active": null, "readonly": null, "is_dash_creator": null, "dash_created_count": null, "is_chart_creator": null, "charts_created_count": null } } ] }
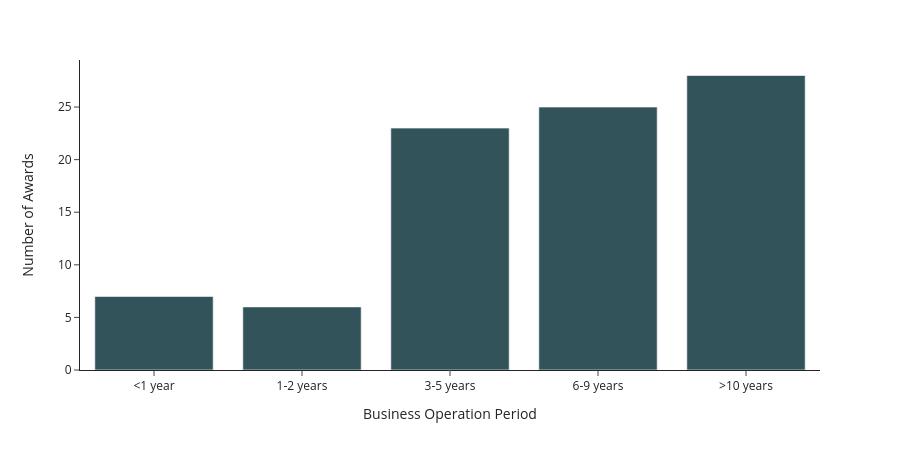
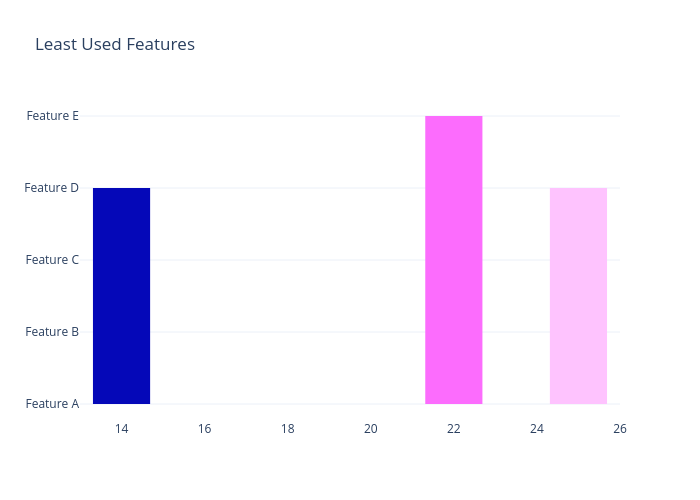