Plots List
Plots
This endpoint handles manipulation of Plotly plot files.
Reference
Authorization
Any user with or without a Plotly account may view public plots. For private plots, see authentication.
Actions
list
Listing all public plots can be done via a GET request to this endpoint.
By default, plots will be listed in order of date created. The order_by
query parameter is accepted at this endpoint. Currently, only ordering by
views is supported. It is possible to filter the plots by quality
with min_quality or max_quality as query parameter.
Example:
// GET https://api.plotly.com/v2/plots/ ---> 200

// GET https://api.plotly.com/v2/plots/?order_by=-views ---> 200

// GET https://api.plotly.com/v2/plots/?min_quality=5 ---> 200

// GET https://api.plotly.com/v2/plots/?max_quality=5 ---> 200
feed
Listing all handpicked feed plots can be done via a GET request to this endpoint. By default, plots will be listed in a random order.
Example:
// GET https://api.plotly.com/v2/plots/feed ---> 200
create
You can create new plot resources here. The only required field is 'figure'. Currently, the figure is restricted to only contain references to grid data. That is, this will fail if raw data arrays are passed in. To create and manipulate underlying grids for plots, see the grids endpoint.
Example:
// This fails because a figure field is required.
// POST https://api.plotly.com/v2/plots ---> 400 Bad Request
{}

// This fails because the figure has raw data
//POST https://api.plotly.com/v2/plots ---> 400 Bad Request
{
    "figure": {"data": [{"y": ['this', 'is', 'raw', 'data']}]}
}

// This succeeds because the figure has src keys, not raw data.
//POST https://api.plotly.com/v2/plots ---> 200 OK
{
    "figure": {"data": [{"ysrc": "sven:88:u8nd62"}]}
}
When creating a grid, you can optionally specify a source_fid to specify where a plot has come from:
- source_fid: the fid of a plot that was copied (and presumably edited) to produce this one
detail
There is a lot of meta information stored about plot files including filename, title, share_url, and content_url to name a few.
This information can only be reached with a GET to this endpoint.
Example:
// GET https://api.plotly.com/v2/plots/iheartgraphs:90
content
The contents of a plot can be downloaded via the content resource. The plot
content contains referenced grid/column data by default. If you wish to
return the raw grid/column data, the inline_data=true query must be included
in the request url. The Content-Type header will be appropriately set for the
response body.
Alternatively, you can set ?map_data=unreadable to append a mapping of
sources to data that belongs to grids which are unreadable for the
requestor. This is useful when you have read access to another users plot,
but that plot contains grid references which you don't have access to.
Examples:
// Returns referenced grid/column data
// GET https://api.plotly.com/v2/plots/iheartgraphs:90/content ---> 200 OK

// Returns full grid/column data
// GET https://api.plotly.com/v2/plots/iheartgraphs:90/content?inline_data=true ---> 200 OK

// Returns full grid/column data when requestor doesn't have permission
// to read the referenced grid.
// GET https://api.plotly.com/v2/plots/iheartgraphs:90/content?map_data=unreadable ---> 200 OK
GET /v2/plots?cursor=cj0xJnA9MjAyNS0wOC0wNisxMSUzQTI4JTNBMjIuNTA5MTcyJTJCMDAlM0EwMA%3D%3D&format=api
{ "next": "https://api.plotly.com/v2/plots?cursor=cD0yMDI1LTA4LTA2KzExJTNBMzklM0E1MC40OTMyOTElMkIwMCUzQTAw&format=api", "previous": "https://api.plotly.com/v2/plots?cursor=cj0xJnA9MjAyNS0wOC0wNisxNSUzQTIyJTNBNTYuODU0NjgwJTJCMDAlM0EwMA%3D%3D&format=api", "results": [ { "creation_time": "2025-08-06T15:22:56.854680Z", "comments": { "results": [], "count": 0 }, "parented": true, "embed_url": "https://chart-studio.plotly.com/~pablo_255/6.embed", "fid": "pablo_255:6", "filename": "Plot 6", "filetype": "plot", "img_url": "https://storage.googleapis.com/plotly-prod-images/pablo_255/6/9_VDFFM9RCO165ORKMGU3S67D6NP1K7Q.png", "image_urls": { "default": "https://storage.googleapis.com/plotly-prod-images/pablo_255/6/2_HUYQK4SPS9YRABSJYK6JOYPASQG9GZ.png", "block-thumb": "https://storage.googleapis.com/plotly-prod-images/pablo_255/6/8_11XM8MJ34YQ96GCE1N17FGVYBAS0MD.png", "list-thumb": "https://storage.googleapis.com/plotly-prod-images/pablo_255/6/9_VDFFM9RCO165ORKMGU3S67D6NP1K7Q.png" }, "api_urls": { "files": "https://api.plotly.com/v2/files/pablo_255:6", "plots": "https://api.plotly.com/v2/plots/pablo_255:6", "parent": "https://api.plotly.com/v2/folders/home?user=pablo_255" }, "owner": "pablo_255", "parent": -1, "preview": "", "referencers": [], "references": [], "title": "", "views": 0, "web_url": "https://chart-studio.plotly.com/~pablo_255/6/", "world_readable": true, "date_modified": "2025-08-06T15:22:56.865Z", "stars": { "results": [], "count": 0 }, "collaborators": { "results": [], "count": 0 }, "subfolder_count": null, "refresh_interval": null, "organize_view_url": "https://chart-studio.plotly.com/~pablo_255/6/", "current_user_permission": "read", "is_theme": null, "is_template": false, "autosize": true, "caption": "", "figure": { "data": [ { "meta": { "columnNames": { "x": "A", "y": "C", "z": "B" } }, "mode": "markers+lines", "name": "Den1_on_BEST", "type": "scatter3d", "xsrc": "pablo_255:0:5c9ec5", "ysrc": "pablo_255:0:05e38f", "zsrc": "pablo_255:0:cc5858" }, { "meta": { "columnNames": { "x": "A", "y": "C", "z": "B" } }, "mode": "markers+lines", "name": "Den1_on_MP", "type": "scatter3d", "xsrc": "pablo_255:1:4f5be2", "ysrc": "pablo_255:1:bfe4aa", "zsrc": "pablo_255:1:ebe364", "scene": "scene" }, { "meta": { "columnNames": { "x": "A", "y": "C", "z": "B" } }, "mode": "markers+lines", "name": "Den1_on_OFFSHORE", "type": "scatter3d", "xsrc": "pablo_255:2:479f59", "ysrc": "pablo_255:1:bfe4aa", "zsrc": "pablo_255:2:78c50f" }, { "meta": { "columnNames": { "x": "A", "y": "C", "z": "B" } }, "mode": "markers+lines", "name": "Escot_on_BEST", "type": "scatter3d", "xsrc": "pablo_255:3:97ea54", "ysrc": "pablo_255:3:9b0e29", "zsrc": "pablo_255:3:83b25c" }, { "meta": { "columnNames": { "x": "A", "y": "C", "z": "B" } }, "mode": "markers+lines", "name": "<b>Escot_on_MP</b>", "type": "scatter3d", "xsrc": "pablo_255:4:7f9d66", "ysrc": "pablo_255:1:bfe4aa", "zsrc": "pablo_255:2:78c50f" }, { "meta": { "columnNames": { "x": "A", "y": "C", "z": "B" } }, "mode": "markers+lines", "name": "Escot_on_OFFSHORE", "type": "scatter3d", "xsrc": "pablo_255:5:503b38", "ysrc": "pablo_255:5:3f1035", "zsrc": "pablo_255:5:a2e5ae" } ], "frames": [], "layout": { "scene": { "camera": { "up": { "x": 0, "y": 0, "z": 1 }, "eye": { "x": -0.19576684458911958, "y": 1.7908130936991637, "z": 0.477603970164131 }, "center": { "x": 0, "y": 0, "z": 0 }, "projection": { "type": "perspective" } }, "dragmode": "turntable", "aspectmode": "auto", "aspectratio": { "x": 1, "y": 1, "z": 1 } }, "title": { "text": "Click to enter Plot title" }, "xaxis": { "range": [ -1, 6 ], "autorange": true }, "yaxis": { "range": [ -1, 4 ], "autorange": true }, "autosize": true, "dragmode": "zoom" } }, "height": null, "width": null, "user": { "profile_url": "https://chart-studio.plotly.com/~pablo_255", "avatar_url": "https://storage.googleapis.com/plotly-prod-profiles/15.jpg", "background_url": "https://storage.googleapis.com/plotly-prod-profiles/bg-13.jpg", "bio": "", "nickname": "", "website": "", "stream_tokens": null, "feature_set_id": null, "csrf_token": null, "date_joined": "2025-08-06 14:57:35", "mapbox_access_tokens": null, "has_password": null, "username": "pablo_255", "email": null, "is_active": null, "readonly": null, "is_dash_creator": null, "dash_created_count": null, "is_chart_creator": null, "charts_created_count": null } }, { "creation_time": "2025-08-06T14:45:19.797515Z", "comments": { "results": [], "count": 0 }, "parented": true, "embed_url": "https://chart-studio.plotly.com/~swegner98/3.embed", "fid": "swegner98:3", "filename": "Plot 3", "filetype": "plot", "img_url": "https://storage.googleapis.com/plotly-prod-images/swegner98/3/9_SFNEECIUIZYQ6DBAN12ZLA5I72PBH5.png", "image_urls": { "default": "https://storage.googleapis.com/plotly-prod-images/swegner98/3/2_WK6CYMAQ8OT8GHZC9ABD9IG402EFYA.png", "block-thumb": "https://storage.googleapis.com/plotly-prod-images/swegner98/3/8_EU38FL0GTHTL95DX3SDZJM4IRF1YY0.png", "list-thumb": "https://storage.googleapis.com/plotly-prod-images/swegner98/3/9_SFNEECIUIZYQ6DBAN12ZLA5I72PBH5.png" }, "api_urls": { "files": "https://api.plotly.com/v2/files/swegner98:3", "plots": "https://api.plotly.com/v2/plots/swegner98:3", "parent": "https://api.plotly.com/v2/folders/home?user=swegner98" }, "owner": "swegner98", "parent": -1, "preview": "", "referencers": [], "references": [], "title": "", "views": 1, "web_url": "https://chart-studio.plotly.com/~swegner98/3/", "world_readable": true, "date_modified": "2025-08-06T14:45:19.809Z", "stars": { "results": [], "count": 0 }, "collaborators": { "results": [], "count": 0 }, "subfolder_count": null, "refresh_interval": null, "organize_view_url": "https://chart-studio.plotly.com/~swegner98/3/", "current_user_permission": "read", "is_theme": null, "is_template": false, "autosize": true, "caption": "", "figure": { "data": [ { "meta": { "columnNames": { "y": "Fehlerentwicklung Sham" } }, "mode": "markers", "name": "Sham", "type": "box", "ysrc": "swegner98:2:d1cba2", "boxmean": true, "boxpoints": false }, { "meta": { "columnNames": { "y": "Fehlerentwicklung Stim" } }, "name": "Stim", "type": "box", "ysrc": "swegner98:2:f2b860", "boxmean": true, "boxpoints": false }, { "meta": { "columnNames": { "y": "Fehlerentwicklung Split" } }, "name": "Split", "type": "box", "ysrc": "swegner98:2:8a09bc", "boxmean": true, "boxpoints": false } ], "frames": [], "layout": { "xaxis": { "type": "category", "range": [ -0.5, 2.5 ], "title": { "text": "Stimulationssetting" }, "showline": false, "autorange": true }, "yaxis": { "type": "linear", "dtick": 3, "range": [ -13, 7 ], "title": { "text": "Fehlerentwicklung" }, "tickfont": { "size": 12 }, "tickmode": "linear", "autorange": true }, "autosize": true, "template": { "data": { "bar": [ { "type": "bar", "marker": { "colorbar": { "ticks": "", "outlinewidth": 0 } } } ], "table": [ { "type": "table", "cells": { "fill": { "color": "#EBF0F8" }, "line": { "color": "white" } }, "header": { "fill": { "color": "#C8D4E3" }, "line": { "color": "white" } } } ], "carpet": [ { "type": "carpet", "aaxis": { "gridcolor": "#C8D4E3", "linecolor": "#C8D4E3", "endlinecolor": "#2a3f5f", "minorgridcolor": "#C8D4E3", "startlinecolor": "#2a3f5f" }, "baxis": { "gridcolor": "#C8D4E3", "linecolor": "#C8D4E3", "endlinecolor": "#2a3f5f", "minorgridcolor": "#C8D4E3", "startlinecolor": "#2a3f5f" } } ], "mesh3d": [ { "type": "mesh3d", "colorbar": { "ticks": "", "outlinewidth": 0 } } ], "contour": [ { "type": "contour", "colorbar": { "ticks": "", "outlinewidth": 0 }, "autocolorscale": true } ], "heatmap": [ { "type": "heatmap", "colorbar": { "ticks": "", "outlinewidth": 0 }, "autocolorscale": true } ], "scatter": [ { "type": "scatter", "marker": { "colorbar": { "ticks": "", "outlinewidth": 0 } } } ], "surface": [ { "type": "surface", "colorbar": { "ticks": "", "outlinewidth": 0 } } ], "heatmapgl": [ { "type": "heatmapgl", "colorbar": { "ticks": "", "outlinewidth": 0 } } ], "histogram": [ { "type": "histogram", "marker": { "colorbar": { "ticks": "", "outlinewidth": 0 } } } ], "parcoords": [ { "line": { "colorbar": { "ticks": "", "outlinewidth": 0 } }, "type": "parcoords" } ], "scatter3d": [ { "type": "scatter3d", "marker": { "colorbar": { "ticks": "", "outlinewidth": 0 } } } ], "scattergl": [ { "type": "scattergl", "marker": { "colorbar": { "ticks": "", "outlinewidth": 0 } } } ], "choropleth": [ { "type": "choropleth", "colorbar": { "ticks": "", "outlinewidth": 0 } } ], "scattergeo": [ { "type": "scattergeo", "marker": { "colorbar": { "ticks": "", "outlinewidth": 0 } } } ], "histogram2d": [ { "type": "histogram2d", "colorbar": { "ticks": "", "outlinewidth": 0 }, "autocolorscale": true } ], "scatterpolar": [ { "type": "scatterpolar", "marker": { "colorbar": { "ticks": "", "outlinewidth": 0 } } } ], "contourcarpet": [ { "type": "contourcarpet", "colorbar": { "ticks": "", "outlinewidth": 0 } } ], "scattercarpet": [ { "type": "scattercarpet", "marker": { "colorbar": { "ticks": "", "outlinewidth": 0 } } } ], "scattermapbox": [ { "type": "scattermapbox", "marker": { "colorbar": { "ticks": "", "outlinewidth": 0 } } } ], "scatterpolargl": [ { "type": "scatterpolargl", "marker": { "colorbar": { "ticks": "", "outlinewidth": 0 } } } ], "scatterternary": [ { "type": "scatterternary", "marker": { "colorbar": { "ticks": "", "outlinewidth": 0 } } } ], "histogram2dcontour": [ { "type": "histogram2dcontour", "colorbar": { "ticks": "", "outlinewidth": 0 }, "autocolorscale": true } ] }, "layout": { "geo": { "bgcolor": "white", "showland": true, "lakecolor": "white", "landcolor": "white", "showlakes": true, "subunitcolor": "#C8D4E3" }, "font": { "color": "#2a3f5f" }, "polar": { "bgcolor": "white", "radialaxis": { "ticks": "", "gridcolor": "#EBF0F8", "linecolor": "#EBF0F8" }, "angularaxis": { "ticks": "", "gridcolor": "#EBF0F8", "linecolor": "#EBF0F8" } }, "scene": { "xaxis": { "ticks": "", "gridcolor": "#DFE8F3", "gridwidth": 2, "linecolor": "#EBF0F8", "zerolinecolor": "#EBF0F8", "showbackground": true, "backgroundcolor": "white" }, "yaxis": { "ticks": "", "gridcolor": "#DFE8F3", "gridwidth": 2, "linecolor": "#EBF0F8", "zerolinecolor": "#EBF0F8", "showbackground": true, "backgroundcolor": "white" }, "zaxis": { "ticks": "", "gridcolor": "#DFE8F3", "gridwidth": 2, "linecolor": "#EBF0F8", "zerolinecolor": "#EBF0F8", "showbackground": true, "backgroundcolor": "white" } }, "title": { "x": 0.05 }, "xaxis": { "ticks": "", "gridcolor": "#EBF0F8", "linecolor": "#EBF0F8", "automargin": true, "zerolinecolor": "#EBF0F8", "zerolinewidth": 2 }, "yaxis": { "ticks": "", "gridcolor": "#EBF0F8", "linecolor": "#EBF0F8", "automargin": true, "zerolinecolor": "#EBF0F8", "zerolinewidth": 2 }, "ternary": { "aaxis": { "ticks": "", "gridcolor": "#DFE8F3", "linecolor": "#A2B1C6" }, "baxis": { "ticks": "", "gridcolor": "#DFE8F3", "linecolor": "#A2B1C6" }, "caxis": { "ticks": "", "gridcolor": "#DFE8F3", "linecolor": "#A2B1C6" }, "bgcolor": "white" }, "colorway": [ "#636efa", "#EF553B", "#00cc96", "#ab63fa", "#19d3f3", "#e763fa", "#fecb52", "#ffa15a", "#ff6692", "#b6e880" ], "hovermode": "closest", "colorscale": { "diverging": [ [ 0, "#8e0152" ], [ 0.1, "#c51b7d" ], [ 0.2, "#de77ae" ], [ 0.3, "#f1b6da" ], [ 0.4, "#fde0ef" ], [ 0.5, "#f7f7f7" ], [ 0.6, "#e6f5d0" ], [ 0.7, "#b8e186" ], [ 0.8, "#7fbc41" ], [ 0.9, "#4d9221" ], [ 1, "#276419" ] ], "sequential": [ [ 0, "#0508b8" ], [ 0.0893854748603352, "#1910d8" ], [ 0.1787709497206704, "#3c19f0" ], [ 0.2681564245810056, "#6b1cfb" ], [ 0.3575418994413408, "#981cfd" ], [ 0.44692737430167595, "#bf1cfd" ], [ 0.5363128491620112, "#dd2bfd" ], [ 0.6256983240223464, "#f246fe" ], [ 0.7150837988826816, "#fc67fd" ], [ 0.8044692737430168, "#fe88fc" ], [ 0.8938547486033519, "#fea5fd" ], [ 0.9832402234636871, "#febefe" ], [ 1, "#fec3fe" ] ], "sequentialminus": [ [ 0, "#0508b8" ], [ 0.0893854748603352, "#1910d8" ], [ 0.1787709497206704, "#3c19f0" ], [ 0.2681564245810056, "#6b1cfb" ], [ 0.3575418994413408, "#981cfd" ], [ 0.44692737430167595, "#bf1cfd" ], [ 0.5363128491620112, "#dd2bfd" ], [ 0.6256983240223464, "#f246fe" ], [ 0.7150837988826816, "#fc67fd" ], [ 0.8044692737430168, "#fe88fc" ], [ 0.8938547486033519, "#fea5fd" ], [ 0.9832402234636871, "#febefe" ], [ 1, "#fec3fe" ] ] }, "plot_bgcolor": "white", "paper_bgcolor": "white", "shapedefaults": { "line": { "width": 0 }, "opacity": 0.4, "fillcolor": "#506784" }, "annotationdefaults": { "arrowhead": 0, "arrowcolor": "#506784", "arrowwidth": 1 } }, "themeRef": "PLOTLY_WHITE" } } }, "height": null, "width": null, "user": { "profile_url": "https://chart-studio.plotly.com/~swegner98", "avatar_url": "https://storage.googleapis.com/plotly-prod-profiles/8.jpg", "background_url": "https://storage.googleapis.com/plotly-prod-profiles/bg-13.jpg", "bio": "", "nickname": "", "website": "", "stream_tokens": null, "feature_set_id": null, "csrf_token": null, "date_joined": "2025-08-06 13:26:15", "mapbox_access_tokens": null, "has_password": null, "username": "swegner98", "email": null, "is_active": null, "readonly": null, "is_dash_creator": null, "dash_created_count": null, "is_chart_creator": null, "charts_created_count": null } }, { "creation_time": "2025-08-06T14:27:14.678465Z", "comments": { "results": [], "count": 0 }, "parented": true, "embed_url": "https://chart-studio.plotly.com/~antle/216.embed", "fid": "antle:216", "filename": "antle20", "filetype": "plot", "img_url": "https://storage.googleapis.com/plotly-prod-images/antle/216/9_IX6ERUIZVORRB97X73ZK9M8L2ZQAX4.png", "image_urls": { "default": "https://storage.googleapis.com/plotly-prod-images/antle/216/2_ONKSNWHRZSOCV6BN55IAZJ7LID6IJ7.png", "block-thumb": "https://storage.googleapis.com/plotly-prod-images/antle/216/8_055ZO0PX1PXB6094P2FP8ESQVLPT7G.png", "list-thumb": "https://storage.googleapis.com/plotly-prod-images/antle/216/9_IX6ERUIZVORRB97X73ZK9M8L2ZQAX4.png" }, "api_urls": { "files": "https://api.plotly.com/v2/files/antle:216", "plots": "https://api.plotly.com/v2/plots/antle:216", "parent": "https://api.plotly.com/v2/folders/home?user=antle" }, "owner": "antle", "parent": -1, "preview": "", "referencers": [], "references": [], "title": "", "views": 1, "web_url": "https://chart-studio.plotly.com/~antle/216/", "world_readable": true, "date_modified": "2025-08-06T14:27:14.689Z", "stars": { "results": [], "count": 0 }, "collaborators": { "results": [], "count": 0 }, "subfolder_count": null, "refresh_interval": null, "organize_view_url": "https://chart-studio.plotly.com/~antle/216/", "current_user_permission": "read", "is_theme": null, "is_template": null, "autosize": true, "caption": "", "figure": { "data": [ { "name": "노령 제외 인구 (64세 미만)", "type": "bar", "xsrc": "antle:215:dac44d", "ysrc": "antle:215:521d21", "marker": { "color": "#4cc9f0" }, "textsrc": "antle:215:5b89d0", "textposition": "outside" }, { "name": "노령 인구 (65세 이상)", "type": "bar", "xsrc": "antle:215:e46883", "ysrc": "antle:215:25e3c6", "marker": { "color": "#7209b7" }, "textsrc": "antle:215:729464", "textposition": "outside" } ], "layout": { "title": { "text": "성남시 구별 인구" }, "xaxis": { "title": { "text": "구별" } }, "yaxis": { "title": { "text": "인구 수 (명)" }, "tickformat": "," }, "height": 700, "legend": { "title": { "text": "구성" } }, "barmode": "group", "template": { "data": { "bar": [ { "type": "bar", "marker": { "line": { "color": "#E5ECF6", "width": 0.5 }, "pattern": { "size": 10, "fillmode": "overlay", "solidity": 0.2 } }, "error_x": { "color": "#2a3f5f" }, "error_y": { "color": "#2a3f5f" } } ], "pie": [ { "type": "pie", "automargin": true } ], "table": [ { "type": "table", "cells": { "fill": { "color": "#EBF0F8" }, "line": { "color": "white" } }, "header": { "fill": { "color": "#C8D4E3" }, "line": { "color": "white" } } } ], "carpet": [ { "type": "carpet", "aaxis": { "gridcolor": "white", "linecolor": "white", "endlinecolor": "#2a3f5f", "minorgridcolor": "white", "startlinecolor": "#2a3f5f" }, "baxis": { "gridcolor": "white", "linecolor": "white", "endlinecolor": "#2a3f5f", "minorgridcolor": "white", "startlinecolor": "#2a3f5f" } } ], "mesh3d": [ { "type": "mesh3d", "colorbar": { "ticks": "", "outlinewidth": 0 } } ], "contour": [ { "type": "contour", "colorbar": { "ticks": "", "outlinewidth": 0 }, "colorscale": [ [ 0.0, "#0d0887" ], [ 0.1111111111111111, "#46039f" ], [ 0.2222222222222222, "#7201a8" ], [ 0.3333333333333333, "#9c179e" ], [ 0.4444444444444444, "#bd3786" ], [ 0.5555555555555556, "#d8576b" ], [ 0.6666666666666666, "#ed7953" ], [ 0.7777777777777778, "#fb9f3a" ], [ 0.8888888888888888, "#fdca26" ], [ 1.0, "#f0f921" ] ] } ], "heatmap": [ { "type": "heatmap", "colorbar": { "ticks": "", "outlinewidth": 0 }, "colorscale": [ [ 0.0, "#0d0887" ], [ 0.1111111111111111, "#46039f" ], [ 0.2222222222222222, "#7201a8" ], [ 0.3333333333333333, "#9c179e" ], [ 0.4444444444444444, "#bd3786" ], [ 0.5555555555555556, "#d8576b" ], [ 0.6666666666666666, "#ed7953" ], [ 0.7777777777777778, "#fb9f3a" ], [ 0.8888888888888888, "#fdca26" ], [ 1.0, "#f0f921" ] ] } ], "scatter": [ { "type": "scatter", "fillpattern": { "size": 10, "fillmode": "overlay", "solidity": 0.2 } } ], "surface": [ { "type": "surface", "colorbar": { "ticks": "", "outlinewidth": 0 }, "colorscale": [ [ 0.0, "#0d0887" ], [ 0.1111111111111111, "#46039f" ], [ 0.2222222222222222, "#7201a8" ], [ 0.3333333333333333, "#9c179e" ], [ 0.4444444444444444, "#bd3786" ], [ 0.5555555555555556, "#d8576b" ], [ 0.6666666666666666, "#ed7953" ], [ 0.7777777777777778, "#fb9f3a" ], [ 0.8888888888888888, "#fdca26" ], [ 1.0, "#f0f921" ] ] } ], "barpolar": [ { "type": "barpolar", "marker": { "line": { "color": "#E5ECF6", "width": 0.5 }, "pattern": { "size": 10, "fillmode": "overlay", "solidity": 0.2 } } } ], "heatmapgl": [ { "type": "heatmapgl", "colorbar": { "ticks": "", "outlinewidth": 0 }, "colorscale": [ [ 0.0, "#0d0887" ], [ 0.1111111111111111, "#46039f" ], [ 0.2222222222222222, "#7201a8" ], [ 0.3333333333333333, "#9c179e" ], [ 0.4444444444444444, "#bd3786" ], [ 0.5555555555555556, "#d8576b" ], [ 0.6666666666666666, "#ed7953" ], [ 0.7777777777777778, "#fb9f3a" ], [ 0.8888888888888888, "#fdca26" ], [ 1.0, "#f0f921" ] ] } ], "histogram": [ { "type": "histogram", "marker": { "pattern": { "size": 10, "fillmode": "overlay", "solidity": 0.2 } } } ], "parcoords": [ { "line": { "colorbar": { "ticks": "", "outlinewidth": 0 } }, "type": "parcoords" } ], "scatter3d": [ { "line": { "colorbar": { "ticks": "", "outlinewidth": 0 } }, "type": "scatter3d", "marker": { "colorbar": { "ticks": "", "outlinewidth": 0 } } } ], "scattergl": [ { "type": "scattergl", "marker": { "colorbar": { "ticks": "", "outlinewidth": 0 } } } ], "choropleth": [ { "type": "choropleth", "colorbar": { "ticks": "", "outlinewidth": 0 } } ], "scattergeo": [ { "type": "scattergeo", "marker": { "colorbar": { "ticks": "", "outlinewidth": 0 } } } ], "histogram2d": [ { "type": "histogram2d", "colorbar": { "ticks": "", "outlinewidth": 0 }, "colorscale": [ [ 0.0, "#0d0887" ], [ 0.1111111111111111, "#46039f" ], [ 0.2222222222222222, "#7201a8" ], [ 0.3333333333333333, "#9c179e" ], [ 0.4444444444444444, "#bd3786" ], [ 0.5555555555555556, "#d8576b" ], [ 0.6666666666666666, "#ed7953" ], [ 0.7777777777777778, "#fb9f3a" ], [ 0.8888888888888888, "#fdca26" ], [ 1.0, "#f0f921" ] ] } ], "scatterpolar": [ { "type": "scatterpolar", "marker": { "colorbar": { "ticks": "", "outlinewidth": 0 } } } ], "contourcarpet": [ { "type": "contourcarpet", "colorbar": { "ticks": "", "outlinewidth": 0 } } ], "scattercarpet": [ { "type": "scattercarpet", "marker": { "colorbar": { "ticks": "", "outlinewidth": 0 } } } ], "scattermapbox": [ { "type": "scattermapbox", "marker": { "colorbar": { "ticks": "", "outlinewidth": 0 } } } ], "scatterpolargl": [ { "type": "scatterpolargl", "marker": { "colorbar": { "ticks": "", "outlinewidth": 0 } } } ], "scatterternary": [ { "type": "scatterternary", "marker": { "colorbar": { "ticks": "", "outlinewidth": 0 } } } ], "histogram2dcontour": [ { "type": "histogram2dcontour", "colorbar": { "ticks": "", "outlinewidth": 0 }, "colorscale": [ [ 0.0, "#0d0887" ], [ 0.1111111111111111, "#46039f" ], [ 0.2222222222222222, "#7201a8" ], [ 0.3333333333333333, "#9c179e" ], [ 0.4444444444444444, "#bd3786" ], [ 0.5555555555555556, "#d8576b" ], [ 0.6666666666666666, "#ed7953" ], [ 0.7777777777777778, "#fb9f3a" ], [ 0.8888888888888888, "#fdca26" ], [ 1.0, "#f0f921" ] ] } ] }, "layout": { "geo": { "bgcolor": "white", "showland": true, "lakecolor": "white", "landcolor": "#E5ECF6", "showlakes": true, "subunitcolor": "white" }, "font": { "color": "#2a3f5f" }, "polar": { "bgcolor": "#E5ECF6", "radialaxis": { "ticks": "", "gridcolor": "white", "linecolor": "white" }, "angularaxis": { "ticks": "", "gridcolor": "white", "linecolor": "white" } }, "scene": { "xaxis": { "ticks": "", "gridcolor": "white", "gridwidth": 2, "linecolor": "white", "zerolinecolor": "white", "showbackground": true, "backgroundcolor": "#E5ECF6" }, "yaxis": { "ticks": "", "gridcolor": "white", "gridwidth": 2, "linecolor": "white", "zerolinecolor": "white", "showbackground": true, "backgroundcolor": "#E5ECF6" }, "zaxis": { "ticks": "", "gridcolor": "white", "gridwidth": 2, "linecolor": "white", "zerolinecolor": "white", "showbackground": true, "backgroundcolor": "#E5ECF6" } }, "title": { "x": 0.05 }, "xaxis": { "ticks": "", "title": { "standoff": 15 }, "gridcolor": "white", "linecolor": "white", "automargin": true, "zerolinecolor": "white", "zerolinewidth": 2 }, "yaxis": { "ticks": "", "title": { "standoff": 15 }, "gridcolor": "white", "linecolor": "white", "automargin": true, "zerolinecolor": "white", "zerolinewidth": 2 }, "mapbox": { "style": "light" }, "ternary": { "aaxis": { "ticks": "", "gridcolor": "white", "linecolor": "white" }, "baxis": { "ticks": "", "gridcolor": "white", "linecolor": "white" }, "caxis": { "ticks": "", "gridcolor": "white", "linecolor": "white" }, "bgcolor": "#E5ECF6" }, "colorway": [ "#636efa", "#EF553B", "#00cc96", "#ab63fa", "#FFA15A", "#19d3f3", "#FF6692", "#B6E880", "#FF97FF", "#FECB52" ], "coloraxis": { "colorbar": { "ticks": "", "outlinewidth": 0 } }, "hovermode": "closest", "colorscale": { "diverging": [ [ 0, "#8e0152" ], [ 0.1, "#c51b7d" ], [ 0.2, "#de77ae" ], [ 0.3, "#f1b6da" ], [ 0.4, "#fde0ef" ], [ 0.5, "#f7f7f7" ], [ 0.6, "#e6f5d0" ], [ 0.7, "#b8e186" ], [ 0.8, "#7fbc41" ], [ 0.9, "#4d9221" ], [ 1, "#276419" ] ], "sequential": [ [ 0.0, "#0d0887" ], [ 0.1111111111111111, "#46039f" ], [ 0.2222222222222222, "#7201a8" ], [ 0.3333333333333333, "#9c179e" ], [ 0.4444444444444444, "#bd3786" ], [ 0.5555555555555556, "#d8576b" ], [ 0.6666666666666666, "#ed7953" ], [ 0.7777777777777778, "#fb9f3a" ], [ 0.8888888888888888, "#fdca26" ], [ 1.0, "#f0f921" ] ], "sequentialminus": [ [ 0.0, "#0d0887" ], [ 0.1111111111111111, "#46039f" ], [ 0.2222222222222222, "#7201a8" ], [ 0.3333333333333333, "#9c179e" ], [ 0.4444444444444444, "#bd3786" ], [ 0.5555555555555556, "#d8576b" ], [ 0.6666666666666666, "#ed7953" ], [ 0.7777777777777778, "#fb9f3a" ], [ 0.8888888888888888, "#fdca26" ], [ 1.0, "#f0f921" ] ] }, "hoverlabel": { "align": "left" }, "plot_bgcolor": "#E5ECF6", "paper_bgcolor": "white", "shapedefaults": { "line": { "color": "#2a3f5f" } }, "autotypenumbers": "strict", "annotationdefaults": { "arrowhead": 0, "arrowcolor": "#2a3f5f", "arrowwidth": 1 } } } } }, "height": 700, "width": null, "user": { "profile_url": "https://chart-studio.plotly.com/~antle", "avatar_url": "https://storage.googleapis.com/plotly-prod-profiles/54.jpg", "background_url": "https://storage.googleapis.com/plotly-prod-profiles/bg-9.jpg", "bio": "", "nickname": "", "website": "", "stream_tokens": null, "feature_set_id": null, "csrf_token": null, "date_joined": "2025-06-17 11:08:35", "mapbox_access_tokens": null, "has_password": null, "username": "antle", "email": null, "is_active": null, "readonly": null, "is_dash_creator": null, "dash_created_count": null, "is_chart_creator": null, "charts_created_count": null } }, { "creation_time": "2025-08-06T14:17:15.640810Z", "comments": { "results": [], "count": 0 }, "parented": true, "embed_url": "https://chart-studio.plotly.com/~Camila.Siqueira/3.embed", "fid": "Camila.Siqueira:3", "filename": "Plot 3", "filetype": "plot", "img_url": "https://storage.googleapis.com/plotly-prod-images/Camila.Siqueira/3/9_O0QLS6Y5GP5ADRP2U1ZTFF5B4DYGQG.png", "image_urls": { "default": "https://storage.googleapis.com/plotly-prod-images/Camila.Siqueira/3/2_1NO6T69VFQGKP2WODS69NHIYXAMHAA.png", "block-thumb": "https://storage.googleapis.com/plotly-prod-images/Camila.Siqueira/3/8_S8C93567DSIKZG9FCNE2SMPMK06O90.png", "list-thumb": "https://storage.googleapis.com/plotly-prod-images/Camila.Siqueira/3/9_O0QLS6Y5GP5ADRP2U1ZTFF5B4DYGQG.png" }, "api_urls": { "files": "https://api.plotly.com/v2/files/Camila.Siqueira:3", "plots": "https://api.plotly.com/v2/plots/Camila.Siqueira:3", "parent": "https://api.plotly.com/v2/folders/home?user=Camila.Siqueira" }, "owner": "Camila.Siqueira", "parent": -1, "preview": "", "referencers": [], "references": [], "title": "", "views": 0, "web_url": "https://chart-studio.plotly.com/~Camila.Siqueira/3/", "world_readable": true, "date_modified": "2025-08-06T14:17:15.651Z", "stars": { "results": [], "count": 0 }, "collaborators": { "results": [], "count": 0 }, "subfolder_count": null, "refresh_interval": null, "organize_view_url": "https://chart-studio.plotly.com/~Camila.Siqueira/3/", "current_user_permission": "read", "is_theme": null, "is_template": false, "autosize": true, "caption": "", "figure": { "data": [ { "meta": { "columnNames": { "x": "A", "y": "B" } }, "mode": "lines", "type": "scatter", "xsrc": "Camila.Siqueira:2:7ee946", "ysrc": "Camila.Siqueira:2:36c8d9" }, { "meta": { "columnNames": { "x": "A", "y": "C" } }, "mode": "lines", "type": "scatter", "xsrc": "Camila.Siqueira:2:7ee946", "ysrc": "Camila.Siqueira:2:a44fb4", "stackgroup": null }, { "meta": { "columnNames": { "x": "A", "y": "D" } }, "mode": "lines", "type": "scatter", "xsrc": "Camila.Siqueira:2:7ee946", "ysrc": "Camila.Siqueira:2:a807b3", "stackgroup": null } ], "frames": [], "layout": { "title": { "text": "Gráfico de Adsorção AVIP224" }, "xaxis": { "type": "linear", "range": [ 0, 30 ], "title": { "text": "Tempo" }, "autorange": true }, "yaxis": { "type": "linear", "range": [ -988388.8888888891, 18999388.888888888 ], "title": { "text": "UMdsorção em Log" }, "autorange": true }, "template": { "data": { "bar": [ { "type": "bar", "marker": { "colorbar": { "ticks": "", "outlinewidth": 0 } } } ], "table": [ { "type": "table", "cells": { "fill": { "color": "#EBF0F8" }, "line": { "color": "white" } }, "header": { "fill": { "color": "#C8D4E3" }, "line": { "color": "white" } } } ], "carpet": [ { "type": "carpet", "aaxis": { "gridcolor": "#C8D4E3", "linecolor": "#C8D4E3", "endlinecolor": "#2a3f5f", "minorgridcolor": "#C8D4E3", "startlinecolor": "#2a3f5f" }, "baxis": { "gridcolor": "#C8D4E3", "linecolor": "#C8D4E3", "endlinecolor": "#2a3f5f", "minorgridcolor": "#C8D4E3", "startlinecolor": "#2a3f5f" } } ], "mesh3d": [ { "type": "mesh3d", "colorbar": { "ticks": "", "outlinewidth": 0 } } ], "contour": [ { "type": "contour", "colorbar": { "ticks": "", "outlinewidth": 0 }, "autocolorscale": true } ], "heatmap": [ { "type": "heatmap", "colorbar": { "ticks": "", "outlinewidth": 0 }, "autocolorscale": true } ], "scatter": [ { "type": "scatter", "marker": { "colorbar": { "ticks": "", "outlinewidth": 0 } } } ], "surface": [ { "type": "surface", "colorbar": { "ticks": "", "outlinewidth": 0 } } ], "heatmapgl": [ { "type": "heatmapgl", "colorbar": { "ticks": "", "outlinewidth": 0 } } ], "histogram": [ { "type": "histogram", "marker": { "colorbar": { "ticks": "", "outlinewidth": 0 } } } ], "parcoords": [ { "line": { "colorbar": { "ticks": "", "outlinewidth": 0 } }, "type": "parcoords" } ], "scatter3d": [ { "type": "scatter3d", "marker": { "colorbar": { "ticks": "", "outlinewidth": 0 } } } ], "scattergl": [ { "type": "scattergl", "marker": { "colorbar": { "ticks": "", "outlinewidth": 0 } } } ], "choropleth": [ { "type": "choropleth", "colorbar": { "ticks": "", "outlinewidth": 0 } } ], "scattergeo": [ { "type": "scattergeo", "marker": { "colorbar": { "ticks": "", "outlinewidth": 0 } } } ], "histogram2d": [ { "type": "histogram2d", "colorbar": { "ticks": "", "outlinewidth": 0 }, "autocolorscale": true } ], "scatterpolar": [ { "type": "scatterpolar", "marker": { "colorbar": { "ticks": "", "outlinewidth": 0 } } } ], "contourcarpet": [ { "type": "contourcarpet", "colorbar": { "ticks": "", "outlinewidth": 0 } } ], "scattercarpet": [ { "type": "scattercarpet", "marker": { "colorbar": { "ticks": "", "outlinewidth": 0 } } } ], "scattermapbox": [ { "type": "scattermapbox", "marker": { "colorbar": { "ticks": "", "outlinewidth": 0 } } } ], "scatterpolargl": [ { "type": "scatterpolargl", "marker": { "colorbar": { "ticks": "", "outlinewidth": 0 } } } ], "scatterternary": [ { "type": "scatterternary", "marker": { "colorbar": { "ticks": "", "outlinewidth": 0 } } } ], "histogram2dcontour": [ { "type": "histogram2dcontour", "colorbar": { "ticks": "", "outlinewidth": 0 }, "autocolorscale": true } ] }, "layout": { "geo": { "bgcolor": "white", "showland": true, "lakecolor": "white", "landcolor": "white", "showlakes": true, "subunitcolor": "#C8D4E3" }, "font": { "color": "#2a3f5f" }, "polar": { "bgcolor": "white", "radialaxis": { "ticks": "", "gridcolor": "#EBF0F8", "linecolor": "#EBF0F8" }, "angularaxis": { "ticks": "", "gridcolor": "#EBF0F8", "linecolor": "#EBF0F8" } }, "scene": { "xaxis": { "ticks": "", "gridcolor": "#DFE8F3", "gridwidth": 2, "linecolor": "#EBF0F8", "zerolinecolor": "#EBF0F8", "showbackground": true, "backgroundcolor": "white" }, "yaxis": { "ticks": "", "gridcolor": "#DFE8F3", "gridwidth": 2, "linecolor": "#EBF0F8", "zerolinecolor": "#EBF0F8", "showbackground": true, "backgroundcolor": "white" }, "zaxis": { "ticks": "", "gridcolor": "#DFE8F3", "gridwidth": 2, "linecolor": "#EBF0F8", "zerolinecolor": "#EBF0F8", "showbackground": true, "backgroundcolor": "white" } }, "title": { "x": 0.05 }, "xaxis": { "ticks": "", "gridcolor": "#EBF0F8", "linecolor": "#EBF0F8", "automargin": true, "zerolinecolor": "#EBF0F8", "zerolinewidth": 2 }, "yaxis": { "ticks": "", "gridcolor": "#EBF0F8", "linecolor": "#EBF0F8", "automargin": true, "zerolinecolor": "#EBF0F8", "zerolinewidth": 2 }, "ternary": { "aaxis": { "ticks": "", "gridcolor": "#DFE8F3", "linecolor": "#A2B1C6" }, "baxis": { "ticks": "", "gridcolor": "#DFE8F3", "linecolor": "#A2B1C6" }, "caxis": { "ticks": "", "gridcolor": "#DFE8F3", "linecolor": "#A2B1C6" }, "bgcolor": "white" }, "colorway": [ "#636efa", "#EF553B", "#00cc96", "#ab63fa", "#19d3f3", "#e763fa", "#fecb52", "#ffa15a", "#ff6692", "#b6e880" ], "hovermode": "closest", "colorscale": { "diverging": [ [ 0, "#8e0152" ], [ 0.1, "#c51b7d" ], [ 0.2, "#de77ae" ], [ 0.3, "#f1b6da" ], [ 0.4, "#fde0ef" ], [ 0.5, "#f7f7f7" ], [ 0.6, "#e6f5d0" ], [ 0.7, "#b8e186" ], [ 0.8, "#7fbc41" ], [ 0.9, "#4d9221" ], [ 1, "#276419" ] ], "sequential": [ [ 0, "#0508b8" ], [ 0.0893854748603352, "#1910d8" ], [ 0.1787709497206704, "#3c19f0" ], [ 0.2681564245810056, "#6b1cfb" ], [ 0.3575418994413408, "#981cfd" ], [ 0.44692737430167595, "#bf1cfd" ], [ 0.5363128491620112, "#dd2bfd" ], [ 0.6256983240223464, "#f246fe" ], [ 0.7150837988826816, "#fc67fd" ], [ 0.8044692737430168, "#fe88fc" ], [ 0.8938547486033519, "#fea5fd" ], [ 0.9832402234636871, "#febefe" ], [ 1, "#fec3fe" ] ], "sequentialminus": [ [ 0, "#0508b8" ], [ 0.0893854748603352, "#1910d8" ], [ 0.1787709497206704, "#3c19f0" ], [ 0.2681564245810056, "#6b1cfb" ], [ 0.3575418994413408, "#981cfd" ], [ 0.44692737430167595, "#bf1cfd" ], [ 0.5363128491620112, "#dd2bfd" ], [ 0.6256983240223464, "#f246fe" ], [ 0.7150837988826816, "#fc67fd" ], [ 0.8044692737430168, "#fe88fc" ], [ 0.8938547486033519, "#fea5fd" ], [ 0.9832402234636871, "#febefe" ], [ 1, "#fec3fe" ] ] }, "plot_bgcolor": "white", "paper_bgcolor": "white", "shapedefaults": { "line": { "width": 0 }, "opacity": 0.4, "fillcolor": "#506784" }, "annotationdefaults": { "arrowhead": 0, "arrowcolor": "#506784", "arrowwidth": 1 } }, "themeRef": "PLOTLY_WHITE" } } }, "height": null, "width": null, "user": { "profile_url": "https://chart-studio.plotly.com/~Camila.Siqueira", "avatar_url": "https://storage.googleapis.com/plotly-prod-profiles/75.jpg", "background_url": "https://storage.googleapis.com/plotly-prod-profiles/bg-14.jpg", "bio": "", "nickname": "", "website": "", "stream_tokens": null, "feature_set_id": null, "csrf_token": null, "date_joined": "2025-07-29 13:57:56", "mapbox_access_tokens": null, "has_password": null, "username": "Camila.Siqueira", "email": null, "is_active": null, "readonly": null, "is_dash_creator": null, "dash_created_count": null, "is_chart_creator": null, "charts_created_count": null } }, { "creation_time": "2025-08-06T13:46:51.762302Z", "comments": { "results": [], "count": 0 }, "parented": true, "embed_url": "https://chart-studio.plotly.com/~mgrjee8JiQF2JydtkDoW./1.embed", "fid": "mgrjee8JiQF2JydtkDoW.:1", "filename": "Plot 1", "filetype": "plot", "img_url": "https://storage.googleapis.com/plotly-prod-images/mgrjee8JiQF2JydtkDoW./1/9_3T3PWEMWUYM1SAYQNZRLSTCDTW219J.png", "image_urls": { "default": "https://storage.googleapis.com/plotly-prod-images/mgrjee8JiQF2JydtkDoW./1/2_CICG3XSQSXT85DIRRNGEQNO79ZWOXV.png", "block-thumb": "https://storage.googleapis.com/plotly-prod-images/mgrjee8JiQF2JydtkDoW./1/8_61FRWHMP8QPE5N92NJYJGQH4747KVN.png", "list-thumb": "https://storage.googleapis.com/plotly-prod-images/mgrjee8JiQF2JydtkDoW./1/9_3T3PWEMWUYM1SAYQNZRLSTCDTW219J.png" }, "api_urls": { "files": "https://api.plotly.com/v2/files/mgrjee8JiQF2JydtkDoW.:1", "plots": "https://api.plotly.com/v2/plots/mgrjee8JiQF2JydtkDoW.:1", "parent": "https://api.plotly.com/v2/folders/home?user=mgrjee8JiQF2JydtkDoW." }, "owner": "mgrjee8JiQF2JydtkDoW.", "parent": -1, "preview": "", "referencers": [], "references": [], "title": "", "views": 0, "web_url": "https://chart-studio.plotly.com/~mgrjee8JiQF2JydtkDoW./1/", "world_readable": true, "date_modified": "2025-08-07T13:22:03.769Z", "stars": { "results": [], "count": 0 }, "collaborators": { "results": [], "count": 0 }, "subfolder_count": null, "refresh_interval": null, "organize_view_url": "https://chart-studio.plotly.com/~mgrjee8JiQF2JydtkDoW./1/", "current_user_permission": "read", "is_theme": null, "is_template": false, "autosize": true, "caption": "", "figure": { "data": [ { "meta": { "columnNames": { "x": "A", "y": "B", "measure": "C" } }, "mode": "markers", "type": "waterfall", "xsrc": "mgrjee8JiQF2JydtkDoW.:0:895c68", "ysrc": "mgrjee8JiQF2JydtkDoW.:0:9af1a3", "totals": { "marker": { "color": "rgb(194, 194, 194)" } }, "connector": { "line": { "width": 2 }, "visible": true }, "measuresrc": "mgrjee8JiQF2JydtkDoW.:0:b98461", "orientation": "v", "selectedpoints": [ 1, 2, 3, 4, 5, 6, 7, 8, 9, 10 ] } ], "frames": [], "layout": { "xaxis": { "type": "category", "range": [ -0.5, 10.5 ], "autorange": true, "showspikes": false }, "yaxis": { "type": "linear", "range": [ 0, 48.21052631578947 ], "autorange": true, "showspikes": false }, "autosize": true, "dragmode": "select", "template": { "data": { "bar": [ { "type": "bar", "marker": { "colorbar": { "ticks": "", "outlinewidth": 0 } } } ], "table": [ { "type": "table", "cells": { "fill": { "color": "#EBF0F8" }, "line": { "color": "white" } }, "header": { "fill": { "color": "#C8D4E3" }, "line": { "color": "white" } } } ], "carpet": [ { "type": "carpet", "aaxis": { "gridcolor": "#C8D4E3", "linecolor": "#C8D4E3", "endlinecolor": "#2a3f5f", "minorgridcolor": "#C8D4E3", "startlinecolor": "#2a3f5f" }, "baxis": { "gridcolor": "#C8D4E3", "linecolor": "#C8D4E3", "endlinecolor": "#2a3f5f", "minorgridcolor": "#C8D4E3", "startlinecolor": "#2a3f5f" } } ], "mesh3d": [ { "type": "mesh3d", "colorbar": { "ticks": "", "outlinewidth": 0 } } ], "contour": [ { "type": "contour", "colorbar": { "ticks": "", "outlinewidth": 0 }, "autocolorscale": true } ], "heatmap": [ { "type": "heatmap", "colorbar": { "ticks": "", "outlinewidth": 0 }, "autocolorscale": true } ], "scatter": [ { "type": "scatter", "marker": { "colorbar": { "ticks": "", "outlinewidth": 0 } } } ], "surface": [ { "type": "surface", "colorbar": { "ticks": "", "outlinewidth": 0 } } ], "heatmapgl": [ { "type": "heatmapgl", "colorbar": { "ticks": "", "outlinewidth": 0 } } ], "histogram": [ { "type": "histogram", "marker": { "colorbar": { "ticks": "", "outlinewidth": 0 } } } ], "parcoords": [ { "line": { "colorbar": { "ticks": "", "outlinewidth": 0 } }, "type": "parcoords" } ], "scatter3d": [ { "type": "scatter3d", "marker": { "colorbar": { "ticks": "", "outlinewidth": 0 } } } ], "scattergl": [ { "type": "scattergl", "marker": { "colorbar": { "ticks": "", "outlinewidth": 0 } } } ], "choropleth": [ { "type": "choropleth", "colorbar": { "ticks": "", "outlinewidth": 0 } } ], "scattergeo": [ { "type": "scattergeo", "marker": { "colorbar": { "ticks": "", "outlinewidth": 0 } } } ], "histogram2d": [ { "type": "histogram2d", "colorbar": { "ticks": "", "outlinewidth": 0 }, "autocolorscale": true } ], "scatterpolar": [ { "type": "scatterpolar", "marker": { "colorbar": { "ticks": "", "outlinewidth": 0 } } } ], "contourcarpet": [ { "type": "contourcarpet", "colorbar": { "ticks": "", "outlinewidth": 0 } } ], "scattercarpet": [ { "type": "scattercarpet", "marker": { "colorbar": { "ticks": "", "outlinewidth": 0 } } } ], "scattermapbox": [ { "type": "scattermapbox", "marker": { "colorbar": { "ticks": "", "outlinewidth": 0 } } } ], "scatterpolargl": [ { "type": "scatterpolargl", "marker": { "colorbar": { "ticks": "", "outlinewidth": 0 } } } ], "scatterternary": [ { "type": "scatterternary", "marker": { "colorbar": { "ticks": "", "outlinewidth": 0 } } } ], "histogram2dcontour": [ { "type": "histogram2dcontour", "colorbar": { "ticks": "", "outlinewidth": 0 }, "autocolorscale": true } ] }, "layout": { "geo": { "bgcolor": "white", "showland": true, "lakecolor": "white", "landcolor": "white", "showlakes": true, "subunitcolor": "#C8D4E3" }, "font": { "color": "#2a3f5f" }, "polar": { "bgcolor": "white", "radialaxis": { "ticks": "", "gridcolor": "#EBF0F8", "linecolor": "#EBF0F8" }, "angularaxis": { "ticks": "", "gridcolor": "#EBF0F8", "linecolor": "#EBF0F8" } }, "scene": { "xaxis": { "ticks": "", "gridcolor": "#DFE8F3", "gridwidth": 2, "linecolor": "#EBF0F8", "zerolinecolor": "#EBF0F8", "showbackground": true, "backgroundcolor": "white" }, "yaxis": { "ticks": "", "gridcolor": "#DFE8F3", "gridwidth": 2, "linecolor": "#EBF0F8", "zerolinecolor": "#EBF0F8", "showbackground": true, "backgroundcolor": "white" }, "zaxis": { "ticks": "", "gridcolor": "#DFE8F3", "gridwidth": 2, "linecolor": "#EBF0F8", "zerolinecolor": "#EBF0F8", "showbackground": true, "backgroundcolor": "white" } }, "title": { "x": 0.05 }, "xaxis": { "ticks": "", "gridcolor": "#EBF0F8", "linecolor": "#EBF0F8", "automargin": true, "zerolinecolor": "#EBF0F8", "zerolinewidth": 2 }, "yaxis": { "ticks": "", "gridcolor": "#EBF0F8", "linecolor": "#EBF0F8", "automargin": true, "zerolinecolor": "#EBF0F8", "zerolinewidth": 2 }, "ternary": { "aaxis": { "ticks": "", "gridcolor": "#DFE8F3", "linecolor": "#A2B1C6" }, "baxis": { "ticks": "", "gridcolor": "#DFE8F3", "linecolor": "#A2B1C6" }, "caxis": { "ticks": "", "gridcolor": "#DFE8F3", "linecolor": "#A2B1C6" }, "bgcolor": "white" }, "colorway": [ "#636efa", "#EF553B", "#00cc96", "#ab63fa", "#19d3f3", "#e763fa", "#fecb52", "#ffa15a", "#ff6692", "#b6e880" ], "hovermode": "closest", "colorscale": { "diverging": [ [ 0, "#8e0152" ], [ 0.1, "#c51b7d" ], [ 0.2, "#de77ae" ], [ 0.3, "#f1b6da" ], [ 0.4, "#fde0ef" ], [ 0.5, "#f7f7f7" ], [ 0.6, "#e6f5d0" ], [ 0.7, "#b8e186" ], [ 0.8, "#7fbc41" ], [ 0.9, "#4d9221" ], [ 1, "#276419" ] ], "sequential": [ [ 0, "#0508b8" ], [ 0.0893854748603352, "#1910d8" ], [ 0.1787709497206704, "#3c19f0" ], [ 0.2681564245810056, "#6b1cfb" ], [ 0.3575418994413408, "#981cfd" ], [ 0.44692737430167595, "#bf1cfd" ], [ 0.5363128491620112, "#dd2bfd" ], [ 0.6256983240223464, "#f246fe" ], [ 0.7150837988826816, "#fc67fd" ], [ 0.8044692737430168, "#fe88fc" ], [ 0.8938547486033519, "#fea5fd" ], [ 0.9832402234636871, "#febefe" ], [ 1, "#fec3fe" ] ], "sequentialminus": [ [ 0, "#0508b8" ], [ 0.0893854748603352, "#1910d8" ], [ 0.1787709497206704, "#3c19f0" ], [ 0.2681564245810056, "#6b1cfb" ], [ 0.3575418994413408, "#981cfd" ], [ 0.44692737430167595, "#bf1cfd" ], [ 0.5363128491620112, "#dd2bfd" ], [ 0.6256983240223464, "#f246fe" ], [ 0.7150837988826816, "#fc67fd" ], [ 0.8044692737430168, "#fe88fc" ], [ 0.8938547486033519, "#fea5fd" ], [ 0.9832402234636871, "#febefe" ], [ 1, "#fec3fe" ] ] }, "plot_bgcolor": "white", "paper_bgcolor": "white", "shapedefaults": { "line": { "width": 0 }, "opacity": 0.4, "fillcolor": "#506784" }, "annotationdefaults": { "arrowhead": 0, "arrowcolor": "#506784", "arrowwidth": 1 } }, "themeRef": "PLOTLY_WHITE" }, "hovermode": "x", "waterfallmode": "group" } }, "height": null, "width": null, "user": { "profile_url": "https://chart-studio.plotly.com/~mgrjee8JiQF2JydtkDoW.", "avatar_url": "https://storage.googleapis.com/plotly-prod-profiles/79.jpg", "background_url": "https://storage.googleapis.com/plotly-prod-profiles/bg-1.jpg", "bio": "", "nickname": "", "website": "", "stream_tokens": null, "feature_set_id": null, "csrf_token": null, "date_joined": "2025-07-22 09:10:44", "mapbox_access_tokens": null, "has_password": null, "username": "mgrjee8JiQF2JydtkDoW.", "email": null, "is_active": null, "readonly": null, "is_dash_creator": null, "dash_created_count": null, "is_chart_creator": null, "charts_created_count": null } }, { "creation_time": "2025-08-06T13:44:03.746537Z", "comments": { "results": [], "count": 0 }, "parented": true, "embed_url": "https://chart-studio.plotly.com/~swegner98/1.embed", "fid": "swegner98:1", "filename": "Plot 1", "filetype": "plot", "img_url": "https://storage.googleapis.com/plotly-prod-images/swegner98/1/9_62PTQJOS00TDRIM3P1QPOC87BCI47H.png", "image_urls": { "default": "https://storage.googleapis.com/plotly-prod-images/swegner98/1/2_FVMM9ZXVMU7AGCRUA10TPPI1ABMFH9.png", "block-thumb": "https://storage.googleapis.com/plotly-prod-images/swegner98/1/8_DCGSNBVVG3Z6TXRY7D5WCOBSGHSJOQ.png", "list-thumb": "https://storage.googleapis.com/plotly-prod-images/swegner98/1/9_62PTQJOS00TDRIM3P1QPOC87BCI47H.png" }, "api_urls": { "files": "https://api.plotly.com/v2/files/swegner98:1", "plots": "https://api.plotly.com/v2/plots/swegner98:1", "parent": "https://api.plotly.com/v2/folders/home?user=swegner98" }, "owner": "swegner98", "parent": -1, "preview": "", "referencers": [], "references": [], "title": "", "views": 0, "web_url": "https://chart-studio.plotly.com/~swegner98/1/", "world_readable": true, "date_modified": "2025-08-06T15:49:12.514Z", "stars": { "results": [], "count": 0 }, "collaborators": { "results": [], "count": 0 }, "subfolder_count": null, "refresh_interval": null, "organize_view_url": "https://chart-studio.plotly.com/~swegner98/1/", "current_user_permission": "read", "is_theme": null, "is_template": false, "autosize": true, "caption": "", "figure": { "data": [ { "meta": { "columnNames": { "x": "", "y": "Fehlerentwicklung Sham" } }, "mode": "markers", "name": "Sham", "type": "box", "ysrc": "swegner98:0:a409fc", "boxpoints": false, "orientation": "v" }, { "meta": { "columnNames": { "y": "Fehlerentwicklung Stim" } }, "name": "Stim", "type": "box", "ysrc": "swegner98:0:262fee", "boxpoints": false }, { "meta": { "columnNames": { "y": "Fehlerentwicklung Split" } }, "name": "Split", "type": "box", "ysrc": "swegner98:0:e7bc51", "boxpoints": false } ], "frames": [], "layout": { "title": { "text": "" }, "xaxis": { "type": "category", "range": [ -0.5, 2.5 ], "title": { "text": "Stimulationssetting" }, "autorange": false }, "yaxis": { "type": "linear", "range": [ -3.4444444444444446, 5.444444444444445 ], "title": { "text": "Fehlerentwicklung" }, "autorange": false }, "autosize": true, "template": { "data": { "bar": [ { "type": "bar", "marker": { "colorbar": { "ticks": "", "outlinewidth": 0 } } } ], "table": [ { "type": "table", "cells": { "fill": { "color": "#EBF0F8" }, "line": { "color": "white" } }, "header": { "fill": { "color": "#C8D4E3" }, "line": { "color": "white" } } } ], "carpet": [ { "type": "carpet", "aaxis": { "gridcolor": "#C8D4E3", "linecolor": "#C8D4E3", "endlinecolor": "#2a3f5f", "minorgridcolor": "#C8D4E3", "startlinecolor": "#2a3f5f" }, "baxis": { "gridcolor": "#C8D4E3", "linecolor": "#C8D4E3", "endlinecolor": "#2a3f5f", "minorgridcolor": "#C8D4E3", "startlinecolor": "#2a3f5f" } } ], "mesh3d": [ { "type": "mesh3d", "colorbar": { "ticks": "", "outlinewidth": 0 } } ], "contour": [ { "type": "contour", "colorbar": { "ticks": "", "outlinewidth": 0 }, "autocolorscale": true } ], "heatmap": [ { "type": "heatmap", "colorbar": { "ticks": "", "outlinewidth": 0 }, "autocolorscale": true } ], "scatter": [ { "type": "scatter", "marker": { "colorbar": { "ticks": "", "outlinewidth": 0 } } } ], "surface": [ { "type": "surface", "colorbar": { "ticks": "", "outlinewidth": 0 } } ], "heatmapgl": [ { "type": "heatmapgl", "colorbar": { "ticks": "", "outlinewidth": 0 } } ], "histogram": [ { "type": "histogram", "marker": { "colorbar": { "ticks": "", "outlinewidth": 0 } } } ], "parcoords": [ { "line": { "colorbar": { "ticks": "", "outlinewidth": 0 } }, "type": "parcoords" } ], "scatter3d": [ { "type": "scatter3d", "marker": { "colorbar": { "ticks": "", "outlinewidth": 0 } } } ], "scattergl": [ { "type": "scattergl", "marker": { "colorbar": { "ticks": "", "outlinewidth": 0 } } } ], "choropleth": [ { "type": "choropleth", "colorbar": { "ticks": "", "outlinewidth": 0 } } ], "scattergeo": [ { "type": "scattergeo", "marker": { "colorbar": { "ticks": "", "outlinewidth": 0 } } } ], "histogram2d": [ { "type": "histogram2d", "colorbar": { "ticks": "", "outlinewidth": 0 }, "autocolorscale": true } ], "scatterpolar": [ { "type": "scatterpolar", "marker": { "colorbar": { "ticks": "", "outlinewidth": 0 } } } ], "contourcarpet": [ { "type": "contourcarpet", "colorbar": { "ticks": "", "outlinewidth": 0 } } ], "scattercarpet": [ { "type": "scattercarpet", "marker": { "colorbar": { "ticks": "", "outlinewidth": 0 } } } ], "scattermapbox": [ { "type": "scattermapbox", "marker": { "colorbar": { "ticks": "", "outlinewidth": 0 } } } ], "scatterpolargl": [ { "type": "scatterpolargl", "marker": { "colorbar": { "ticks": "", "outlinewidth": 0 } } } ], "scatterternary": [ { "type": "scatterternary", "marker": { "colorbar": { "ticks": "", "outlinewidth": 0 } } } ], "histogram2dcontour": [ { "type": "histogram2dcontour", "colorbar": { "ticks": "", "outlinewidth": 0 }, "autocolorscale": true } ] }, "layout": { "geo": { "bgcolor": "white", "showland": true, "lakecolor": "white", "landcolor": "white", "showlakes": true, "subunitcolor": "#C8D4E3" }, "font": { "color": "#2a3f5f" }, "polar": { "bgcolor": "white", "radialaxis": { "ticks": "", "gridcolor": "#EBF0F8", "linecolor": "#EBF0F8" }, "angularaxis": { "ticks": "", "gridcolor": "#EBF0F8", "linecolor": "#EBF0F8" } }, "scene": { "xaxis": { "ticks": "", "gridcolor": "#DFE8F3", "gridwidth": 2, "linecolor": "#EBF0F8", "zerolinecolor": "#EBF0F8", "showbackground": true, "backgroundcolor": "white" }, "yaxis": { "ticks": "", "gridcolor": "#DFE8F3", "gridwidth": 2, "linecolor": "#EBF0F8", "zerolinecolor": "#EBF0F8", "showbackground": true, "backgroundcolor": "white" }, "zaxis": { "ticks": "", "gridcolor": "#DFE8F3", "gridwidth": 2, "linecolor": "#EBF0F8", "zerolinecolor": "#EBF0F8", "showbackground": true, "backgroundcolor": "white" } }, "title": { "x": 0.05 }, "xaxis": { "ticks": "", "gridcolor": "#EBF0F8", "linecolor": "#EBF0F8", "automargin": true, "zerolinecolor": "#EBF0F8", "zerolinewidth": 2 }, "yaxis": { "ticks": "", "gridcolor": "#EBF0F8", "linecolor": "#EBF0F8", "automargin": true, "zerolinecolor": "#EBF0F8", "zerolinewidth": 2 }, "ternary": { "aaxis": { "ticks": "", "gridcolor": "#DFE8F3", "linecolor": "#A2B1C6" }, "baxis": { "ticks": "", "gridcolor": "#DFE8F3", "linecolor": "#A2B1C6" }, "caxis": { "ticks": "", "gridcolor": "#DFE8F3", "linecolor": "#A2B1C6" }, "bgcolor": "white" }, "colorway": [ "#636efa", "#EF553B", "#00cc96", "#ab63fa", "#19d3f3", "#e763fa", "#fecb52", "#ffa15a", "#ff6692", "#b6e880" ], "hovermode": "closest", "colorscale": { "diverging": [ [ 0, "#8e0152" ], [ 0.1, "#c51b7d" ], [ 0.2, "#de77ae" ], [ 0.3, "#f1b6da" ], [ 0.4, "#fde0ef" ], [ 0.5, "#f7f7f7" ], [ 0.6, "#e6f5d0" ], [ 0.7, "#b8e186" ], [ 0.8, "#7fbc41" ], [ 0.9, "#4d9221" ], [ 1, "#276419" ] ], "sequential": [ [ 0, "#0508b8" ], [ 0.0893854748603352, "#1910d8" ], [ 0.1787709497206704, "#3c19f0" ], [ 0.2681564245810056, "#6b1cfb" ], [ 0.3575418994413408, "#981cfd" ], [ 0.44692737430167595, "#bf1cfd" ], [ 0.5363128491620112, "#dd2bfd" ], [ 0.6256983240223464, "#f246fe" ], [ 0.7150837988826816, "#fc67fd" ], [ 0.8044692737430168, "#fe88fc" ], [ 0.8938547486033519, "#fea5fd" ], [ 0.9832402234636871, "#febefe" ], [ 1, "#fec3fe" ] ], "sequentialminus": [ [ 0, "#0508b8" ], [ 0.0893854748603352, "#1910d8" ], [ 0.1787709497206704, "#3c19f0" ], [ 0.2681564245810056, "#6b1cfb" ], [ 0.3575418994413408, "#981cfd" ], [ 0.44692737430167595, "#bf1cfd" ], [ 0.5363128491620112, "#dd2bfd" ], [ 0.6256983240223464, "#f246fe" ], [ 0.7150837988826816, "#fc67fd" ], [ 0.8044692737430168, "#fe88fc" ], [ 0.8938547486033519, "#fea5fd" ], [ 0.9832402234636871, "#febefe" ], [ 1, "#fec3fe" ] ] }, "plot_bgcolor": "white", "paper_bgcolor": "white", "shapedefaults": { "line": { "width": 0 }, "opacity": 0.4, "fillcolor": "#506784" }, "annotationdefaults": { "arrowhead": 0, "arrowcolor": "#506784", "arrowwidth": 1 } }, "themeRef": "PLOTLY_WHITE" } } }, "height": null, "width": null, "user": { "profile_url": "https://chart-studio.plotly.com/~swegner98", "avatar_url": "https://storage.googleapis.com/plotly-prod-profiles/8.jpg", "background_url": "https://storage.googleapis.com/plotly-prod-profiles/bg-13.jpg", "bio": "", "nickname": "", "website": "", "stream_tokens": null, "feature_set_id": null, "csrf_token": null, "date_joined": "2025-08-06 13:26:15", "mapbox_access_tokens": null, "has_password": null, "username": "swegner98", "email": null, "is_active": null, "readonly": null, "is_dash_creator": null, "dash_created_count": null, "is_chart_creator": null, "charts_created_count": null } }, { "creation_time": "2025-08-06T13:28:02.833789Z", "comments": { "results": [], "count": 0 }, "parented": true, "embed_url": "https://chart-studio.plotly.com/~quincyh/3.embed", "fid": "quincyh:3", "filename": "Plot 3", "filetype": "plot", "img_url": "https://storage.googleapis.com/plotly-prod-images/quincyh/3/9_BOACULHCGTKKDWU8R4F9N87EQII88Q.png", "image_urls": { "default": "https://storage.googleapis.com/plotly-prod-images/quincyh/3/2_PHRSMHTLYKQECICUQJZ0L4YJZAKFS2.png", "block-thumb": "https://storage.googleapis.com/plotly-prod-images/quincyh/3/8_ILOVG5WH02HQDQYHJT2T26P7LNYWKD.png", "list-thumb": "https://storage.googleapis.com/plotly-prod-images/quincyh/3/9_BOACULHCGTKKDWU8R4F9N87EQII88Q.png" }, "api_urls": { "files": "https://api.plotly.com/v2/files/quincyh:3", "plots": "https://api.plotly.com/v2/plots/quincyh:3", "parent": "https://api.plotly.com/v2/folders/home?user=quincyh" }, "owner": "quincyh", "parent": -1, "preview": "", "referencers": [], "references": [], "title": "", "views": 0, "web_url": "https://chart-studio.plotly.com/~quincyh/3/", "world_readable": true, "date_modified": "2025-08-06T13:28:02.846Z", "stars": { "results": [], "count": 0 }, "collaborators": { "results": [], "count": 0 }, "subfolder_count": null, "refresh_interval": null, "organize_view_url": "https://chart-studio.plotly.com/~quincyh/3/", "current_user_permission": "read", "is_theme": null, "is_template": false, "autosize": true, "caption": "", "figure": { "data": [ { "meta": { "columnNames": { "x": "x", "y": "y" } }, "mode": "lines", "type": "scatter", "xsrc": "quincyh:2:88ffd2", "ysrc": "quincyh:2:dd8b8b" } ], "frames": [], "layout": { "font": { "size": 16 }, "title": { "x": 0.5, "font": { "size": 30 }, "text": "Laser Frequency Over Time" }, "xaxis": { "type": "linear", "range": [ 0.006183602957796186, 2.9987891116923384 ], "title": { "text": "Minutes" }, "autorange": true }, "yaxis": { "type": "linear", "range": [ 469.3267601512109, 469.32679316136796 ], "title": { "text": "kHz" }, "autorange": true }, "margin": { "l": 100, "r": 95, "t": 100, "pad": 0 }, "autosize": true } }, "height": null, "width": null, "user": { "profile_url": "https://chart-studio.plotly.com/~quincyh", "avatar_url": "https://storage.googleapis.com/plotly-prod-profiles/92.jpg", "background_url": "https://storage.googleapis.com/plotly-prod-profiles/bg-14.jpg", "bio": "", "nickname": "", "website": "", "stream_tokens": null, "feature_set_id": null, "csrf_token": null, "date_joined": "2025-08-01 14:37:06", "mapbox_access_tokens": null, "has_password": null, "username": "quincyh", "email": null, "is_active": null, "readonly": null, "is_dash_creator": null, "dash_created_count": null, "is_chart_creator": null, "charts_created_count": null } }, { "creation_time": "2025-08-06T12:40:04.119649Z", "comments": { "results": [], "count": 0 }, "parented": true, "embed_url": "https://chart-studio.plotly.com/~MeenalK/1.embed", "fid": "MeenalK:1", "filename": "Plot 1", "filetype": "plot", "img_url": "https://storage.googleapis.com/plotly-prod-images/MeenalK/1/9_MENV63B68N88P4QNUC00M82T2FGPKN.png", "image_urls": { "default": "https://storage.googleapis.com/plotly-prod-images/MeenalK/1/2_OM8DC6K49VOX2KASHO9QU3EHA1QY12.png", "block-thumb": "https://storage.googleapis.com/plotly-prod-images/MeenalK/1/8_EA2E8FOCU230BE1A24TNIY0BG0C368.png", "list-thumb": "https://storage.googleapis.com/plotly-prod-images/MeenalK/1/9_MENV63B68N88P4QNUC00M82T2FGPKN.png" }, "api_urls": { "files": "https://api.plotly.com/v2/files/MeenalK:1", "plots": "https://api.plotly.com/v2/plots/MeenalK:1", "parent": "https://api.plotly.com/v2/folders/home?user=MeenalK" }, "owner": "MeenalK", "parent": -1, "preview": "", "referencers": [], "references": [], "title": "", "views": 1, "web_url": "https://chart-studio.plotly.com/~MeenalK/1/", "world_readable": true, "date_modified": "2025-08-06T12:40:04.132Z", "stars": { "results": [], "count": 0 }, "collaborators": { "results": [], "count": 0 }, "subfolder_count": null, "refresh_interval": null, "organize_view_url": "https://chart-studio.plotly.com/~MeenalK/1/", "current_user_permission": "read", "is_theme": null, "is_template": false, "autosize": true, "caption": "", "figure": { "data": [ { "meta": { "columnNames": { "x": "A", "y": "B" } }, "mode": "lines", "name": "Simulated test frequncy [Hz}", "type": "scatter", "xsrc": "MeenalK:0:376e3c", "ysrc": "MeenalK:0:579747" }, { "meta": { "columnNames": { "x": "A", "y": "D" } }, "mode": "lines", "name": "Toatl chnage in active power %", "type": "scatter", "xsrc": "MeenalK:0:376e3c", "ysrc": "MeenalK:0:e95568", "xaxis": "x", "yaxis": "y2", "stackgroup": null } ], "frames": [], "layout": { "title": { "text": "Click to enter Plot title" }, "xaxis": { "type": "linear", "range": [ 0, 27 ], "title": { "text": "Time t is minutes" }, "autorange": true }, "yaxis": { "side": "left", "type": "linear", "range": [ 49.916666666666664, 51.583333333333336 ], "title": { "text": "Simulated frequency in HZ " }, "autorange": true }, "legend": { "x": 0.7826666666666666, "y": 0.6086505190311418 }, "yaxis2": { "side": "right", "type": "linear", "range": [ -68.61111111111111, 3.6111111111111116 ], "title": { "text": "Total active power chnage in %" }, "autorange": true, "overlaying": "y" }, "autosize": true, "template": { "data": { "bar": [ { "type": "bar", "marker": { "colorbar": { "ticks": "", "outlinewidth": 0 } } } ], "table": [ { "type": "table", "cells": { "fill": { "color": "#EBF0F8" }, "line": { "color": "white" } }, "header": { "fill": { "color": "#C8D4E3" }, "line": { "color": "white" } } } ], "carpet": [ { "type": "carpet", "aaxis": { "gridcolor": "#C8D4E3", "linecolor": "#C8D4E3", "endlinecolor": "#2a3f5f", "minorgridcolor": "#C8D4E3", "startlinecolor": "#2a3f5f" }, "baxis": { "gridcolor": "#C8D4E3", "linecolor": "#C8D4E3", "endlinecolor": "#2a3f5f", "minorgridcolor": "#C8D4E3", "startlinecolor": "#2a3f5f" } } ], "mesh3d": [ { "type": "mesh3d", "colorbar": { "ticks": "", "outlinewidth": 0 } } ], "contour": [ { "type": "contour", "colorbar": { "ticks": "", "outlinewidth": 0 }, "autocolorscale": true } ], "heatmap": [ { "type": "heatmap", "colorbar": { "ticks": "", "outlinewidth": 0 }, "autocolorscale": true } ], "scatter": [ { "type": "scatter", "marker": { "colorbar": { "ticks": "", "outlinewidth": 0 } } } ], "surface": [ { "type": "surface", "colorbar": { "ticks": "", "outlinewidth": 0 } } ], "heatmapgl": [ { "type": "heatmapgl", "colorbar": { "ticks": "", "outlinewidth": 0 } } ], "histogram": [ { "type": "histogram", "marker": { "colorbar": { "ticks": "", "outlinewidth": 0 } } } ], "parcoords": [ { "line": { "colorbar": { "ticks": "", "outlinewidth": 0 } }, "type": "parcoords" } ], "scatter3d": [ { "type": "scatter3d", "marker": { "colorbar": { "ticks": "", "outlinewidth": 0 } } } ], "scattergl": [ { "type": "scattergl", "marker": { "colorbar": { "ticks": "", "outlinewidth": 0 } } } ], "choropleth": [ { "type": "choropleth", "colorbar": { "ticks": "", "outlinewidth": 0 } } ], "scattergeo": [ { "type": "scattergeo", "marker": { "colorbar": { "ticks": "", "outlinewidth": 0 } } } ], "histogram2d": [ { "type": "histogram2d", "colorbar": { "ticks": "", "outlinewidth": 0 }, "autocolorscale": true } ], "scatterpolar": [ { "type": "scatterpolar", "marker": { "colorbar": { "ticks": "", "outlinewidth": 0 } } } ], "contourcarpet": [ { "type": "contourcarpet", "colorbar": { "ticks": "", "outlinewidth": 0 } } ], "scattercarpet": [ { "type": "scattercarpet", "marker": { "colorbar": { "ticks": "", "outlinewidth": 0 } } } ], "scattermapbox": [ { "type": "scattermapbox", "marker": { "colorbar": { "ticks": "", "outlinewidth": 0 } } } ], "scatterpolargl": [ { "type": "scatterpolargl", "marker": { "colorbar": { "ticks": "", "outlinewidth": 0 } } } ], "scatterternary": [ { "type": "scatterternary", "marker": { "colorbar": { "ticks": "", "outlinewidth": 0 } } } ], "histogram2dcontour": [ { "type": "histogram2dcontour", "colorbar": { "ticks": "", "outlinewidth": 0 }, "autocolorscale": true } ] }, "layout": { "geo": { "bgcolor": "white", "showland": true, "lakecolor": "white", "landcolor": "white", "showlakes": true, "subunitcolor": "#C8D4E3" }, "font": { "color": "#2a3f5f" }, "polar": { "bgcolor": "white", "radialaxis": { "ticks": "", "gridcolor": "#EBF0F8", "linecolor": "#EBF0F8" }, "angularaxis": { "ticks": "", "gridcolor": "#EBF0F8", "linecolor": "#EBF0F8" } }, "scene": { "xaxis": { "ticks": "", "gridcolor": "#DFE8F3", "gridwidth": 2, "linecolor": "#EBF0F8", "zerolinecolor": "#EBF0F8", "showbackground": true, "backgroundcolor": "white" }, "yaxis": { "ticks": "", "gridcolor": "#DFE8F3", "gridwidth": 2, "linecolor": "#EBF0F8", "zerolinecolor": "#EBF0F8", "showbackground": true, "backgroundcolor": "white" }, "zaxis": { "ticks": "", "gridcolor": "#DFE8F3", "gridwidth": 2, "linecolor": "#EBF0F8", "zerolinecolor": "#EBF0F8", "showbackground": true, "backgroundcolor": "white" } }, "title": { "x": 0.05 }, "xaxis": { "ticks": "", "gridcolor": "#EBF0F8", "linecolor": "#EBF0F8", "automargin": true, "zerolinecolor": "#EBF0F8", "zerolinewidth": 2 }, "yaxis": { "ticks": "", "gridcolor": "#EBF0F8", "linecolor": "#EBF0F8", "automargin": true, "zerolinecolor": "#EBF0F8", "zerolinewidth": 2 }, "ternary": { "aaxis": { "ticks": "", "gridcolor": "#DFE8F3", "linecolor": "#A2B1C6" }, "baxis": { "ticks": "", "gridcolor": "#DFE8F3", "linecolor": "#A2B1C6" }, "caxis": { "ticks": "", "gridcolor": "#DFE8F3", "linecolor": "#A2B1C6" }, "bgcolor": "white" }, "colorway": [ "#636efa", "#EF553B", "#00cc96", "#ab63fa", "#19d3f3", "#e763fa", "#fecb52", "#ffa15a", "#ff6692", "#b6e880" ], "hovermode": "closest", "colorscale": { "diverging": [ [ 0, "#8e0152" ], [ 0.1, "#c51b7d" ], [ 0.2, "#de77ae" ], [ 0.3, "#f1b6da" ], [ 0.4, "#fde0ef" ], [ 0.5, "#f7f7f7" ], [ 0.6, "#e6f5d0" ], [ 0.7, "#b8e186" ], [ 0.8, "#7fbc41" ], [ 0.9, "#4d9221" ], [ 1, "#276419" ] ], "sequential": [ [ 0, "#0508b8" ], [ 0.0893854748603352, "#1910d8" ], [ 0.1787709497206704, "#3c19f0" ], [ 0.2681564245810056, "#6b1cfb" ], [ 0.3575418994413408, "#981cfd" ], [ 0.44692737430167595, "#bf1cfd" ], [ 0.5363128491620112, "#dd2bfd" ], [ 0.6256983240223464, "#f246fe" ], [ 0.7150837988826816, "#fc67fd" ], [ 0.8044692737430168, "#fe88fc" ], [ 0.8938547486033519, "#fea5fd" ], [ 0.9832402234636871, "#febefe" ], [ 1, "#fec3fe" ] ], "sequentialminus": [ [ 0, "#0508b8" ], [ 0.0893854748603352, "#1910d8" ], [ 0.1787709497206704, "#3c19f0" ], [ 0.2681564245810056, "#6b1cfb" ], [ 0.3575418994413408, "#981cfd" ], [ 0.44692737430167595, "#bf1cfd" ], [ 0.5363128491620112, "#dd2bfd" ], [ 0.6256983240223464, "#f246fe" ], [ 0.7150837988826816, "#fc67fd" ], [ 0.8044692737430168, "#fe88fc" ], [ 0.8938547486033519, "#fea5fd" ], [ 0.9832402234636871, "#febefe" ], [ 1, "#fec3fe" ] ] }, "plot_bgcolor": "white", "paper_bgcolor": "white", "shapedefaults": { "line": { "width": 0 }, "opacity": 0.4, "fillcolor": "#506784" }, "annotationdefaults": { "arrowhead": 0, "arrowcolor": "#506784", "arrowwidth": 1 } }, "themeRef": "PLOTLY_WHITE" } } }, "height": null, "width": null, "user": { "profile_url": "https://chart-studio.plotly.com/~MeenalK", "avatar_url": "https://storage.googleapis.com/plotly-prod-profiles/55.jpg", "background_url": "https://storage.googleapis.com/plotly-prod-profiles/bg-10.jpg", "bio": "", "nickname": "", "website": "", "stream_tokens": null, "feature_set_id": null, "csrf_token": null, "date_joined": "2025-08-06 12:39:00", "mapbox_access_tokens": null, "has_password": null, "username": "MeenalK", "email": null, "is_active": null, "readonly": null, "is_dash_creator": null, "dash_created_count": null, "is_chart_creator": null, "charts_created_count": null } }, { "creation_time": "2025-08-06T12:14:44.837816Z", "comments": { "results": [], "count": 0 }, "parented": true, "embed_url": "https://chart-studio.plotly.com/~Parping/19.embed", "fid": "Parping:19", "filename": "Plot 19", "filetype": "plot", "img_url": "https://storage.googleapis.com/plotly-prod-images/Parping/19/9_NDP3D87MFG89O2J83F940BZO1PU0RV.png", "image_urls": { "default": "https://storage.googleapis.com/plotly-prod-images/Parping/19/2_WWWUWOWX8YI9YSLN21FIS8CCP71FZS.png", "block-thumb": "https://storage.googleapis.com/plotly-prod-images/Parping/19/8_TYECS6BO0L27PK6BMT1KLK8DMHTYI6.png", "list-thumb": "https://storage.googleapis.com/plotly-prod-images/Parping/19/9_NDP3D87MFG89O2J83F940BZO1PU0RV.png" }, "api_urls": { "files": "https://api.plotly.com/v2/files/Parping:19", "plots": "https://api.plotly.com/v2/plots/Parping:19", "parent": "https://api.plotly.com/v2/folders/home?user=Parping" }, "owner": "Parping", "parent": -1, "preview": "", "referencers": [], "references": [], "title": "", "views": 17, "web_url": "https://chart-studio.plotly.com/~Parping/19/", "world_readable": true, "date_modified": "2025-08-06T14:40:42.982Z", "stars": { "results": [], "count": 0 }, "collaborators": { "results": [], "count": 0 }, "subfolder_count": null, "refresh_interval": null, "organize_view_url": "https://chart-studio.plotly.com/~Parping/19/", "current_user_permission": "read", "is_theme": null, "is_template": false, "autosize": true, "caption": "", "figure": { "data": [ { "line": { "dash": "dot", "color": "rgb(17, 0, 255)", "width": 3 }, "meta": { "columnNames": { "x": "A", "y": "I" } }, "mode": "lines", "name": "Niveau PHEC", "type": "scatter", "xsrc": "Parping:14:4eac14", "ysrc": "Parping:14:ddd312", "opacity": 0.5, "stackgroup": null }, { "line": { "dash": "dash", "color": "rgb(242, 184, 74)" }, "meta": { "columnNames": { "x": "A", "y": "B" } }, "mode": "lines", "name": "Tête PZ1", "type": "scatter", "xsrc": "Parping:15:39cff7", "ysrc": "Parping:15:79d3f8", "opacity": 0.5, "visible": true, "stackgroup": null, "legendgroup": 1 }, { "meta": { "columnNames": { "x": "A", "y": "B" } }, "mode": "markers+lines", "name": "PZ1", "type": "scatter", "xsrc": "Parping:16:e9a22c", "ysrc": "Parping:16:38b0cd", "marker": { "size": 3, "color": "rgb(242, 184, 74)", "symbol": "circle" }, "visible": true, "legendgroup": 1 }, { "line": { "dash": "dash", "color": "rgb(242, 184, 74)" }, "meta": { "columnNames": { "x": "A", "y": "C" } }, "mode": "lines", "name": "Fond PZ1", "type": "scatter", "xsrc": "Parping:15:39cff7", "ysrc": "Parping:15:1ad8bb", "opacity": 0.5, "visible": true, "stackgroup": null, "legendgroup": 1 }, { "line": { "dash": "dash", "color": "rgb(247, 79, 73)" }, "meta": { "columnNames": { "x": "A", "y": "D" } }, "mode": "lines", "name": "Tête PZ2", "type": "scatter", "xsrc": "Parping:15:39cff7", "ysrc": "Parping:15:ebbcd0", "opacity": 0.5, "visible": true, "stackgroup": null, "legendgroup": 2 }, { "meta": { "columnNames": { "x": "A", "y": "C" } }, "mode": "markers+lines", "name": "PZ2", "type": "scatter", "xsrc": "Parping:16:e9a22c", "ysrc": "Parping:16:2eb969", "marker": { "size": 3, "color": "rgb(247, 79, 73)" }, "visible": true, "stackgroup": null, "legendgroup": 2 }, { "line": { "dash": "dash", "color": "rgb(247, 79, 73)" }, "meta": { "columnNames": { "x": "A", "y": "E" } }, "mode": "lines", "name": "Fond PZ2", "type": "scatter", "xsrc": "Parping:15:39cff7", "ysrc": "Parping:15:fdb25f", "opacity": 0.5, "visible": true, "stackgroup": null, "legendgroup": 2 }, { "line": { "dash": "dash", "color": "rgb(17, 183, 40)" }, "meta": { "columnNames": { "x": "A", "y": "F" } }, "mode": "lines", "name": "Tête PZ5", "type": "scatter", "xsrc": "Parping:15:39cff7", "ysrc": "Parping:15:fc3a67", "opacity": 0.5, "visible": true, "stackgroup": null, "legendgroup": 3 }, { "meta": { "columnNames": { "x": "A", "y": "D" } }, "mode": "markers+lines", "name": "PZ5", "type": "scatter", "xsrc": "Parping:16:e9a22c", "ysrc": "Parping:16:40104d", "marker": { "size": 3, "color": "rgb(17, 183, 40)" }, "visible": true, "stackgroup": null, "legendgroup": 3 }, { "line": { "dash": "dash", "color": "rgb(17, 183, 40)" }, "meta": { "columnNames": { "x": "A", "y": "G" } }, "mode": "lines", "name": "Fond PZ5", "type": "scatter", "xsrc": "Parping:15:39cff7", "ysrc": "Parping:15:e13438", "opacity": 0.5, "visible": true, "stackgroup": null, "legendgroup": 3 }, { "line": { "color": "rgb(190, 187, 194)" }, "meta": { "columnNames": { "x": "A", "y": "B" } }, "mode": "lines", "name": "Station Èvre (données pré-validées)", "type": "scatter", "xsrc": "Parping:17:f1655f", "ysrc": "Parping:17:813c30", "opacity": 0.5, "visible": true, "legendgroup": 4 }, { "line": { "color": "rgb(242, 144, 240)" }, "meta": { "columnNames": { "x": "A", "y": "C" } }, "mode": "lines", "name": "Station Èvre (données brutes)", "type": "scatter", "xsrc": "Parping:17:f1655f", "ysrc": "Parping:17:1e0e76", "opacity": 0.5, "visible": true, "legendgroup": 4 }, { "line": { "dash": "longdashdot", "color": "rgb(59, 124, 239)", "shape": "linear", "width": 4 }, "meta": { "columnNames": { "x": "A", "y": "B" } }, "mode": "lines", "name": "Assise poste de refoulement", "type": "scatter", "xsrc": "Parping:14:4eac14", "ysrc": "Parping:14:b83d75", "opacity": 1, "visible": "legendonly", "stackgroup": null }, { "line": { "dash": "longdashdot", "color": "rgb(232, 100, 232)", "width": 4 }, "meta": { "columnNames": { "x": "A", "y": "C" } }, "mode": "lines", "name": "Assise bassin d'aération", "type": "scatter", "xsrc": "Parping:14:4eac14", "ysrc": "Parping:14:516e75", "visible": "legendonly", "stackgroup": null, "legendgroup": 5 }, { "line": { "dash": "longdashdot", "color": "rgb(128, 0, 128)", "width": 4 }, "meta": { "columnNames": { "x": "A", "y": "D" } }, "mode": "lines", "name": "Assise dégazeur", "type": "scatter", "xsrc": "Parping:14:4eac14", "ysrc": "Parping:14:59ec65", "visible": "legendonly", "stackgroup": null, "legendgroup": 5 }, { "line": { "dash": "longdashdot", "color": "rgb(8, 194, 194)", "width": 4 }, "meta": { "columnNames": { "x": "A", "y": "E" } }, "mode": "lines", "name": "Assise clarificateur", "type": "scatter", "xsrc": "Parping:14:4eac14", "ysrc": "Parping:14:39bba3", "visible": "legendonly", "stackgroup": null, "legendgroup": 6 }, { "line": { "dash": "longdashdot", "color": "rgb(15, 131, 131)", "width": 4 }, "meta": { "columnNames": { "x": "A", "y": "F" } }, "mode": "lines", "name": "Assise puit de recirculation", "type": "scatter", "xsrc": "Parping:14:4eac14", "ysrc": "Parping:14:2c7ba9", "visible": "legendonly", "stackgroup": null, "legendgroup": 6 }, { "line": { "dash": "longdashdot", "color": "rgb(239, 107, 21)", "width": 4 }, "meta": { "columnNames": { "x": "A", "y": "G" } }, "mode": "lines", "name": "Assise desableur / dégraisseur", "type": "scatter", "xsrc": "Parping:14:4eac14", "ysrc": "Parping:14:53e466", "visible": "legendonly", "stackgroup": null }, { "line": { "dash": "longdashdot", "color": "rgb(90, 204, 255)", "width": 4 }, "meta": { "columnNames": { "x": "A", "y": "H" } }, "mode": "lines", "name": "Assise traitement tertiaire", "type": "scatter", "xsrc": "Parping:14:4eac14", "ysrc": "Parping:14:0ec8f1", "visible": "legendonly", "stackgroup": null } ], "frames": [], "layout": { "title": { "x": 0.42, "text": "<b>Suivi piézométrique de la STEP de Beaupréau-en-Mauges (49)</b>" }, "xaxis": { "type": "date", "range": [ "2025-01-20 01:41:42.7926", "2025-08-11 02:18:17.2074" ], "title": { "text": "Temps" }, "autorange": true, "rangeslider": { "range": [ "2025-01-20 01:41:42.7926", "2025-08-11 02:18:17.2074" ], "yaxis": { "rangemode": "match" }, "bgcolor": "rgb(241, 247, 255)", "visible": true, "autorange": true, "thickness": 0.1, "borderwidth": 1 }, "rangeselector": { "visible": false } }, "yaxis": { "type": "linear", "range": [ 43.01416666666667, 54.81083333333333 ], "title": { "text": "Niveau (NGF IGN69)" }, "autorange": true, "separatethousands": false }, "legend": { "x": 1.0510918669840226, "y": 0.9495707082793163, "title": { "text": "<b>Légende :</b>" }, "xanchor": "left", "borderwidth": 0 }, "autosize": true, "template": { "data": { "bar": [ { "type": "bar", "marker": { "colorbar": { "ticks": "", "outlinewidth": 0 } } } ], "table": [ { "type": "table", "cells": { "fill": { "color": "#EBF0F8" }, "line": { "color": "white" } }, "header": { "fill": { "color": "#C8D4E3" }, "line": { "color": "white" } } } ], "carpet": [ { "type": "carpet", "aaxis": { "gridcolor": "#C8D4E3", "linecolor": "#C8D4E3", "endlinecolor": "#2a3f5f", "minorgridcolor": "#C8D4E3", "startlinecolor": "#2a3f5f" }, "baxis": { "gridcolor": "#C8D4E3", "linecolor": "#C8D4E3", "endlinecolor": "#2a3f5f", "minorgridcolor": "#C8D4E3", "startlinecolor": "#2a3f5f" } } ], "mesh3d": [ { "type": "mesh3d", "colorbar": { "ticks": "", "outlinewidth": 0 } } ], "contour": [ { "type": "contour", "colorbar": { "ticks": "", "outlinewidth": 0 }, "autocolorscale": true } ], "heatmap": [ { "type": "heatmap", "colorbar": { "ticks": "", "outlinewidth": 0 }, "autocolorscale": true } ], "scatter": [ { "type": "scatter", "marker": { "colorbar": { "ticks": "", "outlinewidth": 0 } } } ], "surface": [ { "type": "surface", "colorbar": { "ticks": "", "outlinewidth": 0 } } ], "heatmapgl": [ { "type": "heatmapgl", "colorbar": { "ticks": "", "outlinewidth": 0 } } ], "histogram": [ { "type": "histogram", "marker": { "colorbar": { "ticks": "", "outlinewidth": 0 } } } ], "parcoords": [ { "line": { "colorbar": { "ticks": "", "outlinewidth": 0 } }, "type": "parcoords" } ], "scatter3d": [ { "type": "scatter3d", "marker": { "colorbar": { "ticks": "", "outlinewidth": 0 } } } ], "scattergl": [ { "type": "scattergl", "marker": { "colorbar": { "ticks": "", "outlinewidth": 0 } } } ], "choropleth": [ { "type": "choropleth", "colorbar": { "ticks": "", "outlinewidth": 0 } } ], "scattergeo": [ { "type": "scattergeo", "marker": { "colorbar": { "ticks": "", "outlinewidth": 0 } } } ], "histogram2d": [ { "type": "histogram2d", "colorbar": { "ticks": "", "outlinewidth": 0 }, "autocolorscale": true } ], "scatterpolar": [ { "type": "scatterpolar", "marker": { "colorbar": { "ticks": "", "outlinewidth": 0 } } } ], "contourcarpet": [ { "type": "contourcarpet", "colorbar": { "ticks": "", "outlinewidth": 0 } } ], "scattercarpet": [ { "type": "scattercarpet", "marker": { "colorbar": { "ticks": "", "outlinewidth": 0 } } } ], "scattermapbox": [ { "type": "scattermapbox", "marker": { "colorbar": { "ticks": "", "outlinewidth": 0 } } } ], "scatterpolargl": [ { "type": "scatterpolargl", "marker": { "colorbar": { "ticks": "", "outlinewidth": 0 } } } ], "scatterternary": [ { "type": "scatterternary", "marker": { "colorbar": { "ticks": "", "outlinewidth": 0 } } } ], "histogram2dcontour": [ { "type": "histogram2dcontour", "colorbar": { "ticks": "", "outlinewidth": 0 }, "autocolorscale": true } ] }, "layout": { "geo": { "bgcolor": "white", "showland": true, "lakecolor": "white", "landcolor": "white", "showlakes": true, "subunitcolor": "#C8D4E3" }, "font": { "color": "#2a3f5f" }, "polar": { "bgcolor": "white", "radialaxis": { "ticks": "", "gridcolor": "#EBF0F8", "linecolor": "#EBF0F8" }, "angularaxis": { "ticks": "", "gridcolor": "#EBF0F8", "linecolor": "#EBF0F8" } }, "scene": { "xaxis": { "ticks": "", "gridcolor": "#DFE8F3", "gridwidth": 2, "linecolor": "#EBF0F8", "zerolinecolor": "#EBF0F8", "showbackground": true, "backgroundcolor": "white" }, "yaxis": { "ticks": "", "gridcolor": "#DFE8F3", "gridwidth": 2, "linecolor": "#EBF0F8", "zerolinecolor": "#EBF0F8", "showbackground": true, "backgroundcolor": "white" }, "zaxis": { "ticks": "", "gridcolor": "#DFE8F3", "gridwidth": 2, "linecolor": "#EBF0F8", "zerolinecolor": "#EBF0F8", "showbackground": true, "backgroundcolor": "white" } }, "title": { "x": 0.05 }, "xaxis": { "ticks": "", "gridcolor": "#EBF0F8", "linecolor": "#EBF0F8", "automargin": true, "zerolinecolor": "#EBF0F8", "zerolinewidth": 2 }, "yaxis": { "ticks": "", "gridcolor": "#EBF0F8", "linecolor": "#EBF0F8", "automargin": true, "zerolinecolor": "#EBF0F8", "zerolinewidth": 2 }, "ternary": { "aaxis": { "ticks": "", "gridcolor": "#DFE8F3", "linecolor": "#A2B1C6" }, "baxis": { "ticks": "", "gridcolor": "#DFE8F3", "linecolor": "#A2B1C6" }, "caxis": { "ticks": "", "gridcolor": "#DFE8F3", "linecolor": "#A2B1C6" }, "bgcolor": "white" }, "colorway": [ "#636efa", "#EF553B", "#00cc96", "#ab63fa", "#19d3f3", "#e763fa", "#fecb52", "#ffa15a", "#ff6692", "#b6e880" ], "hovermode": "closest", "colorscale": { "diverging": [ [ 0, "#8e0152" ], [ 0.1, "#c51b7d" ], [ 0.2, "#de77ae" ], [ 0.3, "#f1b6da" ], [ 0.4, "#fde0ef" ], [ 0.5, "#f7f7f7" ], [ 0.6, "#e6f5d0" ], [ 0.7, "#b8e186" ], [ 0.8, "#7fbc41" ], [ 0.9, "#4d9221" ], [ 1, "#276419" ] ], "sequential": [ [ 0, "#0508b8" ], [ 0.0893854748603352, "#1910d8" ], [ 0.1787709497206704, "#3c19f0" ], [ 0.2681564245810056, "#6b1cfb" ], [ 0.3575418994413408, "#981cfd" ], [ 0.44692737430167595, "#bf1cfd" ], [ 0.5363128491620112, "#dd2bfd" ], [ 0.6256983240223464, "#f246fe" ], [ 0.7150837988826816, "#fc67fd" ], [ 0.8044692737430168, "#fe88fc" ], [ 0.8938547486033519, "#fea5fd" ], [ 0.9832402234636871, "#febefe" ], [ 1, "#fec3fe" ] ], "sequentialminus": [ [ 0, "#0508b8" ], [ 0.0893854748603352, "#1910d8" ], [ 0.1787709497206704, "#3c19f0" ], [ 0.2681564245810056, "#6b1cfb" ], [ 0.3575418994413408, "#981cfd" ], [ 0.44692737430167595, "#bf1cfd" ], [ 0.5363128491620112, "#dd2bfd" ], [ 0.6256983240223464, "#f246fe" ], [ 0.7150837988826816, "#fc67fd" ], [ 0.8044692737430168, "#fe88fc" ], [ 0.8938547486033519, "#fea5fd" ], [ 0.9832402234636871, "#febefe" ], [ 1, "#fec3fe" ] ] }, "plot_bgcolor": "white", "paper_bgcolor": "white", "shapedefaults": { "line": { "width": 0 }, "opacity": 0.4, "fillcolor": "#506784" }, "annotationdefaults": { "arrowhead": 0, "arrowcolor": "#506784", "arrowwidth": 1 } }, "themeRef": "PLOTLY_WHITE" }, "hoverlabel": { "font": { "family": "Arial" } }, "separators": ".,", "paper_bgcolor": "rgb(255, 255, 255)" } }, "height": null, "width": null, "user": { "profile_url": "https://chart-studio.plotly.com/~Parping", "avatar_url": "https://storage.googleapis.com/plotly-prod-profiles/5.jpg", "background_url": "https://storage.googleapis.com/plotly-prod-profiles/bg-3.jpg", "bio": "", "nickname": "", "website": "", "stream_tokens": null, "feature_set_id": null, "csrf_token": null, "date_joined": "2023-09-01 10:27:45", "mapbox_access_tokens": null, "has_password": null, "username": "Parping", "email": null, "is_active": null, "readonly": null, "is_dash_creator": null, "dash_created_count": null, "is_chart_creator": null, "charts_created_count": null } }, { "creation_time": "2025-08-06T11:39:50.493291Z", "comments": { "results": [], "count": 0 }, "parented": true, "embed_url": "https://chart-studio.plotly.com/~marlonjr/23.embed", "fid": "marlonjr:23", "filename": "Plot 23", "filetype": "plot", "img_url": "https://storage.googleapis.com/plotly-prod-images/marlonjr/23/9_NLTG7GTCSPFDTPZSNLHLSXHZOH3VLO.png", "image_urls": { "default": "https://storage.googleapis.com/plotly-prod-images/marlonjr/23/2_PS9HUTKY0APQXX5QA776O68ZQMVSQM.png", "block-thumb": "https://storage.googleapis.com/plotly-prod-images/marlonjr/23/8_EYYTSVGB4WIH12Q709XUISCI79MEPZ.png", "list-thumb": "https://storage.googleapis.com/plotly-prod-images/marlonjr/23/9_NLTG7GTCSPFDTPZSNLHLSXHZOH3VLO.png" }, "api_urls": { "files": "https://api.plotly.com/v2/files/marlonjr:23", "plots": "https://api.plotly.com/v2/plots/marlonjr:23", "parent": "https://api.plotly.com/v2/folders/home?user=marlonjr" }, "owner": "marlonjr", "parent": -1, "preview": "", "referencers": [], "references": [], "title": "", "views": 0, "web_url": "https://chart-studio.plotly.com/~marlonjr/23/", "world_readable": true, "date_modified": "2025-08-06T11:39:50.506Z", "stars": { "results": [], "count": 0 }, "collaborators": { "results": [], "count": 0 }, "subfolder_count": null, "refresh_interval": null, "organize_view_url": "https://chart-studio.plotly.com/~marlonjr/23/", "current_user_permission": "read", "is_theme": null, "is_template": false, "autosize": true, "caption": "", "figure": { "data": [ { "meta": { "columnNames": { "x": "A", "y": "B" } }, "mode": "markers", "name": "Without porous foam", "type": "scatter", "xsrc": "marlonjr:22:b4ff2d", "ysrc": "marlonjr:22:879e69", "selectedpoints": [] }, { "meta": { "columnNames": { "x": "C", "y": "D" } }, "mode": "markers", "name": "With porous foam", "type": "scatter", "xsrc": "marlonjr:22:8aadeb", "ysrc": "marlonjr:22:76b37a", "stackgroup": null, "selectedpoints": [ 2719, 2720, 2721, 2722, 2723, 2724, 2731, 2732, 2733, 2734, 2735, 2736, 2743, 2744, 2745, 2746, 2747, 2748, 2753, 2754, 2755, 2758, 2759, 2760, 2767, 2768, 2769, 2770, 2771, 2772, 2779, 2780, 2781, 2782, 2783, 2784, 2787, 2794, 2795, 2796, 2797, 2798, 2799, 2806, 2807, 2808, 2809, 2810, 2811, 2818, 2819, 2820, 2821, 2822, 2823, 2830, 2831, 2832, 2833, 2834, 2835, 2842, 2843, 2844, 2845, 2846, 2847, 2854, 2855, 2858, 2859, 2860, 2861, 2862, 2863, 2870, 2871, 2872, 2873, 2874, 2875, 2882, 2883, 2884, 2885, 2886, 2887, 2894, 2895, 2896, 2897, 2898, 2899, 2911, 2912, 2913, 2914, 2915, 2916, 2923, 2924, 2925, 2926, 2927, 2928, 2933, 2934, 2935, 2936, 2937, 2938, 2940, 2941, 2942, 2943, 2944, 2945, 2952, 2953, 2954, 2955, 2956, 2957, 2964, 2965, 2966, 2967, 2968, 2969, 2980, 2981, 2982, 2983, 2992, 2993, 2994, 2995, 2996, 2997, 3005, 3006, 3007, 3008, 3009, 3010, 3011, 3012, 3021, 3022, 3025, 3026, 3027, 3028, 3035, 3036, 3037, 3038, 3039, 3040, 3041, 3048, 3049, 3050, 3051, 3052, 3053, 3060, 3061, 3062, 3063, 3064, 3065, 3072, 3073, 3074, 3075, 3076, 3077, 3079, 3080, 3081, 3082, 3083, 3090, 3091, 3092, 3093, 3094, 3095, 3100, 3101, 3102, 3103, 3104, 3105, 3112, 3113, 3114, 3115, 3116, 3117, 3124, 3125, 3126, 3127, 3128, 3129, 3136, 3137, 3138, 3139, 3140, 3141, 3148, 3149, 3150, 3151, 3152, 3153, 3157, 3158, 3159, 3160, 3161, 3162, 3169, 3170, 3171, 3172, 3173, 3174, 3181, 3182, 3183, 3184, 3185, 3186, 3193, 3194, 3195, 3196, 3197, 3198, 3203, 3204, 3205, 3212, 3213, 3214, 3215, 3216, 3217, 3224, 3225, 3226, 3227, 3228, 3229, 3230, 3231, 3232, 3233, 3234, 3235, 3248, 3249, 3250, 3251, 3252, 3253, 3255, 3256, 3257, 3258, 3265, 3266, 3267, 3268, 3269, 3270, 3277, 3278, 3279, 3280, 3281, 3282, 3289, 3290, 3291, 3292, 3293, 3294, 3301, 3302, 3303, 3304, 3305, 3306, 3313, 3314, 3321, 3322, 3323, 3324, 3325, 3326, 3333, 3334, 3335, 3336, 3337, 3338, 3345, 3346, 3347, 3348, 3349, 3350, 3357, 3358, 3359, 3360, 3361, 3362, 3369, 3370, 3371, 3372, 3373, 3376, 3377, 3378, 3379, 3380, 3381, 3388, 3389, 3390, 3391, 3392, 3393, 3398, 3399, 3400, 3401, 3402, 3403, 3412, 3413, 3414, 3415, 3416, 3417, 3424, 3425, 3426, 3427, 3428, 3429, 3440, 3441, 3442, 3443, 3444, 3445, 3448, 3449, 3450, 3457, 3458, 3459, 3460, 3461, 3462, 3469, 3470, 3471, 3472, 3473, 3474, 3481, 3482, 3483, 3484, 3485, 3486, 3493, 3494, 3495, 3496, 3497, 3504, 3505, 3506, 3509, 3510, 3511, 3512, 3513, 3514, 3521, 3522, 3523, 3524, 3525, 3526, 3533, 3534, 3535, 3536, 3537, 3538, 3545, 3546, 3547, 3548, 3549, 3550, 3551, 3552, 3553, 3554, 3555, 3562, 3563, 3564, 3565, 3566, 3567, 3574, 3575, 3576, 3577, 3578, 3579, 3586, 3587, 3588, 3589, 3590, 3591, 3598, 3599, 3600, 3601, 3602, 3603, 3615, 3616, 3617, 3618, 3619, 3620, 3627, 3628, 3629, 3630, 3631, 3632, 3639, 3640, 3641, 3642, 3643, 3644, 3648, 3649, 3650, 3651, 3652, 3653, 3654, 3655, 3662, 3663, 3664, 3665, 3666, 3667, 3674, 3675, 3676, 3677, 3678, 3679, 3686, 3687, 3688, 3689, 3690, 3691, 3698, 3699, 3700, 3707, 3708, 3709, 3710, 3711, 3712, 3719, 3720, 3721, 3722, 3723, 3724, 3731, 3732, 3733, 3734, 3735, 3736, 3743, 3744, 3745, 3746, 3747, 3748, 3755, 3756, 3757, 3758, 3759, 3760, 3767, 3768, 3769, 3770, 3771, 3772, 3773, 3774, 3781, 3782, 3783, 3784, 3785, 3786, 3793, 3794, 3795, 3796, 3797, 3798, 3805, 3806, 3807, 3808, 3809, 3811, 3812, 3813, 3814, 3815, 3816, 3828, 3829, 3830, 3831, 3832, 3833, 3840, 3841, 3842, 3843, 3844, 3845, 3852, 3853, 3854, 3855, 3856, 3857, 3858, 3859, 3866, 3867, 3868, 3869, 3870, 3871, 3878, 3879, 3880, 3881, 3882, 3883, 3890, 3891, 3892, 3893, 3900, 3901, 3902, 3903, 3904, 3905, 3912, 3913, 3914, 3915, 3916, 3917 ] } ], "frames": [], "layout": { "xaxis": { "type": "linear", "range": [ -0.05542430421686747, 0.9500153042168674 ], "autorange": true, "showspikes": false }, "yaxis": { "type": "linear", "range": [ -22.23733060686016, 128.96293060686017 ], "autorange": true, "showspikes": false }, "autosize": true, "dragmode": "pan", "template": { "data": { "bar": [ { "type": "bar", "marker": { "colorbar": { "ticks": "", "outlinewidth": 0 } } } ], "table": [ { "type": "table", "cells": { "fill": { "color": "#EBF0F8" }, "line": { "color": "white" } }, "header": { "fill": { "color": "#C8D4E3" }, "line": { "color": "white" } } } ], "carpet": [ { "type": "carpet", "aaxis": { "gridcolor": "#C8D4E3", "linecolor": "#C8D4E3", "endlinecolor": "#2a3f5f", "minorgridcolor": "#C8D4E3", "startlinecolor": "#2a3f5f" }, "baxis": { "gridcolor": "#C8D4E3", "linecolor": "#C8D4E3", "endlinecolor": "#2a3f5f", "minorgridcolor": "#C8D4E3", "startlinecolor": "#2a3f5f" } } ], "mesh3d": [ { "type": "mesh3d", "colorbar": { "ticks": "", "outlinewidth": 0 } } ], "contour": [ { "type": "contour", "colorbar": { "ticks": "", "outlinewidth": 0 }, "autocolorscale": true } ], "heatmap": [ { "type": "heatmap", "colorbar": { "ticks": "", "outlinewidth": 0 }, "autocolorscale": true } ], "scatter": [ { "type": "scatter", "marker": { "colorbar": { "ticks": "", "outlinewidth": 0 } } } ], "surface": [ { "type": "surface", "colorbar": { "ticks": "", "outlinewidth": 0 } } ], "heatmapgl": [ { "type": "heatmapgl", "colorbar": { "ticks": "", "outlinewidth": 0 } } ], "histogram": [ { "type": "histogram", "marker": { "colorbar": { "ticks": "", "outlinewidth": 0 } } } ], "parcoords": [ { "line": { "colorbar": { "ticks": "", "outlinewidth": 0 } }, "type": "parcoords" } ], "scatter3d": [ { "type": "scatter3d", "marker": { "colorbar": { "ticks": "", "outlinewidth": 0 } } } ], "scattergl": [ { "type": "scattergl", "marker": { "colorbar": { "ticks": "", "outlinewidth": 0 } } } ], "choropleth": [ { "type": "choropleth", "colorbar": { "ticks": "", "outlinewidth": 0 } } ], "scattergeo": [ { "type": "scattergeo", "marker": { "colorbar": { "ticks": "", "outlinewidth": 0 } } } ], "histogram2d": [ { "type": "histogram2d", "colorbar": { "ticks": "", "outlinewidth": 0 }, "autocolorscale": true } ], "scatterpolar": [ { "type": "scatterpolar", "marker": { "colorbar": { "ticks": "", "outlinewidth": 0 } } } ], "contourcarpet": [ { "type": "contourcarpet", "colorbar": { "ticks": "", "outlinewidth": 0 } } ], "scattercarpet": [ { "type": "scattercarpet", "marker": { "colorbar": { "ticks": "", "outlinewidth": 0 } } } ], "scattermapbox": [ { "type": "scattermapbox", "marker": { "colorbar": { "ticks": "", "outlinewidth": 0 } } } ], "scatterpolargl": [ { "type": "scatterpolargl", "marker": { "colorbar": { "ticks": "", "outlinewidth": 0 } } } ], "scatterternary": [ { "type": "scatterternary", "marker": { "colorbar": { "ticks": "", "outlinewidth": 0 } } } ], "histogram2dcontour": [ { "type": "histogram2dcontour", "colorbar": { "ticks": "", "outlinewidth": 0 }, "autocolorscale": true } ] }, "layout": { "geo": { "bgcolor": "white", "showland": true, "lakecolor": "white", "landcolor": "white", "showlakes": true, "subunitcolor": "#C8D4E3" }, "font": { "color": "#2a3f5f" }, "polar": { "bgcolor": "white", "radialaxis": { "ticks": "", "gridcolor": "#EBF0F8", "linecolor": "#EBF0F8" }, "angularaxis": { "ticks": "", "gridcolor": "#EBF0F8", "linecolor": "#EBF0F8" } }, "scene": { "xaxis": { "ticks": "", "gridcolor": "#DFE8F3", "gridwidth": 2, "linecolor": "#EBF0F8", "zerolinecolor": "#EBF0F8", "showbackground": true, "backgroundcolor": "white" }, "yaxis": { "ticks": "", "gridcolor": "#DFE8F3", "gridwidth": 2, "linecolor": "#EBF0F8", "zerolinecolor": "#EBF0F8", "showbackground": true, "backgroundcolor": "white" }, "zaxis": { "ticks": "", "gridcolor": "#DFE8F3", "gridwidth": 2, "linecolor": "#EBF0F8", "zerolinecolor": "#EBF0F8", "showbackground": true, "backgroundcolor": "white" } }, "title": { "x": 0.05 }, "xaxis": { "ticks": "", "gridcolor": "#EBF0F8", "linecolor": "#EBF0F8", "automargin": true, "zerolinecolor": "#EBF0F8", "zerolinewidth": 2 }, "yaxis": { "ticks": "", "gridcolor": "#EBF0F8", "linecolor": "#EBF0F8", "automargin": true, "zerolinecolor": "#EBF0F8", "zerolinewidth": 2 }, "ternary": { "aaxis": { "ticks": "", "gridcolor": "#DFE8F3", "linecolor": "#A2B1C6" }, "baxis": { "ticks": "", "gridcolor": "#DFE8F3", "linecolor": "#A2B1C6" }, "caxis": { "ticks": "", "gridcolor": "#DFE8F3", "linecolor": "#A2B1C6" }, "bgcolor": "white" }, "colorway": [ "#636efa", "#EF553B", "#00cc96", "#ab63fa", "#19d3f3", "#e763fa", "#fecb52", "#ffa15a", "#ff6692", "#b6e880" ], "hovermode": "closest", "colorscale": { "diverging": [ [ 0, "#8e0152" ], [ 0.1, "#c51b7d" ], [ 0.2, "#de77ae" ], [ 0.3, "#f1b6da" ], [ 0.4, "#fde0ef" ], [ 0.5, "#f7f7f7" ], [ 0.6, "#e6f5d0" ], [ 0.7, "#b8e186" ], [ 0.8, "#7fbc41" ], [ 0.9, "#4d9221" ], [ 1, "#276419" ] ], "sequential": [ [ 0, "#0508b8" ], [ 0.0893854748603352, "#1910d8" ], [ 0.1787709497206704, "#3c19f0" ], [ 0.2681564245810056, "#6b1cfb" ], [ 0.3575418994413408, "#981cfd" ], [ 0.44692737430167595, "#bf1cfd" ], [ 0.5363128491620112, "#dd2bfd" ], [ 0.6256983240223464, "#f246fe" ], [ 0.7150837988826816, "#fc67fd" ], [ 0.8044692737430168, "#fe88fc" ], [ 0.8938547486033519, "#fea5fd" ], [ 0.9832402234636871, "#febefe" ], [ 1, "#fec3fe" ] ], "sequentialminus": [ [ 0, "#0508b8" ], [ 0.0893854748603352, "#1910d8" ], [ 0.1787709497206704, "#3c19f0" ], [ 0.2681564245810056, "#6b1cfb" ], [ 0.3575418994413408, "#981cfd" ], [ 0.44692737430167595, "#bf1cfd" ], [ 0.5363128491620112, "#dd2bfd" ], [ 0.6256983240223464, "#f246fe" ], [ 0.7150837988826816, "#fc67fd" ], [ 0.8044692737430168, "#fe88fc" ], [ 0.8938547486033519, "#fea5fd" ], [ 0.9832402234636871, "#febefe" ], [ 1, "#fec3fe" ] ] }, "plot_bgcolor": "white", "paper_bgcolor": "white", "shapedefaults": { "line": { "width": 0 }, "opacity": 0.4, "fillcolor": "#506784" }, "annotationdefaults": { "arrowhead": 0, "arrowcolor": "#506784", "arrowwidth": 1 } }, "themeRef": "PLOTLY_WHITE" } } }, "height": null, "width": null, "user": { "profile_url": "https://chart-studio.plotly.com/~marlonjr", "avatar_url": "https://storage.googleapis.com/plotly-prod-profiles/64.jpg", "background_url": "https://storage.googleapis.com/plotly-prod-profiles/bg-11.jpg", "bio": "", "nickname": "", "website": "", "stream_tokens": null, "feature_set_id": null, "csrf_token": null, "date_joined": "2025-04-03 18:25:38", "mapbox_access_tokens": null, "has_password": null, "username": "marlonjr", "email": null, "is_active": null, "readonly": null, "is_dash_creator": null, "dash_created_count": null, "is_chart_creator": null, "charts_created_count": null } } ] }
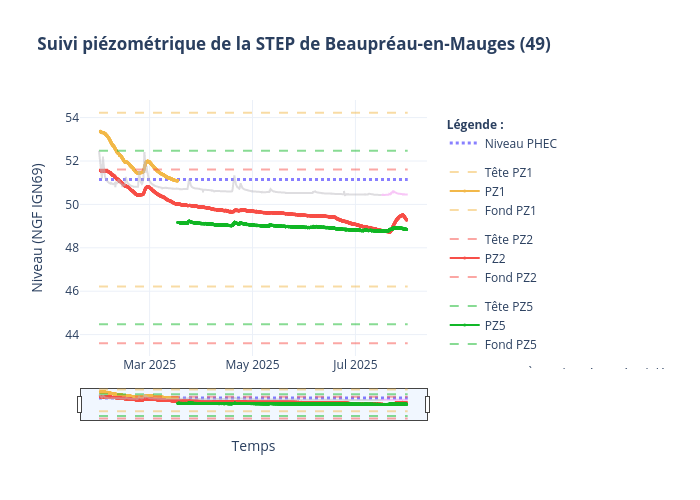