Plots List
Plots
This endpoint handles manipulation of Plotly plot files.
Reference
Authorization
Any user with or without a Plotly account may view public plots. For private plots, see authentication.
Actions
list
Listing all public plots can be done via a GET request to this endpoint.
By default, plots will be listed in order of date created. The order_by
query parameter is accepted at this endpoint. Currently, only ordering by
views is supported. It is possible to filter the plots by quality
with min_quality or max_quality as query parameter.
Example:
// GET https://api.plotly.com/v2/plots/ ---> 200

// GET https://api.plotly.com/v2/plots/?order_by=-views ---> 200

// GET https://api.plotly.com/v2/plots/?min_quality=5 ---> 200

// GET https://api.plotly.com/v2/plots/?max_quality=5 ---> 200
feed
Listing all handpicked feed plots can be done via a GET request to this endpoint. By default, plots will be listed in a random order.
Example:
// GET https://api.plotly.com/v2/plots/feed ---> 200
create
You can create new plot resources here. The only required field is 'figure'. Currently, the figure is restricted to only contain references to grid data. That is, this will fail if raw data arrays are passed in. To create and manipulate underlying grids for plots, see the grids endpoint.
Example:
// This fails because a figure field is required.
// POST https://api.plotly.com/v2/plots ---> 400 Bad Request
{}

// This fails because the figure has raw data
//POST https://api.plotly.com/v2/plots ---> 400 Bad Request
{
    "figure": {"data": [{"y": ['this', 'is', 'raw', 'data']}]}
}

// This succeeds because the figure has src keys, not raw data.
//POST https://api.plotly.com/v2/plots ---> 200 OK
{
    "figure": {"data": [{"ysrc": "sven:88:u8nd62"}]}
}
When creating a grid, you can optionally specify a source_fid to specify where a plot has come from:
- source_fid: the fid of a plot that was copied (and presumably edited) to produce this one
detail
There is a lot of meta information stored about plot files including filename, title, share_url, and content_url to name a few.
This information can only be reached with a GET to this endpoint.
Example:
// GET https://api.plotly.com/v2/plots/iheartgraphs:90
content
The contents of a plot can be downloaded via the content resource. The plot
content contains referenced grid/column data by default. If you wish to
return the raw grid/column data, the inline_data=true query must be included
in the request url. The Content-Type header will be appropriately set for the
response body.
Alternatively, you can set ?map_data=unreadable to append a mapping of
sources to data that belongs to grids which are unreadable for the
requestor. This is useful when you have read access to another users plot,
but that plot contains grid references which you don't have access to.
Examples:
// Returns referenced grid/column data
// GET https://api.plotly.com/v2/plots/iheartgraphs:90/content ---> 200 OK

// Returns full grid/column data
// GET https://api.plotly.com/v2/plots/iheartgraphs:90/content?inline_data=true ---> 200 OK

// Returns full grid/column data when requestor doesn't have permission
// to read the referenced grid.
// GET https://api.plotly.com/v2/plots/iheartgraphs:90/content?map_data=unreadable ---> 200 OK
GET /v2/plots?cursor=cj0xJnA9MjAyNS0wOS0wMysxMCUzQTE3JTNBMTIuMzY4Mzk5JTJCMDAlM0EwMA%3D%3D&format=api
{ "next": "https://api.plotly.com/v2/plots?cursor=cD0yMDI1LTA5LTAzKzEwJTNBMjMlM0EzMC4zNDQ3MjAlMkIwMCUzQTAw&format=api", "previous": "https://api.plotly.com/v2/plots?cursor=cj0xJnA9MjAyNS0wOS0wMysxMyUzQTU2JTNBNTcuNDQ3OTk1JTJCMDAlM0EwMA%3D%3D&format=api", "results": [ { "creation_time": "2025-09-03T13:56:57.447995Z", "comments": { "results": [], "count": 0 }, "parented": true, "embed_url": "https://chart-studio.plotly.com/~Lucka/28.embed", "fid": "Lucka:28", "filename": "po donorjih posebej copy", "filetype": "plot", "img_url": "https://storage.googleapis.com/plotly-prod-images/Lucka/28/9_Z6CCG51IMRABKJSSX3V11WLJCSJUW1.png", "image_urls": { "default": "https://storage.googleapis.com/plotly-prod-images/Lucka/28/2_SKHFN5Q5JY2G7JL3DX5N9A905FPNS9.png", "block-thumb": "https://storage.googleapis.com/plotly-prod-images/Lucka/28/8_71U8WKO4VZADQQNX4H38IMPQGJOMA0.png", "list-thumb": "https://storage.googleapis.com/plotly-prod-images/Lucka/28/9_Z6CCG51IMRABKJSSX3V11WLJCSJUW1.png" }, "api_urls": { "files": "https://api.plotly.com/v2/files/Lucka:28", "plots": "https://api.plotly.com/v2/plots/Lucka:28", "parent": "https://api.plotly.com/v2/folders/home?user=Lucka" }, "owner": "Lucka", "parent": -1, "preview": "", "referencers": [], "references": [], "title": "", "views": 2, "web_url": "https://chart-studio.plotly.com/~Lucka/28/", "world_readable": true, "date_modified": "2025-09-04T16:17:23.699Z", "stars": { "results": [], "count": 0 }, "collaborators": { "results": [], "count": 0 }, "subfolder_count": null, "refresh_interval": null, "organize_view_url": "https://chart-studio.plotly.com/~Lucka/28/", "current_user_permission": "read", "is_theme": null, "is_template": false, "autosize": true, "caption": "", "figure": { "data": [ { "meta": { "columnNames": { "x": "E", "y": "F" } }, "mode": "lines", "type": "scatter", "xsrc": "Lucka:27:a18676", "ysrc": "Lucka:27:3e6f7a", "visible": true, "transforms": [ { "meta": { "columnNames": { "groups": "A" } }, "type": "groupby", "styles": [ { "value": { "line": { "dash": "dot", "width": 2 }, "mode": "markers+lines", "marker": { "size": 6, "symbol": "x-thin-open" }, "showlegend": false }, "target": "SM14 KO p2" }, { "value": { "line": { "dash": "dot", "width": 2 }, "mode": "markers+lines", "marker": { "size": 6, "color": "rgb(31, 119, 180)", "symbol": "x-thin-open" }, "showlegend": false }, "target": "SM23KO p5" }, { "value": { "line": { "dash": "dot", "width": 2 }, "mode": "markers+lines", "marker": { "size": 6, "color": "rgb(31, 119, 180)", "symbol": "x-thin-open" }, "showlegend": false }, "target": "SM28KO p4" }, { "value": { "line": { "dash": "dot", "width": 2 }, "mode": "markers+lines", "marker": { "size": 6, "color": "rgb(31, 119, 180)", "symbol": "x-thin-open" }, "showlegend": false }, "target": "SM36 BM p6" }, { "value": { "line": { "dash": "dot", "width": 2 }, "mode": "markers+lines", "marker": { "size": 6, "color": "rgb(31, 119, 180)", "symbol": "x-thin-open" }, "showlegend": false }, "target": "SM26 P p5" }, { "value": { "line": { "dash": "dot", "width": 2 }, "mode": "markers+lines", "marker": { "size": 6, "color": "rgb(31, 119, 180)", "symbol": "x-thin-open" }, "showlegend": false }, "target": "SM23S p4" }, { "value": { "line": { "dash": "dot", "width": 2 }, "mode": "markers+lines", "marker": { "size": 6, "color": "rgb(44, 160, 44)", "symbol": "x-thin-open" }, "showlegend": false }, "target": "OKK11 S2\n p3" }, { "value": { "line": { "dash": "dot", "width": 2 }, "mode": "markers+lines", "marker": { "size": 6, "color": "rgb(44, 160, 44)", "symbol": "x-thin-open" }, "showlegend": false }, "target": "OKK12 S2\n p3" }, { "value": { "line": { "dash": "dot", "width": 2 }, "mode": "markers+lines", "marker": { "size": 6, "color": "rgb(44, 160, 44)", "symbol": "x-thin-open" }, "showlegend": false }, "target": "OKK13 S2\n p1" }, { "value": { "line": { "dash": "dot", "width": 2 }, "mode": "markers+lines", "name": "OKK17 S2 p7", "marker": { "size": 6, "color": "rgb(44, 160, 44)", "symbol": "x-thin-open" }, "showlegend": false }, "target": "OKK17 S2\n p7" }, { "value": { "line": { "dash": "dot", "width": 2 }, "mode": "markers+lines", "name": "OKK6 S1 p2", "marker": { "size": 6, "symbol": "x-thin-open" }, "showlegend": false }, "target": "OKK6 S1 p2" }, { "value": { "line": { "dash": "dot", "width": 2 }, "mode": "markers+lines", "name": "AM2 p1", "marker": { "size": 6, "symbol": "x-thin-open" }, "showlegend": false }, "target": "P2 AM p1" }, { "value": { "line": { "dash": "dot", "width": 2 }, "mode": "markers+lines", "marker": { "size": 6, "color": "rgb(255, 127, 14)", "symbol": "x-thin-open" }, "showlegend": false }, "target": "PL7 p2" }, { "value": { "line": { "dash": "dot", "width": 2 }, "mode": "markers+lines", "marker": { "size": 6, "color": "rgb(255, 127, 14)", "symbol": "x-thin-open" }, "showlegend": false }, "target": "PL9 p2" }, { "value": { "line": { "dash": "solid", "width": 3 }, "mode": "markers+lines", "marker": { "size": 9, "color": "rgb(44, 160, 44)", "symbol": "x" } }, "target": "Ortopedski bolniki" }, { "value": { "line": { "dash": "solid", "width": 3 }, "mode": "markers+lines", "marker": { "size": 9, "color": "rgb(255, 127, 14)", "symbol": "x" } }, "target": "Perinatalni vzorci" }, { "value": { "line": { "dash": "solid", "width": 3 }, "mode": "markers+lines", "name": "Donorji <i>post mortem</i>", "marker": { "size": 9, "color": "rgb(31, 119, 180)", "symbol": "x" } }, "target": "Donorji post mortem" }, { "value": { "visible": "legendonly" }, "target": "" } ], "groupssrc": "Lucka:27:60ccfc" } ] } ], "frames": [], "layout": { "title": { "text": "" }, "xaxis": { "type": "category", "range": [ -0.12584733274388446, 2.1258473327438843 ], "title": { "text": "Tretma" }, "autorange": true }, "yaxis": { "type": "linear", "range": [ 55, 175 ], "title": { "text": "Viabilnost (%)" }, "autorange": false }, "legend": { "title": { "text": "Donor" }, "itemsizing": "trace", "traceorder": "normal" }, "autosize": true } }, "height": null, "width": null, "user": { "profile_url": "https://chart-studio.plotly.com/~Lucka", "avatar_url": "https://storage.googleapis.com/plotly-prod-profiles/6.jpg", "background_url": "https://storage.googleapis.com/plotly-prod-profiles/bg-7.jpg", "bio": "", "nickname": "", "website": "", "stream_tokens": null, "feature_set_id": null, "csrf_token": null, "date_joined": "2025-07-28 10:37:16", "mapbox_access_tokens": null, "has_password": null, "username": "Lucka", "email": null, "is_active": null, "readonly": null, "is_dash_creator": null, "dash_created_count": null, "is_chart_creator": null, "charts_created_count": null } }, { "creation_time": "2025-09-03T13:02:34.853035Z", "comments": { "results": [], "count": 0 }, "parented": true, "embed_url": "https://chart-studio.plotly.com/~pmonahan/87.embed", "fid": "pmonahan:87", "filename": "Plot 87", "filetype": "plot", "img_url": "https://storage.googleapis.com/plotly-prod-images/pmonahan/87/9_7N8R91YATI7HYJ2BPQCSI81ZGXW2NK.png", "image_urls": { "default": "https://storage.googleapis.com/plotly-prod-images/pmonahan/87/2_WNMJV06T1PFU5IXQVMPZB1TPQQ13CA.png", "block-thumb": "https://storage.googleapis.com/plotly-prod-images/pmonahan/87/8_3KE82FG8IWUSV973I47N65TV8UA765.png", "list-thumb": "https://storage.googleapis.com/plotly-prod-images/pmonahan/87/9_7N8R91YATI7HYJ2BPQCSI81ZGXW2NK.png" }, "api_urls": { "files": "https://api.plotly.com/v2/files/pmonahan:87", "plots": "https://api.plotly.com/v2/plots/pmonahan:87", "parent": "https://api.plotly.com/v2/folders/home?user=pmonahan" }, "owner": "pmonahan", "parent": -1, "preview": "", "referencers": [], "references": [], "title": "", "views": 1, "web_url": "https://chart-studio.plotly.com/~pmonahan/87/", "world_readable": true, "date_modified": "2025-09-03T13:12:16.078Z", "stars": { "results": [], "count": 0 }, "collaborators": { "results": [], "count": 0 }, "subfolder_count": null, "refresh_interval": null, "organize_view_url": "https://chart-studio.plotly.com/~pmonahan/87/", "current_user_permission": "read", "is_theme": null, "is_template": false, "autosize": true, "caption": "", "figure": { "data": [ { "meta": { "columnNames": { "x": "Date", "y": "Romex" } }, "mode": "lines", "name": "NM-B Copper Trend", "type": "scatter", "xsrc": "pmonahan:88:8b7419", "ysrc": "pmonahan:88:c188a4", "visible": true }, { "meta": { "columnNames": { "x": "Date", "y": "CCA" } }, "mode": "lines", "name": "NM-B CCA Trend", "type": "scatter", "xsrc": "pmonahan:88:8b7419", "ysrc": "pmonahan:88:47fca2", "visible": true, "stackgroup": null }, { "meta": { "columnNames": { "x": "Month_Year", "y": "Copper_Price_Index" } }, "mode": "lines", "name": "Copper Index Trend", "type": "scatter", "xsrc": "pmonahan:89:c467c4", "ysrc": "pmonahan:89:650313", "visible": true, "stackgroup": null }, { "meta": { "columnNames": { "x": "Month_Year", "y": "Aluminum_Price_Index" } }, "mode": "lines", "name": "Aluminum Index Trend", "type": "scatter", "xsrc": "pmonahan:89:c467c4", "ysrc": "pmonahan:89:f4d766", "visible": true, "stackgroup": null } ], "frames": [], "layout": { "title": { "text": "Trends for Raw Materials and NM-B Cable, Copper vs Aluminum" }, "xaxis": { "type": "category", "range": [ 0, 11 ], "autorange": true }, "yaxis": { "type": "linear", "range": [ 99.57277777777777, 108.11722222222222 ], "autorange": true }, "autosize": true, "template": { "data": { "bar": [ { "type": "bar", "marker": { "colorbar": { "ticks": "", "outlinewidth": 0 } } } ], "table": [ { "type": "table", "cells": { "fill": { "color": "#EBF0F8" }, "line": { "color": "white" } }, "header": { "fill": { "color": "#C8D4E3" }, "line": { "color": "white" } } } ], "carpet": [ { "type": "carpet", "aaxis": { "gridcolor": "#C8D4E3", "linecolor": "#C8D4E3", "endlinecolor": "#2a3f5f", "minorgridcolor": "#C8D4E3", "startlinecolor": "#2a3f5f" }, "baxis": { "gridcolor": "#C8D4E3", "linecolor": "#C8D4E3", "endlinecolor": "#2a3f5f", "minorgridcolor": "#C8D4E3", "startlinecolor": "#2a3f5f" } } ], "mesh3d": [ { "type": "mesh3d", "colorbar": { "ticks": "", "outlinewidth": 0 } } ], "contour": [ { "type": "contour", "colorbar": { "ticks": "", "outlinewidth": 0 }, "autocolorscale": true } ], "heatmap": [ { "type": "heatmap", "colorbar": { "ticks": "", "outlinewidth": 0 }, "autocolorscale": true } ], "scatter": [ { "type": "scatter", "marker": { "colorbar": { "ticks": "", "outlinewidth": 0 } } } ], "surface": [ { "type": "surface", "colorbar": { "ticks": "", "outlinewidth": 0 } } ], "heatmapgl": [ { "type": "heatmapgl", "colorbar": { "ticks": "", "outlinewidth": 0 } } ], "histogram": [ { "type": "histogram", "marker": { "colorbar": { "ticks": "", "outlinewidth": 0 } } } ], "parcoords": [ { "line": { "colorbar": { "ticks": "", "outlinewidth": 0 } }, "type": "parcoords" } ], "scatter3d": [ { "type": "scatter3d", "marker": { "colorbar": { "ticks": "", "outlinewidth": 0 } } } ], "scattergl": [ { "type": "scattergl", "marker": { "colorbar": { "ticks": "", "outlinewidth": 0 } } } ], "choropleth": [ { "type": "choropleth", "colorbar": { "ticks": "", "outlinewidth": 0 } } ], "scattergeo": [ { "type": "scattergeo", "marker": { "colorbar": { "ticks": "", "outlinewidth": 0 } } } ], "histogram2d": [ { "type": "histogram2d", "colorbar": { "ticks": "", "outlinewidth": 0 }, "autocolorscale": true } ], "scatterpolar": [ { "type": "scatterpolar", "marker": { "colorbar": { "ticks": "", "outlinewidth": 0 } } } ], "contourcarpet": [ { "type": "contourcarpet", "colorbar": { "ticks": "", "outlinewidth": 0 } } ], "scattercarpet": [ { "type": "scattercarpet", "marker": { "colorbar": { "ticks": "", "outlinewidth": 0 } } } ], "scattermapbox": [ { "type": "scattermapbox", "marker": { "colorbar": { "ticks": "", "outlinewidth": 0 } } } ], "scatterpolargl": [ { "type": "scatterpolargl", "marker": { "colorbar": { "ticks": "", "outlinewidth": 0 } } } ], "scatterternary": [ { "type": "scatterternary", "marker": { "colorbar": { "ticks": "", "outlinewidth": 0 } } } ], "histogram2dcontour": [ { "type": "histogram2dcontour", "colorbar": { "ticks": "", "outlinewidth": 0 }, "autocolorscale": true } ] }, "layout": { "geo": { "bgcolor": "white", "showland": true, "lakecolor": "white", "landcolor": "white", "showlakes": true, "subunitcolor": "#C8D4E3" }, "font": { "color": "#2a3f5f" }, "polar": { "bgcolor": "white", "radialaxis": { "ticks": "", "gridcolor": "#EBF0F8", "linecolor": "#EBF0F8" }, "angularaxis": { "ticks": "", "gridcolor": "#EBF0F8", "linecolor": "#EBF0F8" } }, "scene": { "xaxis": { "ticks": "", "gridcolor": "#DFE8F3", "gridwidth": 2, "linecolor": "#EBF0F8", "zerolinecolor": "#EBF0F8", "showbackground": true, "backgroundcolor": "white" }, "yaxis": { "ticks": "", "gridcolor": "#DFE8F3", "gridwidth": 2, "linecolor": "#EBF0F8", "zerolinecolor": "#EBF0F8", "showbackground": true, "backgroundcolor": "white" }, "zaxis": { "ticks": "", "gridcolor": "#DFE8F3", "gridwidth": 2, "linecolor": "#EBF0F8", "zerolinecolor": "#EBF0F8", "showbackground": true, "backgroundcolor": "white" } }, "title": { "x": 0.05 }, "xaxis": { "ticks": "", "gridcolor": "#EBF0F8", "linecolor": "#EBF0F8", "automargin": true, "zerolinecolor": "#EBF0F8", "zerolinewidth": 2 }, "yaxis": { "ticks": "", "gridcolor": "#EBF0F8", "linecolor": "#EBF0F8", "automargin": true, "zerolinecolor": "#EBF0F8", "zerolinewidth": 2 }, "ternary": { "aaxis": { "ticks": "", "gridcolor": "#DFE8F3", "linecolor": "#A2B1C6" }, "baxis": { "ticks": "", "gridcolor": "#DFE8F3", "linecolor": "#A2B1C6" }, "caxis": { "ticks": "", "gridcolor": "#DFE8F3", "linecolor": "#A2B1C6" }, "bgcolor": "white" }, "colorway": [ "#636efa", "#EF553B", "#00cc96", "#ab63fa", "#19d3f3", "#e763fa", "#fecb52", "#ffa15a", "#ff6692", "#b6e880" ], "hovermode": "closest", "colorscale": { "diverging": [ [ 0, "#8e0152" ], [ 0.1, "#c51b7d" ], [ 0.2, "#de77ae" ], [ 0.3, "#f1b6da" ], [ 0.4, "#fde0ef" ], [ 0.5, "#f7f7f7" ], [ 0.6, "#e6f5d0" ], [ 0.7, "#b8e186" ], [ 0.8, "#7fbc41" ], [ 0.9, "#4d9221" ], [ 1, "#276419" ] ], "sequential": [ [ 0, "#0508b8" ], [ 0.0893854748603352, "#1910d8" ], [ 0.1787709497206704, "#3c19f0" ], [ 0.2681564245810056, "#6b1cfb" ], [ 0.3575418994413408, "#981cfd" ], [ 0.44692737430167595, "#bf1cfd" ], [ 0.5363128491620112, "#dd2bfd" ], [ 0.6256983240223464, "#f246fe" ], [ 0.7150837988826816, "#fc67fd" ], [ 0.8044692737430168, "#fe88fc" ], [ 0.8938547486033519, "#fea5fd" ], [ 0.9832402234636871, "#febefe" ], [ 1, "#fec3fe" ] ], "sequentialminus": [ [ 0, "#0508b8" ], [ 0.0893854748603352, "#1910d8" ], [ 0.1787709497206704, "#3c19f0" ], [ 0.2681564245810056, "#6b1cfb" ], [ 0.3575418994413408, "#981cfd" ], [ 0.44692737430167595, "#bf1cfd" ], [ 0.5363128491620112, "#dd2bfd" ], [ 0.6256983240223464, "#f246fe" ], [ 0.7150837988826816, "#fc67fd" ], [ 0.8044692737430168, "#fe88fc" ], [ 0.8938547486033519, "#fea5fd" ], [ 0.9832402234636871, "#febefe" ], [ 1, "#fec3fe" ] ] }, "plot_bgcolor": "white", "paper_bgcolor": "white", "shapedefaults": { "line": { "width": 0 }, "opacity": 0.4, "fillcolor": "#506784" }, "annotationdefaults": { "arrowhead": 0, "arrowcolor": "#506784", "arrowwidth": 1 } }, "themeRef": "PLOTLY_WHITE" }, "annotations": [ { "x": 8.800738255033558, "y": 103.72343270099368, "ax": 30, "ay": 64, "text": "Copperweld Changes Prices to <br>Mirror Fluctuations in Copper Market" } ] } }, "height": null, "width": null, "user": { "profile_url": "https://chart-studio.plotly.com/~pmonahan", "avatar_url": "https://storage.googleapis.com/plotly-prod-profiles/94.jpg", "background_url": "https://storage.googleapis.com/plotly-prod-profiles/bg-5.jpg", "bio": "", "nickname": "", "website": "", "stream_tokens": null, "feature_set_id": null, "csrf_token": null, "date_joined": "2018-10-25 12:38:29", "mapbox_access_tokens": null, "has_password": null, "username": "pmonahan", "email": null, "is_active": null, "readonly": null, "is_dash_creator": null, "dash_created_count": null, "is_chart_creator": null, "charts_created_count": null } }, { "creation_time": "2025-09-03T12:58:00.619280Z", "comments": { "results": [], "count": 0 }, "parented": true, "embed_url": "https://chart-studio.plotly.com/~sylvendahl/1.embed", "fid": "sylvendahl:1", "filename": "Plot 1", "filetype": "plot", "img_url": "https://storage.googleapis.com/plotly-prod-images/sylvendahl/1/9_9SQPWH9IRXVOHF12X4M3FUBZR7CC73.png", "image_urls": { "default": "https://storage.googleapis.com/plotly-prod-images/sylvendahl/1/2_EYUWC6K1BGJGH1U94BKJ4C8994SUYA.png", "block-thumb": "https://storage.googleapis.com/plotly-prod-images/sylvendahl/1/8_SIX2CJ5AH3NM2ENOZT2CWXRHJ17122.png", "list-thumb": "https://storage.googleapis.com/plotly-prod-images/sylvendahl/1/9_9SQPWH9IRXVOHF12X4M3FUBZR7CC73.png" }, "api_urls": { "files": "https://api.plotly.com/v2/files/sylvendahl:1", "plots": "https://api.plotly.com/v2/plots/sylvendahl:1", "parent": "https://api.plotly.com/v2/folders/home?user=sylvendahl" }, "owner": "sylvendahl", "parent": -1, "preview": "", "referencers": [], "references": [], "title": "", "views": 1, "web_url": "https://chart-studio.plotly.com/~sylvendahl/1/", "world_readable": true, "date_modified": "2025-09-03T12:58:00.631Z", "stars": { "results": [], "count": 0 }, "collaborators": { "results": [], "count": 0 }, "subfolder_count": null, "refresh_interval": null, "organize_view_url": "https://chart-studio.plotly.com/~sylvendahl/1/", "current_user_permission": "read", "is_theme": null, "is_template": false, "autosize": true, "caption": "", "figure": { "data": [ { "meta": { "columnNames": { "x": "year", "y": "jan" } }, "mode": "lines", "name": "jan", "type": "scatter", "xsrc": "sylvendahl:0:c53d41", "ysrc": "sylvendahl:0:6ed2e5" }, { "meta": { "columnNames": { "x": "year", "y": "feb" } }, "mode": "lines", "name": "feb", "type": "scatter", "xsrc": "sylvendahl:0:c53d41", "ysrc": "sylvendahl:0:f5a1b4", "stackgroup": null }, { "meta": { "columnNames": { "x": "year", "y": "mar" } }, "mode": "lines", "name": "mar", "type": "scatter", "xsrc": "sylvendahl:0:c53d41", "ysrc": "sylvendahl:0:b03195", "stackgroup": null }, { "meta": { "columnNames": { "x": "year", "y": "apr" } }, "mode": "lines", "name": "apr", "type": "scatter", "xsrc": "sylvendahl:0:c53d41", "ysrc": "sylvendahl:0:d8abd4", "stackgroup": null }, { "meta": { "columnNames": { "x": "year", "y": "may" } }, "mode": "lines", "name": "may", "type": "scatter", "xsrc": "sylvendahl:0:c53d41", "ysrc": "sylvendahl:0:035e65", "stackgroup": null }, { "meta": { "columnNames": { "x": "year", "y": "jun" } }, "mode": "lines", "name": "jun", "type": "scatter", "xsrc": "sylvendahl:0:c53d41", "ysrc": "sylvendahl:0:fb2aa6", "stackgroup": null }, { "meta": { "columnNames": { "x": "year", "y": "jul" } }, "mode": "lines", "name": "jul", "type": "scatter", "xsrc": "sylvendahl:0:c53d41", "ysrc": "sylvendahl:0:c2810f", "stackgroup": null }, { "meta": { "columnNames": { "x": "year", "y": "aug" } }, "mode": "lines", "name": "aug", "type": "scatter", "xsrc": "sylvendahl:0:c53d41", "ysrc": "sylvendahl:0:ae1143", "stackgroup": null }, { "meta": { "columnNames": { "x": "year", "y": "sep" } }, "mode": "lines", "name": "sep", "type": "scatter", "xsrc": "sylvendahl:0:c53d41", "ysrc": "sylvendahl:0:09e005", "stackgroup": null }, { "meta": { "columnNames": { "x": "year", "y": "oct" } }, "mode": "lines", "name": "okt", "type": "scatter", "xsrc": "sylvendahl:0:c53d41", "ysrc": "sylvendahl:0:f806f5", "stackgroup": null }, { "meta": { "columnNames": { "x": "year", "y": "nov" } }, "mode": "lines", "name": "nov", "type": "scatter", "xsrc": "sylvendahl:0:c53d41", "ysrc": "sylvendahl:0:9f7627", "stackgroup": null }, { "meta": { "columnNames": { "x": "year", "y": "dec" } }, "mode": "lines", "name": "dec", "type": "scatter", "xsrc": "sylvendahl:0:c53d41", "ysrc": "sylvendahl:0:7d5489", "stackgroup": null } ], "frames": [], "layout": { "title": { "text": "arctic" }, "xaxis": { "type": "linear", "range": [ 1979, 2015 ], "title": { "text": "year" }, "autorange": true }, "yaxis": { "type": "linear", "range": [ 2.166777777777778, 34.571222222222225 ], "title": { "text": "Ice volume 10^3km^3" }, "autorange": true }, "autosize": true, "template": { "data": { "bar": [ { "type": "bar", "marker": { "colorbar": { "ticks": "", "outlinewidth": 0 } } } ], "table": [ { "type": "table", "cells": { "fill": { "color": "#EBF0F8" }, "line": { "color": "white" } }, "header": { "fill": { "color": "#C8D4E3" }, "line": { "color": "white" } } } ], "carpet": [ { "type": "carpet", "aaxis": { "gridcolor": "#C8D4E3", "linecolor": "#C8D4E3", "endlinecolor": "#2a3f5f", "minorgridcolor": "#C8D4E3", "startlinecolor": "#2a3f5f" }, "baxis": { "gridcolor": "#C8D4E3", "linecolor": "#C8D4E3", "endlinecolor": "#2a3f5f", "minorgridcolor": "#C8D4E3", "startlinecolor": "#2a3f5f" } } ], "mesh3d": [ { "type": "mesh3d", "colorbar": { "ticks": "", "outlinewidth": 0 } } ], "contour": [ { "type": "contour", "colorbar": { "ticks": "", "outlinewidth": 0 }, "autocolorscale": true } ], "heatmap": [ { "type": "heatmap", "colorbar": { "ticks": "", "outlinewidth": 0 }, "autocolorscale": true } ], "scatter": [ { "type": "scatter", "marker": { "colorbar": { "ticks": "", "outlinewidth": 0 } } } ], "surface": [ { "type": "surface", "colorbar": { "ticks": "", "outlinewidth": 0 } } ], "heatmapgl": [ { "type": "heatmapgl", "colorbar": { "ticks": "", "outlinewidth": 0 } } ], "histogram": [ { "type": "histogram", "marker": { "colorbar": { "ticks": "", "outlinewidth": 0 } } } ], "parcoords": [ { "line": { "colorbar": { "ticks": "", "outlinewidth": 0 } }, "type": "parcoords" } ], "scatter3d": [ { "type": "scatter3d", "marker": { "colorbar": { "ticks": "", "outlinewidth": 0 } } } ], "scattergl": [ { "type": "scattergl", "marker": { "colorbar": { "ticks": "", "outlinewidth": 0 } } } ], "choropleth": [ { "type": "choropleth", "colorbar": { "ticks": "", "outlinewidth": 0 } } ], "scattergeo": [ { "type": "scattergeo", "marker": { "colorbar": { "ticks": "", "outlinewidth": 0 } } } ], "histogram2d": [ { "type": "histogram2d", "colorbar": { "ticks": "", "outlinewidth": 0 }, "autocolorscale": true } ], "scatterpolar": [ { "type": "scatterpolar", "marker": { "colorbar": { "ticks": "", "outlinewidth": 0 } } } ], "contourcarpet": [ { "type": "contourcarpet", "colorbar": { "ticks": "", "outlinewidth": 0 } } ], "scattercarpet": [ { "type": "scattercarpet", "marker": { "colorbar": { "ticks": "", "outlinewidth": 0 } } } ], "scattermapbox": [ { "type": "scattermapbox", "marker": { "colorbar": { "ticks": "", "outlinewidth": 0 } } } ], "scatterpolargl": [ { "type": "scatterpolargl", "marker": { "colorbar": { "ticks": "", "outlinewidth": 0 } } } ], "scatterternary": [ { "type": "scatterternary", "marker": { "colorbar": { "ticks": "", "outlinewidth": 0 } } } ], "histogram2dcontour": [ { "type": "histogram2dcontour", "colorbar": { "ticks": "", "outlinewidth": 0 }, "autocolorscale": true } ] }, "layout": { "geo": { "bgcolor": "white", "showland": true, "lakecolor": "white", "landcolor": "white", "showlakes": true, "subunitcolor": "#C8D4E3" }, "font": { "color": "#2a3f5f" }, "polar": { "bgcolor": "white", "radialaxis": { "ticks": "", "gridcolor": "#EBF0F8", "linecolor": "#EBF0F8" }, "angularaxis": { "ticks": "", "gridcolor": "#EBF0F8", "linecolor": "#EBF0F8" } }, "scene": { "xaxis": { "ticks": "", "gridcolor": "#DFE8F3", "gridwidth": 2, "linecolor": "#EBF0F8", "zerolinecolor": "#EBF0F8", "showbackground": true, "backgroundcolor": "white" }, "yaxis": { "ticks": "", "gridcolor": "#DFE8F3", "gridwidth": 2, "linecolor": "#EBF0F8", "zerolinecolor": "#EBF0F8", "showbackground": true, "backgroundcolor": "white" }, "zaxis": { "ticks": "", "gridcolor": "#DFE8F3", "gridwidth": 2, "linecolor": "#EBF0F8", "zerolinecolor": "#EBF0F8", "showbackground": true, "backgroundcolor": "white" } }, "title": { "x": 0.05 }, "xaxis": { "ticks": "", "gridcolor": "#EBF0F8", "linecolor": "#EBF0F8", "automargin": true, "zerolinecolor": "#EBF0F8", "zerolinewidth": 2 }, "yaxis": { "ticks": "", "gridcolor": "#EBF0F8", "linecolor": "#EBF0F8", "automargin": true, "zerolinecolor": "#EBF0F8", "zerolinewidth": 2 }, "ternary": { "aaxis": { "ticks": "", "gridcolor": "#DFE8F3", "linecolor": "#A2B1C6" }, "baxis": { "ticks": "", "gridcolor": "#DFE8F3", "linecolor": "#A2B1C6" }, "caxis": { "ticks": "", "gridcolor": "#DFE8F3", "linecolor": "#A2B1C6" }, "bgcolor": "white" }, "colorway": [ "#636efa", "#EF553B", "#00cc96", "#ab63fa", "#19d3f3", "#e763fa", "#fecb52", "#ffa15a", "#ff6692", "#b6e880" ], "hovermode": "closest", "colorscale": { "diverging": [ [ 0, "#8e0152" ], [ 0.1, "#c51b7d" ], [ 0.2, "#de77ae" ], [ 0.3, "#f1b6da" ], [ 0.4, "#fde0ef" ], [ 0.5, "#f7f7f7" ], [ 0.6, "#e6f5d0" ], [ 0.7, "#b8e186" ], [ 0.8, "#7fbc41" ], [ 0.9, "#4d9221" ], [ 1, "#276419" ] ], "sequential": [ [ 0, "#0508b8" ], [ 0.0893854748603352, "#1910d8" ], [ 0.1787709497206704, "#3c19f0" ], [ 0.2681564245810056, "#6b1cfb" ], [ 0.3575418994413408, "#981cfd" ], [ 0.44692737430167595, "#bf1cfd" ], [ 0.5363128491620112, "#dd2bfd" ], [ 0.6256983240223464, "#f246fe" ], [ 0.7150837988826816, "#fc67fd" ], [ 0.8044692737430168, "#fe88fc" ], [ 0.8938547486033519, "#fea5fd" ], [ 0.9832402234636871, "#febefe" ], [ 1, "#fec3fe" ] ], "sequentialminus": [ [ 0, "#0508b8" ], [ 0.0893854748603352, "#1910d8" ], [ 0.1787709497206704, "#3c19f0" ], [ 0.2681564245810056, "#6b1cfb" ], [ 0.3575418994413408, "#981cfd" ], [ 0.44692737430167595, "#bf1cfd" ], [ 0.5363128491620112, "#dd2bfd" ], [ 0.6256983240223464, "#f246fe" ], [ 0.7150837988826816, "#fc67fd" ], [ 0.8044692737430168, "#fe88fc" ], [ 0.8938547486033519, "#fea5fd" ], [ 0.9832402234636871, "#febefe" ], [ 1, "#fec3fe" ] ] }, "plot_bgcolor": "white", "paper_bgcolor": "white", "shapedefaults": { "line": { "width": 0 }, "opacity": 0.4, "fillcolor": "#506784" }, "annotationdefaults": { "arrowhead": 0, "arrowcolor": "#506784", "arrowwidth": 1 } }, "themeRef": "PLOTLY_WHITE" } } }, "height": null, "width": null, "user": { "profile_url": "https://chart-studio.plotly.com/~sylvendahl", "avatar_url": "https://storage.googleapis.com/plotly-prod-profiles/90.jpg", "background_url": "https://storage.googleapis.com/plotly-prod-profiles/bg-4.jpg", "bio": "", "nickname": "", "website": "", "stream_tokens": null, "feature_set_id": null, "csrf_token": null, "date_joined": "2025-09-03 12:50:59", "mapbox_access_tokens": null, "has_password": null, "username": "sylvendahl", "email": null, "is_active": null, "readonly": null, "is_dash_creator": null, "dash_created_count": null, "is_chart_creator": null, "charts_created_count": null } }, { "creation_time": "2025-09-03T12:43:34.733411Z", "comments": { "results": [], "count": 0 }, "parented": true, "embed_url": "https://chart-studio.plotly.com/~mszell/64.embed", "fid": "mszell:64", "filename": "Plot 53 copy copy copy copy copy", "filetype": "plot", "img_url": "https://storage.googleapis.com/plotly-prod-images/mszell/64/9_J7NPLK6LNYLVSYRZISDOVPX4LQM4AQ.png", "image_urls": { "default": "https://storage.googleapis.com/plotly-prod-images/mszell/64/2_Q95IP9WN88V3JN8CWPQK2ZIU1TJO81.png", "block-thumb": "https://storage.googleapis.com/plotly-prod-images/mszell/64/8_ABG16Q68RASHCV8AHX8EZ5OCNWG9GE.png", "list-thumb": "https://storage.googleapis.com/plotly-prod-images/mszell/64/9_J7NPLK6LNYLVSYRZISDOVPX4LQM4AQ.png" }, "api_urls": { "files": "https://api.plotly.com/v2/files/mszell:64", "plots": "https://api.plotly.com/v2/plots/mszell:64", "parent": "https://api.plotly.com/v2/folders/home?user=mszell" }, "owner": "mszell", "parent": -1, "preview": "", "referencers": [], "references": [], "title": "", "views": 36, "web_url": "https://chart-studio.plotly.com/~mszell/64/", "world_readable": true, "date_modified": "2025-09-03T12:45:52.251Z", "stars": { "results": [], "count": 0 }, "collaborators": { "results": [], "count": 0 }, "subfolder_count": null, "refresh_interval": null, "organize_view_url": "https://chart-studio.plotly.com/~mszell/64/", "current_user_permission": "read", "is_theme": null, "is_template": false, "autosize": false, "caption": "", "figure": { "data": [ { "meta": { "columnNames": { "x": "date", "y": "fullprof" } }, "name": "Professor", "type": "bar", "xsrc": "mszell:63:472224", "ysrc": "mszell:63:30142c", "marker": { "color": "rgb(20, 20, 191)" }, "visible": true, "hoverinfo": "y+name", "orientation": "v" }, { "meta": { "columnNames": { "x": "date", "y": "assocprof" } }, "name": "Assoc. Prof.", "type": "bar", "xsrc": "mszell:63:472224", "ysrc": "mszell:63:fc66f9", "marker": { "color": "rgb(67, 106, 235)" }, "visible": true, "hoverinfo": "y+name", "orientation": "v" }, { "meta": { "columnNames": { "x": "date", "y": "asstprof" } }, "name": "Asst. Prof.", "type": "bar", "xsrc": "mszell:63:472224", "ysrc": "mszell:63:6b94f0", "marker": { "color": "rgb(89, 181, 237)", "opacity": 1 }, "visible": true, "hoverinfo": "y+name", "orientation": "v", "textposition": "none" }, { "meta": { "columnNames": { "x": "date", "y": "postdoc" } }, "name": "Postdoc", "type": "bar", "xsrc": "mszell:63:472224", "ysrc": "mszell:63:7cb8f3", "marker": { "color": "rgb(17, 135, 17)" }, "visible": true, "hoverinfo": "y+name", "orientation": "v" }, { "meta": { "columnNames": { "x": "date", "y": "phd" } }, "mode": "lines", "name": "PhD", "type": "bar", "xsrc": "mszell:63:472224", "ysrc": "mszell:63:098f01", "marker": { "line": { "width": 0 }, "color": "rgb(50, 217, 71)" }, "visible": true, "hoverinfo": "y+name", "stackgroup": 1, "orientation": "v" }, { "meta": { "columnNames": { "x": "date", "y": "visitor/intern" } }, "name": "Visitor/Intern", "type": "bar", "xsrc": "mszell:63:472224", "ysrc": "mszell:63:5e986b", "marker": { "color": "rgb(157, 149, 158)" }, "visible": true, "hoverinfo": "y+name", "orientation": "v" } ], "frames": [], "layout": { "title": { "x": 0.05, "font": { "size": 17 }, "text": "NERDS over time" }, "width": 600, "xaxis": { "type": "date", "range": [ "2019-03-18", "2025-09-15" ], "ticks": "outside", "title": { "text": "" }, "nticks": 0, "showgrid": true, "showline": true, "zeroline": false, "autorange": true, "gridwidth": 2, "tickwidth": 1, "fixedrange": false, "showspikes": false, "rangeslider": { "range": [ "2019-03-18", "2021-12-15" ], "yaxis": {}, "visible": false, "autorange": true }, "rangeselector": { "visible": false } }, "yaxis": { "type": "linear", "range": [ 0, 32.63157894736842 ], "ticks": "", "title": { "text": "Click to enter Y axis title" }, "autorange": true, "gridwidth": 2, "showspikes": false }, "bargap": 0.19999999999999996, "height": 360, "legend": { "x": 0.043243666824292426, "y": 0.9639350453172209, "valign": "middle", "xanchor": "auto", "yanchor": "top", "borderwidth": 1, "orientation": "v" }, "margin": { "b": 4, "l": 4, "r": 4, "t": 40, "pad": 0 }, "barmode": "stack", "autosize": false, "dragmode": "pan", "template": { "data": { "bar": [ { "type": "bar", "marker": { "colorbar": { "ticks": "", "outlinewidth": 0 } } } ], "table": [ { "type": "table", "cells": { "fill": { "color": "#EBF0F8" }, "line": { "color": "white" } }, "header": { "fill": { "color": "#C8D4E3" }, "line": { "color": "white" } } } ], "carpet": [ { "type": "carpet", "aaxis": { "gridcolor": "#C8D4E3", "linecolor": "#C8D4E3", "endlinecolor": "#2a3f5f", "minorgridcolor": "#C8D4E3", "startlinecolor": "#2a3f5f" }, "baxis": { "gridcolor": "#C8D4E3", "linecolor": "#C8D4E3", "endlinecolor": "#2a3f5f", "minorgridcolor": "#C8D4E3", "startlinecolor": "#2a3f5f" } } ], "mesh3d": [ { "type": "mesh3d", "colorbar": { "ticks": "", "outlinewidth": 0 } } ], "contour": [ { "type": "contour", "colorbar": { "ticks": "", "outlinewidth": 0 }, "autocolorscale": true } ], "heatmap": [ { "type": "heatmap", "colorbar": { "ticks": "", "outlinewidth": 0 }, "autocolorscale": true } ], "scatter": [ { "type": "scatter", "marker": { "colorbar": { "ticks": "", "outlinewidth": 0 } } } ], "surface": [ { "type": "surface", "colorbar": { "ticks": "", "outlinewidth": 0 } } ], "heatmapgl": [ { "type": "heatmapgl", "colorbar": { "ticks": "", "outlinewidth": 0 } } ], "histogram": [ { "type": "histogram", "marker": { "colorbar": { "ticks": "", "outlinewidth": 0 } } } ], "parcoords": [ { "line": { "colorbar": { "ticks": "", "outlinewidth": 0 } }, "type": "parcoords" } ], "scatter3d": [ { "type": "scatter3d", "marker": { "colorbar": { "ticks": "", "outlinewidth": 0 } } } ], "scattergl": [ { "type": "scattergl", "marker": { "colorbar": { "ticks": "", "outlinewidth": 0 } } } ], "choropleth": [ { "type": "choropleth", "colorbar": { "ticks": "", "outlinewidth": 0 } } ], "scattergeo": [ { "type": "scattergeo", "marker": { "colorbar": { "ticks": "", "outlinewidth": 0 } } } ], "histogram2d": [ { "type": "histogram2d", "colorbar": { "ticks": "", "outlinewidth": 0 }, "autocolorscale": true } ], "scatterpolar": [ { "type": "scatterpolar", "marker": { "colorbar": { "ticks": "", "outlinewidth": 0 } } } ], "contourcarpet": [ { "type": "contourcarpet", "colorbar": { "ticks": "", "outlinewidth": 0 } } ], "scattercarpet": [ { "type": "scattercarpet", "marker": { "colorbar": { "ticks": "", "outlinewidth": 0 } } } ], "scattermapbox": [ { "type": "scattermapbox", "marker": { "colorbar": { "ticks": "", "outlinewidth": 0 } } } ], "scatterpolargl": [ { "type": "scatterpolargl", "marker": { "colorbar": { "ticks": "", "outlinewidth": 0 } } } ], "scatterternary": [ { "type": "scatterternary", "marker": { "colorbar": { "ticks": "", "outlinewidth": 0 } } } ], "histogram2dcontour": [ { "type": "histogram2dcontour", "colorbar": { "ticks": "", "outlinewidth": 0 }, "autocolorscale": true } ] }, "layout": { "geo": { "bgcolor": "white", "showland": true, "lakecolor": "white", "landcolor": "white", "showlakes": true, "subunitcolor": "#C8D4E3" }, "font": { "color": "#2a3f5f" }, "polar": { "bgcolor": "white", "radialaxis": { "ticks": "", "gridcolor": "#EBF0F8", "linecolor": "#EBF0F8" }, "angularaxis": { "ticks": "", "gridcolor": "#EBF0F8", "linecolor": "#EBF0F8" } }, "scene": { "xaxis": { "ticks": "", "gridcolor": "#DFE8F3", "gridwidth": 2, "linecolor": "#EBF0F8", "zerolinecolor": "#EBF0F8", "showbackground": true, "backgroundcolor": "white" }, "yaxis": { "ticks": "", "gridcolor": "#DFE8F3", "gridwidth": 2, "linecolor": "#EBF0F8", "zerolinecolor": "#EBF0F8", "showbackground": true, "backgroundcolor": "white" }, "zaxis": { "ticks": "", "gridcolor": "#DFE8F3", "gridwidth": 2, "linecolor": "#EBF0F8", "zerolinecolor": "#EBF0F8", "showbackground": true, "backgroundcolor": "white" } }, "title": { "x": 0.05 }, "xaxis": { "ticks": "", "gridcolor": "#EBF0F8", "linecolor": "#EBF0F8", "automargin": true, "zerolinecolor": "#EBF0F8", "zerolinewidth": 2 }, "yaxis": { "ticks": "", "gridcolor": "#EBF0F8", "linecolor": "#EBF0F8", "automargin": true, "zerolinecolor": "#EBF0F8", "zerolinewidth": 2 }, "ternary": { "aaxis": { "ticks": "", "gridcolor": "#DFE8F3", "linecolor": "#A2B1C6" }, "baxis": { "ticks": "", "gridcolor": "#DFE8F3", "linecolor": "#A2B1C6" }, "caxis": { "ticks": "", "gridcolor": "#DFE8F3", "linecolor": "#A2B1C6" }, "bgcolor": "white" }, "colorway": [ "#636efa", "#EF553B", "#00cc96", "#ab63fa", "#19d3f3", "#e763fa", "#fecb52", "#ffa15a", "#ff6692", "#b6e880" ], "hovermode": "closest", "colorscale": { "diverging": [ [ 0, "#8e0152" ], [ 0.1, "#c51b7d" ], [ 0.2, "#de77ae" ], [ 0.3, "#f1b6da" ], [ 0.4, "#fde0ef" ], [ 0.5, "#f7f7f7" ], [ 0.6, "#e6f5d0" ], [ 0.7, "#b8e186" ], [ 0.8, "#7fbc41" ], [ 0.9, "#4d9221" ], [ 1, "#276419" ] ], "sequential": [ [ 0, "#0508b8" ], [ 0.0893854748603352, "#1910d8" ], [ 0.1787709497206704, "#3c19f0" ], [ 0.2681564245810056, "#6b1cfb" ], [ 0.3575418994413408, "#981cfd" ], [ 0.44692737430167595, "#bf1cfd" ], [ 0.5363128491620112, "#dd2bfd" ], [ 0.6256983240223464, "#f246fe" ], [ 0.7150837988826816, "#fc67fd" ], [ 0.8044692737430168, "#fe88fc" ], [ 0.8938547486033519, "#fea5fd" ], [ 0.9832402234636871, "#febefe" ], [ 1, "#fec3fe" ] ], "sequentialminus": [ [ 0, "#0508b8" ], [ 0.0893854748603352, "#1910d8" ], [ 0.1787709497206704, "#3c19f0" ], [ 0.2681564245810056, "#6b1cfb" ], [ 0.3575418994413408, "#981cfd" ], [ 0.44692737430167595, "#bf1cfd" ], [ 0.5363128491620112, "#dd2bfd" ], [ 0.6256983240223464, "#f246fe" ], [ 0.7150837988826816, "#fc67fd" ], [ 0.8044692737430168, "#fe88fc" ], [ 0.8938547486033519, "#fea5fd" ], [ 0.9832402234636871, "#febefe" ], [ 1, "#fec3fe" ] ] }, "plot_bgcolor": "white", "paper_bgcolor": "white", "shapedefaults": { "line": { "width": 0 }, "opacity": 0.4, "fillcolor": "#506784" }, "annotationdefaults": { "arrowhead": 0, "arrowcolor": "#506784", "arrowwidth": 1 } }, "themeRef": "PLOTLY_WHITE" }, "hovermode": "x", "bargroupgap": 0.15 } }, "height": 360, "width": 600, "user": { "profile_url": "https://chart-studio.plotly.com/~mszell", "avatar_url": "https://storage.googleapis.com/plotly-prod-profiles/26.jpg", "background_url": "https://storage.googleapis.com/plotly-prod-profiles/bg-6.jpg", "bio": "", "nickname": "Michael Szell", "website": "http://michael.szell.net/", "stream_tokens": null, "feature_set_id": null, "csrf_token": null, "date_joined": "2014-09-24 20:48:49", "mapbox_access_tokens": null, "has_password": null, "username": "mszell", "email": null, "is_active": null, "readonly": null, "is_dash_creator": null, "dash_created_count": null, "is_chart_creator": null, "charts_created_count": null } }, { "creation_time": "2025-09-03T11:33:32.366231Z", "comments": { "results": [], "count": 0 }, "parented": true, "embed_url": "https://chart-studio.plotly.com/~handigital/5.embed", "fid": "handigital:5", "filename": "Plot 5", "filetype": "plot", "img_url": "https://storage.googleapis.com/plotly-prod-images/handigital/5/9_EQG6YF8M6S1ESSS0SIW2I7SEDT76E3.png", "image_urls": { "default": "https://storage.googleapis.com/plotly-prod-images/handigital/5/2_G9H6WPHHXOFQ7YDHGOHUKERYVXI35S.png", "block-thumb": "https://storage.googleapis.com/plotly-prod-images/handigital/5/8_STPGVOWC1U0HSUUP5R15QU18MV2C4D.png", "list-thumb": "https://storage.googleapis.com/plotly-prod-images/handigital/5/9_EQG6YF8M6S1ESSS0SIW2I7SEDT76E3.png" }, "api_urls": { "files": "https://api.plotly.com/v2/files/handigital:5", "plots": "https://api.plotly.com/v2/plots/handigital:5", "parent": "https://api.plotly.com/v2/folders/home?user=handigital" }, "owner": "handigital", "parent": -1, "preview": "", "referencers": [], "references": [], "title": "", "views": 1, "web_url": "https://chart-studio.plotly.com/~handigital/5/", "world_readable": true, "date_modified": "2025-09-03T11:33:32.379Z", "stars": { "results": [], "count": 0 }, "collaborators": { "results": [], "count": 0 }, "subfolder_count": null, "refresh_interval": null, "organize_view_url": "https://chart-studio.plotly.com/~handigital/5/", "current_user_permission": "read", "is_theme": null, "is_template": false, "autosize": true, "caption": "", "figure": { "data": [ { "meta": { "columnNames": { "x": "Platform", "y": "Price" } }, "mode": "markers", "name": "Price", "type": "bar", "xsrc": "handigital:4:ea7b01", "ysrc": "handigital:4:bae294", "orientation": "v" }, { "meta": { "columnNames": { "x": "Platform", "y": "Rating" } }, "name": "Rating", "type": "bar", "xsrc": "handigital:4:ea7b01", "ysrc": "handigital:4:9c2dd5", "orientation": "v" } ], "frames": [], "layout": { "xaxis": { "type": "category", "range": [ -0.5, 1.5 ], "autorange": true }, "yaxis": { "type": "linear", "range": [ 0, 210.4736842105263 ], "autorange": true }, "autosize": true, "template": { "data": { "bar": [ { "type": "bar", "marker": { "colorbar": { "ticks": "", "outlinewidth": 0 } } } ], "table": [ { "type": "table", "cells": { "fill": { "color": "#EBF0F8" }, "line": { "color": "white" } }, "header": { "fill": { "color": "#C8D4E3" }, "line": { "color": "white" } } } ], "carpet": [ { "type": "carpet", "aaxis": { "gridcolor": "#C8D4E3", "linecolor": "#C8D4E3", "endlinecolor": "#2a3f5f", "minorgridcolor": "#C8D4E3", "startlinecolor": "#2a3f5f" }, "baxis": { "gridcolor": "#C8D4E3", "linecolor": "#C8D4E3", "endlinecolor": "#2a3f5f", "minorgridcolor": "#C8D4E3", "startlinecolor": "#2a3f5f" } } ], "mesh3d": [ { "type": "mesh3d", "colorbar": { "ticks": "", "outlinewidth": 0 } } ], "contour": [ { "type": "contour", "colorbar": { "ticks": "", "outlinewidth": 0 }, "autocolorscale": true } ], "heatmap": [ { "type": "heatmap", "colorbar": { "ticks": "", "outlinewidth": 0 }, "autocolorscale": true } ], "scatter": [ { "type": "scatter", "marker": { "colorbar": { "ticks": "", "outlinewidth": 0 } } } ], "surface": [ { "type": "surface", "colorbar": { "ticks": "", "outlinewidth": 0 } } ], "heatmapgl": [ { "type": "heatmapgl", "colorbar": { "ticks": "", "outlinewidth": 0 } } ], "histogram": [ { "type": "histogram", "marker": { "colorbar": { "ticks": "", "outlinewidth": 0 } } } ], "parcoords": [ { "line": { "colorbar": { "ticks": "", "outlinewidth": 0 } }, "type": "parcoords" } ], "scatter3d": [ { "type": "scatter3d", "marker": { "colorbar": { "ticks": "", "outlinewidth": 0 } } } ], "scattergl": [ { "type": "scattergl", "marker": { "colorbar": { "ticks": "", "outlinewidth": 0 } } } ], "choropleth": [ { "type": "choropleth", "colorbar": { "ticks": "", "outlinewidth": 0 } } ], "scattergeo": [ { "type": "scattergeo", "marker": { "colorbar": { "ticks": "", "outlinewidth": 0 } } } ], "histogram2d": [ { "type": "histogram2d", "colorbar": { "ticks": "", "outlinewidth": 0 }, "autocolorscale": true } ], "scatterpolar": [ { "type": "scatterpolar", "marker": { "colorbar": { "ticks": "", "outlinewidth": 0 } } } ], "contourcarpet": [ { "type": "contourcarpet", "colorbar": { "ticks": "", "outlinewidth": 0 } } ], "scattercarpet": [ { "type": "scattercarpet", "marker": { "colorbar": { "ticks": "", "outlinewidth": 0 } } } ], "scattermapbox": [ { "type": "scattermapbox", "marker": { "colorbar": { "ticks": "", "outlinewidth": 0 } } } ], "scatterpolargl": [ { "type": "scatterpolargl", "marker": { "colorbar": { "ticks": "", "outlinewidth": 0 } } } ], "scatterternary": [ { "type": "scatterternary", "marker": { "colorbar": { "ticks": "", "outlinewidth": 0 } } } ], "histogram2dcontour": [ { "type": "histogram2dcontour", "colorbar": { "ticks": "", "outlinewidth": 0 }, "autocolorscale": true } ] }, "layout": { "geo": { "bgcolor": "white", "showland": true, "lakecolor": "white", "landcolor": "white", "showlakes": true, "subunitcolor": "#C8D4E3" }, "font": { "color": "#2a3f5f" }, "polar": { "bgcolor": "white", "radialaxis": { "ticks": "", "gridcolor": "#EBF0F8", "linecolor": "#EBF0F8" }, "angularaxis": { "ticks": "", "gridcolor": "#EBF0F8", "linecolor": "#EBF0F8" } }, "scene": { "xaxis": { "ticks": "", "gridcolor": "#DFE8F3", "gridwidth": 2, "linecolor": "#EBF0F8", "zerolinecolor": "#EBF0F8", "showbackground": true, "backgroundcolor": "white" }, "yaxis": { "ticks": "", "gridcolor": "#DFE8F3", "gridwidth": 2, "linecolor": "#EBF0F8", "zerolinecolor": "#EBF0F8", "showbackground": true, "backgroundcolor": "white" }, "zaxis": { "ticks": "", "gridcolor": "#DFE8F3", "gridwidth": 2, "linecolor": "#EBF0F8", "zerolinecolor": "#EBF0F8", "showbackground": true, "backgroundcolor": "white" } }, "title": { "x": 0.05 }, "xaxis": { "ticks": "", "gridcolor": "#EBF0F8", "linecolor": "#EBF0F8", "automargin": true, "zerolinecolor": "#EBF0F8", "zerolinewidth": 2 }, "yaxis": { "ticks": "", "gridcolor": "#EBF0F8", "linecolor": "#EBF0F8", "automargin": true, "zerolinecolor": "#EBF0F8", "zerolinewidth": 2 }, "ternary": { "aaxis": { "ticks": "", "gridcolor": "#DFE8F3", "linecolor": "#A2B1C6" }, "baxis": { "ticks": "", "gridcolor": "#DFE8F3", "linecolor": "#A2B1C6" }, "caxis": { "ticks": "", "gridcolor": "#DFE8F3", "linecolor": "#A2B1C6" }, "bgcolor": "white" }, "colorway": [ "#636efa", "#EF553B", "#00cc96", "#ab63fa", "#19d3f3", "#e763fa", "#fecb52", "#ffa15a", "#ff6692", "#b6e880" ], "hovermode": "closest", "colorscale": { "diverging": [ [ 0, "#8e0152" ], [ 0.1, "#c51b7d" ], [ 0.2, "#de77ae" ], [ 0.3, "#f1b6da" ], [ 0.4, "#fde0ef" ], [ 0.5, "#f7f7f7" ], [ 0.6, "#e6f5d0" ], [ 0.7, "#b8e186" ], [ 0.8, "#7fbc41" ], [ 0.9, "#4d9221" ], [ 1, "#276419" ] ], "sequential": [ [ 0, "#0508b8" ], [ 0.0893854748603352, "#1910d8" ], [ 0.1787709497206704, "#3c19f0" ], [ 0.2681564245810056, "#6b1cfb" ], [ 0.3575418994413408, "#981cfd" ], [ 0.44692737430167595, "#bf1cfd" ], [ 0.5363128491620112, "#dd2bfd" ], [ 0.6256983240223464, "#f246fe" ], [ 0.7150837988826816, "#fc67fd" ], [ 0.8044692737430168, "#fe88fc" ], [ 0.8938547486033519, "#fea5fd" ], [ 0.9832402234636871, "#febefe" ], [ 1, "#fec3fe" ] ], "sequentialminus": [ [ 0, "#0508b8" ], [ 0.0893854748603352, "#1910d8" ], [ 0.1787709497206704, "#3c19f0" ], [ 0.2681564245810056, "#6b1cfb" ], [ 0.3575418994413408, "#981cfd" ], [ 0.44692737430167595, "#bf1cfd" ], [ 0.5363128491620112, "#dd2bfd" ], [ 0.6256983240223464, "#f246fe" ], [ 0.7150837988826816, "#fc67fd" ], [ 0.8044692737430168, "#fe88fc" ], [ 0.8938547486033519, "#fea5fd" ], [ 0.9832402234636871, "#febefe" ], [ 1, "#fec3fe" ] ] }, "plot_bgcolor": "white", "paper_bgcolor": "white", "shapedefaults": { "line": { "width": 0 }, "opacity": 0.4, "fillcolor": "#506784" }, "annotationdefaults": { "arrowhead": 0, "arrowcolor": "#506784", "arrowwidth": 1 } }, "themeRef": "PLOTLY_WHITE" } } }, "height": null, "width": null, "user": { "profile_url": "https://chart-studio.plotly.com/~handigital", "avatar_url": "https://storage.googleapis.com/plotly-prod-profiles/77.jpg", "background_url": "https://storage.googleapis.com/plotly-prod-profiles/bg-2.jpg", "bio": "", "nickname": "", "website": "", "stream_tokens": null, "feature_set_id": null, "csrf_token": null, "date_joined": "2025-08-11 11:45:18", "mapbox_access_tokens": null, "has_password": null, "username": "handigital", "email": null, "is_active": null, "readonly": null, "is_dash_creator": null, "dash_created_count": null, "is_chart_creator": null, "charts_created_count": null } }, { "creation_time": "2025-09-03T11:19:25.465203Z", "comments": { "results": [], "count": 0 }, "parented": true, "embed_url": "https://chart-studio.plotly.com/~Sienna_R/1.embed", "fid": "Sienna_R:1", "filename": "Plot 1", "filetype": "plot", "img_url": "https://storage.googleapis.com/plotly-prod-images/Sienna_R/1/9_M0O52GW7JQ6BH2JXUTO6J93C67VQIM.png", "image_urls": { "default": "https://storage.googleapis.com/plotly-prod-images/Sienna_R/1/2_8HDWCIX5T3D4SOU2Z0WCGHF0DYLI9G.png", "block-thumb": "https://storage.googleapis.com/plotly-prod-images/Sienna_R/1/8_QRI1B6FXVVQK4LHBSYGFCZD3XM0EMY.png", "list-thumb": "https://storage.googleapis.com/plotly-prod-images/Sienna_R/1/9_M0O52GW7JQ6BH2JXUTO6J93C67VQIM.png" }, "api_urls": { "files": "https://api.plotly.com/v2/files/Sienna_R:1", "plots": "https://api.plotly.com/v2/plots/Sienna_R:1", "parent": "https://api.plotly.com/v2/folders/home?user=Sienna_R" }, "owner": "Sienna_R", "parent": -1, "preview": "", "referencers": [], "references": [], "title": "", "views": 1, "web_url": "https://chart-studio.plotly.com/~Sienna_R/1/", "world_readable": true, "date_modified": "2025-09-03T11:19:25.477Z", "stars": { "results": [], "count": 0 }, "collaborators": { "results": [], "count": 0 }, "subfolder_count": null, "refresh_interval": null, "organize_view_url": "https://chart-studio.plotly.com/~Sienna_R/1/", "current_user_permission": "read", "is_theme": null, "is_template": false, "autosize": true, "caption": "", "figure": { "data": [ { "uid": "5d52b2", "meta": { "columnNames": { "x": "A", "y": "B" } }, "mode": "markers", "name": "Exact Data Point", "type": "scatter", "xsrc": "Sienna_R:0:78c48f", "ysrc": "Sienna_R:0:72c7b7" }, { "uid": "143d98", "transforms": [ { "rms": "", "type": "fit", "inputUid": "5d52b2", "regressor": "x", "parameters": [ { "hold": false, "name": "a", "error": 0.24915774472940552, "value": 0.9179365079364089 }, { "hold": false, "name": "b", "error": 4.571212882809029, "value": -4.998190476188589 }, { "hold": false, "name": "c", "error": 17.995330791231098, "value": 41.26999999999268 } ], "regressand": "y", "correlation": "", "fitfunction": "a*x^2 + b*x + c", "inputxrange": [], "outputxrange": [], "interpolation": 50 } ] } ], "frames": [], "layout": { "title": { "text": "Impact of Distance on Light Intensity" }, "xaxis": { "type": "linear", "range": [ 2.2755632582322356, 15.724436741767764 ], "title": { "text": "Distance between Light Source and Puff Paint Sample (cm)" }, "autorange": true }, "yaxis": { "type": "linear", "range": [ 26.8537460317434, 180.51596825396726 ], "title": { "text": "Time for Puff Paint to Activate (s)" }, "autorange": true }, "autosize": true, "template": { "data": { "bar": [ { "type": "bar", "marker": { "colorbar": { "ticks": "", "outlinewidth": 0 } } } ], "table": [ { "type": "table", "cells": { "fill": { "color": "#EBF0F8" }, "line": { "color": "white" } }, "header": { "fill": { "color": "#C8D4E3" }, "line": { "color": "white" } } } ], "carpet": [ { "type": "carpet", "aaxis": { "gridcolor": "#C8D4E3", "linecolor": "#C8D4E3", "endlinecolor": "#2a3f5f", "minorgridcolor": "#C8D4E3", "startlinecolor": "#2a3f5f" }, "baxis": { "gridcolor": "#C8D4E3", "linecolor": "#C8D4E3", "endlinecolor": "#2a3f5f", "minorgridcolor": "#C8D4E3", "startlinecolor": "#2a3f5f" } } ], "mesh3d": [ { "type": "mesh3d", "colorbar": { "ticks": "", "outlinewidth": 0 } } ], "contour": [ { "type": "contour", "colorbar": { "ticks": "", "outlinewidth": 0 }, "autocolorscale": true } ], "heatmap": [ { "type": "heatmap", "colorbar": { "ticks": "", "outlinewidth": 0 }, "autocolorscale": true } ], "scatter": [ { "type": "scatter", "marker": { "colorbar": { "ticks": "", "outlinewidth": 0 } } } ], "surface": [ { "type": "surface", "colorbar": { "ticks": "", "outlinewidth": 0 } } ], "heatmapgl": [ { "type": "heatmapgl", "colorbar": { "ticks": "", "outlinewidth": 0 } } ], "histogram": [ { "type": "histogram", "marker": { "colorbar": { "ticks": "", "outlinewidth": 0 } } } ], "parcoords": [ { "line": { "colorbar": { "ticks": "", "outlinewidth": 0 } }, "type": "parcoords" } ], "scatter3d": [ { "type": "scatter3d", "marker": { "colorbar": { "ticks": "", "outlinewidth": 0 } } } ], "scattergl": [ { "type": "scattergl", "marker": { "colorbar": { "ticks": "", "outlinewidth": 0 } } } ], "choropleth": [ { "type": "choropleth", "colorbar": { "ticks": "", "outlinewidth": 0 } } ], "scattergeo": [ { "type": "scattergeo", "marker": { "colorbar": { "ticks": "", "outlinewidth": 0 } } } ], "histogram2d": [ { "type": "histogram2d", "colorbar": { "ticks": "", "outlinewidth": 0 }, "autocolorscale": true } ], "scatterpolar": [ { "type": "scatterpolar", "marker": { "colorbar": { "ticks": "", "outlinewidth": 0 } } } ], "contourcarpet": [ { "type": "contourcarpet", "colorbar": { "ticks": "", "outlinewidth": 0 } } ], "scattercarpet": [ { "type": "scattercarpet", "marker": { "colorbar": { "ticks": "", "outlinewidth": 0 } } } ], "scattermapbox": [ { "type": "scattermapbox", "marker": { "colorbar": { "ticks": "", "outlinewidth": 0 } } } ], "scatterpolargl": [ { "type": "scatterpolargl", "marker": { "colorbar": { "ticks": "", "outlinewidth": 0 } } } ], "scatterternary": [ { "type": "scatterternary", "marker": { "colorbar": { "ticks": "", "outlinewidth": 0 } } } ], "histogram2dcontour": [ { "type": "histogram2dcontour", "colorbar": { "ticks": "", "outlinewidth": 0 }, "autocolorscale": true } ] }, "layout": { "geo": { "bgcolor": "white", "showland": true, "lakecolor": "white", "landcolor": "white", "showlakes": true, "subunitcolor": "#C8D4E3" }, "font": { "color": "#2a3f5f" }, "polar": { "bgcolor": "white", "radialaxis": { "ticks": "", "gridcolor": "#EBF0F8", "linecolor": "#EBF0F8" }, "angularaxis": { "ticks": "", "gridcolor": "#EBF0F8", "linecolor": "#EBF0F8" } }, "scene": { "xaxis": { "ticks": "", "gridcolor": "#DFE8F3", "gridwidth": 2, "linecolor": "#EBF0F8", "zerolinecolor": "#EBF0F8", "showbackground": true, "backgroundcolor": "white" }, "yaxis": { "ticks": "", "gridcolor": "#DFE8F3", "gridwidth": 2, "linecolor": "#EBF0F8", "zerolinecolor": "#EBF0F8", "showbackground": true, "backgroundcolor": "white" }, "zaxis": { "ticks": "", "gridcolor": "#DFE8F3", "gridwidth": 2, "linecolor": "#EBF0F8", "zerolinecolor": "#EBF0F8", "showbackground": true, "backgroundcolor": "white" } }, "title": { "x": 0.05 }, "xaxis": { "ticks": "", "gridcolor": "#EBF0F8", "linecolor": "#EBF0F8", "automargin": true, "zerolinecolor": "#EBF0F8", "zerolinewidth": 2 }, "yaxis": { "ticks": "", "gridcolor": "#EBF0F8", "linecolor": "#EBF0F8", "automargin": true, "zerolinecolor": "#EBF0F8", "zerolinewidth": 2 }, "ternary": { "aaxis": { "ticks": "", "gridcolor": "#DFE8F3", "linecolor": "#A2B1C6" }, "baxis": { "ticks": "", "gridcolor": "#DFE8F3", "linecolor": "#A2B1C6" }, "caxis": { "ticks": "", "gridcolor": "#DFE8F3", "linecolor": "#A2B1C6" }, "bgcolor": "white" }, "colorway": [ "#636efa", "#EF553B", "#00cc96", "#ab63fa", "#19d3f3", "#e763fa", "#fecb52", "#ffa15a", "#ff6692", "#b6e880" ], "hovermode": "closest", "colorscale": { "diverging": [ [ 0, "#8e0152" ], [ 0.1, "#c51b7d" ], [ 0.2, "#de77ae" ], [ 0.3, "#f1b6da" ], [ 0.4, "#fde0ef" ], [ 0.5, "#f7f7f7" ], [ 0.6, "#e6f5d0" ], [ 0.7, "#b8e186" ], [ 0.8, "#7fbc41" ], [ 0.9, "#4d9221" ], [ 1, "#276419" ] ], "sequential": [ [ 0, "#0508b8" ], [ 0.0893854748603352, "#1910d8" ], [ 0.1787709497206704, "#3c19f0" ], [ 0.2681564245810056, "#6b1cfb" ], [ 0.3575418994413408, "#981cfd" ], [ 0.44692737430167595, "#bf1cfd" ], [ 0.5363128491620112, "#dd2bfd" ], [ 0.6256983240223464, "#f246fe" ], [ 0.7150837988826816, "#fc67fd" ], [ 0.8044692737430168, "#fe88fc" ], [ 0.8938547486033519, "#fea5fd" ], [ 0.9832402234636871, "#febefe" ], [ 1, "#fec3fe" ] ], "sequentialminus": [ [ 0, "#0508b8" ], [ 0.0893854748603352, "#1910d8" ], [ 0.1787709497206704, "#3c19f0" ], [ 0.2681564245810056, "#6b1cfb" ], [ 0.3575418994413408, "#981cfd" ], [ 0.44692737430167595, "#bf1cfd" ], [ 0.5363128491620112, "#dd2bfd" ], [ 0.6256983240223464, "#f246fe" ], [ 0.7150837988826816, "#fc67fd" ], [ 0.8044692737430168, "#fe88fc" ], [ 0.8938547486033519, "#fea5fd" ], [ 0.9832402234636871, "#febefe" ], [ 1, "#fec3fe" ] ] }, "plot_bgcolor": "white", "paper_bgcolor": "white", "shapedefaults": { "line": { "width": 0 }, "opacity": 0.4, "fillcolor": "#506784" }, "annotationdefaults": { "arrowhead": 0, "arrowcolor": "#506784", "arrowwidth": 1 } }, "themeRef": "PLOTLY_WHITE" }, "hovermode": "closest", "annotations": [ { "x": 3.015126603091088, "y": 40.11031993403173, "ax": -10, "ay": -30, "font": { "family": "Arial" }, "text": "(3, 37.05)", "align": "center", "showarrow": false, "arrowcolor": "rgb(248, 248, 248)" }, { "x": 6.027293653403486, "y": 37.54453143681463, "text": "(6, 40.74)", "showarrow": false }, { "x": 9.105228543242355, "y": 63.20241640898559, "text": "(9, 66.32)", "showarrow": false }, { "x": 11.999013482407102, "y": 125.9216907854035, "text": "(12, 122.82)", "showarrow": false }, { "x": 15.169023347583032, "y": 165.54886868686754, "text": "(15, 168.88)", "showarrow": false } ] } }, "height": null, "width": null, "user": { "profile_url": "https://chart-studio.plotly.com/~Sienna_R", "avatar_url": "https://storage.googleapis.com/plotly-prod-profiles/23.jpg", "background_url": "https://storage.googleapis.com/plotly-prod-profiles/bg-12.jpg", "bio": "", "nickname": "", "website": "", "stream_tokens": null, "feature_set_id": null, "csrf_token": null, "date_joined": "2025-06-25 08:34:15", "mapbox_access_tokens": null, "has_password": null, "username": "Sienna_R", "email": null, "is_active": null, "readonly": null, "is_dash_creator": null, "dash_created_count": null, "is_chart_creator": null, "charts_created_count": null } }, { "creation_time": "2025-09-03T11:00:10.701865Z", "comments": { "results": [], "count": 0 }, "parented": true, "embed_url": "https://chart-studio.plotly.com/~sruthiwimi/107.embed", "fid": "sruthiwimi:107", "filename": "Post fire energy", "filetype": "plot", "img_url": "https://storage.googleapis.com/plotly-prod-images/sruthiwimi/107/9_XGVCGLBANJUEJIPYL4PAFNZMLPPZ2V.png", "image_urls": { "default": "https://storage.googleapis.com/plotly-prod-images/sruthiwimi/107/2_MX12RJ6DOP9WH80MNF7PG3QUPIF85O.png", "block-thumb": "https://storage.googleapis.com/plotly-prod-images/sruthiwimi/107/8_KJB0YUZQMTON9TEJWC3ZX5C1B13HS0.png", "list-thumb": "https://storage.googleapis.com/plotly-prod-images/sruthiwimi/107/9_XGVCGLBANJUEJIPYL4PAFNZMLPPZ2V.png" }, "api_urls": { "files": "https://api.plotly.com/v2/files/sruthiwimi:107", "plots": "https://api.plotly.com/v2/plots/sruthiwimi:107", "parent": "https://api.plotly.com/v2/folders/home?user=sruthiwimi" }, "owner": "sruthiwimi", "parent": -1, "preview": "", "referencers": [], "references": [], "title": "", "views": 1, "web_url": "https://chart-studio.plotly.com/~sruthiwimi/107/", "world_readable": true, "date_modified": "2025-09-03T11:31:03.757Z", "stars": { "results": [], "count": 0 }, "collaborators": { "results": [], "count": 0 }, "subfolder_count": null, "refresh_interval": null, "organize_view_url": "https://chart-studio.plotly.com/~sruthiwimi/107/", "current_user_permission": "read", "is_theme": null, "is_template": false, "autosize": true, "caption": "", "figure": { "data": [ { "meta": { "columnNames": { "x": "A", "y": "B", "text": "", "error_y": { "array": "C" } } }, "mode": "markers", "name": "0%", "type": "bar", "xsrc": "sruthiwimi:106:01f929", "ysrc": "sruthiwimi:106:1fde49", "marker": { "color": "rgb(134, 135, 139)" }, "error_y": { "meta": { "columnNames": { "array": "C" } }, "type": "data", "visible": true, "arraysrc": "sruthiwimi:106:58ea4e", "symmetric": true }, "textfont": { "size": 20, "color": "rgb(208, 211, 217)", "family": "Arial" }, "orientation": "v", "textposition": "auto", "texttemplate": "" }, { "meta": { "columnNames": { "x": "A", "y": "D", "text": "", "error_y": { "array": "E" } } }, "mode": "markers", "name": "10% ", "type": "bar", "xsrc": "sruthiwimi:106:01f929", "ysrc": "sruthiwimi:106:7d625f", "marker": { "color": "rgb(218, 137, 68)" }, "error_y": { "meta": { "columnNames": { "array": "E" } }, "type": "data", "visible": true, "arraysrc": "sruthiwimi:106:ae7ef3", "symmetric": true }, "visible": true, "textfont": { "size": 20, "family": "Arial" }, "stackgroup": null, "orientation": "v", "textposition": "auto" }, { "meta": { "columnNames": { "x": "A", "y": "F", "error_y": { "array": "G" } } }, "name": "30%", "type": "bar", "xsrc": "sruthiwimi:106:01f929", "ysrc": "sruthiwimi:106:e25771", "marker": { "color": "rgb(121, 151, 157)" }, "error_y": { "meta": { "columnNames": { "array": "G" } }, "type": "data", "visible": true, "arraysrc": "sruthiwimi:106:5697b3", "symmetric": true }, "visible": true, "orientation": "v" }, { "meta": { "columnNames": { "x": "A", "y": "H", "error_y": { "array": "I" } } }, "name": "50%", "type": "bar", "xsrc": "sruthiwimi:106:01f929", "ysrc": "sruthiwimi:106:51a5f5", "marker": { "color": "rgb(22, 33, 93)" }, "error_y": { "meta": { "columnNames": { "array": "I" } }, "type": "data", "visible": true, "arraysrc": "sruthiwimi:106:db5586", "symmetric": true }, "visible": true, "orientation": "v" } ], "frames": [], "layout": { "xaxis": { "type": "linear", "dtick": 50, "range": [ -25, 175 ], "ticks": "inside", "title": { "font": { "size": 25, "family": "Arial" }, "text": "Energy / kJ" }, "domain": [ 0, 0.5 ], "mirror": "ticks", "showgrid": false, "showline": true, "tickfont": { "size": 20, "family": "Arial" }, "tickmode": "linear", "zeroline": false, "autorange": true, "linecolor": "rgb(67, 71, 77)" }, "yaxis": { "type": "linear", "dtick": 50, "range": [ 0, 25.23153041013958 ], "ticks": "inside", "title": { "font": { "size": 25, "family": "Arial" }, "text": "Flexural modulus / GPa" }, "domain": [ 0.25, 1 ], "mirror": "ticks", "showgrid": false, "showline": true, "tickfont": { "size": 20, "family": "Arial" }, "tickmode": "auto", "zeroline": false, "autorange": false, "linecolor": "rgb(67, 71, 77)" }, "bargap": 0.14, "legend": { "x": 0.339773548490194, "y": 0.9868404825145591, "font": { "size": 20, "family": "Arial" }, "borderwidth": 1 }, "barmode": "group", "autosize": true, "template": { "data": { "bar": [ { "type": "bar", "marker": { "colorbar": { "ticks": "", "outlinewidth": 0 } } } ], "table": [ { "type": "table", "cells": { "fill": { "color": "#EBF0F8" }, "line": { "color": "white" } }, "header": { "fill": { "color": "#C8D4E3" }, "line": { "color": "white" } } } ], "carpet": [ { "type": "carpet", "aaxis": { "gridcolor": "#C8D4E3", "linecolor": "#C8D4E3", "endlinecolor": "#2a3f5f", "minorgridcolor": "#C8D4E3", "startlinecolor": "#2a3f5f" }, "baxis": { "gridcolor": "#C8D4E3", "linecolor": "#C8D4E3", "endlinecolor": "#2a3f5f", "minorgridcolor": "#C8D4E3", "startlinecolor": "#2a3f5f" } } ], "mesh3d": [ { "type": "mesh3d", "colorbar": { "ticks": "", "outlinewidth": 0 } } ], "contour": [ { "type": "contour", "colorbar": { "ticks": "", "outlinewidth": 0 }, "autocolorscale": true } ], "heatmap": [ { "type": "heatmap", "colorbar": { "ticks": "", "outlinewidth": 0 }, "autocolorscale": true } ], "scatter": [ { "type": "scatter", "marker": { "colorbar": { "ticks": "", "outlinewidth": 0 } } } ], "surface": [ { "type": "surface", "colorbar": { "ticks": "", "outlinewidth": 0 } } ], "heatmapgl": [ { "type": "heatmapgl", "colorbar": { "ticks": "", "outlinewidth": 0 } } ], "histogram": [ { "type": "histogram", "marker": { "colorbar": { "ticks": "", "outlinewidth": 0 } } } ], "parcoords": [ { "line": { "colorbar": { "ticks": "", "outlinewidth": 0 } }, "type": "parcoords" } ], "scatter3d": [ { "type": "scatter3d", "marker": { "colorbar": { "ticks": "", "outlinewidth": 0 } } } ], "scattergl": [ { "type": "scattergl", "marker": { "colorbar": { "ticks": "", "outlinewidth": 0 } } } ], "choropleth": [ { "type": "choropleth", "colorbar": { "ticks": "", "outlinewidth": 0 } } ], "scattergeo": [ { "type": "scattergeo", "marker": { "colorbar": { "ticks": "", "outlinewidth": 0 } } } ], "histogram2d": [ { "type": "histogram2d", "colorbar": { "ticks": "", "outlinewidth": 0 }, "autocolorscale": true } ], "scatterpolar": [ { "type": "scatterpolar", "marker": { "colorbar": { "ticks": "", "outlinewidth": 0 } } } ], "contourcarpet": [ { "type": "contourcarpet", "colorbar": { "ticks": "", "outlinewidth": 0 } } ], "scattercarpet": [ { "type": "scattercarpet", "marker": { "colorbar": { "ticks": "", "outlinewidth": 0 } } } ], "scattermapbox": [ { "type": "scattermapbox", "marker": { "colorbar": { "ticks": "", "outlinewidth": 0 } } } ], "scatterpolargl": [ { "type": "scatterpolargl", "marker": { "colorbar": { "ticks": "", "outlinewidth": 0 } } } ], "scatterternary": [ { "type": "scatterternary", "marker": { "colorbar": { "ticks": "", "outlinewidth": 0 } } } ], "histogram2dcontour": [ { "type": "histogram2dcontour", "colorbar": { "ticks": "", "outlinewidth": 0 }, "autocolorscale": true } ] }, "layout": { "geo": { "bgcolor": "white", "showland": true, "lakecolor": "white", "landcolor": "white", "showlakes": true, "subunitcolor": "#C8D4E3" }, "font": { "color": "#2a3f5f" }, "polar": { "bgcolor": "white", "radialaxis": { "ticks": "", "gridcolor": "#EBF0F8", "linecolor": "#EBF0F8" }, "angularaxis": { "ticks": "", "gridcolor": "#EBF0F8", "linecolor": "#EBF0F8" } }, "scene": { "xaxis": { "ticks": "", "gridcolor": "#DFE8F3", "gridwidth": 2, "linecolor": "#EBF0F8", "zerolinecolor": "#EBF0F8", "showbackground": true, "backgroundcolor": "white" }, "yaxis": { "ticks": "", "gridcolor": "#DFE8F3", "gridwidth": 2, "linecolor": "#EBF0F8", "zerolinecolor": "#EBF0F8", "showbackground": true, "backgroundcolor": "white" }, "zaxis": { "ticks": "", "gridcolor": "#DFE8F3", "gridwidth": 2, "linecolor": "#EBF0F8", "zerolinecolor": "#EBF0F8", "showbackground": true, "backgroundcolor": "white" } }, "title": { "x": 0.05 }, "xaxis": { "ticks": "", "gridcolor": "#EBF0F8", "linecolor": "#EBF0F8", "automargin": true, "zerolinecolor": "#EBF0F8", "zerolinewidth": 2 }, "yaxis": { "ticks": "", "gridcolor": "#EBF0F8", "linecolor": "#EBF0F8", "automargin": true, "zerolinecolor": "#EBF0F8", "zerolinewidth": 2 }, "ternary": { "aaxis": { "ticks": "", "gridcolor": "#DFE8F3", "linecolor": "#A2B1C6" }, "baxis": { "ticks": "", "gridcolor": "#DFE8F3", "linecolor": "#A2B1C6" }, "caxis": { "ticks": "", "gridcolor": "#DFE8F3", "linecolor": "#A2B1C6" }, "bgcolor": "white" }, "colorway": [ "#636efa", "#EF553B", "#00cc96", "#ab63fa", "#19d3f3", "#e763fa", "#fecb52", "#ffa15a", "#ff6692", "#b6e880" ], "hovermode": "closest", "colorscale": { "diverging": [ [ 0, "#8e0152" ], [ 0.1, "#c51b7d" ], [ 0.2, "#de77ae" ], [ 0.3, "#f1b6da" ], [ 0.4, "#fde0ef" ], [ 0.5, "#f7f7f7" ], [ 0.6, "#e6f5d0" ], [ 0.7, "#b8e186" ], [ 0.8, "#7fbc41" ], [ 0.9, "#4d9221" ], [ 1, "#276419" ] ], "sequential": [ [ 0, "#0508b8" ], [ 0.0893854748603352, "#1910d8" ], [ 0.1787709497206704, "#3c19f0" ], [ 0.2681564245810056, "#6b1cfb" ], [ 0.3575418994413408, "#981cfd" ], [ 0.44692737430167595, "#bf1cfd" ], [ 0.5363128491620112, "#dd2bfd" ], [ 0.6256983240223464, "#f246fe" ], [ 0.7150837988826816, "#fc67fd" ], [ 0.8044692737430168, "#fe88fc" ], [ 0.8938547486033519, "#fea5fd" ], [ 0.9832402234636871, "#febefe" ], [ 1, "#fec3fe" ] ], "sequentialminus": [ [ 0, "#0508b8" ], [ 0.0893854748603352, "#1910d8" ], [ 0.1787709497206704, "#3c19f0" ], [ 0.2681564245810056, "#6b1cfb" ], [ 0.3575418994413408, "#981cfd" ], [ 0.44692737430167595, "#bf1cfd" ], [ 0.5363128491620112, "#dd2bfd" ], [ 0.6256983240223464, "#f246fe" ], [ 0.7150837988826816, "#fc67fd" ], [ 0.8044692737430168, "#fe88fc" ], [ 0.8938547486033519, "#fea5fd" ], [ 0.9832402234636871, "#febefe" ], [ 1, "#fec3fe" ] ] }, "plot_bgcolor": "white", "paper_bgcolor": "white", "shapedefaults": { "line": { "width": 0 }, "opacity": 0.4, "fillcolor": "#506784" }, "annotationdefaults": { "arrowhead": 0, "arrowcolor": "#506784", "arrowwidth": 1 } }, "themeRef": "PLOTLY_WHITE" }, "showlegend": true, "bargroupgap": 0.08 } }, "height": null, "width": null, "user": { "profile_url": "https://chart-studio.plotly.com/~sruthiwimi", "avatar_url": "https://storage.googleapis.com/plotly-prod-profiles/90.jpg", "background_url": "https://storage.googleapis.com/plotly-prod-profiles/bg-13.jpg", "bio": "", "nickname": "", "website": "", "stream_tokens": null, "feature_set_id": null, "csrf_token": null, "date_joined": "2022-01-13 16:37:50", "mapbox_access_tokens": null, "has_password": null, "username": "sruthiwimi", "email": null, "is_active": null, "readonly": null, "is_dash_creator": null, "dash_created_count": null, "is_chart_creator": null, "charts_created_count": null } }, { "creation_time": "2025-09-03T10:58:08.313328Z", "comments": { "results": [], "count": 0 }, "parented": true, "embed_url": "https://chart-studio.plotly.com/~Ayush07/1.embed", "fid": "Ayush07:1", "filename": "Plot 1", "filetype": "plot", "img_url": "https://storage.googleapis.com/plotly-prod-images/Ayush07/1/9_928EW7TDMDV0OJVADBBCOGCP1Y37H2.png", "image_urls": { "default": "https://storage.googleapis.com/plotly-prod-images/Ayush07/1/2_HAQBW9FVAL85THFSPTM0HJVQHQ9CNF.png", "block-thumb": "https://storage.googleapis.com/plotly-prod-images/Ayush07/1/8_4G23144YM581HAEYC8KTZAZ6H0JE83.png", "list-thumb": "https://storage.googleapis.com/plotly-prod-images/Ayush07/1/9_928EW7TDMDV0OJVADBBCOGCP1Y37H2.png" }, "api_urls": { "files": "https://api.plotly.com/v2/files/Ayush07:1", "plots": "https://api.plotly.com/v2/plots/Ayush07:1", "parent": "https://api.plotly.com/v2/folders/home?user=Ayush07" }, "owner": "Ayush07", "parent": -1, "preview": "", "referencers": [], "references": [], "title": "", "views": 1, "web_url": "https://chart-studio.plotly.com/~Ayush07/1/", "world_readable": true, "date_modified": "2025-09-03T10:58:37.904Z", "stars": { "results": [], "count": 0 }, "collaborators": { "results": [], "count": 0 }, "subfolder_count": null, "refresh_interval": null, "organize_view_url": "https://chart-studio.plotly.com/~Ayush07/1/", "current_user_permission": "read", "is_theme": null, "is_template": false, "autosize": true, "caption": "", "figure": { "data": [ { "meta": { "columnNames": { "text": "A", "labels": "A", "values": "B" } }, "mode": "markers", "name": "<br>", "type": "pie", "title": { "text": "" }, "textsrc": "Ayush07:0:faaeae", "hoverinfo": "percent+label+value+text", "labelssrc": "Ayush07:0:faaeae", "valuessrc": "Ayush07:0:411008", "showlegend": false, "legendgroup": 1, "insidetextorientation": "auto" } ], "frames": [], "layout": { "xaxis": { "range": [ -1, 6 ], "autorange": true }, "yaxis": { "range": [ -1, 4 ], "autorange": true }, "autosize": true, "template": { "data": { "bar": [ { "type": "bar", "marker": { "colorbar": { "ticks": "", "outlinewidth": 0 } } } ], "table": [ { "type": "table", "cells": { "fill": { "color": "#EBF0F8" }, "line": { "color": "white" } }, "header": { "fill": { "color": "#C8D4E3" }, "line": { "color": "white" } } } ], "carpet": [ { "type": "carpet", "aaxis": { "gridcolor": "#C8D4E3", "linecolor": "#C8D4E3", "endlinecolor": "#2a3f5f", "minorgridcolor": "#C8D4E3", "startlinecolor": "#2a3f5f" }, "baxis": { "gridcolor": "#C8D4E3", "linecolor": "#C8D4E3", "endlinecolor": "#2a3f5f", "minorgridcolor": "#C8D4E3", "startlinecolor": "#2a3f5f" } } ], "mesh3d": [ { "type": "mesh3d", "colorbar": { "ticks": "", "outlinewidth": 0 } } ], "contour": [ { "type": "contour", "colorbar": { "ticks": "", "outlinewidth": 0 }, "autocolorscale": true } ], "heatmap": [ { "type": "heatmap", "colorbar": { "ticks": "", "outlinewidth": 0 }, "autocolorscale": true } ], "scatter": [ { "type": "scatter", "marker": { "colorbar": { "ticks": "", "outlinewidth": 0 } } } ], "surface": [ { "type": "surface", "colorbar": { "ticks": "", "outlinewidth": 0 } } ], "heatmapgl": [ { "type": "heatmapgl", "colorbar": { "ticks": "", "outlinewidth": 0 } } ], "histogram": [ { "type": "histogram", "marker": { "colorbar": { "ticks": "", "outlinewidth": 0 } } } ], "parcoords": [ { "line": { "colorbar": { "ticks": "", "outlinewidth": 0 } }, "type": "parcoords" } ], "scatter3d": [ { "type": "scatter3d", "marker": { "colorbar": { "ticks": "", "outlinewidth": 0 } } } ], "scattergl": [ { "type": "scattergl", "marker": { "colorbar": { "ticks": "", "outlinewidth": 0 } } } ], "choropleth": [ { "type": "choropleth", "colorbar": { "ticks": "", "outlinewidth": 0 } } ], "scattergeo": [ { "type": "scattergeo", "marker": { "colorbar": { "ticks": "", "outlinewidth": 0 } } } ], "histogram2d": [ { "type": "histogram2d", "colorbar": { "ticks": "", "outlinewidth": 0 }, "autocolorscale": true } ], "scatterpolar": [ { "type": "scatterpolar", "marker": { "colorbar": { "ticks": "", "outlinewidth": 0 } } } ], "contourcarpet": [ { "type": "contourcarpet", "colorbar": { "ticks": "", "outlinewidth": 0 } } ], "scattercarpet": [ { "type": "scattercarpet", "marker": { "colorbar": { "ticks": "", "outlinewidth": 0 } } } ], "scattermapbox": [ { "type": "scattermapbox", "marker": { "colorbar": { "ticks": "", "outlinewidth": 0 } } } ], "scatterpolargl": [ { "type": "scatterpolargl", "marker": { "colorbar": { "ticks": "", "outlinewidth": 0 } } } ], "scatterternary": [ { "type": "scatterternary", "marker": { "colorbar": { "ticks": "", "outlinewidth": 0 } } } ], "histogram2dcontour": [ { "type": "histogram2dcontour", "colorbar": { "ticks": "", "outlinewidth": 0 }, "autocolorscale": true } ] }, "layout": { "geo": { "bgcolor": "white", "showland": true, "lakecolor": "white", "landcolor": "white", "showlakes": true, "subunitcolor": "#C8D4E3" }, "font": { "color": "#2a3f5f" }, "polar": { "bgcolor": "white", "radialaxis": { "ticks": "", "gridcolor": "#EBF0F8", "linecolor": "#EBF0F8" }, "angularaxis": { "ticks": "", "gridcolor": "#EBF0F8", "linecolor": "#EBF0F8" } }, "scene": { "xaxis": { "ticks": "", "gridcolor": "#DFE8F3", "gridwidth": 2, "linecolor": "#EBF0F8", "zerolinecolor": "#EBF0F8", "showbackground": true, "backgroundcolor": "white" }, "yaxis": { "ticks": "", "gridcolor": "#DFE8F3", "gridwidth": 2, "linecolor": "#EBF0F8", "zerolinecolor": "#EBF0F8", "showbackground": true, "backgroundcolor": "white" }, "zaxis": { "ticks": "", "gridcolor": "#DFE8F3", "gridwidth": 2, "linecolor": "#EBF0F8", "zerolinecolor": "#EBF0F8", "showbackground": true, "backgroundcolor": "white" } }, "title": { "x": 0.05 }, "xaxis": { "ticks": "", "gridcolor": "#EBF0F8", "linecolor": "#EBF0F8", "automargin": true, "zerolinecolor": "#EBF0F8", "zerolinewidth": 2 }, "yaxis": { "ticks": "", "gridcolor": "#EBF0F8", "linecolor": "#EBF0F8", "automargin": true, "zerolinecolor": "#EBF0F8", "zerolinewidth": 2 }, "ternary": { "aaxis": { "ticks": "", "gridcolor": "#DFE8F3", "linecolor": "#A2B1C6" }, "baxis": { "ticks": "", "gridcolor": "#DFE8F3", "linecolor": "#A2B1C6" }, "caxis": { "ticks": "", "gridcolor": "#DFE8F3", "linecolor": "#A2B1C6" }, "bgcolor": "white" }, "colorway": [ "#636efa", "#EF553B", "#00cc96", "#ab63fa", "#19d3f3", "#e763fa", "#fecb52", "#ffa15a", "#ff6692", "#b6e880" ], "hovermode": "closest", "colorscale": { "diverging": [ [ 0, "#8e0152" ], [ 0.1, "#c51b7d" ], [ 0.2, "#de77ae" ], [ 0.3, "#f1b6da" ], [ 0.4, "#fde0ef" ], [ 0.5, "#f7f7f7" ], [ 0.6, "#e6f5d0" ], [ 0.7, "#b8e186" ], [ 0.8, "#7fbc41" ], [ 0.9, "#4d9221" ], [ 1, "#276419" ] ], "sequential": [ [ 0, "#0508b8" ], [ 0.0893854748603352, "#1910d8" ], [ 0.1787709497206704, "#3c19f0" ], [ 0.2681564245810056, "#6b1cfb" ], [ 0.3575418994413408, "#981cfd" ], [ 0.44692737430167595, "#bf1cfd" ], [ 0.5363128491620112, "#dd2bfd" ], [ 0.6256983240223464, "#f246fe" ], [ 0.7150837988826816, "#fc67fd" ], [ 0.8044692737430168, "#fe88fc" ], [ 0.8938547486033519, "#fea5fd" ], [ 0.9832402234636871, "#febefe" ], [ 1, "#fec3fe" ] ], "sequentialminus": [ [ 0, "#0508b8" ], [ 0.0893854748603352, "#1910d8" ], [ 0.1787709497206704, "#3c19f0" ], [ 0.2681564245810056, "#6b1cfb" ], [ 0.3575418994413408, "#981cfd" ], [ 0.44692737430167595, "#bf1cfd" ], [ 0.5363128491620112, "#dd2bfd" ], [ 0.6256983240223464, "#f246fe" ], [ 0.7150837988826816, "#fc67fd" ], [ 0.8044692737430168, "#fe88fc" ], [ 0.8938547486033519, "#fea5fd" ], [ 0.9832402234636871, "#febefe" ], [ 1, "#fec3fe" ] ] }, "plot_bgcolor": "white", "paper_bgcolor": "white", "shapedefaults": { "line": { "width": 0 }, "opacity": 0.4, "fillcolor": "#506784" }, "annotationdefaults": { "arrowhead": 0, "arrowcolor": "#506784", "arrowwidth": 1 } }, "themeRef": "PLOTLY_WHITE" }, "piecolorway": [ "#fbb4ae", "#b3cde3", "#ccebc5", "#decbe4", "#fed9a6", "#ffffcc", "#e5d8bd", "#fddaec", "#f2f2f2" ] } }, "height": null, "width": null, "user": { "profile_url": "https://chart-studio.plotly.com/~Ayush07", "avatar_url": "https://storage.googleapis.com/plotly-prod-profiles/21.jpg", "background_url": "https://storage.googleapis.com/plotly-prod-profiles/bg-9.jpg", "bio": "", "nickname": "", "website": "", "stream_tokens": null, "feature_set_id": null, "csrf_token": null, "date_joined": "2025-09-03 10:56:26", "mapbox_access_tokens": null, "has_password": null, "username": "Ayush07", "email": null, "is_active": null, "readonly": null, "is_dash_creator": null, "dash_created_count": null, "is_chart_creator": null, "charts_created_count": null } }, { "creation_time": "2025-09-03T10:46:44.924403Z", "comments": { "results": [], "count": 0 }, "parented": true, "embed_url": "https://chart-studio.plotly.com/~tdecombe/1.embed", "fid": "tdecombe:1", "filename": "Plot 1", "filetype": "plot", "img_url": "https://storage.googleapis.com/plotly-prod-images/tdecombe/1/9_GX12E0LT00AXQVJ7TOKEWUNDUV48XO.png", "image_urls": { "default": "https://storage.googleapis.com/plotly-prod-images/tdecombe/1/2_NKGQC20YZE8RY1GJAOLJ7H4PL4TUUZ.png", "block-thumb": "https://storage.googleapis.com/plotly-prod-images/tdecombe/1/8_HBAWM8TIO041TM06IOTZ3EMWRJ544M.png", "list-thumb": "https://storage.googleapis.com/plotly-prod-images/tdecombe/1/9_GX12E0LT00AXQVJ7TOKEWUNDUV48XO.png" }, "api_urls": { "files": "https://api.plotly.com/v2/files/tdecombe:1", "plots": "https://api.plotly.com/v2/plots/tdecombe:1", "parent": "https://api.plotly.com/v2/folders/home?user=tdecombe" }, "owner": "tdecombe", "parent": -1, "preview": "", "referencers": [], "references": [], "title": "", "views": 1, "web_url": "https://chart-studio.plotly.com/~tdecombe/1/", "world_readable": true, "date_modified": "2025-09-03T10:46:44.937Z", "stars": { "results": [], "count": 0 }, "collaborators": { "results": [], "count": 0 }, "subfolder_count": null, "refresh_interval": null, "organize_view_url": "https://chart-studio.plotly.com/~tdecombe/1/", "current_user_permission": "read", "is_theme": null, "is_template": false, "autosize": true, "caption": "", "figure": { "data": [ { "uid": "f142b4", "meta": { "columnNames": { "lat": "Y", "lon": "X", "text": "city" } }, "mode": "markers", "name": "X", "type": "scattergeo", "zmax": 8029200, "zmin": 803900, "zauto": true, "latsrc": "tdecombe:0:2a69c4", "lonsrc": "tdecombe:0:c3bd87", "marker": { "meta": { "columnNames": { "size": "city_popul" } }, "sizeref": 10036.5, "sizesrc": "tdecombe:0:ed4ae7", "sizemode": "area" }, "textsrc": "tdecombe:0:e92972", "colorscale": [ [ 0, "rgb(220,220,220)" ], [ 0.2, "rgb(245,195,157)" ], [ 0.4, "rgb(245,160,105)" ], [ 1, "rgb(178,10,28)" ] ] } ], "frames": [], "layout": { "geo": { "scope": "africa", "center": { "lat": 0, "lon": 15 }, "fitbounds": false, "projection": { "scale": 1 } }, "title": { "text": "Bubble Map" }, "autosize": true, "hovermode": "closest" } }, "height": null, "width": null, "user": { "profile_url": "https://chart-studio.plotly.com/~tdecombe", "avatar_url": "https://storage.googleapis.com/plotly-prod-profiles/25.jpg", "background_url": "https://storage.googleapis.com/plotly-prod-profiles/bg-9.jpg", "bio": "", "nickname": "", "website": "", "stream_tokens": null, "feature_set_id": null, "csrf_token": null, "date_joined": "2025-09-03 10:35:24", "mapbox_access_tokens": null, "has_password": null, "username": "tdecombe", "email": null, "is_active": null, "readonly": null, "is_dash_creator": null, "dash_created_count": null, "is_chart_creator": null, "charts_created_count": null } }, { "creation_time": "2025-09-03T10:23:30.344720Z", "comments": { "results": [], "count": 0 }, "parented": true, "embed_url": "https://chart-studio.plotly.com/~sruthiwimi/105.embed", "fid": "sruthiwimi:105", "filename": "PL action", "filetype": "plot", "img_url": "https://storage.googleapis.com/plotly-prod-images/sruthiwimi/105/9_4EVR0NL6N1KLFW9RGX4JWKJO0TDJHS.png", "image_urls": { "default": "https://storage.googleapis.com/plotly-prod-images/sruthiwimi/105/2_52VLXUUI4L96WRPG5ODH6S2B850QUY.png", "block-thumb": "https://storage.googleapis.com/plotly-prod-images/sruthiwimi/105/8_39JQNYTC2QE7FRVYW5HTW2PNCFKKO3.png", "list-thumb": "https://storage.googleapis.com/plotly-prod-images/sruthiwimi/105/9_4EVR0NL6N1KLFW9RGX4JWKJO0TDJHS.png" }, "api_urls": { "files": "https://api.plotly.com/v2/files/sruthiwimi:105", "plots": "https://api.plotly.com/v2/plots/sruthiwimi:105", "parent": "https://api.plotly.com/v2/folders/home?user=sruthiwimi" }, "owner": "sruthiwimi", "parent": -1, "preview": "", "referencers": [], "references": [], "title": "", "views": 1, "web_url": "https://chart-studio.plotly.com/~sruthiwimi/105/", "world_readable": true, "date_modified": "2025-09-03T10:26:15.067Z", "stars": { "results": [], "count": 0 }, "collaborators": { "results": [], "count": 0 }, "subfolder_count": null, "refresh_interval": null, "organize_view_url": "https://chart-studio.plotly.com/~sruthiwimi/105/", "current_user_permission": "read", "is_theme": null, "is_template": false, "autosize": true, "caption": "", "figure": { "data": [ { "meta": { "columnNames": { "x": "A", "y": "F", "text": "F" } }, "mode": "markers", "name": "Resins", "type": "bar", "xsrc": "sruthiwimi:104:2b10b9", "ysrc": "sruthiwimi:104:e25771", "marker": { "color": "rgb(134, 135, 139)" }, "textsrc": "sruthiwimi:104:e25771", "textfont": { "size": 20, "color": "rgb(208, 211, 217)", "family": "Arial" }, "orientation": "v", "textposition": "auto" }, { "meta": { "columnNames": { "x": "A", "y": "G", "text": "G" } }, "mode": "markers", "name": "BD Composites", "type": "bar", "xsrc": "sruthiwimi:104:2b10b9", "ysrc": "sruthiwimi:104:5697b3", "textsrc": "sruthiwimi:104:5697b3", "textfont": { "size": 20, "family": "Arial" }, "stackgroup": null, "orientation": "v", "textposition": "auto" } ], "frames": [], "layout": { "xaxis": { "type": "linear", "dtick": 10, "range": [ 0, 60 ], "title": { "font": { "size": 30, "family": "Arial" }, "text": "APPInsi % w/w " }, "domain": [ 0, 0.5 ], "mirror": "ticks", "showgrid": false, "showline": true, "tickfont": { "size": 25, "family": "Arial" }, "tickmode": "linear", "zeroline": false, "autorange": true, "linecolor": "rgb(67, 71, 77)" }, "yaxis": { "type": "linear", "range": [ 0, 93.85981830178146 ], "title": { "font": { "size": 30, "family": "Arial" }, "text": "Protective layer action / %" }, "domain": [ 0.25, 1 ], "mirror": "ticks", "showgrid": false, "showline": true, "tickfont": { "size": 25, "family": "Arial" }, "zeroline": false, "autorange": false, "linecolor": "rgb(67, 71, 77)" }, "legend": { "x": 0.021092229808875308, "y": 0.9824561403508771, "font": { "size": 25, "family": "Arial" }, "borderwidth": 1 }, "barmode": "group", "autosize": true, "template": { "data": { "bar": [ { "type": "bar", "marker": { "colorbar": { "ticks": "", "outlinewidth": 0 } } } ], "table": [ { "type": "table", "cells": { "fill": { "color": "#EBF0F8" }, "line": { "color": "white" } }, "header": { "fill": { "color": "#C8D4E3" }, "line": { "color": "white" } } } ], "carpet": [ { "type": "carpet", "aaxis": { "gridcolor": "#C8D4E3", "linecolor": "#C8D4E3", "endlinecolor": "#2a3f5f", "minorgridcolor": "#C8D4E3", "startlinecolor": "#2a3f5f" }, "baxis": { "gridcolor": "#C8D4E3", "linecolor": "#C8D4E3", "endlinecolor": "#2a3f5f", "minorgridcolor": "#C8D4E3", "startlinecolor": "#2a3f5f" } } ], "mesh3d": [ { "type": "mesh3d", "colorbar": { "ticks": "", "outlinewidth": 0 } } ], "contour": [ { "type": "contour", "colorbar": { "ticks": "", "outlinewidth": 0 }, "autocolorscale": true } ], "heatmap": [ { "type": "heatmap", "colorbar": { "ticks": "", "outlinewidth": 0 }, "autocolorscale": true } ], "scatter": [ { "type": "scatter", "marker": { "colorbar": { "ticks": "", "outlinewidth": 0 } } } ], "surface": [ { "type": "surface", "colorbar": { "ticks": "", "outlinewidth": 0 } } ], "heatmapgl": [ { "type": "heatmapgl", "colorbar": { "ticks": "", "outlinewidth": 0 } } ], "histogram": [ { "type": "histogram", "marker": { "colorbar": { "ticks": "", "outlinewidth": 0 } } } ], "parcoords": [ { "line": { "colorbar": { "ticks": "", "outlinewidth": 0 } }, "type": "parcoords" } ], "scatter3d": [ { "type": "scatter3d", "marker": { "colorbar": { "ticks": "", "outlinewidth": 0 } } } ], "scattergl": [ { "type": "scattergl", "marker": { "colorbar": { "ticks": "", "outlinewidth": 0 } } } ], "choropleth": [ { "type": "choropleth", "colorbar": { "ticks": "", "outlinewidth": 0 } } ], "scattergeo": [ { "type": "scattergeo", "marker": { "colorbar": { "ticks": "", "outlinewidth": 0 } } } ], "histogram2d": [ { "type": "histogram2d", "colorbar": { "ticks": "", "outlinewidth": 0 }, "autocolorscale": true } ], "scatterpolar": [ { "type": "scatterpolar", "marker": { "colorbar": { "ticks": "", "outlinewidth": 0 } } } ], "contourcarpet": [ { "type": "contourcarpet", "colorbar": { "ticks": "", "outlinewidth": 0 } } ], "scattercarpet": [ { "type": "scattercarpet", "marker": { "colorbar": { "ticks": "", "outlinewidth": 0 } } } ], "scattermapbox": [ { "type": "scattermapbox", "marker": { "colorbar": { "ticks": "", "outlinewidth": 0 } } } ], "scatterpolargl": [ { "type": "scatterpolargl", "marker": { "colorbar": { "ticks": "", "outlinewidth": 0 } } } ], "scatterternary": [ { "type": "scatterternary", "marker": { "colorbar": { "ticks": "", "outlinewidth": 0 } } } ], "histogram2dcontour": [ { "type": "histogram2dcontour", "colorbar": { "ticks": "", "outlinewidth": 0 }, "autocolorscale": true } ] }, "layout": { "geo": { "bgcolor": "white", "showland": true, "lakecolor": "white", "landcolor": "white", "showlakes": true, "subunitcolor": "#C8D4E3" }, "font": { "color": "#2a3f5f" }, "polar": { "bgcolor": "white", "radialaxis": { "ticks": "", "gridcolor": "#EBF0F8", "linecolor": "#EBF0F8" }, "angularaxis": { "ticks": "", "gridcolor": "#EBF0F8", "linecolor": "#EBF0F8" } }, "scene": { "xaxis": { "ticks": "", "gridcolor": "#DFE8F3", "gridwidth": 2, "linecolor": "#EBF0F8", "zerolinecolor": "#EBF0F8", "showbackground": true, "backgroundcolor": "white" }, "yaxis": { "ticks": "", "gridcolor": "#DFE8F3", "gridwidth": 2, "linecolor": "#EBF0F8", "zerolinecolor": "#EBF0F8", "showbackground": true, "backgroundcolor": "white" }, "zaxis": { "ticks": "", "gridcolor": "#DFE8F3", "gridwidth": 2, "linecolor": "#EBF0F8", "zerolinecolor": "#EBF0F8", "showbackground": true, "backgroundcolor": "white" } }, "title": { "x": 0.05 }, "xaxis": { "ticks": "", "gridcolor": "#EBF0F8", "linecolor": "#EBF0F8", "automargin": true, "zerolinecolor": "#EBF0F8", "zerolinewidth": 2 }, "yaxis": { "ticks": "", "gridcolor": "#EBF0F8", "linecolor": "#EBF0F8", "automargin": true, "zerolinecolor": "#EBF0F8", "zerolinewidth": 2 }, "ternary": { "aaxis": { "ticks": "", "gridcolor": "#DFE8F3", "linecolor": "#A2B1C6" }, "baxis": { "ticks": "", "gridcolor": "#DFE8F3", "linecolor": "#A2B1C6" }, "caxis": { "ticks": "", "gridcolor": "#DFE8F3", "linecolor": "#A2B1C6" }, "bgcolor": "white" }, "colorway": [ "#636efa", "#EF553B", "#00cc96", "#ab63fa", "#19d3f3", "#e763fa", "#fecb52", "#ffa15a", "#ff6692", "#b6e880" ], "hovermode": "closest", "colorscale": { "diverging": [ [ 0, "#8e0152" ], [ 0.1, "#c51b7d" ], [ 0.2, "#de77ae" ], [ 0.3, "#f1b6da" ], [ 0.4, "#fde0ef" ], [ 0.5, "#f7f7f7" ], [ 0.6, "#e6f5d0" ], [ 0.7, "#b8e186" ], [ 0.8, "#7fbc41" ], [ 0.9, "#4d9221" ], [ 1, "#276419" ] ], "sequential": [ [ 0, "#0508b8" ], [ 0.0893854748603352, "#1910d8" ], [ 0.1787709497206704, "#3c19f0" ], [ 0.2681564245810056, "#6b1cfb" ], [ 0.3575418994413408, "#981cfd" ], [ 0.44692737430167595, "#bf1cfd" ], [ 0.5363128491620112, "#dd2bfd" ], [ 0.6256983240223464, "#f246fe" ], [ 0.7150837988826816, "#fc67fd" ], [ 0.8044692737430168, "#fe88fc" ], [ 0.8938547486033519, "#fea5fd" ], [ 0.9832402234636871, "#febefe" ], [ 1, "#fec3fe" ] ], "sequentialminus": [ [ 0, "#0508b8" ], [ 0.0893854748603352, "#1910d8" ], [ 0.1787709497206704, "#3c19f0" ], [ 0.2681564245810056, "#6b1cfb" ], [ 0.3575418994413408, "#981cfd" ], [ 0.44692737430167595, "#bf1cfd" ], [ 0.5363128491620112, "#dd2bfd" ], [ 0.6256983240223464, "#f246fe" ], [ 0.7150837988826816, "#fc67fd" ], [ 0.8044692737430168, "#fe88fc" ], [ 0.8938547486033519, "#fea5fd" ], [ 0.9832402234636871, "#febefe" ], [ 1, "#fec3fe" ] ] }, "plot_bgcolor": "white", "paper_bgcolor": "white", "shapedefaults": { "line": { "width": 0 }, "opacity": 0.4, "fillcolor": "#506784" }, "annotationdefaults": { "arrowhead": 0, "arrowcolor": "#506784", "arrowwidth": 1 } }, "themeRef": "PLOTLY_WHITE" }, "bargroupgap": 0.08 } }, "height": null, "width": null, "user": { "profile_url": "https://chart-studio.plotly.com/~sruthiwimi", "avatar_url": "https://storage.googleapis.com/plotly-prod-profiles/90.jpg", "background_url": "https://storage.googleapis.com/plotly-prod-profiles/bg-13.jpg", "bio": "", "nickname": "", "website": "", "stream_tokens": null, "feature_set_id": null, "csrf_token": null, "date_joined": "2022-01-13 16:37:50", "mapbox_access_tokens": null, "has_password": null, "username": "sruthiwimi", "email": null, "is_active": null, "readonly": null, "is_dash_creator": null, "dash_created_count": null, "is_chart_creator": null, "charts_created_count": null } } ] }
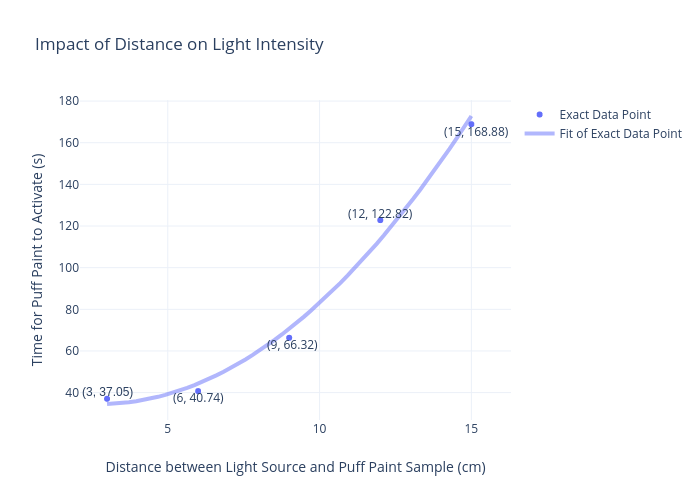
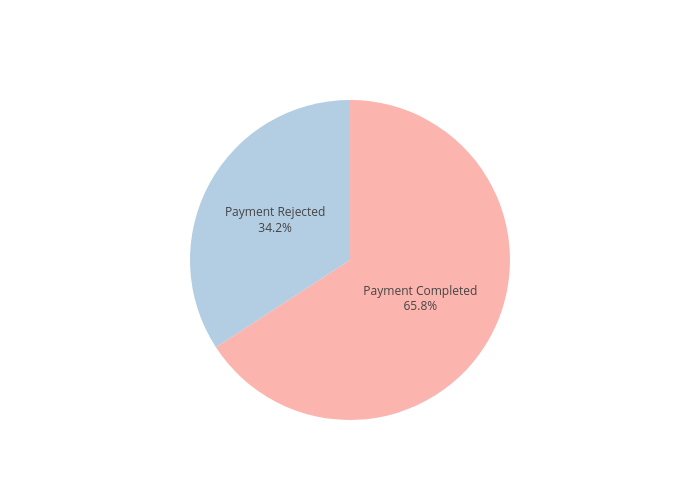