Plots List
Plots
This endpoint handles manipulation of Plotly plot files.
Reference
Authorization
Any user with or without a Plotly account may view public plots. For private plots, see authentication.
Actions
list
Listing all public plots can be done via a GET request to this endpoint.
By default, plots will be listed in order of date created. The order_by
query parameter is accepted at this endpoint. Currently, only ordering by
views is supported. It is possible to filter the plots by quality
with min_quality or max_quality as query parameter.
Example:
// GET https://api.plotly.com/v2/plots/ ---> 200

// GET https://api.plotly.com/v2/plots/?order_by=-views ---> 200

// GET https://api.plotly.com/v2/plots/?min_quality=5 ---> 200

// GET https://api.plotly.com/v2/plots/?max_quality=5 ---> 200
feed
Listing all handpicked feed plots can be done via a GET request to this endpoint. By default, plots will be listed in a random order.
Example:
// GET https://api.plotly.com/v2/plots/feed ---> 200
create
You can create new plot resources here. The only required field is 'figure'. Currently, the figure is restricted to only contain references to grid data. That is, this will fail if raw data arrays are passed in. To create and manipulate underlying grids for plots, see the grids endpoint.
Example:
// This fails because a figure field is required.
// POST https://api.plotly.com/v2/plots ---> 400 Bad Request
{}

// This fails because the figure has raw data
//POST https://api.plotly.com/v2/plots ---> 400 Bad Request
{
    "figure": {"data": [{"y": ['this', 'is', 'raw', 'data']}]}
}

// This succeeds because the figure has src keys, not raw data.
//POST https://api.plotly.com/v2/plots ---> 200 OK
{
    "figure": {"data": [{"ysrc": "sven:88:u8nd62"}]}
}
When creating a grid, you can optionally specify a source_fid to specify where a plot has come from:
- source_fid: the fid of a plot that was copied (and presumably edited) to produce this one
detail
There is a lot of meta information stored about plot files including filename, title, share_url, and content_url to name a few.
This information can only be reached with a GET to this endpoint.
Example:
// GET https://api.plotly.com/v2/plots/iheartgraphs:90
content
The contents of a plot can be downloaded via the content resource. The plot
content contains referenced grid/column data by default. If you wish to
return the raw grid/column data, the inline_data=true query must be included
in the request url. The Content-Type header will be appropriately set for the
response body.
Alternatively, you can set ?map_data=unreadable to append a mapping of
sources to data that belongs to grids which are unreadable for the
requestor. This is useful when you have read access to another users plot,
but that plot contains grid references which you don't have access to.
Examples:
// Returns referenced grid/column data
// GET https://api.plotly.com/v2/plots/iheartgraphs:90/content ---> 200 OK

// Returns full grid/column data
// GET https://api.plotly.com/v2/plots/iheartgraphs:90/content?inline_data=true ---> 200 OK

// Returns full grid/column data when requestor doesn't have permission
// to read the referenced grid.
// GET https://api.plotly.com/v2/plots/iheartgraphs:90/content?map_data=unreadable ---> 200 OK
GET /v2/plots?cursor=cj0xJnA9MjAyNS0wOS0wNSswNiUzQTMyJTNBNTcuMzQ1NTAwJTJCMDAlM0EwMA%3D%3D&format=api
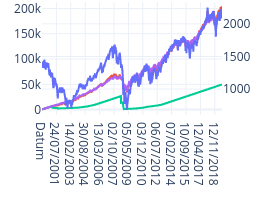
{ "next": "https://api.plotly.com/v2/plots?cursor=cD0yMDI1LTA5LTA1KzA3JTNBMjAlM0ExNC42MTk2NTclMkIwMCUzQTAw&format=api", "previous": "https://api.plotly.com/v2/plots?cursor=cj0xJnA9MjAyNS0wOS0wNSswOSUzQTQ0JTNBMDcuODQ2MDMwJTJCMDAlM0EwMA%3D%3D&format=api", "results": [ { "creation_time": "2025-09-05T09:44:07.846030Z", "comments": { "results": [], "count": 0 }, "parented": true, "embed_url": "https://chart-studio.plotly.com/~singhtinka970/7.embed", "fid": "singhtinka970:7", "filename": "Plot 7", "filetype": "plot", "img_url": "https://storage.googleapis.com/plotly-prod-images/singhtinka970/7/9_JZON4R435PHLR0S3XIW5GKKLM1B92P.png", "image_urls": { "default": "https://storage.googleapis.com/plotly-prod-images/singhtinka970/7/2_ZWB8VCA6H3JH6GM1I8QDGFJTH1KBRG.png", "block-thumb": "https://storage.googleapis.com/plotly-prod-images/singhtinka970/7/8_RDGZJBWBWX0Q8K8T7HEKI5K3UOL3SP.png", "list-thumb": "https://storage.googleapis.com/plotly-prod-images/singhtinka970/7/9_JZON4R435PHLR0S3XIW5GKKLM1B92P.png" }, "api_urls": { "files": "https://api.plotly.com/v2/files/singhtinka970:7", "plots": "https://api.plotly.com/v2/plots/singhtinka970:7", "parent": "https://api.plotly.com/v2/folders/home?user=singhtinka970" }, "owner": "singhtinka970", "parent": -1, "preview": "", "referencers": [], "references": [], "title": "", "views": 0, "web_url": "https://chart-studio.plotly.com/~singhtinka970/7/", "world_readable": true, "date_modified": "2025-09-05T09:44:07.858Z", "stars": { "results": [], "count": 0 }, "collaborators": { "results": [], "count": 0 }, "subfolder_count": null, "refresh_interval": null, "organize_view_url": "https://chart-studio.plotly.com/~singhtinka970/7/", "current_user_permission": "read", "is_theme": null, "is_template": false, "autosize": true, "caption": "", "figure": { "data": [ { "uid": "de77ba46-e0f3-11e8-807d-40a3cc5c0bdd", "line": { "dash": "solid", "color": "rgba(255, 153, 51, 1.0)", "shape": "linear", "width": 1.3 }, "meta": { "columnNames": { "x": "x", "y": "y" } }, "mode": "lines", "name": "PM10", "text": "", "type": "scatter", "xsrc": "singhtinka970:6:1501e1", "ysrc": "singhtinka970:6:f799a2" } ], "frames": [], "layout": { "title": { "font": { "color": "#4D5663" }, "text": "PM10 Jan 2014 - Aug 2018" }, "xaxis": { "type": "date", "range": [ "2014-01-01", "2018-08-13" ], "title": { "font": { "color": "#4D5663" }, "text": "" }, "showgrid": true, "tickfont": { "color": "#4D5663" }, "autorange": true, "gridcolor": "#E1E5ED", "zerolinecolor": "#E1E5ED" }, "yaxis": { "type": "linear", "range": [ -26.166666666666664, 597.1666666666666 ], "title": { "font": { "color": "#4D5663" }, "text": "" }, "showgrid": true, "tickfont": { "color": "#4D5663" }, "autorange": true, "gridcolor": "#E1E5ED", "zerolinecolor": "#E1E5ED" }, "legend": { "font": { "color": "#4D5663" }, "bgcolor": "#F5F6F9" }, "plot_bgcolor": "#F5F6F9", "paper_bgcolor": "#F5F6F9" } }, "height": null, "width": null, "user": { "profile_url": "https://chart-studio.plotly.com/~singhtinka970", "avatar_url": "https://storage.googleapis.com/plotly-prod-profiles/62.jpg", "background_url": "https://storage.googleapis.com/plotly-prod-profiles/bg-14.jpg", "bio": "", "nickname": "", "website": "", "stream_tokens": null, "feature_set_id": null, "csrf_token": null, "date_joined": "2025-09-05 08:50:37", "mapbox_access_tokens": null, "has_password": null, "username": "singhtinka970", "email": null, "is_active": null, "readonly": null, "is_dash_creator": null, "dash_created_count": null, "is_chart_creator": null, "charts_created_count": null } }, { "creation_time": "2025-09-05T09:42:25.196697Z", "comments": { "results": [], "count": 0 }, "parented": true, "embed_url": "https://chart-studio.plotly.com/~singhtinka970/5.embed", "fid": "singhtinka970:5", "filename": "Plot 5", "filetype": "plot", "img_url": "https://storage.googleapis.com/plotly-prod-images/singhtinka970/5/9_2NE2NJSRWLS70ERO0VY8Q1T07CMJHA.png", "image_urls": { "default": "https://storage.googleapis.com/plotly-prod-images/singhtinka970/5/2_LXVT1LGV31NN2ARWBDJTLZQFJ08KCF.png", "block-thumb": "https://storage.googleapis.com/plotly-prod-images/singhtinka970/5/8_2B1582PPKE5D6LNFL84FQ4PST5KZRO.png", "list-thumb": "https://storage.googleapis.com/plotly-prod-images/singhtinka970/5/9_2NE2NJSRWLS70ERO0VY8Q1T07CMJHA.png" }, "api_urls": { "files": "https://api.plotly.com/v2/files/singhtinka970:5", "plots": "https://api.plotly.com/v2/plots/singhtinka970:5", "parent": "https://api.plotly.com/v2/folders/home?user=singhtinka970" }, "owner": "singhtinka970", "parent": -1, "preview": "", "referencers": [], "references": [], "title": "", "views": 0, "web_url": "https://chart-studio.plotly.com/~singhtinka970/5/", "world_readable": true, "date_modified": "2025-09-05T09:42:25.209Z", "stars": { "results": [], "count": 0 }, "collaborators": { "results": [], "count": 0 }, "subfolder_count": null, "refresh_interval": null, "organize_view_url": "https://chart-studio.plotly.com/~singhtinka970/5/", "current_user_permission": "read", "is_theme": null, "is_template": false, "autosize": true, "caption": "", "figure": { "data": [ { "uid": "ebab13", "line": { "shape": "vh" }, "meta": { "columnNames": { "x": "Time", "y": "Station_131" } }, "mode": "lines+markers", "name": "Station_131", "type": "scatter", "xsrc": "singhtinka970:4:6f5503", "ysrc": "singhtinka970:4:70cf90", "marker": { "size": 4, "opacity": 0.4 }, "opacity": 0.43, "visible": true }, { "uid": "9163e5", "line": { "shape": "vh" }, "meta": { "columnNames": { "x": "Time", "y": "Station_230" } }, "mode": "lines+markers", "name": "Station_230", "type": "scatter", "xsrc": "singhtinka970:4:6f5503", "ysrc": "singhtinka970:4:02e1b8", "marker": { "size": 4, "opacity": 0.4 }, "opacity": 0.43 }, { "uid": "f57718", "line": { "shape": "vh" }, "meta": { "columnNames": { "x": "Time", "y": "Station_247" } }, "mode": "lines+markers", "name": "Station_247", "type": "scatter", "xsrc": "singhtinka970:4:6f5503", "ysrc": "singhtinka970:4:8733de", "marker": { "size": 4, "opacity": 0.4 }, "opacity": 0.43 }, { "uid": "2baf9b", "line": { "shape": "vh" }, "meta": { "columnNames": { "x": "Time", "y": "bg_1" } }, "mode": "lines+markers", "name": "bg_1", "type": "scatter", "xsrc": "singhtinka970:4:6f5503", "ysrc": "singhtinka970:4:3ba961", "marker": { "size": 4, "opacity": 0.4 }, "opacity": 0.43 }, { "uid": "3ec774", "line": { "shape": "vh" }, "meta": { "columnNames": { "x": "Time", "y": "Averaged_Background" } }, "mode": "lines+markers", "name": "Averaged_Background", "type": "scatter", "xsrc": "singhtinka970:4:6f5503", "ysrc": "singhtinka970:4:6bb546", "marker": { "size": 4, "opacity": 0.4 }, "opacity": 0.43 } ], "frames": [], "layout": { "title": { "text": "Temporal Plots for PM10 at Background Stations" }, "width": 1620, "xaxis": { "type": "date", "range": [ "2015-05-30 06:02:19.2073", "2015-07-02 16:57:40.7927" ], "title": { "text": "Dates" }, "autorange": true }, "yaxis": { "type": "linear", "range": [ -7.550488599348534, 39.55048859934853 ], "title": { "text": "PM10 (ug/m3)" }, "nticks": 23, "autorange": true }, "height": 903, "autosize": true } }, "height": 903, "width": 1620, "user": { "profile_url": "https://chart-studio.plotly.com/~singhtinka970", "avatar_url": "https://storage.googleapis.com/plotly-prod-profiles/62.jpg", "background_url": "https://storage.googleapis.com/plotly-prod-profiles/bg-14.jpg", "bio": "", "nickname": "", "website": "", "stream_tokens": null, "feature_set_id": null, "csrf_token": null, "date_joined": "2025-09-05 08:50:37", "mapbox_access_tokens": null, "has_password": null, "username": "singhtinka970", "email": null, "is_active": null, "readonly": null, "is_dash_creator": null, "dash_created_count": null, "is_chart_creator": null, "charts_created_count": null } }, { "creation_time": "2025-09-05T09:21:06.233070Z", "comments": { "results": [], "count": 0 }, "parented": true, "embed_url": "https://chart-studio.plotly.com/~osmarkp/49.embed", "fid": "osmarkp:49", "filename": "Alle<102spejllinjer", "filetype": "plot", "img_url": "https://storage.googleapis.com/plotly-prod-images/osmarkp/49/9_F4Q3MUPVFHILLW9UHZ00JI62W5KFFW.png", "image_urls": { "default": "https://storage.googleapis.com/plotly-prod-images/osmarkp/49/2_IHOZAWN5TRAPZC3J51F4HYC77WRDZ6.png", "block-thumb": "https://storage.googleapis.com/plotly-prod-images/osmarkp/49/8_4H61J9D5A0H5DSPN6T5DM9J7PG0X66.png", "list-thumb": "https://storage.googleapis.com/plotly-prod-images/osmarkp/49/9_F4Q3MUPVFHILLW9UHZ00JI62W5KFFW.png" }, "api_urls": { "files": "https://api.plotly.com/v2/files/osmarkp:49", "plots": "https://api.plotly.com/v2/plots/osmarkp:49", "parent": "https://api.plotly.com/v2/folders/home?user=osmarkp" }, "owner": "osmarkp", "parent": -1, "preview": "", "referencers": [], "references": [], "title": "", "views": 0, "web_url": "https://chart-studio.plotly.com/~osmarkp/49/", "world_readable": true, "date_modified": "2025-09-05T09:21:06.246Z", "stars": { "results": [], "count": 0 }, "collaborators": { "results": [], "count": 0 }, "subfolder_count": null, "refresh_interval": null, "organize_view_url": "https://chart-studio.plotly.com/~osmarkp/49/", "current_user_permission": "read", "is_theme": null, "is_template": false, "autosize": true, "caption": "", "figure": { "data": [ { "meta": { "columnNames": { "x": "x", "y": "y", "z": "z", "marker": { "color": "si-1" } } }, "mode": "markers", "type": "scatter3d", "xsrc": "osmarkp:48:d1152f", "ysrc": "osmarkp:48:868d67", "zsrc": "osmarkp:48:8f5ab0", "marker": { "meta": { "columnNames": { "color": "si-1" } }, "size": 4, "symbol": "circle", "colorsrc": "osmarkp:48:517fcf", "reversescale": true }, "visible": true }, { "meta": { "columnNames": { "x": "M", "y": "N", "z": "O" } }, "mode": "lines", "type": "scatter3d", "xsrc": "osmarkp:48:1a1e30", "ysrc": "osmarkp:48:0fd88f", "zsrc": "osmarkp:48:5a5c88", "visible": true }, { "meta": { "columnNames": { "x": "Q", "y": "R", "z": "S" } }, "mode": "lines", "type": "scatter3d", "xsrc": "osmarkp:48:92a262", "ysrc": "osmarkp:48:0602f8", "zsrc": "osmarkp:48:e56e8a", "visible": true }, { "meta": { "columnNames": { "x": "U", "y": "V", "z": "W" } }, "mode": "lines", "type": "scatter3d", "xsrc": "osmarkp:48:09bdf2", "ysrc": "osmarkp:48:9df7a4", "zsrc": "osmarkp:48:194f0d", "visible": true }, { "meta": { "columnNames": { "x": "Y", "y": "Z", "z": "AA" } }, "mode": "lines", "type": "scatter3d", "xsrc": "osmarkp:48:46bf79", "ysrc": "osmarkp:48:ed2c75", "zsrc": "osmarkp:48:ffb84a", "visible": true }, { "meta": { "columnNames": { "x": "AC", "y": "AD", "z": "AE" } }, "mode": "lines", "type": "scatter3d", "xsrc": "osmarkp:48:cba669", "ysrc": "osmarkp:48:3b9d5b", "zsrc": "osmarkp:48:3ade14", "visible": true }, { "meta": { "columnNames": { "x": "AG", "y": "AH", "z": "AI" } }, "mode": "lines", "type": "scatter3d", "xsrc": "osmarkp:48:ba3ab1", "ysrc": "osmarkp:48:f9d4fc", "zsrc": "osmarkp:48:696f6a", "visible": true }, { "meta": { "columnNames": { "x": "AK", "y": "AL", "z": "AM" } }, "mode": "lines", "type": "scatter3d", "xsrc": "osmarkp:48:6faffa", "ysrc": "osmarkp:48:156e81", "zsrc": "osmarkp:48:5637c5", "visible": true }, { "meta": { "columnNames": { "x": "AO", "y": "AP", "z": "AQ" } }, "mode": "lines", "type": "scatter3d", "xsrc": "osmarkp:48:a285ca", "ysrc": "osmarkp:48:622b64", "zsrc": "osmarkp:48:1717e7", "visible": true }, { "meta": { "columnNames": { "x": "AS", "y": "AT", "z": "AU" } }, "mode": "lines", "type": "scatter3d", "xsrc": "osmarkp:48:6134cd", "ysrc": "osmarkp:48:65e572", "zsrc": "osmarkp:48:17af1b", "visible": true }, { "meta": { "columnNames": { "x": "AW", "y": "AX", "z": "AY" } }, "mode": "lines", "type": "scatter3d", "xsrc": "osmarkp:48:dc50de", "ysrc": "osmarkp:48:b98f8c", "zsrc": "osmarkp:48:66afb0", "visible": true }, { "meta": { "columnNames": { "x": "BA", "y": "BB", "z": "BC" } }, "mode": "lines", "type": "scatter3d", "xsrc": "osmarkp:48:93779a", "ysrc": "osmarkp:48:18eff2", "zsrc": "osmarkp:48:d42248", "visible": true }, { "meta": { "columnNames": { "x": "BE", "y": "BF", "z": "BG" } }, "mode": "lines", "type": "scatter3d", "xsrc": "osmarkp:48:e9ab94", "ysrc": "osmarkp:48:71b827", "zsrc": "osmarkp:48:00fbc7", "visible": true }, { "meta": { "columnNames": { "x": "N", "y": "O", "z": "P", "marker": { "color": "a" } } }, "mode": "markers", "type": "scatter3d", "xsrc": "osmarkp:48:0fd88f", "ysrc": "osmarkp:48:5a5c88", "zsrc": "osmarkp:48:c951a3", "marker": { "meta": { "columnNames": { "color": "a" } }, "colorsrc": "osmarkp:48:53c6b8", "colorscale": [ [ 0, "#9e0142" ], [ 0.1, "#d53e4f" ], [ 0.2, "#f46d43" ], [ 0.3, "#fdae61" ], [ 0.4, "#fee08b" ], [ 0.5, "#ffffbf" ], [ 0.6, "#e6f598" ], [ 0.7, "#abdda4" ], [ 0.8, "#66c2a5" ], [ 0.9, "#3288bd" ], [ 1, "#5e4fa2" ] ] }, "autocolorscale": false } ], "frames": [], "layout": { "scene": { "camera": { "up": { "x": 0.03685646799284403, "y": -0.6158138571304088, "z": 0.7870291571049077 }, "eye": { "x": -1.4110187262053353, "y": 0.05661193434883435, "z": 0.11037403047455378 }, "center": { "x": 0, "y": 0, "z": 0 }, "projection": { "type": "perspective" } }, "dragmode": "orbit", "aspectmode": "auto", "aspectratio": { "x": 1.0428150522085233, "y": 1.0837251925229634, "z": 0.8848579141615022 } }, "xaxis": { "range": [ -1, 6 ], "autorange": true }, "yaxis": { "range": [ -1, 4 ], "autorange": true }, "autosize": true, "dragmode": "zoom", "template": { "data": { "bar": [ { "type": "bar", "marker": { "colorbar": { "ticks": "", "outlinewidth": 0 } } } ], "table": [ { "type": "table", "cells": { "fill": { "color": "#EBF0F8" }, "line": { "color": "white" } }, "header": { "fill": { "color": "#C8D4E3" }, "line": { "color": "white" } } } ], "carpet": [ { "type": "carpet", "aaxis": { "gridcolor": "#C8D4E3", "linecolor": "#C8D4E3", "endlinecolor": "#2a3f5f", "minorgridcolor": "#C8D4E3", "startlinecolor": "#2a3f5f" }, "baxis": { "gridcolor": "#C8D4E3", "linecolor": "#C8D4E3", "endlinecolor": "#2a3f5f", "minorgridcolor": "#C8D4E3", "startlinecolor": "#2a3f5f" } } ], "mesh3d": [ { "type": "mesh3d", "colorbar": { "ticks": "", "outlinewidth": 0 } } ], "contour": [ { "type": "contour", "colorbar": { "ticks": "", "outlinewidth": 0 }, "autocolorscale": true } ], "heatmap": [ { "type": "heatmap", "colorbar": { "ticks": "", "outlinewidth": 0 }, "autocolorscale": true } ], "scatter": [ { "type": "scatter", "marker": { "colorbar": { "ticks": "", "outlinewidth": 0 } } } ], "surface": [ { "type": "surface", "colorbar": { "ticks": "", "outlinewidth": 0 } } ], "heatmapgl": [ { "type": "heatmapgl", "colorbar": { "ticks": "", "outlinewidth": 0 } } ], "histogram": [ { "type": "histogram", "marker": { "colorbar": { "ticks": "", "outlinewidth": 0 } } } ], "parcoords": [ { "line": { "colorbar": { "ticks": "", "outlinewidth": 0 } }, "type": "parcoords" } ], "scatter3d": [ { "type": "scatter3d", "marker": { "colorbar": { "ticks": "", "outlinewidth": 0 } } } ], "scattergl": [ { "type": "scattergl", "marker": { "colorbar": { "ticks": "", "outlinewidth": 0 } } } ], "choropleth": [ { "type": "choropleth", "colorbar": { "ticks": "", "outlinewidth": 0 } } ], "scattergeo": [ { "type": "scattergeo", "marker": { "colorbar": { "ticks": "", "outlinewidth": 0 } } } ], "histogram2d": [ { "type": "histogram2d", "colorbar": { "ticks": "", "outlinewidth": 0 }, "autocolorscale": true } ], "scatterpolar": [ { "type": "scatterpolar", "marker": { "colorbar": { "ticks": "", "outlinewidth": 0 } } } ], "contourcarpet": [ { "type": "contourcarpet", "colorbar": { "ticks": "", "outlinewidth": 0 } } ], "scattercarpet": [ { "type": "scattercarpet", "marker": { "colorbar": { "ticks": "", "outlinewidth": 0 } } } ], "scattermapbox": [ { "type": "scattermapbox", "marker": { "colorbar": { "ticks": "", "outlinewidth": 0 } } } ], "scatterpolargl": [ { "type": "scatterpolargl", "marker": { "colorbar": { "ticks": "", "outlinewidth": 0 } } } ], "scatterternary": [ { "type": "scatterternary", "marker": { "colorbar": { "ticks": "", "outlinewidth": 0 } } } ], "histogram2dcontour": [ { "type": "histogram2dcontour", "colorbar": { "ticks": "", "outlinewidth": 0 }, "autocolorscale": true } ] }, "layout": { "geo": { "bgcolor": "white", "showland": true, "lakecolor": "white", "landcolor": "white", "showlakes": true, "subunitcolor": "#C8D4E3" }, "font": { "color": "#2a3f5f" }, "polar": { "bgcolor": "white", "radialaxis": { "ticks": "", "gridcolor": "#EBF0F8", "linecolor": "#EBF0F8" }, "angularaxis": { "ticks": "", "gridcolor": "#EBF0F8", "linecolor": "#EBF0F8" } }, "scene": { "xaxis": { "ticks": "", "gridcolor": "#DFE8F3", "gridwidth": 2, "linecolor": "#EBF0F8", "zerolinecolor": "#EBF0F8", "showbackground": true, "backgroundcolor": "white" }, "yaxis": { "ticks": "", "gridcolor": "#DFE8F3", "gridwidth": 2, "linecolor": "#EBF0F8", "zerolinecolor": "#EBF0F8", "showbackground": true, "backgroundcolor": "white" }, "zaxis": { "ticks": "", "gridcolor": "#DFE8F3", "gridwidth": 2, "linecolor": "#EBF0F8", "zerolinecolor": "#EBF0F8", "showbackground": true, "backgroundcolor": "white" } }, "title": { "x": 0.05 }, "xaxis": { "ticks": "", "gridcolor": "#EBF0F8", "linecolor": "#EBF0F8", "automargin": true, "zerolinecolor": "#EBF0F8", "zerolinewidth": 2 }, "yaxis": { "ticks": "", "gridcolor": "#EBF0F8", "linecolor": "#EBF0F8", "automargin": true, "zerolinecolor": "#EBF0F8", "zerolinewidth": 2 }, "ternary": { "aaxis": { "ticks": "", "gridcolor": "#DFE8F3", "linecolor": "#A2B1C6" }, "baxis": { "ticks": "", "gridcolor": "#DFE8F3", "linecolor": "#A2B1C6" }, "caxis": { "ticks": "", "gridcolor": "#DFE8F3", "linecolor": "#A2B1C6" }, "bgcolor": "white" }, "colorway": [ "#636efa", "#EF553B", "#00cc96", "#ab63fa", "#19d3f3", "#e763fa", "#fecb52", "#ffa15a", "#ff6692", "#b6e880" ], "hovermode": "closest", "colorscale": { "diverging": [ [ 0, "#8e0152" ], [ 0.1, "#c51b7d" ], [ 0.2, "#de77ae" ], [ 0.3, "#f1b6da" ], [ 0.4, "#fde0ef" ], [ 0.5, "#f7f7f7" ], [ 0.6, "#e6f5d0" ], [ 0.7, "#b8e186" ], [ 0.8, "#7fbc41" ], [ 0.9, "#4d9221" ], [ 1, "#276419" ] ], "sequential": [ [ 0, "#0508b8" ], [ 0.0893854748603352, "#1910d8" ], [ 0.1787709497206704, "#3c19f0" ], [ 0.2681564245810056, "#6b1cfb" ], [ 0.3575418994413408, "#981cfd" ], [ 0.44692737430167595, "#bf1cfd" ], [ 0.5363128491620112, "#dd2bfd" ], [ 0.6256983240223464, "#f246fe" ], [ 0.7150837988826816, "#fc67fd" ], [ 0.8044692737430168, "#fe88fc" ], [ 0.8938547486033519, "#fea5fd" ], [ 0.9832402234636871, "#febefe" ], [ 1, "#fec3fe" ] ], "sequentialminus": [ [ 0, "#0508b8" ], [ 0.0893854748603352, "#1910d8" ], [ 0.1787709497206704, "#3c19f0" ], [ 0.2681564245810056, "#6b1cfb" ], [ 0.3575418994413408, "#981cfd" ], [ 0.44692737430167595, "#bf1cfd" ], [ 0.5363128491620112, "#dd2bfd" ], [ 0.6256983240223464, "#f246fe" ], [ 0.7150837988826816, "#fc67fd" ], [ 0.8044692737430168, "#fe88fc" ], [ 0.8938547486033519, "#fea5fd" ], [ 0.9832402234636871, "#febefe" ], [ 1, "#fec3fe" ] ] }, "plot_bgcolor": "white", "paper_bgcolor": "white", "shapedefaults": { "line": { "width": 0 }, "opacity": 0.4, "fillcolor": "#506784" }, "annotationdefaults": { "arrowhead": 0, "arrowcolor": "#506784", "arrowwidth": 1 } }, "themeRef": "PLOTLY_WHITE" } } }, "height": null, "width": null, "user": { "profile_url": "https://chart-studio.plotly.com/~osmarkp", "avatar_url": "https://storage.googleapis.com/plotly-prod-profiles/94.jpg", "background_url": "https://storage.googleapis.com/plotly-prod-profiles/bg-10.jpg", "bio": "", "nickname": "", "website": "", "stream_tokens": null, "feature_set_id": null, "csrf_token": null, "date_joined": "2021-02-03 22:15:47", "mapbox_access_tokens": null, "has_password": null, "username": "osmarkp", "email": null, "is_active": null, "readonly": null, "is_dash_creator": null, "dash_created_count": null, "is_chart_creator": null, "charts_created_count": null } }, { "creation_time": "2025-09-05T08:57:00.657186Z", "comments": { "results": [], "count": 0 }, "parented": true, "embed_url": "https://chart-studio.plotly.com/~singhtinka970/3.embed", "fid": "singhtinka970:3", "filename": "Plots Basestations", "filetype": "plot", "img_url": "https://storage.googleapis.com/plotly-prod-images/singhtinka970/3/9_F2SHW6TYMXTSEQG63YFO0C98QR5GEX.png", "image_urls": { "default": "https://storage.googleapis.com/plotly-prod-images/singhtinka970/3/2_4IW5SEGDVNEJXAJNXJ3C2B4UZ49J5H.png", "block-thumb": "https://storage.googleapis.com/plotly-prod-images/singhtinka970/3/8_KVAJ8LKIQQPRSCWOTUGATE1086QDEE.png", "list-thumb": "https://storage.googleapis.com/plotly-prod-images/singhtinka970/3/9_F2SHW6TYMXTSEQG63YFO0C98QR5GEX.png" }, "api_urls": { "files": "https://api.plotly.com/v2/files/singhtinka970:3", "plots": "https://api.plotly.com/v2/plots/singhtinka970:3", "parent": "https://api.plotly.com/v2/folders/home?user=singhtinka970" }, "owner": "singhtinka970", "parent": -1, "preview": "", "referencers": [], "references": [], "title": "", "views": 0, "web_url": "https://chart-studio.plotly.com/~singhtinka970/3/", "world_readable": true, "date_modified": "2025-09-05T09:31:47.867Z", "stars": { "results": [], "count": 0 }, "collaborators": { "results": [], "count": 0 }, "subfolder_count": null, "refresh_interval": null, "organize_view_url": "https://chart-studio.plotly.com/~singhtinka970/3/", "current_user_permission": "read", "is_theme": null, "is_template": false, "autosize": true, "caption": "", "figure": { "data": [ { "uid": "dc984e", "line": { "color": "#7F7F7F", "shape": "spline" }, "meta": { "columnNames": { "x": "Anand Vihar, x", "y": "Anand Vihar, y" } }, "mode": "lines", "name": "Pan Bazaar", "type": "scatter", "xsrc": "singhtinka970:2:4fbbf4", "ysrc": "singhtinka970:2:d2789b", "opacity": 0.8 }, { "uid": "181912", "line": { "color": "#317DBD", "shape": "spline" }, "meta": { "columnNames": { "x": "NSIT Dwarka, x", "y": "NSIT Dwarka, y" } }, "mode": "lines", "name": "NSIT Dwarka", "type": "scatter", "xsrc": "singhtinka970:2:aeed0e", "ysrc": "singhtinka970:2:38b933", "opacity": 0.8, "visible": "legendonly" }, { "uid": "66dbc7", "line": { "color": "#17BECF" }, "meta": { "columnNames": { "x": "Shadipur, x", "y": "Shadipur, y" } }, "mode": "lines", "name": "Bamunimaidam", "type": "scatter", "xsrc": "singhtinka970:2:565c15", "ysrc": "singhtinka970:2:f2be64", "opacity": 0.8, "visible": true }, { "uid": "73f4dd", "line": { "color": "#498015" }, "meta": { "columnNames": { "x": "IHBAS, x", "y": "IHBAS, y" } }, "mode": "lines", "name": "IIT Guwahati", "type": "scatter", "xsrc": "singhtinka970:2:818a01", "ysrc": "singhtinka970:2:3f55de", "opacity": 0.8, "visible": true }, { "uid": "4325a7", "line": { "color": "#9E4634" }, "meta": { "columnNames": { "x": "DTU, x", "y": "DTU, y" } }, "mode": "lines", "name": "DTU", "type": "scatter", "xsrc": "singhtinka970:2:a12c0e", "ysrc": "singhtinka970:2:24fc86", "opacity": 0.8, "visible": "legendonly" }, { "uid": "b6e76b", "line": { "color": "#BD319D" }, "meta": { "columnNames": { "x": "Mandir Marg, x", "y": "Mandir Marg, y" } }, "mode": "lines", "name": "Airport, Azara", "type": "scatter", "xsrc": "singhtinka970:2:b7a820", "ysrc": "singhtinka970:2:a5dfad", "opacity": 0.8, "visible": true } ], "frames": [], "layout": { "title": { "text": "PM 2.5 for Guwahati" }, "xaxis": { "type": "date", "range": [ "2015-03-23", "2017-04-17" ], "title": { "text": "Time" }, "autorange": true, "rangeslider": { "range": [ "2015-03-23", "2017-04-17" ], "yaxis": {}, "visible": false, "autorange": true }, "rangeselector": { "buttons": [ { "step": "day", "count": 1, "label": "1 day", "stepmode": "backward" }, { "step": "hour", "count": 6, "label": "6 hours", "stepmode": "backward" }, { "step": "all" } ] } }, "yaxis": { "type": "linear", "range": [ -85.96888888888887, 1002.6088888888888 ], "title": { "text": "PM 2.5 (µg/m³)" }, "autorange": true }, "autosize": true } }, "height": null, "width": null, "user": { "profile_url": "https://chart-studio.plotly.com/~singhtinka970", "avatar_url": "https://storage.googleapis.com/plotly-prod-profiles/62.jpg", "background_url": "https://storage.googleapis.com/plotly-prod-profiles/bg-14.jpg", "bio": "", "nickname": "", "website": "", "stream_tokens": null, "feature_set_id": null, "csrf_token": null, "date_joined": "2025-09-05 08:50:37", "mapbox_access_tokens": null, "has_password": null, "username": "singhtinka970", "email": null, "is_active": null, "readonly": null, "is_dash_creator": null, "dash_created_count": null, "is_chart_creator": null, "charts_created_count": null } }, { "creation_time": "2025-09-05T08:55:58.287380Z", "comments": { "results": [], "count": 0 }, "parented": true, "embed_url": "https://chart-studio.plotly.com/~singhtinka970/1.embed", "fid": "singhtinka970:1", "filename": "World", "filetype": "plot", "img_url": "https://storage.googleapis.com/plotly-prod-images/singhtinka970/1/9_ERN7XJVXRGWGIWPVLTPJZWS2TT29ZK.png", "image_urls": { "default": "https://storage.googleapis.com/plotly-prod-images/singhtinka970/1/2_GJKUFJ7OVTJA012LYCS7U7SPHUA2CT.png", "block-thumb": "https://storage.googleapis.com/plotly-prod-images/singhtinka970/1/8_9QHH7MK5C57YRF337V6UZOTMADXLEC.png", "list-thumb": "https://storage.googleapis.com/plotly-prod-images/singhtinka970/1/9_ERN7XJVXRGWGIWPVLTPJZWS2TT29ZK.png" }, "api_urls": { "files": "https://api.plotly.com/v2/files/singhtinka970:1", "plots": "https://api.plotly.com/v2/plots/singhtinka970:1", "parent": "https://api.plotly.com/v2/folders/home?user=singhtinka970" }, "owner": "singhtinka970", "parent": -1, "preview": "", "referencers": [], "references": [], "title": "", "views": 0, "web_url": "https://chart-studio.plotly.com/~singhtinka970/1/", "world_readable": true, "date_modified": "2025-09-05T08:55:58.297Z", "stars": { "results": [], "count": 0 }, "collaborators": { "results": [], "count": 0 }, "subfolder_count": null, "refresh_interval": null, "organize_view_url": "https://chart-studio.plotly.com/~singhtinka970/1/", "current_user_permission": "read", "is_theme": null, "is_template": false, "autosize": true, "caption": "", "figure": { "data": [ { "meta": { "columnNames": { "z": "z", "text": "text", "locations": "locations" } }, "type": "choropleth", "zsrc": "singhtinka970:0:b46208", "marker": { "line": { "color": "rgb(0, 0, 0)", "width": 0.5 } }, "textsrc": "singhtinka970:0:97609a", "colorbar": { "title": { "text": "PM2.5<br>annual" }, "autotick": false, "ticksuffix": " ug/m3" }, "colorscale": [ [ 0, "rgb(108, 78, 47)" ], [ 0.35, "rgb(179, 138, 98)" ], [ 0.5, "rgb(205, 178, 151)" ], [ 0.6, "rgb(217, 197, 176)" ], [ 0.7, "rgb(231, 218, 206)" ], [ 1, "rgb(255, 255, 255)" ] ], "locationssrc": "singhtinka970:0:ce7ada", "plot_bgcolor": "#ff9900", "reversescale": true, "autocolorscale": false } ], "frames": [], "layout": { "geo": { "showframe": false, "projection": { "type": "Mercator" }, "showcoastlines": false }, "title": { "text": "Concentrations of fine particulate matter(pm 2.5)<br>Source: <a href=\"http://apps.who.int/gho/data/view.main.SDGPM25116v?lang=en\"> World Health Organization</a>" }, "autosize": true, "plot_bgcolor": "#ff9900", "paper_bgcolor": "rgba(255,0,0,0)" } }, "height": null, "width": null, "user": { "profile_url": "https://chart-studio.plotly.com/~singhtinka970", "avatar_url": "https://storage.googleapis.com/plotly-prod-profiles/62.jpg", "background_url": "https://storage.googleapis.com/plotly-prod-profiles/bg-14.jpg", "bio": "", "nickname": "", "website": "", "stream_tokens": null, "feature_set_id": null, "csrf_token": null, "date_joined": "2025-09-05 08:50:37", "mapbox_access_tokens": null, "has_password": null, "username": "singhtinka970", "email": null, "is_active": null, "readonly": null, "is_dash_creator": null, "dash_created_count": null, "is_chart_creator": null, "charts_created_count": null } }, { "creation_time": "2025-09-05T08:15:51.352578Z", "comments": { "results": [], "count": 0 }, "parented": true, "embed_url": "https://chart-studio.plotly.com/~AnaisLebrun/15.embed", "fid": "AnaisLebrun:15", "filename": "Sorigny fosses", "filetype": "plot", "img_url": "https://storage.googleapis.com/plotly-prod-images/AnaisLebrun/15/9_K3XXO41QZ7N9TN1VS99M6SEWFF738G.png", "image_urls": { "default": "https://storage.googleapis.com/plotly-prod-images/AnaisLebrun/15/2_UF49ZN8C8PAWNNXN7BGVGW1SP62VXA.png", "block-thumb": "https://storage.googleapis.com/plotly-prod-images/AnaisLebrun/15/8_D560IGDYVRJWFKW2QMRGOZMMINFAOA.png", "list-thumb": "https://storage.googleapis.com/plotly-prod-images/AnaisLebrun/15/9_K3XXO41QZ7N9TN1VS99M6SEWFF738G.png" }, "api_urls": { "files": "https://api.plotly.com/v2/files/AnaisLebrun:15", "plots": "https://api.plotly.com/v2/plots/AnaisLebrun:15", "parent": "https://api.plotly.com/v2/folders/home?user=AnaisLebrun" }, "owner": "AnaisLebrun", "parent": -1, "preview": "", "referencers": [], "references": [], "title": "", "views": 0, "web_url": "https://chart-studio.plotly.com/~AnaisLebrun/15/", "world_readable": true, "date_modified": "2025-09-05T08:34:04.885Z", "stars": { "results": [], "count": 0 }, "collaborators": { "results": [], "count": 0 }, "subfolder_count": null, "refresh_interval": null, "organize_view_url": "https://chart-studio.plotly.com/~AnaisLebrun/15/", "current_user_permission": "read", "is_theme": null, "is_template": false, "autosize": true, "caption": "", "figure": { "data": [ { "meta": { "columnNames": { "x": "B" } }, "mode": "markers", "name": "<br>", "type": "box", "xsrc": "AnaisLebrun:14:12e8c9", "jitter": 0, "marker": { "color": "rgb(84, 123, 83)" }, "boxmean": true, "boxpoints": "all" } ], "frames": [], "layout": { "title": { "x": 0.5, "text": "Distribution des profondeurs conservées des fosses sépulcrales" }, "xaxis": { "side": "bottom", "range": [ -2.1111111111111116, 80.11111111111111 ], "ticks": "outside", "showline": true, "autorange": true, "automargin": false }, "yaxis": { "type": "category", "range": [ -0.5137614678899083, 0.5 ], "autorange": true }, "boxgap": 0.78, "modebar": { "orientation": "h" }, "autosize": true, "boxgroupgap": 0 } }, "height": null, "width": null, "user": { "profile_url": "https://chart-studio.plotly.com/~AnaisLebrun", "avatar_url": "https://storage.googleapis.com/plotly-prod-profiles/87.jpg", "background_url": "https://storage.googleapis.com/plotly-prod-profiles/bg-9.jpg", "bio": "", "nickname": "", "website": "", "stream_tokens": null, "feature_set_id": null, "csrf_token": null, "date_joined": "2024-04-04 11:18:04", "mapbox_access_tokens": null, "has_password": null, "username": "AnaisLebrun", "email": null, "is_active": null, "readonly": null, "is_dash_creator": null, "dash_created_count": null, "is_chart_creator": null, "charts_created_count": null } }, { "creation_time": "2025-09-05T08:00:27.191536Z", "comments": { "results": [], "count": 0 }, "parented": true, "embed_url": "https://chart-studio.plotly.com/~ATrav/39.embed", "fid": "ATrav:39", "filename": "Plot 39", "filetype": "plot", "img_url": "https://storage.googleapis.com/plotly-prod-images/ATrav/39/9_CALGO1N2H2MFG6Y3QQPY9W6WR2BG0K.png", "image_urls": { "default": "https://storage.googleapis.com/plotly-prod-images/ATrav/39/2_YHXOYNG2086DC72XX02YWJJ3LP0OM5.png", "block-thumb": "https://storage.googleapis.com/plotly-prod-images/ATrav/39/8_62DHBSPDR7HGR9JR0NIV1CA0KIPB23.png", "list-thumb": "https://storage.googleapis.com/plotly-prod-images/ATrav/39/9_CALGO1N2H2MFG6Y3QQPY9W6WR2BG0K.png" }, "api_urls": { "files": "https://api.plotly.com/v2/files/ATrav:39", "plots": "https://api.plotly.com/v2/plots/ATrav:39", "parent": "https://api.plotly.com/v2/folders/home?user=ATrav" }, "owner": "ATrav", "parent": -1, "preview": "", "referencers": [], "references": [], "title": "", "views": 0, "web_url": "https://chart-studio.plotly.com/~ATrav/39/", "world_readable": true, "date_modified": "2025-09-05T08:07:14.383Z", "stars": { "results": [], "count": 0 }, "collaborators": { "results": [], "count": 0 }, "subfolder_count": null, "refresh_interval": null, "organize_view_url": "https://chart-studio.plotly.com/~ATrav/39/", "current_user_permission": "read", "is_theme": null, "is_template": false, "autosize": true, "caption": "", "figure": { "data": [ { "meta": { "columnNames": { "x": "Species", "y": "SINEs (%)" } }, "mode": "markers", "name": "SINEs", "type": "bar", "xsrc": "ATrav:38:f6883b", "ysrc": "ATrav:38:6c88b2", "marker": { "color": "rgb(249, 22, 14)" }, "orientation": "v" }, { "meta": { "columnNames": { "x": "Species", "y": "LINEs (%)" } }, "name": "LINEs", "type": "bar", "xsrc": "ATrav:38:f6883b", "ysrc": "ATrav:38:0dfb7e", "marker": { "color": "rgb(12, 25, 233)" }, "orientation": "v" }, { "meta": { "columnNames": { "x": "Species", "y": "LTRs (%)" } }, "name": "LTRs", "type": "bar", "xsrc": "ATrav:38:f6883b", "ysrc": "ATrav:38:05fb1d", "marker": { "color": "rgb(253, 175, 62)" }, "orientation": "v" }, { "meta": { "columnNames": { "x": "Species", "y": "Penelope (%)" } }, "name": "Penelope", "type": "bar", "xsrc": "ATrav:38:f6883b", "ysrc": "ATrav:38:3d0e52", "marker": { "color": "rgb(10, 178, 8)" }, "orientation": "v" }, { "meta": { "columnNames": { "x": "Species", "y": "DNA transposons (%)" } }, "name": "DNA transposones", "type": "bar", "xsrc": "ATrav:38:f6883b", "ysrc": "ATrav:38:0a54bc", "marker": { "color": "rgb(250, 190, 225)" }, "orientation": "v" }, { "meta": { "columnNames": { "x": "Species", "y": "Rolling-circles (%)" } }, "name": "Helitrons", "type": "bar", "xsrc": "ATrav:38:f6883b", "ysrc": "ATrav:38:7d2e6e", "marker": { "color": "rgb(250, 128, 114)" }, "orientation": "v" } ], "frames": [], "layout": { "xaxis": { "type": "category", "range": [ -0.5, 8.5 ], "autorange": true }, "yaxis": { "type": "linear", "range": [ 0, 76.75438596842105 ], "autorange": true }, "autosize": true, "template": { "data": { "bar": [ { "type": "bar", "marker": { "colorbar": { "ticks": "", "outlinewidth": 0 } } } ], "table": [ { "type": "table", "cells": { "fill": { "color": "#EBF0F8" }, "line": { "color": "white" } }, "header": { "fill": { "color": "#C8D4E3" }, "line": { "color": "white" } } } ], "carpet": [ { "type": "carpet", "aaxis": { "gridcolor": "#C8D4E3", "linecolor": "#C8D4E3", "endlinecolor": "#2a3f5f", "minorgridcolor": "#C8D4E3", "startlinecolor": "#2a3f5f" }, "baxis": { "gridcolor": "#C8D4E3", "linecolor": "#C8D4E3", "endlinecolor": "#2a3f5f", "minorgridcolor": "#C8D4E3", "startlinecolor": "#2a3f5f" } } ], "mesh3d": [ { "type": "mesh3d", "colorbar": { "ticks": "", "outlinewidth": 0 } } ], "contour": [ { "type": "contour", "colorbar": { "ticks": "", "outlinewidth": 0 }, "autocolorscale": true } ], "heatmap": [ { "type": "heatmap", "colorbar": { "ticks": "", "outlinewidth": 0 }, "autocolorscale": true } ], "scatter": [ { "type": "scatter", "marker": { "colorbar": { "ticks": "", "outlinewidth": 0 } } } ], "surface": [ { "type": "surface", "colorbar": { "ticks": "", "outlinewidth": 0 } } ], "heatmapgl": [ { "type": "heatmapgl", "colorbar": { "ticks": "", "outlinewidth": 0 } } ], "histogram": [ { "type": "histogram", "marker": { "colorbar": { "ticks": "", "outlinewidth": 0 } } } ], "parcoords": [ { "line": { "colorbar": { "ticks": "", "outlinewidth": 0 } }, "type": "parcoords" } ], "scatter3d": [ { "type": "scatter3d", "marker": { "colorbar": { "ticks": "", "outlinewidth": 0 } } } ], "scattergl": [ { "type": "scattergl", "marker": { "colorbar": { "ticks": "", "outlinewidth": 0 } } } ], "choropleth": [ { "type": "choropleth", "colorbar": { "ticks": "", "outlinewidth": 0 } } ], "scattergeo": [ { "type": "scattergeo", "marker": { "colorbar": { "ticks": "", "outlinewidth": 0 } } } ], "histogram2d": [ { "type": "histogram2d", "colorbar": { "ticks": "", "outlinewidth": 0 }, "autocolorscale": true } ], "scatterpolar": [ { "type": "scatterpolar", "marker": { "colorbar": { "ticks": "", "outlinewidth": 0 } } } ], "contourcarpet": [ { "type": "contourcarpet", "colorbar": { "ticks": "", "outlinewidth": 0 } } ], "scattercarpet": [ { "type": "scattercarpet", "marker": { "colorbar": { "ticks": "", "outlinewidth": 0 } } } ], "scattermapbox": [ { "type": "scattermapbox", "marker": { "colorbar": { "ticks": "", "outlinewidth": 0 } } } ], "scatterpolargl": [ { "type": "scatterpolargl", "marker": { "colorbar": { "ticks": "", "outlinewidth": 0 } } } ], "scatterternary": [ { "type": "scatterternary", "marker": { "colorbar": { "ticks": "", "outlinewidth": 0 } } } ], "histogram2dcontour": [ { "type": "histogram2dcontour", "colorbar": { "ticks": "", "outlinewidth": 0 }, "autocolorscale": true } ] }, "layout": { "geo": { "bgcolor": "white", "showland": true, "lakecolor": "white", "landcolor": "white", "showlakes": true, "subunitcolor": "#C8D4E3" }, "font": { "color": "#2a3f5f" }, "polar": { "bgcolor": "white", "radialaxis": { "ticks": "", "gridcolor": "#EBF0F8", "linecolor": "#EBF0F8" }, "angularaxis": { "ticks": "", "gridcolor": "#EBF0F8", "linecolor": "#EBF0F8" } }, "scene": { "xaxis": { "ticks": "", "gridcolor": "#DFE8F3", "gridwidth": 2, "linecolor": "#EBF0F8", "zerolinecolor": "#EBF0F8", "showbackground": true, "backgroundcolor": "white" }, "yaxis": { "ticks": "", "gridcolor": "#DFE8F3", "gridwidth": 2, "linecolor": "#EBF0F8", "zerolinecolor": "#EBF0F8", "showbackground": true, "backgroundcolor": "white" }, "zaxis": { "ticks": "", "gridcolor": "#DFE8F3", "gridwidth": 2, "linecolor": "#EBF0F8", "zerolinecolor": "#EBF0F8", "showbackground": true, "backgroundcolor": "white" } }, "title": { "x": 0.05 }, "xaxis": { "ticks": "", "gridcolor": "#EBF0F8", "linecolor": "#EBF0F8", "automargin": true, "zerolinecolor": "#EBF0F8", "zerolinewidth": 2 }, "yaxis": { "ticks": "", "gridcolor": "#EBF0F8", "linecolor": "#EBF0F8", "automargin": true, "zerolinecolor": "#EBF0F8", "zerolinewidth": 2 }, "ternary": { "aaxis": { "ticks": "", "gridcolor": "#DFE8F3", "linecolor": "#A2B1C6" }, "baxis": { "ticks": "", "gridcolor": "#DFE8F3", "linecolor": "#A2B1C6" }, "caxis": { "ticks": "", "gridcolor": "#DFE8F3", "linecolor": "#A2B1C6" }, "bgcolor": "white" }, "colorway": [ "#636efa", "#EF553B", "#00cc96", "#ab63fa", "#19d3f3", "#e763fa", "#fecb52", "#ffa15a", "#ff6692", "#b6e880" ], "hovermode": "closest", "colorscale": { "diverging": [ [ 0, "#8e0152" ], [ 0.1, "#c51b7d" ], [ 0.2, "#de77ae" ], [ 0.3, "#f1b6da" ], [ 0.4, "#fde0ef" ], [ 0.5, "#f7f7f7" ], [ 0.6, "#e6f5d0" ], [ 0.7, "#b8e186" ], [ 0.8, "#7fbc41" ], [ 0.9, "#4d9221" ], [ 1, "#276419" ] ], "sequential": [ [ 0, "#0508b8" ], [ 0.0893854748603352, "#1910d8" ], [ 0.1787709497206704, "#3c19f0" ], [ 0.2681564245810056, "#6b1cfb" ], [ 0.3575418994413408, "#981cfd" ], [ 0.44692737430167595, "#bf1cfd" ], [ 0.5363128491620112, "#dd2bfd" ], [ 0.6256983240223464, "#f246fe" ], [ 0.7150837988826816, "#fc67fd" ], [ 0.8044692737430168, "#fe88fc" ], [ 0.8938547486033519, "#fea5fd" ], [ 0.9832402234636871, "#febefe" ], [ 1, "#fec3fe" ] ], "sequentialminus": [ [ 0, "#0508b8" ], [ 0.0893854748603352, "#1910d8" ], [ 0.1787709497206704, "#3c19f0" ], [ 0.2681564245810056, "#6b1cfb" ], [ 0.3575418994413408, "#981cfd" ], [ 0.44692737430167595, "#bf1cfd" ], [ 0.5363128491620112, "#dd2bfd" ], [ 0.6256983240223464, "#f246fe" ], [ 0.7150837988826816, "#fc67fd" ], [ 0.8044692737430168, "#fe88fc" ], [ 0.8938547486033519, "#fea5fd" ], [ 0.9832402234636871, "#febefe" ], [ 1, "#fec3fe" ] ] }, "plot_bgcolor": "white", "paper_bgcolor": "white", "shapedefaults": { "line": { "width": 0 }, "opacity": 0.4, "fillcolor": "#506784" }, "annotationdefaults": { "arrowhead": 0, "arrowcolor": "#506784", "arrowwidth": 1 } }, "themeRef": "PLOTLY_WHITE" } } }, "height": null, "width": null, "user": { "profile_url": "https://chart-studio.plotly.com/~ATrav", "avatar_url": "https://storage.googleapis.com/plotly-prod-profiles/89.jpg", "background_url": "https://storage.googleapis.com/plotly-prod-profiles/bg-7.jpg", "bio": "", "nickname": "", "website": "", "stream_tokens": null, "feature_set_id": null, "csrf_token": null, "date_joined": "2025-07-26 09:57:47", "mapbox_access_tokens": null, "has_password": null, "username": "ATrav", "email": null, "is_active": null, "readonly": null, "is_dash_creator": null, "dash_created_count": null, "is_chart_creator": null, "charts_created_count": null } }, { "creation_time": "2025-09-05T07:29:21.865834Z", "comments": { "results": [], "count": 0 }, "parented": true, "embed_url": "https://chart-studio.plotly.com/~Traber_plot/3.embed", "fid": "Traber_plot:3", "filename": "Plot 3", "filetype": "plot", "img_url": "https://storage.googleapis.com/plotly-prod-images/Traber_plot/3/9_W5H9E8VI97IIEOUB6MROZQPQM9S5EN.png", "image_urls": { "default": "https://storage.googleapis.com/plotly-prod-images/Traber_plot/3/2_8J1BL3ATTHY9BBB7DTVVC0HS4U7G44.png", "block-thumb": "https://storage.googleapis.com/plotly-prod-images/Traber_plot/3/8_IEHUH2N8J5NI23CAR4FJVQG6X5M0QT.png", "list-thumb": "https://storage.googleapis.com/plotly-prod-images/Traber_plot/3/9_W5H9E8VI97IIEOUB6MROZQPQM9S5EN.png" }, "api_urls": { "files": "https://api.plotly.com/v2/files/Traber_plot:3", "plots": "https://api.plotly.com/v2/plots/Traber_plot:3", "parent": "https://api.plotly.com/v2/folders/home?user=Traber_plot" }, "owner": "Traber_plot", "parent": -1, "preview": "", "referencers": [], "references": [], "title": "", "views": 0, "web_url": "https://chart-studio.plotly.com/~Traber_plot/3/", "world_readable": true, "date_modified": "2025-09-05T07:32:12.040Z", "stars": { "results": [], "count": 0 }, "collaborators": { "results": [], "count": 0 }, "subfolder_count": null, "refresh_interval": null, "organize_view_url": "https://chart-studio.plotly.com/~Traber_plot/3/", "current_user_permission": "read", "is_theme": null, "is_template": false, "autosize": true, "caption": "", "figure": { "data": [ { "meta": { "columnNames": { "x": "Datum", "y": "Preis" } }, "mode": "lines", "name": "%{meta.columnNames.y}", "type": "scatter", "xsrc": "Traber_plot:2:341dd3", "ysrc": "Traber_plot:2:864c95", "yaxis": "y2", "stackgroup": null }, { "meta": { "columnNames": { "x": "Datum", "y": "Wert S1" } }, "mode": "lines", "name": "%{meta.columnNames.y}", "type": "scatter", "xsrc": "Traber_plot:2:341dd3", "ysrc": "Traber_plot:2:f71de1", "stackgroup": null }, { "meta": { "columnNames": { "x": "Datum", "y": "Gespart S2" } }, "mode": "lines", "name": "%{meta.columnNames.y}", "type": "scatter", "xsrc": "Traber_plot:2:341dd3", "ysrc": "Traber_plot:2:44e9f1", "stackgroup": null }, { "meta": { "columnNames": { "x": "Datum", "y": "Wert insgesamt" } }, "mode": "lines", "name": "Wert S2", "type": "scatter", "xsrc": "Traber_plot:2:341dd3", "ysrc": "Traber_plot:2:57fbdb", "stackgroup": null } ], "frames": [], "layout": { "title": { "text": "Vergleich Crash Portfolio vs Standard Sparplan" }, "xaxis": { "type": "category", "range": [ 0, 3253 ], "nticks": 25, "autorange": true }, "yaxis": { "type": "linear", "range": [ -23596.094489033334, 457717.68718363333 ], "autorange": true }, "yaxis2": { "side": "right", "type": "linear", "range": [ 504.1388888888889, 4371.361111111111 ], "autorange": true, "overlaying": "y" }, "autosize": true, "template": { "data": { "bar": [ { "type": "bar", "marker": { "colorbar": { "ticks": "", "outlinewidth": 0 } } } ], "table": [ { "type": "table", "cells": { "fill": { "color": "#EBF0F8" }, "line": { "color": "white" } }, "header": { "fill": { "color": "#C8D4E3" }, "line": { "color": "white" } } } ], "carpet": [ { "type": "carpet", "aaxis": { "gridcolor": "#C8D4E3", "linecolor": "#C8D4E3", "endlinecolor": "#2a3f5f", "minorgridcolor": "#C8D4E3", "startlinecolor": "#2a3f5f" }, "baxis": { "gridcolor": "#C8D4E3", "linecolor": "#C8D4E3", "endlinecolor": "#2a3f5f", "minorgridcolor": "#C8D4E3", "startlinecolor": "#2a3f5f" } } ], "mesh3d": [ { "type": "mesh3d", "colorbar": { "ticks": "", "outlinewidth": 0 } } ], "contour": [ { "type": "contour", "colorbar": { "ticks": "", "outlinewidth": 0 }, "autocolorscale": true } ], "heatmap": [ { "type": "heatmap", "colorbar": { "ticks": "", "outlinewidth": 0 }, "autocolorscale": true } ], "scatter": [ { "type": "scatter", "marker": { "colorbar": { "ticks": "", "outlinewidth": 0 } } } ], "surface": [ { "type": "surface", "colorbar": { "ticks": "", "outlinewidth": 0 } } ], "heatmapgl": [ { "type": "heatmapgl", "colorbar": { "ticks": "", "outlinewidth": 0 } } ], "histogram": [ { "type": "histogram", "marker": { "colorbar": { "ticks": "", "outlinewidth": 0 } } } ], "parcoords": [ { "line": { "colorbar": { "ticks": "", "outlinewidth": 0 } }, "type": "parcoords" } ], "scatter3d": [ { "type": "scatter3d", "marker": { "colorbar": { "ticks": "", "outlinewidth": 0 } } } ], "scattergl": [ { "type": "scattergl", "marker": { "colorbar": { "ticks": "", "outlinewidth": 0 } } } ], "choropleth": [ { "type": "choropleth", "colorbar": { "ticks": "", "outlinewidth": 0 } } ], "scattergeo": [ { "type": "scattergeo", "marker": { "colorbar": { "ticks": "", "outlinewidth": 0 } } } ], "histogram2d": [ { "type": "histogram2d", "colorbar": { "ticks": "", "outlinewidth": 0 }, "autocolorscale": true } ], "scatterpolar": [ { "type": "scatterpolar", "marker": { "colorbar": { "ticks": "", "outlinewidth": 0 } } } ], "contourcarpet": [ { "type": "contourcarpet", "colorbar": { "ticks": "", "outlinewidth": 0 } } ], "scattercarpet": [ { "type": "scattercarpet", "marker": { "colorbar": { "ticks": "", "outlinewidth": 0 } } } ], "scattermapbox": [ { "type": "scattermapbox", "marker": { "colorbar": { "ticks": "", "outlinewidth": 0 } } } ], "scatterpolargl": [ { "type": "scatterpolargl", "marker": { "colorbar": { "ticks": "", "outlinewidth": 0 } } } ], "scatterternary": [ { "type": "scatterternary", "marker": { "colorbar": { "ticks": "", "outlinewidth": 0 } } } ], "histogram2dcontour": [ { "type": "histogram2dcontour", "colorbar": { "ticks": "", "outlinewidth": 0 }, "autocolorscale": true } ] }, "layout": { "geo": { "bgcolor": "white", "showland": true, "lakecolor": "white", "landcolor": "white", "showlakes": true, "subunitcolor": "#C8D4E3" }, "font": { "color": "#2a3f5f" }, "polar": { "bgcolor": "white", "radialaxis": { "ticks": "", "gridcolor": "#EBF0F8", "linecolor": "#EBF0F8" }, "angularaxis": { "ticks": "", "gridcolor": "#EBF0F8", "linecolor": "#EBF0F8" } }, "scene": { "xaxis": { "ticks": "", "gridcolor": "#DFE8F3", "gridwidth": 2, "linecolor": "#EBF0F8", "zerolinecolor": "#EBF0F8", "showbackground": true, "backgroundcolor": "white" }, "yaxis": { "ticks": "", "gridcolor": "#DFE8F3", "gridwidth": 2, "linecolor": "#EBF0F8", "zerolinecolor": "#EBF0F8", "showbackground": true, "backgroundcolor": "white" }, "zaxis": { "ticks": "", "gridcolor": "#DFE8F3", "gridwidth": 2, "linecolor": "#EBF0F8", "zerolinecolor": "#EBF0F8", "showbackground": true, "backgroundcolor": "white" } }, "title": { "x": 0.05 }, "xaxis": { "ticks": "", "gridcolor": "#EBF0F8", "linecolor": "#EBF0F8", "automargin": true, "zerolinecolor": "#EBF0F8", "zerolinewidth": 2 }, "yaxis": { "ticks": "", "gridcolor": "#EBF0F8", "linecolor": "#EBF0F8", "automargin": true, "zerolinecolor": "#EBF0F8", "zerolinewidth": 2 }, "ternary": { "aaxis": { "ticks": "", "gridcolor": "#DFE8F3", "linecolor": "#A2B1C6" }, "baxis": { "ticks": "", "gridcolor": "#DFE8F3", "linecolor": "#A2B1C6" }, "caxis": { "ticks": "", "gridcolor": "#DFE8F3", "linecolor": "#A2B1C6" }, "bgcolor": "white" }, "colorway": [ "#636efa", "#EF553B", "#00cc96", "#ab63fa", "#19d3f3", "#e763fa", "#fecb52", "#ffa15a", "#ff6692", "#b6e880" ], "hovermode": "closest", "colorscale": { "diverging": [ [ 0, "#8e0152" ], [ 0.1, "#c51b7d" ], [ 0.2, "#de77ae" ], [ 0.3, "#f1b6da" ], [ 0.4, "#fde0ef" ], [ 0.5, "#f7f7f7" ], [ 0.6, "#e6f5d0" ], [ 0.7, "#b8e186" ], [ 0.8, "#7fbc41" ], [ 0.9, "#4d9221" ], [ 1, "#276419" ] ], "sequential": [ [ 0, "#0508b8" ], [ 0.0893854748603352, "#1910d8" ], [ 0.1787709497206704, "#3c19f0" ], [ 0.2681564245810056, "#6b1cfb" ], [ 0.3575418994413408, "#981cfd" ], [ 0.44692737430167595, "#bf1cfd" ], [ 0.5363128491620112, "#dd2bfd" ], [ 0.6256983240223464, "#f246fe" ], [ 0.7150837988826816, "#fc67fd" ], [ 0.8044692737430168, "#fe88fc" ], [ 0.8938547486033519, "#fea5fd" ], [ 0.9832402234636871, "#febefe" ], [ 1, "#fec3fe" ] ], "sequentialminus": [ [ 0, "#0508b8" ], [ 0.0893854748603352, "#1910d8" ], [ 0.1787709497206704, "#3c19f0" ], [ 0.2681564245810056, "#6b1cfb" ], [ 0.3575418994413408, "#981cfd" ], [ 0.44692737430167595, "#bf1cfd" ], [ 0.5363128491620112, "#dd2bfd" ], [ 0.6256983240223464, "#f246fe" ], [ 0.7150837988826816, "#fc67fd" ], [ 0.8044692737430168, "#fe88fc" ], [ 0.8938547486033519, "#fea5fd" ], [ 0.9832402234636871, "#febefe" ], [ 1, "#fec3fe" ] ] }, "plot_bgcolor": "white", "paper_bgcolor": "white", "shapedefaults": { "line": { "width": 0 }, "opacity": 0.4, "fillcolor": "#506784" }, "annotationdefaults": { "arrowhead": 0, "arrowcolor": "#506784", "arrowwidth": 1 } }, "themeRef": "PLOTLY_WHITE" } } }, "height": null, "width": null, "user": { "profile_url": "https://chart-studio.plotly.com/~Traber_plot", "avatar_url": "https://storage.googleapis.com/plotly-prod-profiles/45.jpg", "background_url": "https://storage.googleapis.com/plotly-prod-profiles/bg-3.jpg", "bio": "", "nickname": "", "website": "", "stream_tokens": null, "feature_set_id": null, "csrf_token": null, "date_joined": "2025-09-05 07:15:31", "mapbox_access_tokens": null, "has_password": null, "username": "Traber_plot", "email": null, "is_active": null, "readonly": null, "is_dash_creator": null, "dash_created_count": null, "is_chart_creator": null, "charts_created_count": null } }, { "creation_time": "2025-09-05T07:28:49.259481Z", "comments": { "results": [], "count": 0 }, "parented": true, "embed_url": "https://chart-studio.plotly.com/~mabe1558/1.embed", "fid": "mabe1558:1", "filename": "Plot 1", "filetype": "plot", "img_url": "https://storage.googleapis.com/plotly-prod-images/mabe1558/1/9_DVQBGQ4BS8KV03F3GYI068ZASV2X7T.png", "image_urls": { "default": "https://storage.googleapis.com/plotly-prod-images/mabe1558/1/2_P5NXBOI8AAANH7NZFHILBMEAAE8H24.png", "block-thumb": "https://storage.googleapis.com/plotly-prod-images/mabe1558/1/8_17UWNYJTPXHZSP1QNLCLAO1NTF7NE5.png", "list-thumb": "https://storage.googleapis.com/plotly-prod-images/mabe1558/1/9_DVQBGQ4BS8KV03F3GYI068ZASV2X7T.png" }, "api_urls": { "files": "https://api.plotly.com/v2/files/mabe1558:1", "plots": "https://api.plotly.com/v2/plots/mabe1558:1", "parent": "https://api.plotly.com/v2/folders/home?user=mabe1558" }, "owner": "mabe1558", "parent": -1, "preview": "", "referencers": [], "references": [], "title": "", "views": 0, "web_url": "https://chart-studio.plotly.com/~mabe1558/1/", "world_readable": true, "date_modified": "2025-09-05T07:51:28.828Z", "stars": { "results": [], "count": 0 }, "collaborators": { "results": [], "count": 0 }, "subfolder_count": null, "refresh_interval": null, "organize_view_url": "https://chart-studio.plotly.com/~mabe1558/1/", "current_user_permission": "read", "is_theme": null, "is_template": false, "autosize": true, "caption": "", "figure": { "data": [ { "line": { "color": "rgb(67, 73, 67)", "shape": "linear", "width": 12 }, "meta": { "columnNames": { "y": "B" } }, "mode": "markers+lines", "name": "B", "type": "scatter", "ysrc": "mabe1558:0:8f4fb5", "marker": { "line": { "width": 0 }, "size": 40, "color": "rgb(142, 217, 115)", "symbol": "circle" }, "stackgroup": null }, { "line": { "shape": "hv" }, "meta": { "columnNames": { "y": "B" } }, "mode": "markers", "name": "%{meta.columnNames.y}", "type": "bar", "ysrc": "mabe1558:0:8f4fb5", "marker": { "color": "rgb(142, 217, 115)" }, "orientation": "v" }, { "line": { "width": 0 }, "meta": { "columnNames": { "x": "C", "y": "D" } }, "mode": "markers+lines", "name": "%{meta.columnNames.y}", "type": "scatter", "xsrc": "mabe1558:0:f9feee", "ysrc": "mabe1558:0:e9624d", "marker": { "size": 40, "color": "rgb(216, 110, 204)" }, "stackgroup": null }, { "meta": { "columnNames": { "x": "C", "y": "D" } }, "name": "%{meta.columnNames.y}", "type": "bar", "xsrc": "mabe1558:0:f9feee", "ysrc": "mabe1558:0:e9624d", "orientation": "v" } ], "frames": [], "layout": { "xaxis": { "type": "linear", "dtick": 0.5, "range": [ -0.25, 2.75 ], "tick0": 0, "ticks": "", "title": { "font": { "size": 46 }, "text": "" }, "mirror": false, "ticklen": 9, "showgrid": true, "showline": true, "tickfont": { "size": 35 }, "tickmode": "linear", "zeroline": false, "autorange": true, "gridcolor": "rgb(234, 238, 242)", "gridwidth": 10, "linecolor": "rgb(0, 0, 0)", "linewidth": 20, "tickwidth": 8, "showspikes": false, "rangeslider": { "range": [ -0.25, 2.75 ], "yaxis": {}, "visible": false, "autorange": true }, "zerolinewidth": 10, "showticklabels": false, "spikethickness": 37 }, "yaxis": { "type": "linear", "dtick": 1, "range": [ 0, 3.21343677781446 ], "tick0": 0, "ticks": "", "title": { "font": { "size": 46 }, "text": "" }, "mirror": false, "ticklen": 9, "showline": true, "tickfont": { "size": 35 }, "tickmode": "linear", "zeroline": false, "autorange": false, "gridcolor": "rgb(234, 238, 242)", "gridwidth": 10, "linecolor": "rgb(0, 0, 0)", "linewidth": 20, "tickwidth": 8, "showspikes": false, "zerolinewidth": 10, "showticklabels": false }, "bargap": 0.97, "legend": { "font": { "size": 30 }, "title": { "text": "<br>" }, "itemsizing": "constant" }, "barmode": "group", "autosize": true, "template": { "data": { "bar": [ { "type": "bar", "marker": { "colorbar": { "ticks": "", "outlinewidth": 0 } } } ], "table": [ { "type": "table", "cells": { "fill": { "color": "#EBF0F8" }, "line": { "color": "white" } }, "header": { "fill": { "color": "#C8D4E3" }, "line": { "color": "white" } } } ], "carpet": [ { "type": "carpet", "aaxis": { "gridcolor": "#C8D4E3", "linecolor": "#C8D4E3", "endlinecolor": "#2a3f5f", "minorgridcolor": "#C8D4E3", "startlinecolor": "#2a3f5f" }, "baxis": { "gridcolor": "#C8D4E3", "linecolor": "#C8D4E3", "endlinecolor": "#2a3f5f", "minorgridcolor": "#C8D4E3", "startlinecolor": "#2a3f5f" } } ], "mesh3d": [ { "type": "mesh3d", "colorbar": { "ticks": "", "outlinewidth": 0 } } ], "contour": [ { "type": "contour", "colorbar": { "ticks": "", "outlinewidth": 0 }, "autocolorscale": true } ], "heatmap": [ { "type": "heatmap", "colorbar": { "ticks": "", "outlinewidth": 0 }, "autocolorscale": true } ], "scatter": [ { "type": "scatter", "marker": { "colorbar": { "ticks": "", "outlinewidth": 0 } } } ], "surface": [ { "type": "surface", "colorbar": { "ticks": "", "outlinewidth": 0 } } ], "heatmapgl": [ { "type": "heatmapgl", "colorbar": { "ticks": "", "outlinewidth": 0 } } ], "histogram": [ { "type": "histogram", "marker": { "colorbar": { "ticks": "", "outlinewidth": 0 } } } ], "parcoords": [ { "line": { "colorbar": { "ticks": "", "outlinewidth": 0 } }, "type": "parcoords" } ], "scatter3d": [ { "type": "scatter3d", "marker": { "colorbar": { "ticks": "", "outlinewidth": 0 } } } ], "scattergl": [ { "type": "scattergl", "marker": { "colorbar": { "ticks": "", "outlinewidth": 0 } } } ], "choropleth": [ { "type": "choropleth", "colorbar": { "ticks": "", "outlinewidth": 0 } } ], "scattergeo": [ { "type": "scattergeo", "marker": { "colorbar": { "ticks": "", "outlinewidth": 0 } } } ], "histogram2d": [ { "type": "histogram2d", "colorbar": { "ticks": "", "outlinewidth": 0 }, "autocolorscale": true } ], "scatterpolar": [ { "type": "scatterpolar", "marker": { "colorbar": { "ticks": "", "outlinewidth": 0 } } } ], "contourcarpet": [ { "type": "contourcarpet", "colorbar": { "ticks": "", "outlinewidth": 0 } } ], "scattercarpet": [ { "type": "scattercarpet", "marker": { "colorbar": { "ticks": "", "outlinewidth": 0 } } } ], "scattermapbox": [ { "type": "scattermapbox", "marker": { "colorbar": { "ticks": "", "outlinewidth": 0 } } } ], "scatterpolargl": [ { "type": "scatterpolargl", "marker": { "colorbar": { "ticks": "", "outlinewidth": 0 } } } ], "scatterternary": [ { "type": "scatterternary", "marker": { "colorbar": { "ticks": "", "outlinewidth": 0 } } } ], "histogram2dcontour": [ { "type": "histogram2dcontour", "colorbar": { "ticks": "", "outlinewidth": 0 }, "autocolorscale": true } ] }, "layout": { "geo": { "bgcolor": "white", "showland": true, "lakecolor": "white", "landcolor": "white", "showlakes": true, "subunitcolor": "#C8D4E3" }, "font": { "color": "#2a3f5f" }, "polar": { "bgcolor": "white", "radialaxis": { "ticks": "", "gridcolor": "#EBF0F8", "linecolor": "#EBF0F8" }, "angularaxis": { "ticks": "", "gridcolor": "#EBF0F8", "linecolor": "#EBF0F8" } }, "scene": { "xaxis": { "ticks": "", "gridcolor": "#DFE8F3", "gridwidth": 2, "linecolor": "#EBF0F8", "zerolinecolor": "#EBF0F8", "showbackground": true, "backgroundcolor": "white" }, "yaxis": { "ticks": "", "gridcolor": "#DFE8F3", "gridwidth": 2, "linecolor": "#EBF0F8", "zerolinecolor": "#EBF0F8", "showbackground": true, "backgroundcolor": "white" }, "zaxis": { "ticks": "", "gridcolor": "#DFE8F3", "gridwidth": 2, "linecolor": "#EBF0F8", "zerolinecolor": "#EBF0F8", "showbackground": true, "backgroundcolor": "white" } }, "title": { "x": 0.05 }, "xaxis": { "ticks": "", "gridcolor": "#EBF0F8", "linecolor": "#EBF0F8", "automargin": true, "zerolinecolor": "#EBF0F8", "zerolinewidth": 2 }, "yaxis": { "ticks": "", "gridcolor": "#EBF0F8", "linecolor": "#EBF0F8", "automargin": true, "zerolinecolor": "#EBF0F8", "zerolinewidth": 2 }, "ternary": { "aaxis": { "ticks": "", "gridcolor": "#DFE8F3", "linecolor": "#A2B1C6" }, "baxis": { "ticks": "", "gridcolor": "#DFE8F3", "linecolor": "#A2B1C6" }, "caxis": { "ticks": "", "gridcolor": "#DFE8F3", "linecolor": "#A2B1C6" }, "bgcolor": "white" }, "colorway": [ "#636efa", "#EF553B", "#00cc96", "#ab63fa", "#19d3f3", "#e763fa", "#fecb52", "#ffa15a", "#ff6692", "#b6e880" ], "hovermode": "closest", "colorscale": { "diverging": [ [ 0, "#8e0152" ], [ 0.1, "#c51b7d" ], [ 0.2, "#de77ae" ], [ 0.3, "#f1b6da" ], [ 0.4, "#fde0ef" ], [ 0.5, "#f7f7f7" ], [ 0.6, "#e6f5d0" ], [ 0.7, "#b8e186" ], [ 0.8, "#7fbc41" ], [ 0.9, "#4d9221" ], [ 1, "#276419" ] ], "sequential": [ [ 0, "#0508b8" ], [ 0.0893854748603352, "#1910d8" ], [ 0.1787709497206704, "#3c19f0" ], [ 0.2681564245810056, "#6b1cfb" ], [ 0.3575418994413408, "#981cfd" ], [ 0.44692737430167595, "#bf1cfd" ], [ 0.5363128491620112, "#dd2bfd" ], [ 0.6256983240223464, "#f246fe" ], [ 0.7150837988826816, "#fc67fd" ], [ 0.8044692737430168, "#fe88fc" ], [ 0.8938547486033519, "#fea5fd" ], [ 0.9832402234636871, "#febefe" ], [ 1, "#fec3fe" ] ], "sequentialminus": [ [ 0, "#0508b8" ], [ 0.0893854748603352, "#1910d8" ], [ 0.1787709497206704, "#3c19f0" ], [ 0.2681564245810056, "#6b1cfb" ], [ 0.3575418994413408, "#981cfd" ], [ 0.44692737430167595, "#bf1cfd" ], [ 0.5363128491620112, "#dd2bfd" ], [ 0.6256983240223464, "#f246fe" ], [ 0.7150837988826816, "#fc67fd" ], [ 0.8044692737430168, "#fe88fc" ], [ 0.8938547486033519, "#fea5fd" ], [ 0.9832402234636871, "#febefe" ], [ 1, "#fec3fe" ] ] }, "plot_bgcolor": "white", "paper_bgcolor": "white", "shapedefaults": { "line": { "width": 0 }, "opacity": 0.4, "fillcolor": "#506784" }, "annotationdefaults": { "arrowhead": 0, "arrowcolor": "#506784", "arrowwidth": 1 } }, "themeRef": "PLOTLY_WHITE" }, "showlegend": false } }, "height": null, "width": null, "user": { "profile_url": "https://chart-studio.plotly.com/~mabe1558", "avatar_url": "https://storage.googleapis.com/plotly-prod-profiles/59.jpg", "background_url": "https://storage.googleapis.com/plotly-prod-profiles/bg-4.jpg", "bio": "", "nickname": "", "website": "", "stream_tokens": null, "feature_set_id": null, "csrf_token": null, "date_joined": "2025-09-05 07:27:41", "mapbox_access_tokens": null, "has_password": null, "username": "mabe1558", "email": null, "is_active": null, "readonly": null, "is_dash_creator": null, "dash_created_count": null, "is_chart_creator": null, "charts_created_count": null } }, { "creation_time": "2025-09-05T07:20:14.619657Z", "comments": { "results": [], "count": 0 }, "parented": true, "embed_url": "https://chart-studio.plotly.com/~Traber_plot/1.embed", "fid": "Traber_plot:1", "filename": "Plot 1", "filetype": "plot", "img_url": "https://storage.googleapis.com/plotly-prod-images/Traber_plot/1/9_G7NV4YS356NFDOORK1T66HPUJXNHQ2.png", "image_urls": { "default": "https://storage.googleapis.com/plotly-prod-images/Traber_plot/1/2_6GGL7I5RJK07UCOVXWRF27RHFQDSPM.png", "block-thumb": "https://storage.googleapis.com/plotly-prod-images/Traber_plot/1/8_1Z9SMDBPMX9ORY7EE4ADWDA1DK06JH.png", "list-thumb": "https://storage.googleapis.com/plotly-prod-images/Traber_plot/1/9_G7NV4YS356NFDOORK1T66HPUJXNHQ2.png" }, "api_urls": { "files": "https://api.plotly.com/v2/files/Traber_plot:1", "plots": "https://api.plotly.com/v2/plots/Traber_plot:1", "parent": "https://api.plotly.com/v2/folders/home?user=Traber_plot" }, "owner": "Traber_plot", "parent": -1, "preview": "", "referencers": [], "references": [], "title": "", "views": 0, "web_url": "https://chart-studio.plotly.com/~Traber_plot/1/", "world_readable": true, "date_modified": "2025-09-05T07:20:14.632Z", "stars": { "results": [], "count": 0 }, "collaborators": { "results": [], "count": 0 }, "subfolder_count": null, "refresh_interval": null, "organize_view_url": "https://chart-studio.plotly.com/~Traber_plot/1/", "current_user_permission": "read", "is_theme": null, "is_template": false, "autosize": true, "caption": "", "figure": { "data": [ { "meta": { "columnNames": { "x": "Datum", "y": "Preis" } }, "mode": "lines", "name": "%{meta.columnNames.y}", "type": "scatter", "xsrc": "Traber_plot:0:95fc63", "ysrc": "Traber_plot:0:646c45", "yaxis": "y2", "stackgroup": null }, { "meta": { "columnNames": { "x": "Datum", "y": "Wert S1" } }, "mode": "lines", "name": "%{meta.columnNames.y}", "type": "scatter", "xsrc": "Traber_plot:0:95fc63", "ysrc": "Traber_plot:0:7e4bcd", "stackgroup": null }, { "meta": { "columnNames": { "x": "Datum", "y": "Gespart S2" } }, "mode": "lines", "name": "%{meta.columnNames.y}", "type": "scatter", "xsrc": "Traber_plot:0:95fc63", "ysrc": "Traber_plot:0:6f3ec6", "stackgroup": null }, { "meta": { "columnNames": { "x": "Datum", "y": "Wert S2" } }, "mode": "lines", "name": "%{meta.columnNames.y}", "type": "scatter", "xsrc": "Traber_plot:0:95fc63", "ysrc": "Traber_plot:0:18a9dc", "stackgroup": null } ], "frames": [], "layout": { "xaxis": { "type": "category", "range": [ 0, 4999 ], "autorange": true }, "yaxis": { "type": "linear", "range": [ -10704.09918347778, 212769.77637807778 ], "title": { "text": "Wert Portfolio" }, "autorange": true }, "yaxis2": { "side": "right", "type": "linear", "range": [ 601.9166666666666, 2335.5833333333335 ], "title": { "text": "Höhe MSCI WORLD" }, "autorange": true, "overlaying": "y" }, "autosize": true, "template": { "data": { "bar": [ { "type": "bar", "marker": { "colorbar": { "ticks": "", "outlinewidth": 0 } } } ], "table": [ { "type": "table", "cells": { "fill": { "color": "#EBF0F8" }, "line": { "color": "white" } }, "header": { "fill": { "color": "#C8D4E3" }, "line": { "color": "white" } } } ], "carpet": [ { "type": "carpet", "aaxis": { "gridcolor": "#C8D4E3", "linecolor": "#C8D4E3", "endlinecolor": "#2a3f5f", "minorgridcolor": "#C8D4E3", "startlinecolor": "#2a3f5f" }, "baxis": { "gridcolor": "#C8D4E3", "linecolor": "#C8D4E3", "endlinecolor": "#2a3f5f", "minorgridcolor": "#C8D4E3", "startlinecolor": "#2a3f5f" } } ], "mesh3d": [ { "type": "mesh3d", "colorbar": { "ticks": "", "outlinewidth": 0 } } ], "contour": [ { "type": "contour", "colorbar": { "ticks": "", "outlinewidth": 0 }, "autocolorscale": true } ], "heatmap": [ { "type": "heatmap", "colorbar": { "ticks": "", "outlinewidth": 0 }, "autocolorscale": true } ], "scatter": [ { "type": "scatter", "marker": { "colorbar": { "ticks": "", "outlinewidth": 0 } } } ], "surface": [ { "type": "surface", "colorbar": { "ticks": "", "outlinewidth": 0 } } ], "heatmapgl": [ { "type": "heatmapgl", "colorbar": { "ticks": "", "outlinewidth": 0 } } ], "histogram": [ { "type": "histogram", "marker": { "colorbar": { "ticks": "", "outlinewidth": 0 } } } ], "parcoords": [ { "line": { "colorbar": { "ticks": "", "outlinewidth": 0 } }, "type": "parcoords" } ], "scatter3d": [ { "type": "scatter3d", "marker": { "colorbar": { "ticks": "", "outlinewidth": 0 } } } ], "scattergl": [ { "type": "scattergl", "marker": { "colorbar": { "ticks": "", "outlinewidth": 0 } } } ], "choropleth": [ { "type": "choropleth", "colorbar": { "ticks": "", "outlinewidth": 0 } } ], "scattergeo": [ { "type": "scattergeo", "marker": { "colorbar": { "ticks": "", "outlinewidth": 0 } } } ], "histogram2d": [ { "type": "histogram2d", "colorbar": { "ticks": "", "outlinewidth": 0 }, "autocolorscale": true } ], "scatterpolar": [ { "type": "scatterpolar", "marker": { "colorbar": { "ticks": "", "outlinewidth": 0 } } } ], "contourcarpet": [ { "type": "contourcarpet", "colorbar": { "ticks": "", "outlinewidth": 0 } } ], "scattercarpet": [ { "type": "scattercarpet", "marker": { "colorbar": { "ticks": "", "outlinewidth": 0 } } } ], "scattermapbox": [ { "type": "scattermapbox", "marker": { "colorbar": { "ticks": "", "outlinewidth": 0 } } } ], "scatterpolargl": [ { "type": "scatterpolargl", "marker": { "colorbar": { "ticks": "", "outlinewidth": 0 } } } ], "scatterternary": [ { "type": "scatterternary", "marker": { "colorbar": { "ticks": "", "outlinewidth": 0 } } } ], "histogram2dcontour": [ { "type": "histogram2dcontour", "colorbar": { "ticks": "", "outlinewidth": 0 }, "autocolorscale": true } ] }, "layout": { "geo": { "bgcolor": "white", "showland": true, "lakecolor": "white", "landcolor": "white", "showlakes": true, "subunitcolor": "#C8D4E3" }, "font": { "color": "#2a3f5f" }, "polar": { "bgcolor": "white", "radialaxis": { "ticks": "", "gridcolor": "#EBF0F8", "linecolor": "#EBF0F8" }, "angularaxis": { "ticks": "", "gridcolor": "#EBF0F8", "linecolor": "#EBF0F8" } }, "scene": { "xaxis": { "ticks": "", "gridcolor": "#DFE8F3", "gridwidth": 2, "linecolor": "#EBF0F8", "zerolinecolor": "#EBF0F8", "showbackground": true, "backgroundcolor": "white" }, "yaxis": { "ticks": "", "gridcolor": "#DFE8F3", "gridwidth": 2, "linecolor": "#EBF0F8", "zerolinecolor": "#EBF0F8", "showbackground": true, "backgroundcolor": "white" }, "zaxis": { "ticks": "", "gridcolor": "#DFE8F3", "gridwidth": 2, "linecolor": "#EBF0F8", "zerolinecolor": "#EBF0F8", "showbackground": true, "backgroundcolor": "white" } }, "title": { "x": 0.05 }, "xaxis": { "ticks": "", "gridcolor": "#EBF0F8", "linecolor": "#EBF0F8", "automargin": true, "zerolinecolor": "#EBF0F8", "zerolinewidth": 2 }, "yaxis": { "ticks": "", "gridcolor": "#EBF0F8", "linecolor": "#EBF0F8", "automargin": true, "zerolinecolor": "#EBF0F8", "zerolinewidth": 2 }, "ternary": { "aaxis": { "ticks": "", "gridcolor": "#DFE8F3", "linecolor": "#A2B1C6" }, "baxis": { "ticks": "", "gridcolor": "#DFE8F3", "linecolor": "#A2B1C6" }, "caxis": { "ticks": "", "gridcolor": "#DFE8F3", "linecolor": "#A2B1C6" }, "bgcolor": "white" }, "colorway": [ "#636efa", "#EF553B", "#00cc96", "#ab63fa", "#19d3f3", "#e763fa", "#fecb52", "#ffa15a", "#ff6692", "#b6e880" ], "hovermode": "closest", "colorscale": { "diverging": [ [ 0, "#8e0152" ], [ 0.1, "#c51b7d" ], [ 0.2, "#de77ae" ], [ 0.3, "#f1b6da" ], [ 0.4, "#fde0ef" ], [ 0.5, "#f7f7f7" ], [ 0.6, "#e6f5d0" ], [ 0.7, "#b8e186" ], [ 0.8, "#7fbc41" ], [ 0.9, "#4d9221" ], [ 1, "#276419" ] ], "sequential": [ [ 0, "#0508b8" ], [ 0.0893854748603352, "#1910d8" ], [ 0.1787709497206704, "#3c19f0" ], [ 0.2681564245810056, "#6b1cfb" ], [ 0.3575418994413408, "#981cfd" ], [ 0.44692737430167595, "#bf1cfd" ], [ 0.5363128491620112, "#dd2bfd" ], [ 0.6256983240223464, "#f246fe" ], [ 0.7150837988826816, "#fc67fd" ], [ 0.8044692737430168, "#fe88fc" ], [ 0.8938547486033519, "#fea5fd" ], [ 0.9832402234636871, "#febefe" ], [ 1, "#fec3fe" ] ], "sequentialminus": [ [ 0, "#0508b8" ], [ 0.0893854748603352, "#1910d8" ], [ 0.1787709497206704, "#3c19f0" ], [ 0.2681564245810056, "#6b1cfb" ], [ 0.3575418994413408, "#981cfd" ], [ 0.44692737430167595, "#bf1cfd" ], [ 0.5363128491620112, "#dd2bfd" ], [ 0.6256983240223464, "#f246fe" ], [ 0.7150837988826816, "#fc67fd" ], [ 0.8044692737430168, "#fe88fc" ], [ 0.8938547486033519, "#fea5fd" ], [ 0.9832402234636871, "#febefe" ], [ 1, "#fec3fe" ] ] }, "plot_bgcolor": "white", "paper_bgcolor": "white", "shapedefaults": { "line": { "width": 0 }, "opacity": 0.4, "fillcolor": "#506784" }, "annotationdefaults": { "arrowhead": 0, "arrowcolor": "#506784", "arrowwidth": 1 } }, "themeRef": "PLOTLY_WHITE" } } }, "height": null, "width": null, "user": { "profile_url": "https://chart-studio.plotly.com/~Traber_plot", "avatar_url": "https://storage.googleapis.com/plotly-prod-profiles/45.jpg", "background_url": "https://storage.googleapis.com/plotly-prod-profiles/bg-3.jpg", "bio": "", "nickname": "", "website": "", "stream_tokens": null, "feature_set_id": null, "csrf_token": null, "date_joined": "2025-09-05 07:15:31", "mapbox_access_tokens": null, "has_password": null, "username": "Traber_plot", "email": null, "is_active": null, "readonly": null, "is_dash_creator": null, "dash_created_count": null, "is_chart_creator": null, "charts_created_count": null } } ] }