Plots List
Plots
This endpoint handles manipulation of Plotly plot files.
Reference
Authorization
Any user with or without a Plotly account may view public plots. For private plots, see authentication.
Actions
list
Listing all public plots can be done via a GET request to this endpoint.
By default, plots will be listed in order of date created. The order_by
query parameter is accepted at this endpoint. Currently, only ordering by
views is supported. It is possible to filter the plots by quality
with min_quality or max_quality as query parameter.
Example:
// GET https://api.plotly.com/v2/plots/ ---> 200

// GET https://api.plotly.com/v2/plots/?order_by=-views ---> 200

// GET https://api.plotly.com/v2/plots/?min_quality=5 ---> 200

// GET https://api.plotly.com/v2/plots/?max_quality=5 ---> 200
feed
Listing all handpicked feed plots can be done via a GET request to this endpoint. By default, plots will be listed in a random order.
Example:
// GET https://api.plotly.com/v2/plots/feed ---> 200
create
You can create new plot resources here. The only required field is 'figure'. Currently, the figure is restricted to only contain references to grid data. That is, this will fail if raw data arrays are passed in. To create and manipulate underlying grids for plots, see the grids endpoint.
Example:
// This fails because a figure field is required.
// POST https://api.plotly.com/v2/plots ---> 400 Bad Request
{}

// This fails because the figure has raw data
//POST https://api.plotly.com/v2/plots ---> 400 Bad Request
{
    "figure": {"data": [{"y": ['this', 'is', 'raw', 'data']}]}
}

// This succeeds because the figure has src keys, not raw data.
//POST https://api.plotly.com/v2/plots ---> 200 OK
{
    "figure": {"data": [{"ysrc": "sven:88:u8nd62"}]}
}
When creating a grid, you can optionally specify a source_fid to specify where a plot has come from:
- source_fid: the fid of a plot that was copied (and presumably edited) to produce this one
detail
There is a lot of meta information stored about plot files including filename, title, share_url, and content_url to name a few.
This information can only be reached with a GET to this endpoint.
Example:
// GET https://api.plotly.com/v2/plots/iheartgraphs:90
content
The contents of a plot can be downloaded via the content resource. The plot
content contains referenced grid/column data by default. If you wish to
return the raw grid/column data, the inline_data=true query must be included
in the request url. The Content-Type header will be appropriately set for the
response body.
Alternatively, you can set ?map_data=unreadable to append a mapping of
sources to data that belongs to grids which are unreadable for the
requestor. This is useful when you have read access to another users plot,
but that plot contains grid references which you don't have access to.
Examples:
// Returns referenced grid/column data
// GET https://api.plotly.com/v2/plots/iheartgraphs:90/content ---> 200 OK

// Returns full grid/column data
// GET https://api.plotly.com/v2/plots/iheartgraphs:90/content?inline_data=true ---> 200 OK

// Returns full grid/column data when requestor doesn't have permission
// to read the referenced grid.
// GET https://api.plotly.com/v2/plots/iheartgraphs:90/content?map_data=unreadable ---> 200 OK
GET /v2/plots?cursor=cj0xJnA9MjAyNS0wOS0xNSswOSUzQTQ0JTNBMTAuNTU4MTYzJTJCMDAlM0EwMA%3D%3D&format=api
{ "next": "https://api.plotly.com/v2/plots?cursor=cD0yMDI1LTA5LTE1KzA5JTNBNTAlM0EyNi44MTE0NDElMkIwMCUzQTAw&format=api", "previous": "https://api.plotly.com/v2/plots?cursor=cj0xJnA9MjAyNS0wOS0xNSsxMCUzQTU5JTNBNTkuNjI1MzgzJTJCMDAlM0EwMA%3D%3D&format=api", "results": [ { "creation_time": "2025-09-15T10:59:59.625383Z", "comments": { "results": [], "count": 0 }, "parented": true, "embed_url": "https://chart-studio.plotly.com/~srivallijanani_04/5.embed", "fid": "srivallijanani_04:5", "filename": "plot 3", "filetype": "plot", "img_url": "https://storage.googleapis.com/plotly-prod-images/srivallijanani_04/5/9_7A95IHKSDZFYQXT9WQQG1F5GQ3RBY6.png", "image_urls": { "default": "https://storage.googleapis.com/plotly-prod-images/srivallijanani_04/5/2_HD2LDCJR4DLYJ9AW2AIHA1NGERML1V.png", "block-thumb": "https://storage.googleapis.com/plotly-prod-images/srivallijanani_04/5/8_QTWZQCQ4ZYVC81F1BCZ6T31KVKNR3R.png", "list-thumb": "https://storage.googleapis.com/plotly-prod-images/srivallijanani_04/5/9_7A95IHKSDZFYQXT9WQQG1F5GQ3RBY6.png" }, "api_urls": { "files": "https://api.plotly.com/v2/files/srivallijanani_04:5", "plots": "https://api.plotly.com/v2/plots/srivallijanani_04:5", "parent": "https://api.plotly.com/v2/folders/home?user=srivallijanani_04" }, "owner": "srivallijanani_04", "parent": -1, "preview": "", "referencers": [], "references": [], "title": "", "views": 0, "web_url": "https://chart-studio.plotly.com/~srivallijanani_04/5/", "world_readable": true, "date_modified": "2025-09-15T10:59:59.636Z", "stars": { "results": [], "count": 0 }, "collaborators": { "results": [], "count": 0 }, "subfolder_count": null, "refresh_interval": null, "organize_view_url": "https://chart-studio.plotly.com/~srivallijanani_04/5/", "current_user_permission": "read", "is_theme": null, "is_template": false, "autosize": true, "caption": "", "figure": { "data": [ { "meta": { "columnNames": { "x": "x", "y": "y" } }, "mode": "lines", "type": "scatter", "xsrc": "srivallijanani_04:4:592c21", "ysrc": "srivallijanani_04:4:63427a" } ], "frames": [], "layout": { "xaxis": { "type": "date", "range": [ "2025-02-14 12:57:54", "2025-02-21 23:51:48" ], "autorange": true }, "yaxis": { "type": "linear", "range": [ 147813.06347074348, 261788.49137219848 ], "autorange": true }, "autosize": true } }, "height": null, "width": null, "user": { "profile_url": "https://chart-studio.plotly.com/~srivallijanani_04", "avatar_url": "https://storage.googleapis.com/plotly-prod-profiles/25.jpg", "background_url": "https://storage.googleapis.com/plotly-prod-profiles/bg-3.jpg", "bio": "", "nickname": "", "website": "", "stream_tokens": null, "feature_set_id": null, "csrf_token": null, "date_joined": "2025-09-15 10:07:23", "mapbox_access_tokens": null, "has_password": null, "username": "srivallijanani_04", "email": null, "is_active": null, "readonly": null, "is_dash_creator": null, "dash_created_count": null, "is_chart_creator": null, "charts_created_count": null } }, { "creation_time": "2025-09-15T10:57:43.483711Z", "comments": { "results": [], "count": 0 }, "parented": true, "embed_url": "https://chart-studio.plotly.com/~abhishek.karn025/89.embed", "fid": "abhishek.karn025:89", "filename": "us-patents-–-flow-export-test-57933753-20250915_162739", "filetype": "plot", "img_url": "https://storage.googleapis.com/plotly-prod-images/abhishek.karn025/89/9_07P1WU8F2CYFPYUK9CP96W6NC3J9WK.png", "image_urls": { "default": "https://storage.googleapis.com/plotly-prod-images/abhishek.karn025/89/2_ZX7EQ1Q307QEHQ60ZOOWM4LSNSR51Z.png", "block-thumb": "https://storage.googleapis.com/plotly-prod-images/abhishek.karn025/89/8_WEXRUXRBRE189RR9G5H9QOE3B6YMS9.png", "list-thumb": "https://storage.googleapis.com/plotly-prod-images/abhishek.karn025/89/9_07P1WU8F2CYFPYUK9CP96W6NC3J9WK.png" }, "api_urls": { "files": "https://api.plotly.com/v2/files/abhishek.karn025:89", "plots": "https://api.plotly.com/v2/plots/abhishek.karn025:89", "parent": "https://api.plotly.com/v2/folders/home?user=abhishek.karn025" }, "owner": "abhishek.karn025", "parent": -1, "preview": "", "referencers": [], "references": [], "title": "", "views": 0, "web_url": "https://chart-studio.plotly.com/~abhishek.karn025/89/", "world_readable": true, "date_modified": "2025-09-15T10:57:43.494Z", "stars": { "results": [], "count": 0 }, "collaborators": { "results": [], "count": 0 }, "subfolder_count": null, "refresh_interval": null, "organize_view_url": "https://chart-studio.plotly.com/~abhishek.karn025/89/", "current_user_permission": "read", "is_theme": null, "is_template": null, "autosize": true, "caption": "", "figure": { "data": [ { "y": { "bdata": "CAYEAwMCAgICAgICAQEBAQEBAQEBAQEBAQEBAQEBAQEBAQEBAQEBAQEBAQEBAQEBAQEBAQEBAQEBAQEBAQEBAQEBAQEBAQEB", "dtype": "i1" }, "name": "", "type": "bar", "xsrc": "abhishek.karn025:88:2f76b3", "xaxis": "x", "yaxis": "y", "marker": { "color": "#636efa", "pattern": { "shape": "" } }, "showlegend": false, "legendgroup": "", "offsetgroup": "", "orientation": "v", "textposition": "auto", "hovertemplate": "assignee_organization=%{x}<br>patent_id=%{y}<extra></extra>", "alignmentgroup": "True" }, { "x": { "bdata": "AAAAAADgbkAAAAAAAMB/QAAAAAAAIGpAAAAAAAAAQkAAAAAAAMBiQAAAAAAAkHdAAAAAAADAWkAAAAAAAICDQAAAAAAAwF9AAAAAAABgeEAAAAAAAIB1QAAAAAAAsHNAAAAAAABAXEAAAAAAAIBaQAAAAAAAgFpAAAAAAAAASUAAAAAAAAB9QAAAAAAA8IJAAAAAAAAgaUAAAAAAAAAYQAAAAAAAoHxAAAAAAAAAWUAAAAAAAIB2QAAAAAAAAGRAAAAAAABAakAAAAAAAGBxQAAAAAAAAF1AAAAAAABAaUAAAAAAAMBbQAAAAAAAwG9AAAAAAABQcEAAAAAAAOBiQAAAAAAAAGZAAAAAAACQckAAAAAAAEBfQAAAAAAAAGBAAAAAAACARUAAAAAAAADwPwAAAAAAYGtAAAAAAABQhUAAAAAAADCAQAAAAAAAgEBAAAAAAACAaEAAAAAAAECBQAAAAAAAQGlAAAAAAAAgfkAAAAAAAAA9QAAAAAAAoIBAAAAAAADAX0AAAAAAAKB1QAAAAAAA8I1AAAAAAADQdUAAAAAAABB7QAAAAAAAUHNAAAAAAABoj0AAAAAAAOiAQAAAAAAAMHBAAAAAAACAXkAAAAAAAGBqQAAAAAAAADFAAAAAAACwckAAAAAAAABBQAAAAAAAwGFAAAAAAAAALkA=", "dtype": "f8" }, "name": "", "type": "histogram", "xaxis": "x2", "yaxis": "y2", "marker": { "color": "#636efa", "pattern": { "shape": "" } }, "nbinsx": 20, "bingroup": "x", "histfunc": "count", "showlegend": false, "legendgroup": "", "offsetgroup": "", "orientation": "v", "hovertemplate": "patent_term_extension=%{x}<br>count=%{y}<extra></extra>", "alignmentgroup": "True" }, { "hole": 0, "name": "", "type": "pie", "domain": { "x": [ 0.0, 0.5018181818181818 ], "y": [ 0.0, 0.4 ] }, "values": { "bdata": "ZA==", "dtype": "i1" }, "labelssrc": "abhishek.karn025:88:ef9564", "showlegend": true, "legendgroup": "", "hovertemplate": "patent_type=%{label}<br>count=%{value}<extra></extra>" } ], "layout": { "title": { "x": 0.5, "font": { "size": 22 }, "text": "US Patents – Flow Export Test", "xanchor": "center" }, "width": 1180, "xaxis": { "anchor": "y", "domain": [ 0.0, 0.5018181818181818 ] }, "yaxis": { "anchor": "x", "domain": [ 0.6000000000000001, 1.0 ] }, "height": 1240, "legend": { "x": 0.5, "y": -0.1, "xanchor": "center", "yanchor": "top", "orientation": "h" }, "margin": { "b": 110, "l": 70, "r": 40, "t": 96 }, "xaxis2": { "anchor": "y2", "domain": [ 0.5818181818181818, 1.0 ] }, "xaxis3": { "anchor": "y3", "domain": [ 0.5818181818181818, 1.0 ] }, "yaxis2": { "anchor": "x2", "domain": [ 0.6000000000000001, 1.0 ] }, "yaxis3": { "anchor": "x3", "domain": [ 0.0, 0.4 ] }, "template": { "data": { "bar": [ { "type": "bar", "marker": { "line": { "color": "white", "width": 0.5 }, "pattern": { "size": 10, "fillmode": "overlay", "solidity": 0.2 } }, "error_x": { "color": "#2a3f5f" }, "error_y": { "color": "#2a3f5f" } } ], "pie": [ { "type": "pie", "automargin": true } ], "table": [ { "type": "table", "cells": { "fill": { "color": "#EBF0F8" }, "line": { "color": "white" } }, "header": { "fill": { "color": "#C8D4E3" }, "line": { "color": "white" } } } ], "carpet": [ { "type": "carpet", "aaxis": { "gridcolor": "#C8D4E3", "linecolor": "#C8D4E3", "endlinecolor": "#2a3f5f", "minorgridcolor": "#C8D4E3", "startlinecolor": "#2a3f5f" }, "baxis": { "gridcolor": "#C8D4E3", "linecolor": "#C8D4E3", "endlinecolor": "#2a3f5f", "minorgridcolor": "#C8D4E3", "startlinecolor": "#2a3f5f" } } ], "mesh3d": [ { "type": "mesh3d", "colorbar": { "ticks": "", "outlinewidth": 0 } } ], "contour": [ { "type": "contour", "colorbar": { "ticks": "", "outlinewidth": 0 }, "colorscale": [ [ 0.0, "#0d0887" ], [ 0.1111111111111111, "#46039f" ], [ 0.2222222222222222, "#7201a8" ], [ 0.3333333333333333, "#9c179e" ], [ 0.4444444444444444, "#bd3786" ], [ 0.5555555555555556, "#d8576b" ], [ 0.6666666666666666, "#ed7953" ], [ 0.7777777777777778, "#fb9f3a" ], [ 0.8888888888888888, "#fdca26" ], [ 1.0, "#f0f921" ] ] } ], "heatmap": [ { "type": "heatmap", "colorbar": { "ticks": "", "outlinewidth": 0 }, "colorscale": [ [ 0.0, "#0d0887" ], [ 0.1111111111111111, "#46039f" ], [ 0.2222222222222222, "#7201a8" ], [ 0.3333333333333333, "#9c179e" ], [ 0.4444444444444444, "#bd3786" ], [ 0.5555555555555556, "#d8576b" ], [ 0.6666666666666666, "#ed7953" ], [ 0.7777777777777778, "#fb9f3a" ], [ 0.8888888888888888, "#fdca26" ], [ 1.0, "#f0f921" ] ] } ], "scatter": [ { "type": "scatter", "fillpattern": { "size": 10, "fillmode": "overlay", "solidity": 0.2 } } ], "surface": [ { "type": "surface", "colorbar": { "ticks": "", "outlinewidth": 0 }, "colorscale": [ [ 0.0, "#0d0887" ], [ 0.1111111111111111, "#46039f" ], [ 0.2222222222222222, "#7201a8" ], [ 0.3333333333333333, "#9c179e" ], [ 0.4444444444444444, "#bd3786" ], [ 0.5555555555555556, "#d8576b" ], [ 0.6666666666666666, "#ed7953" ], [ 0.7777777777777778, "#fb9f3a" ], [ 0.8888888888888888, "#fdca26" ], [ 1.0, "#f0f921" ] ] } ], "barpolar": [ { "type": "barpolar", "marker": { "line": { "color": "white", "width": 0.5 }, "pattern": { "size": 10, "fillmode": "overlay", "solidity": 0.2 } } } ], "histogram": [ { "type": "histogram", "marker": { "pattern": { "size": 10, "fillmode": "overlay", "solidity": 0.2 } } } ], "parcoords": [ { "line": { "colorbar": { "ticks": "", "outlinewidth": 0 } }, "type": "parcoords" } ], "scatter3d": [ { "line": { "colorbar": { "ticks": "", "outlinewidth": 0 } }, "type": "scatter3d", "marker": { "colorbar": { "ticks": "", "outlinewidth": 0 } } } ], "scattergl": [ { "type": "scattergl", "marker": { "colorbar": { "ticks": "", "outlinewidth": 0 } } } ], "choropleth": [ { "type": "choropleth", "colorbar": { "ticks": "", "outlinewidth": 0 } } ], "scattergeo": [ { "type": "scattergeo", "marker": { "colorbar": { "ticks": "", "outlinewidth": 0 } } } ], "scattermap": [ { "type": "scattermap", "marker": { "colorbar": { "ticks": "", "outlinewidth": 0 } } } ], "histogram2d": [ { "type": "histogram2d", "colorbar": { "ticks": "", "outlinewidth": 0 }, "colorscale": [ [ 0.0, "#0d0887" ], [ 0.1111111111111111, "#46039f" ], [ 0.2222222222222222, "#7201a8" ], [ 0.3333333333333333, "#9c179e" ], [ 0.4444444444444444, "#bd3786" ], [ 0.5555555555555556, "#d8576b" ], [ 0.6666666666666666, "#ed7953" ], [ 0.7777777777777778, "#fb9f3a" ], [ 0.8888888888888888, "#fdca26" ], [ 1.0, "#f0f921" ] ] } ], "scatterpolar": [ { "type": "scatterpolar", "marker": { "colorbar": { "ticks": "", "outlinewidth": 0 } } } ], "contourcarpet": [ { "type": "contourcarpet", "colorbar": { "ticks": "", "outlinewidth": 0 } } ], "scattercarpet": [ { "type": "scattercarpet", "marker": { "colorbar": { "ticks": "", "outlinewidth": 0 } } } ], "scattermapbox": [ { "type": "scattermapbox", "marker": { "colorbar": { "ticks": "", "outlinewidth": 0 } } } ], "scatterpolargl": [ { "type": "scatterpolargl", "marker": { "colorbar": { "ticks": "", "outlinewidth": 0 } } } ], "scatterternary": [ { "type": "scatterternary", "marker": { "colorbar": { "ticks": "", "outlinewidth": 0 } } } ], "histogram2dcontour": [ { "type": "histogram2dcontour", "colorbar": { "ticks": "", "outlinewidth": 0 }, "colorscale": [ [ 0.0, "#0d0887" ], [ 0.1111111111111111, "#46039f" ], [ 0.2222222222222222, "#7201a8" ], [ 0.3333333333333333, "#9c179e" ], [ 0.4444444444444444, "#bd3786" ], [ 0.5555555555555556, "#d8576b" ], [ 0.6666666666666666, "#ed7953" ], [ 0.7777777777777778, "#fb9f3a" ], [ 0.8888888888888888, "#fdca26" ], [ 1.0, "#f0f921" ] ] } ] }, "layout": { "geo": { "bgcolor": "white", "showland": true, "lakecolor": "white", "landcolor": "white", "showlakes": true, "subunitcolor": "#C8D4E3" }, "font": { "color": "#2a3f5f" }, "polar": { "bgcolor": "white", "radialaxis": { "ticks": "", "gridcolor": "#EBF0F8", "linecolor": "#EBF0F8" }, "angularaxis": { "ticks": "", "gridcolor": "#EBF0F8", "linecolor": "#EBF0F8" } }, "scene": { "xaxis": { "ticks": "", "gridcolor": "#DFE8F3", "gridwidth": 2, "linecolor": "#EBF0F8", "zerolinecolor": "#EBF0F8", "showbackground": true, "backgroundcolor": "white" }, "yaxis": { "ticks": "", "gridcolor": "#DFE8F3", "gridwidth": 2, "linecolor": "#EBF0F8", "zerolinecolor": "#EBF0F8", "showbackground": true, "backgroundcolor": "white" }, "zaxis": { "ticks": "", "gridcolor": "#DFE8F3", "gridwidth": 2, "linecolor": "#EBF0F8", "zerolinecolor": "#EBF0F8", "showbackground": true, "backgroundcolor": "white" } }, "title": { "x": 0.05 }, "xaxis": { "ticks": "", "title": { "standoff": 15 }, "gridcolor": "#EBF0F8", "linecolor": "#EBF0F8", "automargin": true, "zerolinecolor": "#EBF0F8", "zerolinewidth": 2 }, "yaxis": { "ticks": "", "title": { "standoff": 15 }, "gridcolor": "#EBF0F8", "linecolor": "#EBF0F8", "automargin": true, "zerolinecolor": "#EBF0F8", "zerolinewidth": 2 }, "mapbox": { "style": "light" }, "ternary": { "aaxis": { "ticks": "", "gridcolor": "#DFE8F3", "linecolor": "#A2B1C6" }, "baxis": { "ticks": "", "gridcolor": "#DFE8F3", "linecolor": "#A2B1C6" }, "caxis": { "ticks": "", "gridcolor": "#DFE8F3", "linecolor": "#A2B1C6" }, "bgcolor": "white" }, "colorway": [ "#636efa", "#EF553B", "#00cc96", "#ab63fa", "#FFA15A", "#19d3f3", "#FF6692", "#B6E880", "#FF97FF", "#FECB52" ], "coloraxis": { "colorbar": { "ticks": "", "outlinewidth": 0 } }, "hovermode": "closest", "colorscale": { "diverging": [ [ 0, "#8e0152" ], [ 0.1, "#c51b7d" ], [ 0.2, "#de77ae" ], [ 0.3, "#f1b6da" ], [ 0.4, "#fde0ef" ], [ 0.5, "#f7f7f7" ], [ 0.6, "#e6f5d0" ], [ 0.7, "#b8e186" ], [ 0.8, "#7fbc41" ], [ 0.9, "#4d9221" ], [ 1, "#276419" ] ], "sequential": [ [ 0.0, "#0d0887" ], [ 0.1111111111111111, "#46039f" ], [ 0.2222222222222222, "#7201a8" ], [ 0.3333333333333333, "#9c179e" ], [ 0.4444444444444444, "#bd3786" ], [ 0.5555555555555556, "#d8576b" ], [ 0.6666666666666666, "#ed7953" ], [ 0.7777777777777778, "#fb9f3a" ], [ 0.8888888888888888, "#fdca26" ], [ 1.0, "#f0f921" ] ], "sequentialminus": [ [ 0.0, "#0d0887" ], [ 0.1111111111111111, "#46039f" ], [ 0.2222222222222222, "#7201a8" ], [ 0.3333333333333333, "#9c179e" ], [ 0.4444444444444444, "#bd3786" ], [ 0.5555555555555556, "#d8576b" ], [ 0.6666666666666666, "#ed7953" ], [ 0.7777777777777778, "#fb9f3a" ], [ 0.8888888888888888, "#fdca26" ], [ 1.0, "#f0f921" ] ] }, "hoverlabel": { "align": "left" }, "plot_bgcolor": "white", "paper_bgcolor": "white", "shapedefaults": { "line": { "color": "#2a3f5f" } }, "autotypenumbers": "strict", "annotationdefaults": { "arrowhead": 0, "arrowcolor": "#2a3f5f", "arrowwidth": 1 } } }, "showlegend": true, "annotations": [ { "x": 0.2509090909090909, "y": 1.0, "font": { "size": 15 }, "text": "Number of Patents by Assignee Organization", "xref": "paper", "yref": "paper", "yshift": 12, "xanchor": "center", "yanchor": "bottom", "showarrow": false }, { "x": 0.7909090909090909, "y": 1.0, "font": { "size": 15 }, "text": "Distribution of Patent Term Extension", "xref": "paper", "yref": "paper", "yshift": 12, "xanchor": "center", "yanchor": "bottom", "showarrow": false }, { "x": 0.2509090909090909, "y": 0.4, "font": { "size": 15 }, "text": "Patent Types", "xref": "paper", "yref": "paper", "yshift": 12, "xanchor": "center", "yanchor": "bottom", "showarrow": false } ] } }, "height": 1240, "width": 1180, "user": { "profile_url": "https://chart-studio.plotly.com/~abhishek.karn025", "avatar_url": "https://storage.googleapis.com/plotly-prod-profiles/8.jpg", "background_url": "https://storage.googleapis.com/plotly-prod-profiles/bg-4.jpg", "bio": "", "nickname": "", "website": "", "stream_tokens": null, "feature_set_id": null, "csrf_token": null, "date_joined": "2025-08-19 08:26:37", "mapbox_access_tokens": null, "has_password": null, "username": "abhishek.karn025", "email": null, "is_active": null, "readonly": null, "is_dash_creator": null, "dash_created_count": null, "is_chart_creator": null, "charts_created_count": null } }, { "creation_time": "2025-09-15T10:50:19.034825Z", "comments": { "results": [], "count": 0 }, "parented": true, "embed_url": "https://chart-studio.plotly.com/~srivallijanani_04/3.embed", "fid": "srivallijanani_04:3", "filename": "plot1", "filetype": "plot", "img_url": "https://storage.googleapis.com/plotly-prod-images/srivallijanani_04/3/9_X3VALDYGLBOZQJG3CW2PM960SYQ6S0.png", "image_urls": { "default": "https://storage.googleapis.com/plotly-prod-images/srivallijanani_04/3/2_9GQ09ONQ2LVZXOTIQG0UVYIMR7FJN7.png", "block-thumb": "https://storage.googleapis.com/plotly-prod-images/srivallijanani_04/3/8_JIBCRPNVIPD4QLM5URZ46E2D7A3JPU.png", "list-thumb": "https://storage.googleapis.com/plotly-prod-images/srivallijanani_04/3/9_X3VALDYGLBOZQJG3CW2PM960SYQ6S0.png" }, "api_urls": { "files": "https://api.plotly.com/v2/files/srivallijanani_04:3", "plots": "https://api.plotly.com/v2/plots/srivallijanani_04:3", "parent": "https://api.plotly.com/v2/folders/home?user=srivallijanani_04" }, "owner": "srivallijanani_04", "parent": -1, "preview": "", "referencers": [], "references": [], "title": "", "views": 0, "web_url": "https://chart-studio.plotly.com/~srivallijanani_04/3/", "world_readable": true, "date_modified": "2025-09-15T10:50:19.046Z", "stars": { "results": [], "count": 0 }, "collaborators": { "results": [], "count": 0 }, "subfolder_count": null, "refresh_interval": null, "organize_view_url": "https://chart-studio.plotly.com/~srivallijanani_04/3/", "current_user_permission": "read", "is_theme": null, "is_template": false, "autosize": true, "caption": "", "figure": { "data": [ { "meta": { "columnNames": { "x": "x", "y": "y" } }, "mode": "lines", "type": "scatter", "xsrc": "srivallijanani_04:2:06a5ba", "ysrc": "srivallijanani_04:2:9c0789" } ], "frames": [], "layout": { "xaxis": { "type": "date", "range": [ "2025-01-31 12:41:06", "2025-02-07 23:47:19" ], "autorange": true }, "yaxis": { "type": "linear", "range": [ 141413.539234197, 262292.8668638235 ], "autorange": true }, "autosize": true } }, "height": null, "width": null, "user": { "profile_url": "https://chart-studio.plotly.com/~srivallijanani_04", "avatar_url": "https://storage.googleapis.com/plotly-prod-profiles/25.jpg", "background_url": "https://storage.googleapis.com/plotly-prod-profiles/bg-3.jpg", "bio": "", "nickname": "", "website": "", "stream_tokens": null, "feature_set_id": null, "csrf_token": null, "date_joined": "2025-09-15 10:07:23", "mapbox_access_tokens": null, "has_password": null, "username": "srivallijanani_04", "email": null, "is_active": null, "readonly": null, "is_dash_creator": null, "dash_created_count": null, "is_chart_creator": null, "charts_created_count": null } }, { "creation_time": "2025-09-15T10:45:42.427148Z", "comments": { "results": [], "count": 0 }, "parented": true, "embed_url": "https://chart-studio.plotly.com/~abhishek.karn025/87.embed", "fid": "abhishek.karn025:87", "filename": "us-patents-–-flow-export-test-57933031-20250915_161538", "filetype": "plot", "img_url": "https://storage.googleapis.com/plotly-prod-images/abhishek.karn025/87/9_JB3XADS22SNTHITM4065C065XRUCCV.png", "image_urls": { "default": "https://storage.googleapis.com/plotly-prod-images/abhishek.karn025/87/2_CWPKKD7QW5ZRO1QFMIMI7XG94S18QZ.png", "block-thumb": "https://storage.googleapis.com/plotly-prod-images/abhishek.karn025/87/8_61UQRNEES6JF7B1WOPAJW2SE2JT2WC.png", "list-thumb": "https://storage.googleapis.com/plotly-prod-images/abhishek.karn025/87/9_JB3XADS22SNTHITM4065C065XRUCCV.png" }, "api_urls": { "files": "https://api.plotly.com/v2/files/abhishek.karn025:87", "plots": "https://api.plotly.com/v2/plots/abhishek.karn025:87", "parent": "https://api.plotly.com/v2/folders/home?user=abhishek.karn025" }, "owner": "abhishek.karn025", "parent": -1, "preview": "", "referencers": [], "references": [], "title": "", "views": 0, "web_url": "https://chart-studio.plotly.com/~abhishek.karn025/87/", "world_readable": true, "date_modified": "2025-09-15T10:45:42.440Z", "stars": { "results": [], "count": 0 }, "collaborators": { "results": [], "count": 0 }, "subfolder_count": null, "refresh_interval": null, "organize_view_url": "https://chart-studio.plotly.com/~abhishek.karn025/87/", "current_user_permission": "read", "is_theme": null, "is_template": null, "autosize": true, "caption": "", "figure": { "data": [ { "y": { "bdata": "AQEBAQEBAQEBAQEBAQEBAQEBAQEBAQEBAQEBAQEBAQEBAQEBAQEBAQEBAQEBAQEBAQEBAQEBAQEBAQEBAQEBAQEBAQEBAQEB", "dtype": "i1" }, "name": "", "type": "bar", "xsrc": "abhishek.karn025:86:f479a4", "xaxis": "x", "yaxis": "y", "marker": { "color": "#636efa", "pattern": { "shape": "" } }, "showlegend": false, "legendgroup": "", "offsetgroup": "", "orientation": "v", "textposition": "auto", "hovertemplate": "assignee_organization=%{x}<br>value=%{y}<extra></extra>", "alignmentgroup": "True" }, { "x": { "bdata": "AAAAAADgbkAAAAAAAMB/QAAAAAAAIGpAAAAAAAAAQkAAAAAAAMBiQAAAAAAAkHdAAAAAAADAWkAAAAAAAICDQAAAAAAAwF9AAAAAAABgeEAAAAAAAIB1QAAAAAAAsHNAAAAAAABAXEAAAAAAAIBaQAAAAAAAgFpAAAAAAAAASUAAAAAAAAB9QAAAAAAA8IJAAAAAAAAgaUAAAAAAAAAYQAAAAAAAoHxAAAAAAAAAWUAAAAAAAIB2QAAAAAAAAGRAAAAAAABAakAAAAAAAGBxQAAAAAAAAF1AAAAAAABAaUAAAAAAAMBbQAAAAAAAwG9AAAAAAABQcEAAAAAAAOBiQAAAAAAAAGZAAAAAAACQckAAAAAAAEBfQAAAAAAAAGBAAAAAAACARUAAAAAAAADwPwAAAAAAYGtAAAAAAABQhUAAAAAAADCAQAAAAAAAgEBAAAAAAACAaEAAAAAAAECBQAAAAAAAQGlAAAAAAAAgfkAAAAAAAAA9QAAAAAAAoIBAAAAAAADAX0AAAAAAAKB1QAAAAAAA8I1AAAAAAADQdUAAAAAAABB7QAAAAAAAUHNAAAAAAABoj0AAAAAAAOiAQAAAAAAAMHBAAAAAAACAXkAAAAAAAGBqQAAAAAAAADFAAAAAAACwckAAAAAAAABBQAAAAAAAwGFAAAAAAAAALkA=", "dtype": "f8" }, "name": "", "type": "histogram", "xaxis": "x2", "yaxis": "y2", "marker": { "color": "#636efa", "pattern": { "shape": "" } }, "nbinsx": 20, "bingroup": "x", "histfunc": "count", "showlegend": false, "legendgroup": "", "offsetgroup": "", "orientation": "v", "hovertemplate": "patent_term_extension=%{x}<br>count=%{y}<extra></extra>", "alignmentgroup": "True" }, { "hole": 0, "name": "", "type": "pie", "domain": { "x": [ 0.0, 0.5018181818181818 ], "y": [ 0.0, 0.4 ] }, "values": { "bdata": "ZA==", "dtype": "i1" }, "labelssrc": "abhishek.karn025:86:713db9", "showlegend": true, "legendgroup": "", "hovertemplate": "patent_type=%{label}<br>count=%{value}<extra></extra>" } ], "layout": { "title": { "x": 0.5, "font": { "size": 22 }, "text": "US Patents – Flow Export Test", "xanchor": "center" }, "width": 1180, "xaxis": { "anchor": "y", "domain": [ 0.0, 0.5018181818181818 ] }, "yaxis": { "anchor": "x", "domain": [ 0.6000000000000001, 1.0 ] }, "height": 1240, "legend": { "x": 0.5, "y": -0.1, "xanchor": "center", "yanchor": "top", "orientation": "h" }, "margin": { "b": 110, "l": 70, "r": 40, "t": 96 }, "xaxis2": { "anchor": "y2", "domain": [ 0.5818181818181818, 1.0 ] }, "xaxis3": { "anchor": "y3", "domain": [ 0.5818181818181818, 1.0 ] }, "yaxis2": { "anchor": "x2", "domain": [ 0.6000000000000001, 1.0 ] }, "yaxis3": { "anchor": "x3", "domain": [ 0.0, 0.4 ] }, "template": { "data": { "bar": [ { "type": "bar", "marker": { "line": { "color": "white", "width": 0.5 }, "pattern": { "size": 10, "fillmode": "overlay", "solidity": 0.2 } }, "error_x": { "color": "#2a3f5f" }, "error_y": { "color": "#2a3f5f" } } ], "pie": [ { "type": "pie", "automargin": true } ], "table": [ { "type": "table", "cells": { "fill": { "color": "#EBF0F8" }, "line": { "color": "white" } }, "header": { "fill": { "color": "#C8D4E3" }, "line": { "color": "white" } } } ], "carpet": [ { "type": "carpet", "aaxis": { "gridcolor": "#C8D4E3", "linecolor": "#C8D4E3", "endlinecolor": "#2a3f5f", "minorgridcolor": "#C8D4E3", "startlinecolor": "#2a3f5f" }, "baxis": { "gridcolor": "#C8D4E3", "linecolor": "#C8D4E3", "endlinecolor": "#2a3f5f", "minorgridcolor": "#C8D4E3", "startlinecolor": "#2a3f5f" } } ], "mesh3d": [ { "type": "mesh3d", "colorbar": { "ticks": "", "outlinewidth": 0 } } ], "contour": [ { "type": "contour", "colorbar": { "ticks": "", "outlinewidth": 0 }, "colorscale": [ [ 0.0, "#0d0887" ], [ 0.1111111111111111, "#46039f" ], [ 0.2222222222222222, "#7201a8" ], [ 0.3333333333333333, "#9c179e" ], [ 0.4444444444444444, "#bd3786" ], [ 0.5555555555555556, "#d8576b" ], [ 0.6666666666666666, "#ed7953" ], [ 0.7777777777777778, "#fb9f3a" ], [ 0.8888888888888888, "#fdca26" ], [ 1.0, "#f0f921" ] ] } ], "heatmap": [ { "type": "heatmap", "colorbar": { "ticks": "", "outlinewidth": 0 }, "colorscale": [ [ 0.0, "#0d0887" ], [ 0.1111111111111111, "#46039f" ], [ 0.2222222222222222, "#7201a8" ], [ 0.3333333333333333, "#9c179e" ], [ 0.4444444444444444, "#bd3786" ], [ 0.5555555555555556, "#d8576b" ], [ 0.6666666666666666, "#ed7953" ], [ 0.7777777777777778, "#fb9f3a" ], [ 0.8888888888888888, "#fdca26" ], [ 1.0, "#f0f921" ] ] } ], "scatter": [ { "type": "scatter", "fillpattern": { "size": 10, "fillmode": "overlay", "solidity": 0.2 } } ], "surface": [ { "type": "surface", "colorbar": { "ticks": "", "outlinewidth": 0 }, "colorscale": [ [ 0.0, "#0d0887" ], [ 0.1111111111111111, "#46039f" ], [ 0.2222222222222222, "#7201a8" ], [ 0.3333333333333333, "#9c179e" ], [ 0.4444444444444444, "#bd3786" ], [ 0.5555555555555556, "#d8576b" ], [ 0.6666666666666666, "#ed7953" ], [ 0.7777777777777778, "#fb9f3a" ], [ 0.8888888888888888, "#fdca26" ], [ 1.0, "#f0f921" ] ] } ], "barpolar": [ { "type": "barpolar", "marker": { "line": { "color": "white", "width": 0.5 }, "pattern": { "size": 10, "fillmode": "overlay", "solidity": 0.2 } } } ], "histogram": [ { "type": "histogram", "marker": { "pattern": { "size": 10, "fillmode": "overlay", "solidity": 0.2 } } } ], "parcoords": [ { "line": { "colorbar": { "ticks": "", "outlinewidth": 0 } }, "type": "parcoords" } ], "scatter3d": [ { "line": { "colorbar": { "ticks": "", "outlinewidth": 0 } }, "type": "scatter3d", "marker": { "colorbar": { "ticks": "", "outlinewidth": 0 } } } ], "scattergl": [ { "type": "scattergl", "marker": { "colorbar": { "ticks": "", "outlinewidth": 0 } } } ], "choropleth": [ { "type": "choropleth", "colorbar": { "ticks": "", "outlinewidth": 0 } } ], "scattergeo": [ { "type": "scattergeo", "marker": { "colorbar": { "ticks": "", "outlinewidth": 0 } } } ], "scattermap": [ { "type": "scattermap", "marker": { "colorbar": { "ticks": "", "outlinewidth": 0 } } } ], "histogram2d": [ { "type": "histogram2d", "colorbar": { "ticks": "", "outlinewidth": 0 }, "colorscale": [ [ 0.0, "#0d0887" ], [ 0.1111111111111111, "#46039f" ], [ 0.2222222222222222, "#7201a8" ], [ 0.3333333333333333, "#9c179e" ], [ 0.4444444444444444, "#bd3786" ], [ 0.5555555555555556, "#d8576b" ], [ 0.6666666666666666, "#ed7953" ], [ 0.7777777777777778, "#fb9f3a" ], [ 0.8888888888888888, "#fdca26" ], [ 1.0, "#f0f921" ] ] } ], "scatterpolar": [ { "type": "scatterpolar", "marker": { "colorbar": { "ticks": "", "outlinewidth": 0 } } } ], "contourcarpet": [ { "type": "contourcarpet", "colorbar": { "ticks": "", "outlinewidth": 0 } } ], "scattercarpet": [ { "type": "scattercarpet", "marker": { "colorbar": { "ticks": "", "outlinewidth": 0 } } } ], "scattermapbox": [ { "type": "scattermapbox", "marker": { "colorbar": { "ticks": "", "outlinewidth": 0 } } } ], "scatterpolargl": [ { "type": "scatterpolargl", "marker": { "colorbar": { "ticks": "", "outlinewidth": 0 } } } ], "scatterternary": [ { "type": "scatterternary", "marker": { "colorbar": { "ticks": "", "outlinewidth": 0 } } } ], "histogram2dcontour": [ { "type": "histogram2dcontour", "colorbar": { "ticks": "", "outlinewidth": 0 }, "colorscale": [ [ 0.0, "#0d0887" ], [ 0.1111111111111111, "#46039f" ], [ 0.2222222222222222, "#7201a8" ], [ 0.3333333333333333, "#9c179e" ], [ 0.4444444444444444, "#bd3786" ], [ 0.5555555555555556, "#d8576b" ], [ 0.6666666666666666, "#ed7953" ], [ 0.7777777777777778, "#fb9f3a" ], [ 0.8888888888888888, "#fdca26" ], [ 1.0, "#f0f921" ] ] } ] }, "layout": { "geo": { "bgcolor": "white", "showland": true, "lakecolor": "white", "landcolor": "white", "showlakes": true, "subunitcolor": "#C8D4E3" }, "font": { "color": "#2a3f5f" }, "polar": { "bgcolor": "white", "radialaxis": { "ticks": "", "gridcolor": "#EBF0F8", "linecolor": "#EBF0F8" }, "angularaxis": { "ticks": "", "gridcolor": "#EBF0F8", "linecolor": "#EBF0F8" } }, "scene": { "xaxis": { "ticks": "", "gridcolor": "#DFE8F3", "gridwidth": 2, "linecolor": "#EBF0F8", "zerolinecolor": "#EBF0F8", "showbackground": true, "backgroundcolor": "white" }, "yaxis": { "ticks": "", "gridcolor": "#DFE8F3", "gridwidth": 2, "linecolor": "#EBF0F8", "zerolinecolor": "#EBF0F8", "showbackground": true, "backgroundcolor": "white" }, "zaxis": { "ticks": "", "gridcolor": "#DFE8F3", "gridwidth": 2, "linecolor": "#EBF0F8", "zerolinecolor": "#EBF0F8", "showbackground": true, "backgroundcolor": "white" } }, "title": { "x": 0.05 }, "xaxis": { "ticks": "", "title": { "standoff": 15 }, "gridcolor": "#EBF0F8", "linecolor": "#EBF0F8", "automargin": true, "zerolinecolor": "#EBF0F8", "zerolinewidth": 2 }, "yaxis": { "ticks": "", "title": { "standoff": 15 }, "gridcolor": "#EBF0F8", "linecolor": "#EBF0F8", "automargin": true, "zerolinecolor": "#EBF0F8", "zerolinewidth": 2 }, "mapbox": { "style": "light" }, "ternary": { "aaxis": { "ticks": "", "gridcolor": "#DFE8F3", "linecolor": "#A2B1C6" }, "baxis": { "ticks": "", "gridcolor": "#DFE8F3", "linecolor": "#A2B1C6" }, "caxis": { "ticks": "", "gridcolor": "#DFE8F3", "linecolor": "#A2B1C6" }, "bgcolor": "white" }, "colorway": [ "#636efa", "#EF553B", "#00cc96", "#ab63fa", "#FFA15A", "#19d3f3", "#FF6692", "#B6E880", "#FF97FF", "#FECB52" ], "coloraxis": { "colorbar": { "ticks": "", "outlinewidth": 0 } }, "hovermode": "closest", "colorscale": { "diverging": [ [ 0, "#8e0152" ], [ 0.1, "#c51b7d" ], [ 0.2, "#de77ae" ], [ 0.3, "#f1b6da" ], [ 0.4, "#fde0ef" ], [ 0.5, "#f7f7f7" ], [ 0.6, "#e6f5d0" ], [ 0.7, "#b8e186" ], [ 0.8, "#7fbc41" ], [ 0.9, "#4d9221" ], [ 1, "#276419" ] ], "sequential": [ [ 0.0, "#0d0887" ], [ 0.1111111111111111, "#46039f" ], [ 0.2222222222222222, "#7201a8" ], [ 0.3333333333333333, "#9c179e" ], [ 0.4444444444444444, "#bd3786" ], [ 0.5555555555555556, "#d8576b" ], [ 0.6666666666666666, "#ed7953" ], [ 0.7777777777777778, "#fb9f3a" ], [ 0.8888888888888888, "#fdca26" ], [ 1.0, "#f0f921" ] ], "sequentialminus": [ [ 0.0, "#0d0887" ], [ 0.1111111111111111, "#46039f" ], [ 0.2222222222222222, "#7201a8" ], [ 0.3333333333333333, "#9c179e" ], [ 0.4444444444444444, "#bd3786" ], [ 0.5555555555555556, "#d8576b" ], [ 0.6666666666666666, "#ed7953" ], [ 0.7777777777777778, "#fb9f3a" ], [ 0.8888888888888888, "#fdca26" ], [ 1.0, "#f0f921" ] ] }, "hoverlabel": { "align": "left" }, "plot_bgcolor": "white", "paper_bgcolor": "white", "shapedefaults": { "line": { "color": "#2a3f5f" } }, "autotypenumbers": "strict", "annotationdefaults": { "arrowhead": 0, "arrowcolor": "#2a3f5f", "arrowwidth": 1 } } }, "showlegend": true, "annotations": [ { "x": 0.2509090909090909, "y": 1.0, "font": { "size": 15 }, "text": "Patent Count by Assignee Organization", "xref": "paper", "yref": "paper", "yshift": 12, "xanchor": "center", "yanchor": "bottom", "showarrow": false }, { "x": 0.7909090909090909, "y": 1.0, "font": { "size": 15 }, "text": "Distribution of Patent Term Extensions", "xref": "paper", "yref": "paper", "yshift": 12, "xanchor": "center", "yanchor": "bottom", "showarrow": false }, { "x": 0.2509090909090909, "y": 0.4, "font": { "size": 15 }, "text": "Patent Type Distribution", "xref": "paper", "yref": "paper", "yshift": 12, "xanchor": "center", "yanchor": "bottom", "showarrow": false } ] } }, "height": 1240, "width": 1180, "user": { "profile_url": "https://chart-studio.plotly.com/~abhishek.karn025", "avatar_url": "https://storage.googleapis.com/plotly-prod-profiles/8.jpg", "background_url": "https://storage.googleapis.com/plotly-prod-profiles/bg-4.jpg", "bio": "", "nickname": "", "website": "", "stream_tokens": null, "feature_set_id": null, "csrf_token": null, "date_joined": "2025-08-19 08:26:37", "mapbox_access_tokens": null, "has_password": null, "username": "abhishek.karn025", "email": null, "is_active": null, "readonly": null, "is_dash_creator": null, "dash_created_count": null, "is_chart_creator": null, "charts_created_count": null } }, { "creation_time": "2025-09-15T10:31:39.093477Z", "comments": { "results": [], "count": 0 }, "parented": true, "embed_url": "https://chart-studio.plotly.com/~abhishek.karn025/85.embed", "fid": "abhishek.karn025:85", "filename": "us-patents-–-flow-export-test-57932177-20250915_160135", "filetype": "plot", "img_url": "https://storage.googleapis.com/plotly-prod-images/abhishek.karn025/85/9_HIOF7A14VICF3O16DZKCN32SJM0VK8.png", "image_urls": { "default": "https://storage.googleapis.com/plotly-prod-images/abhishek.karn025/85/2_81HVC1Z9E9HNRYWJ7CU53YUUUJ36MD.png", "block-thumb": "https://storage.googleapis.com/plotly-prod-images/abhishek.karn025/85/8_B500751AOBVPM6VLSOMUTE7KICYUHK.png", "list-thumb": "https://storage.googleapis.com/plotly-prod-images/abhishek.karn025/85/9_HIOF7A14VICF3O16DZKCN32SJM0VK8.png" }, "api_urls": { "files": "https://api.plotly.com/v2/files/abhishek.karn025:85", "plots": "https://api.plotly.com/v2/plots/abhishek.karn025:85", "parent": "https://api.plotly.com/v2/folders/home?user=abhishek.karn025" }, "owner": "abhishek.karn025", "parent": -1, "preview": "", "referencers": [], "references": [], "title": "", "views": 1, "web_url": "https://chart-studio.plotly.com/~abhishek.karn025/85/", "world_readable": true, "date_modified": "2025-09-15T10:31:39.106Z", "stars": { "results": [], "count": 0 }, "collaborators": { "results": [], "count": 0 }, "subfolder_count": null, "refresh_interval": null, "organize_view_url": "https://chart-studio.plotly.com/~abhishek.karn025/85/", "current_user_permission": "read", "is_theme": null, "is_template": null, "autosize": true, "caption": "", "figure": { "data": [ { "y": { "bdata": "AQEBAQEBAQEBAQEBAQEBAQEBAQEBAQEBAQEBAQEBAQEBAQEBAQEBAQEBAQEBAQEBAQEBAQEBAQEBAQEBAQEBAQEBAQEBAQEB", "dtype": "i1" }, "name": "", "type": "bar", "xsrc": "abhishek.karn025:84:567836", "xaxis": "x", "yaxis": "y", "marker": { "color": "#636efa", "pattern": { "shape": "" } }, "showlegend": false, "legendgroup": "", "offsetgroup": "", "orientation": "v", "textposition": "auto", "hovertemplate": "assignee_organization=%{x}<br>value=%{y}<extra></extra>", "alignmentgroup": "True" }, { "x": { "bdata": "AAAAAADgbkAAAAAAAMB/QAAAAAAAIGpAAAAAAAAAQkAAAAAAAMBiQAAAAAAAkHdAAAAAAADAWkAAAAAAAICDQAAAAAAAwF9AAAAAAABgeEAAAAAAAIB1QAAAAAAAsHNAAAAAAABAXEAAAAAAAIBaQAAAAAAAgFpAAAAAAAAASUAAAAAAAAB9QAAAAAAA8IJAAAAAAAAgaUAAAAAAAAAYQAAAAAAAoHxAAAAAAAAAWUAAAAAAAIB2QAAAAAAAAGRAAAAAAABAakAAAAAAAGBxQAAAAAAAAF1AAAAAAABAaUAAAAAAAMBbQAAAAAAAwG9AAAAAAABQcEAAAAAAAOBiQAAAAAAAAGZAAAAAAACQckAAAAAAAEBfQAAAAAAAAGBAAAAAAACARUAAAAAAAADwPwAAAAAAYGtAAAAAAABQhUAAAAAAADCAQAAAAAAAgEBAAAAAAACAaEAAAAAAAECBQAAAAAAAQGlAAAAAAAAgfkAAAAAAAAA9QAAAAAAAoIBAAAAAAADAX0AAAAAAAKB1QAAAAAAA8I1AAAAAAADQdUAAAAAAABB7QAAAAAAAUHNAAAAAAABoj0AAAAAAAOiAQAAAAAAAMHBAAAAAAACAXkAAAAAAAGBqQAAAAAAAADFAAAAAAACwckAAAAAAAABBQAAAAAAAwGFAAAAAAAAALkA=", "dtype": "f8" }, "name": "", "type": "histogram", "xaxis": "x2", "yaxis": "y2", "marker": { "color": "#636efa", "pattern": { "shape": "" } }, "nbinsx": 20, "bingroup": "x", "histfunc": "count", "showlegend": false, "legendgroup": "", "offsetgroup": "", "orientation": "v", "hovertemplate": "patent_term_extension=%{x}<br>count=%{y}<extra></extra>", "alignmentgroup": "True" }, { "hole": 0, "name": "", "type": "pie", "domain": { "x": [ 0.0, 0.5018181818181818 ], "y": [ 0.0, 0.4 ] }, "values": { "bdata": "ZA==", "dtype": "i1" }, "labelssrc": "abhishek.karn025:84:c5bded", "showlegend": true, "legendgroup": "", "hovertemplate": "patent_type=%{label}<br>count=%{value}<extra></extra>" } ], "layout": { "title": { "x": 0.5, "font": { "size": 22 }, "text": "US Patents – Flow Export Test", "xanchor": "center" }, "width": 1180, "xaxis": { "anchor": "y", "domain": [ 0.0, 0.5018181818181818 ] }, "yaxis": { "anchor": "x", "domain": [ 0.6000000000000001, 1.0 ] }, "height": 1240, "legend": { "x": 0.5, "y": -0.1, "xanchor": "center", "yanchor": "top", "orientation": "h" }, "margin": { "b": 110, "l": 70, "r": 40, "t": 96 }, "xaxis2": { "anchor": "y2", "domain": [ 0.5818181818181818, 1.0 ] }, "xaxis3": { "anchor": "y3", "domain": [ 0.5818181818181818, 1.0 ] }, "yaxis2": { "anchor": "x2", "domain": [ 0.6000000000000001, 1.0 ] }, "yaxis3": { "anchor": "x3", "domain": [ 0.0, 0.4 ] }, "template": { "data": { "bar": [ { "type": "bar", "marker": { "line": { "color": "white", "width": 0.5 }, "pattern": { "size": 10, "fillmode": "overlay", "solidity": 0.2 } }, "error_x": { "color": "#2a3f5f" }, "error_y": { "color": "#2a3f5f" } } ], "pie": [ { "type": "pie", "automargin": true } ], "table": [ { "type": "table", "cells": { "fill": { "color": "#EBF0F8" }, "line": { "color": "white" } }, "header": { "fill": { "color": "#C8D4E3" }, "line": { "color": "white" } } } ], "carpet": [ { "type": "carpet", "aaxis": { "gridcolor": "#C8D4E3", "linecolor": "#C8D4E3", "endlinecolor": "#2a3f5f", "minorgridcolor": "#C8D4E3", "startlinecolor": "#2a3f5f" }, "baxis": { "gridcolor": "#C8D4E3", "linecolor": "#C8D4E3", "endlinecolor": "#2a3f5f", "minorgridcolor": "#C8D4E3", "startlinecolor": "#2a3f5f" } } ], "mesh3d": [ { "type": "mesh3d", "colorbar": { "ticks": "", "outlinewidth": 0 } } ], "contour": [ { "type": "contour", "colorbar": { "ticks": "", "outlinewidth": 0 }, "colorscale": [ [ 0.0, "#0d0887" ], [ 0.1111111111111111, "#46039f" ], [ 0.2222222222222222, "#7201a8" ], [ 0.3333333333333333, "#9c179e" ], [ 0.4444444444444444, "#bd3786" ], [ 0.5555555555555556, "#d8576b" ], [ 0.6666666666666666, "#ed7953" ], [ 0.7777777777777778, "#fb9f3a" ], [ 0.8888888888888888, "#fdca26" ], [ 1.0, "#f0f921" ] ] } ], "heatmap": [ { "type": "heatmap", "colorbar": { "ticks": "", "outlinewidth": 0 }, "colorscale": [ [ 0.0, "#0d0887" ], [ 0.1111111111111111, "#46039f" ], [ 0.2222222222222222, "#7201a8" ], [ 0.3333333333333333, "#9c179e" ], [ 0.4444444444444444, "#bd3786" ], [ 0.5555555555555556, "#d8576b" ], [ 0.6666666666666666, "#ed7953" ], [ 0.7777777777777778, "#fb9f3a" ], [ 0.8888888888888888, "#fdca26" ], [ 1.0, "#f0f921" ] ] } ], "scatter": [ { "type": "scatter", "fillpattern": { "size": 10, "fillmode": "overlay", "solidity": 0.2 } } ], "surface": [ { "type": "surface", "colorbar": { "ticks": "", "outlinewidth": 0 }, "colorscale": [ [ 0.0, "#0d0887" ], [ 0.1111111111111111, "#46039f" ], [ 0.2222222222222222, "#7201a8" ], [ 0.3333333333333333, "#9c179e" ], [ 0.4444444444444444, "#bd3786" ], [ 0.5555555555555556, "#d8576b" ], [ 0.6666666666666666, "#ed7953" ], [ 0.7777777777777778, "#fb9f3a" ], [ 0.8888888888888888, "#fdca26" ], [ 1.0, "#f0f921" ] ] } ], "barpolar": [ { "type": "barpolar", "marker": { "line": { "color": "white", "width": 0.5 }, "pattern": { "size": 10, "fillmode": "overlay", "solidity": 0.2 } } } ], "histogram": [ { "type": "histogram", "marker": { "pattern": { "size": 10, "fillmode": "overlay", "solidity": 0.2 } } } ], "parcoords": [ { "line": { "colorbar": { "ticks": "", "outlinewidth": 0 } }, "type": "parcoords" } ], "scatter3d": [ { "line": { "colorbar": { "ticks": "", "outlinewidth": 0 } }, "type": "scatter3d", "marker": { "colorbar": { "ticks": "", "outlinewidth": 0 } } } ], "scattergl": [ { "type": "scattergl", "marker": { "colorbar": { "ticks": "", "outlinewidth": 0 } } } ], "choropleth": [ { "type": "choropleth", "colorbar": { "ticks": "", "outlinewidth": 0 } } ], "scattergeo": [ { "type": "scattergeo", "marker": { "colorbar": { "ticks": "", "outlinewidth": 0 } } } ], "scattermap": [ { "type": "scattermap", "marker": { "colorbar": { "ticks": "", "outlinewidth": 0 } } } ], "histogram2d": [ { "type": "histogram2d", "colorbar": { "ticks": "", "outlinewidth": 0 }, "colorscale": [ [ 0.0, "#0d0887" ], [ 0.1111111111111111, "#46039f" ], [ 0.2222222222222222, "#7201a8" ], [ 0.3333333333333333, "#9c179e" ], [ 0.4444444444444444, "#bd3786" ], [ 0.5555555555555556, "#d8576b" ], [ 0.6666666666666666, "#ed7953" ], [ 0.7777777777777778, "#fb9f3a" ], [ 0.8888888888888888, "#fdca26" ], [ 1.0, "#f0f921" ] ] } ], "scatterpolar": [ { "type": "scatterpolar", "marker": { "colorbar": { "ticks": "", "outlinewidth": 0 } } } ], "contourcarpet": [ { "type": "contourcarpet", "colorbar": { "ticks": "", "outlinewidth": 0 } } ], "scattercarpet": [ { "type": "scattercarpet", "marker": { "colorbar": { "ticks": "", "outlinewidth": 0 } } } ], "scattermapbox": [ { "type": "scattermapbox", "marker": { "colorbar": { "ticks": "", "outlinewidth": 0 } } } ], "scatterpolargl": [ { "type": "scatterpolargl", "marker": { "colorbar": { "ticks": "", "outlinewidth": 0 } } } ], "scatterternary": [ { "type": "scatterternary", "marker": { "colorbar": { "ticks": "", "outlinewidth": 0 } } } ], "histogram2dcontour": [ { "type": "histogram2dcontour", "colorbar": { "ticks": "", "outlinewidth": 0 }, "colorscale": [ [ 0.0, "#0d0887" ], [ 0.1111111111111111, "#46039f" ], [ 0.2222222222222222, "#7201a8" ], [ 0.3333333333333333, "#9c179e" ], [ 0.4444444444444444, "#bd3786" ], [ 0.5555555555555556, "#d8576b" ], [ 0.6666666666666666, "#ed7953" ], [ 0.7777777777777778, "#fb9f3a" ], [ 0.8888888888888888, "#fdca26" ], [ 1.0, "#f0f921" ] ] } ] }, "layout": { "geo": { "bgcolor": "white", "showland": true, "lakecolor": "white", "landcolor": "white", "showlakes": true, "subunitcolor": "#C8D4E3" }, "font": { "color": "#2a3f5f" }, "polar": { "bgcolor": "white", "radialaxis": { "ticks": "", "gridcolor": "#EBF0F8", "linecolor": "#EBF0F8" }, "angularaxis": { "ticks": "", "gridcolor": "#EBF0F8", "linecolor": "#EBF0F8" } }, "scene": { "xaxis": { "ticks": "", "gridcolor": "#DFE8F3", "gridwidth": 2, "linecolor": "#EBF0F8", "zerolinecolor": "#EBF0F8", "showbackground": true, "backgroundcolor": "white" }, "yaxis": { "ticks": "", "gridcolor": "#DFE8F3", "gridwidth": 2, "linecolor": "#EBF0F8", "zerolinecolor": "#EBF0F8", "showbackground": true, "backgroundcolor": "white" }, "zaxis": { "ticks": "", "gridcolor": "#DFE8F3", "gridwidth": 2, "linecolor": "#EBF0F8", "zerolinecolor": "#EBF0F8", "showbackground": true, "backgroundcolor": "white" } }, "title": { "x": 0.05 }, "xaxis": { "ticks": "", "title": { "standoff": 15 }, "gridcolor": "#EBF0F8", "linecolor": "#EBF0F8", "automargin": true, "zerolinecolor": "#EBF0F8", "zerolinewidth": 2 }, "yaxis": { "ticks": "", "title": { "standoff": 15 }, "gridcolor": "#EBF0F8", "linecolor": "#EBF0F8", "automargin": true, "zerolinecolor": "#EBF0F8", "zerolinewidth": 2 }, "mapbox": { "style": "light" }, "ternary": { "aaxis": { "ticks": "", "gridcolor": "#DFE8F3", "linecolor": "#A2B1C6" }, "baxis": { "ticks": "", "gridcolor": "#DFE8F3", "linecolor": "#A2B1C6" }, "caxis": { "ticks": "", "gridcolor": "#DFE8F3", "linecolor": "#A2B1C6" }, "bgcolor": "white" }, "colorway": [ "#636efa", "#EF553B", "#00cc96", "#ab63fa", "#FFA15A", "#19d3f3", "#FF6692", "#B6E880", "#FF97FF", "#FECB52" ], "coloraxis": { "colorbar": { "ticks": "", "outlinewidth": 0 } }, "hovermode": "closest", "colorscale": { "diverging": [ [ 0, "#8e0152" ], [ 0.1, "#c51b7d" ], [ 0.2, "#de77ae" ], [ 0.3, "#f1b6da" ], [ 0.4, "#fde0ef" ], [ 0.5, "#f7f7f7" ], [ 0.6, "#e6f5d0" ], [ 0.7, "#b8e186" ], [ 0.8, "#7fbc41" ], [ 0.9, "#4d9221" ], [ 1, "#276419" ] ], "sequential": [ [ 0.0, "#0d0887" ], [ 0.1111111111111111, "#46039f" ], [ 0.2222222222222222, "#7201a8" ], [ 0.3333333333333333, "#9c179e" ], [ 0.4444444444444444, "#bd3786" ], [ 0.5555555555555556, "#d8576b" ], [ 0.6666666666666666, "#ed7953" ], [ 0.7777777777777778, "#fb9f3a" ], [ 0.8888888888888888, "#fdca26" ], [ 1.0, "#f0f921" ] ], "sequentialminus": [ [ 0.0, "#0d0887" ], [ 0.1111111111111111, "#46039f" ], [ 0.2222222222222222, "#7201a8" ], [ 0.3333333333333333, "#9c179e" ], [ 0.4444444444444444, "#bd3786" ], [ 0.5555555555555556, "#d8576b" ], [ 0.6666666666666666, "#ed7953" ], [ 0.7777777777777778, "#fb9f3a" ], [ 0.8888888888888888, "#fdca26" ], [ 1.0, "#f0f921" ] ] }, "hoverlabel": { "align": "left" }, "plot_bgcolor": "white", "paper_bgcolor": "white", "shapedefaults": { "line": { "color": "#2a3f5f" } }, "autotypenumbers": "strict", "annotationdefaults": { "arrowhead": 0, "arrowcolor": "#2a3f5f", "arrowwidth": 1 } } }, "showlegend": true, "annotations": [ { "x": 0.2509090909090909, "y": 1.0, "font": { "size": 15 }, "text": "Patent Count by Assignee Organization", "xref": "paper", "yref": "paper", "yshift": 12, "xanchor": "center", "yanchor": "bottom", "showarrow": false }, { "x": 0.7909090909090909, "y": 1.0, "font": { "size": 15 }, "text": "Distribution of Patent Term Extensions", "xref": "paper", "yref": "paper", "yshift": 12, "xanchor": "center", "yanchor": "bottom", "showarrow": false }, { "x": 0.2509090909090909, "y": 0.4, "font": { "size": 15 }, "text": "Patent Type Distribution", "xref": "paper", "yref": "paper", "yshift": 12, "xanchor": "center", "yanchor": "bottom", "showarrow": false } ] } }, "height": 1240, "width": 1180, "user": { "profile_url": "https://chart-studio.plotly.com/~abhishek.karn025", "avatar_url": "https://storage.googleapis.com/plotly-prod-profiles/8.jpg", "background_url": "https://storage.googleapis.com/plotly-prod-profiles/bg-4.jpg", "bio": "", "nickname": "", "website": "", "stream_tokens": null, "feature_set_id": null, "csrf_token": null, "date_joined": "2025-08-19 08:26:37", "mapbox_access_tokens": null, "has_password": null, "username": "abhishek.karn025", "email": null, "is_active": null, "readonly": null, "is_dash_creator": null, "dash_created_count": null, "is_chart_creator": null, "charts_created_count": null } }, { "creation_time": "2025-09-15T10:08:46.642021Z", "comments": { "results": [], "count": 0 }, "parented": true, "embed_url": "https://chart-studio.plotly.com/~srivallijanani_04/1.embed", "fid": "srivallijanani_04:1", "filename": "Plot 1", "filetype": "plot", "img_url": "https://storage.googleapis.com/plotly-prod-images/srivallijanani_04/1/9_MMYW1YUTXBT8CJ1352CZM4XSVB59ND.png", "image_urls": { "default": "https://storage.googleapis.com/plotly-prod-images/srivallijanani_04/1/2_GAWY6BLZ97OM0AOKLUAIFDJVT8CEWE.png", "block-thumb": "https://storage.googleapis.com/plotly-prod-images/srivallijanani_04/1/8_XYH3QM86VCAKDVZTF7LHDZAHXV2CP0.png", "list-thumb": "https://storage.googleapis.com/plotly-prod-images/srivallijanani_04/1/9_MMYW1YUTXBT8CJ1352CZM4XSVB59ND.png" }, "api_urls": { "files": "https://api.plotly.com/v2/files/srivallijanani_04:1", "plots": "https://api.plotly.com/v2/plots/srivallijanani_04:1", "parent": "https://api.plotly.com/v2/folders/home?user=srivallijanani_04" }, "owner": "srivallijanani_04", "parent": -1, "preview": "", "referencers": [], "references": [], "title": "", "views": 0, "web_url": "https://chart-studio.plotly.com/~srivallijanani_04/1/", "world_readable": true, "date_modified": "2025-09-15T10:08:46.657Z", "stars": { "results": [], "count": 0 }, "collaborators": { "results": [], "count": 0 }, "subfolder_count": null, "refresh_interval": null, "organize_view_url": "https://chart-studio.plotly.com/~srivallijanani_04/1/", "current_user_permission": "read", "is_theme": null, "is_template": false, "autosize": true, "caption": "", "figure": { "data": [ { "meta": { "columnNames": { "x": "x", "y": "y" } }, "mode": "lines", "type": "scatter", "xsrc": "srivallijanani_04:0:0af21c", "ysrc": "srivallijanani_04:0:648991" } ], "frames": [], "layout": { "xaxis": { "type": "date", "range": [ "2025-02-07 11:40:48", "2025-02-14 23:49:13" ], "autorange": true }, "yaxis": { "type": "linear", "range": [ 142607.1415470557, 262160.45423341566 ], "autorange": true }, "autosize": true } }, "height": null, "width": null, "user": { "profile_url": "https://chart-studio.plotly.com/~srivallijanani_04", "avatar_url": "https://storage.googleapis.com/plotly-prod-profiles/25.jpg", "background_url": "https://storage.googleapis.com/plotly-prod-profiles/bg-3.jpg", "bio": "", "nickname": "", "website": "", "stream_tokens": null, "feature_set_id": null, "csrf_token": null, "date_joined": "2025-09-15 10:07:23", "mapbox_access_tokens": null, "has_password": null, "username": "srivallijanani_04", "email": null, "is_active": null, "readonly": null, "is_dash_creator": null, "dash_created_count": null, "is_chart_creator": null, "charts_created_count": null } }, { "creation_time": "2025-09-15T10:03:50.389341Z", "comments": { "results": [], "count": 0 }, "parented": true, "embed_url": "https://chart-studio.plotly.com/~Pavithra123/1.embed", "fid": "Pavithra123:1", "filename": "Plot 1", "filetype": "plot", "img_url": "https://storage.googleapis.com/plotly-prod-images/Pavithra123/1/9_6R3RVEUVZJTSA8YVPGOUNMVP3TJHA1.png", "image_urls": { "default": "https://storage.googleapis.com/plotly-prod-images/Pavithra123/1/2_6XBU4TFMVU31ML12X19WZ4I6SJO6H9.png", "block-thumb": "https://storage.googleapis.com/plotly-prod-images/Pavithra123/1/8_GQCYUBTPA9UG6O212N2KHCMKP85DPU.png", "list-thumb": "https://storage.googleapis.com/plotly-prod-images/Pavithra123/1/9_6R3RVEUVZJTSA8YVPGOUNMVP3TJHA1.png" }, "api_urls": { "files": "https://api.plotly.com/v2/files/Pavithra123:1", "plots": "https://api.plotly.com/v2/plots/Pavithra123:1", "parent": "https://api.plotly.com/v2/folders/home?user=Pavithra123" }, "owner": "Pavithra123", "parent": -1, "preview": "", "referencers": [], "references": [], "title": "", "views": 0, "web_url": "https://chart-studio.plotly.com/~Pavithra123/1/", "world_readable": true, "date_modified": "2025-09-15T10:03:50.401Z", "stars": { "results": [], "count": 0 }, "collaborators": { "results": [], "count": 0 }, "subfolder_count": null, "refresh_interval": null, "organize_view_url": "https://chart-studio.plotly.com/~Pavithra123/1/", "current_user_permission": "read", "is_theme": null, "is_template": false, "autosize": true, "caption": "", "figure": { "data": [ { "meta": { "columnNames": { "x": "x", "y": "y" } }, "mode": "lines", "type": "scatter", "xsrc": "Pavithra123:0:3b7ae0", "ysrc": "Pavithra123:0:876f73" } ], "frames": [], "layout": { "xaxis": { "type": "date", "range": [ "2025-09-14 03:30:12", "2025-09-21 23:30:43" ], "autorange": true }, "yaxis": { "type": "linear", "range": [ 178646.32746093711, 232493.55321558507 ], "autorange": true }, "autosize": true } }, "height": null, "width": null, "user": { "profile_url": "https://chart-studio.plotly.com/~Pavithra123", "avatar_url": "https://storage.googleapis.com/plotly-prod-profiles/21.jpg", "background_url": "https://storage.googleapis.com/plotly-prod-profiles/bg-5.jpg", "bio": "", "nickname": "", "website": "", "stream_tokens": null, "feature_set_id": null, "csrf_token": null, "date_joined": "2025-09-15 10:02:21", "mapbox_access_tokens": null, "has_password": null, "username": "Pavithra123", "email": null, "is_active": null, "readonly": null, "is_dash_creator": null, "dash_created_count": null, "is_chart_creator": null, "charts_created_count": null } }, { "creation_time": "2025-09-15T09:53:38.487476Z", "comments": { "results": [], "count": 0 }, "parented": true, "embed_url": "https://chart-studio.plotly.com/~grabby/24.embed", "fid": "grabby:24", "filename": "ven_java_MQ", "filetype": "plot", "img_url": "https://storage.googleapis.com/plotly-prod-images/grabby/24/9_38KIC8T2B9U6POKW9OYO9M41OJKU18.png", "image_urls": { "default": "https://storage.googleapis.com/plotly-prod-images/grabby/24/2_JT2ZMVW2Y3AGD3WCA41Y3MEOE4ULSH.png", "block-thumb": "https://storage.googleapis.com/plotly-prod-images/grabby/24/8_PKJQRUWL7LDETN3H4U7Z8PG3KXJGUJ.png", "list-thumb": "https://storage.googleapis.com/plotly-prod-images/grabby/24/9_38KIC8T2B9U6POKW9OYO9M41OJKU18.png" }, "api_urls": { "files": "https://api.plotly.com/v2/files/grabby:24", "plots": "https://api.plotly.com/v2/plots/grabby:24", "parent": "https://api.plotly.com/v2/folders/home?user=grabby" }, "owner": "grabby", "parent": -1, "preview": "", "referencers": [], "references": [], "title": "", "views": 0, "web_url": "https://chart-studio.plotly.com/~grabby/24/", "world_readable": true, "date_modified": "2025-09-15T09:53:38.498Z", "stars": { "results": [], "count": 0 }, "collaborators": { "results": [], "count": 0 }, "subfolder_count": null, "refresh_interval": null, "organize_view_url": "https://chart-studio.plotly.com/~grabby/24/", "current_user_permission": "read", "is_theme": null, "is_template": false, "autosize": true, "caption": "", "figure": { "data": [ { "meta": { "columnNames": { "x": "Oracles", "y": "MQ Mean", "error_y": { "array": "MQ Std Dev" } } }, "mode": "markers", "type": "scatter", "xsrc": "grabby:23:8f1dc6", "ysrc": "grabby:23:af1dae", "error_y": { "meta": { "columnNames": { "array": "MQ Std Dev" } }, "type": "data", "visible": true, "arraysrc": "grabby:23:ce532a", "symmetric": true } } ], "frames": [], "layout": { "xaxis": { "type": "category", "range": [ -0.1820873427091044, 3.1820873427091043 ], "title": { "text": "Equivalence Oracle Type" }, "autorange": true }, "yaxis": { "type": "linear", "range": [ -564.5765667574931, 13852.976566757492 ], "title": { "text": "Mean Membership Queries [MQ]" }, "autorange": true }, "autosize": true, "template": { "data": { "bar": [ { "type": "bar", "marker": { "colorbar": { "ticks": "", "outlinewidth": 0 } } } ], "table": [ { "type": "table", "cells": { "fill": { "color": "#EBF0F8" }, "line": { "color": "white" } }, "header": { "fill": { "color": "#C8D4E3" }, "line": { "color": "white" } } } ], "carpet": [ { "type": "carpet", "aaxis": { "gridcolor": "#C8D4E3", "linecolor": "#C8D4E3", "endlinecolor": "#2a3f5f", "minorgridcolor": "#C8D4E3", "startlinecolor": "#2a3f5f" }, "baxis": { "gridcolor": "#C8D4E3", "linecolor": "#C8D4E3", "endlinecolor": "#2a3f5f", "minorgridcolor": "#C8D4E3", "startlinecolor": "#2a3f5f" } } ], "mesh3d": [ { "type": "mesh3d", "colorbar": { "ticks": "", "outlinewidth": 0 } } ], "contour": [ { "type": "contour", "colorbar": { "ticks": "", "outlinewidth": 0 }, "autocolorscale": true } ], "heatmap": [ { "type": "heatmap", "colorbar": { "ticks": "", "outlinewidth": 0 }, "autocolorscale": true } ], "scatter": [ { "type": "scatter", "marker": { "colorbar": { "ticks": "", "outlinewidth": 0 } } } ], "surface": [ { "type": "surface", "colorbar": { "ticks": "", "outlinewidth": 0 } } ], "heatmapgl": [ { "type": "heatmapgl", "colorbar": { "ticks": "", "outlinewidth": 0 } } ], "histogram": [ { "type": "histogram", "marker": { "colorbar": { "ticks": "", "outlinewidth": 0 } } } ], "parcoords": [ { "line": { "colorbar": { "ticks": "", "outlinewidth": 0 } }, "type": "parcoords" } ], "scatter3d": [ { "type": "scatter3d", "marker": { "colorbar": { "ticks": "", "outlinewidth": 0 } } } ], "scattergl": [ { "type": "scattergl", "marker": { "colorbar": { "ticks": "", "outlinewidth": 0 } } } ], "choropleth": [ { "type": "choropleth", "colorbar": { "ticks": "", "outlinewidth": 0 } } ], "scattergeo": [ { "type": "scattergeo", "marker": { "colorbar": { "ticks": "", "outlinewidth": 0 } } } ], "histogram2d": [ { "type": "histogram2d", "colorbar": { "ticks": "", "outlinewidth": 0 }, "autocolorscale": true } ], "scatterpolar": [ { "type": "scatterpolar", "marker": { "colorbar": { "ticks": "", "outlinewidth": 0 } } } ], "contourcarpet": [ { "type": "contourcarpet", "colorbar": { "ticks": "", "outlinewidth": 0 } } ], "scattercarpet": [ { "type": "scattercarpet", "marker": { "colorbar": { "ticks": "", "outlinewidth": 0 } } } ], "scattermapbox": [ { "type": "scattermapbox", "marker": { "colorbar": { "ticks": "", "outlinewidth": 0 } } } ], "scatterpolargl": [ { "type": "scatterpolargl", "marker": { "colorbar": { "ticks": "", "outlinewidth": 0 } } } ], "scatterternary": [ { "type": "scatterternary", "marker": { "colorbar": { "ticks": "", "outlinewidth": 0 } } } ], "histogram2dcontour": [ { "type": "histogram2dcontour", "colorbar": { "ticks": "", "outlinewidth": 0 }, "autocolorscale": true } ] }, "layout": { "geo": { "bgcolor": "white", "showland": true, "lakecolor": "white", "landcolor": "white", "showlakes": true, "subunitcolor": "#C8D4E3" }, "font": { "color": "#2a3f5f" }, "polar": { "bgcolor": "white", "radialaxis": { "ticks": "", "gridcolor": "#EBF0F8", "linecolor": "#EBF0F8" }, "angularaxis": { "ticks": "", "gridcolor": "#EBF0F8", "linecolor": "#EBF0F8" } }, "scene": { "xaxis": { "ticks": "", "gridcolor": "#DFE8F3", "gridwidth": 2, "linecolor": "#EBF0F8", "zerolinecolor": "#EBF0F8", "showbackground": true, "backgroundcolor": "white" }, "yaxis": { "ticks": "", "gridcolor": "#DFE8F3", "gridwidth": 2, "linecolor": "#EBF0F8", "zerolinecolor": "#EBF0F8", "showbackground": true, "backgroundcolor": "white" }, "zaxis": { "ticks": "", "gridcolor": "#DFE8F3", "gridwidth": 2, "linecolor": "#EBF0F8", "zerolinecolor": "#EBF0F8", "showbackground": true, "backgroundcolor": "white" } }, "title": { "x": 0.05 }, "xaxis": { "ticks": "", "gridcolor": "#EBF0F8", "linecolor": "#EBF0F8", "automargin": true, "zerolinecolor": "#EBF0F8", "zerolinewidth": 2 }, "yaxis": { "ticks": "", "gridcolor": "#EBF0F8", "linecolor": "#EBF0F8", "automargin": true, "zerolinecolor": "#EBF0F8", "zerolinewidth": 2 }, "ternary": { "aaxis": { "ticks": "", "gridcolor": "#DFE8F3", "linecolor": "#A2B1C6" }, "baxis": { "ticks": "", "gridcolor": "#DFE8F3", "linecolor": "#A2B1C6" }, "caxis": { "ticks": "", "gridcolor": "#DFE8F3", "linecolor": "#A2B1C6" }, "bgcolor": "white" }, "colorway": [ "#636efa", "#EF553B", "#00cc96", "#ab63fa", "#19d3f3", "#e763fa", "#fecb52", "#ffa15a", "#ff6692", "#b6e880" ], "hovermode": "closest", "colorscale": { "diverging": [ [ 0, "#8e0152" ], [ 0.1, "#c51b7d" ], [ 0.2, "#de77ae" ], [ 0.3, "#f1b6da" ], [ 0.4, "#fde0ef" ], [ 0.5, "#f7f7f7" ], [ 0.6, "#e6f5d0" ], [ 0.7, "#b8e186" ], [ 0.8, "#7fbc41" ], [ 0.9, "#4d9221" ], [ 1, "#276419" ] ], "sequential": [ [ 0, "#0508b8" ], [ 0.0893854748603352, "#1910d8" ], [ 0.1787709497206704, "#3c19f0" ], [ 0.2681564245810056, "#6b1cfb" ], [ 0.3575418994413408, "#981cfd" ], [ 0.44692737430167595, "#bf1cfd" ], [ 0.5363128491620112, "#dd2bfd" ], [ 0.6256983240223464, "#f246fe" ], [ 0.7150837988826816, "#fc67fd" ], [ 0.8044692737430168, "#fe88fc" ], [ 0.8938547486033519, "#fea5fd" ], [ 0.9832402234636871, "#febefe" ], [ 1, "#fec3fe" ] ], "sequentialminus": [ [ 0, "#0508b8" ], [ 0.0893854748603352, "#1910d8" ], [ 0.1787709497206704, "#3c19f0" ], [ 0.2681564245810056, "#6b1cfb" ], [ 0.3575418994413408, "#981cfd" ], [ 0.44692737430167595, "#bf1cfd" ], [ 0.5363128491620112, "#dd2bfd" ], [ 0.6256983240223464, "#f246fe" ], [ 0.7150837988826816, "#fc67fd" ], [ 0.8044692737430168, "#fe88fc" ], [ 0.8938547486033519, "#fea5fd" ], [ 0.9832402234636871, "#febefe" ], [ 1, "#fec3fe" ] ] }, "plot_bgcolor": "white", "paper_bgcolor": "white", "shapedefaults": { "line": { "width": 0 }, "opacity": 0.4, "fillcolor": "#506784" }, "annotationdefaults": { "arrowhead": 0, "arrowcolor": "#506784", "arrowwidth": 1 } }, "themeRef": "PLOTLY_WHITE" } } }, "height": null, "width": null, "user": { "profile_url": "https://chart-studio.plotly.com/~grabby", "avatar_url": "https://storage.googleapis.com/plotly-prod-profiles/93.jpg", "background_url": "https://storage.googleapis.com/plotly-prod-profiles/bg-3.jpg", "bio": "", "nickname": "", "website": "", "stream_tokens": null, "feature_set_id": null, "csrf_token": null, "date_joined": "2025-07-29 03:44:44", "mapbox_access_tokens": null, "has_password": null, "username": "grabby", "email": null, "is_active": null, "readonly": null, "is_dash_creator": null, "dash_created_count": null, "is_chart_creator": null, "charts_created_count": null } }, { "creation_time": "2025-09-15T09:51:59.065257Z", "comments": { "results": [], "count": 0 }, "parented": true, "embed_url": "https://chart-studio.plotly.com/~grabby/22.embed", "fid": "grabby:22", "filename": "ven_java_LR", "filetype": "plot", "img_url": "https://storage.googleapis.com/plotly-prod-images/grabby/22/9_T0Y12EJK2XWM3Z0IG6XXPQF9UATSFB.png", "image_urls": { "default": "https://storage.googleapis.com/plotly-prod-images/grabby/22/2_T5DLOQ7F5653C1OS3EX0OY3Q2C6X8I.png", "block-thumb": "https://storage.googleapis.com/plotly-prod-images/grabby/22/8_V4G2SWPIYYT5QTBHVV019QTFGO4C14.png", "list-thumb": "https://storage.googleapis.com/plotly-prod-images/grabby/22/9_T0Y12EJK2XWM3Z0IG6XXPQF9UATSFB.png" }, "api_urls": { "files": "https://api.plotly.com/v2/files/grabby:22", "plots": "https://api.plotly.com/v2/plots/grabby:22", "parent": "https://api.plotly.com/v2/folders/home?user=grabby" }, "owner": "grabby", "parent": -1, "preview": "", "referencers": [], "references": [], "title": "", "views": 0, "web_url": "https://chart-studio.plotly.com/~grabby/22/", "world_readable": true, "date_modified": "2025-09-15T09:51:59.076Z", "stars": { "results": [], "count": 0 }, "collaborators": { "results": [], "count": 0 }, "subfolder_count": null, "refresh_interval": null, "organize_view_url": "https://chart-studio.plotly.com/~grabby/22/", "current_user_permission": "read", "is_theme": null, "is_template": false, "autosize": true, "caption": "", "figure": { "data": [ { "meta": { "columnNames": { "x": "Oracles", "y": " LR Mean", "error_y": { "array": "LR Std Dev" } } }, "mode": "markers", "type": "bar", "xsrc": "grabby:21:caf236", "ysrc": "grabby:21:c7a875", "error_y": { "meta": { "columnNames": { "array": "LR Std Dev" } }, "type": "data", "visible": true, "arraysrc": "grabby:21:b9568e", "symmetric": true }, "orientation": "v" } ], "frames": [], "layout": { "title": { "text": "Learning Rounds (Mean ± SD) by Oracle" }, "xaxis": { "type": "category", "range": [ -0.5, 3.5 ], "title": { "text": "Equivalence Oracle Type" }, "autorange": true }, "yaxis": { "type": "linear", "range": [ 0, 3.6526315789473682 ], "title": { "text": "Mean Learning Rounds (LR)" }, "autorange": true }, "autosize": true, "template": { "data": { "bar": [ { "type": "bar", "marker": { "colorbar": { "ticks": "", "outlinewidth": 0 } } } ], "table": [ { "type": "table", "cells": { "fill": { "color": "#EBF0F8" }, "line": { "color": "white" } }, "header": { "fill": { "color": "#C8D4E3" }, "line": { "color": "white" } } } ], "carpet": [ { "type": "carpet", "aaxis": { "gridcolor": "#C8D4E3", "linecolor": "#C8D4E3", "endlinecolor": "#2a3f5f", "minorgridcolor": "#C8D4E3", "startlinecolor": "#2a3f5f" }, "baxis": { "gridcolor": "#C8D4E3", "linecolor": "#C8D4E3", "endlinecolor": "#2a3f5f", "minorgridcolor": "#C8D4E3", "startlinecolor": "#2a3f5f" } } ], "mesh3d": [ { "type": "mesh3d", "colorbar": { "ticks": "", "outlinewidth": 0 } } ], "contour": [ { "type": "contour", "colorbar": { "ticks": "", "outlinewidth": 0 }, "autocolorscale": true } ], "heatmap": [ { "type": "heatmap", "colorbar": { "ticks": "", "outlinewidth": 0 }, "autocolorscale": true } ], "scatter": [ { "type": "scatter", "marker": { "colorbar": { "ticks": "", "outlinewidth": 0 } } } ], "surface": [ { "type": "surface", "colorbar": { "ticks": "", "outlinewidth": 0 } } ], "heatmapgl": [ { "type": "heatmapgl", "colorbar": { "ticks": "", "outlinewidth": 0 } } ], "histogram": [ { "type": "histogram", "marker": { "colorbar": { "ticks": "", "outlinewidth": 0 } } } ], "parcoords": [ { "line": { "colorbar": { "ticks": "", "outlinewidth": 0 } }, "type": "parcoords" } ], "scatter3d": [ { "type": "scatter3d", "marker": { "colorbar": { "ticks": "", "outlinewidth": 0 } } } ], "scattergl": [ { "type": "scattergl", "marker": { "colorbar": { "ticks": "", "outlinewidth": 0 } } } ], "choropleth": [ { "type": "choropleth", "colorbar": { "ticks": "", "outlinewidth": 0 } } ], "scattergeo": [ { "type": "scattergeo", "marker": { "colorbar": { "ticks": "", "outlinewidth": 0 } } } ], "histogram2d": [ { "type": "histogram2d", "colorbar": { "ticks": "", "outlinewidth": 0 }, "autocolorscale": true } ], "scatterpolar": [ { "type": "scatterpolar", "marker": { "colorbar": { "ticks": "", "outlinewidth": 0 } } } ], "contourcarpet": [ { "type": "contourcarpet", "colorbar": { "ticks": "", "outlinewidth": 0 } } ], "scattercarpet": [ { "type": "scattercarpet", "marker": { "colorbar": { "ticks": "", "outlinewidth": 0 } } } ], "scattermapbox": [ { "type": "scattermapbox", "marker": { "colorbar": { "ticks": "", "outlinewidth": 0 } } } ], "scatterpolargl": [ { "type": "scatterpolargl", "marker": { "colorbar": { "ticks": "", "outlinewidth": 0 } } } ], "scatterternary": [ { "type": "scatterternary", "marker": { "colorbar": { "ticks": "", "outlinewidth": 0 } } } ], "histogram2dcontour": [ { "type": "histogram2dcontour", "colorbar": { "ticks": "", "outlinewidth": 0 }, "autocolorscale": true } ] }, "layout": { "geo": { "bgcolor": "white", "showland": true, "lakecolor": "white", "landcolor": "white", "showlakes": true, "subunitcolor": "#C8D4E3" }, "font": { "color": "#2a3f5f" }, "polar": { "bgcolor": "white", "radialaxis": { "ticks": "", "gridcolor": "#EBF0F8", "linecolor": "#EBF0F8" }, "angularaxis": { "ticks": "", "gridcolor": "#EBF0F8", "linecolor": "#EBF0F8" } }, "scene": { "xaxis": { "ticks": "", "gridcolor": "#DFE8F3", "gridwidth": 2, "linecolor": "#EBF0F8", "zerolinecolor": "#EBF0F8", "showbackground": true, "backgroundcolor": "white" }, "yaxis": { "ticks": "", "gridcolor": "#DFE8F3", "gridwidth": 2, "linecolor": "#EBF0F8", "zerolinecolor": "#EBF0F8", "showbackground": true, "backgroundcolor": "white" }, "zaxis": { "ticks": "", "gridcolor": "#DFE8F3", "gridwidth": 2, "linecolor": "#EBF0F8", "zerolinecolor": "#EBF0F8", "showbackground": true, "backgroundcolor": "white" } }, "title": { "x": 0.05 }, "xaxis": { "ticks": "", "gridcolor": "#EBF0F8", "linecolor": "#EBF0F8", "automargin": true, "zerolinecolor": "#EBF0F8", "zerolinewidth": 2 }, "yaxis": { "ticks": "", "gridcolor": "#EBF0F8", "linecolor": "#EBF0F8", "automargin": true, "zerolinecolor": "#EBF0F8", "zerolinewidth": 2 }, "ternary": { "aaxis": { "ticks": "", "gridcolor": "#DFE8F3", "linecolor": "#A2B1C6" }, "baxis": { "ticks": "", "gridcolor": "#DFE8F3", "linecolor": "#A2B1C6" }, "caxis": { "ticks": "", "gridcolor": "#DFE8F3", "linecolor": "#A2B1C6" }, "bgcolor": "white" }, "colorway": [ "#636efa", "#EF553B", "#00cc96", "#ab63fa", "#19d3f3", "#e763fa", "#fecb52", "#ffa15a", "#ff6692", "#b6e880" ], "hovermode": "closest", "colorscale": { "diverging": [ [ 0, "#8e0152" ], [ 0.1, "#c51b7d" ], [ 0.2, "#de77ae" ], [ 0.3, "#f1b6da" ], [ 0.4, "#fde0ef" ], [ 0.5, "#f7f7f7" ], [ 0.6, "#e6f5d0" ], [ 0.7, "#b8e186" ], [ 0.8, "#7fbc41" ], [ 0.9, "#4d9221" ], [ 1, "#276419" ] ], "sequential": [ [ 0, "#0508b8" ], [ 0.0893854748603352, "#1910d8" ], [ 0.1787709497206704, "#3c19f0" ], [ 0.2681564245810056, "#6b1cfb" ], [ 0.3575418994413408, "#981cfd" ], [ 0.44692737430167595, "#bf1cfd" ], [ 0.5363128491620112, "#dd2bfd" ], [ 0.6256983240223464, "#f246fe" ], [ 0.7150837988826816, "#fc67fd" ], [ 0.8044692737430168, "#fe88fc" ], [ 0.8938547486033519, "#fea5fd" ], [ 0.9832402234636871, "#febefe" ], [ 1, "#fec3fe" ] ], "sequentialminus": [ [ 0, "#0508b8" ], [ 0.0893854748603352, "#1910d8" ], [ 0.1787709497206704, "#3c19f0" ], [ 0.2681564245810056, "#6b1cfb" ], [ 0.3575418994413408, "#981cfd" ], [ 0.44692737430167595, "#bf1cfd" ], [ 0.5363128491620112, "#dd2bfd" ], [ 0.6256983240223464, "#f246fe" ], [ 0.7150837988826816, "#fc67fd" ], [ 0.8044692737430168, "#fe88fc" ], [ 0.8938547486033519, "#fea5fd" ], [ 0.9832402234636871, "#febefe" ], [ 1, "#fec3fe" ] ] }, "plot_bgcolor": "white", "paper_bgcolor": "white", "shapedefaults": { "line": { "width": 0 }, "opacity": 0.4, "fillcolor": "#506784" }, "annotationdefaults": { "arrowhead": 0, "arrowcolor": "#506784", "arrowwidth": 1 } }, "themeRef": "PLOTLY_WHITE" } } }, "height": null, "width": null, "user": { "profile_url": "https://chart-studio.plotly.com/~grabby", "avatar_url": "https://storage.googleapis.com/plotly-prod-profiles/93.jpg", "background_url": "https://storage.googleapis.com/plotly-prod-profiles/bg-3.jpg", "bio": "", "nickname": "", "website": "", "stream_tokens": null, "feature_set_id": null, "csrf_token": null, "date_joined": "2025-07-29 03:44:44", "mapbox_access_tokens": null, "has_password": null, "username": "grabby", "email": null, "is_active": null, "readonly": null, "is_dash_creator": null, "dash_created_count": null, "is_chart_creator": null, "charts_created_count": null } }, { "creation_time": "2025-09-15T09:50:26.811441Z", "comments": { "results": [], "count": 0 }, "parented": true, "embed_url": "https://chart-studio.plotly.com/~grabby/20.embed", "fid": "grabby:20", "filename": "ven_grpc_LR", "filetype": "plot", "img_url": "https://storage.googleapis.com/plotly-prod-images/grabby/20/9_JCOS20C7DVK916MJ0T87L2NAJIE3NB.png", "image_urls": { "default": "https://storage.googleapis.com/plotly-prod-images/grabby/20/2_OC0LREEFZB4XKCOU8F0CGLIYX4HURB.png", "block-thumb": "https://storage.googleapis.com/plotly-prod-images/grabby/20/8_QE5GEVSAWE5PYD5Y85MFGEVV744EPR.png", "list-thumb": "https://storage.googleapis.com/plotly-prod-images/grabby/20/9_JCOS20C7DVK916MJ0T87L2NAJIE3NB.png" }, "api_urls": { "files": "https://api.plotly.com/v2/files/grabby:20", "plots": "https://api.plotly.com/v2/plots/grabby:20", "parent": "https://api.plotly.com/v2/folders/home?user=grabby" }, "owner": "grabby", "parent": -1, "preview": "", "referencers": [], "references": [], "title": "", "views": 0, "web_url": "https://chart-studio.plotly.com/~grabby/20/", "world_readable": true, "date_modified": "2025-09-15T09:50:26.822Z", "stars": { "results": [], "count": 0 }, "collaborators": { "results": [], "count": 0 }, "subfolder_count": null, "refresh_interval": null, "organize_view_url": "https://chart-studio.plotly.com/~grabby/20/", "current_user_permission": "read", "is_theme": null, "is_template": false, "autosize": true, "caption": "", "figure": { "data": [ { "meta": { "columnNames": { "x": "Oracles", "y": " LR Mean", "error_y": { "array": "LR Std Dev" } } }, "mode": "markers", "type": "bar", "xsrc": "grabby:19:70d2f4", "ysrc": "grabby:19:bb9002", "error_y": { "meta": { "columnNames": { "array": "LR Std Dev" } }, "type": "data", "visible": true, "arraysrc": "grabby:19:96e556", "symmetric": true }, "orientation": "v" } ], "frames": [], "layout": { "title": { "text": "Learning Rounds (Mean ± SD) by Oracle" }, "xaxis": { "type": "category", "range": [ -0.5, 3.5 ], "title": { "text": "Equivalence Oracle Type" }, "autorange": true }, "yaxis": { "type": "linear", "range": [ 0, 3.6105263157894734 ], "title": { "text": "Mean Learning Rounds (LR)" }, "autorange": true }, "autosize": true, "template": { "data": { "bar": [ { "type": "bar", "marker": { "colorbar": { "ticks": "", "outlinewidth": 0 } } } ], "table": [ { "type": "table", "cells": { "fill": { "color": "#EBF0F8" }, "line": { "color": "white" } }, "header": { "fill": { "color": "#C8D4E3" }, "line": { "color": "white" } } } ], "carpet": [ { "type": "carpet", "aaxis": { "gridcolor": "#C8D4E3", "linecolor": "#C8D4E3", "endlinecolor": "#2a3f5f", "minorgridcolor": "#C8D4E3", "startlinecolor": "#2a3f5f" }, "baxis": { "gridcolor": "#C8D4E3", "linecolor": "#C8D4E3", "endlinecolor": "#2a3f5f", "minorgridcolor": "#C8D4E3", "startlinecolor": "#2a3f5f" } } ], "mesh3d": [ { "type": "mesh3d", "colorbar": { "ticks": "", "outlinewidth": 0 } } ], "contour": [ { "type": "contour", "colorbar": { "ticks": "", "outlinewidth": 0 }, "autocolorscale": true } ], "heatmap": [ { "type": "heatmap", "colorbar": { "ticks": "", "outlinewidth": 0 }, "autocolorscale": true } ], "scatter": [ { "type": "scatter", "marker": { "colorbar": { "ticks": "", "outlinewidth": 0 } } } ], "surface": [ { "type": "surface", "colorbar": { "ticks": "", "outlinewidth": 0 } } ], "heatmapgl": [ { "type": "heatmapgl", "colorbar": { "ticks": "", "outlinewidth": 0 } } ], "histogram": [ { "type": "histogram", "marker": { "colorbar": { "ticks": "", "outlinewidth": 0 } } } ], "parcoords": [ { "line": { "colorbar": { "ticks": "", "outlinewidth": 0 } }, "type": "parcoords" } ], "scatter3d": [ { "type": "scatter3d", "marker": { "colorbar": { "ticks": "", "outlinewidth": 0 } } } ], "scattergl": [ { "type": "scattergl", "marker": { "colorbar": { "ticks": "", "outlinewidth": 0 } } } ], "choropleth": [ { "type": "choropleth", "colorbar": { "ticks": "", "outlinewidth": 0 } } ], "scattergeo": [ { "type": "scattergeo", "marker": { "colorbar": { "ticks": "", "outlinewidth": 0 } } } ], "histogram2d": [ { "type": "histogram2d", "colorbar": { "ticks": "", "outlinewidth": 0 }, "autocolorscale": true } ], "scatterpolar": [ { "type": "scatterpolar", "marker": { "colorbar": { "ticks": "", "outlinewidth": 0 } } } ], "contourcarpet": [ { "type": "contourcarpet", "colorbar": { "ticks": "", "outlinewidth": 0 } } ], "scattercarpet": [ { "type": "scattercarpet", "marker": { "colorbar": { "ticks": "", "outlinewidth": 0 } } } ], "scattermapbox": [ { "type": "scattermapbox", "marker": { "colorbar": { "ticks": "", "outlinewidth": 0 } } } ], "scatterpolargl": [ { "type": "scatterpolargl", "marker": { "colorbar": { "ticks": "", "outlinewidth": 0 } } } ], "scatterternary": [ { "type": "scatterternary", "marker": { "colorbar": { "ticks": "", "outlinewidth": 0 } } } ], "histogram2dcontour": [ { "type": "histogram2dcontour", "colorbar": { "ticks": "", "outlinewidth": 0 }, "autocolorscale": true } ] }, "layout": { "geo": { "bgcolor": "white", "showland": true, "lakecolor": "white", "landcolor": "white", "showlakes": true, "subunitcolor": "#C8D4E3" }, "font": { "color": "#2a3f5f" }, "polar": { "bgcolor": "white", "radialaxis": { "ticks": "", "gridcolor": "#EBF0F8", "linecolor": "#EBF0F8" }, "angularaxis": { "ticks": "", "gridcolor": "#EBF0F8", "linecolor": "#EBF0F8" } }, "scene": { "xaxis": { "ticks": "", "gridcolor": "#DFE8F3", "gridwidth": 2, "linecolor": "#EBF0F8", "zerolinecolor": "#EBF0F8", "showbackground": true, "backgroundcolor": "white" }, "yaxis": { "ticks": "", "gridcolor": "#DFE8F3", "gridwidth": 2, "linecolor": "#EBF0F8", "zerolinecolor": "#EBF0F8", "showbackground": true, "backgroundcolor": "white" }, "zaxis": { "ticks": "", "gridcolor": "#DFE8F3", "gridwidth": 2, "linecolor": "#EBF0F8", "zerolinecolor": "#EBF0F8", "showbackground": true, "backgroundcolor": "white" } }, "title": { "x": 0.05 }, "xaxis": { "ticks": "", "gridcolor": "#EBF0F8", "linecolor": "#EBF0F8", "automargin": true, "zerolinecolor": "#EBF0F8", "zerolinewidth": 2 }, "yaxis": { "ticks": "", "gridcolor": "#EBF0F8", "linecolor": "#EBF0F8", "automargin": true, "zerolinecolor": "#EBF0F8", "zerolinewidth": 2 }, "ternary": { "aaxis": { "ticks": "", "gridcolor": "#DFE8F3", "linecolor": "#A2B1C6" }, "baxis": { "ticks": "", "gridcolor": "#DFE8F3", "linecolor": "#A2B1C6" }, "caxis": { "ticks": "", "gridcolor": "#DFE8F3", "linecolor": "#A2B1C6" }, "bgcolor": "white" }, "colorway": [ "#636efa", "#EF553B", "#00cc96", "#ab63fa", "#19d3f3", "#e763fa", "#fecb52", "#ffa15a", "#ff6692", "#b6e880" ], "hovermode": "closest", "colorscale": { "diverging": [ [ 0, "#8e0152" ], [ 0.1, "#c51b7d" ], [ 0.2, "#de77ae" ], [ 0.3, "#f1b6da" ], [ 0.4, "#fde0ef" ], [ 0.5, "#f7f7f7" ], [ 0.6, "#e6f5d0" ], [ 0.7, "#b8e186" ], [ 0.8, "#7fbc41" ], [ 0.9, "#4d9221" ], [ 1, "#276419" ] ], "sequential": [ [ 0, "#0508b8" ], [ 0.0893854748603352, "#1910d8" ], [ 0.1787709497206704, "#3c19f0" ], [ 0.2681564245810056, "#6b1cfb" ], [ 0.3575418994413408, "#981cfd" ], [ 0.44692737430167595, "#bf1cfd" ], [ 0.5363128491620112, "#dd2bfd" ], [ 0.6256983240223464, "#f246fe" ], [ 0.7150837988826816, "#fc67fd" ], [ 0.8044692737430168, "#fe88fc" ], [ 0.8938547486033519, "#fea5fd" ], [ 0.9832402234636871, "#febefe" ], [ 1, "#fec3fe" ] ], "sequentialminus": [ [ 0, "#0508b8" ], [ 0.0893854748603352, "#1910d8" ], [ 0.1787709497206704, "#3c19f0" ], [ 0.2681564245810056, "#6b1cfb" ], [ 0.3575418994413408, "#981cfd" ], [ 0.44692737430167595, "#bf1cfd" ], [ 0.5363128491620112, "#dd2bfd" ], [ 0.6256983240223464, "#f246fe" ], [ 0.7150837988826816, "#fc67fd" ], [ 0.8044692737430168, "#fe88fc" ], [ 0.8938547486033519, "#fea5fd" ], [ 0.9832402234636871, "#febefe" ], [ 1, "#fec3fe" ] ] }, "plot_bgcolor": "white", "paper_bgcolor": "white", "shapedefaults": { "line": { "width": 0 }, "opacity": 0.4, "fillcolor": "#506784" }, "annotationdefaults": { "arrowhead": 0, "arrowcolor": "#506784", "arrowwidth": 1 } }, "themeRef": "PLOTLY_WHITE" } } }, "height": null, "width": null, "user": { "profile_url": "https://chart-studio.plotly.com/~grabby", "avatar_url": "https://storage.googleapis.com/plotly-prod-profiles/93.jpg", "background_url": "https://storage.googleapis.com/plotly-prod-profiles/bg-3.jpg", "bio": "", "nickname": "", "website": "", "stream_tokens": null, "feature_set_id": null, "csrf_token": null, "date_joined": "2025-07-29 03:44:44", "mapbox_access_tokens": null, "has_password": null, "username": "grabby", "email": null, "is_active": null, "readonly": null, "is_dash_creator": null, "dash_created_count": null, "is_chart_creator": null, "charts_created_count": null } } ] }
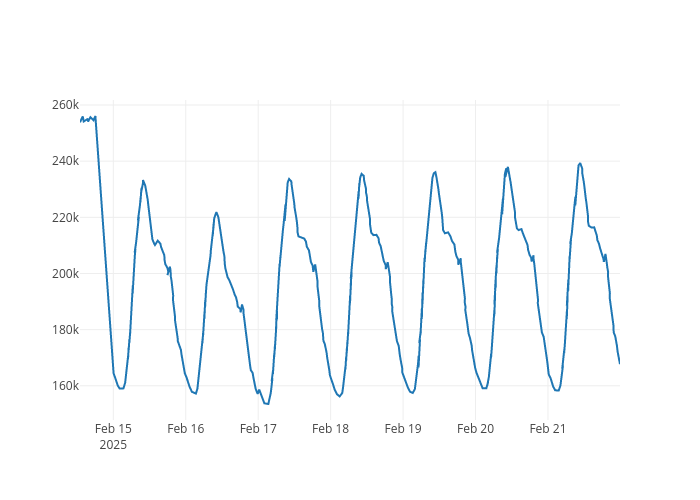
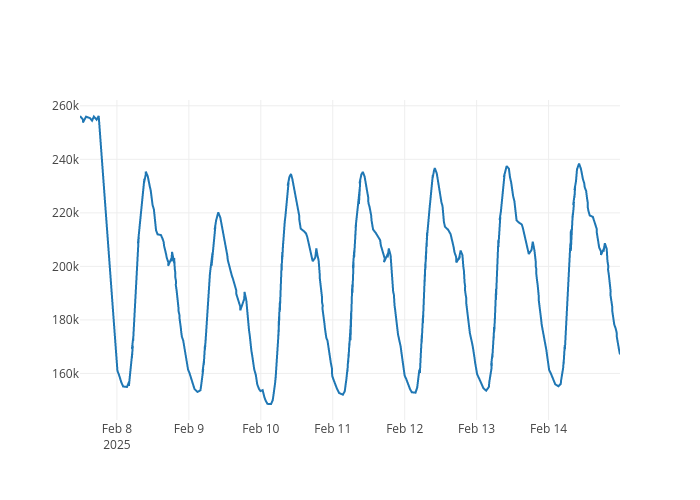